Embed Size (px)
Citation preview
Global Services Sourcing: Issues of Cost and Quality
Nirupam Bajpai, Jeffrey Sachs,
Rohit Arora, and Harpreet Khurana
CGSD Working Paper No. 16 June 2004
Working Papers Series Center on Globalization and Sustainable Development The Earth Institute at Columbia University www.earth.columbia.edu
2
Global Services Sourcing:
Issues of Cost and Quality
Nirupam Bajpai [email protected]
Jeffrey D. Sachs
Rohit Arora [email protected]
and
Harpreet Khurana
Nirupam Bajpai is a Senior Development Advisor and Director of the South Asia Program at the Center on Globalization and Sustainable Development, Columbia University. Jeffrey D. Sachs is the Director of The Earth Institute, Quetelet Professor of Sustainable Development, and Professor of Health Policy and Management at Columbia University. He is also Special Advisor to United Nations Secretary General, Kofi Annan.
Rohit Arora is a graduate student at the School of International and Public Affairs at Columbia University.
Harpreet Khurana is a student at the Graduate School of Business at Columbia University.
Nirupam Bajpai presented this paper to His Excellency, Dr. A P J Abdul Kalam, President of India, the Honorable Dr. Manmohan Singh, Prime Minister of India, Dayanidhi Maran, Information Technology and Communications Minister of India and P Chidambaram, Finance Minister of India during his two day visit to New Delhi on June 17 and 18, 2004.
3
Executive Summary
Global Services Sourcing (GSS) is not an original concept. What is original about it is the media attention it seems to be getting. We have adopted the “then and now” philosophy in developing this report. We start by talking to the pioneers of global services sourcing, companies like General Electric, Nortel Networks and Citibank. The key learning from talking to these companies who have been sourcing their processes for more than a decade is that the long held view - “went for cost, stayed for quality” about moving processes outside the company (in some cases outside the country) is too simplistic. Rather we found that “went for cost and quality, stayed for continued quality at competitive costs” is more in line with the strategy that that these companies employed. Next, our in depth questionnaire tries to capture the “now” of the global services sourcing industry. Since the pioneers had shone the arc light on quality we developed specific quality related questions. The results validated the pioneers’ views:
67% of the respondents said that actual cost savings from services sourcing have been anywhere from 5% - 50% (onshore and/or offshored)
82% of the respondents said that going into the global services sourcing arrangement they look for quality of processes to increase by 2 – 10% (onshore and/or offshored)
70% of the respondents said that the quality of outsourced business processes has increased (quality increase of 5% -10%) or increased significantly (quality increase of 10% - 25%)
The top three drivers of outsourcing were:
Cost savings Increasing capacity Ability to take advantage of offshore labor (through captive centers)
The most difficult phase of outsourcing was transition or handoff of business processes from the company to its outsourcing partner. The top risk factors in outsourcing were:
Loss of institutional knowledge Poor communication with vendor Mismatch of firm cultures
Of the companies that are engaged in services sourcing, 79% of respondents were using an offshore based provider. Perhaps in a sign of maturing of global services sourcing 62% chose to offshore their services to at least one country in addition to India, the current offshoring destination of choice. As far as country risk factors, legal risks (laws comparable to international standards - data security, intellectual property rights) followed by political risks were identified as the top areas of concern. The lesson for countries competing for offshored business and FDI inflows in services is that the robustness and fairness of the legal system is a major factor for companies especially in the face of concerns about loss of institutional knowledge. The overall satisfaction level with outsourcing was high at 68% but a sizeable chunk of respondents – 26% were either unsatisfied or very unsatisfied with their outsourcing arrangements. Almost all of these unsatisfied firms have been outsourcing for 12 months or less, reinforcing the literature about thinking of outsourcing being a long term investment rather than a short term win.
4
ACKNOWLDGEMENTS In writing this report, we have been extremely privileged to receive support from a large number of distinguished and knowledgeable people. We want to acknowledge and thanks everybody for their support and help. The historical perspective on global services sourcing of the report would not have been possible without the active support of people who helped us write the case studies of the pioneering companies. The contribution of Mr. Diju Raha, Mr. Rick Pfiffer and Mr. Michael Quinn in putting together these case studies has been immensely valuable. Professor Gershoff of Columbia Business School helped us in designing the questionnaire. In addition, we are very grateful to a number of senior executives and domain experts. Mr. Vivek Agrawal of McKinsey Global Institute gave us valuable inputs from the time of framing the questionnaire to the final draft of the report. Mr. Jay Altizer of Bain & Co, Mr. Mark Blaxill of the Boston Consulting Group, Ms. Rebecca Scholl of Gartner Inc. and Mr. Chris Gentle of Deloitte provided us inputs along the way. Mr. Vishal Sharma of Marco Polo Partners helped us stay in touch with the developments in the financial services industry. We also want to thank senior executives at Morgan Stanley who made available their research materials to us. Mr. Peter Hooper from Deutsche Bank and Mr. Bill Dudley of Goldman Sachs also gave their valuable inputs about the Wall Street perspective. We received valuable inputs about the policy ramifications of the global services sourcing. Mr. Torbjorn Fredrikssonn of UNCTAD provided us with the European perspective, Mr. Pierre Sauve of World Bank and Mr. Peter Morrison of WTO weighed in on the GATS section of the report. Additionally, Mr. Jerry Rao along with Mr. K.R. Vaidyanathan and Mr. Paraj Kakkar from Mphasis provided us with case studies. Mr. Anish Nanavaty and Mr. Ujjawal Majumdar from WNS, Mr. Tom Murray from E-Telecare provided us with the case studies about different aspects of quality initiatives been taken by the service providers. Mr. R. Arun and Mr. Sarangan of Infosys gave their inputs about the future trends of offshoring. Mr. Kiran Karnik and Mr. Suneel Mehta of Nasscom made available Nasscom’s research materials for us. Mr. James Madden and Mr. Robert Gunn of Exult Inc. helped us with putting together Exult’s case study. Mr. Krishnan Hariharan of Columbia University helped us in putting the media case study and in the general editing of the report.
5
Definitions BPO (business process outsourcing) The delegation of one or more IT-intensive business processes to an external provider that, in turn, owns, administers and manages the selected processes, based on defined and measurable performance metrics. Sourcing The procurement of resources — whether from internal or external sources — to accomplish business objectives. Sourcing purely from external sources is known as "outsourcing" (see outsourcing). Global sourcing1 A service delivery model in which work is performed by a virtual team, which may consist of personnel that are on-site, domestic, nearshore or offshore. Nearshore An outsourcing term describing the provision of services from a country that is close to the client enterprise's country — for example, services provided to a US enterprise from a service provider located in Mexico. Offshore An outsourcing term describing the provision of services from a country that is geographically remote from the client enterprises — for example, services provided to a U.S. enterprise from a service provider located in India.
ITES
IT enabled services where IT is used a tool to execute various other functions like finance and
accounting, HR, payroll processing etc.
Source: The Gartner Glossary of Information Technology Acronyms and Terms
1 We use this definition for Global Services Sourcing (GSS), focusing solely on services
6
Introduction A good place to start the discussion on global services sourcing is to talk about what has been happening in this space for over a decade, long before GSS became a debated, and a headline grabbing topic. For this we talked to three companies: Nortel Networks, Citibank and General Electric (GE) who we like to consider the pioneers of global services sourcing. In the late eighties and early nineties they were pioneering this trend in their respective countries. Services sourcing is all about outsourcing and offshoring, in line with time-tested corporate philosophy of “produce where it is cheapest and sell where it fetches the best price”. While GSS is more than a decade old phenomenon, over the last couple of years in particular, global corporations are resorting to cost cutting measures by offshoring a variety of service sector jobs at a frantic pace to global low cost centers. Since the early to mid-1970s, “outsourcing across the continents” as a concept, has proven to be successful with the substantial movement of manufacturing operations from the United States and Western Europe to Asian and Latin American countries. In the late 1970s and 1980s, jobs were “exported” from developed countries to East Asian countries like Korea, Malaysia and Singapore. The late 1980s and early 1990s saw an increased focus by American companies to move their key manufacturing operations to mainland China to take advantage of its cheap labor and a variety of fiscal and other incentives offered to foreign investors in China’s Special Economic Zones (SEZs) across coastal China. The success of NAFTA brought Mexico into focus as an effective manufacturing base as well due to its geographical proximity to the U.S.
Though outsourcing of manufacturing operations has proved itself to be a time-tested and successful phenomenon, outsourcing of services was never considered to be feasible until a decade ago. It was assumed that good quality services could not be sourced from the developing countries, and also that the technology needed for such operations was not at hand. Services were considered far too personalized and required face-to-face interaction, or at least geographical proximity, between the recipient and the provider. The pioneers of outsourcing (discussed below) took the leap in this direction in the late 1980s and early 1990s, a trend which would see a huge surge in outsourcing activities across the globe in the late 1990s by when the proven success of offshore outsourcing of software development and maintenance, global corporations began to explore the possibility of outsourcing both non-core and critical core tasks and processes to lower cost locations in Asia. And the major candidate countries were the same as those popular for IT outsourcing: India, Ireland and Philippines. This paper is organized as follows: in Section I we describe the pioneers of outsourcing, focusing on General Electric, Nortel Networks, and Citibank. In Section II, we look at country competitiveness. Key drivers of the GSS are discussed in Section III. Since India is the most dominant player in GSS currently, Section IV is devoted to a detailed look at India as a provider of services. The U.S. response to GSS is analyzed in section V. In brief, section VI looks at the General Agreement Treaty on Services, and its various provisions.

7
Section I: Historical perspective on Global Services Sourcing (GSS)
General Electric The year was 1996. Existing Landscape: 1996 represented the third year of GE Capital’s presence in India and several GE Capital businesses were still ramping up. The GE consumer finance JV with HDFC2 was established in 10 cities and running from 13 offices, and was at that time, the most profitable part of GE Capital Services India (GECSI). The dilemma facing GECSI at the time was that they could not leverage GE’s triple A rating in raising rupee denominated funds, and thus they could not compete with the cost of funds of the Indian incumbents. Bringing in debt from outside India was not an option, due to exchange control, and GE did not have the brand recognition to borrow effectively on the domestic market. So, during the early years of GECSI, they financed their activity with either equity or by borrowing from Indian institutions at rates significantly higher than local borrowers. This left very little margin for GECSI when pricing “money over money” transactions (e.g. leases, commercial finance, etc.). Due to: (1) what appeared to be a government / regulatory obstacle that wasn’t going to disappear in the short term, (2) GECSI managers’ prior success in recruiting and training finance and accounting staff, collectors and customer service agents to serve the domestic GECSI operations, and (3) management’s response to find alternative means of generating sources of profitable revenue, planning began to provide services to other GECS components outside of India. Initial move outside the US
1. GE pressure to demonstrate greater profits 2. Improving profits and providing services internally seemed to make sense. 3. An exceptionally important point was the strong support of top management in GE and GE
Capital.
GE has always been a process and cost conscious company. It frequently employed “Champion Challenger” strategies to verify internal processes against outside vendors in terms of efficiency and effectiveness. GE had also developed shared services platforms in North America and Europe for Finance and other common functions. So internal outsourcing was recognized as practical in certain areas of the business. Offshore outsourcing was a natural extension to this situation. Initially the work which was sent out was without any significant strategic plans. It was part of an internal thought process of getting the work done at a lower cost and senior level management in GE supported developing a center that leveraged in-India GE training programs that could serve other GE entities outside of India. At the time GE Capital Services India (GECSI), based in Delhi, had a JV company known as Countrywide Consumer Financial Services (CCFS), based in Mumbai. Managers in GECSI and CCFS served as the “receiving team” transition managers. Some of them worked in the US for
2 Housing Development Finance Corporation- India’s biggest home mortgage financing company
8
anywhere from 6 months to 2 years to learn processes and become part of the US-based “sending team”.
The initial move towards outsourcing/offshoring work was in areas of simple, early stage collections calls, customer care calls, and finance and accounting functions, initially to serve certain accounts payable functions.
Geographical path taken by GE There was no discernable “geographical” path taken by GE; it was more in lines with providing English based services back to GECS entities in English speaking countries (e.g. USA, Canada, UK and Australia). Later, other European work was added, which required translators to be on hand (for BPO work). This was easier for finance work as outputs were consistent and highly repetitive. By December 1995 - GE was already getting IT work done from TCS3, Wipro, PCS4 and Satyam. In January 1996 - GE executives started thinking that India had more than just the IT skills. This happened because of the following reasons which forced GECSI to change their initial plans.
1. No clear horizon about when GE Capital could leverage AAA cost of funds in India. – true, see above point
2. Success had been demonstrated in transferring F&A and consumer finance business skills to India.
It was noticed that Indians were quick learners, and early adopters of quality programs to move towards Six Sigma quality delivery. Quality
1. Performance was benchmarked against global dashboards measurements- CCFS scored the second highest quality after USA in terms of collections effectiveness and the quality of the consumer finance portfolio–high quality was quickly understood and implemented.
2. The IT outsourcing experience and its ramping up was good learning experience for GE. 3. Imported GE training programs to India and exported ‘hi- pots” for 6- 12 months for broader
GE exposure and training. In this GE colleagues in US and UK frequently commented about the caliber of talent coming out of India.
Job loses
Some managers and front line associates did not enjoy seeing their work go offshore. However, Jack Welch established some aggressive stretch goals for general managers throughout GE. To achieve these net profit targets, many general managers understood that one way of improving their performance was to offshore certain functions to GECIS. Jack Welch had proved early on in his tenure as CEO that he was prepared to take the hard decisions. GE culture was one of recognizing the problems and meeting them head on.
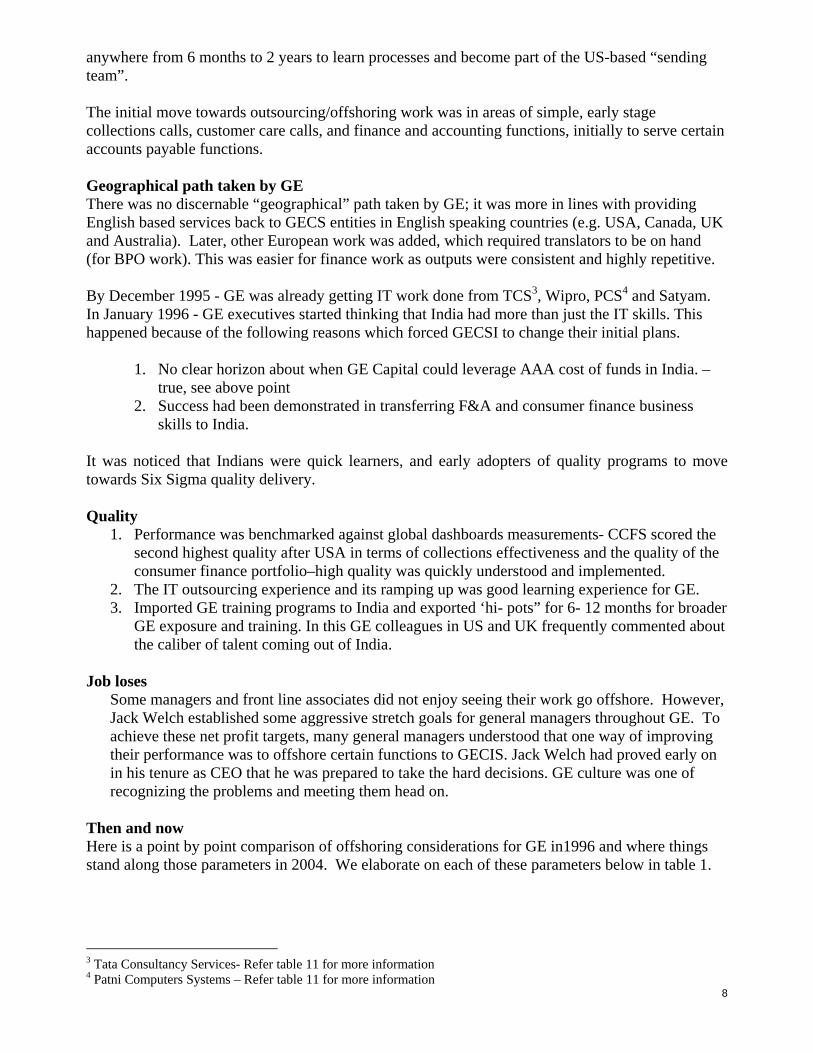
Then and now Here is a point by point comparison of offshoring considerations for GE in1996 and where things stand along those parameters in 2004. We elaborate on each of these parameters below in table 1.
3 Tata Consultancy Services- Refer table 11 for more information 4 Patni Computers Systems – Refer table 11 for more information
9
Table 1: Offshoring considerations for GE 1996 v/s 2004 Number Factors 1996 2004
1 Telecom (cost per E1 /yr.) > 900k < 150 k 2 Domestic telecom carriers 2 50+ 3 No. of offshore outsourcers 356 1000+ 4 # of international. captives in India 3 20+ 5 Wage trends in ITES firms High Moderate 6 Perception of India Low High 7 Quality training programs None High 8 Project Mgmt. experience Low High 9 Domain expertise( IT/BPO) Med/low High/low
1) GE installed expensive earth stations that transmitted to a satellite linked with a downlink site in Bristol, UK. From there communications traveled via ocean cable to the USA. By having just one satellite “hop”, latency was minimized to approx. 500 milliseconds. 2) There are many alternative communication alternatives today in India. VSNL (one of India’s premier telecom company) has liberalized and become far more cost competitive. Thus, communication costs have dramatically reduced from 1996 levels, resulting in a far more competitive equation to offshore. 3) More offshore outsourcers provided more experience to learn from in terms of how to continuously improve quality and control cost. 4) The market understood what processes were being tried and successfully implemented elsewhere in India, thus providing further confidence that other processes could be offshored. 5) In 1996 wage increases in the IT sector were rising rapidly (e.g. 40 to 70% for entry and mid-level managers). Today with more market entrants and more competition, wages have stabilized. For a couple of years (early 2000+) wages for “freshers” reduced. 6) In 1996, few companies were exporting IT projects to India. Today, managers can read several articles per week of new business moving to India from the US, UK and elsewhere. 7) Most Indian concerns have developed SEI-CMM quality programs or are ISO 9001 / 2 certified. While important, what may be lacking is a more conscious effort to understand industry issues so that contextual knowledge is transferred to India as well. 8) During the early days, managers at some ITES vendors had difficulty discussing problems that resulted in milestones not being achieved. Over time, more managers in India have both improved their project management skills and learned how to more openly discuss project issues/problems with foreign counter parties.
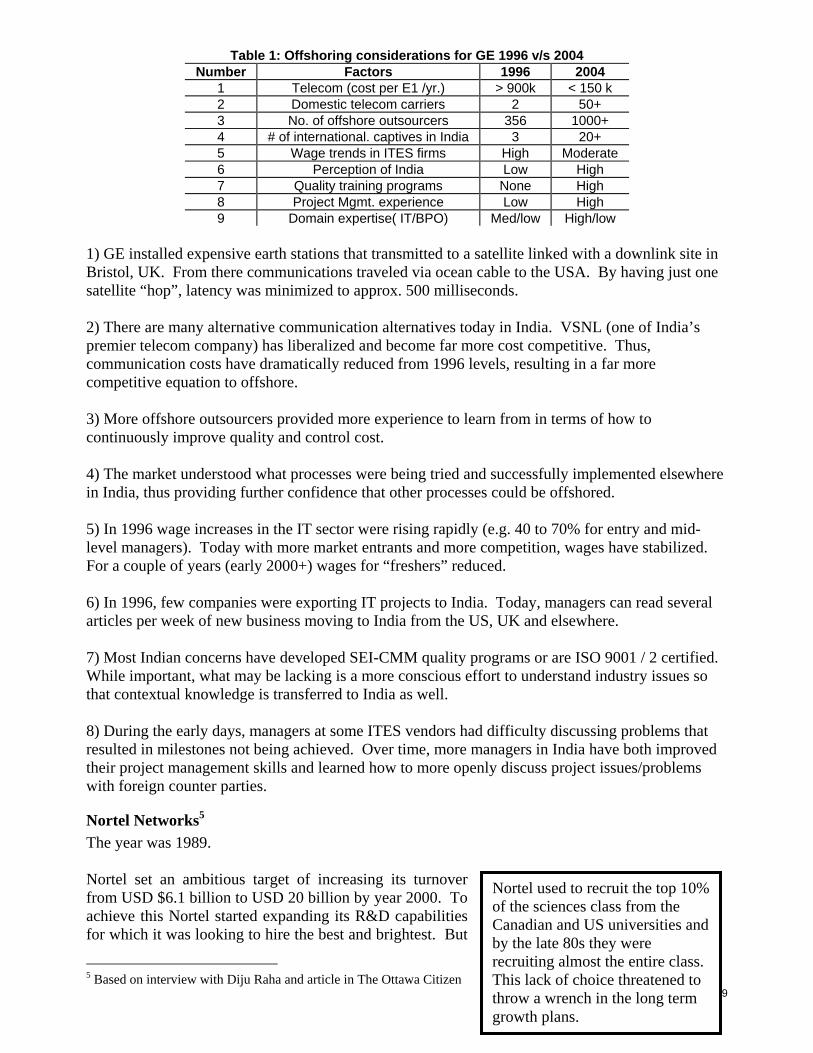
Nortel Networks5 The year was 1989. Nortel set an ambitious target of increasing its turnover from USD $6.1 billion to USD 20 billion by year 2000. To achieve this Nortel started expanding its R&D capabilities for which it was looking to hire the best and brightest. But
5 Based on interview with Diju Raha and article in The Ottawa Citizen
Nortel used to recruit the top 10% of the sciences class from the Canadian and US universities and by the late 80s they were recruiting almost the entire class. This lack of choice threatened to throw a wrench in the long term growth plans.
10
there was a problem. “We could see that a serious constraint was going to be the availability of scientific and technical skills,'' says Diju Raha, the current chairman and CEO of EximSoft International. Diju Raha at that point was the General Manager of Northern Telecom (Nortel). "Enrollment in science and technology had already peaked in North America and the college-age population was declining,'' he says. Nortel used to recruit the top 10% of the sciences class from the Canadian and US universities and by the late 80s they were recruiting almost the entire class. This lack of choice threatened to throw a wrench in the long term growth plans. Nortel decided to look globally for much needed technical talent. China calling China was familiar territory for Nortel since it had strong market presence and deep interest in China. It was also the source of large orders for Nortel’s telecom equipment. In what seemed like a logical next step, they decided to set up a software development center in China. But their plan soon hit a roadblock:
1. At first the state owned telecom labs seemed like an attractive partner. But as Mr. Raha soon discovered there was a lack of project management and execution skills, which raised accountability issues. This was a serious threat to business continuity.
2. Language barrier was a big issue as it made training people an enormous task. 3. Lack of Intellectual Property Rights (IPR) protection and patent laws – an extremely
important consideration for Nortel - a high end telecom company. The Chinese initiative never took off. Diju Raha meanwhile was looking globally to scout for the brightest minds. Then one day PBS aired a television program which examined the business of writing software in the developing world. India was featured prominently. Raha spent weeks tracking down the show's producer, eventually finding him in Harrisburg. Raha screened the PBS tapes and decided India was ideal for what he had in mind for the following reasons:
1) India had private sector companies. Although the Indian software industry was extremely nascent, he saw a lot of potential.
2) India had the infrastructure for conducting business. There was a rule of law, democratic institutions, judicial and banking systems
3) India had process protection patent law in place. An interesting aspect of India’s nascent software industry was that mainframe computer systems never took off, which meant India did not have legacy systems. Indian software professionals could thus leapfrog into the newer age (and cheaper) UNIX platform being used world-wide. Mr. Raha says, “We were not looking for cost savings, we wanted the best and brightest in the world, irrespective of where they came from.” India’s invitation In what was clearly an unconventional step at the time (early 1990’s), Nortel decided to set up an offshore software development center. The risks to this move were high. On the plus side India was 10 ½ hours ahead of the US allowing for the possibility of doing R&D 24 hours a day. And India's colleges and universities were churning out thousands of English-speaking graduates with solid engineering and programming credentials. Many of the graduates were heading straight to North America and Europe for further study or to join multinationals. But thousands more were staying home where they could provide Nortel with a deep pool of programming talent available for less than 30 per cent of the cost of a typical North American engineer.
11
Even so, it was no simple matter for Nortel to set up formal alliances on the sub-continent. Raha first of all needed to convince his North American colleagues that farming out jobs to India was a good idea. Many Nortel managers worked hard to keep jobs in North America where they felt they had more control over things. Some were dubious about the quality of Indian programmers. Still others were suspicious that their new Indian partners would share what they learned with Nortel's competitors. Raha's first step was to find a sponsor within Nortel to get the Indian R&D project under way. He approached John Roth, today the company's chief executive but at the time a senior vice-president. Roth had run Nortel's R&D labs in the early 1980s and, unlike some of the firm's more junior managers, had no difficulty with the concept of contracting out some of the more routine R&D. He chipped in some start-up money. The early days Raha then went seeking talent. His first stop was Mumbai (then known as Bombay), where he visited a large software services company. "The facilities weren't very impressive," Raha recalls, "but the executives were world class." Raha then flew south to the country's emerging tech capital of Bangalore, where he held talks with several emerging software companies. "We were looking for enthusiastic people within the companies who wanted a challenge,'' Raha says. He awarded each of the firms a contract to help Nortel with some aspect of its software R&D. "I felt the projects shouldn't be so complex that we ensured failure,'' he explains, "but I didn't want them to be so simple they didn't provide a test.'' Among the jobs assigned was a project to convert
software code from one computer language to another. Other assignments involved the development of tools for testing telecom software. The idea of using Indian programmers to complement North American R&D projects wasn't unique to Nortel. But Raha had in mind something more ambitious. Right from the beginning, he says, he wanted to "engage the minds of Indians" and steadily ratchet up the sophistication of the R&D done on Nortel's behalf.
The Indian programmers completed most of the projects successfully and Nortel began assigning more complicated jobs. This is when the first real problems began emerging. People in India weren't familiar with working in an environment with proprietary software and advanced equipment. A lot of handholding was required. India tech matures Raha points out that India's top software companies at the time were very good at handling chores involving the translation of software from one type of technology platform to another.” This was well-bounded, well-defined work that could be done remotely without much supervision," he says. But jobs involving imaginative approaches to creating applications or products were a stretch for most of the local programmers. India's software services industry was still in its early stages. In 1989, the country's entire software industry generated sales of only $150 million U.S. India's companies were operating under severe government restrictions. They could not raise money, list on stock exchanges or import personal computers for their personal use without the permission of government bureaucrats. More to the point as far as Nortel was concerned, India's software firms had little experience working on large-scale technology projects which required
Many Nortel managers worked hard to keep jobs in North America where they felt they had more control over things. Some were dubious about the quality of Indian programmers. Still others were suspicious that their new Indian partners would share what they learned with Nortel's competitors.
12
complex procedures and testing to ensure quality. India's notoriously inefficient telecom and power networks didn't help matters. In 1991 a currency exchange crisis prodded India into loosening some of the restrictions on high-tech firms. The government move encouraged some of the more aggressive U.S. multinationals to begin setting up operations in India. This development put enormous pressure on India-based firms to shape up. Suddenly, Nortel's influence was crucial. Nortel encouraged Infosys and Wipro to develop enclaves of employees who worked exclusively on Nortel projects. The programmers were assigned their own offices and telephone exchanges. Nortel, concerned about the quality of overseas data links, also spent millions on satellite links, switches and other telecom gear. "Nortel was a very strategic thinker," says Nandan Nilekani, the cofounder and chief operating officer of Infosys. "They insisted from day one that we put in very good telecommunications links from here to Canada and they provided us with leading-edge switches for us to work on." What about Quality? To outsiders, the off-shored group assigned to handle Nortel projects looked very much like they were part of Nortel's global workforce. These R&D units became known as dedicated offshore software development centers -- Infosys and Wipro eventually set up dozens of these centers on behalf of dozens of the globe's largest corporations. These facilities had the same quality specifications as Nortel labs anywhere in the world. Another slightly indirect measure of quality was that any time only 10% of the dedicated workforce from the Indian partners would be will be onsite at the Nortel location, the and rest would be working in offshore locations in India.
But in the early 1990s Raha wasn't entirely enthusiastic about how things were developing. For one thing, the physical construction of facilities in India was unpredictable, making planning difficult. Making matters worse was the relatively high turnover of Indian programmers who were accepting jobs with other firms in the U.S. This made it more difficult for programmers to hand off assignments back and forth between India and North America and chewed up a lot of time in the Nortel management group. The Indian firms learned quickly, however, and gradually won the confidence of their Nortel colleagues in North America. Indian programmers were also getting plenty of international experience. During the initial stages of most projects, the programmers and managers spent a lot of time in North America on customer sites, gaining a detailed picture of what was required. Then most would return to India to write the necessary programs. In order to ensure that training at the offshore Only a small chunk of this work involved leading-edge technology. When the North American firms moved from one generation of technology to the next they would hand off responsibility for the older stuff to India and then concentrate on the newest products. From the Indian firms' point of view, there was nothing particularly demeaning about this setup -- the older products were still being used and required constant updating. And they provided a steady stream of services revenues. By the late 1990s, Wipro and Infosys were reaching a respectable size. In 1999, Infosys became the first Indian company to list its shares on New York's NASDAQ Exchange. Wipro followed suit on
Nortel encouraged Infosys and Wipro to develop enclaves of employees who worked exclusively on Nortel projects. The programmers were assigned their own offices and telephone exchanges. Nortel, concerned about the quality of overseas data links, also spent millions on satellite links, switches and other telecom gear.
13
the New York Stock Exchange the following year. By the late 1990s more than 1,500 employees of India based firms currently work on Nortel projects, representing about 7 to 8 per cent of the company's global R&D. While the numbers of expected to rise to 1,700 or so by yearend, Nortel's Joe Samuel doesn't think Canadians need to worry about the possibility that Indian programmers will take over ever-larger chunks of Nortel's R&D group. "Companies won't move all their development effort to India," he says, "It has to be a balance. It's a resource pool buffer." The relationship between Nortel and its R&D allies has reached an interesting crossroads on another front. Programmers at Wipro and Infosys, for instance, are pressing for more interesting assignments, ones that involve working on leading edge technology. "Most designers want to work in the most advanced activity they can," says Samuel, "And we're trying to accommodate them."
Arun Kumar Singh, a technical manager with Wipro, cites a recent meeting with Nortel managers who had visited Bangalore. "They were asking us for new ideas about what we can do to improve the customers' products," he says. "The expectations have already changed. Nortel is no longer thinking of us in terms of low-cost programming." In part, this reflects a new reality -- salaries for Indian programmers have been rising more rapidly than for their Canadian counterparts, thus reducing
a once-huge gap. Samuel estimates it still costs Nortel 40 per cent less to use Indian labor. "It used to be much cheaper to do work in India," he says, "but it's still worthwhile in terms of the extra flexibility it gives us." "It's our belief that the latest communications technologies are allowing knowledge workers of all sorts to go global," he says, "They can now work from anywhere." Raha's achievements in India already provide ample evidence of that. The sub-continent's growing army of savvy programmers now appears set to complete India's transformation into a tech powerhouse. Raha believes that is only the beginning.
Companies won't move all their development effort to India," he says, "It has to be a balance. It's a resource pool.
14
Citibank The year was 1986. Situation Citibank had recently analyzed the profitability of their trade products and found the import product (imports into the US) to be less than favorable. On further analysis it was found that revenues were not being maximized, the market was moving to PC based initiation offerings and the cost infrastructure in the US was becoming increasingly challenging. As the majority of the imports under letter of credit (one sentence for the foot note explaining what the term means) were originated in Asia and because Citibank’s branch in Asia had developed good PC based technology it was decided that the best way to improve profitability was to use existing capabilities in Hong Kong which at the time was at the center of US-Asia flows. Initial move The initial movement was made by establishing Citicorp Trade Services Ltd. as a non-bank processing subsidiary in Hong Kong to process (?what?) on behalf of Citibank NA branches worldwide. This was to be a separate operation from the staff which supported Citibank Hong Kong’s branch operations. The top three reasons identified to shift work were:
1. Hong Kong was one of the biggest originators of exports of apparel and consumer electronic to the US. So shifting operations to Hong Kong meant being closer to customer. As there were fees paid by both the exporter and the importer in these transactions, being based in Hong Kong provided an opportunity to capture more “end to end” revenue.
2. Technology - PC based application was developed in 1984 (not sure what you meant when you said: more elaboration to support the initiation of letters of credit remotely). Also, the system had authentication and encryption to help them to transfer data safely. Replicating this infrastructure in North America would have been costly.
3. Because of lower cost and highly skilled manpower being available in Hong Kong it made economic sense to move as much of the manual processing to Hong Kong.
As labor costs increased in Hong Kong in the early 90’s work was shifted from Hong Kong to Penang, Malaysia and eventually to India in early 2001. Current state of affairs In the late 1990’s Citibank India formed OpsCo in the late 90’s to provide back office services to Citibank India. It was later called E-Serve. E-Serve expanded its services to other branches of Citibank in the region. It is a publicly traded company on both of India’s exchanges and Citibank holds a minority ownership position. The initial work force comprised of 700 people. E-Serve handles all the cash management and trade finance transaction processing for Citibank India, Sri Lanka and Bangladesh and credit cards services for the Eastern Europe, Middle East and Africa region of Citibank. In 2000 when Citibank moved the investigations function they were the first outsource arrangement from outside their immediate region (and management structure). Since that time, they have added other servicing including mortgage processing for the North American Consumer Bank and private bank back office processing work for Citibank in Europe among other things.
15
Job losses During the 1990’s through centralizing work (not necessarily offshore) an estimated 1200 people were affected. 90% of these were redeployed. A sample of the measures that were taken to support the displaced workers were: 1. Hiring freezes in all affected and related areas to allow as much natural attrition as possible. 2. Re-deployment to related areas as positions came available. 3. Active “marketing” of available staff to non-affected units. 4. Retraining for different positions within the affected areas. 5. New sources of activity within the affected area through new product launch
Takeaways from the Pioneers
Top management needs to be onboard and committed throughout the outsourcing process.
Well defined internal quality processes are a pre-requisite to a successful outsourcing relationship.
GSS will lead to periods of uncertainty. Put your best people in the forefront of this initiative – folks who are committed and do not feel threatened by the outsourcing decision.
16
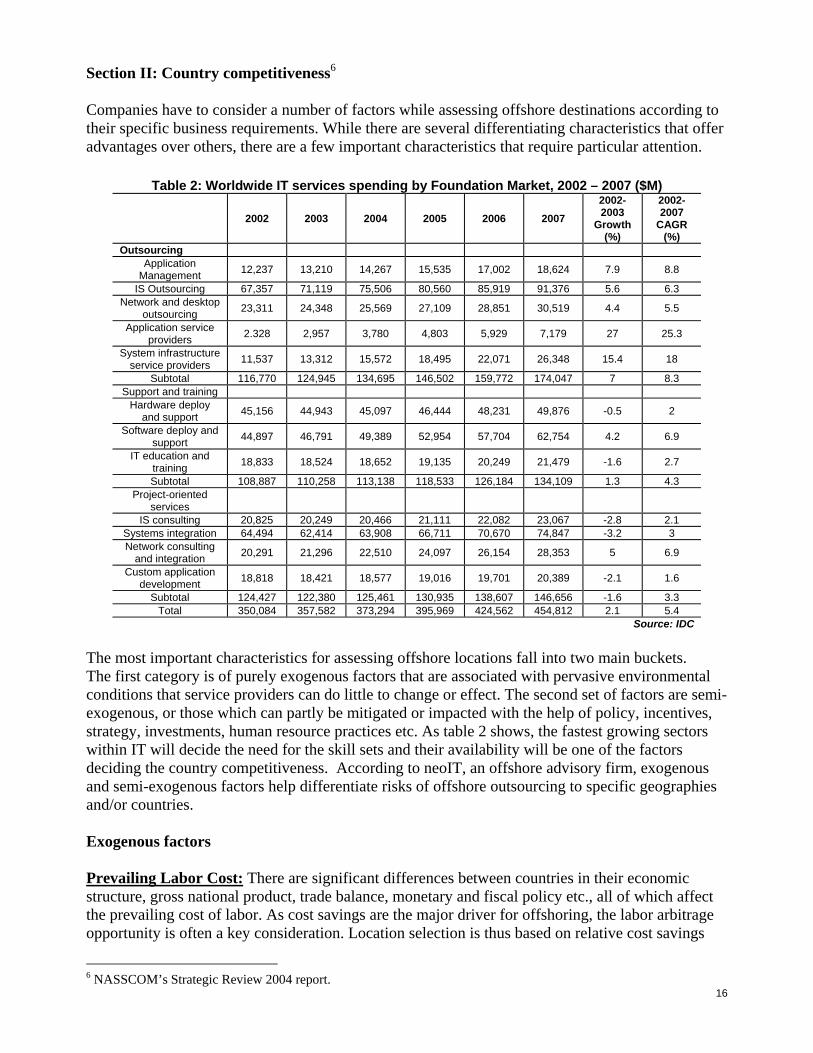
Section II: Country competitiveness6 Companies have to consider a number of factors while assessing offshore destinations according to their specific business requirements. While there are several differentiating characteristics that offer advantages over others, there are a few important characteristics that require particular attention.
Table 2: Worldwide IT services spending by Foundation Market, 2002 – 2007 ($M)
2002 2003 2004 2005 2006 2007 2002-2003
Growth (%)
2002-2007
CAGR (%)
Outsourcing Application
Management 12,237 13,210 14,267 15,535 17,002 18,624 7.9 8.8
IS Outsourcing 67,357 71,119 75,506 80,560 85,919 91,376 5.6 6.3 Network and desktop
outsourcing 23,311 24,348 25,569 27,109 28,851 30,519 4.4 5.5
Application service providers 2.328 2,957 3,780 4,803 5,929 7,179 27 25.3
System infrastructure service providers 11,537 13,312 15,572 18,495 22,071 26,348 15.4 18
Subtotal 116,770 124,945 134,695 146,502 159,772 174,047 7 8.3 Support and training
Hardware deploy and support 45,156 44,943 45,097 46,444 48,231 49,876 -0.5 2
Software deploy and support 44,897 46,791 49,389 52,954 57,704 62,754 4.2 6.9
IT education and training 18,833 18,524 18,652 19,135 20,249 21,479 -1.6 2.7
Subtotal 108,887 110,258 113,138 118,533 126,184 134,109 1.3 4.3 Project-oriented
services
IS consulting 20,825 20,249 20,466 21,111 22,082 23,067 -2.8 2.1 Systems integration 64,494 62,414 63,908 66,711 70,670 74,847 -3.2 3 Network consulting
and integration 20,291 21,296 22,510 24,097 26,154 28,353 5 6.9
Custom application development 18,818 18,421 18,577 19,016 19,701 20,389 -2.1 1.6
Subtotal 124,427 122,380 125,461 130,935 138,607 146,656 -1.6 3.3 Total 350,084 357,582 373,294 395,969 424,562 454,812 2.1 5.4
Source: IDC The most important characteristics for assessing offshore locations fall into two main buckets. The first category is of purely exogenous factors that are associated with pervasive environmental conditions that service providers can do little to change or effect. The second set of factors are semi-exogenous, or those which can partly be mitigated or impacted with the help of policy, incentives, strategy, investments, human resource practices etc. As table 2 shows, the fastest growing sectors within IT will decide the need for the skill sets and their availability will be one of the factors deciding the country competitiveness. According to neoIT, an offshore advisory firm, exogenous and semi-exogenous factors help differentiate risks of offshore outsourcing to specific geographies and/or countries. Exogenous factors Prevailing Labor Cost: There are significant differences between countries in their economic structure, gross national product, trade balance, monetary and fiscal policy etc., all of which affect the prevailing cost of labor. As cost savings are the major driver for offshoring, the labor arbitrage opportunity is often a key consideration. Location selection is thus based on relative cost savings
6 NASSCOM’s Strategic Review 2004 report.
17
derived from offshoring to low cost labor countries such as India, Philippines, Russia, China, Vietnam, etc. Socio and Geopolitical Risk: Countries differ in their inherent stability based on exposure to social and geopolitical risks that could lead to unrest and disrupt normal business operations. While most of these risks are real, it is important to differentiate the perception based risks from real risks. Post September 11th, socio and geopolitical risk has become an increasingly important factor in making location decisions. Physical and Time Zone Displacement: Increased physical distance reduces the opportunity for personal interaction including direct observation, vendor management, contract enforcement, process transfer management etc. Companies concerned with their ability to manage and control vendors within the same city, state, or country would be unlikely to consider a superior offshore service provider. While time zone differences also offer benefits such as 24x7 turnaround times, often the lack of physical presence can serve as a deterrent in making location decisions. Often, when convenience of physical presence is required, companies trade higher labor and total costs in favor of greater opportunity for peace of mind with direct management and control. Ecosystem and Trade Options: The presence of strongly related industries as well as the attractiveness of other local markets can increase opportunity for an offshoring company in a specific destination market. Even when direct spending is not a prerequisite to access an offshore market, the experience and contacts gathered prove invaluable towards enabling subsequent market entry. Business Environment: Countries differ in the conduciveness of their business environments for offshoring. Favorable business factors include policies, government support, tax incentives, access to the legal system, incentives for starting a business, intellectual property protection, vibrant industry associations etc. Such factors can remove concerns and risks for companies seeking to offshore. Semi-exogenous factors Communications: There is a natural inclination to do business in countries where language is not an issue. However, communication capability is not just speaking the same language but includes accents, use of colloquialisms, comprehension of business nuances etc. For instance in IT development, shared language between client and vendor teams is essential when a high degree of interaction is required. When requirements are more technically driven and are tightly defined with minimal ambiguity, same language requirements are minimized. In voice-based BPO (customer contact, employee support, telemarketing, collections, financial services etc.) speaking the same language is a critical requirement. For example, for UK and US based companies, countries with a large number of skilled English speaking workers have an advantage over countries that do not speak the language. While some countries have an inherent advantage over others when it comes to language skills, vendors can also positively impact language issues through extensive employee training in accent neutralization and other verbal and nonverbal communications skills. Culture: Cultural compatibility is one of the most significant enablers of a successful offshoring experience and one of the most neglected. Cultural compatibility goes beyond language skills and is critical for enhancing communication and for the development of strong client-vendor relationships.
18
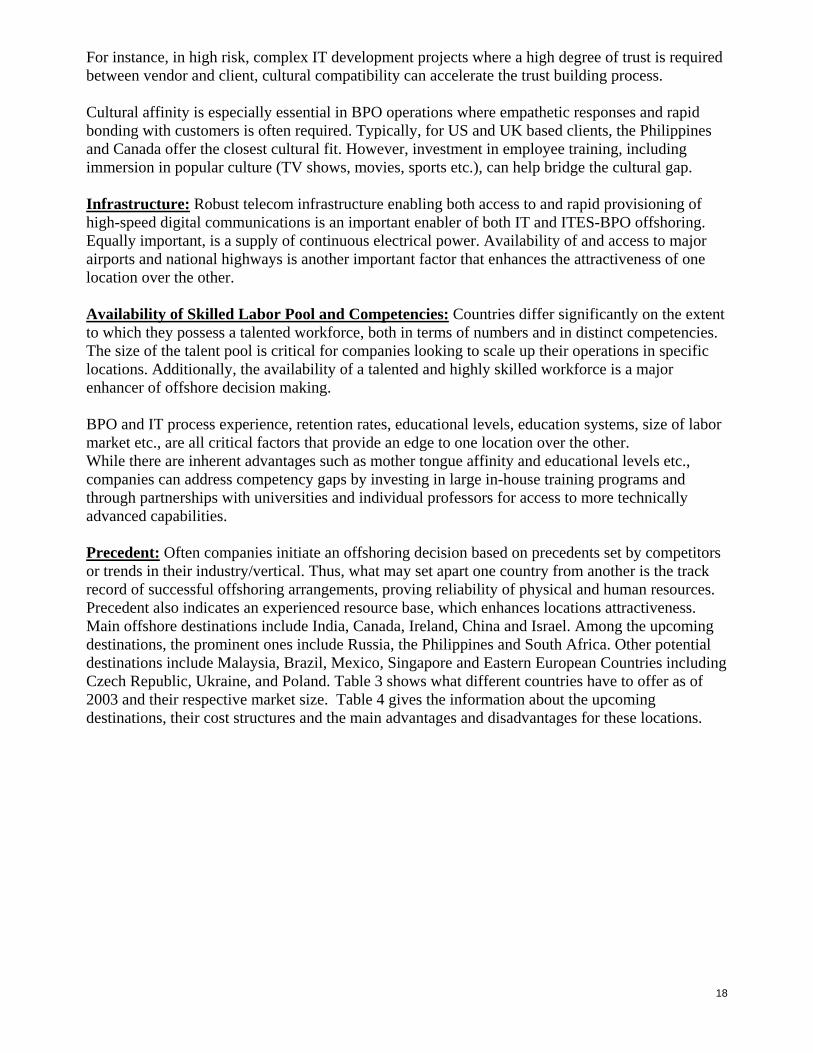
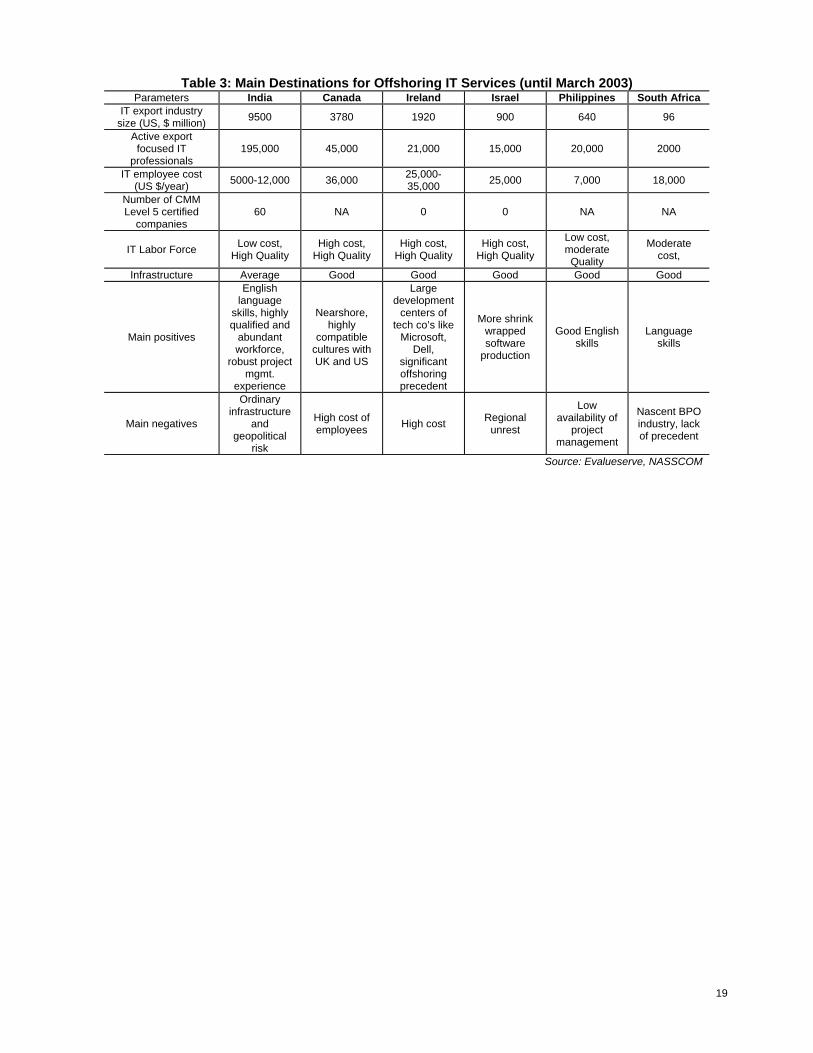
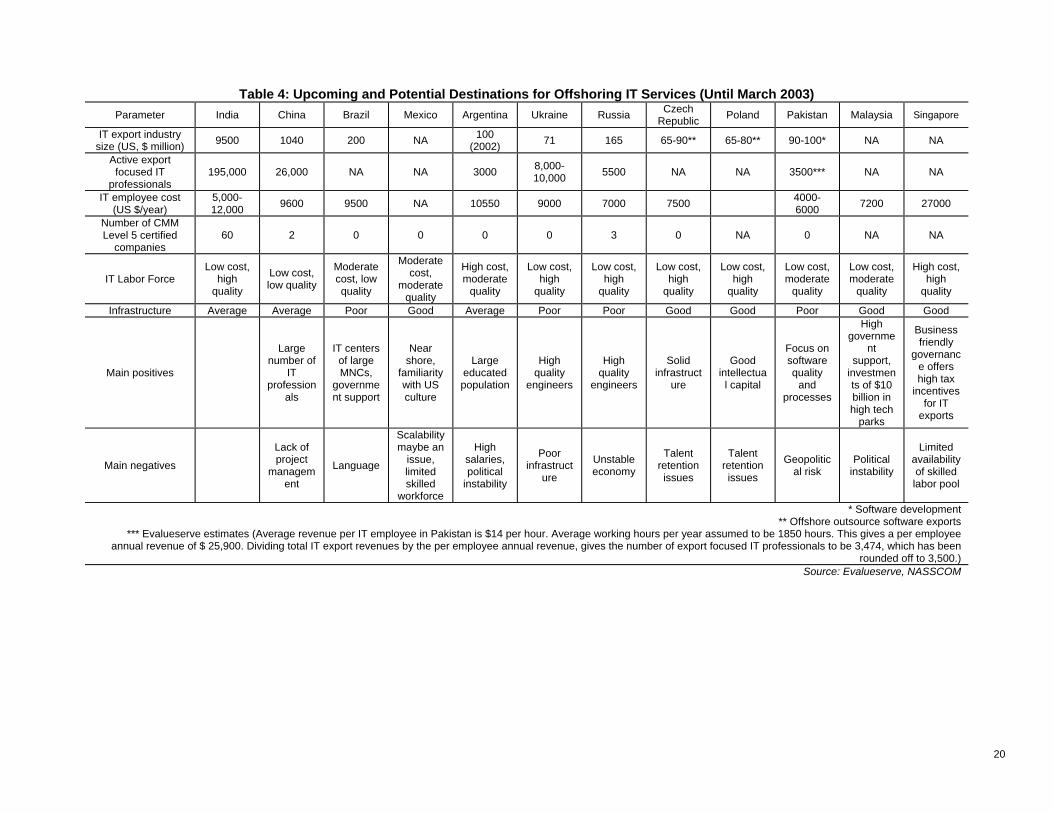
For instance, in high risk, complex IT development projects where a high degree of trust is required between vendor and client, cultural compatibility can accelerate the trust building process. Cultural affinity is especially essential in BPO operations where empathetic responses and rapid bonding with customers is often required. Typically, for US and UK based clients, the Philippines and Canada offer the closest cultural fit. However, investment in employee training, including immersion in popular culture (TV shows, movies, sports etc.), can help bridge the cultural gap. Infrastructure: Robust telecom infrastructure enabling both access to and rapid provisioning of high-speed digital communications is an important enabler of both IT and ITES-BPO offshoring. Equally important, is a supply of continuous electrical power. Availability of and access to major airports and national highways is another important factor that enhances the attractiveness of one location over the other. Availability of Skilled Labor Pool and Competencies: Countries differ significantly on the extent to which they possess a talented workforce, both in terms of numbers and in distinct competencies. The size of the talent pool is critical for companies looking to scale up their operations in specific locations. Additionally, the availability of a talented and highly skilled workforce is a major enhancer of offshore decision making. BPO and IT process experience, retention rates, educational levels, education systems, size of labor market etc., are all critical factors that provide an edge to one location over the other. While there are inherent advantages such as mother tongue affinity and educational levels etc., companies can address competency gaps by investing in large in-house training programs and through partnerships with universities and individual professors for access to more technically advanced capabilities. Precedent: Often companies initiate an offshoring decision based on precedents set by competitors or trends in their industry/vertical. Thus, what may set apart one country from another is the track record of successful offshoring arrangements, proving reliability of physical and human resources. Precedent also indicates an experienced resource base, which enhances locations attractiveness. Main offshore destinations include India, Canada, Ireland, China and Israel. Among the upcoming destinations, the prominent ones include Russia, the Philippines and South Africa. Other potential destinations include Malaysia, Brazil, Mexico, Singapore and Eastern European Countries including Czech Republic, Ukraine, and Poland. Table 3 shows what different countries have to offer as of 2003 and their respective market size. Table 4 gives the information about the upcoming destinations, their cost structures and the main advantages and disadvantages for these locations.
19
Table 3: Main Destinations for Offshoring IT Services (until March 2003) Parameters India Canada Ireland Israel Philippines South Africa
IT export industry size (US, $ million) 9500 3780 1920 900 640 96
Active export focused IT
professionals 195,000 45,000 21,000 15,000 20,000 2000
IT employee cost (US $/year) 5000-12,000 36,000 25,000-
35,000 25,000 7,000 18,000
Number of CMM Level 5 certified
companies 60 NA 0 0 NA NA
IT Labor Force Low cost, High Quality
High cost, High Quality
High cost, High Quality
High cost, High Quality
Low cost, moderate
Quality
Moderate cost,
Infrastructure Average Good Good Good Good Good
Main positives
English language
skills, highly qualified and
abundant workforce,
robust project mgmt.
experience
Nearshore, highly
compatible cultures with UK and US
Large development
centers of tech co’s like
Microsoft, Dell,
significant offshoring precedent
More shrink wrapped software
production
Good English skills
Language skills
Main negatives
Ordinary infrastructure
and geopolitical
risk
High cost of employees High cost Regional
unrest
Low availability of
project management
Nascent BPO industry, lack of precedent
Source: Evalueserve, NASSCOM
20
Table 4: Upcoming and Potential Destinations for Offshoring IT Services (Until March 2003) Parameter India China Brazil Mexico Argentina Ukraine Russia Czech
Republic Poland Pakistan Malaysia Singapore
IT export industry size (US, $ million) 9500 1040 200 NA 100
(2002) 71 165 65-90** 65-80** 90-100* NA NA
Active export focused IT
professionals 195,000 26,000 NA NA 3000 8,000-
10,000 5500 NA NA 3500*** NA NA
IT employee cost (US $/year)
5,000-12,000 9600 9500 NA 10550 9000 7000 7500 4000-
6000 7200 27000
Number of CMM Level 5 certified
companies 60 2 0 0 0 0 3 0 NA 0 NA NA
IT Labor Force Low cost,
high quality
Low cost, low quality
Moderate cost, low quality
Moderate cost,
moderate quality
High cost, moderate
quality
Low cost, high
quality
Low cost, high
quality
Low cost, high
quality
Low cost, high
quality
Low cost, moderate
quality
Low cost, moderate
quality
High cost, high
quality
Infrastructure Average Average Poor Good Average Poor Poor Good Good Poor Good Good
Main positives
Large number of
IT profession
als
IT centers of large MNCs,
government support
Near shore,
familiarity with US culture
Large educated population
High quality
engineers
High quality
engineers
Solid infrastruct
ure
Good intellectua
l capital
Focus on software quality
and processes
High governme
nt support,
investments of $10 billion in high tech
parks
Business friendly
governance offers high tax
incentives for IT
exports
Main negatives
Lack of project
management
Language
Scalability maybe an
issue, limited skilled
workforce
High salaries, political
instability
Poor infrastruct
ure
Unstable economy
Talent retention issues
Talent retention issues
Geopolitical risk
Political instability
Limited availability of skilled labor pool
* Software development** Offshore outsource software exports
*** Evalueserve estimates (Average revenue per IT employee in Pakistan is $14 per hour. Average working hours per year assumed to be 1850 hours. This gives a per employee annual revenue of $ 25,900. Dividing total IT export revenues by the per employee annual revenue, gives the number of export focused IT professionals to be 3,474, which has been
rounded off to 3,500.) Source: Evalueserve, NASSCOM
21
Section III: Key drivers of GSS
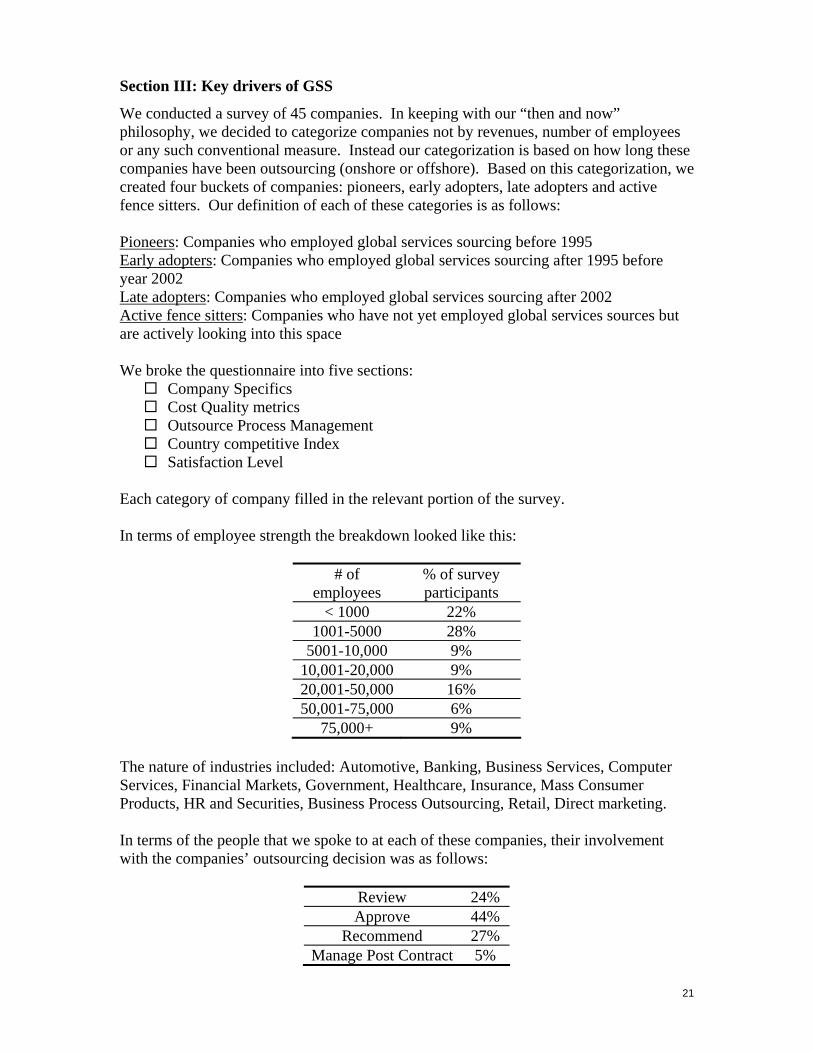
We conducted a survey of 45 companies. In keeping with our “then and now” philosophy, we decided to categorize companies not by revenues, number of employees or any such conventional measure. Instead our categorization is based on how long these companies have been outsourcing (onshore or offshore). Based on this categorization, we created four buckets of companies: pioneers, early adopters, late adopters and active fence sitters. Our definition of each of these categories is as follows: Pioneers: Companies who employed global services sourcing before 1995 Early adopters: Companies who employed global services sourcing after 1995 before year 2002 Late adopters: Companies who employed global services sourcing after 2002 Active fence sitters: Companies who have not yet employed global services sources but are actively looking into this space We broke the questionnaire into five sections:
Company Specifics Cost Quality metrics Outsource Process Management Country competitive Index Satisfaction Level
Each category of company filled in the relevant portion of the survey. In terms of employee strength the breakdown looked like this:
# of employees
% of survey participants
< 1000 22% 1001-5000 28%
5001-10,000 9% 10,001-20,000 9% 20,001-50,000 16% 50,001-75,000 6%
75,000+ 9% The nature of industries included: Automotive, Banking, Business Services, Computer Services, Financial Markets, Government, Healthcare, Insurance, Mass Consumer Products, HR and Securities, Business Process Outsourcing, Retail, Direct marketing. In terms of the people that we spoke to at each of these companies, their involvement with the companies’ outsourcing decision was as follows:
Review 24% Approve 44%
Recommend 27% Manage Post Contract 5%
22
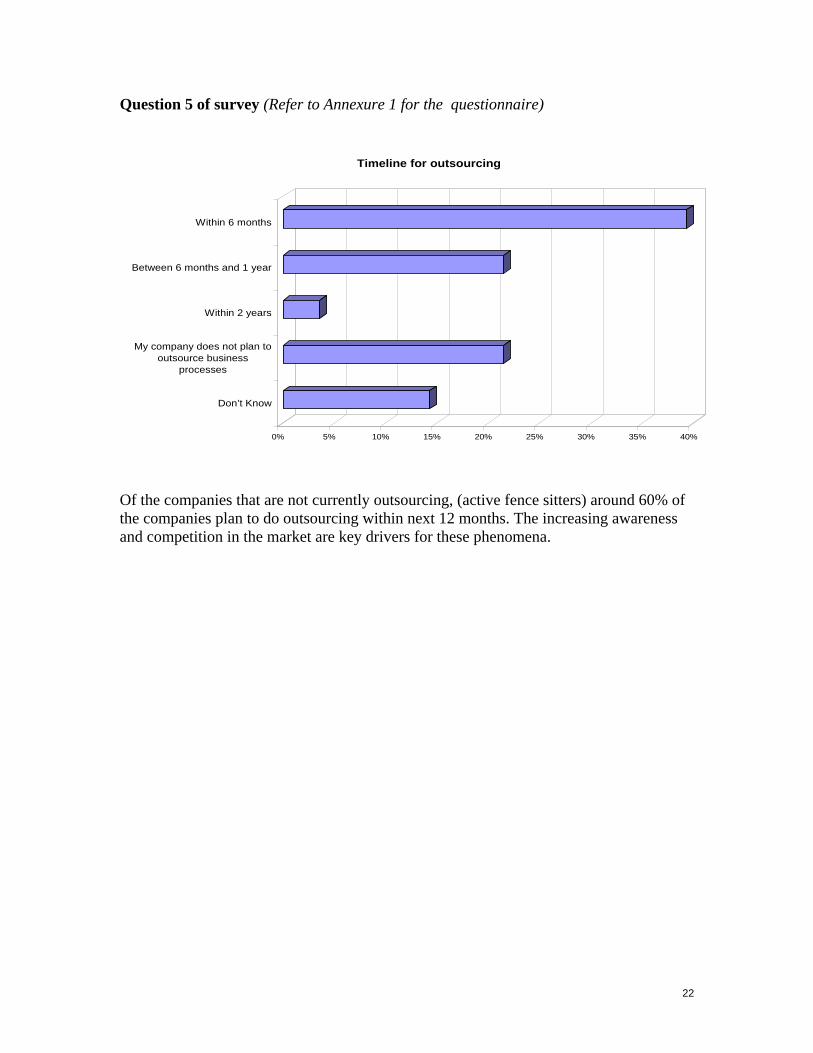
Question 5 of survey (Refer to Annexure 1 for the questionnaire)
0% 5% 10% 15% 20% 25% 30% 35% 40%
Don’t Know
My company does not plan tooutsource business
processes
Within 2 years
Between 6 months and 1 year
Within 6 months
Timeline for outsourcing
Of the companies that are not currently outsourcing, (active fence sitters) around 60% of the companies plan to do outsourcing within next 12 months. The increasing awareness and competition in the market are key drivers for these phenomena.
23
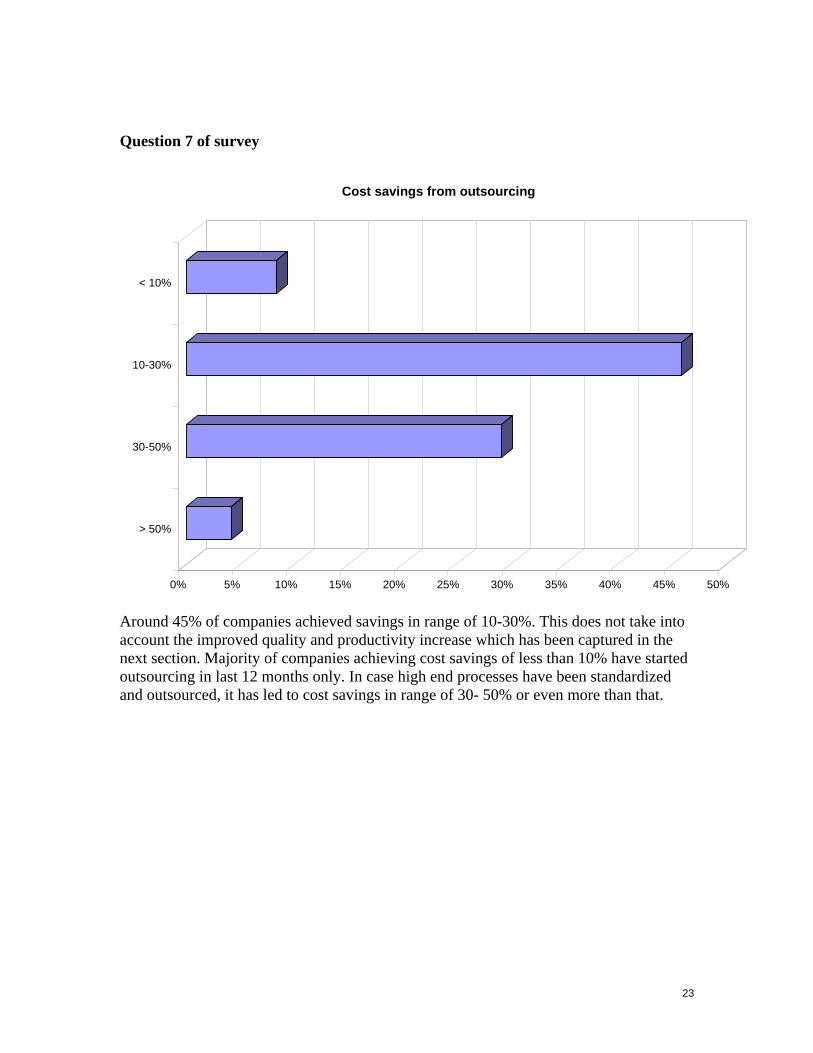
Question 7 of survey
0% 5% 10% 15% 20% 25% 30% 35% 40% 45% 50%
> 50%
30-50%
10-30%
< 10%
Cost savings from outsourcing
Around 45% of companies achieved savings in range of 10-30%. This does not take into account the improved quality and productivity increase which has been captured in the next section. Majority of companies achieving cost savings of less than 10% have started outsourcing in last 12 months only. In case high end processes have been standardized and outsourced, it has led to cost savings in range of 30- 50% or even more than that.
24
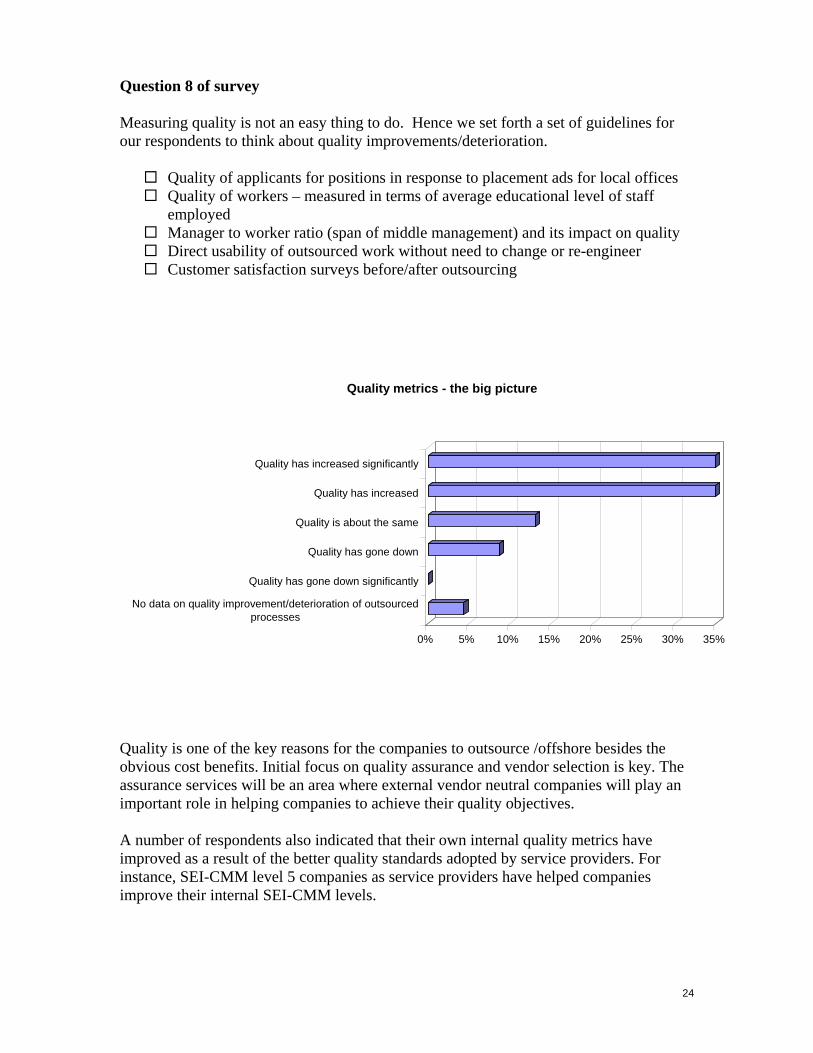
Question 8 of survey Measuring quality is not an easy thing to do. Hence we set forth a set of guidelines for our respondents to think about quality improvements/deterioration.
Quality of applicants for positions in response to placement ads for local offices Quality of workers – measured in terms of average educational level of staff
employed Manager to worker ratio (span of middle management) and its impact on quality Direct usability of outsourced work without need to change or re-engineer Customer satisfaction surveys before/after outsourcing
0% 5% 10% 15% 20% 25% 30% 35%
No data on quality improvement/deterioration of outsourcedprocesses
Quality has gone down significantly
Quality has gone down
Quality is about the same
Quality has increased
Quality has increased significantly
Quality metrics - the big picture
Quality is one of the key reasons for the companies to outsource /offshore besides the obvious cost benefits. Initial focus on quality assurance and vendor selection is key. The assurance services will be an area where external vendor neutral companies will play an important role in helping companies to achieve their quality objectives. A number of respondents also indicated that their own internal quality metrics have improved as a result of the better quality standards adopted by service providers. For instance, SEI-CMM level 5 companies as service providers have helped companies improve their internal SEI-CMM levels.
25
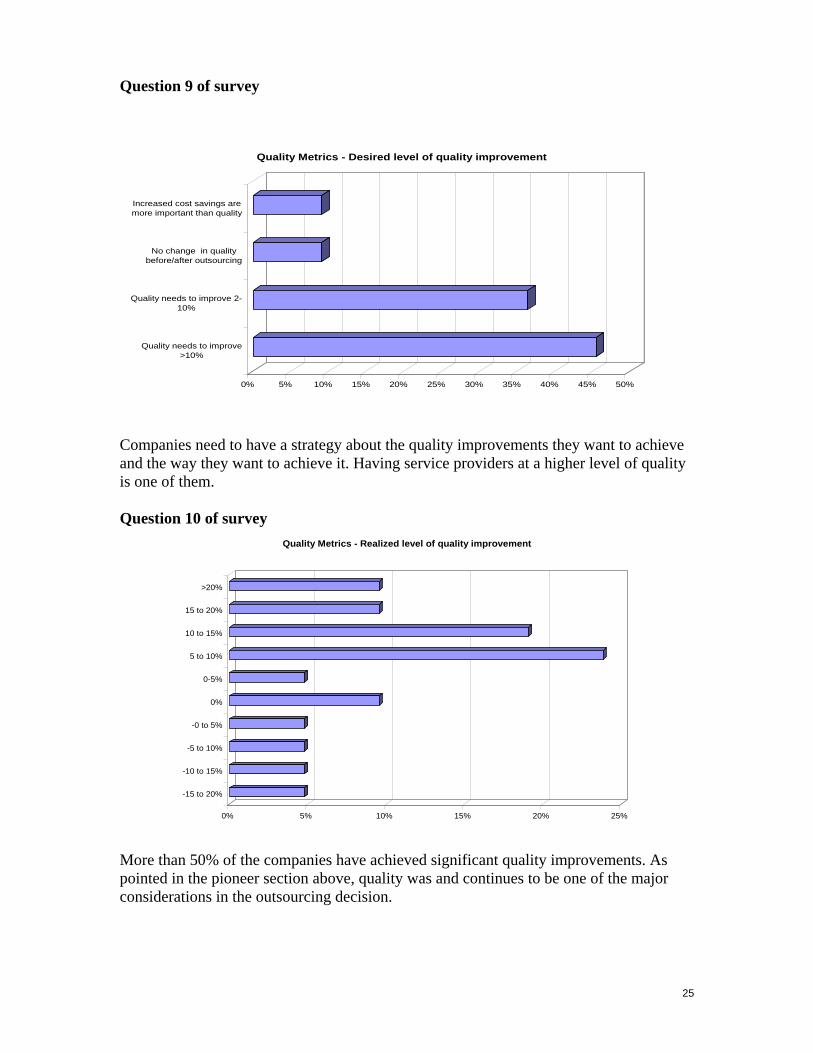
Question 9 of survey
0% 5% 10% 15% 20% 25% 30% 35% 40% 45% 50%
Quality needs to improve>10%
Quality needs to improve 2-10%
No change in qualitybefore/after outsourcing
Increased cost savings aremore important than quality
Quality Metrics - Desired level of quality improvement
Companies need to have a strategy about the quality improvements they want to achieve and the way they want to achieve it. Having service providers at a higher level of quality is one of them. Question 10 of survey
0% 5% 10% 15% 20% 25%
-15 to 20%
-10 to 15%
-5 to 10%
-0 to 5%
0%
0-5%
5 to 10%
10 to 15%
15 to 20%
>20%
Quality Metrics - Realized level of quality improvement
More than 50% of the companies have achieved significant quality improvements. As pointed in the pioneer section above, quality was and continues to be one of the major considerations in the outsourcing decision.
26
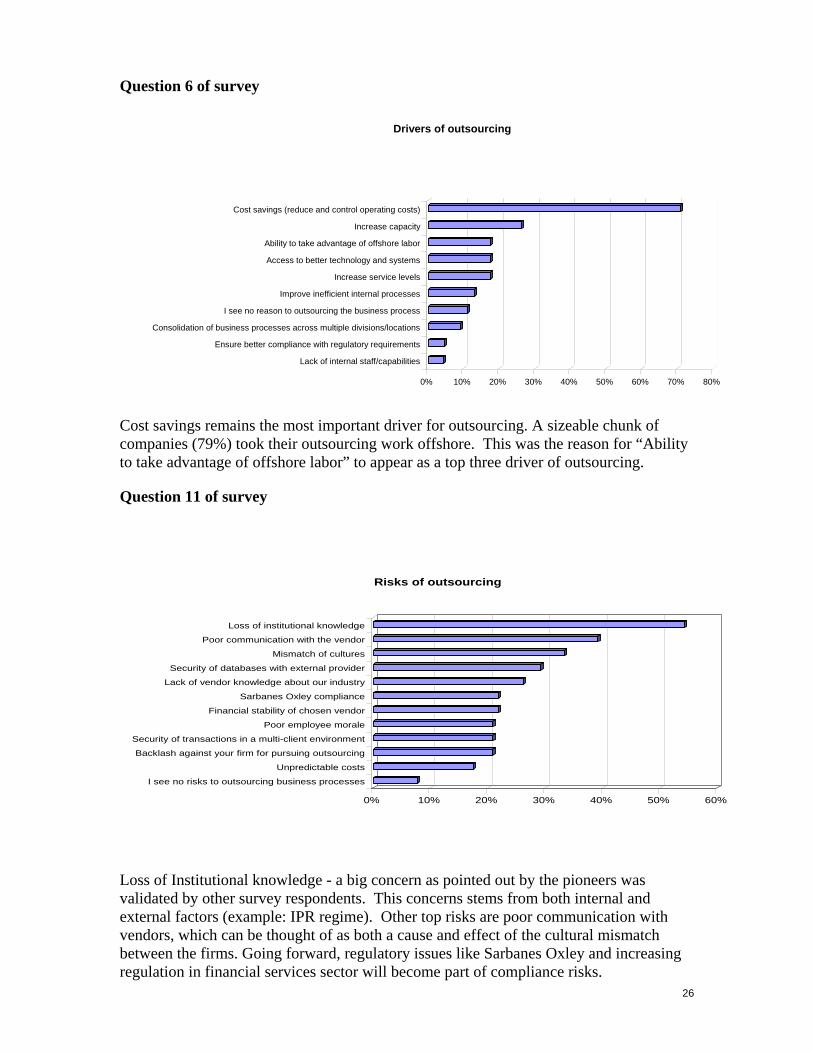
Question 6 of survey
Cost savings remains the most important driver for outsourcing. A sizeable chunk of companies (79%) took their outsourcing work offshore. This was the reason for “Ability to take advantage of offshore labor” to appear as a top three driver of outsourcing.
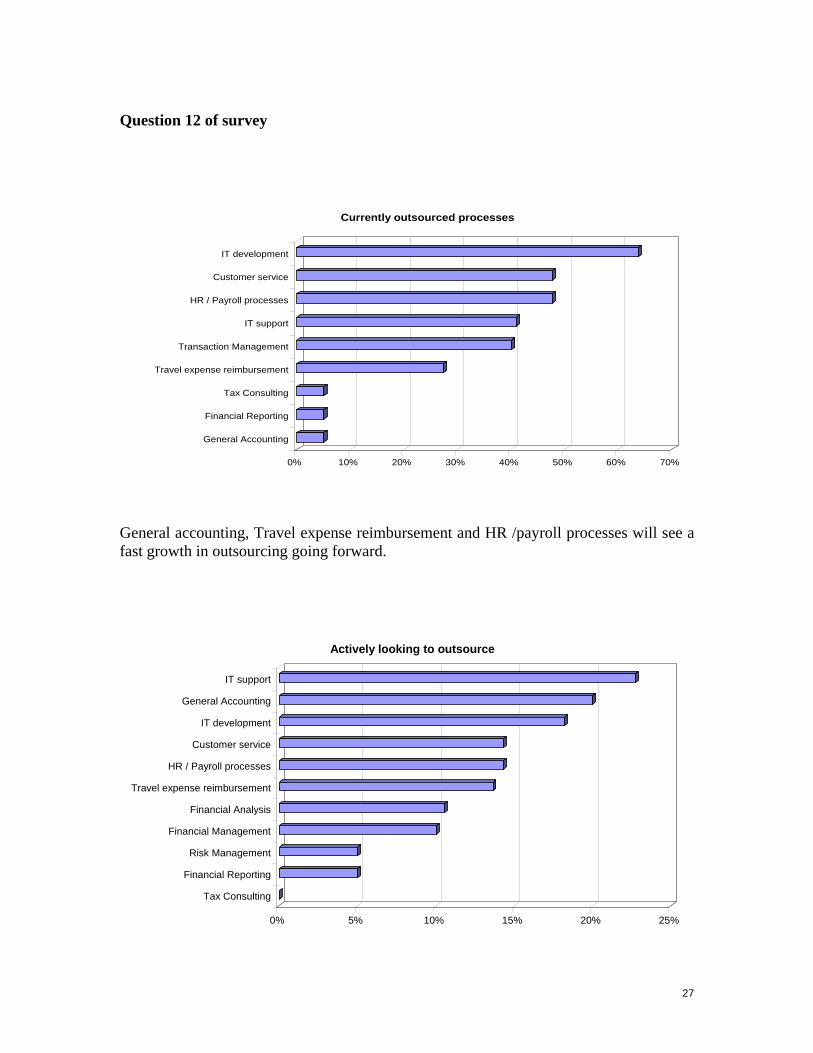
Question 11 of survey
0% 10% 20% 30% 40% 50% 60%
I see no risks to outsourcing business processes
Unpredictable costs
Backlash against your firm for pursuing outsourcing
Security of transactions in a multi-client environment
Poor employee morale
Financial stability of chosen vendor
Sarbanes Oxley compliance
Lack of vendor knowledge about our industry
Security of databases with external provider
Mismatch of cultures
Poor communication with the vendor
Loss of institutional knowledge
Risks of outsourcing
Loss of Institutional knowledge - a big concern as pointed out by the pioneers was validated by other survey respondents. This concerns stems from both internal and external factors (example: IPR regime). Other top risks are poor communication with vendors, which can be thought of as both a cause and effect of the cultural mismatch between the firms. Going forward, regulatory issues like Sarbanes Oxley and increasing regulation in financial services sector will become part of compliance risks.
0% 10% 20% 30% 40% 50% 60% 70% 80%
Lack of internal staff/capabilities
Ensure better compliance with regulatory requirements
Consolidation of business processes across multiple divisions/locations
I see no reason to outsourcing the business process
Improve inefficient internal processes
Increase service levels
Access to better technology and systems
Ability to take advantage of offshore labor
Increase capacity
Cost savings (reduce and control operating costs)
Drivers of outsourcing
27
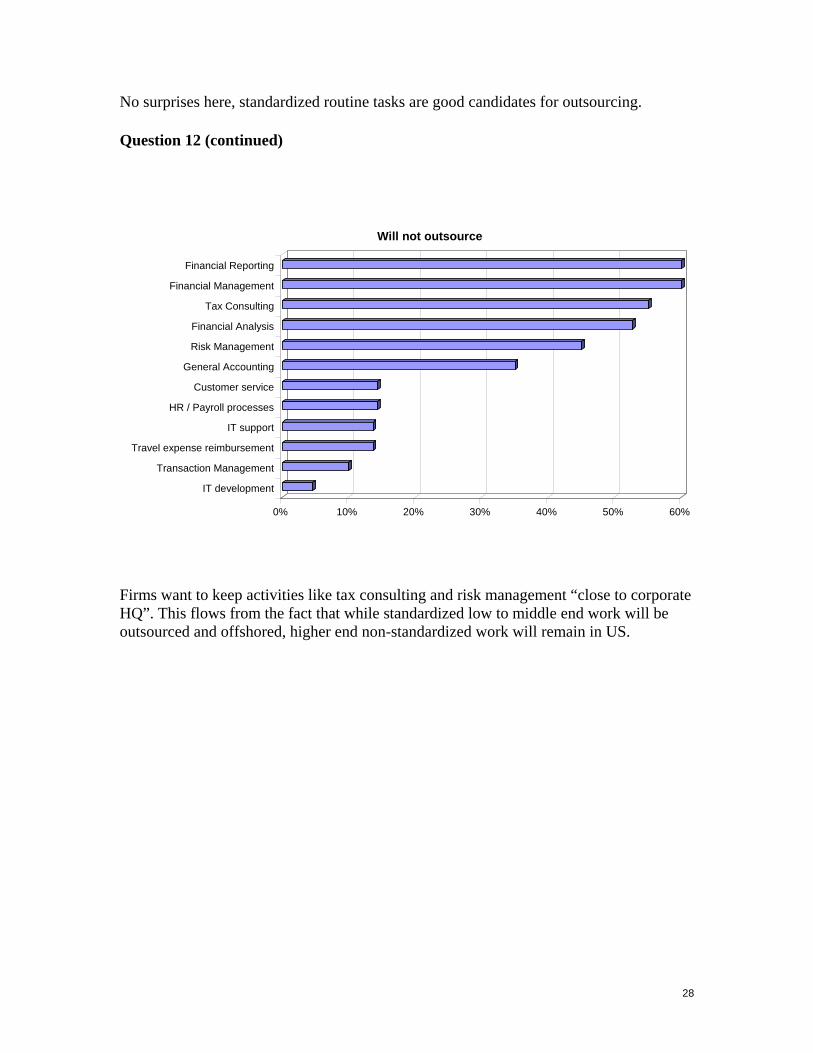
Question 12 of survey
General accounting, Travel expense reimbursement and HR /payroll processes will see a fast growth in outsourcing going forward.
0% 5% 10% 15% 20% 25%
Tax Consulting
Financial Reporting
Risk Management
Financial Management
Financial Analysis
Travel expense reimbursement
HR / Payroll processes
Customer service
IT development
General Accounting
IT support
Actively looking to outsource
0% 10% 20% 30% 40% 50% 60% 70%
General Accounting
Financial Reporting
Tax Consulting
Travel expense reimbursement
Transaction Management
IT support
HR / Payroll processes
Customer service
IT development
Currently outsourced processes
28
No surprises here, standardized routine tasks are good candidates for outsourcing.
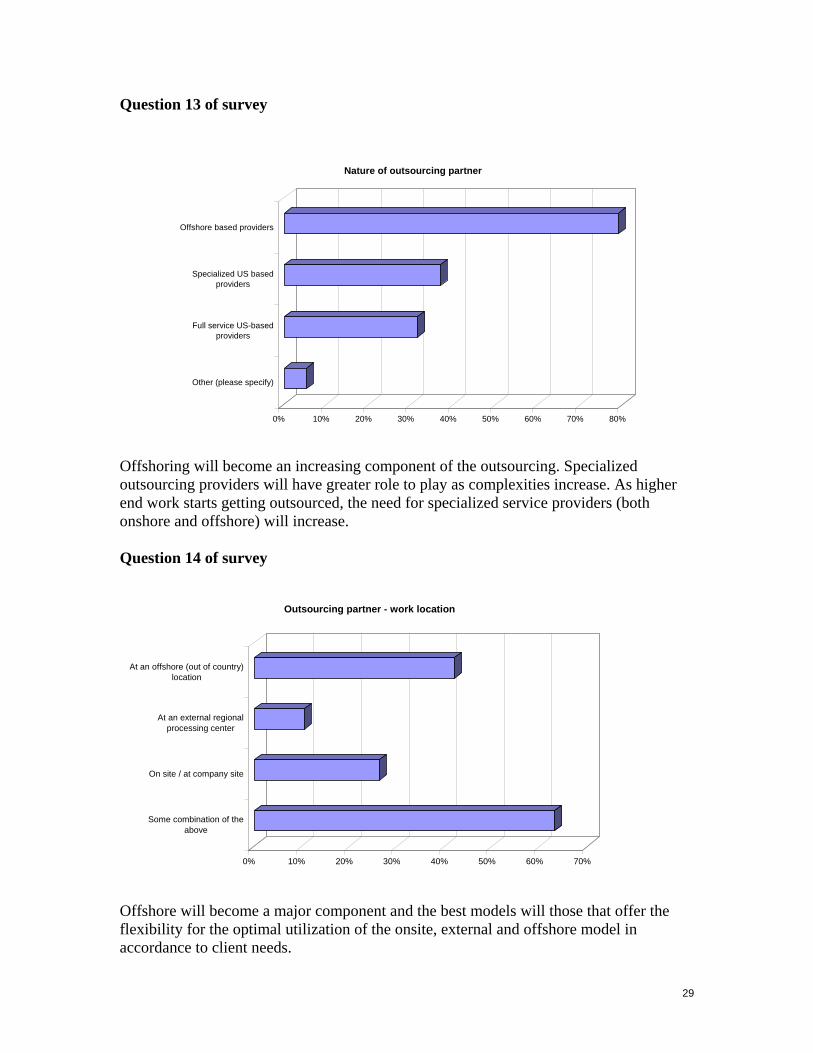
Question 12 (continued)
0% 10% 20% 30% 40% 50% 60%
IT development
Transaction Management
Travel expense reimbursement
IT support
HR / Payroll processes
Customer service
General Accounting
Risk Management
Financial Analysis
Tax Consulting
Financial Management
Financial Reporting
Will not outsource
Firms want to keep activities like tax consulting and risk management “close to corporate HQ”. This flows from the fact that while standardized low to middle end work will be outsourced and offshored, higher end non-standardized work will remain in US.
29
Question 13 of survey
0% 10% 20% 30% 40% 50% 60% 70% 80%
Other (please specify)
Full service US-basedproviders
Specialized US basedproviders
Offshore based providers
Nature of outsourcing partner
Offshoring will become an increasing component of the outsourcing. Specialized outsourcing providers will have greater role to play as complexities increase. As higher end work starts getting outsourced, the need for specialized service providers (both onshore and offshore) will increase. Question 14 of survey
0% 10% 20% 30% 40% 50% 60% 70%
Some combination of theabove
On site / at company site
At an external regionalprocessing center
At an offshore (out of country)location
Outsourcing partner - work location
Offshore will become a major component and the best models will those that offer the flexibility for the optimal utilization of the onsite, external and offshore model in accordance to client needs.
30
Question 18 of survey
0% 10% 20% 30% 40% 50% 60% 70% 80% 90% 100%
Brazil
Mexico
Singapore
China
Canada
Ireland
Other *
Philippines
India
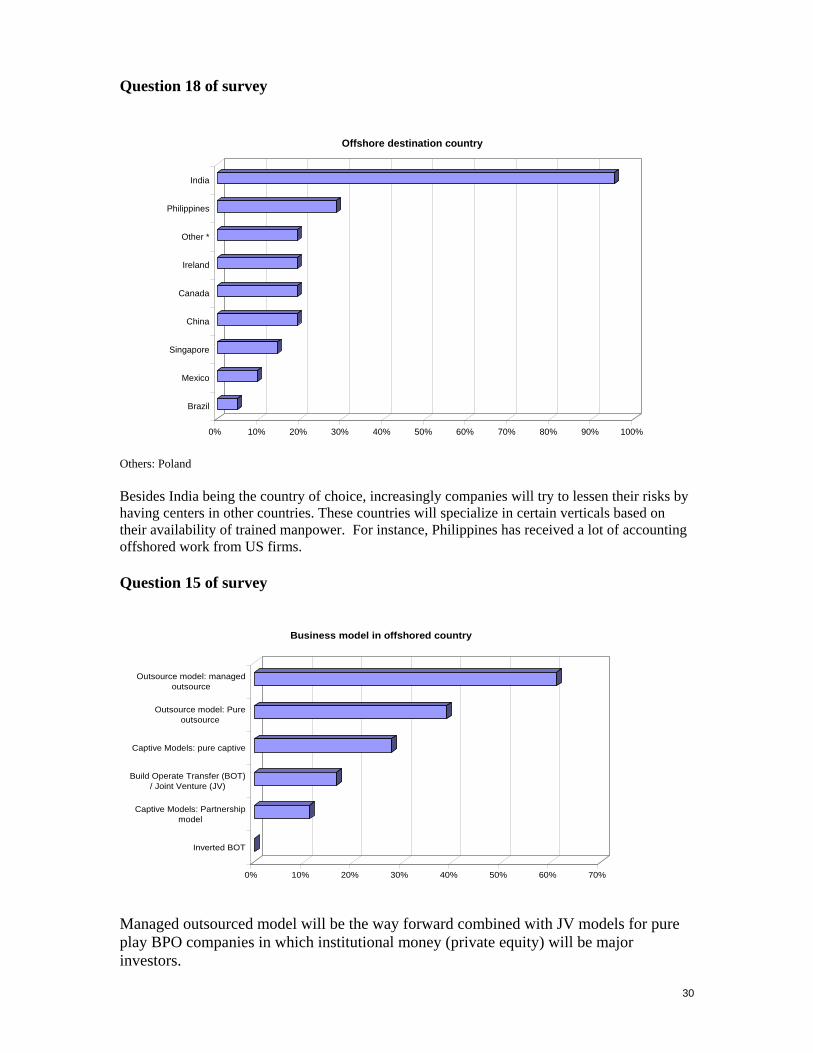
Offshore destination country
Others: Poland Besides India being the country of choice, increasingly companies will try to lessen their risks by having centers in other countries. These countries will specialize in certain verticals based on their availability of trained manpower. For instance, Philippines has received a lot of accounting offshored work from US firms. Question 15 of survey
0% 10% 20% 30% 40% 50% 60% 70%
Inverted BOT
Captive Models: Partnershipmodel
Build Operate Transfer (BOT)/ Joint Venture (JV)
Captive Models: pure captive
Outsource model: Pureoutsource
Outsource model: managedoutsource
Business model in offshored country
Managed outsourced model will be the way forward combined with JV models for pure play BPO companies in which institutional money (private equity) will be major investors.
31
Question 17 of survey
0% 10% 20% 30% 40% 50% 60% 70% 80% 90%
Exit or renegotiation
Negotiation / Agreements
Information gathering
RFP / Provider Selection
Strategy formation
Ongoing Operations
Internal Communications
Transition / Implementation
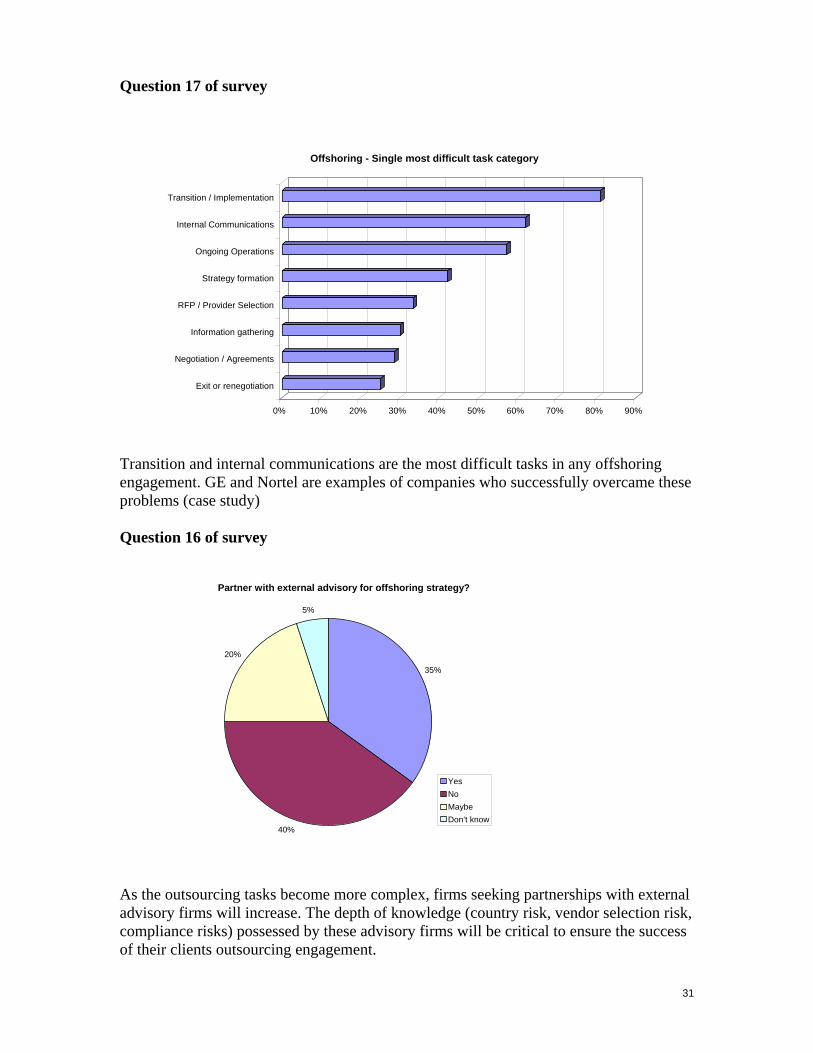
Offshoring - Single most difficult task category
Transition and internal communications are the most difficult tasks in any offshoring engagement. GE and Nortel are examples of companies who successfully overcame these problems (case study) Question 16 of survey
Partner with external advisory for offshoring strategy?
35%
40%
20%
5%
YesNoMaybeDon’t know
As the outsourcing tasks become more complex, firms seeking partnerships with external advisory firms will increase. The depth of knowledge (country risk, vendor selection risk, compliance risks) possessed by these advisory firms will be critical to ensure the success of their clients outsourcing engagement.
32
Question 19 of survey
0% 10% 20% 30% 40% 50% 60%
Physical proximity with vendor country
Reduction in control over process in favor of cost reduction
Feedback from the market
Business friendliness of the recipient country government
Cost factors (telecom tariffs) compared to other destinations
Infrastructure availability and reliability
Skill set availability
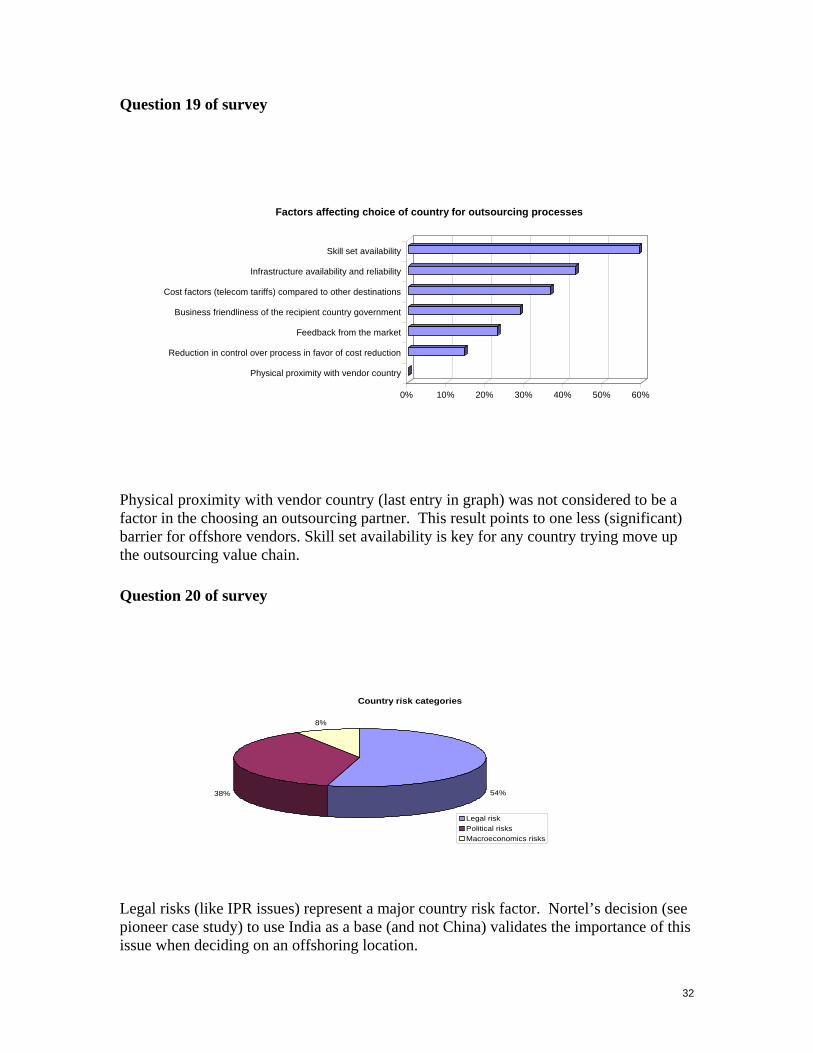
Factors affecting choice of country for outsourcing processes
Physical proximity with vendor country (last entry in graph) was not considered to be a factor in the choosing an outsourcing partner. This result points to one less (significant) barrier for offshore vendors. Skill set availability is key for any country trying move up the outsourcing value chain. Question 20 of survey
Country risk categories
54%38%
8%
Legal riskPolitical risksMacroeconomics risks
Legal risks (like IPR issues) represent a major country risk factor. Nortel’s decision (see pioneer case study) to use India as a base (and not China) validates the importance of this issue when deciding on an offshoring location.
33
Question 21 of survey
0% 10% 20% 30% 40% 50% 60%
Very Unsatisfied
Unsatisfied
Neutral
Satisfied
Very satisfied
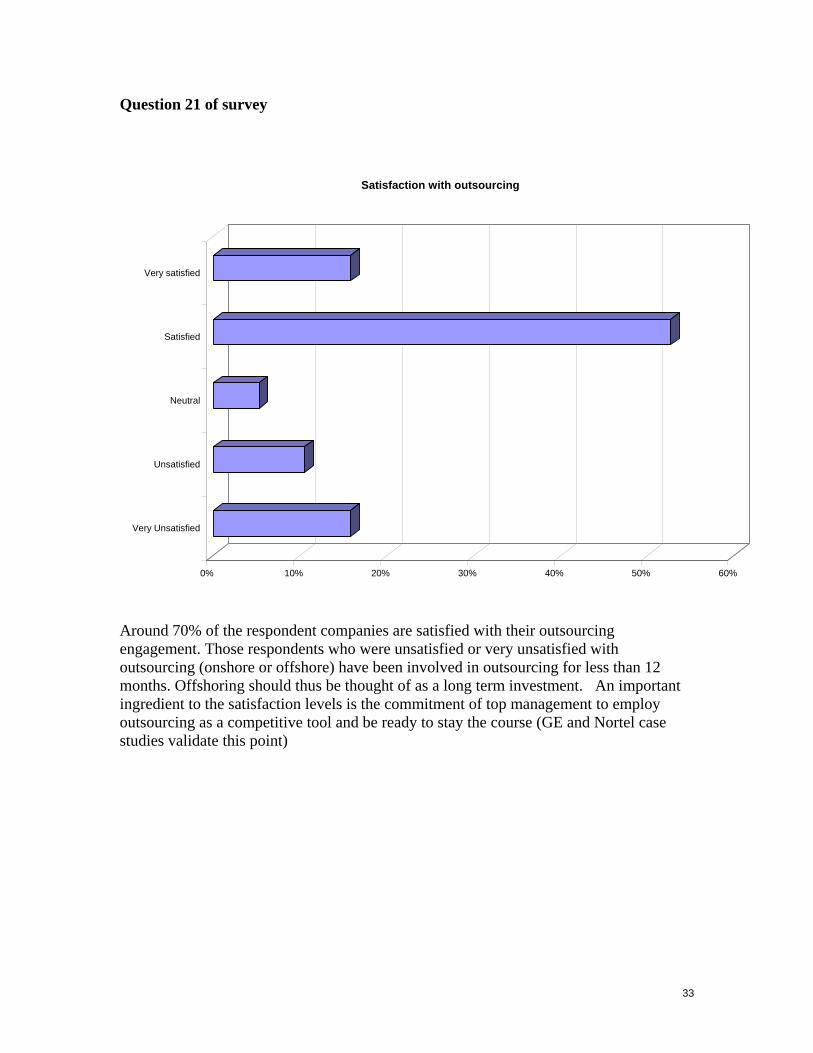
Satisfaction with outsourcing
Around 70% of the respondent companies are satisfied with their outsourcing engagement. Those respondents who were unsatisfied or very unsatisfied with outsourcing (onshore or offshore) have been involved in outsourcing for less than 12 months. Offshoring should thus be thought of as a long term investment. An important ingredient to the satisfaction levels is the commitment of top management to employ outsourcing as a competitive tool and be ready to stay the course (GE and Nortel case studies validate this point)
34
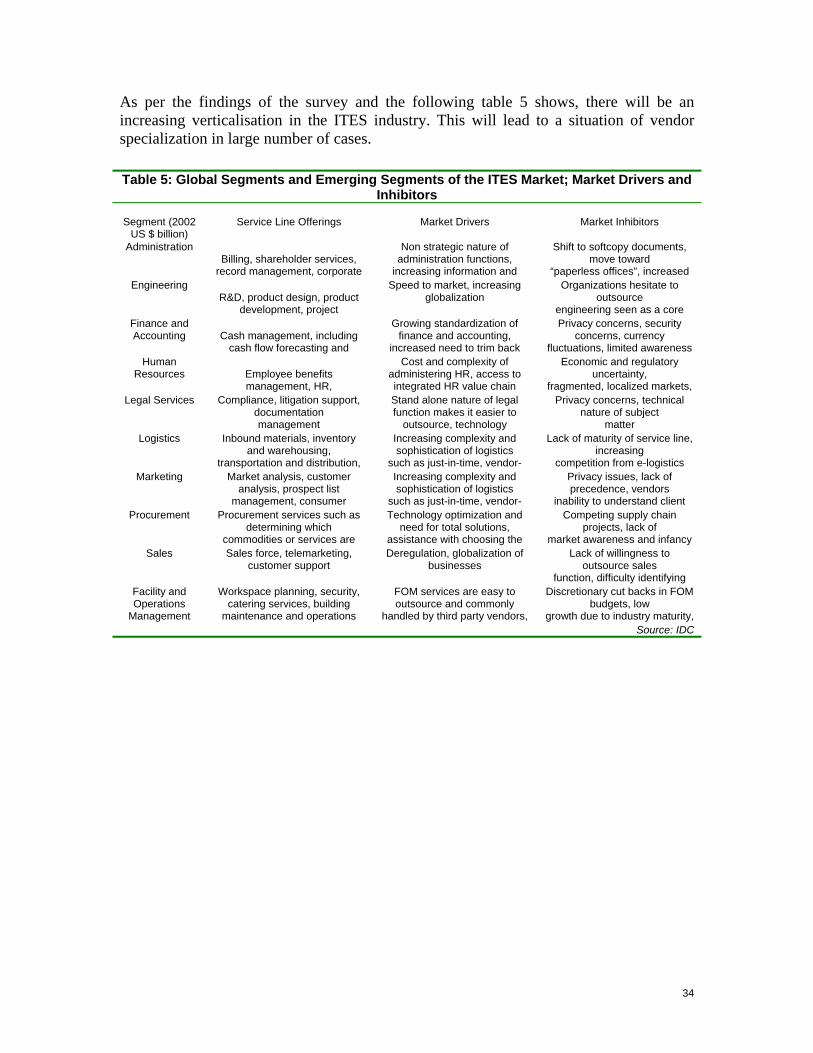
As per the findings of the survey and the following table 5 shows, there will be an increasing verticalisation in the ITES industry. This will lead to a situation of vendor specialization in large number of cases. Table 5: Global Segments and Emerging Segments of the ITES Market; Market Drivers and
Inhibitors
Segment (2002 US $ billion)
Service Line Offerings
Market Drivers
Market Inhibitors
Administration
Billing, shareholder services, record management, corporate
Non strategic nature of administration functions,
increasing information and
Shift to softcopy documents, move toward
“paperless offices”, increased Engineering
R&D, product design, product development, project
Speed to market, increasing globalization
Organizations hesitate to outsource
engineering seen as a core Finance and Accounting
Cash management, including
cash flow forecasting and
Growing standardization of finance and accounting,
increased need to trim back
Privacy concerns, security concerns, currency
fluctuations, limited awareness Human
Resources
Employee benefits management, HR,
Cost and complexity of administering HR, access to integrated HR value chain
Economic and regulatory uncertainty,
fragmented, localized markets, Legal Services
Compliance, litigation support,
documentation management
Stand alone nature of legal function makes it easier to
outsource, technology
Privacy concerns, technical nature of subject
matter Logistics
Inbound materials, inventory
and warehousing, transportation and distribution,
Increasing complexity and sophistication of logistics
such as just-in-time, vendor-
Lack of maturity of service line, increasing
competition from e-logistics Marketing
Market analysis, customer
analysis, prospect list management, consumer
Increasing complexity and sophistication of logistics
such as just-in-time, vendor-
Privacy issues, lack of precedence, vendors
inability to understand client Procurement
Procurement services such as
determining which commodities or services are
Technology optimization and need for total solutions,
assistance with choosing the
Competing supply chain projects, lack of
market awareness and infancy Sales Sales force, telemarketing,
customer support
Deregulation, globalization of businesses
Lack of willingness to outsource sales
function, difficulty identifying Facility and Operations
Management
Workspace planning, security, catering services, building
maintenance and operations
FOM services are easy to outsource and commonly
handled by third party vendors,
Discretionary cut backs in FOM budgets, low
growth due to industry maturity, Source: IDC
35
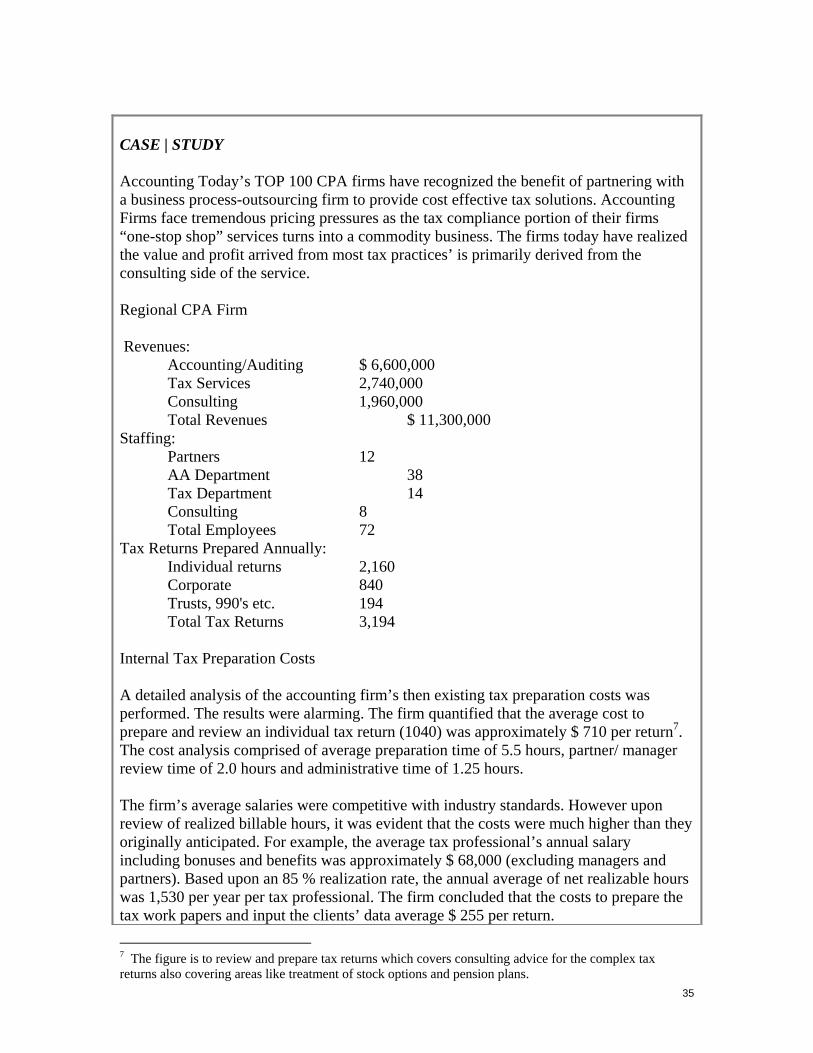
CASE | STUDY Accounting Today’s TOP 100 CPA firms have recognized the benefit of partnering with a business process-outsourcing firm to provide cost effective tax solutions. Accounting Firms face tremendous pricing pressures as the tax compliance portion of their firms “one-stop shop” services turns into a commodity business. The firms today have realized the value and profit arrived from most tax practices’ is primarily derived from the consulting side of the service. Regional CPA Firm Revenues: Accounting/Auditing $ 6,600,000 Tax Services 2,740,000 Consulting 1,960,000 Total Revenues $ 11,300,000 Staffing: Partners 12 AA Department 38 Tax Department 14 Consulting 8 Total Employees 72 Tax Returns Prepared Annually: Individual returns 2,160 Corporate 840 Trusts, 990's etc. 194 Total Tax Returns 3,194 Internal Tax Preparation Costs A detailed analysis of the accounting firm’s then existing tax preparation costs was performed. The results were alarming. The firm quantified that the average cost to prepare and review an individual tax return (1040) was approximately $ 710 per return7. The cost analysis comprised of average preparation time of 5.5 hours, partner/ manager review time of 2.0 hours and administrative time of 1.25 hours. The firm’s average salaries were competitive with industry standards. However upon review of realized billable hours, it was evident that the costs were much higher than they originally anticipated. For example, the average tax professional’s annual salary including bonuses and benefits was approximately $ 68,000 (excluding managers and partners). Based upon an 85 % realization rate, the annual average of net realizable hours was 1,530 per year per tax professional. The firm concluded that the costs to prepare the tax work papers and input the clients’ data average $ 255 per return.
7 The figure is to review and prepare tax returns which covers consulting advice for the complex tax returns also covering areas like treatment of stock options and pension plans.
36
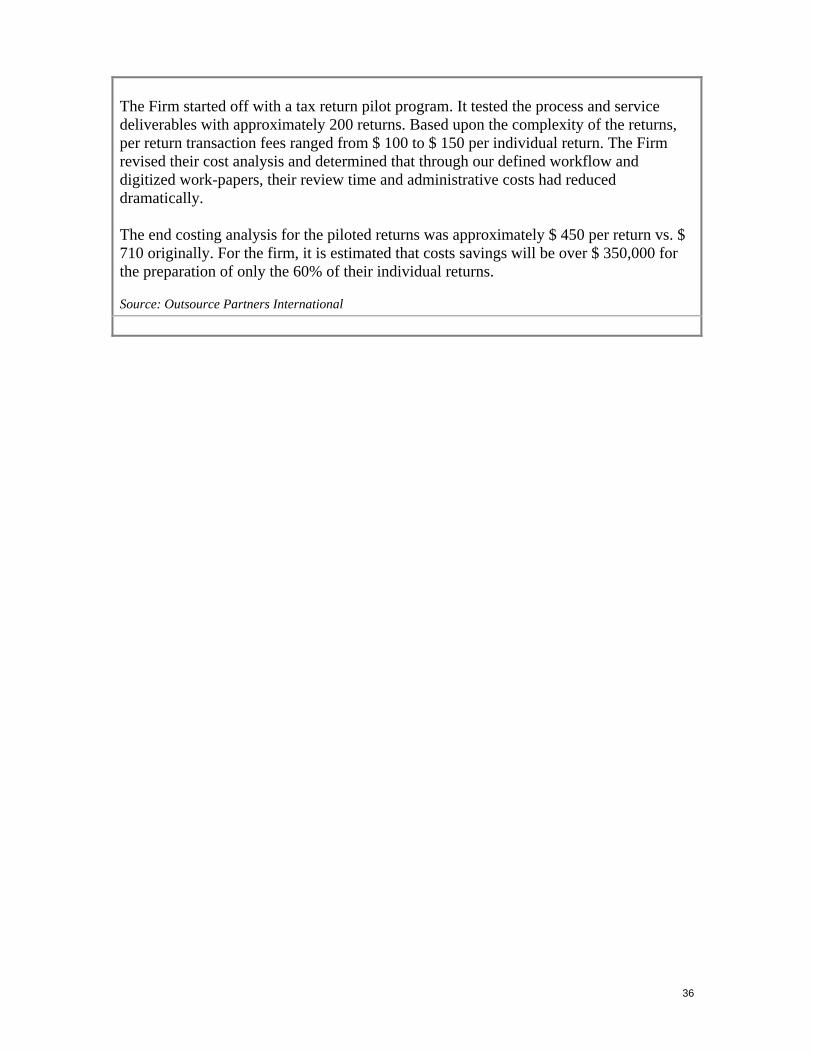
The Firm started off with a tax return pilot program. It tested the process and service deliverables with approximately 200 returns. Based upon the complexity of the returns, per return transaction fees ranged from $ 100 to $ 150 per individual return. The Firm revised their cost analysis and determined that through our defined workflow and digitized work-papers, their review time and administrative costs had reduced dramatically. The end costing analysis for the piloted returns was approximately $ 450 per return vs. $ 710 originally. For the firm, it is estimated that costs savings will be over $ 350,000 for the preparation of only the 60% of their individual returns.
Source: Outsource Partners International
37
Section IV: India – at the heart of GSS According to Bajpai and Radjou (1999) a developing country that aspires to achieve rapid growth and join the global knowledge economy ought to encourage the development of its services sector. This sector has been the engine of growth and employment in developed economies. In the post World-War II period, it has led GDP growth in these economies, more than doubling its share of GDP in the last 5 decades and substantially increasing its share of employment. In the U.S., which leads the global IT revolution, services contribute to almost 80% of GDP. In Singapore, it accounts for 72% of GDP. In Ireland, the second largest software exporter in the world, the service industries employ 65% of the working population. Paradoxically, a key contributor to the 'servitization' of the world economy has been the non-services sector. Companies engaged in every type of commercial activity, be it in agriculture, manufacturing, finance or government- rely on the competitive edge that services firms offer to be integral to their business success. This often is not apparent until you look in the annual reports of MNCs. For instance, unlike what its name may suggest, General Electric today derives most of its income not by selling electrical appliances, but financial services. Its financial arm, GE Capital, is today one of the world’s leading financial service company with assets worth over US$300 billion. At General Motors, #1 in Fortune 500, the auto financing business (GMAC) brings home more revenue than actual car sales! From an economic development perspective, there are many compelling reasons for emerging economies to develop their services sector. To begin with, expanding this sector helps create national wealth: a positive correlation exists between high GDP per capita and the intensity of services activity in the economy, mostly because compensation levels in this sector normally surpass those in agriculture and industry. Moreover, in economies with a strong emphasis on services, people tend to climb the "value chain ladder" much more rapidly. Finally, since services businesses are typically skill -and not investment- intensive, they are ideal sources of growth for countries with scarce capital and a large, qualified workforce. India, which possesses the world's second largest pool of scientific manpower, stands much to gain by developing its service industries. Kapur and Ramamurti (2001) present an evolutionary overview of India’s software industry8. India’s software industry grew out of the pioneering efforts of companies like Tata Consultancy Services, in the aftermath of IBM’s departure from India in 1977 over policy differences with the government. These firms undertook small projects overseas for multinational firms, and slowly climbed up the value chain as their reputations were established.3 Although low-end work, such as maintenance of legacy systems or projects associated with the millennium bug (Y2K) and euro conversion accounted for about 20 percent of export revenues in 2000, the Indian industry has moved up the technology ladder over time. One indicator of that shift is the fact that more than half of the software development centers in the world with Carnegie Mellon University’s CMM Level-5 rating are located in India. The first company in the world to obtain this distinction was an Indian company, Wipro, and companies like Citicorp, GE, Honeywell, IBM, and
8 India’s emerging competitiveness in tradable services, Academy of management, May 2001.
38
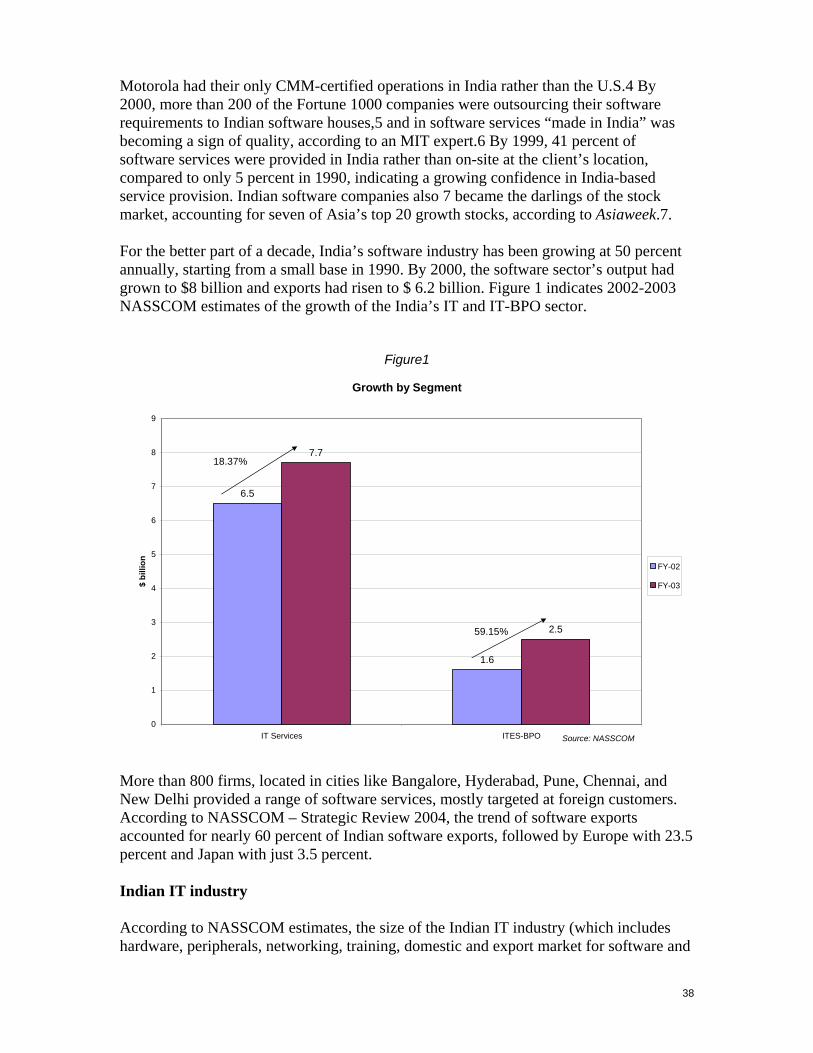
Motorola had their only CMM-certified operations in India rather than the U.S.4 By 2000, more than 200 of the Fortune 1000 companies were outsourcing their software requirements to Indian software houses,5 and in software services “made in India” was becoming a sign of quality, according to an MIT expert.6 By 1999, 41 percent of software services were provided in India rather than on-site at the client’s location, compared to only 5 percent in 1990, indicating a growing confidence in India-based service provision. Indian software companies also 7 became the darlings of the stock market, accounting for seven of Asia’s top 20 growth stocks, according to Asiaweek.7. For the better part of a decade, India’s software industry has been growing at 50 percent annually, starting from a small base in 1990. By 2000, the software sector’s output had grown to $8 billion and exports had risen to $ 6.2 billion. Figure 1 indicates 2002-2003 NASSCOM estimates of the growth of the India’s IT and IT-BPO sector.
Figure1
Growth by Segment
6.5
1.6
7.7
2.5
0
1
2
3
4
5
6
7
8
9
IT Services ITES-BPO
$ bi
llion FY-02
FY-03
18.37%
59.15%
Source: NASSCOM
More than 800 firms, located in cities like Bangalore, Hyderabad, Pune, Chennai, and New Delhi provided a range of software services, mostly targeted at foreign customers. According to NASSCOM – Strategic Review 2004, the trend of software exports accounted for nearly 60 percent of Indian software exports, followed by Europe with 23.5 percent and Japan with just 3.5 percent. Indian IT industry According to NASSCOM estimates, the size of the Indian IT industry (which includes hardware, peripherals, networking, training, domestic and export market for software and
39
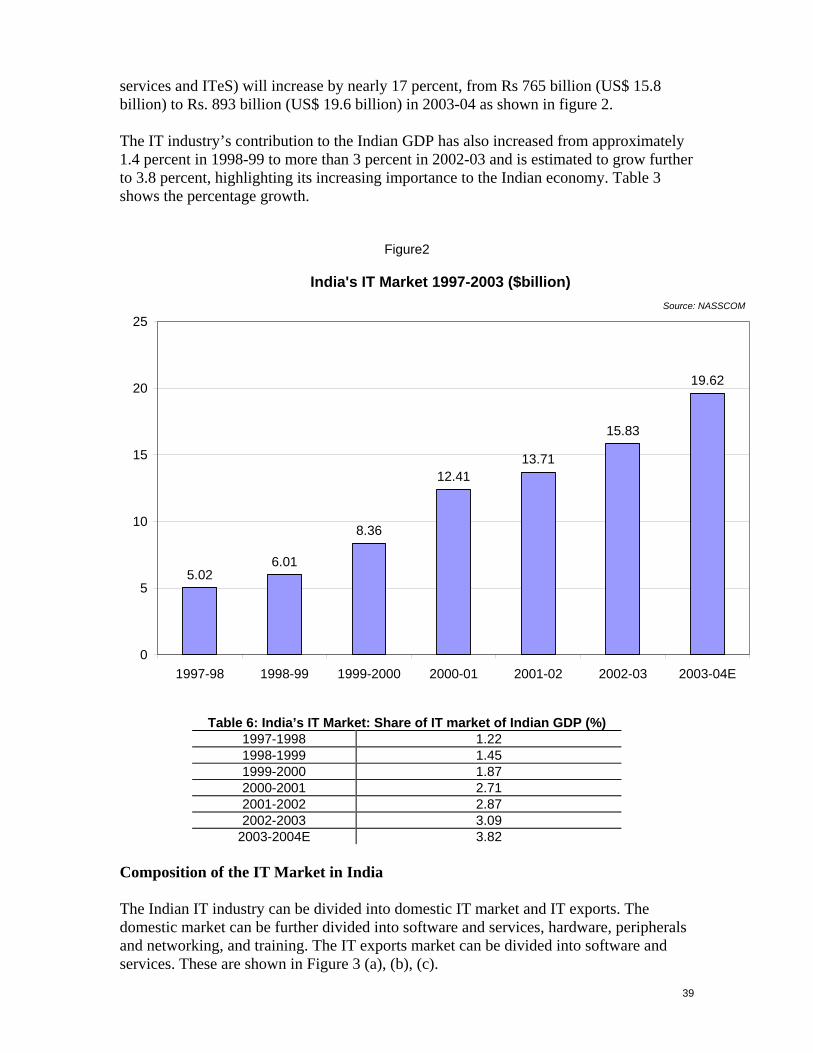
services and ITeS) will increase by nearly 17 percent, from Rs 765 billion (US$ 15.8 billion) to Rs. 893 billion (US$ 19.6 billion) in 2003-04 as shown in figure 2. The IT industry’s contribution to the Indian GDP has also increased from approximately 1.4 percent in 1998-99 to more than 3 percent in 2002-03 and is estimated to grow further to 3.8 percent, highlighting its increasing importance to the Indian economy. Table 3 shows the percentage growth.
Figure2
India's IT Market 1997-2003 ($billion)
5.026.01
8.36
12.4113.71
15.83
19.62
0
5
10
15
20
25
1997-98 1998-99 1999-2000 2000-01 2001-02 2002-03 2003-04E
Source: NASSCOM
Table 6: India’s IT Market: Share of IT market of Indian GDP (%) 1997-1998 1.22 1998-1999 1.45 1999-2000 1.87 2000-2001 2.71 2001-2002 2.87 2002-2003 3.09
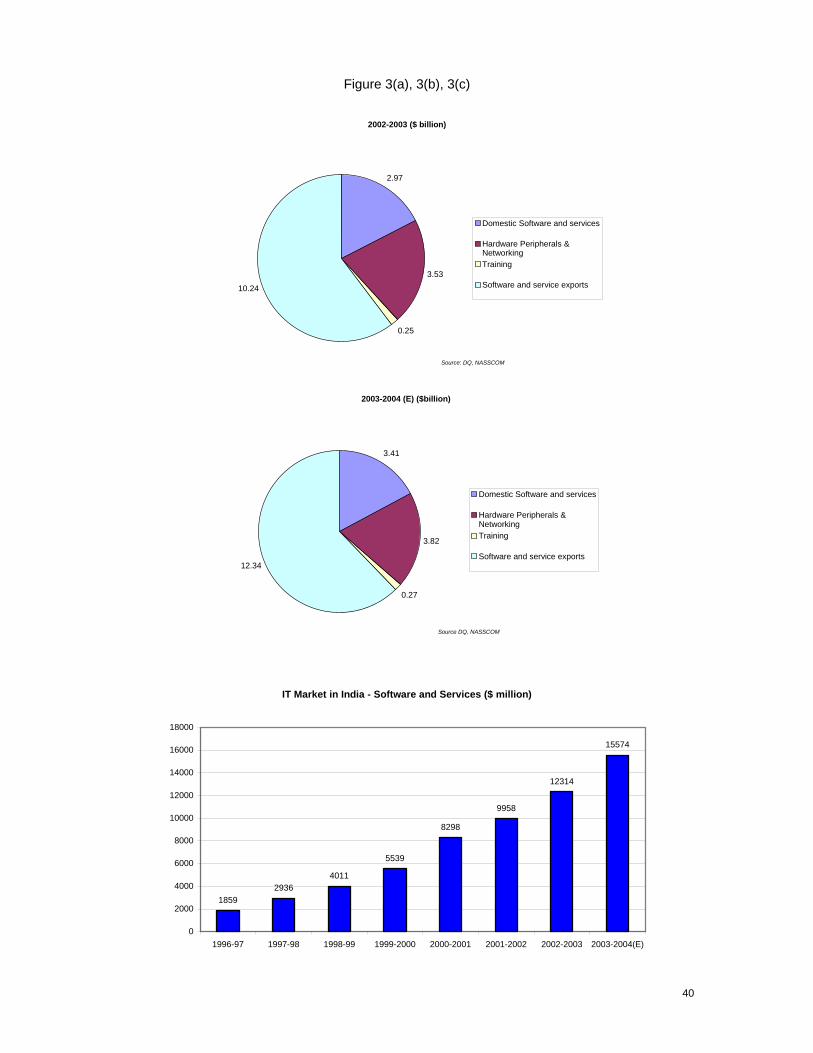
2003-2004E 3.82 Composition of the IT Market in India The Indian IT industry can be divided into domestic IT market and IT exports. The domestic market can be further divided into software and services, hardware, peripherals and networking, and training. The IT exports market can be divided into software and services. These are shown in Figure 3 (a), (b), (c).
40
Figure 3(a), 3(b), 3(c)
2002-2003 ($ billion)
2.97
3.53
0.25
10.24
Domestic Software and services
Hardware Peripherals &NetworkingTraining
Software and service exports
Source: DQ, NASSCOM
2003-2004 (E) ($billion)
3.41
3.82
0.27
12.34
Domestic Software and services
Hardware Peripherals &NetworkingTraining
Software and service exports
Source DQ, NASSCOM
IT Market in India - Software and Services ($ million)
18592936
4011
5539
8298
9958
12314
15574
0
2000
4000
6000
8000
10000
12000
14000
16000
18000
1996-97 1997-98 1998-99 1999-2000 2000-2001 2001-2002 2002-2003 2003-2004(E)
41
Indian Software Exports Growth and Revenues Software and services export continue to be the dominating factor in the overall growth of the Indian IT industry. In 2002-03, Indian software and services export witnessed a healthy growth, with total exports reaching US$ 9.55 billion, an increase of 26 percent over the previous financial year. (Figure 4) This growth is the fastest among the various segments of the IT industry (domestic software and services 23 percent; hardware, peripheral & networking 4.85 percent; IT training (-23) percent). In addition, the contribution of software and services exports to the total IT industry increased from 57 percent in 2001-02 to approximately 60 percent in 2002-03. NASSCOM estimates that this segment will continue to show a robust growth and the total value of software and services export will be US$ 12.2 billion in 2003-04, an increase of 28 percent in US$ terms. Software and services exports contribution to India’s total invisible receipts is also continuously increasing, indicating the strength of the software sector as the driver of the overall foreign exchange reserves. While its contribution to overall invisible earnings was less than 18 percent in 1997-98, it increased to 59 percent in 2002-03 and the contribution is expected to go up to 73 percent in 2003-04. (Table 7)
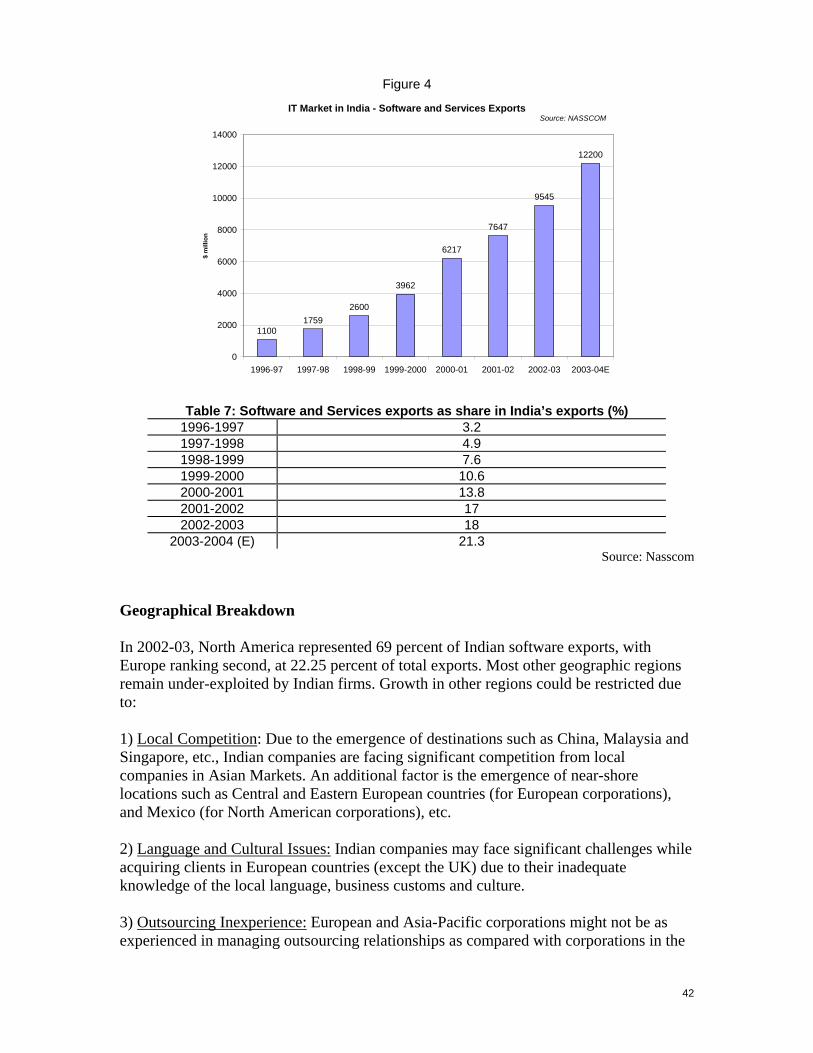
42
Figure 4
IT Market in India - Software and Services Exports
11001759
2600
3962
6217
7647
9545
12200
0
2000
4000
6000
8000
10000
12000
14000
1996-97 1997-98 1998-99 1999-2000 2000-01 2001-02 2002-03 2003-04E
$ m
illio
n
Source: NASSCOM
Table 7: Software and Services exports as share in India’s exports (%) 1996-1997 3.2 1997-1998 4.9 1998-1999 7.6 1999-2000 10.6 2000-2001 13.8 2001-2002 17 2002-2003 18
2003-2004 (E) 21.3 Source: Nasscom
Geographical Breakdown In 2002-03, North America represented 69 percent of Indian software exports, with Europe ranking second, at 22.25 percent of total exports. Most other geographic regions remain under-exploited by Indian firms. Growth in other regions could be restricted due to: 1) Local Competition: Due to the emergence of destinations such as China, Malaysia and Singapore, etc., Indian companies are facing significant competition from local companies in Asian Markets. An additional factor is the emergence of near-shore locations such as Central and Eastern European countries (for European corporations), and Mexico (for North American corporations), etc. 2) Language and Cultural Issues: Indian companies may face significant challenges while acquiring clients in European countries (except the UK) due to their inadequate knowledge of the local language, business customs and culture. 3) Outsourcing Inexperience: European and Asia-Pacific corporations might not be as experienced in managing outsourcing relationships as compared with corporations in the
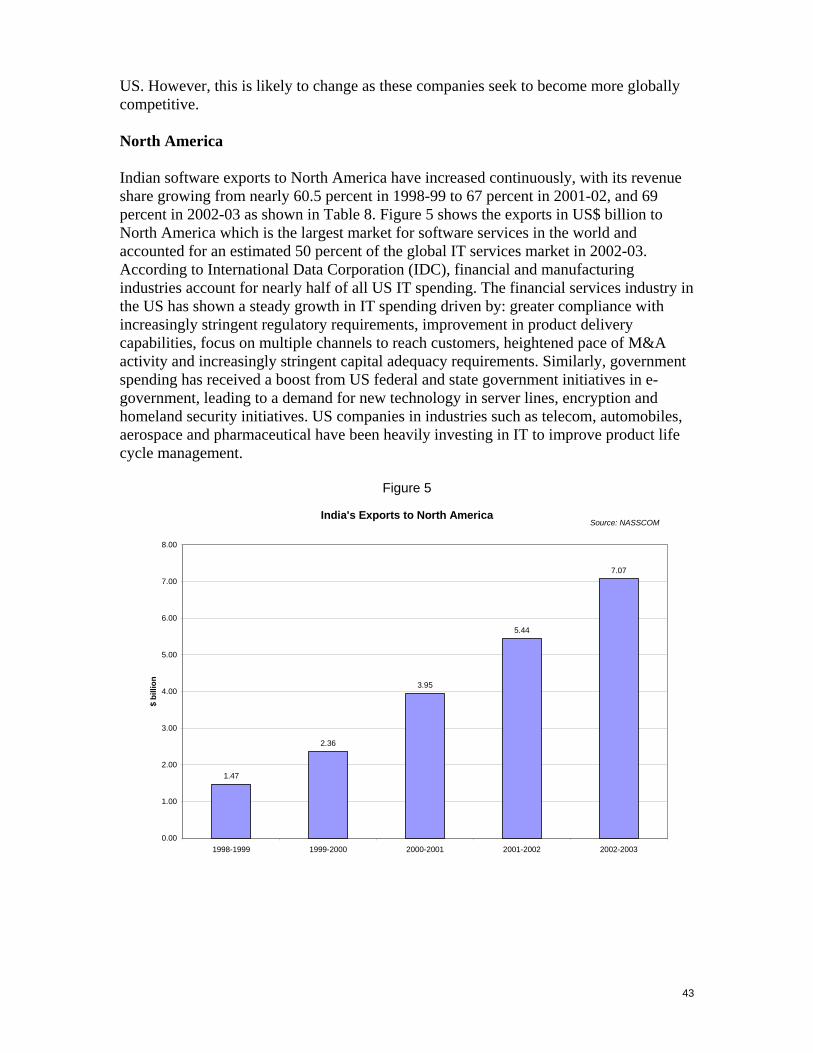
43
US. However, this is likely to change as these companies seek to become more globally competitive. North America Indian software exports to North America have increased continuously, with its revenue share growing from nearly 60.5 percent in 1998-99 to 67 percent in 2001-02, and 69 percent in 2002-03 as shown in Table 8. Figure 5 shows the exports in US$ billion to North America which is the largest market for software services in the world and accounted for an estimated 50 percent of the global IT services market in 2002-03. According to International Data Corporation (IDC), financial and manufacturing industries account for nearly half of all US IT spending. The financial services industry in the US has shown a steady growth in IT spending driven by: greater compliance with increasingly stringent regulatory requirements, improvement in product delivery capabilities, focus on multiple channels to reach customers, heightened pace of M&A activity and increasingly stringent capital adequacy requirements. Similarly, government spending has received a boost from US federal and state government initiatives in e-government, leading to a demand for new technology in server lines, encryption and homeland security initiatives. US companies in industries such as telecom, automobiles, aerospace and pharmaceutical have been heavily investing in IT to improve product life cycle management.
Figure 5
India's Exports to North America
1.47
2.36
3.95
5.44
7.07
0.00
1.00
2.00
3.00
4.00
5.00
6.00
7.00
8.00
1998-1999 1999-2000 2000-2001 2001-2002 2002-2003
$ bi
llion
Source: NASSCOM
44
Table 8: India’s exports to N. America as a % of India’s total ITexport (%) 1998-1999 60.59 1999-2000 62 2000-2001 62.65 2001-2002 67.10 2002-2003 69.05
Europe Europe accounts for approximately 30 percent of the global IT services market. According to IDC, the European IT industry its saw a worst ever decline in 2002 followed by a slight recovery in 2003. IT spending in Western Europe is likely to improve in 2004, and is estimated to grow at 6 percent. Indian software companies have been gradually able to increase the European share in total software exports. Software exports to Europe grew by 18 percent in 2002-03 to Rs.102 billion (US$ 2.1 billion) in 2002-03. The European market poses challenges for Indian firms due to cultural and linguistic differences. Most governments are protectionist and labor laws do not favor outsourcing. In addition, Europe is one of the most quality conscious markets as far as IT services are concerned. Outsourcing is not driven just by cost reduction but also by higher quality requirements. All this makes penetration difficult in the European market. However, with the entry of the 12 new countries (mainly from Eastern Europe) into the EU recently, European companies are increasingly offshoring to near-shore locations in Eastern Europe. With increased experience of offshoring and the small size of talent pool in Eastern Europe, India could potentially emerge as a key player in European offshoring. Already, IT services companies in Europe such as Cap Gemini, Logica, Xansa, Siemens are building large development centers in India. So far, Indian companies were mainly serving the UK market, which accounted for nearly 63 percent of Indian software exports to Europe in 2002-03. The UK, Germany and France together contribute to more than 77 percent of Indian software exports to Europe. Indian companies have increased their efforts to train their employees in various European languages and business culture, especially German and French. In addition, companies are increasingly recruiting local executives in these countries, especially for selling, marketing and other client-facing functions. Indian software companies are increasingly likely to form joint ventures and tie-ups with local European IT services companies for jointly bidding for outsourcing contracts. In order to address the cultural differences, Indian companies are trying to familiarize their existing and prospective clients with the Indian business and social culture. Table 9 gives a percentage Indian IT exports to Europe
Table 9: India’s exports to Europe as a percentage of India’s total IT export (%) 1998-1999 22.94 1999-2000 23.5 2000-2001 23.82 2001-2002 23.66 2002-2003 22.25
45
Asia Pacific
In the Asia Pacific region, Japan, the second largest economy in the world, continues to be the largest market despite its economic turbulence. The second largest market is the Australia-New Zealand region, followed by the China-Hong Kong-Taiwan region and South Korea, then the rest of the Asia-Pacific. IT spending in the Asia Pacific region grew by more than 8 percent in the first half of 2003, as compared with the same period in 2002. The outbreak of SARS did not significantly affect IT spending. Total IT services spending in the region, including Japan, was US$ 101 billion in 2003. The Golden Tax initiatives in China, the new Bangkok Airport, and growth in telecommunications in China and India, were major drivers of IT spending in the region. In Singapore, security was the main driver for IT spending in 2002-03. Chinese IT spending was driven by business-to-employee systems, supply chain management, customer relationship management (CRM), and enterprise resource planning. IT spending in the region is expected to improve in 2004, and the market is expected to grow by 9 percent. The growth is expected primarily from the Chinese and Indian markets, followed by South Korea and Australia. Japan, with the highest spending in the region and the second largest IT spending in the world, is expected to grow slowly. Table 10 gives a breakdown of the Indian IT exports by country while table 11 ranks the companies by their exports. A profile of the top 3 companies is given as below.
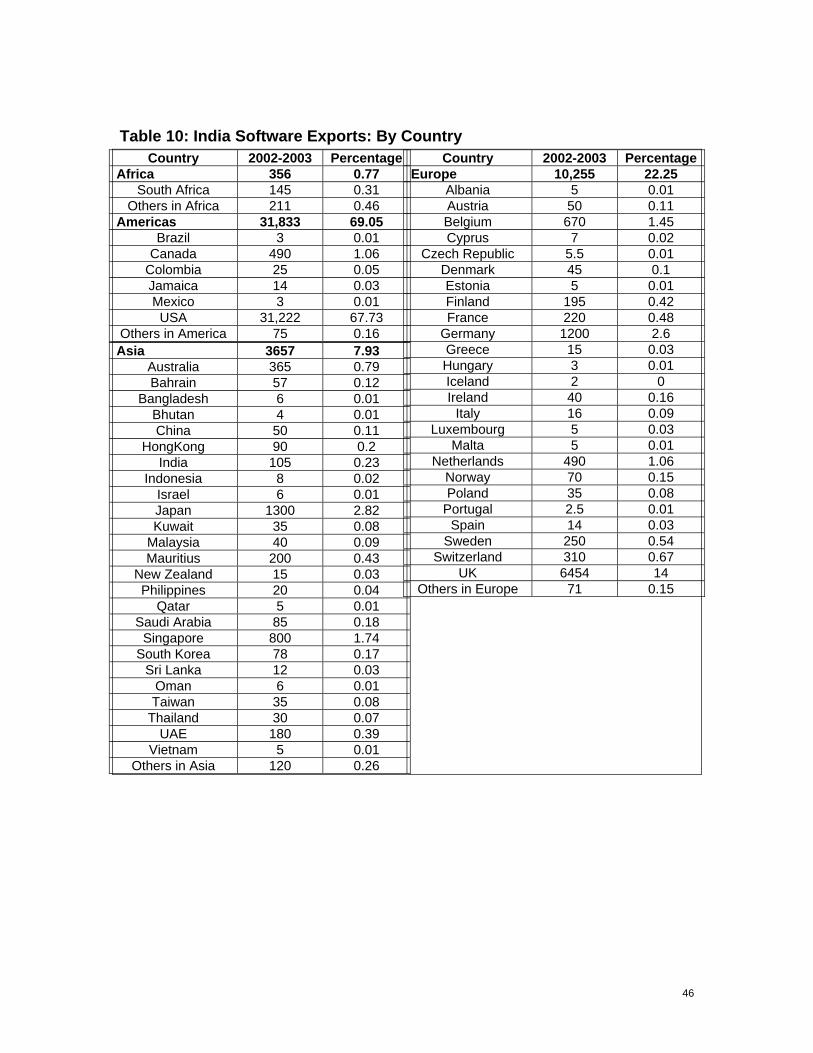
46
Table 10: India Software Exports: By Country Country 2002-2003 Percentage
Africa 356 0.77 South Africa 145 0.31
Others in Africa 211 0.46 Americas 31,833 69.05
Brazil 3 0.01 Canada 490 1.06
Colombia 25 0.05 Jamaica 14 0.03 Mexico 3 0.01
USA 31,222 67.73 Others in America 75 0.16 Asia 3657 7.93
Australia 365 0.79 Bahrain 57 0.12
Bangladesh 6 0.01 Bhutan 4 0.01 China 50 0.11
HongKong 90 0.2 India 105 0.23
Indonesia 8 0.02 Israel 6 0.01 Japan 1300 2.82 Kuwait 35 0.08
Malaysia 40 0.09 Mauritius 200 0.43
New Zealand 15 0.03 Philippines 20 0.04
Qatar 5 0.01 Saudi Arabia 85 0.18
Singapore 800 1.74 South Korea 78 0.17
Sri Lanka 12 0.03 Oman 6 0.01 Taiwan 35 0.08
Thailand 30 0.07 UAE 180 0.39
Vietnam 5 0.01 Others in Asia 120 0.26
Country 2002-2003 Percentage Europe 10,255 22.25
Albania 5 0.01 Austria 50 0.11 Belgium 670 1.45 Cyprus 7 0.02
Czech Republic 5.5 0.01 Denmark 45 0.1 Estonia 5 0.01 Finland 195 0.42 France 220 0.48
Germany 1200 2.6 Greece 15 0.03 Hungary 3 0.01 Iceland 2 0 Ireland 40 0.16
Italy 16 0.09 Luxembourg 5 0.03
Malta 5 0.01 Netherlands 490 1.06
Norway 70 0.15 Poland 35 0.08
Portugal 2.5 0.01 Spain 14 0.03
Sweden 250 0.54 Switzerland 310 0.67
UK 6454 14 Others in Europe 71 0.15
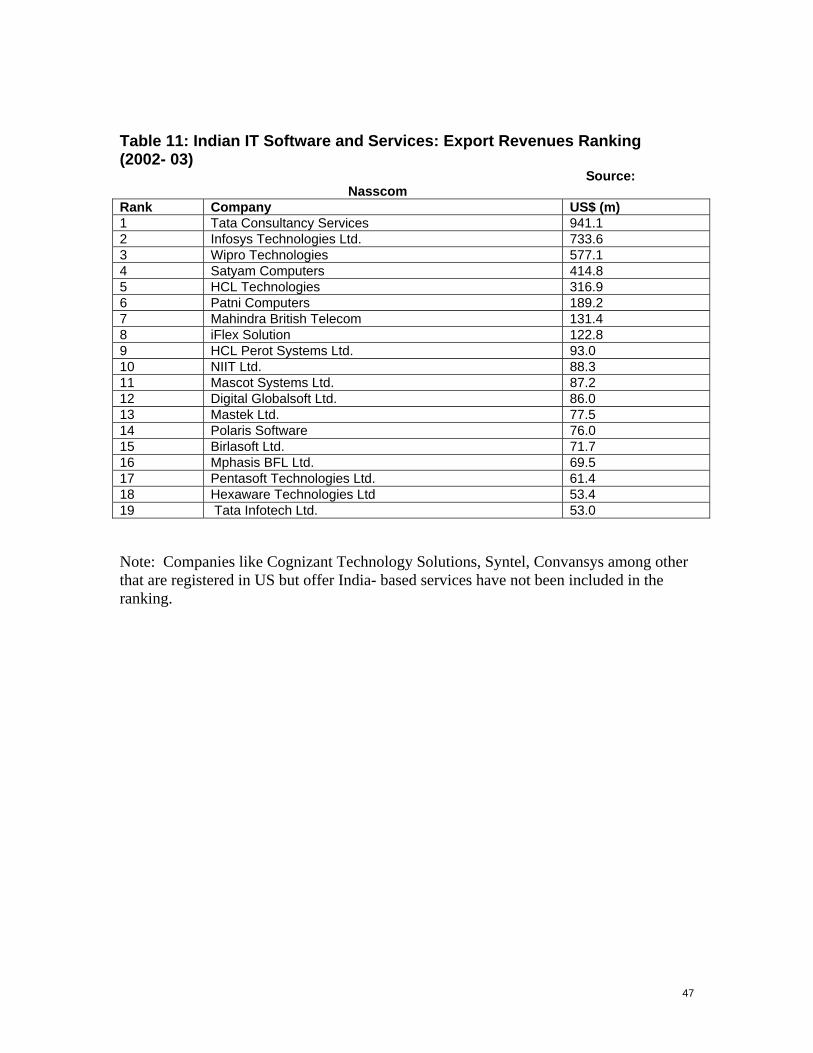
47
Table 11: Indian IT Software and Services: Export Revenues Ranking (2002- 03) Source:
Nasscom Rank Company US$ (m) 1 Tata Consultancy Services 941.1 2 Infosys Technologies Ltd. 733.6 3 Wipro Technologies 577.1 4 Satyam Computers 414.8 5 HCL Technologies 316.9 6 Patni Computers 189.2 7 Mahindra British Telecom 131.4 8 iFlex Solution 122.8 9 HCL Perot Systems Ltd. 93.0 10 NIIT Ltd. 88.3 11 Mascot Systems Ltd. 87.2 12 Digital Globalsoft Ltd. 86.0 13 Mastek Ltd. 77.5 14 Polaris Software 76.0 15 Birlasoft Ltd. 71.7 16 Mphasis BFL Ltd. 69.5 17 Pentasoft Technologies Ltd. 61.4 18 Hexaware Technologies Ltd 53.4 19 Tata Infotech Ltd. 53.0 Note: Companies like Cognizant Technology Solutions, Syntel, Convansys among other that are registered in US but offer India- based services have not been included in the ranking.
48
Tata Consultancy Services (TCS).
Over 28,000 employees worldwide.
Revenues of around US$1.05 billion. (2002-03) Exports:- US$941.1 billion (2002-03):Refer table 11 The different industries where TCS has domain expertise are finance and banking, insurance, telecommunications, transportation, retail, manufacturing, pharmaceuticals and utilities.
Infosys Technologies (NASDAQ: INFY)
Over 25,000 employees worldwide Revenues of around $850 million( 2002-03) Exports: US$733 million( 2002-03) Refer- Table 11 The different industries where Infosys has domain expertise are Energy & Utilities, Engineering Enterprises, Financial Services, Healthcare, Life Sciences, Manufacturing, Retail & Distribution Technology, Telecom, Transportation Wipro Technologies Over 28,500 employees worldwide. Revenue of around US$950 million ( 2002-03)in combined IT businesses Exports: US$577 million (2002-03) Refer Table 11 The different industries where Wipro has domain expertise are Automotive, Avionics, Computing platform, Energy & Utilities, Engineering Enterprises, Financial Services Government, Healthcare Life Sciences Manufacturing Retail & Distribution Technology, Telecom, Transportation
THE INDIAN ITES-BPO INDUSTRY
In 2003-04, according to the National Association of Software and Services Companies (NASSCOM) estimates, the Indian ITES-BPO industry is likely to grow by about 54% to reach US$ 3.6 billion as shown in figure 6. In 2002-2003, the Indian ITES-BPO industry grew by 59.1% to US $2.3 billion. India has maintained its global competitiveness by providing a winning combination of cost quality-scalability versus competing offshore destinations such as the Philippines and China.
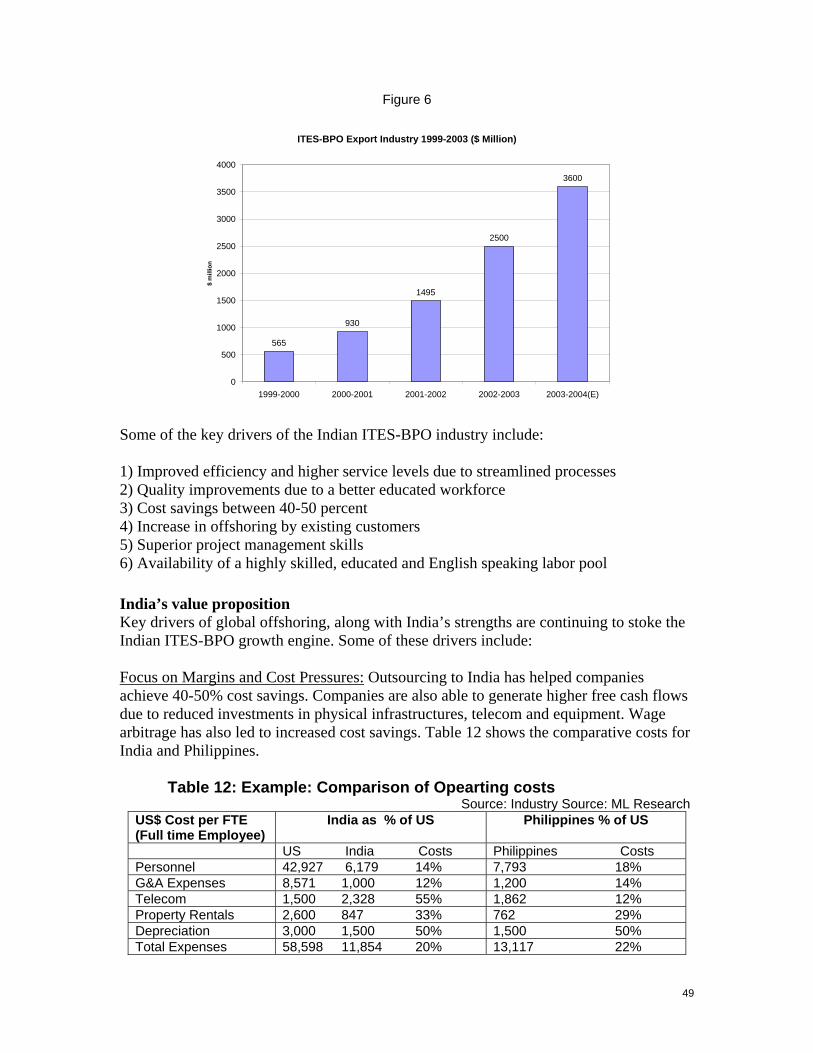
49
Figure 6
ITES-BPO Export Industry 1999-2003 ($ Million)
565
930
1495
2500
3600
0
500
1000
1500
2000
2500
3000
3500
4000
1999-2000 2000-2001 2001-2002 2002-2003 2003-2004(E)
$ m
illio
n
Some of the key drivers of the Indian ITES-BPO industry include: 1) Improved efficiency and higher service levels due to streamlined processes 2) Quality improvements due to a better educated workforce 3) Cost savings between 40-50 percent 4) Increase in offshoring by existing customers 5) Superior project management skills 6) Availability of a highly skilled, educated and English speaking labor pool India’s value proposition Key drivers of global offshoring, along with India’s strengths are continuing to stoke the Indian ITES-BPO growth engine. Some of these drivers include: Focus on Margins and Cost Pressures: Outsourcing to India has helped companies achieve 40-50% cost savings. Companies are also able to generate higher free cash flows due to reduced investments in physical infrastructures, telecom and equipment. Wage arbitrage has also led to increased cost savings. Table 12 shows the comparative costs for India and Philippines.
Table 12: Example: Comparison of Opearting costs Source: Industry Source: ML Research
US$ Cost per FTE (Full time Employee)
India as % of US Philippines % of US
US India Costs Philippines Costs Personnel 42,927 6,179 14% 7,793 18% G&A Expenses 8,571 1,000 12% 1,200 14% Telecom 1,500 2,328 55% 1,862 12% Property Rentals 2,600 847 33% 762 29% Depreciation 3,000 1,500 50% 1,500 50% Total Expenses 58,598 11,854 20% 13,117 22%
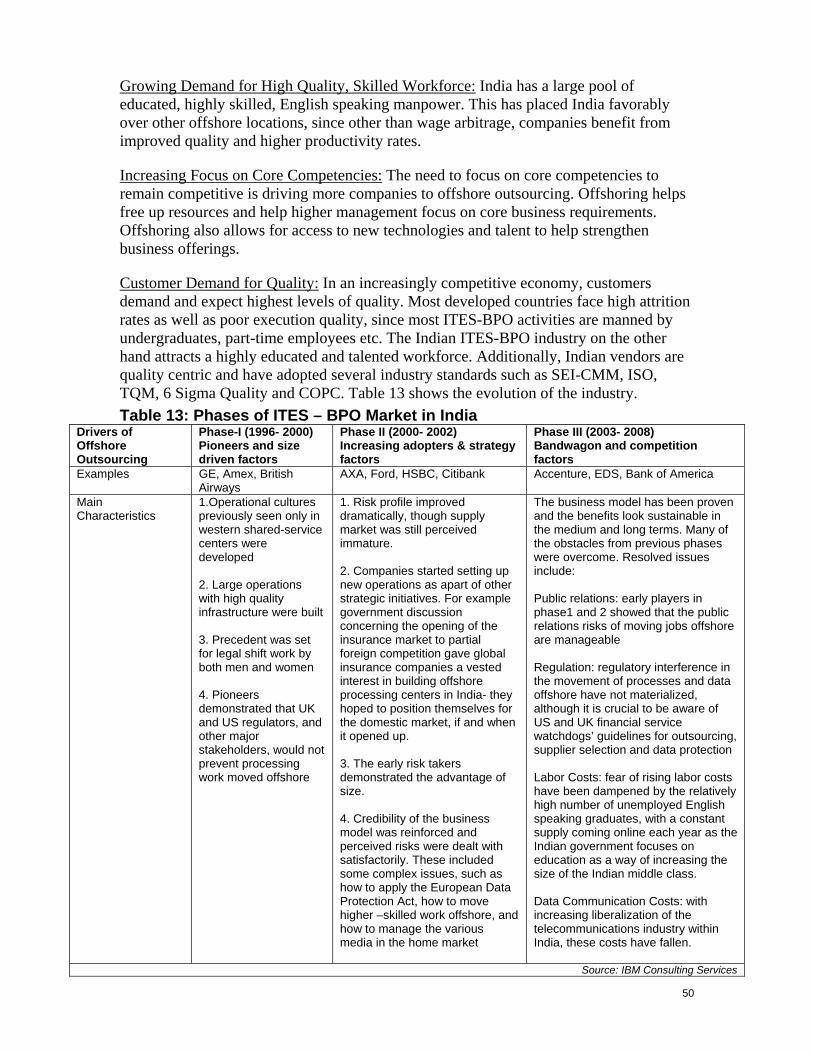
50
Growing Demand for High Quality, Skilled Workforce: India has a large pool of educated, highly skilled, English speaking manpower. This has placed India favorably over other offshore locations, since other than wage arbitrage, companies benefit from improved quality and higher productivity rates.
Increasing Focus on Core Competencies: The need to focus on core competencies to remain competitive is driving more companies to offshore outsourcing. Offshoring helps free up resources and help higher management focus on core business requirements. Offshoring also allows for access to new technologies and talent to help strengthen business offerings.
Customer Demand for Quality: In an increasingly competitive economy, customers demand and expect highest levels of quality. Most developed countries face high attrition rates as well as poor execution quality, since most ITES-BPO activities are manned by undergraduates, part-time employees etc. The Indian ITES-BPO industry on the other hand attracts a highly educated and talented workforce. Additionally, Indian vendors are quality centric and have adopted several industry standards such as SEI-CMM, ISO, TQM, 6 Sigma Quality and COPC. Table 13 shows the evolution of the industry. Table 13: Phases of ITES – BPO Market in India
Drivers of Offshore Outsourcing
Phase-I (1996- 2000) Pioneers and size driven factors
Phase II (2000- 2002) Increasing adopters & strategy factors
Phase III (2003- 2008) Bandwagon and competition factors
Examples GE, Amex, British Airways
AXA, Ford, HSBC, Citibank Accenture, EDS, Bank of America
Main Characteristics
1.Operational cultures previously seen only in western shared-service centers were developed 2. Large operations with high quality infrastructure were built 3. Precedent was set for legal shift work by both men and women 4. Pioneers demonstrated that UK and US regulators, and other major stakeholders, would not prevent processing work moved offshore
1. Risk profile improved dramatically, though supply market was still perceived immature. 2. Companies started setting up new operations as apart of other strategic initiatives. For example government discussion concerning the opening of the insurance market to partial foreign competition gave global insurance companies a vested interest in building offshore processing centers in India- they hoped to position themselves for the domestic market, if and when it opened up. 3. The early risk takers demonstrated the advantage of size. 4. Credibility of the business model was reinforced and perceived risks were dealt with satisfactorily. These included some complex issues, such as how to apply the European Data Protection Act, how to move higher –skilled work offshore, and how to manage the various media in the home market
The business model has been proven and the benefits look sustainable in the medium and long terms. Many of the obstacles from previous phases were overcome. Resolved issues include: Public relations: early players in phase1 and 2 showed that the public relations risks of moving jobs offshore are manageable Regulation: regulatory interference in the movement of processes and data offshore have not materialized, although it is crucial to be aware of US and UK financial service watchdogs’ guidelines for outsourcing, supplier selection and data protection Labor Costs: fear of rising labor costs have been dampened by the relatively high number of unemployed English speaking graduates, with a constant supply coming online each year as the Indian government focuses on education as a way of increasing the size of the Indian middle class. Data Communication Costs: with increasing liberalization of the telecommunications industry within India, these costs have fallen.
Source: IBM Consulting Services
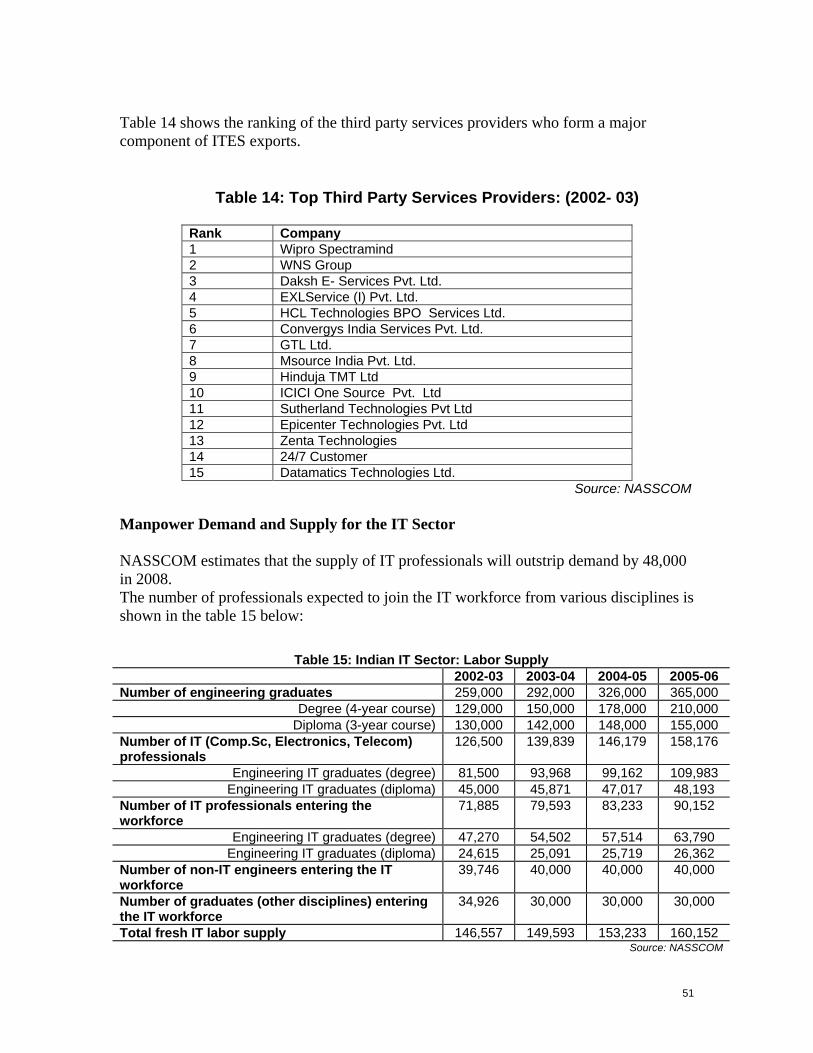
51
Table 14 shows the ranking of the third party services providers who form a major component of ITES exports.
Table 14: Top Third Party Services Providers: (2002- 03)
Rank Company 1 Wipro Spectramind 2 WNS Group 3 Daksh E- Services Pvt. Ltd. 4 EXLService (I) Pvt. Ltd. 5 HCL Technologies BPO Services Ltd. 6 Convergys India Services Pvt. Ltd. 7 GTL Ltd. 8 Msource India Pvt. Ltd. 9 Hinduja TMT Ltd 10 ICICI One Source Pvt. Ltd 11 Sutherland Technologies Pvt Ltd 12 Epicenter Technologies Pvt. Ltd 13 Zenta Technologies 14 24/7 Customer 15 Datamatics Technologies Ltd.
Source: NASSCOM Manpower Demand and Supply for the IT Sector NASSCOM estimates that the supply of IT professionals will outstrip demand by 48,000 in 2008. The number of professionals expected to join the IT workforce from various disciplines is shown in the table 15 below:
Table 15: Indian IT Sector: Labor Supply 2002-03 2003-04 2004-05 2005-06
Number of engineering graduates 259,000 292,000 326,000 365,000 Degree (4-year course) 129,000 150,000 178,000 210,000
Diploma (3-year course) 130,000 142,000 148,000 155,000 Number of IT (Comp.Sc, Electronics, Telecom) professionals
126,500 139,839 146,179 158,176
Engineering IT graduates (degree) 81,500 93,968 99,162 109,983 Engineering IT graduates (diploma) 45,000 45,871 47,017 48,193
Number of IT professionals entering the workforce
71,885 79,593 83,233 90,152
Engineering IT graduates (degree) 47,270 54,502 57,514 63,790 Engineering IT graduates (diploma) 24,615 25,091 25,719 26,362
Number of non-IT engineers entering the IT workforce
39,746 40,000 40,000 40,000
Number of graduates (other disciplines) entering the IT workforce
34,926 30,000 30,000 30,000
Total fresh IT labor supply 146,557 149,593 153,233 160,152 Source: NASSCOM
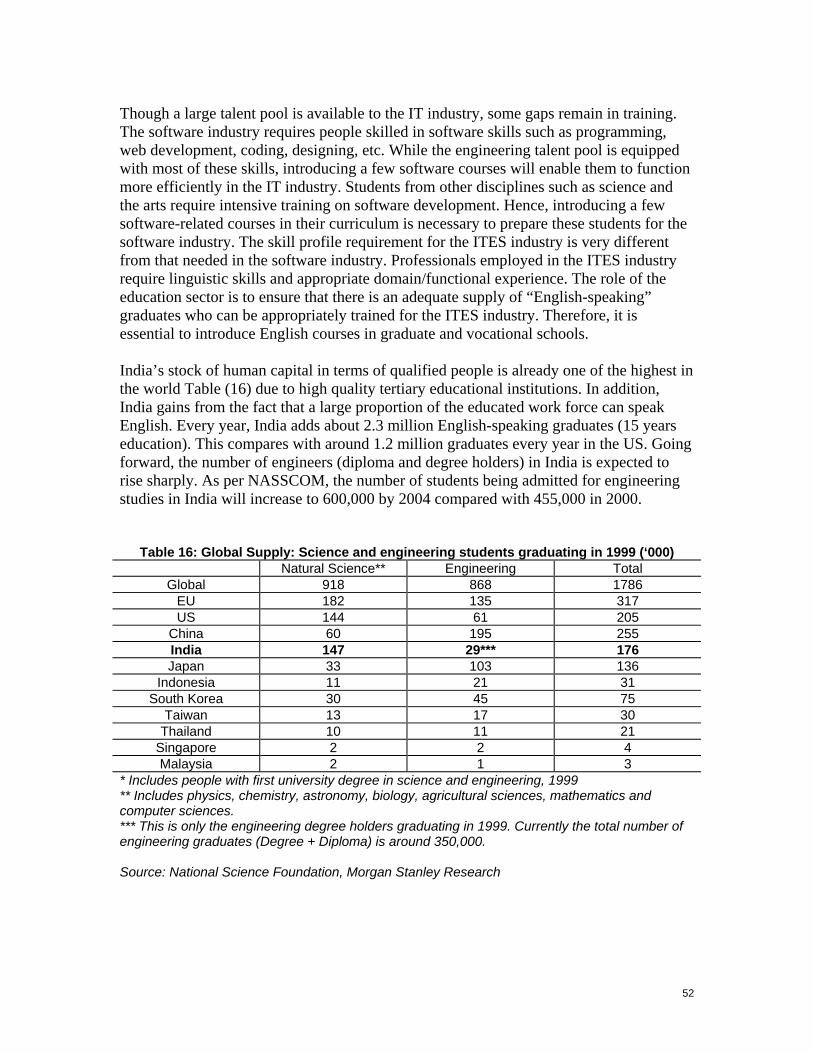
52
Though a large talent pool is available to the IT industry, some gaps remain in training. The software industry requires people skilled in software skills such as programming, web development, coding, designing, etc. While the engineering talent pool is equipped with most of these skills, introducing a few software courses will enable them to function more efficiently in the IT industry. Students from other disciplines such as science and the arts require intensive training on software development. Hence, introducing a few software-related courses in their curriculum is necessary to prepare these students for the software industry. The skill profile requirement for the ITES industry is very different from that needed in the software industry. Professionals employed in the ITES industry require linguistic skills and appropriate domain/functional experience. The role of the education sector is to ensure that there is an adequate supply of “English-speaking” graduates who can be appropriately trained for the ITES industry. Therefore, it is essential to introduce English courses in graduate and vocational schools. India’s stock of human capital in terms of qualified people is already one of the highest in the world Table (16) due to high quality tertiary educational institutions. In addition, India gains from the fact that a large proportion of the educated work force can speak English. Every year, India adds about 2.3 million English-speaking graduates (15 years education). This compares with around 1.2 million graduates every year in the US. Going forward, the number of engineers (diploma and degree holders) in India is expected to rise sharply. As per NASSCOM, the number of students being admitted for engineering studies in India will increase to 600,000 by 2004 compared with 455,000 in 2000.
Table 16: Global Supply: Science and engineering students graduating in 1999 (‘000) Natural Science** Engineering Total
Global 918 868 1786 EU 182 135 317 US 144 61 205
China 60 195 255 India 147 29*** 176 Japan 33 103 136
Indonesia 11 21 31 South Korea 30 45 75
Taiwan 13 17 30 Thailand 10 11 21
Singapore 2 2 4 Malaysia 2 1 3
* Includes people with first university degree in science and engineering, 1999 ** Includes physics, chemistry, astronomy, biology, agricultural sciences, mathematics and computer sciences. *** This is only the engineering degree holders graduating in 1999. Currently the total number of engineering graduates (Degree + Diploma) is around 350,000. Source: National Science Foundation, Morgan Stanley Research
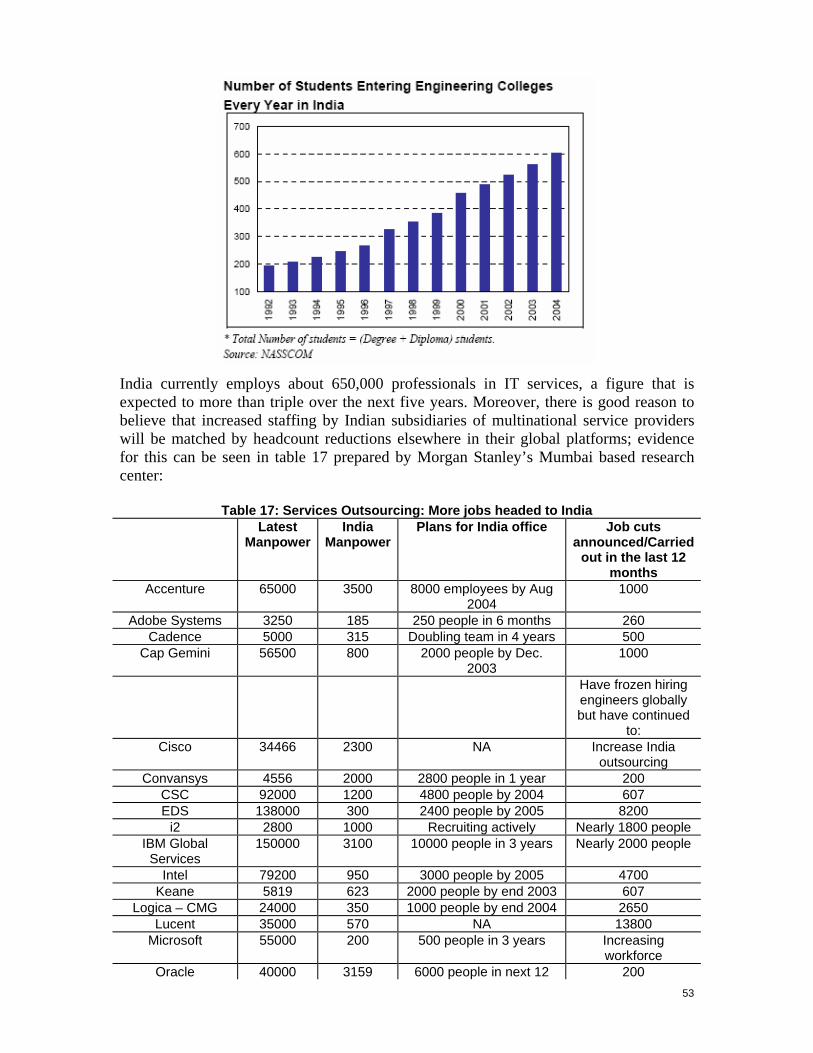
53
India currently employs about 650,000 professionals in IT services, a figure that is expected to more than triple over the next five years. Moreover, there is good reason to believe that increased staffing by Indian subsidiaries of multinational service providers will be matched by headcount reductions elsewhere in their global platforms; evidence for this can be seen in table 17 prepared by Morgan Stanley’s Mumbai based research center:
Table 17: Services Outsourcing: More jobs headed to India Latest
Manpower India
ManpowerPlans for India office Job cuts
announced/Carried out in the last 12
months Accenture 65000 3500 8000 employees by Aug
2004 1000
Adobe Systems 3250 185 250 people in 6 months 260 Cadence 5000 315 Doubling team in 4 years 500
Cap Gemini 56500 800 2000 people by Dec. 2003
1000
Have frozen hiring engineers globally but have continued
to: Cisco 34466 2300 NA Increase India
outsourcing Convansys 4556 2000 2800 people in 1 year 200
CSC 92000 1200 4800 people by 2004 607 EDS 138000 300 2400 people by 2005 8200
i2 2800 1000 Recruiting actively Nearly 1800 people IBM Global
Services 150000 3100 10000 people in 3 years Nearly 2000 people
Intel 79200 950 3000 people by 2005 4700 Keane 5819 623 2000 people by end 2003 607
Logica – CMG 24000 350 1000 people by end 2004 2650 Lucent 35000 570 NA 13800
Microsoft 55000 200 500 people in 3 years Increasing workforce
Oracle 40000 3159 6000 people in next 12 200

54
months Sapient 1500 600 Growing the India center
and Global Delivery 863
SunMicro 36000 700 Growing the India center 5480 Syntel 2700 2000 650 NA
Texas Instruments 34400 900 150 people by Mar 2006 800 personnel Xansa 5583 1200 6000 people in few years 502
Source: Morgan Stanly India Research; data as of September 2003 CASE | STUDY The US Company A leading company in the U.S. dealing in offering wide range of insurance programs designed exclusively for financial institutions, general agents, mortgage bankers, lenders and their customers. Business Objectives
Dramatic cost reduction of contact center operations Improved customer and quality service levels
Project start date: Middle-2002 Project Strength: 90 (84 FTEs, 33 seats) Auto Insurance: 48 (45 FTEs) Mortgage: 42 (39 FTEs) Work window: 3 shifts IST (6 pm-2:30am; 2am-10:30am; 10am- 6:30pm) Volume: 4.9 million transactions per annum (3.38 million for Auto and 1.56 million for Mortgage) Processes: The India Operators key the information (post a thorough analysis and rule set decision making) into the system which in turn compares the borrowers’ details, loan specifics, coverage amount, etc with the client database to match it to the respective loan & subsequently update it.
Project Timeline: The following time line shows the different stages of the project migration and the timeline for the process to be outsourced. This shows the average time required for migration of different processes.
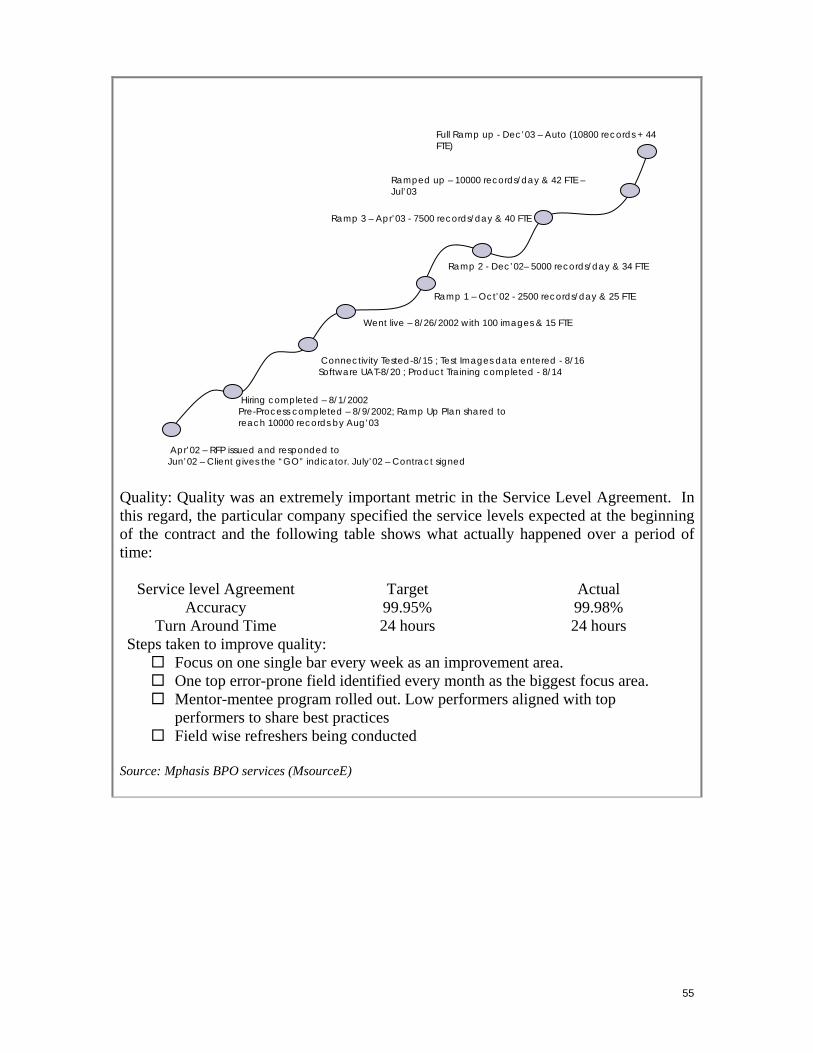
55
Quality: Quality was an extremely important metric in the Service Level Agreement. In this regard, the particular company specified the service levels expected at the beginning of the contract and the following table shows what actually happened over a period of time:
Service level Agreement Target Actual Accuracy 99.95% 99.98%
Turn Around Time 24 hours 24 hours Steps taken to improve quality:
Focus on one single bar every week as an improvement area. One top error-prone field identified every month as the biggest focus area. Mentor-mentee program rolled out. Low performers aligned with top
performers to share best practices Field wise refreshers being conducted
Source: Mphasis BPO services (MsourceE)
The Path Traveled
Hiring completed – 8/1/2002 Pre-Process completed – 8/9/2002; Ramp Up Plan shared to reach 10000 records by Aug’03
Connectivity Tested-8/15 ; Test Images data entered - 8/16 Software UAT-8/20 ; Product Training completed - 8/14
Went live – 8/26/2002 with 100 images & 15 FTE
Ramp 1 – Oct’02 - 2500 records/day & 25 FTE
Ramp 3 – Apr’03 - 7500 records/day & 40 FTE
Ramped up – 10000 records/day & 42 FTE – Jul’03
Full Ramp up - Dec’03 – Auto (10800 records + 44 FTE)
Ramp 2 - Dec’02– 5000 records/day & 34 FTE
Apr’02 – RFP issued and responded to Jun’02 – Client gives the “GO” indicator. July’02 – Contract signed
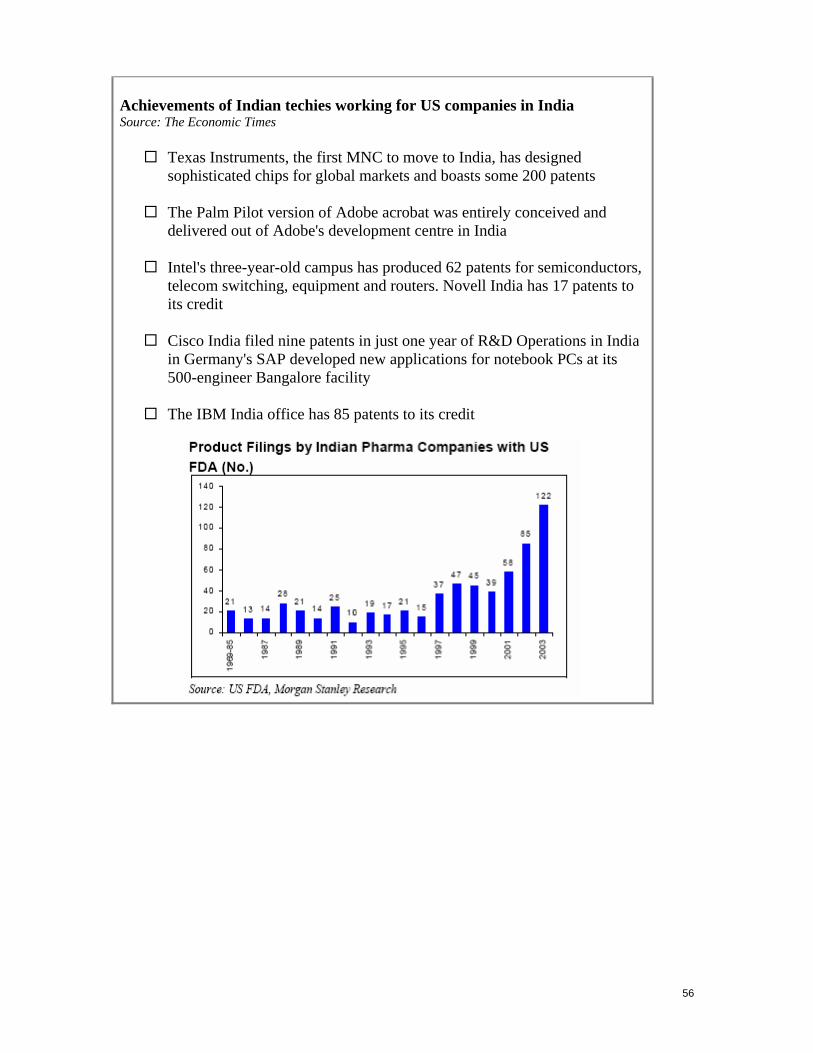
56
Achievements of Indian techies working for US companies in India Source: The Economic Times
Texas Instruments, the first MNC to move to India, has designed sophisticated chips for global markets and boasts some 200 patents
The Palm Pilot version of Adobe acrobat was entirely conceived and delivered out of Adobe's development centre in India
Intel's three-year-old campus has produced 62 patents for semiconductors, telecom switching, equipment and routers. Novell India has 17 patents to its credit
Cisco India filed nine patents in just one year of R&D Operations in India in Germany's SAP developed new applications for notebook PCs at its 500-engineer Bangalore facility
The IBM India office has 85 patents to its credit
57
Section V: US reaction to GSS A lot of companies we tried to speak have adopted a “No comment” strategy on global services sourcing. Still other companies are making sure their outsourcing, especially off-shored outsourcing initiatives are kept under the radar. In many cases even their own employees are not aware of the developments. If global services’ sourcing, as evidenced by our survey results shows, is benefiting companies from both the cost and quality angles and the general level of satisfaction is quite high, why would companies not talk about it as a smart management decision? In most cases we found that anecdotes of workers affected by off-shored outsourcing are powerful and these voices are heard especially clearly during economic downturns. Throw in an election year and this becomes a national issue. What are the contributing factors to this heightened level of anxiety? Many IT executives have themselves contributed to this perception. When IBM announced plans to outsource 3000 jobs overseas, one of its executives said, “Globalization means shifting a lot of jobs, opening a lot of locations in places we had never dreamt of before, going where there’s low cost labor, low-cost competition, shifting jobs offshore. Nandan Nilekani, chief executive of India-based Infosys Technologies, said at this year’s World Economic Forum, “Everything you can send down a wire is up for grabs.” In the January testimony before Congress, Hewlett Packard chief Carly Fiorina warned that “there is no job that is America’s God-given right anymore.” The McKinsey Global Institute estimates that the volume of offshore outsourcing will increase by 30 to 40 per cent a year for the next five years. Forrester Research estimates that 3.3 million white collar jobs will move overseas by 2015. Deloitte Research predicts the outsourcing of 2 million financial sector jobs by 20099.
Unpacking the job loss numbers10 The recent report of Forrester estimates that over 3.3 million jobs and over $136 billion of wages will be transferred out of US. In order to see the effect of outsourcing on these occupations, data from last from 2000-2002 has been analyzed to see the effect of recession and outsourcing on job losses and effect on real wage rates for these workers. The Forrester report breaks down of the US jobs expected to move overseas into nine major occupational categories as identified from the Standard Occupational Classification (SOC) system utilized by the Bureau of Labor Statistics. These are: 1. 11-0000 Management Occupations; 2. 13-0000 Business and Financial Operations Occupations; 3. 15-0000 Computer and Mathematical Occupations; 4. 17-0000 Architecture and Engineering Occupations; 5. 19-0000 Life, Physical, and Social Science Occupations; 6. 23-0000 Legal Occupations; 9 The Outsourcing Bogeyman – Daniel W Drezner – Foreign Affairs (May/June 2004) 10 Source: Outsourcing—Stains on the White Collar? Jacob F. Kirkegaard - Research Assistant, Institute for International Economics
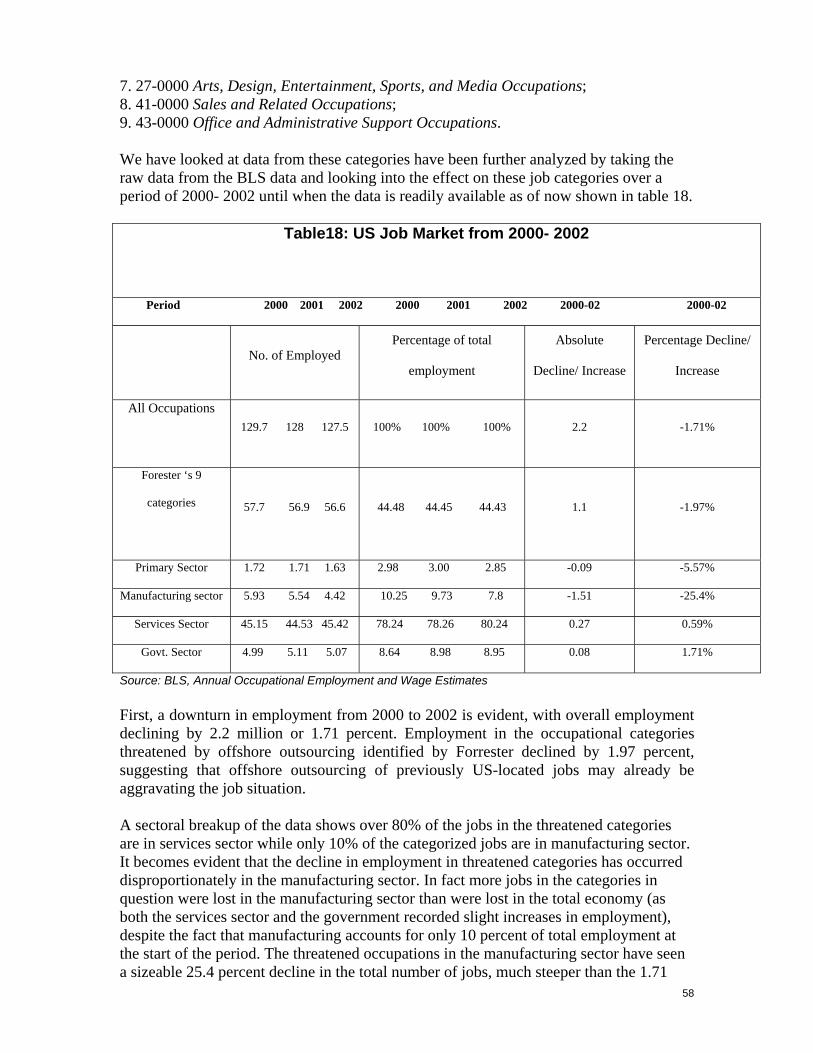
58
7. 27-0000 Arts, Design, Entertainment, Sports, and Media Occupations; 8. 41-0000 Sales and Related Occupations; 9. 43-0000 Office and Administrative Support Occupations. We have looked at data from these categories have been further analyzed by taking the raw data from the BLS data and looking into the effect on these job categories over a period of 2000- 2002 until when the data is readily available as of now shown in table 18.
Table18: US Job Market from 2000- 2002
Period 2000 2001 2002 2000 2001 2002 2000-02 2000-02
No. of Employed
Percentage of total
employment
Absolute
Decline/ Increase
Percentage Decline/
Increase
All Occupations
129.7 128 127.5 100% 100% 100% 2.2 -1.71%
Forester ‘s 9
categories
57.7 56.9 56.6 44.48 44.45 44.43 1.1 -1.97%
Primary Sector 1.72 1.71 1.63 2.98 3.00 2.85 -0.09 -5.57%
Manufacturing sector 5.93 5.54 4.42 10.25 9.73 7.8 -1.51 -25.4%
Services Sector 45.15 44.53 45.42 78.24 78.26 80.24 0.27 0.59%
Govt. Sector 4.99 5.11 5.07 8.64 8.98 8.95 0.08 1.71%
Source: BLS, Annual Occupational Employment and Wage Estimates First, a downturn in employment from 2000 to 2002 is evident, with overall employment declining by 2.2 million or 1.71 percent. Employment in the occupational categories threatened by offshore outsourcing identified by Forrester declined by 1.97 percent, suggesting that offshore outsourcing of previously US-located jobs may already be aggravating the job situation. A sectoral breakup of the data shows over 80% of the jobs in the threatened categories are in services sector while only 10% of the categorized jobs are in manufacturing sector. It becomes evident that the decline in employment in threatened categories has occurred disproportionately in the manufacturing sector. In fact more jobs in the categories in question were lost in the manufacturing sector than were lost in the total economy (as both the services sector and the government recorded slight increases in employment), despite the fact that manufacturing accounts for only 10 percent of total employment at the start of the period. The threatened occupations in the manufacturing sector have seen a sizeable 25.4 percent decline in the total number of jobs, much steeper than the 1.71
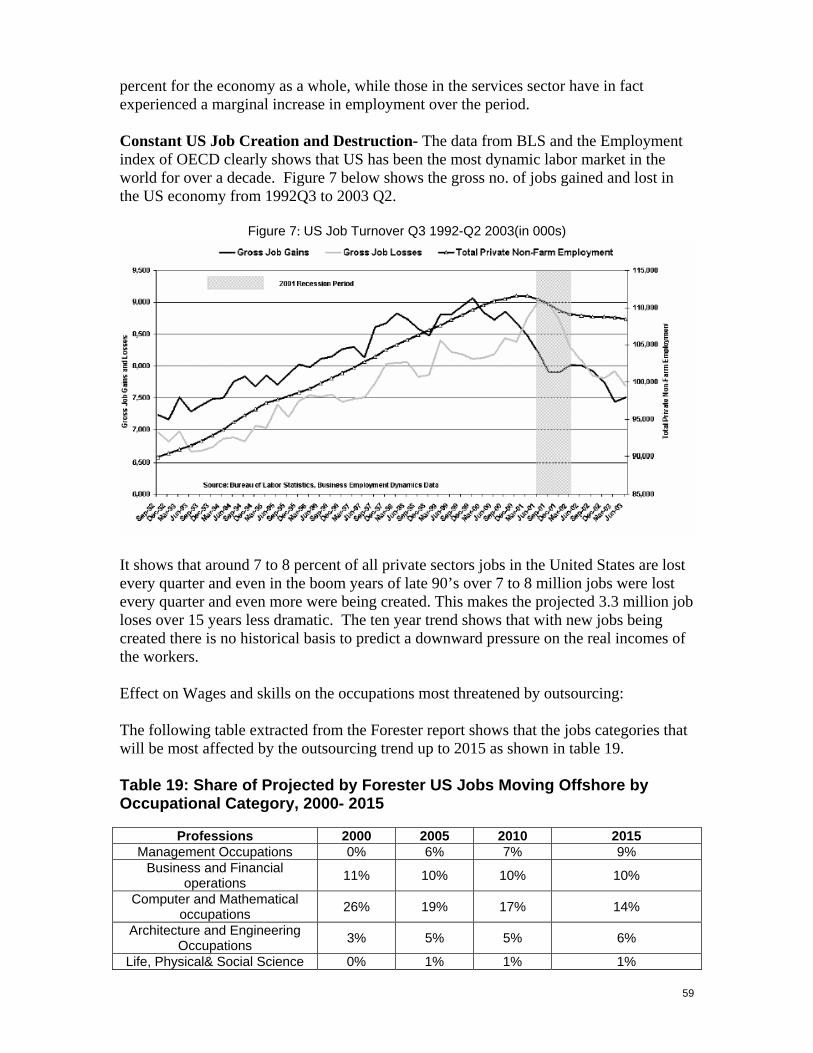
59
percent for the economy as a whole, while those in the services sector have in fact experienced a marginal increase in employment over the period. Constant US Job Creation and Destruction- The data from BLS and the Employment index of OECD clearly shows that US has been the most dynamic labor market in the world for over a decade. Figure 7 below shows the gross no. of jobs gained and lost in the US economy from 1992Q3 to 2003 Q2.
Figure 7: US Job Turnover Q3 1992-Q2 2003(in 000s)
It shows that around 7 to 8 percent of all private sectors jobs in the United States are lost every quarter and even in the boom years of late 90’s over 7 to 8 million jobs were lost every quarter and even more were being created. This makes the projected 3.3 million job loses over 15 years less dramatic. The ten year trend shows that with new jobs being created there is no historical basis to predict a downward pressure on the real incomes of the workers. Effect on Wages and skills on the occupations most threatened by outsourcing: The following table extracted from the Forester report shows that the jobs categories that will be most affected by the outsourcing trend up to 2015 as shown in table 19. Table 19: Share of Projected by Forester US Jobs Moving Offshore by Occupational Category, 2000- 2015
Professions 2000 2005 2010 2015 Management Occupations 0% 6% 7% 9%
Business and Financial operations 11% 10% 10% 10%
Computer and Mathematical occupations 26% 19% 17% 14%
Architecture and Engineering Occupations 3% 5% 5% 6%
Life, Physical& Social Science 0% 1% 1% 1%
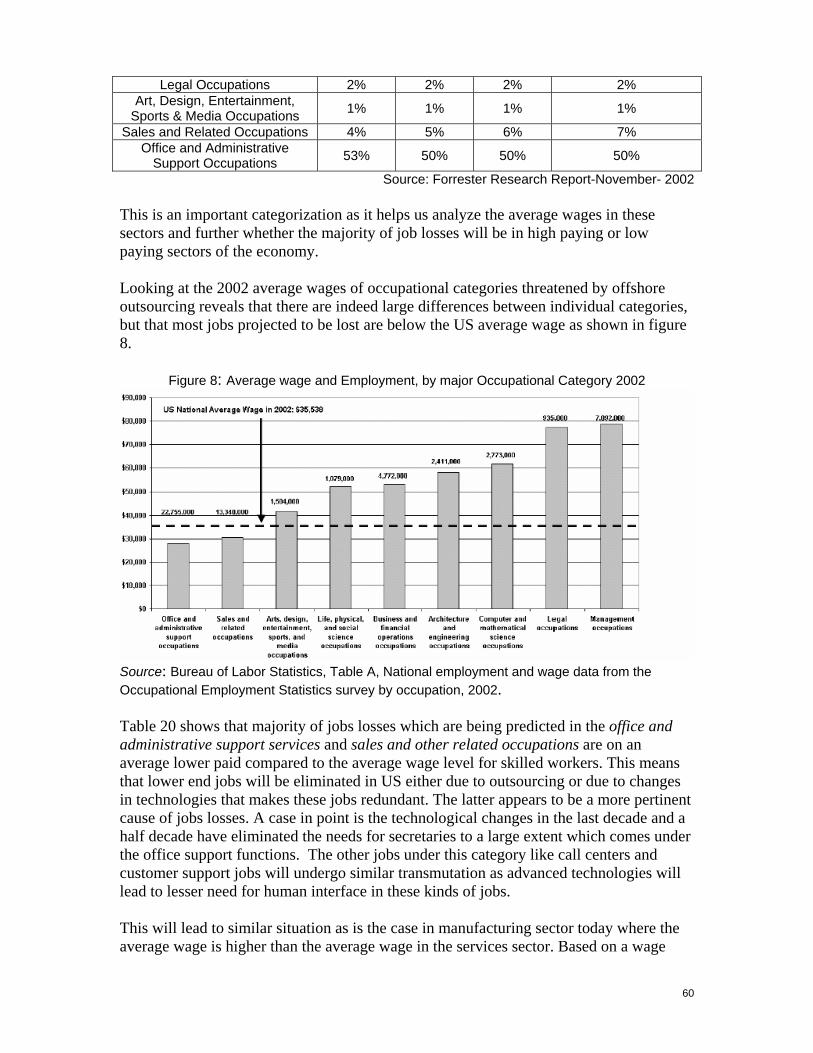
60
Legal Occupations 2% 2% 2% 2% Art, Design, Entertainment,
Sports & Media Occupations 1% 1% 1% 1%
Sales and Related Occupations 4% 5% 6% 7% Office and Administrative
Support Occupations 53% 50% 50% 50%
Source: Forrester Research Report-November- 2002 This is an important categorization as it helps us analyze the average wages in these sectors and further whether the majority of job losses will be in high paying or low paying sectors of the economy. Looking at the 2002 average wages of occupational categories threatened by offshore outsourcing reveals that there are indeed large differences between individual categories, but that most jobs projected to be lost are below the US average wage as shown in figure 8.
Figure 8: Average wage and Employment, by major Occupational Category 2002
Source: Bureau of Labor Statistics, Table A, National employment and wage data from the Occupational Employment Statistics survey by occupation, 2002. Table 20 shows that majority of jobs losses which are being predicted in the office and administrative support services and sales and other related occupations are on an average lower paid compared to the average wage level for skilled workers. This means that lower end jobs will be eliminated in US either due to outsourcing or due to changes in technologies that makes these jobs redundant. The latter appears to be a more pertinent cause of jobs losses. A case in point is the technological changes in the last decade and a half decade have eliminated the needs for secretaries to a large extent which comes under the office support functions. The other jobs under this category like call centers and customer support jobs will undergo similar transmutation as advanced technologies will lead to lesser need for human interface in these kinds of jobs. This will lead to similar situation as is the case in manufacturing sector today where the average wage is higher than the average wage in the services sector. Based on a wage
61
index of 100 for the manufacturing sector, the wage index in the service sector is 99.2.11 This can be attributed to lower end manufacturing being off shored in the last two decades, use of better technology and the average worker being retrained, resulting in sharp productivity increases allowing manufacturing workers to move up the value chain and hence earn higher wages. Affect on IT sector and the changing job profile and effect on wages: Since a lot of changes in the job market in US have been due to the effect of technology, a close look at the IT sector, which has been at the forefront of the outsourcing, will be helpful to predict the future trends. The period from 1999-2002 gives us a glimpse of the effect on the IT job market during both boom and the bust period.
Table 20: Evolution in IT occupations and demand for Skills 1999- 2002 Category Change 1999-2002 Avg. Wage ($) 2002 Emp. Level
Data Entry Operators
-143250 23,190 377,000
Computer Operators -25860 31,640 173,000 Computer
Programmer -71280 63,690 457,000
Computer S/W Engineer
115170 74,615 612,000
Total White Collar -144630 5,492,000 Source: BLS 2002 Occupational Employment and Wage Estimates
The numbers in table 18 show that while the lower end jobs in the IT sector has been lost over the period of 1999- 2002, the higher paying jobs have increased during this period. The jobs losses for lower end jobs can be explained both due to the recession but more due to the increasing standardization of IT technologies which is reducing the need for human input thus making these jobs suitable for outsourcing. A comparison between the jobs losses of data entry operators and job gains by computer software engineers show that jobs are moving up the value chain and the workers who are better trained in the IT sector will probably earn more than what they have been in the past. At the same point of time, loss of jobs for the computer programmers which are high end jobs compared to data entry operators shows that an increasingly globalized services economy will have an effect on both the lower and higher end of the job categories. Still the net effect on high end jobs gained has been positive. This shows that the technological changes and outsourcing is leading to demand for increasingly high skill jobs remaining in US. This should in the future lead to an increase in the real income of the skilled workers.
11 The characteristics and quality of service sector jobs- OECD study - 2001
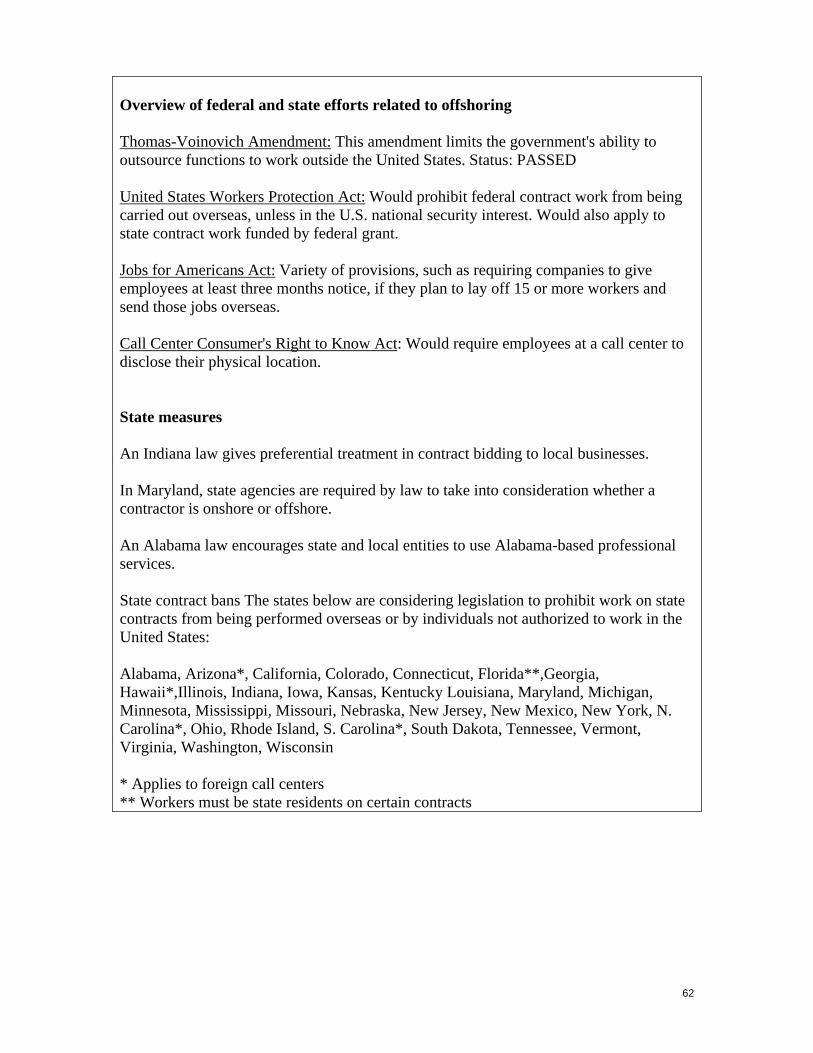
62
Overview of federal and state efforts related to offshoring Thomas-Voinovich Amendment: This amendment limits the government's ability to outsource functions to work outside the United States. Status: PASSED United States Workers Protection Act: Would prohibit federal contract work from being carried out overseas, unless in the U.S. national security interest. Would also apply to state contract work funded by federal grant. Jobs for Americans Act: Variety of provisions, such as requiring companies to give employees at least three months notice, if they plan to lay off 15 or more workers and send those jobs overseas. Call Center Consumer's Right to Know Act: Would require employees at a call center to disclose their physical location. State measures An Indiana law gives preferential treatment in contract bidding to local businesses. In Maryland, state agencies are required by law to take into consideration whether a contractor is onshore or offshore. An Alabama law encourages state and local entities to use Alabama-based professional services. State contract bans The states below are considering legislation to prohibit work on state contracts from being performed overseas or by individuals not authorized to work in the United States: Alabama, Arizona*, California, Colorado, Connecticut, Florida**,Georgia, Hawaii*,Illinois, Indiana, Iowa, Kansas, Kentucky Louisiana, Maryland, Michigan, Minnesota, Mississippi, Missouri, Nebraska, New Jersey, New Mexico, New York, N. Carolina*, Ohio, Rhode Island, S. Carolina*, South Dakota, Tennessee, Vermont, Virginia, Washington, Wisconsin * Applies to foreign call centers ** Workers must be state residents on certain contracts
63
CASE | STUDY – A (Quantifying the impact of global services sourcing on the US Economy) The section also examines the ramifications of recent demands to restrict outsourcing and looks closely at the claim that such restrictions will improve employment numbers over the short and medium term. It examines the impact of the lower cost of consumables on GDP, which is an ideal way to apply cost benefit analysis to the outsourcing phenomena. The Kaldor-Hicks theorem has been used to measure unemployment due to outsourcing in two recent instances where the off-shored work has been recalled including work recalled by the government of New Jersey and cancellation of an IT outsourcing order to India by State of Indiana. (A policy is said to be Kaldor-Hicks superior to another if the gains realized by adopting the policy could theoretically compensate all those made worse off by the policy). Key findings
The median unemployment period for a worker in the US was 12.4 weeks in 2002 (Figure 1- Annexure 1) while the median unemployment period in the OECD countries was 34-36 weeks during the same period. This can be partly explained by the fact that labor laws are very flexible in US while they are more stringent in the OECD countries. This is based on a study by OECD which ranked countries based on employed protection legislation index in which US ranked lowest at 0.2 while selected OECD countries had a score of 2.2.12
The long-term unemployment rate (unemployed over 12 months) as a percentage of the total unemployment rate is lowest in the US at around 6% while it exceeds 30% in a selected sample of OECD nations.
The growth of high end and low end service jobs has been the highest in the US. Job generation in US service sector compared to that of the OECD countries is higher by 15%. In the last decade, two-thirds of services jobs created in the US have been in medium and high paying sectors. 13
The lowering of IT costs has led to long term productivity increase of 1.9% in US
(1995- 2002) compared to 1.1% for the other European OECD countries. The US per capita income being $33,271 based on PPP, compared to $22,474 for OECD countries based on PPP terms.14
Outsourcing activity in the services sector is expected to help the US economy grow by 0.2% by 2010. This will also help US governments to have higher tax collection as the bottom- line of the companies will increase due to cost savings.
The average wage in the US manufacturing sector is higher than the average wage
in the services sector. Based on a wage index of 100 for the manufacturing sector, the wage index in the service sector is 99.2.15 This phenomenon is due to lower end manufacturing being off-shored in the last two decades, and the average
12 OECD Annual Employment Survey -1999 13 The Characteristic and Quality of Service Sector Jobs- OECD Report- 2002 14 Conference Board –Productivity, Employment and Income in World Economy-2002 15 The Characteristic and Quality of Service Sector Jobs- OECD Report- 2002
64
worker has been retrained, earns more, and has moved up the value chain. A similar effect will take place in the service sector when the lower end services are off-shored. The impact of offshoring middle end service jobs will be less pronounced as the workers are better equipped to retrain themselves for new positions
The recent work recall by the State of New Jersey from India is costing the tax-payer an extra $98,000 per annum for each job saved. Similarly, each job saved in the State of Indiana will cost the tax-payers an extra $135,000 per year. ( See annexure 1)
Conclusion
Based on our analysis of the data released by US Congressional Budget Office and Forrester Research, we predict that global sourcing of services will help the US economy to grow higher by 0.2% every year by year 2010.16
IT/ITES professions are predicted to be the fastest growing till 2010 and the
number of jobs created will far outstrip the jobs off-shored.17
Productivity increase in US is going to be higher than in European OECD countries over this decade.18
CASE | STUDY – B- Healthcare Industry in US A healthcare sector case study, taking into account the cost of healthcare, effect on the consumer price index and demand for the workers, is included to show the impact of strict regulation and tight labor laws on this service industry. The healthcare sector is valuable to examine before imposing similar regulations on other services industries because demand for more regulation in other service sectors will lead to similar consequences for the services sector as a whole. Key Findings
Health service prices (defined as the costs of Doctors, Radiologists, and Nurses) have risen faster than overall prices during the period of 1998- 2002 by an average of 3% above the normal rate of inflation. The Consumer Price Index (CPI) for health services rose 5.5% compared to a 1.3 percent increase in the overall increase in CPI in 2002. Source: American Health Association
The prices for hospital Medicare rose at an even greater rate of 8.9% in 2002. The average increase for the period from 1998- 2002 was in the range of 6-7%. (Based on analysis of BLS Consumer Price Index data for 2002)
The price for outpatient health services increased by 10.2 % in 2002 which was 1.5 times greater than the 2002 figure of 6.6 %. The average over the period of
16 Based on data from Forester report and E- Valueserve – The impact of global sourcing on US Economy-2003 17 BLS Occupational Handbook- 2002 18 Conference Board –Productivity, Employment and Income in World Economy-2002 19 Center for Medicare services -http://www.cms.hhs.gov/statistics/health-indicators 20 http://www.cms.hhs.gov/statistics/health-indicators/analysispart1.asp 21 AHA Annual Report- 2002
65
1998- 2002 was 6% on CPI basis. (Based on analysis of BLS Consumer Price Index data for 2002)
The average employment increase in healthcare was 2.02% during 1998- 2002 while the corresponding increase in non-farm employment was 0.82% over the same period.19
The average percentage change in the hourly wage of all service sector employees was 3.7% over the period of 1998- 2002, while the average percentage change in the hourly wage rate for healthcare workers was 4.25% over the same period.20
In June 2001, 168,000 positions were unfilled in American hospitals. Further calculations show that by year 2030, there will be a shortfall of 480,000 nurses in the US based on a projected demographics profile Source: US Census Bureau
Conclusion
Health care services costs will continue to increase by 3-4% above the inflation rate
Healthcare cost has been increasing at a rate much higher than the inflation rate while the wages for this sector are also increasing at a greater rate than the wages for the service sector. This will lead to a situation where the consumer surplus is being reduced as health services costs are increasing. If the labor market for health services were deregulated, it would lead to lower increase in wage cost and better service. This premise is based on the affect IT outsourcing has had on the US economy in terms of lower costs and higher productivity in the 1990’s. (Source: Global sourcing & Hi-tech Jobs- IIE – 2004)
The study of healthcare sector gives a clear indication about the economic impact of the offshoring will have on the cost and quality of services being offered. This is based on the fact that healthcare sector contributes over 16% of US GDP and any lowering of costs will lead to higher consumer surplus for the consumers. As the experience of IT sector shows, this is possible if the healthcare sector is deregulated. Also, in Healthcare sector, when 18 % of the positions for Radiological services are unfilled21, outsourcing will not create any job shortage Source: Arora (2003)
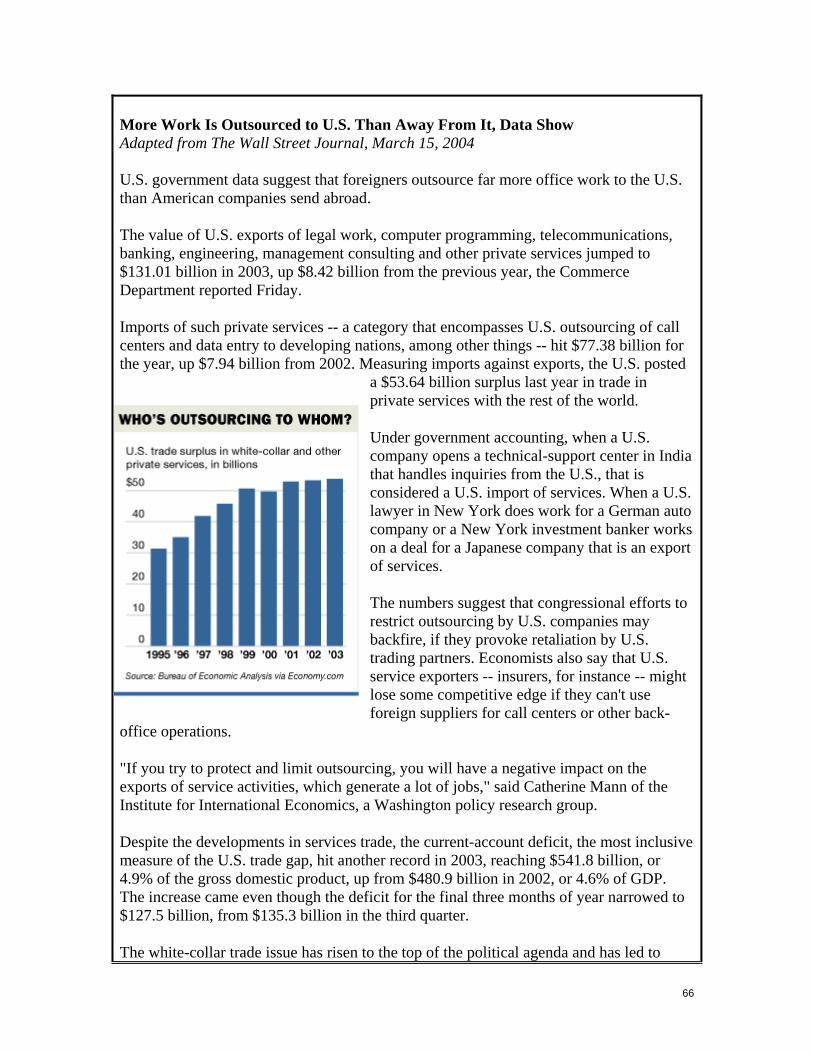
66
More Work Is Outsourced to U.S. Than Away From It, Data Show Adapted from The Wall Street Journal, March 15, 2004 U.S. government data suggest that foreigners outsource far more office work to the U.S. than American companies send abroad.
The value of U.S. exports of legal work, computer programming, telecommunications, banking, engineering, management consulting and other private services jumped to $131.01 billion in 2003, up $8.42 billion from the previous year, the Commerce Department reported Friday.
Imports of such private services -- a category that encompasses U.S. outsourcing of call centers and data entry to developing nations, among other things -- hit $77.38 billion for the year, up $7.94 billion from 2002. Measuring imports against exports, the U.S. posted
a $53.64 billion surplus last year in trade in private services with the rest of the world.
Under government accounting, when a U.S. company opens a technical-support center in India that handles inquiries from the U.S., that is considered a U.S. import of services. When a U.S. lawyer in New York does work for a German auto company or a New York investment banker works on a deal for a Japanese company that is an export of services.
The numbers suggest that congressional efforts to restrict outsourcing by U.S. companies may backfire, if they provoke retaliation by U.S. trading partners. Economists also say that U.S. service exporters -- insurers, for instance -- might lose some competitive edge if they can't use foreign suppliers for call centers or other back-
office operations.
"If you try to protect and limit outsourcing, you will have a negative impact on the exports of service activities, which generate a lot of jobs," said Catherine Mann of the Institute for International Economics, a Washington policy research group.
Despite the developments in services trade, the current-account deficit, the most inclusive measure of the U.S. trade gap, hit another record in 2003, reaching $541.8 billion, or 4.9% of the gross domestic product, up from $480.9 billion in 2002, or 4.6% of GDP. The increase came even though the deficit for the final three months of year narrowed to $127.5 billion, from $135.3 billion in the third quarter.
The white-collar trade issue has risen to the top of the political agenda and has led to

67
legislative proposals to prevent outsourcing, or expose it when it occurs. Sen. John Kerry of Massachusetts, the likely Democratic presidential nominee, wants U.S. companies to reveal to callers that their telephone inquiries are going overseas. Others in Congress legislation to restrict government contractors from sending work abroad. Politicians have largely ignored the jobs created in the U.S. when Americans sell white-collar services to foreign customers.
68
How should the US respond? Adapted from CNN/Money Scrap WTO, trade pacts Some people argue the United States should simply pull out of the World Trade Organization, NAFTA and other world trade pacts, a view proposed by three presidential. Proponents favor withdrawing from most existing trade agreements and negotiating new agreements on a case-by-case basis, requiring trading partners to meet certain environmental, labor and human rights standards. Protect government contracts Opponents of outsourcing especially oppose federal and state governments sending jobs overseas. In that vein, Congress in January passed a law requiring that government functions shifted to contractors had to go to contractors in the United States. In Indiana and New Jersey this year, two state government contracts to move call-center work offshore were canceled under political pressure. And dozens of anti-outsourcing bills await action in federal and state legislatures. Critics of the bills say they would save just a handful of jobs and cost millions of dollars to taxpayers, potentially doing more harm than good. (see case study) Slow visa entries Temporary work visas for high-skilled foreign workers also irritate outsourcing opponents. Not only do they take jobs from U.S. workers in the short run, but visa holders sometimes return home and make future offshore outsourcing even easier for U.S. companies. Caller ID Outsourcing critics want to require workers in overseas call centers to reveal their location in service calls. Not only would such a measure carry on the spirit of the existing requirement to mark foreign-made goods with their country of origin, it might also allow customers to decide whether they want to discuss personal information with a call-center worker in, say, Vietnam, where privacy laws may not be as stringent as they are in the United States. Helping displaced workers
It's all well and good to discuss the long-term economic benefits of trade, as most economists do. But those arguments ring hollow with the millions of workers who will be unemployed or have lower standards of living while they wait for those benefits to come to fruition. Some possible solutions include increased unemployment insurance, wage insurance, and a system that would let workers carry health benefits from job to job.
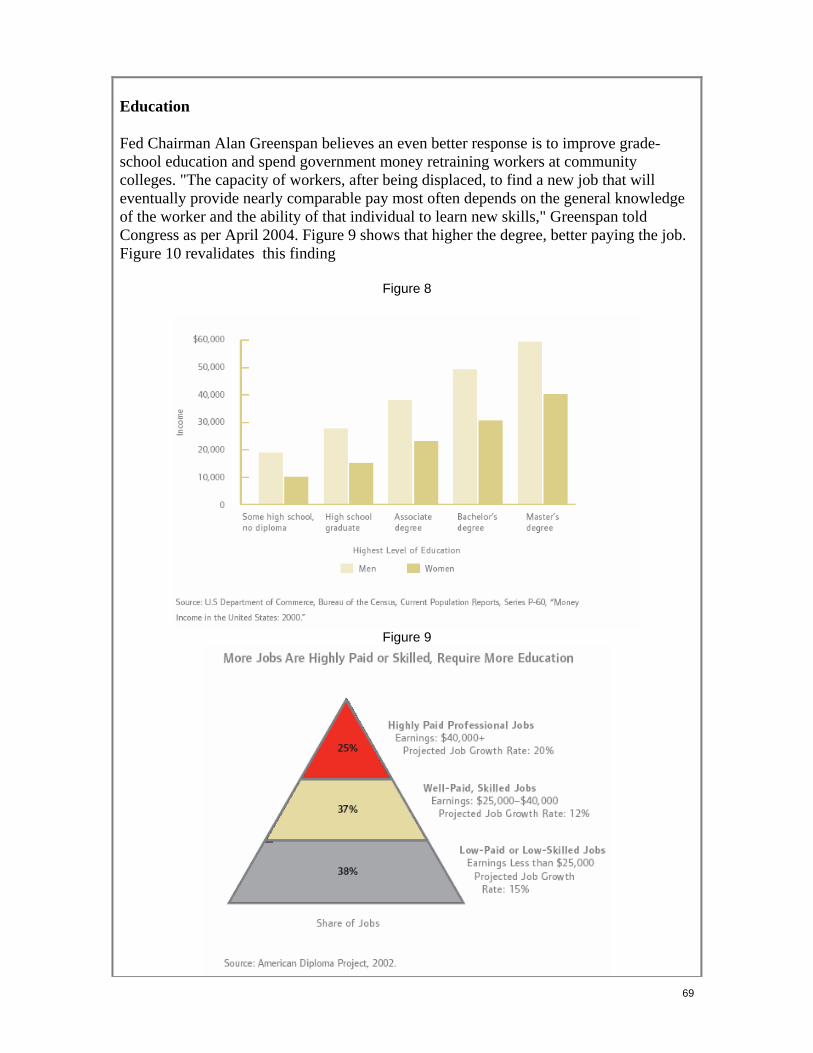
69
Education
Fed Chairman Alan Greenspan believes an even better response is to improve grade-school education and spend government money retraining workers at community colleges. "The capacity of workers, after being displaced, to find a new job that will eventually provide nearly comparable pay most often depends on the general knowledge of the worker and the ability of that individual to learn new skills," Greenspan told Congress as per April 2004. Figure 9 shows that higher the degree, better paying the job. Figure 10 revalidates this finding
Figure 8
Figure 9
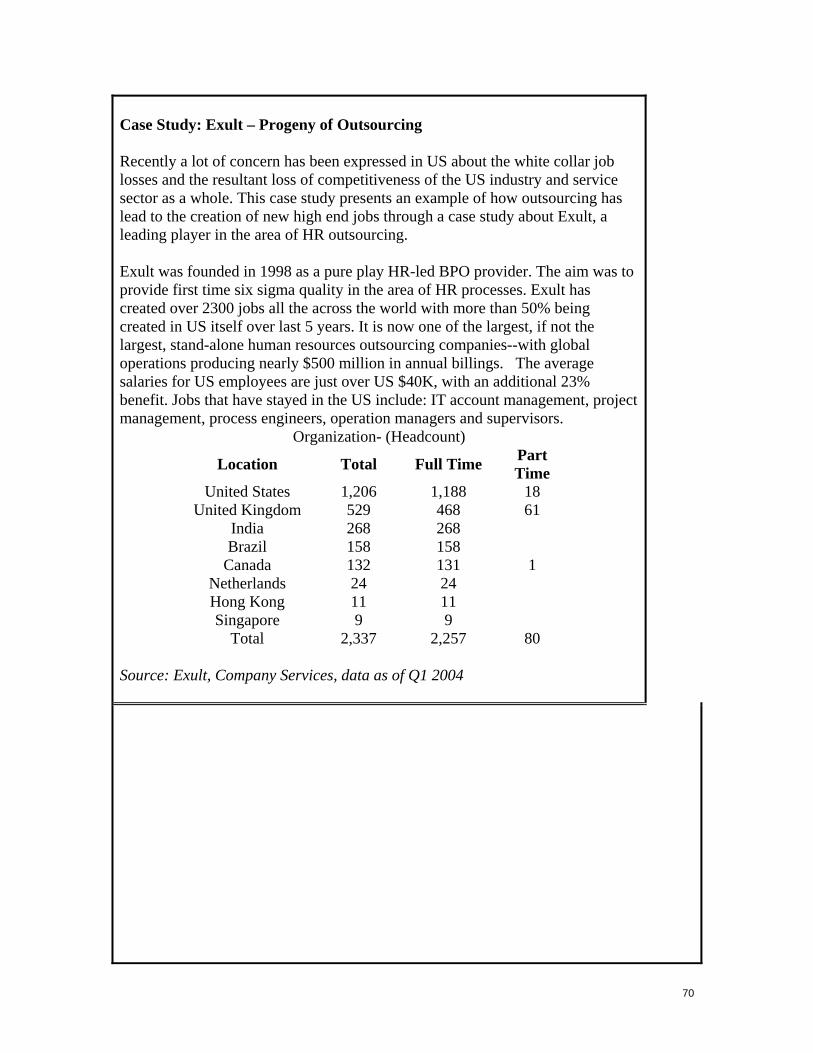
70
Case Study: Exult – Progeny of Outsourcing Recently a lot of concern has been expressed in US about the white collar job losses and the resultant loss of competitiveness of the US industry and service sector as a whole. This case study presents an example of how outsourcing has lead to the creation of new high end jobs through a case study about Exult, a leading player in the area of HR outsourcing. Exult was founded in 1998 as a pure play HR-led BPO provider. The aim was to provide first time six sigma quality in the area of HR processes. Exult has created over 2300 jobs all the across the world with more than 50% being created in US itself over last 5 years. It is now one of the largest, if not the largest, stand-alone human resources outsourcing companies--with global operations producing nearly $500 million in annual billings. The average salaries for US employees are just over US $40K, with an additional 23% benefit. Jobs that have stayed in the US include: IT account management, project management, process engineers, operation managers and supervisors.
Organization- (Headcount)
Location Total Full Time Part Time
United States 1,206 1,188 18 United Kingdom 529 468 61
India 268 268 Brazil 158 158
Canada 132 131 1 Netherlands 24 24 Hong Kong 11 11 Singapore 9 9
Total 2,337 2,257 80 Source: Exult, Company Services, data as of Q1 2004
71
Offshoring – Animated? It would not be erroneous to say that 99% of the people who tuned in to watch the Academy Awards on March 1, 2004 have never heard of Tata Elxsi Visual Computing Labs (VCL). VCL executives in India, working with Prologue Films in the US, were responsible for the dazzling array of computer-generated graphics at display during the recent academy awards. This is only one example of the potential revenue streams available through animation outsourcing. The Indian animation market, which until the mid-late 1990’s was fairly static, is witnessing unprecedented growth opportunities both in the global sphere and domestically. The demand for animation production services from international animation studios spurred in large part due to India's lower costs of animation production and technical manpower to meet 2-D and 3-D animation requirements, is drawing Indian companies into the animation framework, and compelling them to view this emerging market with seriousness. Animation production in India is expected to go up from U.S $ 600 million in 2001 to over $ 1.5 billion by 2005. A recent study on the animation industry by the National Association of Software and Services Companies (NASSCOM) shows that the global animation production market is set for major growth. The study, which is based on multiple statistical projections on the market, from segments such as industry sources, Pixel Inc. and Arthur Andersen (Study on the Entertainment and Media sector) forecasts that the global animation market will generate revenues worth US$ 50-70 billion by 2005. The cost advantages of outsourcing cannot be denied. Trainees in the animation industry in India start with a salary ranging between Rs. 2000 – Rs. 5000 a month ($ 40 - $ 100) while trained (3+ years experience) animators earn up to Rs.16,000 a month ($360). According to some estimates, the cost of outsourcing one hour of animation work (this is not the same as one hour of animation on film) to India would approximately cost $60,000 compared to over $300,000 in the U.S. To extend this line of thinking would imply that if a full length animation budget in the US were $100 million, it would cost only $20 million in India.
72
Section VI: General Agreement Treaty on Services (GATS) and GSS The recent outcry in US and flurry of bills in Congress and states makes it imperative to have a look at the way Global Services Sourcing is covered by multilateral treaties. The most comprehensive is General Agreement Treaty on Services (GATS), which is part of WTO and covers a wide gamut of services across the world. The current GATS treaty works on the principle of positive list where the services that are listed in GATS are covered by the multilateral agreement while the rest of the services are free to be regulated by member countries. This leads to lot of ambiguity as most of growth in services trade is being driven by technological changes and services which were previously thought impossible to be outsourced are being outsourced today as an efficient global services supply chain is being harnessed. As of now we look closely at outsourcing and the way it is defined under GATS and whether member countries can block access to services being outsourced. "Outsourcing" is not a precise term, and it is not a term or concept that is used in WTO agreements. To the extent that "outsourcing" involves the purchase, by firms of one WTO Member, of services of firms from other WTO Members, "outsourcing" is covered by the MFN obligation (Article II of the GATS) and, depending on the contents of the WTO Member's GATS schedule, commitments on market access (Art. XVI) and national treatment (Art. XVII). This means that, whatever a WTO Member's schedule contains, the Member cannot introduce laws and regulations that discriminate between like "outsourcing" services from different WTO Members (MFN). It also means that, if a WTO Member has agreed to full market access and national treatment commitments in the appropriate services sectors (e.g. telephone call center services, computer programming, legal services), that Member cannot block the "outsourcing" service (because of the market access commitment) or discriminate between "outsourcing" services of foreign origin and like domestic services (because of the national treatment commitment). "Outsourcing" by government agencies for government use is only covered by WTO disciplines under special conditions, and depends on the WTO Member concerned having signed the WTO Government Procurement Agreement. A WTO Member can only restrict "outsourcing" services to the extent that such action is consistent with that Member's MFN, market access and national treatment commitments under the GATS. Should a Member nonetheless restrict "outsourcing" services contrary to its GATS commitments, another Member may bring a WTO dispute settlement action against that Member. At the same time, non-tariff barriers can be created by US and EU in order to try to prevent outsourcing and offshoring of services. The issue of data privacy is a potent weapon in the hands of these countries. In late 1998, the European Union issued a wide-ranging directive that aims to safeguard the privacy of personal data of EU citizens and prevent its misuse worldwide. It is backed by the power to cut off data flows to countries that the EU judges not to have adequate data protection rules and enforcement.
73
The issue could have an impact on developing country exports of data processing services and confronts them with a difficult choice. If they choose not to enact laws deemed adequate, they could be shut off from participation in this growing market. In the absence of such laws and/or a cumbersome legal system, it might be difficult for private firms to credibly commit to meet the required high standards. If they do enact stringent laws, then, unless the laws can be made specific to trade with particular jurisdictions, the result could be an economy wide increase in the costs of doing business22. This coupled with enactment of TUPE 23(Transfer of Undertakings and Protection of Employees) could also have an inhibiting effect on trade. TUPE has been passed in Europe to protect the rights of workers displaced due to outsourcing and thus makes it difficult and cumbersome for the companies to outsource and offshore their work. This kind of law can also be passed in US which can create a non – tariff barrier.
22 If private sector estimates generated in the United States are to be believed, information sharing saves the customers of 90 financial institutions (accounting for 30 percent of industry revenues), $17 billion a year ($195 per average customer household) and 320 million hours annually (4 hours per average customer household) (Glassman, 2000). 23 Pre-empting Protectionism in Services: The GATS and Outsourcing- Mattoo and Wunsuch
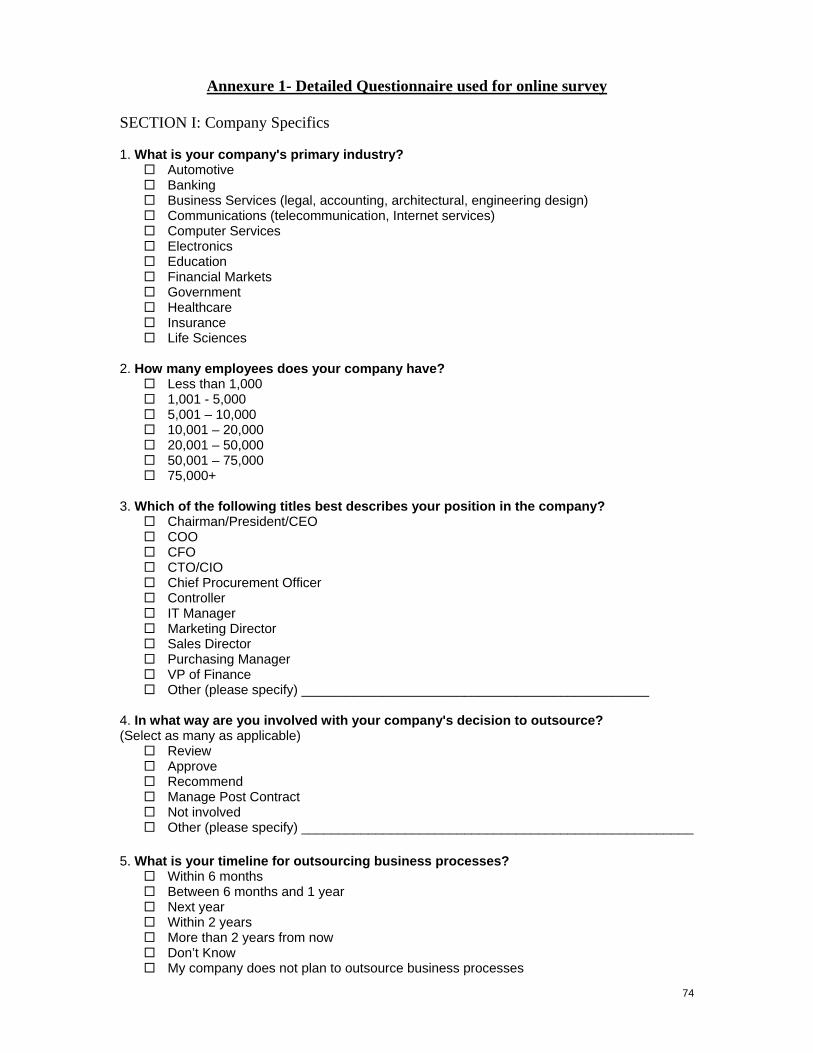
74
Annexure 1- Detailed Questionnaire used for online survey SECTION I: Company Specifics 1. What is your company's primary industry?
Automotive Banking Business Services (legal, accounting, architectural, engineering design) Communications (telecommunication, Internet services) Computer Services Electronics Education Financial Markets Government Healthcare Insurance Life Sciences
2. How many employees does your company have?
Less than 1,000 1,001 - 5,000 5,001 – 10,000 10,001 – 20,000 20,001 – 50,000 50,001 – 75,000 75,000+
3. Which of the following titles best describes your position in the company?
Chairman/President/CEO COO CFO CTO/CIO Chief Procurement Officer Controller IT Manager Marketing Director Sales Director Purchasing Manager VP of Finance Other (please specify) _______________________________________________
4. In what way are you involved with your company's decision to outsource? (Select as many as applicable)
Review Approve Recommend Manage Post Contract Not involved Other (please specify) _____________________________________________________
5. What is your timeline for outsourcing business processes?
Within 6 months Between 6 months and 1 year Next year Within 2 years More than 2 years from now Don’t Know My company does not plan to outsource business processes
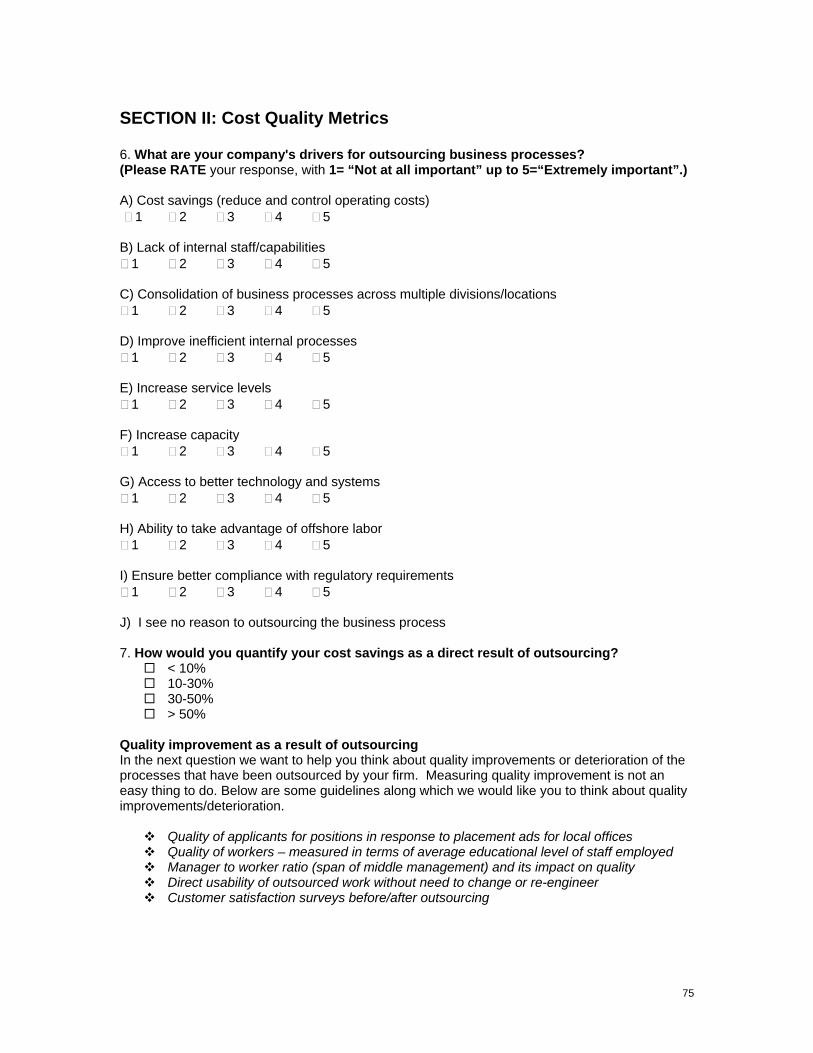
75
SECTION II: Cost Quality Metrics 6. What are your company's drivers for outsourcing business processes? (Please RATE your response, with 1= “Not at all important” up to 5=“Extremely important”.) A) Cost savings (reduce and control operating costs) 1 2 3 4 5 B) Lack of internal staff/capabilities
1 2 3 4 5 C) Consolidation of business processes across multiple divisions/locations
1 2 3 4 5 D) Improve inefficient internal processes
1 2 3 4 5 E) Increase service levels
1 2 3 4 5 F) Increase capacity
1 2 3 4 5 G) Access to better technology and systems
1 2 3 4 5 H) Ability to take advantage of offshore labor
1 2 3 4 5 I) Ensure better compliance with regulatory requirements
1 2 3 4 5 J) I see no reason to outsourcing the business process 7. How would you quantify your cost savings as a direct result of outsourcing?
< 10% 10-30% 30-50% > 50%
Quality improvement as a result of outsourcing In the next question we want to help you think about quality improvements or deterioration of the processes that have been outsourced by your firm. Measuring quality improvement is not an easy thing to do. Below are some guidelines along which we would like you to think about quality improvements/deterioration.
Quality of applicants for positions in response to placement ads for local offices Quality of workers – measured in terms of average educational level of staff employed Manager to worker ratio (span of middle management) and its impact on quality Direct usability of outsourced work without need to change or re-engineer Customer satisfaction surveys before/after outsourcing
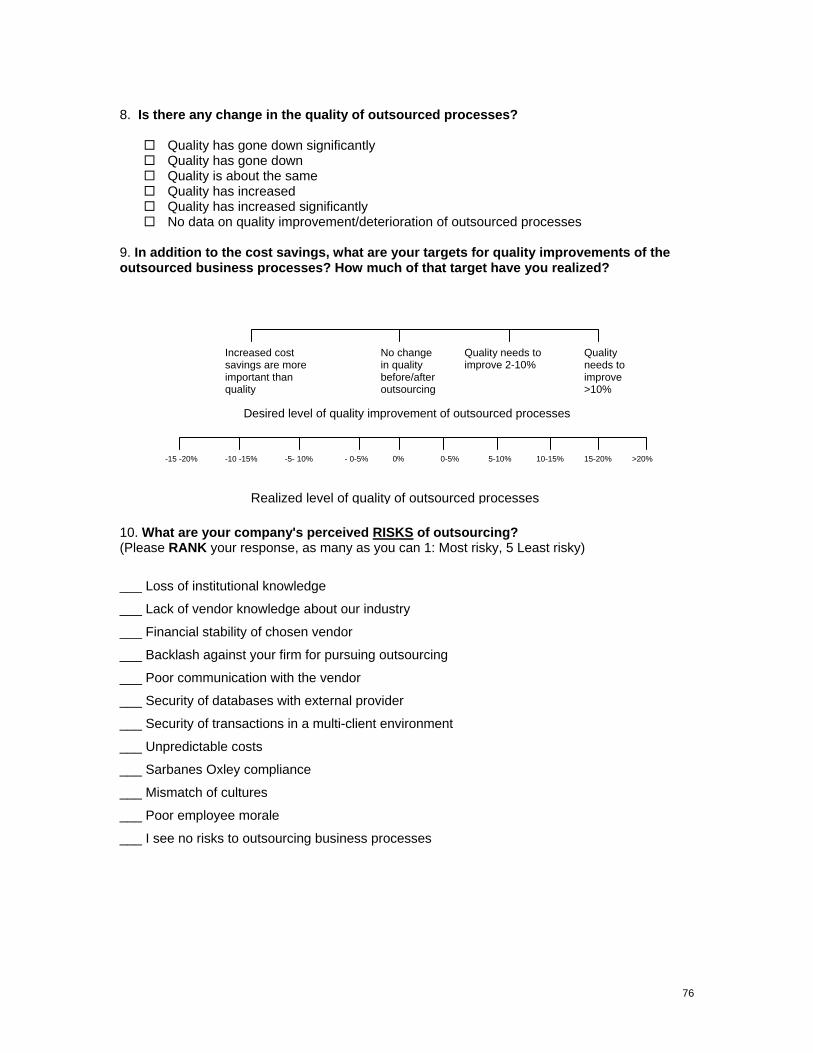
76
8. Is there any change in the quality of outsourced processes?
Quality has gone down significantly Quality has gone down Quality is about the same Quality has increased Quality has increased significantly No data on quality improvement/deterioration of outsourced processes
9. In addition to the cost savings, what are your targets for quality improvements of the outsourced business processes? How much of that target have you realized?
10. What are your company's perceived RISKS of outsourcing? (Please RANK your response, as many as you can 1: Most risky, 5 Least risky)
___ Loss of institutional knowledge
___ Lack of vendor knowledge about our industry
___ Financial stability of chosen vendor
___ Backlash against your firm for pursuing outsourcing
___ Poor communication with the vendor
___ Security of databases with external provider
___ Security of transactions in a multi-client environment
___ Unpredictable costs
___ Sarbanes Oxley compliance
___ Mismatch of cultures
___ Poor employee morale
___ I see no risks to outsourcing business processes
Desired level of quality improvement of outsourced processes
No change in quality before/after outsourcing
Quality needs to improve 2-10%
Quality needs to improve >10%
Increased cost savings are more important than quality
Realized level of quality of outsourced processes
10-15% 15-20% >20% 5-10% 0-5% 0% - 0-5% -5- 10% -10 -15% -15 -20%

77
11. How engaged is your company in outsourcing the following business processes? (Please indicate if "Currently Outsourced," “Actively looking outsource”, "Might Outsource," or "Will Not Outsource." – Tick where applicable)
Currently outsourced
Actively looking outsource Might outsource Will not
outsource
Transaction Management1
General Accounting2
Financial Management3
Financial Reporting4
Financial Analysis5
Tax Consulting
Risk Management6
HR / Payroll processes
Travel expense reimbursement
Customer service7
IT development8
IT support9
1: Accounts payable, accounts receivable, leases, order management and tracking, billing/ customer invoice, customer credit, expense reporting 2: General ledger, cost accounting/ revenue, equity accounting/ debt, statutory accounting, fixed asset accounting, business unit accounting 3: Operating budgets/ forecasts, capital investments, treasury functions, equity financing/ debt, cash management, budgeting, performance analysis, investor relations 4: Financial accounting 5: Financial Analysis (planning, compliance, audits, controversy) 6: Policies and procedures, controls design, controls implementation, internal audit services, business continuity planning, business process risk management 7: Call center 8: Software development, software QA 9: Remote infrastructure management

78
Other ________________________________________________________________________
SECTION III: Outsourcing Process Management 12. What kind of partners/providers are you using for your outsourcing initiatives?
Full service US-based providers Specialized US based providers Offshore based providers Other __________________________________________________________________
13. Which ONE of the following options would your company prefer when outsourcing if the provider's solution included performing the work in the following scenarios?
On site / at company site At an external regional processing center At an offshore (out of country) location Some combination of the above
14. What business model did you use in the outsourced country of choice?
Captive Models: pure captive24 Captive Models: Partnership model25 Outsource model: Pure outsource26 Outsource model: managed outsource27 Build Operate Transfer (BOT) / Joint Venture (JV)28 Inverted BOT29 Other __________________________________________________________________
15. Would you engage an external consulting advisory firm to assist or guide your company with the outsourcing process?
Yes No Maybe Don’t know
16. What phase of the outsourcing process do you feel is the most difficult? (Please RANK your response, as many as you can 1: most difficult, 5 least difficult) ___ Information gathering
___ Strategy formation
___ RFP / Provider Selection
___ Negotiation / Agreements
___ Transition / Implementation
___ Ongoing Operations
___ Internal Communications
___ Exit or renegotiation
24 An internal cost center or a 100% subsidiary set up to execute offshore business processes 25 Strategic alliance with local provider for implementation support services such as infrastructure set-up, recruitment and training 26 Use a local provider to conduct offshore business processes 27 Full-/part time resources locally to facilitate transition, relationship management and transfer of organization and domain knowledge to third party providers 28 Provider-owned/joint operations, transferable to the customer at a pre-determined time 29 Where the local provider provides only implementation support to start with and is allowed to buy in to the entity only upon the center reaching certain milestones

79
___ Other (please specify) ______________________________________________________
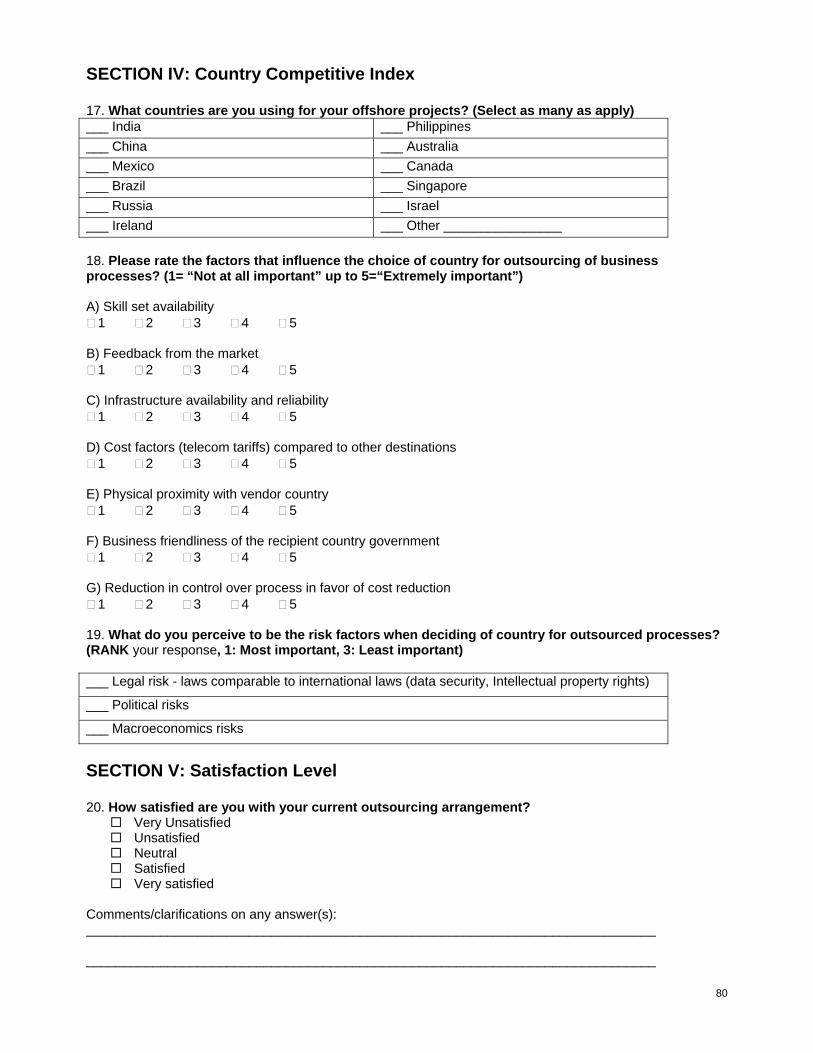
80
SECTION IV: Country Competitive Index 17. What countries are you using for your offshore projects? (Select as many as apply) ___ India ___ Philippines ___ China ___ Australia ___ Mexico ___ Canada ___ Brazil ___ Singapore ___ Russia ___ Israel ___ Ireland ___ Other ________________ 18. Please rate the factors that influence the choice of country for outsourcing of business processes? (1= “Not at all important” up to 5=“Extremely important”) A) Skill set availability
1 2 3 4 5 B) Feedback from the market
1 2 3 4 5 C) Infrastructure availability and reliability
1 2 3 4 5 D) Cost factors (telecom tariffs) compared to other destinations
1 2 3 4 5 E) Physical proximity with vendor country
1 2 3 4 5 F) Business friendliness of the recipient country government
1 2 3 4 5 G) Reduction in control over process in favor of cost reduction
1 2 3 4 5
19. What do you perceive to be the risk factors when deciding of country for outsourced processes? (RANK your response, 1: Most important, 3: Least important) ___ Legal risk - laws comparable to international laws (data security, Intellectual property rights)
___ Political risks
___ Macroeconomics risks
SECTION V: Satisfaction Level 20. How satisfied are you with your current outsourcing arrangement?
Very Unsatisfied Unsatisfied Neutral Satisfied Very satisfied
Comments/clarifications on any answer(s): _____________________________________________________________________________ _____________________________________________________________________________
81
Bibliography Adya, Chetan, “India: Appending Itself to Global Labor Supply Chain”, JM Morgan Stanley Equity Research – February 2004
American Hospital Association, Trendwatch, 2001, Vol 3, No 2 Arora, Rohit, “Economic and Social Impact of Outsourcing on US”, Unpublished Manuscript- January- 2004 Bajpai, Nirupam and Sachs, Jeffrey, “India’s Decade of Development”, CID Working paper no. 46- Harvard University, May 2000. Bajpai, Nirupam and Rajdou, Navi, “Raising the Global Competitiveness of Tamil Nadu's Information Technology Industry”, HIID Working paper - Harvard University, October 1999 Basu, Indrajit, Asia Times, “India sees bright side to US outsourcing threat”, http://www.atimes.com/atimes/South_Asia/FA27Df06.html Basu, Indrajit, “India's software pros face global ire”, Asia Times http://www.atimes.com/atimes/South_Asia/EC13Df03.html BROWN, KEN, “The Wall Street Journal, Offshore Outsourcing Will Increase, Poll Finds”, http://online.wsj.com/article_print/0,,SB108025866449965891,00.html BLS 2002 Occupational Employment and Wage Estimates Bureau of Labor Statistics – Business Employment Dynamics Data- www.bls.gov/proghome.htm Bureau of Labor Statistics, Table A, National employment and wage data from the Occupational Employment Statistics survey by occupation, 2002 Business Roundtable, “Securing Growth and Jobs- Improving US Prosperity in a Worldwide Economy”–– March 2004 Chamber of Commerce of the United States, A Special Report – “Jobs, Trade, Sourcing and Future of the American Workforce”: April 2004 Chicago Tribune, “Where are the jobs?” http://www.chicagotribune.com/news/opinion/chi-0403280305mar28,1,4984001.story Craumer, Martha, Outsourcing: It's Not Just About Cost Cutting, Harvard Business School Working Knowledge http://hbswk.hbs.edu/item.jhtml?id=3022&t=operations&noseek=one Devraj, Ranjit, “Sting in the tail of US outsourcing ban”, Asia Times http://www.atimes.com/atimes/South_Asia/FA30Df05.html Economist, “The great hollowing-out myth”, Feb 19th 2004 http://www.economist.com/agenda/displayStory.cfm?story_id=2454530 Evalueserve-“The Economic Impact of Global Sourcing on the US”: 2003 - 2010 –
82
Far Eastern Economic Review, “Dancing With Giants”, 8 April 2004 FIORINA,CARLY,“The Wall Street Journal, Be Creative, Not Protectionist”, , February 13, 2004 http://online.wsj.com/article/0,,SB107663585610229125,00.html Gonsalves Antone, “Security Pipeline, Overseas Outsourcing Leads To Identity Theft Risks”, http://www.securitypipeline.com/showArticle.jhtml?articleID=17603278 Gumpert, David E, Businessweek, “Misadventures in Indian Outsourcing”, Businessweek http://www.businessweek.com/smallbiz/content/apr2004/sb2004041_5674.htm Grossman, Gene M, Helpman, Elhanan, “Outsourcing in a Global Economy”, National Bureau of Economic Research, January 2002 Johnson Keller Lauren, “Outsmarting with Outsourcing”, Harvard Business School Working Knowledge http://hbswk.hbs.edu/item.jhtml?id=3820&t=operations Kirkegaard, Jacob F, “Outsourcing - Stains on the White Collar?”, IIE – 2004
Kletzer, Lori G, “A Prescription to Relieve Worker Anxiety”, February 2001 Kletzer, Lori G, “Measuring the Costs of Trade-Related Job Loss”, July 2001 KOLAWA,ADAM,“The Wall Street Journal, Outsourcing Is Not the Enemy”, February 24, 2004; Page B2 http://online.wsj.com/article/0,,SB107759212164937450,00.html LIESMAN, STEVE, “U.S. Tax Code Provisions Encourage Offshore Jobs”, The Wall Street Journal, April 1, 2004 http://online.wsj.com/article/0,,SB107904148013253023,00.html MAHER,KRIS,“Next on the Outsourcing List”,The Wall Street Journal , March 23, 2004; Page B1 http://online.wsj.com/article/0,,SB107999444707862153,00.html MAHER, KRIS ,“The Wall Street Journal, What to Do if You Fear Your Job May Go Abroad”, March 23, 2004; Page B8 http://online.wsj.com/article/0,,SB108000175557662399,00.html Mann, Catherine, Dr. “Global Sourcing & High-Tech Jobs: Productivity Gains & Policy Challenges” McCarthy, John, “3.3 Million US Service Jobs Go To Offshore”, Forrester Research, November, 2002 NASSCOM Newsline, http://www.nasscom.org/bponewsline/ OECD Employment Handbook, 2002
83
OECD study –“The characteristics and quality of service sector jobs”– 2001 Pharus Advisors, “Observations and Trends in the Business Process Outsourcing Industry”, -2004 PHILLIPS, MICHAEL M., “More Work Is Outsourced to U.S. Than Away From It”, The Wall Street Journal, Data Show, http://online.wsj.com/article/0,,SB107919804320754591,00.html?mod=2_1073_1 Pink, Daniel H., “The New Face of the Silicon Age”, Wired http://www.wired.com/wired/archive/12.02/india_pr.html Roach, Stephen, “India’s Awakening”– Morgan Stanley Equity Research Global April -2004 Roach, Stephen, “Outsourcing, Protectionism, and the Global Labor Arbitrage”, Morgan Stanley Equity Research Global November- 2003 Roach, Stephen, “Offshoring - Myth and Reality”, Morgan Stanley Equity Research Global March – 2004 Roach, Stephen, “Pondering Asia”, Morgan Stanley Equity Research Global- April- 2004 Roberts, Paul Craig, “Outsourcing: A New Occupational Hazard”, NewsMax http://www.newsmax.com/archives/articles/2004/3/10/85505.shtml SCHROEDER, MICHAEL,“Outsourcing May Create U.S. Jobs”, The Wall Street Journal, March 30, 2004; Page A2 http://online.wsj.com/article/0,,SB108060509775368478,00.html The Wall Street Journal, “Competitive Edge of U.S. Is at Stake in the R&D Arena”, March 17, 2004; Page A4 http://online.wsj.com/article/0,,SB107947826640557230,00.html The Wall Street Journal, “Lesson in India: Not Every Job Translates Overseas” - March 3, 2004; Page A1 http://online.wsj.com/article/0,,SB107826873734544603,00.html Sharma, Anil, Challenges ahead for India's IT boom, Asia Times http://www.atimes.com/atimes/South_Asia/EH01Df04.html Srivastava, Siddharth, Asia Times, “US and UK beg to differ”, http://www.atimes.com/atimes/South_Asia/FC02Df05.html Siddharth, Srivastava , “If only Indians would talk like Americans”, Asia Times, http://www.atimes.com/atimes/South_Asia/FA08Df04.html Sirohi ,Seema , “Indian IT professionals targeted in US”, Asia Times http://www.atimes.com/atimes/South_Asia/EG23Df04.html Swann ,Christopher,“Economists enter war of words on outsourcing”, Financial Times, Apr 01,2004 http://search.ft.com/search/article.html?id=040401007483

84
The Wall Street Journal, 'Benedict Arnold' CEOs, February 12, 2004 http://online.wsj.com/article/0,,SB107654794536227752,00.html?mod=opinion%5Feurope%5Freview%5Fand%5Foutlooks US Census Bureau US Congressional Budget Office Report – 2002 WRISTON,WRISTON, “The Wall Street Journal,Ever Heard of Insourcing?”,March 24, 2004; Page A20 http://online.wsj.com/article/0,,SB108009765048763855,00.html