Embed Size (px)
Citation preview
WORKSHOP ON SCANNER DATAGeneva
10 May 2010
Joint presentation by
Ragnhild Nygaard (Statistics Norway)
and
Heymerik van der Grient (Statistics Netherlands)
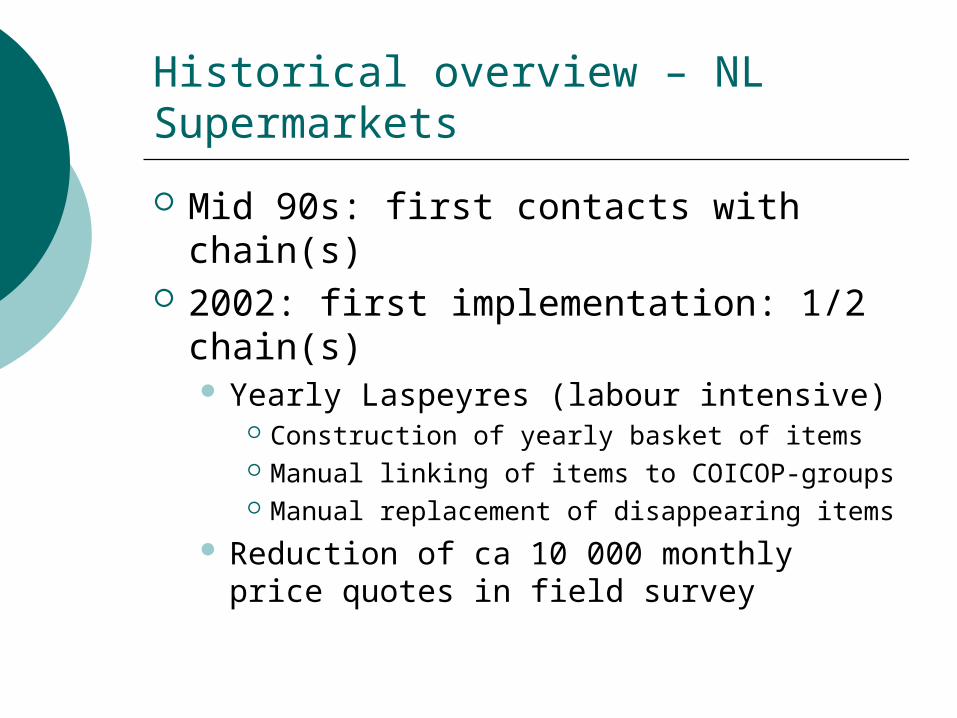
Historical overview – NL Supermarkets
Mid 90s: first contacts with chain(s) 2002: first implementation: 1/2
chain(s) Yearly Laspeyres (labour intensive)
Construction of yearly basket of items Manual linking of items to COICOP-groups Manual replacement of disappearing items
Reduction of ca 10 000 monthly price quotes in field survey
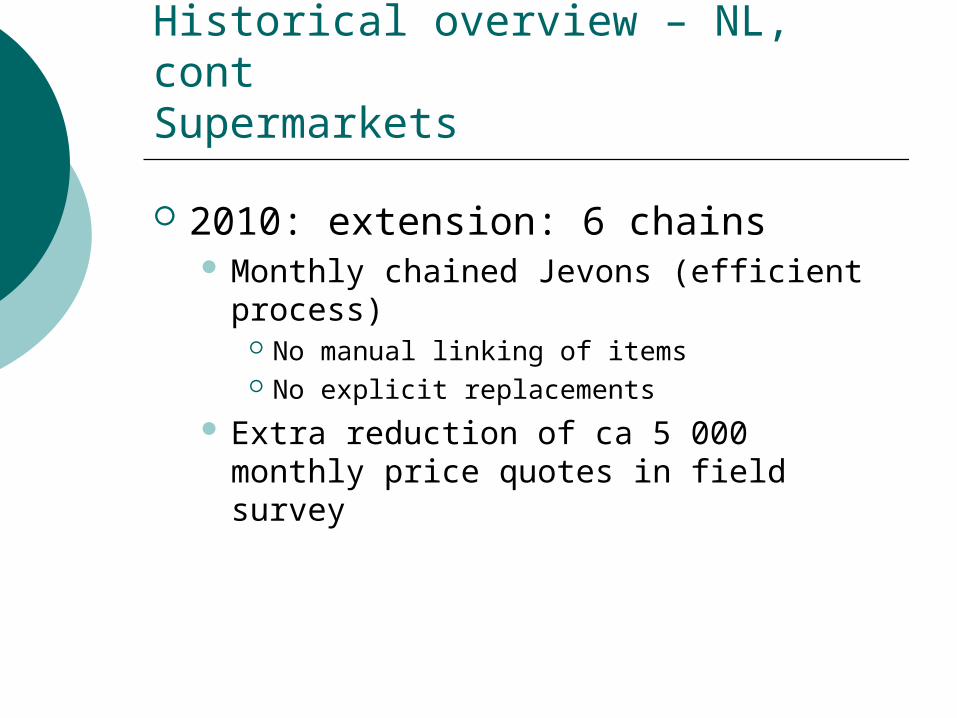
Historical overview – NL, cont Supermarkets
2010: extension: 6 chains Monthly chained Jevons (efficient
process) No manual linking of items No explicit replacements
Extra reduction of ca 5 000 monthly price quotes in field survey
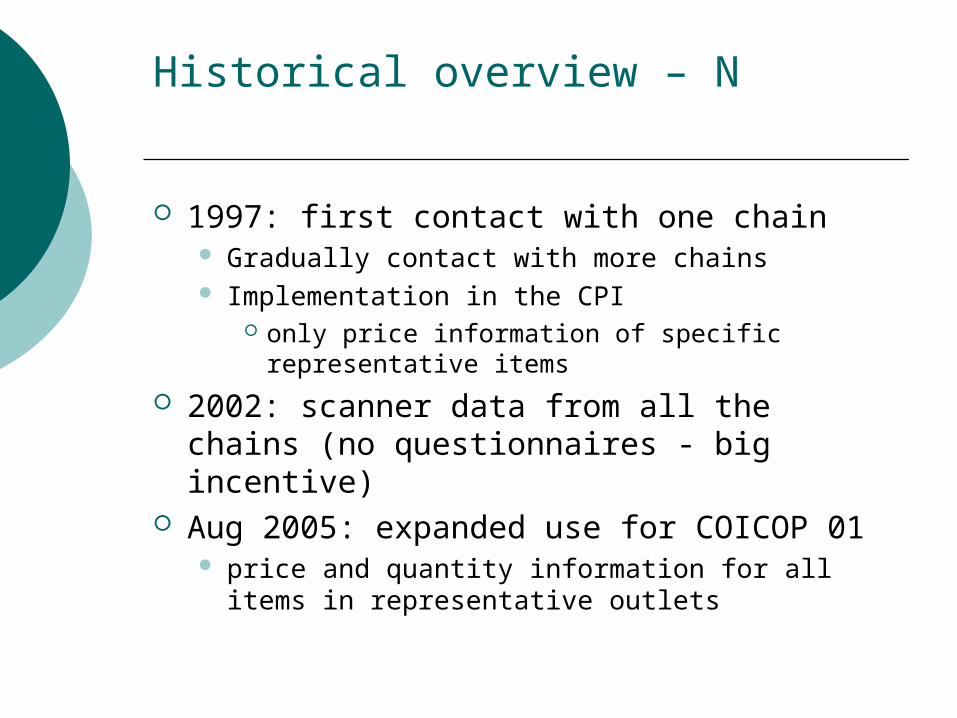
Historical overview – N
1997: first contact with one chain Gradually contact with more chains Implementation in the CPI
only price information of specific representative items
2002: scanner data from all the chains (no questionnaires - big incentive)
Aug 2005: expanded use for COICOP 01 price and quantity information for all items in
representative outlets
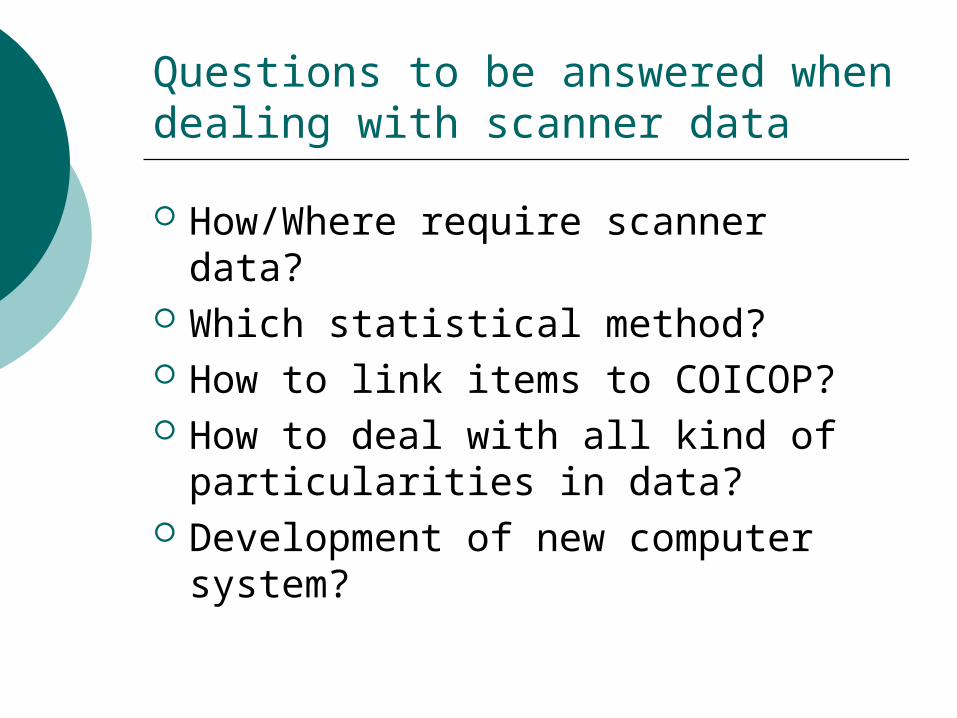
Questions to be answered when dealing with scanner data
How/Where require scanner data? Which statistical method? How to link items to COICOP? How to deal with all kind of
particularities in data? Development of new computer
system?
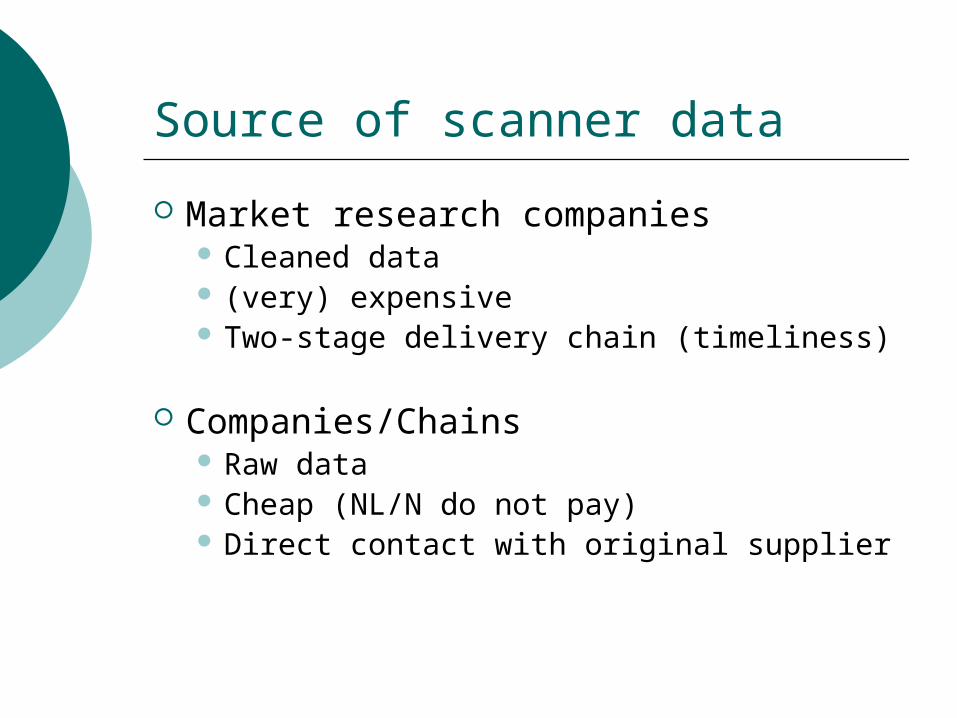
Source of scanner data
Market research companies Cleaned data (very) expensive Two-stage delivery chain (timeliness)
Companies/Chains Raw data Cheap (NL/N do not pay) Direct contact with original supplier
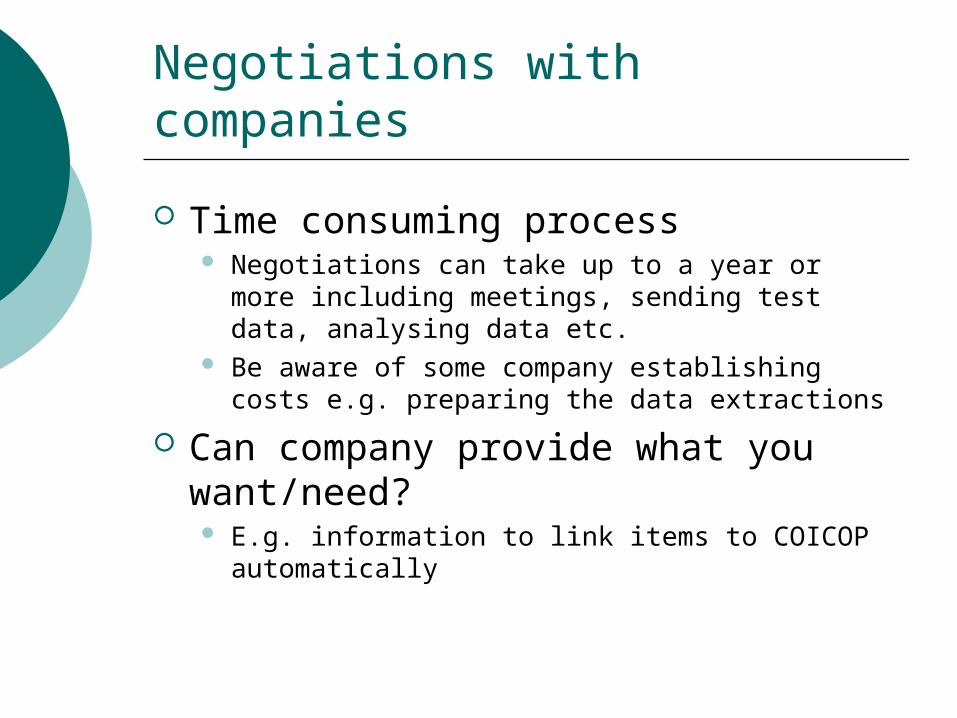
Negotiations with companies
Time consuming process Negotiations can take up to a year or more
including meetings, sending test data, analysing data etc.
Be aware of some company establishing costs e.g. preparing the data extractions
Can company provide what you want/need? E.g. information to link items to COICOP
automatically
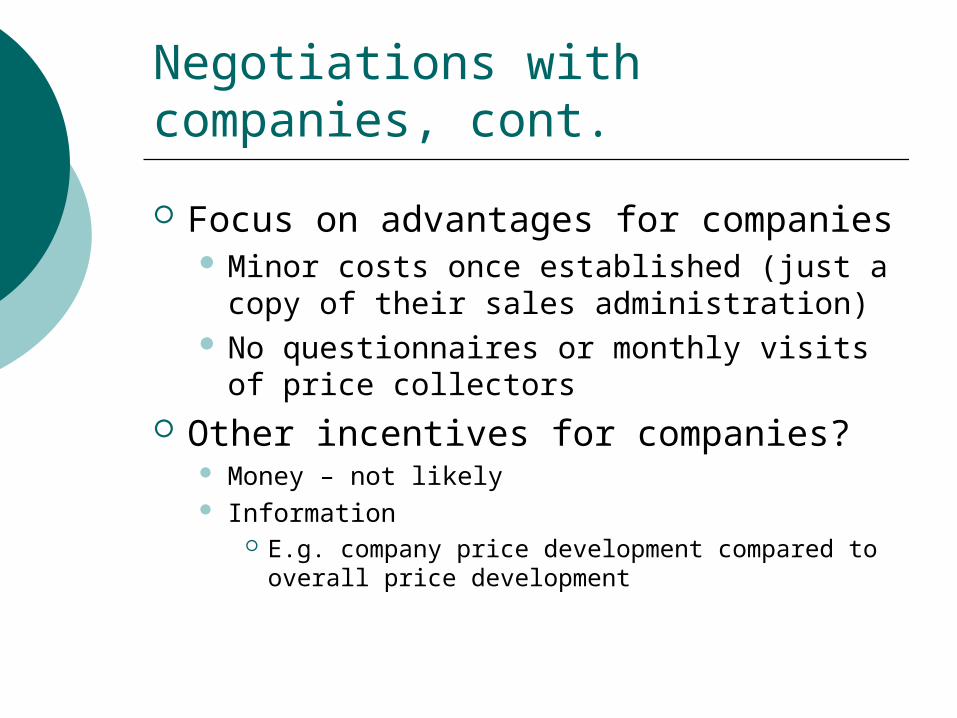
Negotiations with companies, cont.
Focus on advantages for companies Minor costs once established (just a copy
of their sales administration) No questionnaires or monthly visits of
price collectors Other incentives for companies?
Money – not likely Information
E.g. company price development compared to overall price development
Negotiations with companies, cont.
Establishing good routines with the companies are essential Strict time schedules No changes in formats when
implemented
Pre - production work
Take your time analyzing the data Enormous amount of data
N: Over 300 000 price observations each month divided into about 14 000 items
Build shadow system (prototype) Compare the new price indexes based on
scanner data with the old method for a certain period of time before implementation
Discover possible problems in advance Unexpected situations will arise for sure
Pre - production work
Ideas for analysing the data: Is same EAN always same item? Extreme price changes Specific price development at beginning or end
life cycle EAN structurally Risk of bias!
All kind of dynamics in data Missing prices Do properties of data change over time Etc
Methodology / IT-system
Find methodology that: Delivers good indexes (e.g. no bias) Can deal with all particularities in data
Build IT-system that supports the chosen methodology
Learn from experiences other countries using scanner data
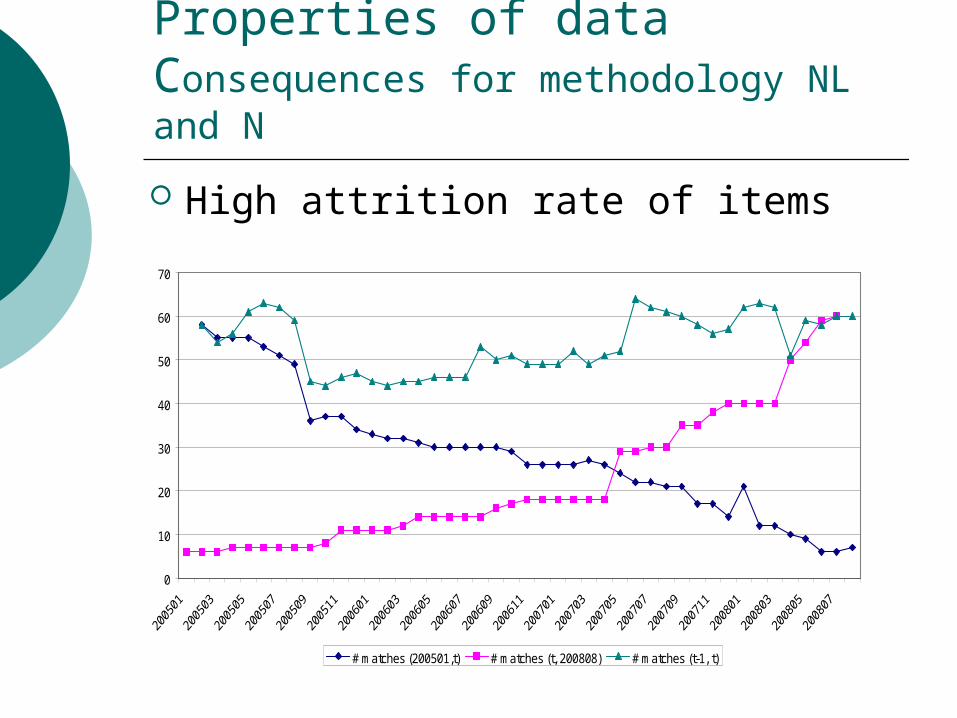
Properties of dataConsequences for methodology NL and N
High attrition rate of items
0
10
20
30
40
50
60
70
# matches (200501,t) # matches (t, 200808) # matches (t-1, t)
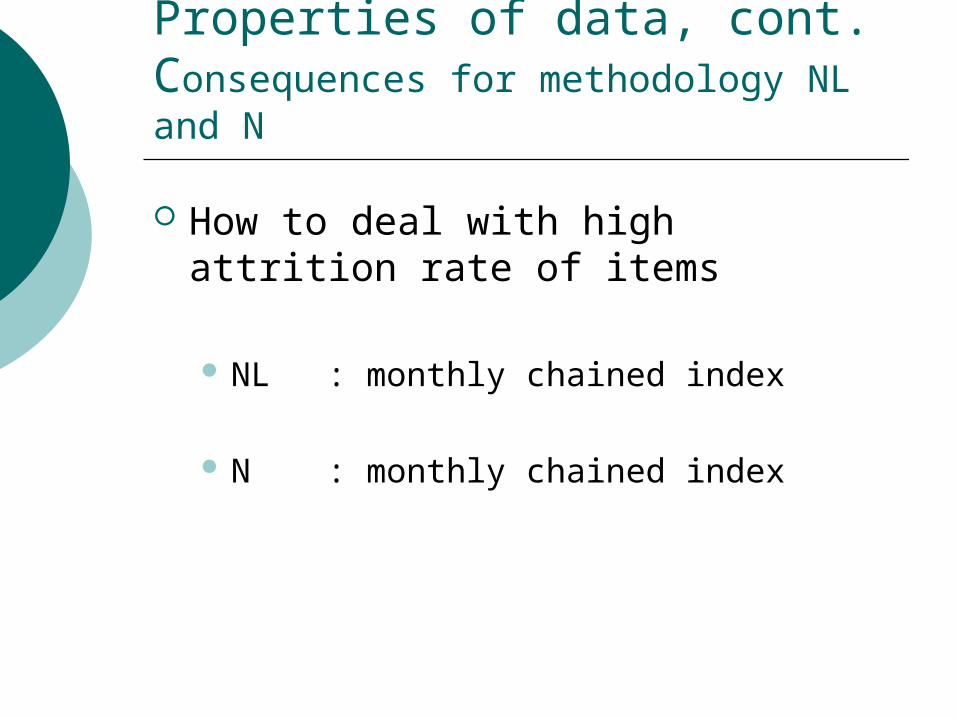
Properties of data, cont.Consequences for methodology NL and N
How to deal with high attrition rate of items
NL : monthly chained index
N : monthly chained index
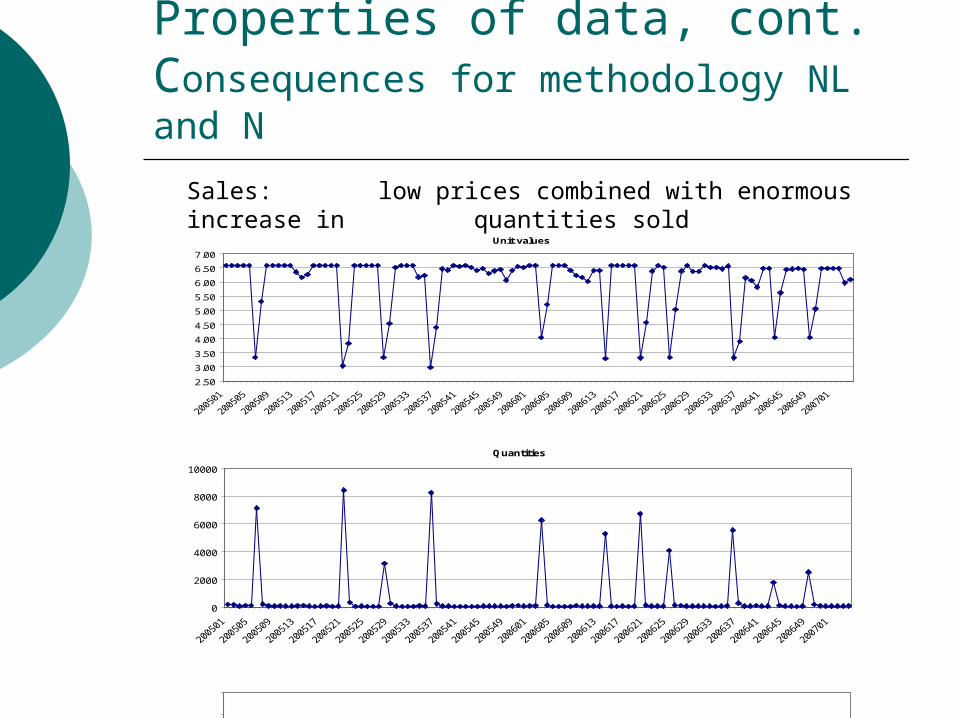
Properties of data, cont.Consequences for methodology NL and N
Unit values
2.50
3.00
3.50
4.00
4.50
5.00
5.50
6.00
6.50
7.00
0
5000
10000
15000
20000
25000
30000
Quantities
0
2000
4000
6000
8000
10000
Sales: low prices combined with enormous increase in quantities sold
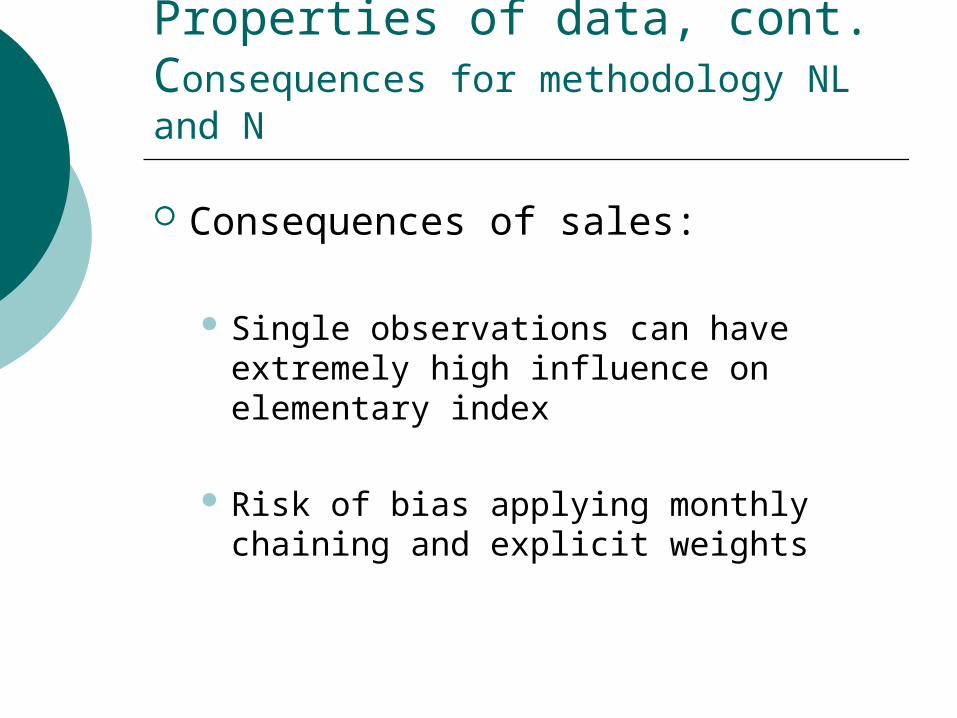
Properties of data, cont.Consequences for methodology NL and N
Consequences of sales:
Single observations can have extremely high influence on elementary index
Risk of bias applying monthly chaining and explicit weights
Properties of data, cont.Consequences for methodology NL and N
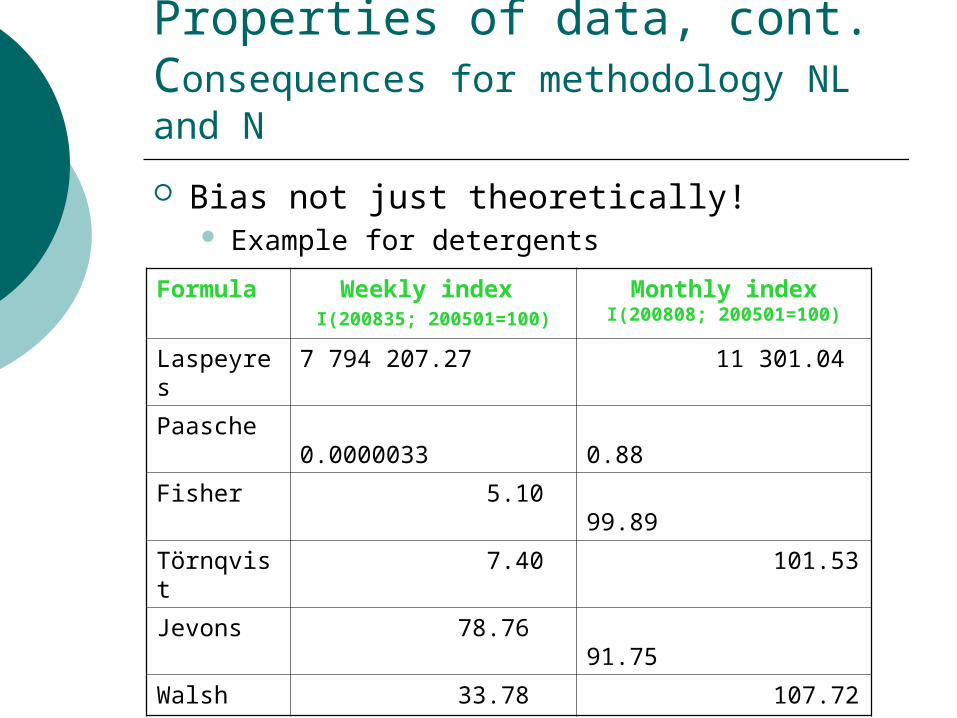
Bias not just theoretically! Example for detergents
Formula Weekly index I(200835; 200501=100)
Monthly index I(200808; 200501=100)
Laspeyres 7 794 207.27 11 301.04
Paasche 0.0000033 0.88
Fisher 5.10 99.89
Törnqvist 7.40 101.53
Jevons 78.76 91.75
Walsh 33.78 107.72
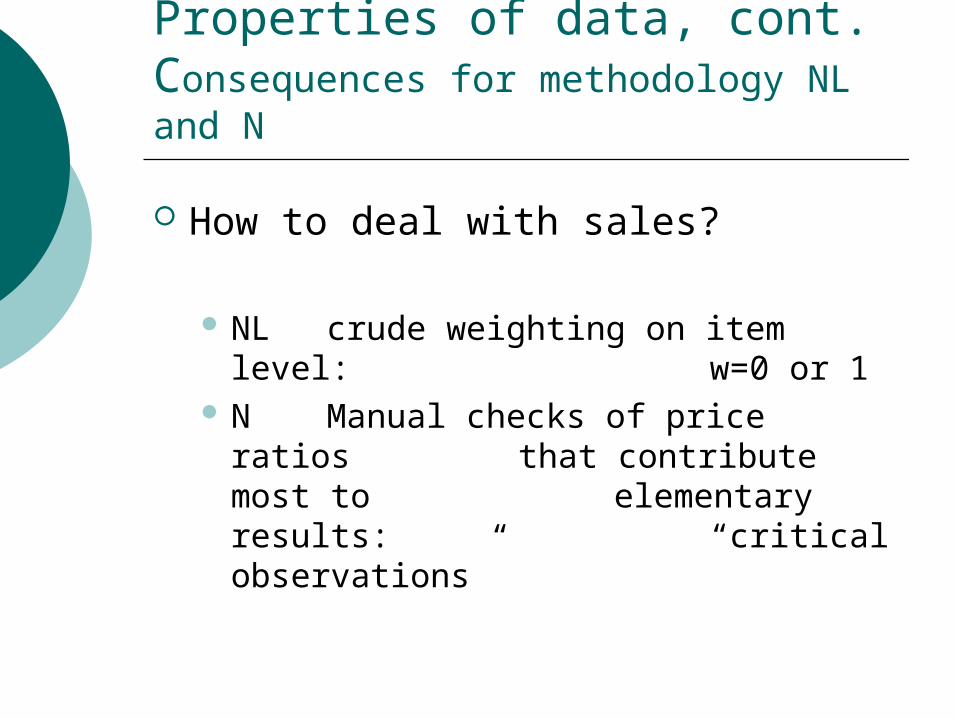
Properties of data, cont.Consequences for methodology NL and N
How to deal with sales?
NL crude weighting on item level: w=0 or 1
N Manual checks of price ratios that contribute most to
elementary results: “critical
observations”
Properties of data, cont.Consequences for methodology NL and N
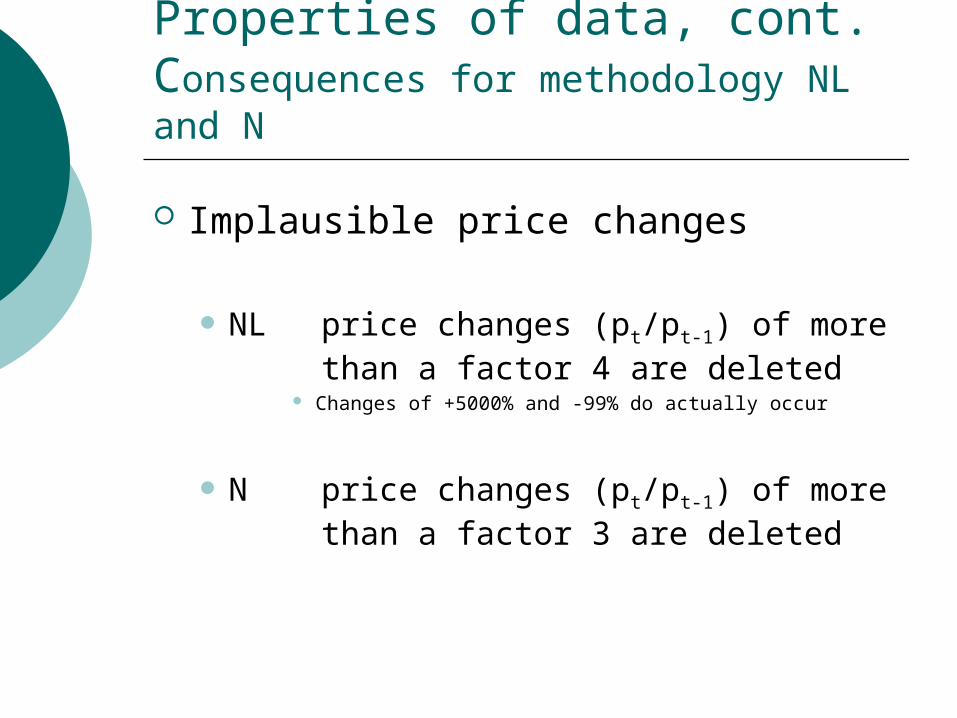
Implausible price changes
NL price changes (pt/pt-1) of more than a factor 4 are deleted
Changes of +5000% and -99% do actually occur
N price changes (pt/pt-1) of more than a factor 3 are deleted
Properties of data, cont.Consequences for methodology NL and N
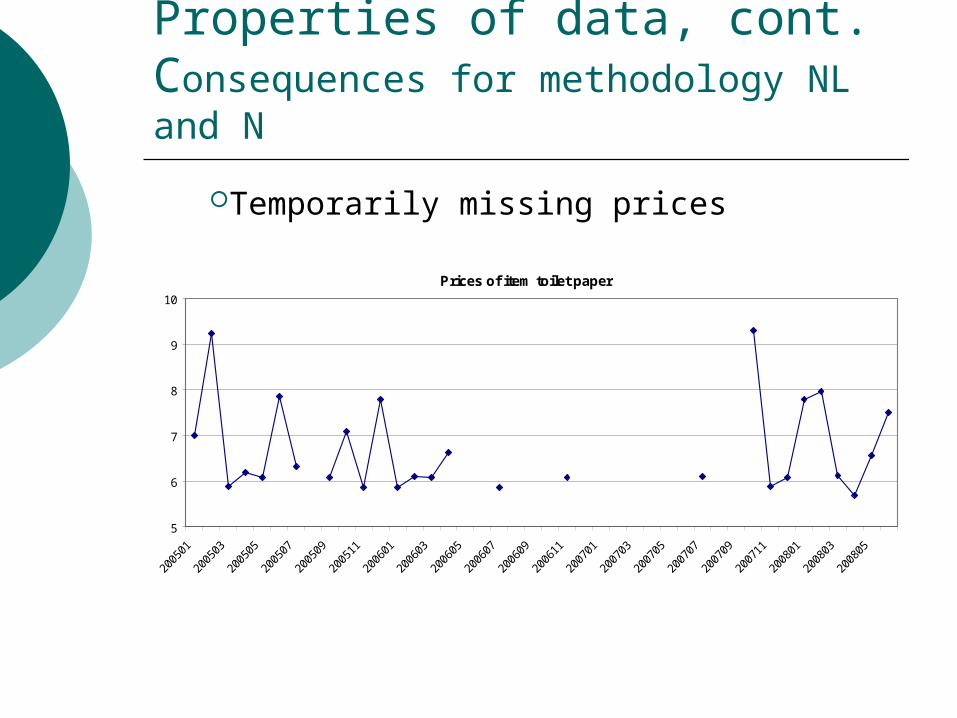
Prices of item toilet paper
5
6
7
8
9
10
Temporarily missing prices
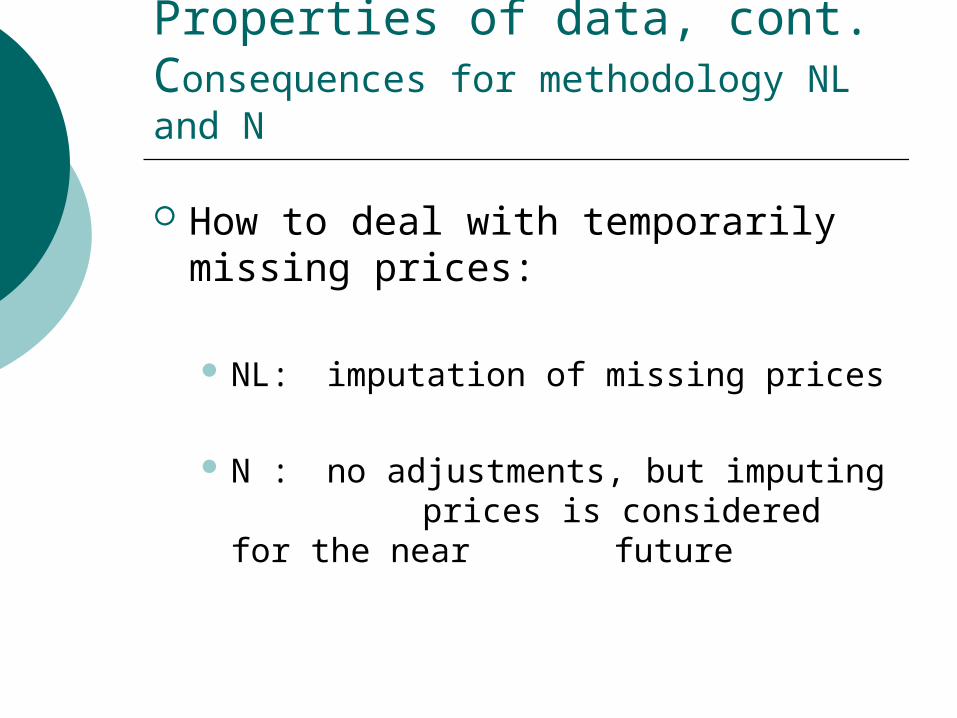
Properties of data, cont.Consequences for methodology NL and N
How to deal with temporarily missing prices:
NL: imputation of missing prices
N : no adjustments, but imputing prices is considered for the
near future
Properties of data, cont.Consequences for methodology NL and N
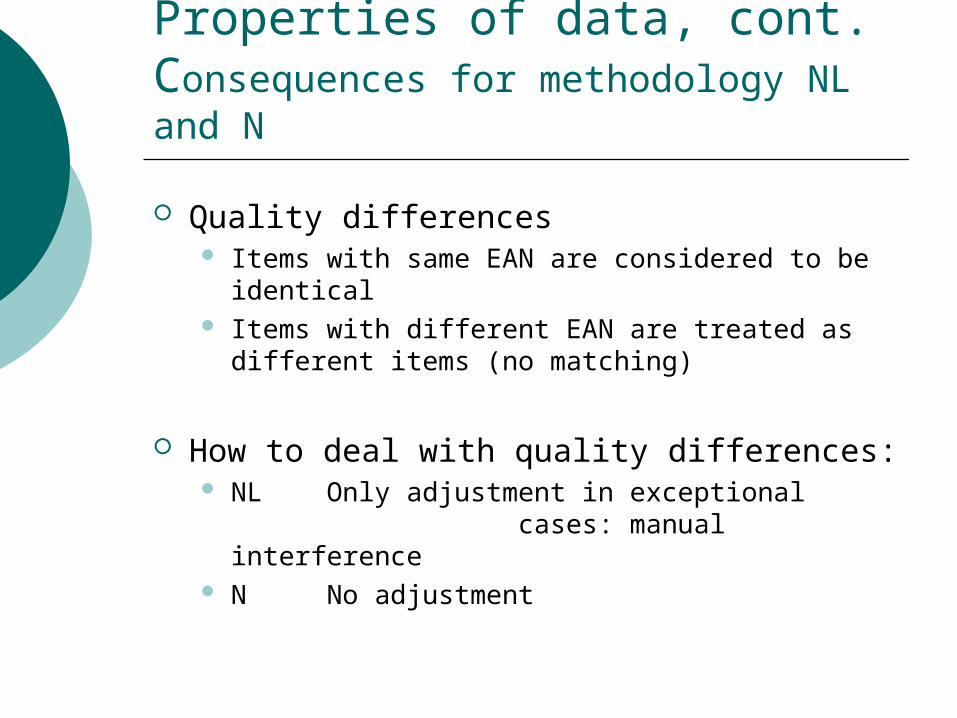
Quality differences Items with same EAN are considered to be
identical Items with different EAN are treated as different
items (no matching)
How to deal with quality differences: NL Only adjustment in exceptional
cases: manual interference N No adjustment
Actual method - NL
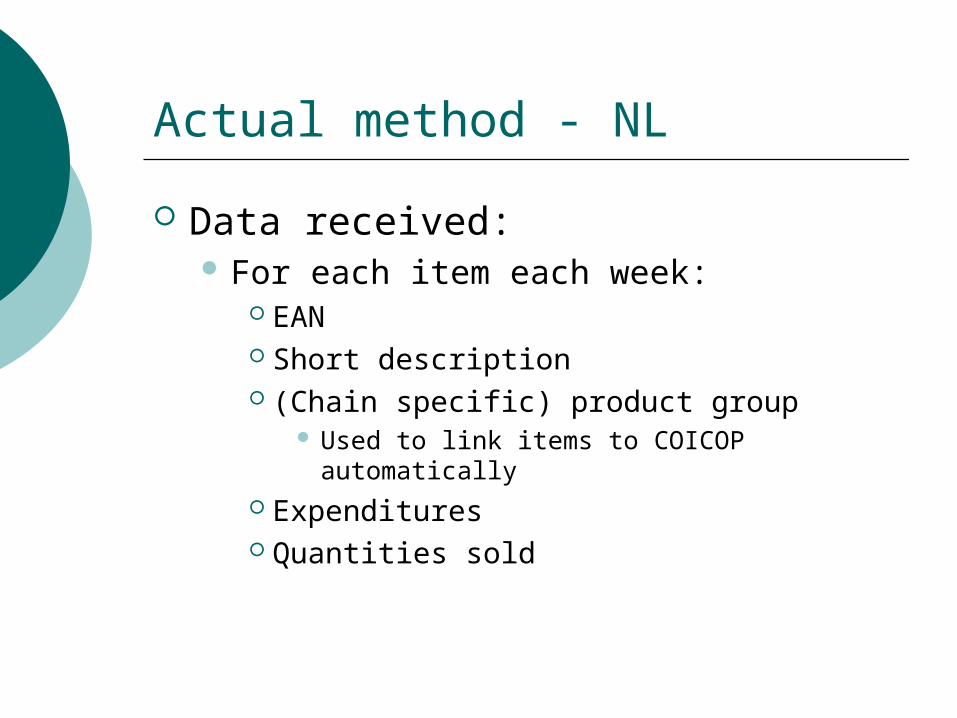
Data received: For each item each week:
EAN Short description (Chain specific) product group
Used to link items to COICOP automatically Expenditures Quantities sold
Actual method – NL, cont.
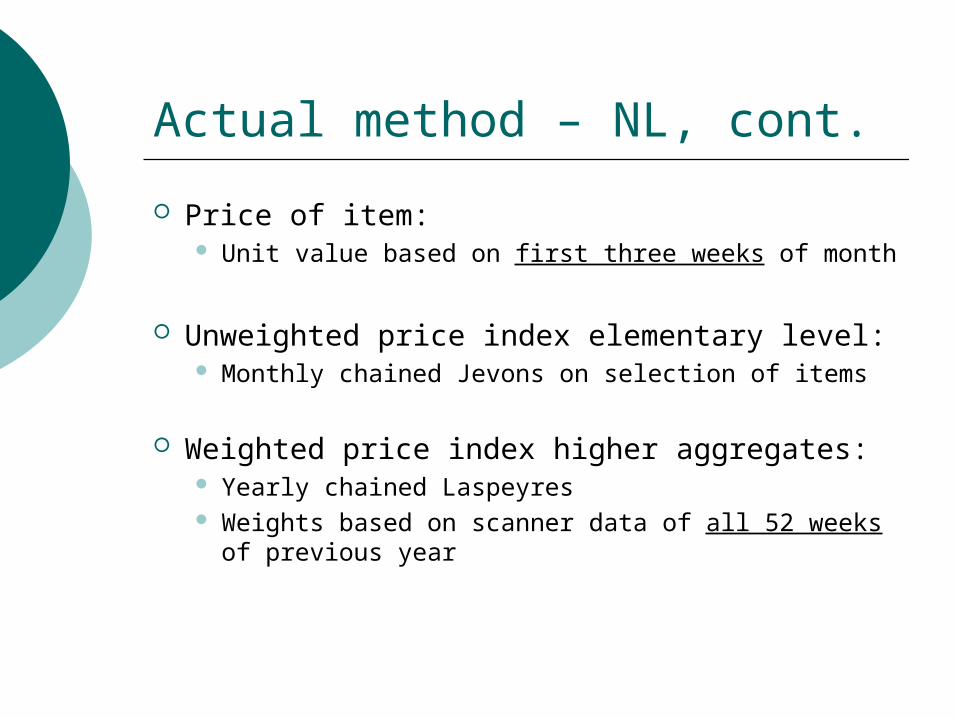
Price of item: Unit value based on first three weeks of month
Unweighted price index elementary level: Monthly chained Jevons on selection of items
Weighted price index higher aggregates: Yearly chained Laspeyres Weights based on scanner data of all 52 weeks
of previous year
Actual method – NL, cont.
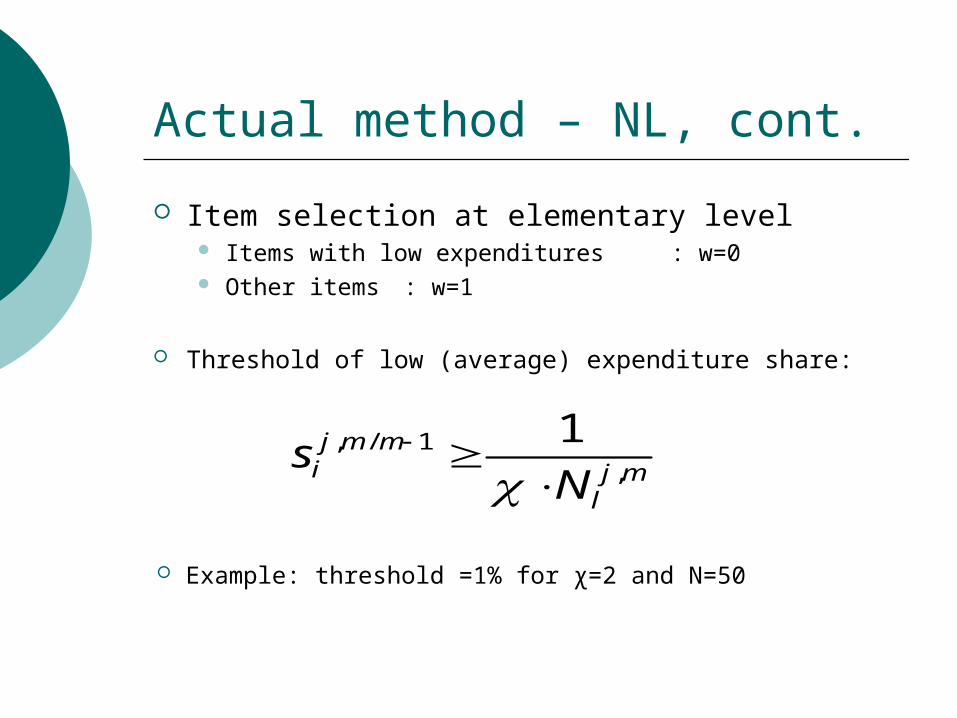
Item selection at elementary level Items with low expenditures : w=0 Other items : w=1
Threshold of low (average) expenditure share:
mjl
mmji Ns
,1/, 1
Example: threshold =1% for χ=2 and N=50
Actual method – NL, cont.
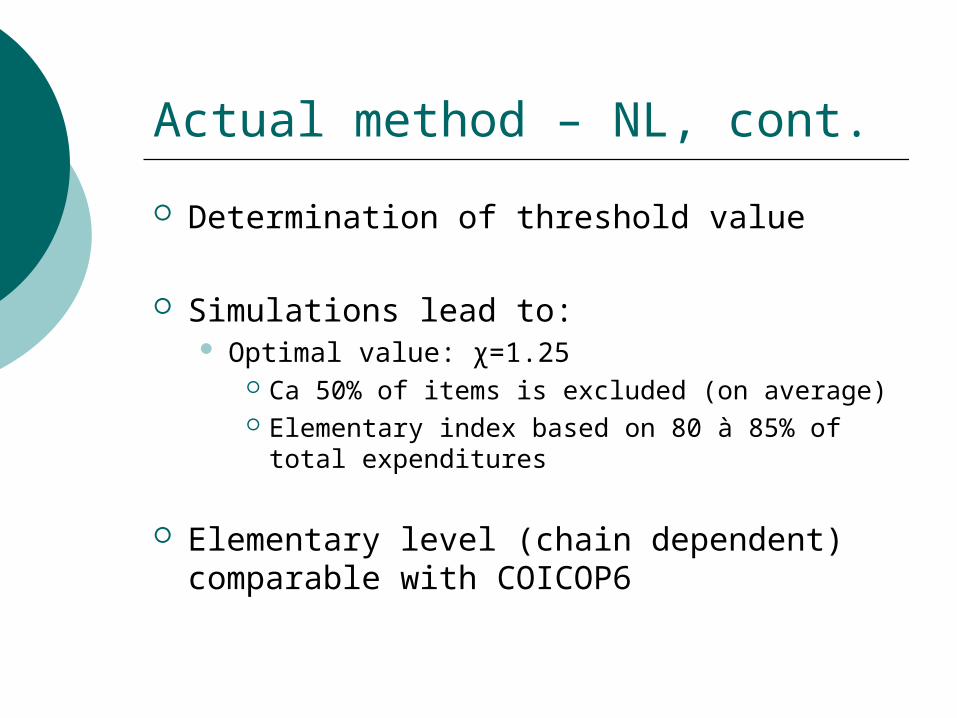
Determination of threshold value
Simulations lead to: Optimal value: χ=1.25
Ca 50% of items is excluded (on average) Elementary index based on 80 à 85% of total
expenditures
Elementary level (chain dependent) comparable with COICOP6
Actual method – NL, cont.
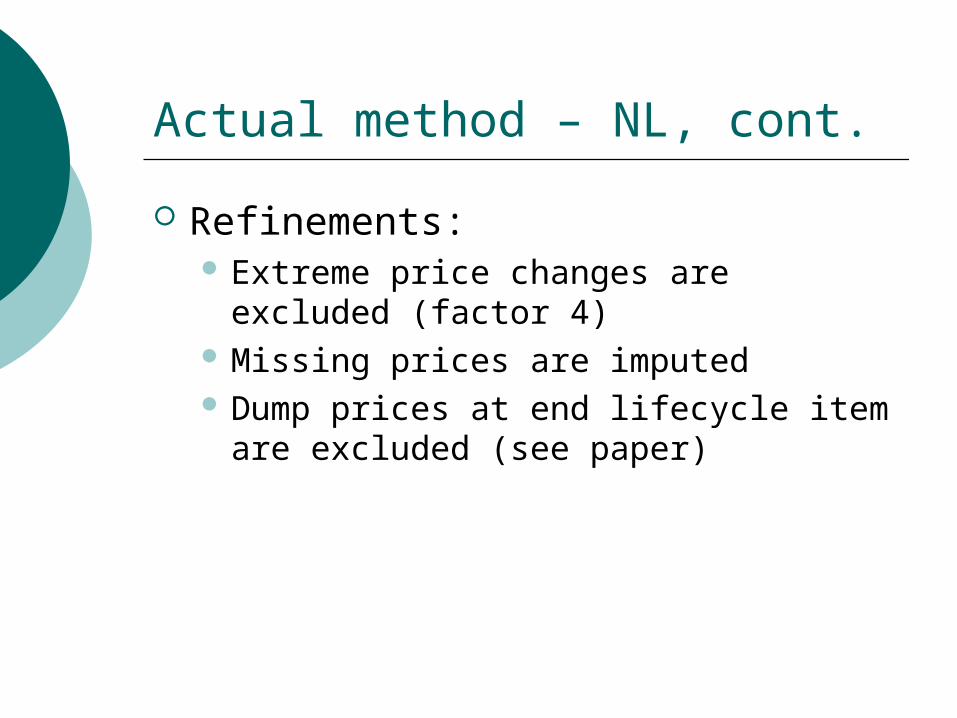
Refinements: Extreme price changes are excluded
(factor 4) Missing prices are imputed Dump prices at end lifecycle item are
excluded (see paper)
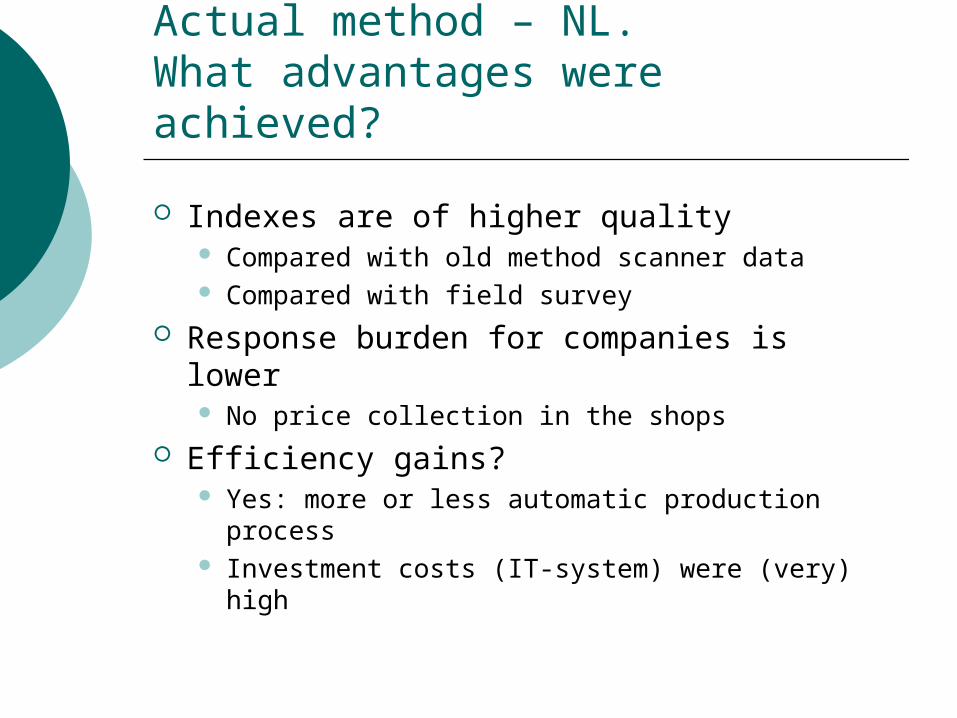
Actual method – NL.What advantages were achieved?
Indexes are of higher quality Compared with old method scanner data Compared with field survey
Response burden for companies is lower No price collection in the shops
Efficiency gains? Yes: more or less automatic production
process Investment costs (IT-system) were (very) high
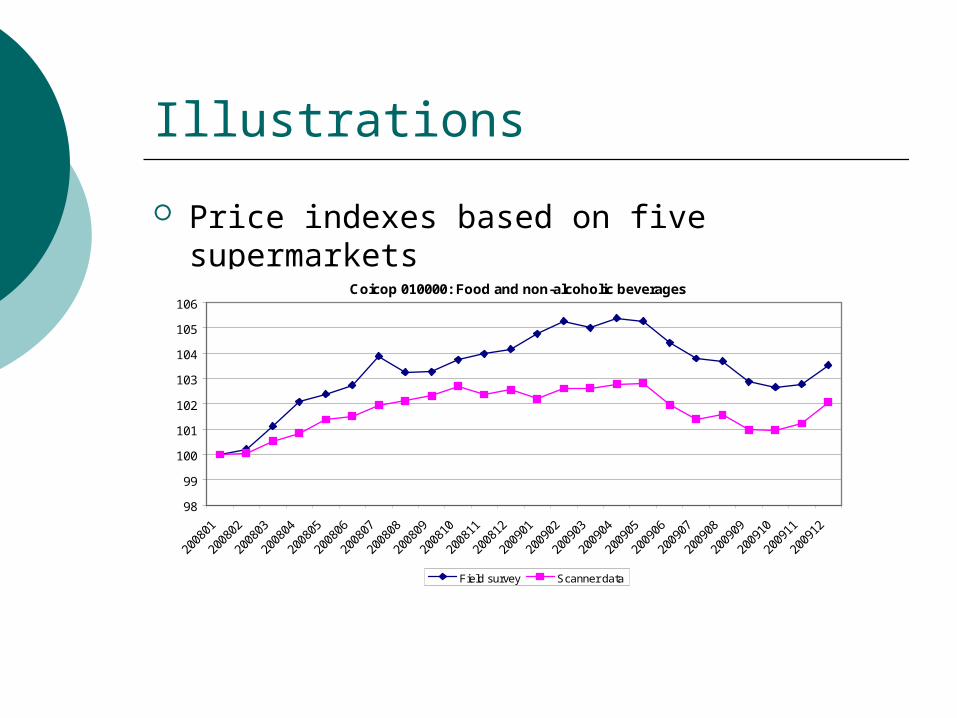
Illustrations
Price indexes based on five supermarkets
Coicop 010000: Food and non-alcoholic beverages
98
99
100
101
102
103
104
105
106
Field survey Scanner data
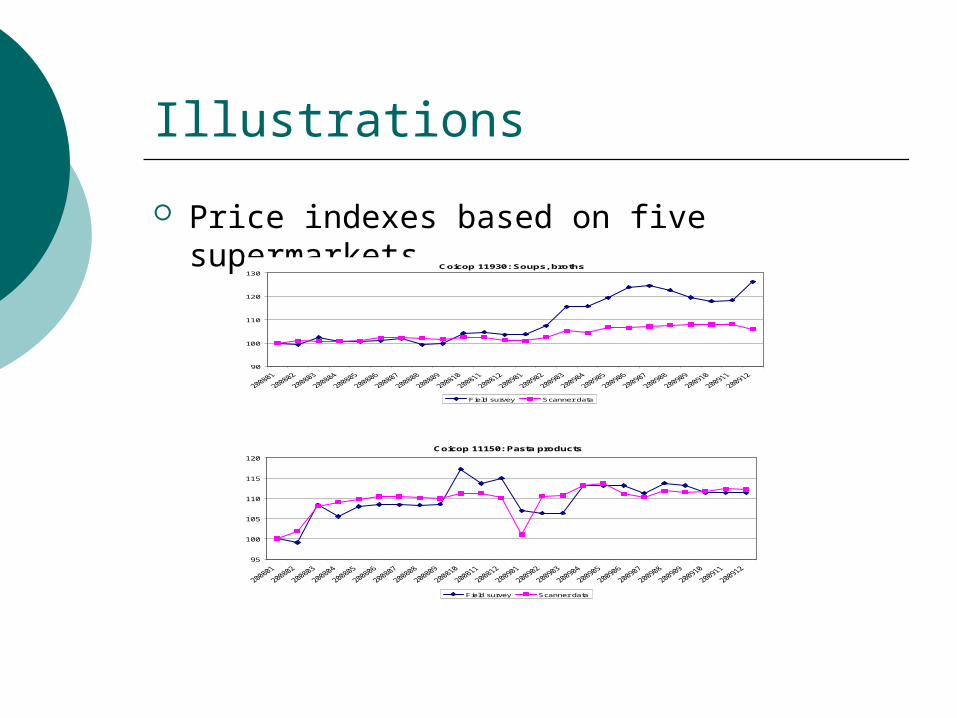
Illustrations
Price indexes based on five supermarketsCoicop 11930: Soups, broths
90
100
110
120
130
Field survey Scanner data
Coicop 11150: Pasta products
95
100
105
110
115
120
Field survey Scanner data
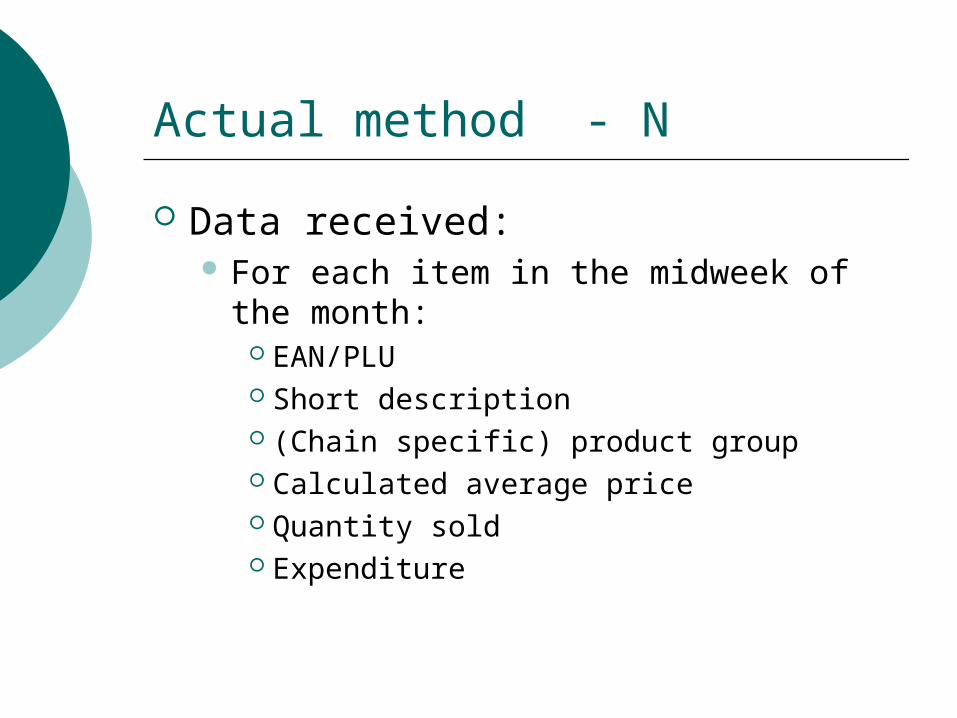
Actual method - N
Data received: For each item in the midweek of the
month: EAN/PLU Short description (Chain specific) product group Calculated average price Quantity sold Expenditure
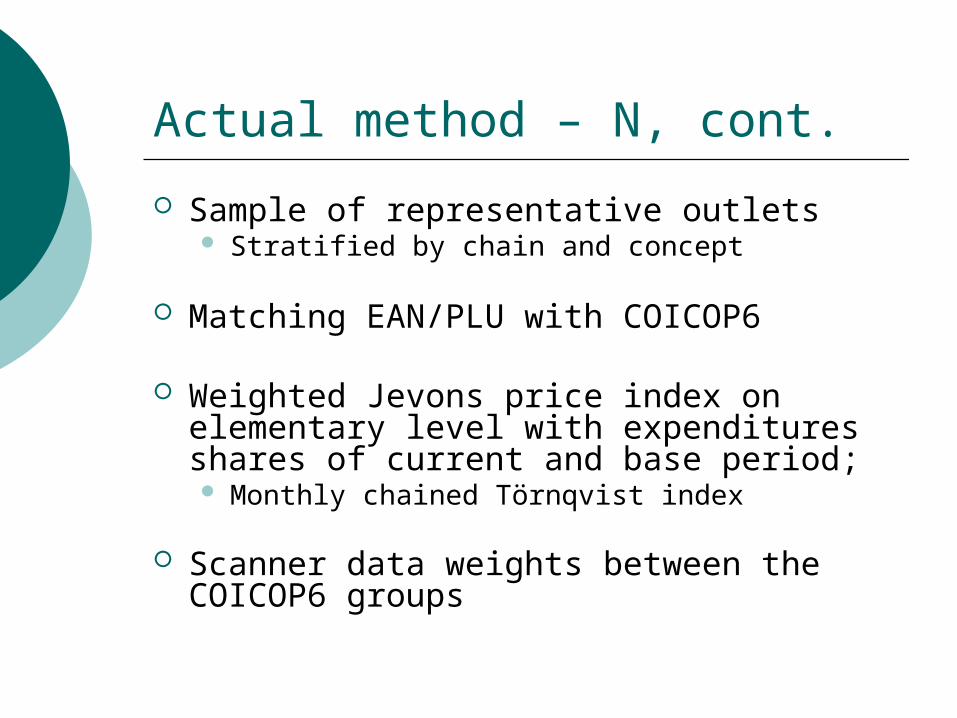
Actual method – N, cont.
Sample of representative outlets Stratified by chain and concept
Matching EAN/PLU with COICOP6
Weighted Jevons price index on elementary level with expenditures shares of current and base period; Monthly chained Törnqvist index
Scanner data weights between the COICOP6 groups
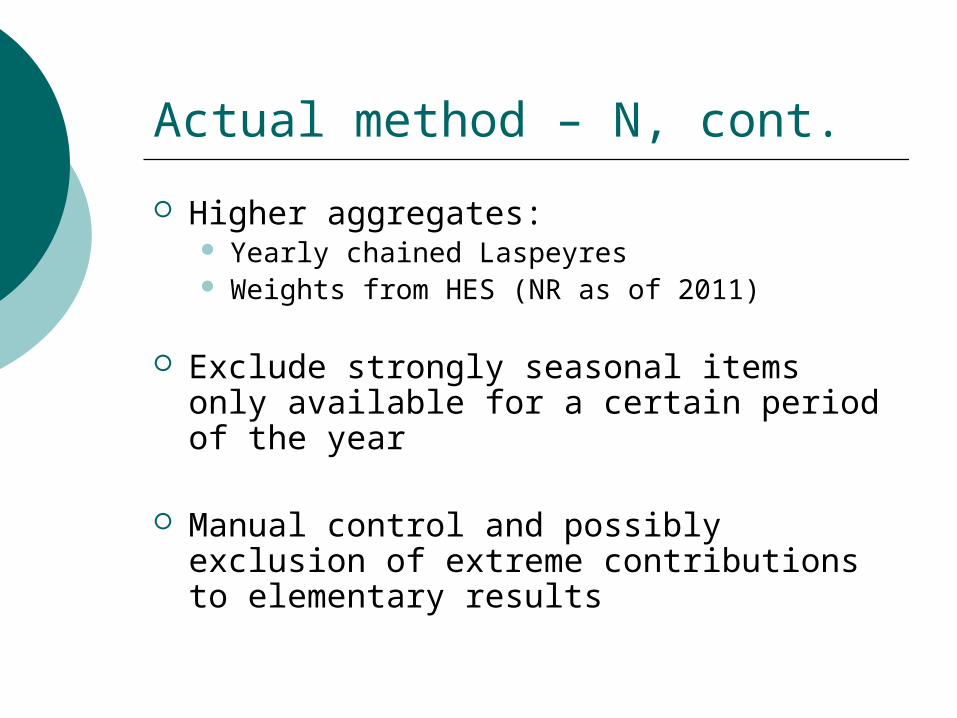
Higher aggregates: Yearly chained Laspeyres Weights from HES (NR as of 2011)
Exclude strongly seasonal items only available for a certain period of the year
Manual control and possibly exclusion of extreme contributions to elementary results
Actual method – N, cont.
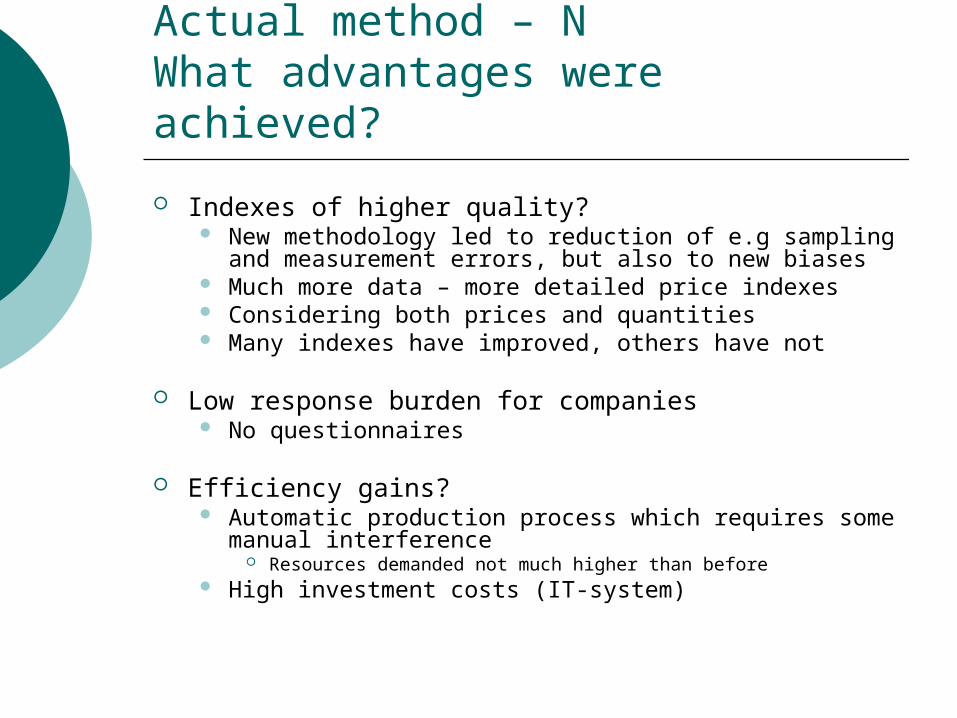
Actual method – NWhat advantages were achieved?
Indexes of higher quality? New methodology led to reduction of e.g sampling and
measurement errors, but also to new biases Much more data – more detailed price indexes Considering both prices and quantities Many indexes have improved, others have not
Low response burden for companies No questionnaires
Efficiency gains? Automatic production process which requires some
manual interference Resources demanded not much higher than before
High investment costs (IT-system)
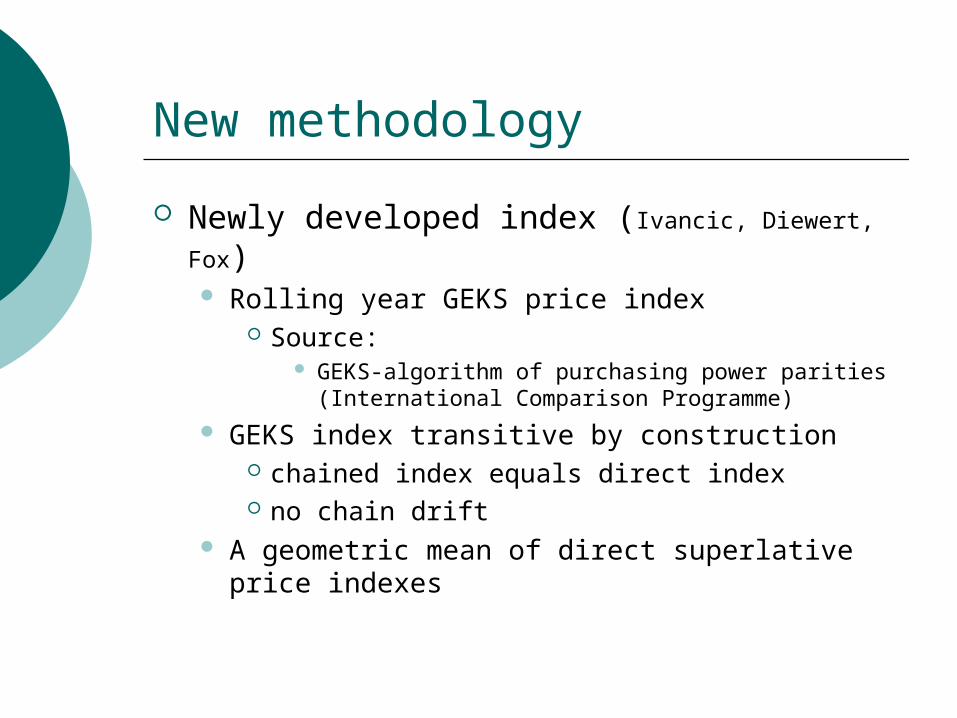
New methodology
Newly developed index (Ivancic, Diewert, Fox) Rolling year GEKS price index
Source: GEKS-algorithm of purchasing power parities
(International Comparison Programme) GEKS index transitive by construction
chained index equals direct index no chain drift
A geometric mean of direct superlative price indexes
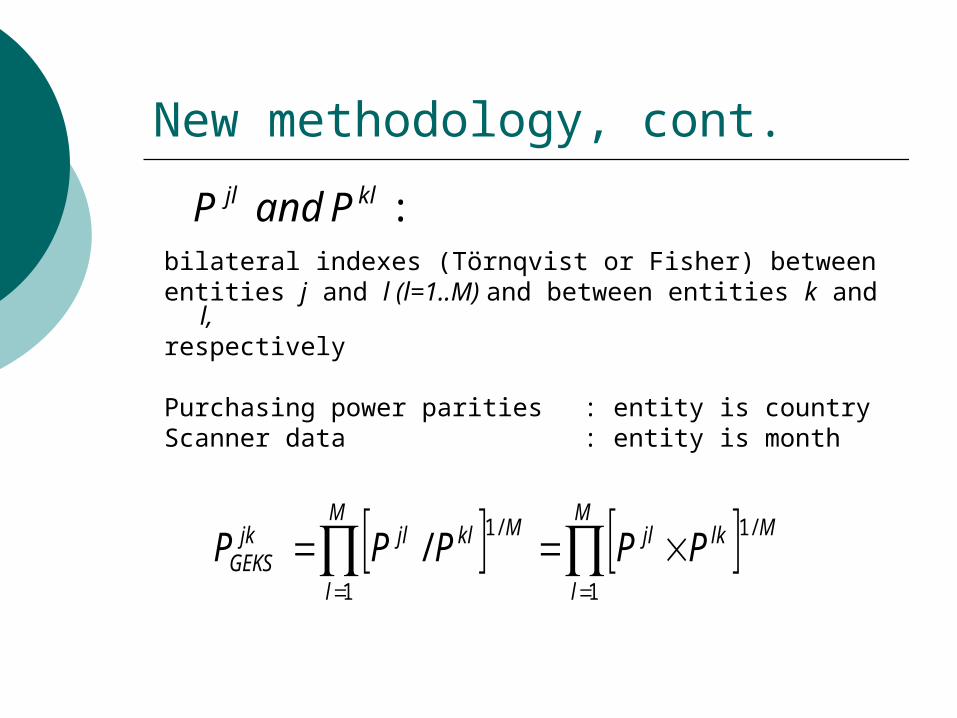
New methodology, cont.
bilateral indexes (Törnqvist or Fisher) betweenentities j and l (l=1..M) and between entities k and l,respectively
Purchasing power parities : entity is countryScanner data : entity is month
M
l
MlkjlM
l
MkljljkGEKS PPPPP
1
/1
1
/1/
:kljl PandP
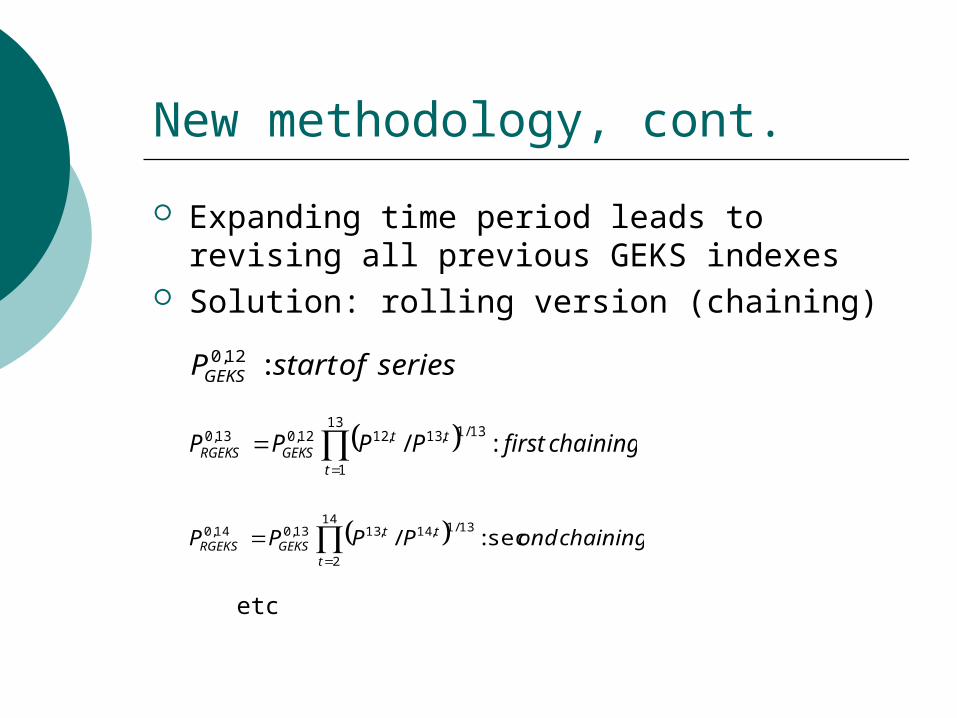
New methodology, cont.
Expanding time period leads to revising all previous GEKS indexes
Solution: rolling version (chaining)
etc
seriesofstartPGEKS :12,0
chainingfirstPPPPt
ttGEKSRGEKS :/
13
1
13/1,13,1212,013,0
chainingondPPPPt
ttGEKSRGEKS sec:/
14
2
13/1,14,1313,014,0
RYGEKS and NL
RYGEKS specifically developed for Statistics Netherlands as remedy for not-weighting at elementary level
Not (yet) applied in practice
Used as benchmark Finding optimal value threshold
Current method (NL) resembles RYGEKS quite well (on average)
No bias found
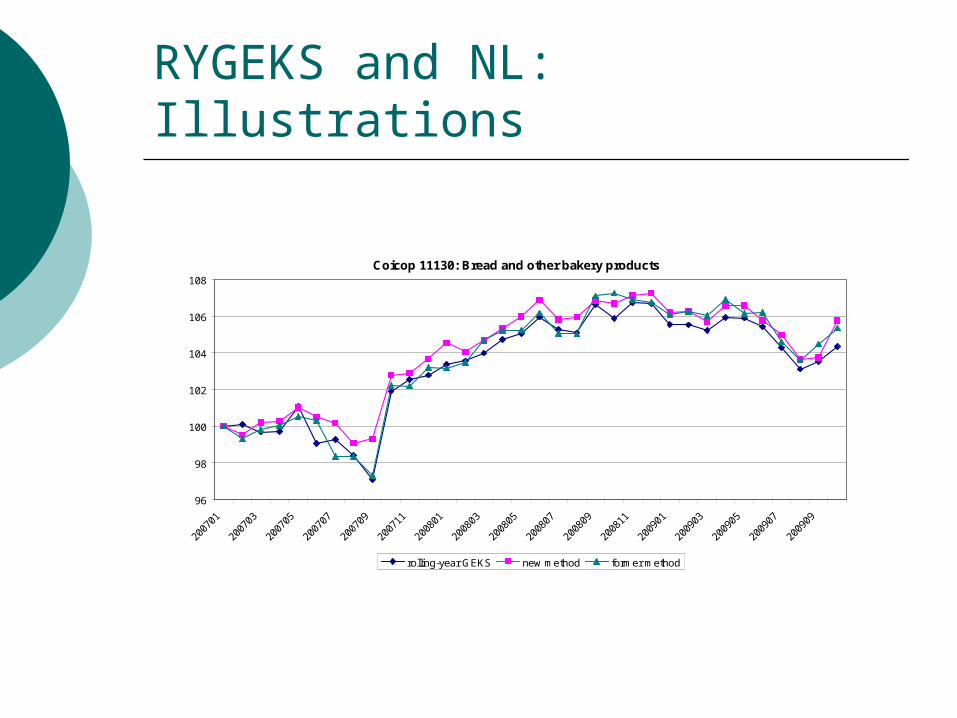
RYGEKS and NL: Illustrations
Coicop 11130: Bread and other bakery products
96
98
100
102
104
106
108
rolling-year GEKS new method former method
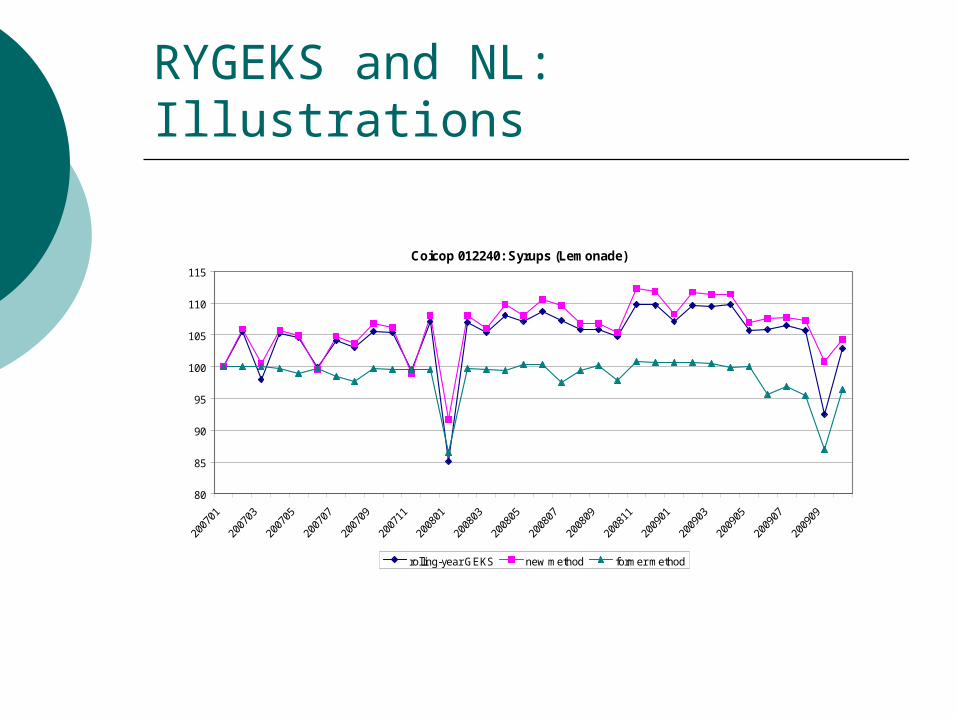
RYGEKS and NL: Illustrations
Coicop 012240: Syrups (Lemonade)
80
85
90
95
100
105
110
115
rolling-year GEKS new method former method
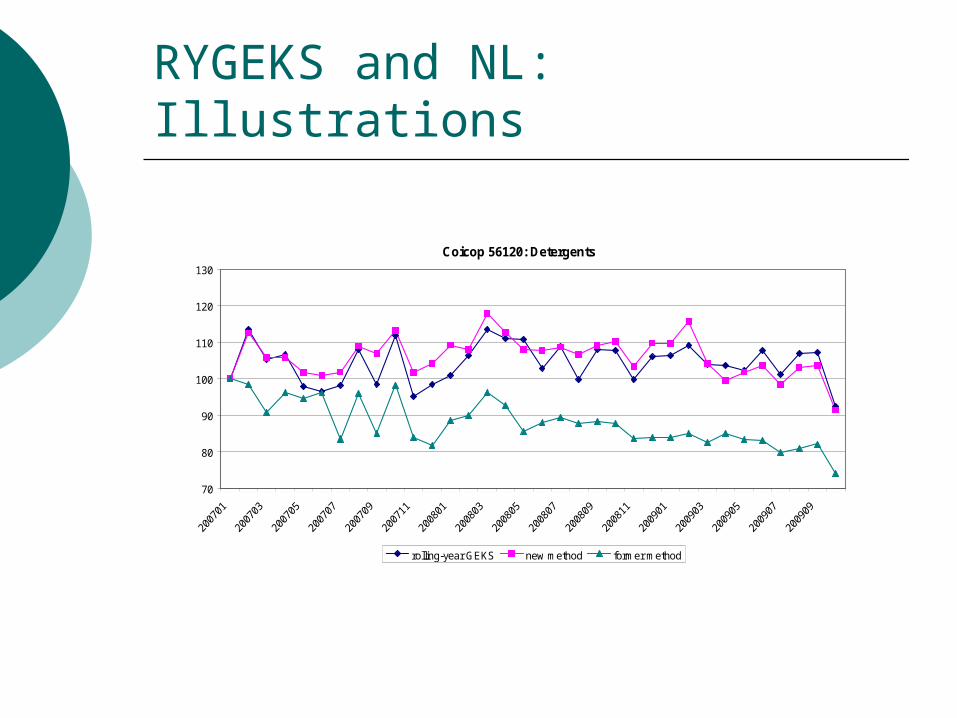
RYGEKS and NL: Illustrations
Coicop 56120: Detergents
70
80
90
100
110
120
130
rolling-year GEKS new method former method
RYGEKS and NL, cont.
Plans for near future: Shadow system based on RYGEKS
indexes Continuous benchmark for current
method Implementation when RYGEKS is widely
accepted? More (international) analysis needed
RYGEKS and N
RYGEKS indexes tested on Norwegian scanner data on different levels; EAN, elementary and aggregated COICOP
levels For COICOP 01 compared a monthly
chained Törnqvist index with a monthly chained RYGEKS index
The results indicate some bias in the Törnqvist index
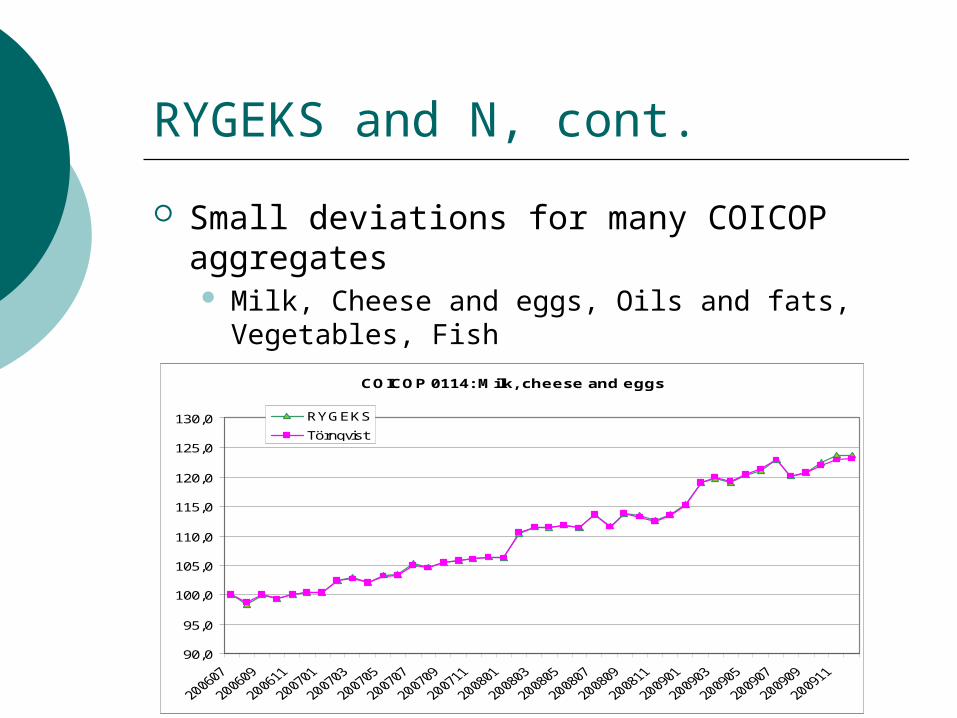
RYGEKS and N, cont.
Small deviations for many COICOP aggregates Milk, Cheese and eggs, Oils and fats,
Vegetables, Fish
COICOP 0114: Milk, cheese and eggs
90,0
95,0
100,0
105,0
110,0
115,0
120,0
125,0
130,0 RYGEKS
Törnqvist
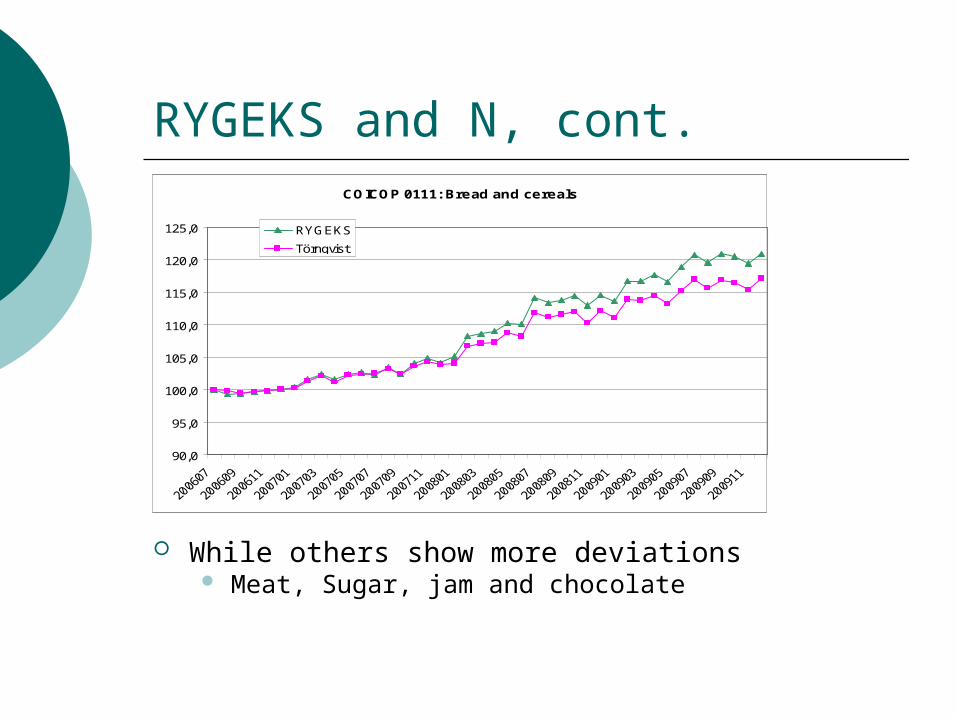
RYGEKS and N, cont.
While others show more deviations Meat, Sugar, jam and chocolate
COICOP 0111: Bread and cereals
90,0
95,0
100,0
105,0
110,0
115,0
120,0
125,0 RYGEKS
Törnqvist
RYGEKS and N, cont.
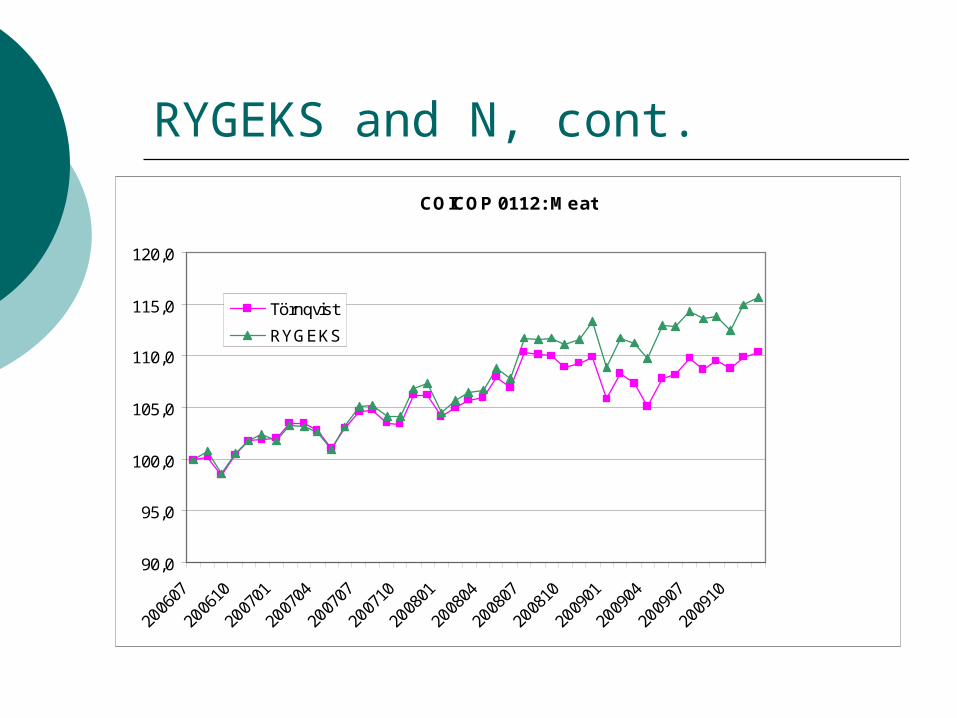
COICOP 0112: Meat
90,0
95,0
100,0
105,0
110,0
115,0
120,0
Törnqvist
RYGEKS
RYGEKS and N, cont.
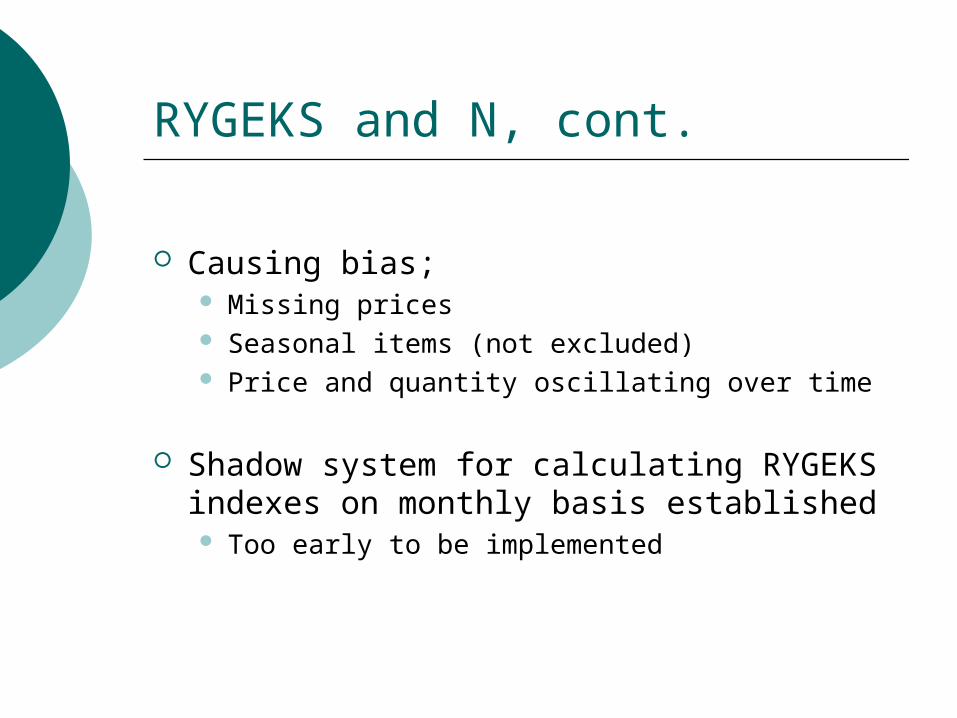
Causing bias; Missing prices Seasonal items (not excluded) Price and quantity oscillating over time
Shadow system for calculating RYGEKS indexes on monthly basis established Too early to be implemented
Scanner data in other branches?
NL: Expanding to other branches desirable Data available (e.g. durables) Problem of quality changes Analysis needed
N: Continuously working to expand scanner data
Increasing pressure from chains and outlets Data available for pharmaceutical products, wine
and spirits (state monopoly) and petrol Mostly price information implemented
Have tried to cover clothing, but matched item model unsuccessful


![Nygaard historie[1]](https://img.pdfslide.net/doc/110x75/54958ac7b479598c368b467c/nygaard-historie1.jpg)