Embed Size (px)
Citation preview
GSA Office of Governmentwide Policy
Workspace Utilization and Allocation Benchmark
Office of Real Property Management Performance Measurement Division
Workspace Utilization and Allocation Benchmark

Workspace Utilization and Allocation Benchmark
U.S. General Services Administration Office of Governmentwide Policy
Office of Real Property Management Performance Measurement Division
July 2011
Note: Effective as of July 2012, the author has updated the workspace benchmark data.
1
Workspace Utilization and Allocation Benchmark
Contents
Introduction .................................................................................................................3
Methodology ................................................................................................................7
Research Analysis .......................................................................................................9
Federal Workspace Policy and Regulations .............................................................13
The Emerging Workspace .........................................................................................15
Workspace Survey Results .......................................................................................23
Workspace Allocation Results ..................................................................................25
Workplace Snapshots
Benchmark #1: Business Services/Consulting ...............................................27
Benchmark #2: Telecommunication .................................................................28
Benchmark #3: Manufacturing ..........................................................................28
Benchmark #4: Domestic Government Organization .....................................29
Benchmark #5: International Government Organization ................................29
Benchmark #6: Academic Institution ...............................................................30
Benchmark #7: Diversified Manufacturer .........................................................30
Benchmark #8: Media Conglomerate ...............................................................31
Benchmark #9: Business Services/Consulting ...............................................31
Case studies: Today’s Innovative Workplace .........................................................32
Case Study #1: IBM Reduces Its Real Estate Footprint Through Telework ..32
Case Study #2: Sabre’s Workplace Innovation ................................................34
Case Study #3: Herman Miller on Space Standards and Industry Trends ....35
Featured Article: “Take my desk — please” .............................................................37
Acronyms ..................................................................................................................43
3
Workspace Utilization and Allocation Benchmark
anaging and allocating office workspace is a constant challenge for both public and private organizations. This challenge exists because organizations have to meet
functional space demands using limited resources. When determining the best way to forecast and allocate workspace and support knowledge workers, today’s architects, designers, facilities and real estate professionals, and workplace consultants must consider the following factors: • Space availability;• Energy costs; • Operation and maintenance costs; • Ever-changing mission requirements; • Security concerns; • Emergency management planning; • Alternative workplace arrangements
(AWA); and • The new mobile workforce.
Over the past decade, the Federal government has moved away from strict hierarchical space use standards based on pay grade or associate position. The Federal government now follows the Code of Federal Regulation’s (CFR) recommendations for space planning based on organizational needs1. Current workspace regulations
state that “Executive agencies must provide a quality workplace environment that supports program operations, preserves the value of real property assets, meets the needs of the occupant agencies, and provides child care and physical fitness facilities in the workplace when adequately justified. An Executive agency must promote maximum utilization of Federal workspace, consistent with mission requirements, to maximize its value to the Government.”2
When assigning and utilizing federal workspace, “Executive agencies must provide assignment and utilization services that will maximize the value of Federal real property resources and improve the productivity of the workers housed therein.”3
With respect to the Code of Federal Regulations, the General Services Administration (GSA), Office of Governmentwide Policy (OGP) provides additional guidance to promote government-wide cost-effective, flexible and quality workspace. This Workspace Utilization and Allocation Benchmark publication presents a concise synopsis of workspace research findings and practical recommendations. OGP’s
Introduction
1 GPO Access, Code of Federal Regulations Main Page: http://www.gpoaccess.gov/cfr/index.html2 “Federal Management Regulation: Assignment and Utilization of Space,” Title 40 Code of Federal Regulations, Part 102-79.10 http://ecfr.gpoaccess.gov/cgi/t/text/text-
idx?c=ecfr&tpl=/ecfrbrowse/Title41/41cfr102-79_main_02.tpl.3 “Federal Management Regulation: Assignment and Utilization of Space,” Title 40 Code of Federal Regulations, Part 102-79.15 http://ecfr.gpoaccess.gov/cgi/t/text/text-
idx?c=ecfr&tpl=/ecfrbrowse/Title41/41cfr102-79_main_02.tpl.
M
4
Workspace Utilization and Allocation Benchmark
objective is to present this information to the entire Federal community with the hope that it leads to more informed decision-making and better overall utilization and allocation of office workspace. Many real estate managers and facility managers are interested in developing similar programs or extending existing programs in support of real estate cost savings goals, workspace consolidation plans and GSA’s Zero Environmental Footprint (ZEF) initiatives. This publication shares challenges and best practices with real estate professionals and facility managers across all industries.
In addition to providing useful recommendations, this 2011 Workspace Utilization and Allocation Benchmark publication includes the GSA Office of Governmentwide Policy workspace benchmark and a feature article on space planning methods used by an internationally-known private sector firm. This research review also includes ten arbitrarily selected benchmark studies and three case studies. The case studies explain how these organizations—which range from information technology firms to real estate corporations—utilize space planning to get the most out of their workplaces.

Workspace Utilization and Allocation Benchmark
he Federal government is a collection of diverse agencies with differing missions. Therefore, the task of developing or confirming a government-wide standard
for office workspace use per person is a significant challenge and not the premise of this benchmark publication. GSA presents this information to the entire Federal community with the hope that it leads to a more effective, efficient workspace environment that accommodates individual work styles and alternative workplace strategies to reduce office workspace costs.
GSA developed this comprehensive study with our real property colleagues to promote the most efficient and optimal use of office workspace for both Federal agencies and the private sector.
A wide variety of public and private sector organizations are represented in this study, including Federal agencies, international sector organizations, financial services, information technology, technology consulting, management consulting,
real estate services, media services and manufacturing.
In the summer of 2010, through the winter of 2011, GSA conducted a workspace utilization survey, analyzed data results, conducted Internet research, and held telephone interviews with several public and private organizations. GSA attended several leading industry workplace conferences to identify and gain insight into emerging contemporary trends, practices, and standards in workspace utilization and allocation.
GSA collected data to produce three case studies and ten workplace benchmarks, which explain each organization’s workplace space usage in greater detail.
GSA also reviewed numerous published sources and other publicly available information—including industry best practice publications, government-wide policy bulletins, press releases, and industry surveys—to examine new government and private sector space allocation trends.
7
Methodology
T
9
Workspace Utilization and Allocation Benchmark
Research Analysis
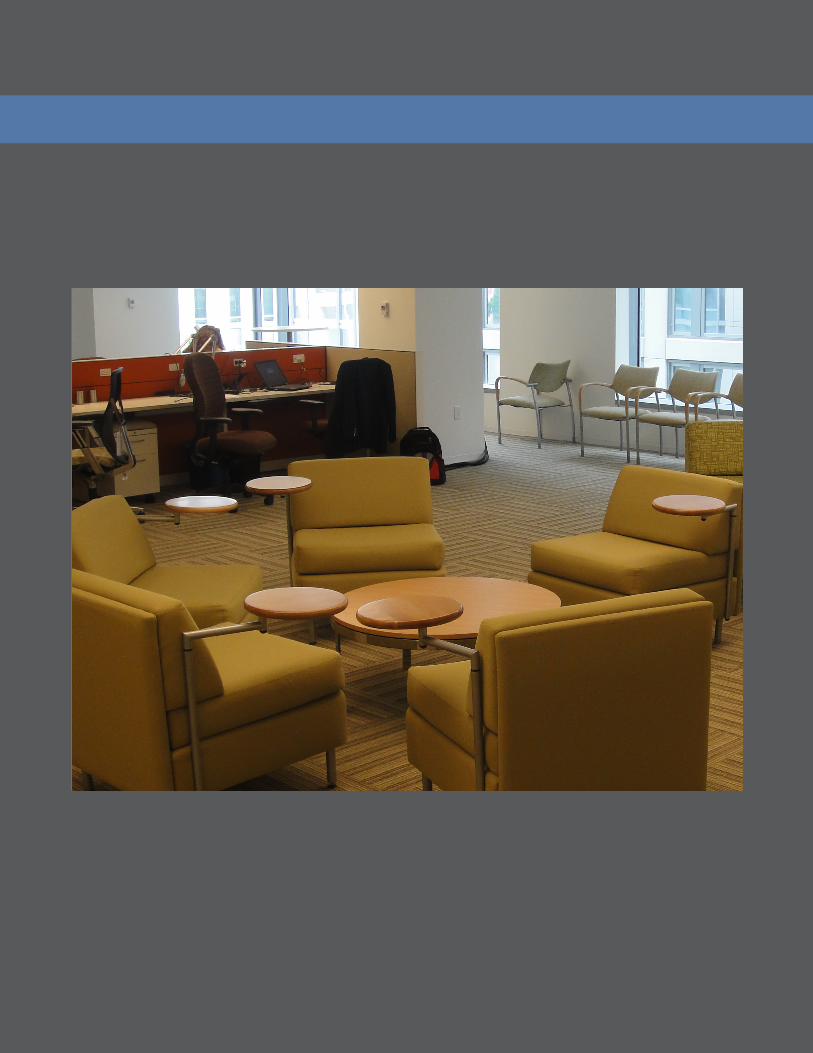
“Our customers are struggling with higher real estate costs, so they’re looking for ways to reduce the amount of gross square footage allotted to each person.”
~ Cheri Bromberg, Steelcase application design specialist
This section outlines findings of workspace use practices and trends based on GSA’s research and contact with professional trade organizations, private sector firms, and Federal agencies, as well as national, international, state and local governments.
GSA found that the emphasis on workplace space use trends has changed tremendously since our initial 1997 Office Space Use Review: Current Practices and Emerging Trends and our 2002 Space Use Update. Federal
agencies and private sector organizations have been forced to constantly reevaluate their current workspace usage. Workplaces are now influenced by an improving mobile workforce and greater
use of instantaneous wireless
communication tools. Mobile phones, smart phones, BlackBerry devices and wireless networking have revolutionized the workplace. As a result, many Federal agencies and private organizations have turned to alternative work environments to reduce workspace costs and optimize physical workspace.
Alternative work environments including telework, hoteling stations and desk sharing, are a major trend in today’s real estate marketplace, and offer organizations flexibility and optimal workspace usage. Additionally, organizations have noted an increase of quantitative benefits with the use of alternative work environments such as increased productivity and enhanced associate morale.
Organizations apply different space use measurements, which presented a challenge when comparing workplace space use for the many participating organizations. For example, some organizations measure workspace in Rentable Square Feet (RSF), or the gross square footage minus vertical penetrations (such as stairwells and elevator pipe shafts). Others measure workspace by Usable Square Feet (USF), or the sum of retail areas, office
The workspace benchmark average in this study is based primarily on a square foot per person assessment.
10
space, and common areas. Neither RSF nor USF standards simply measure an associate’s office or cubicle area, but also include a portion of shared space—such as conference rooms and hall space—for each associate in a space use measurement.
Participating organizations also differed in their space per person reporting method. Some organizations reported a space per person standard based on workers’ positions or functions, while others use a uniform, organization-wide space per person designation. Some organizations did not identify their measurement method, so GSA tried to resolve the reporting issues by working with participating organizations to generate and standardize comparable data. In most cases, GSA adjusted percentages between RSF and USF, as agreed upon by the organization representative.
Based on public sector data information of office workspace use trends, organizations were allocating a prevailing standard workspace average of 190 Usable Square Feet (218 Rentable Square Feet) as the optimum workspace
per person. Organizations can most efficiently and effectively minimize their square foot usage by implementing innovative workspace strategy, such as hoteling and teleworking.
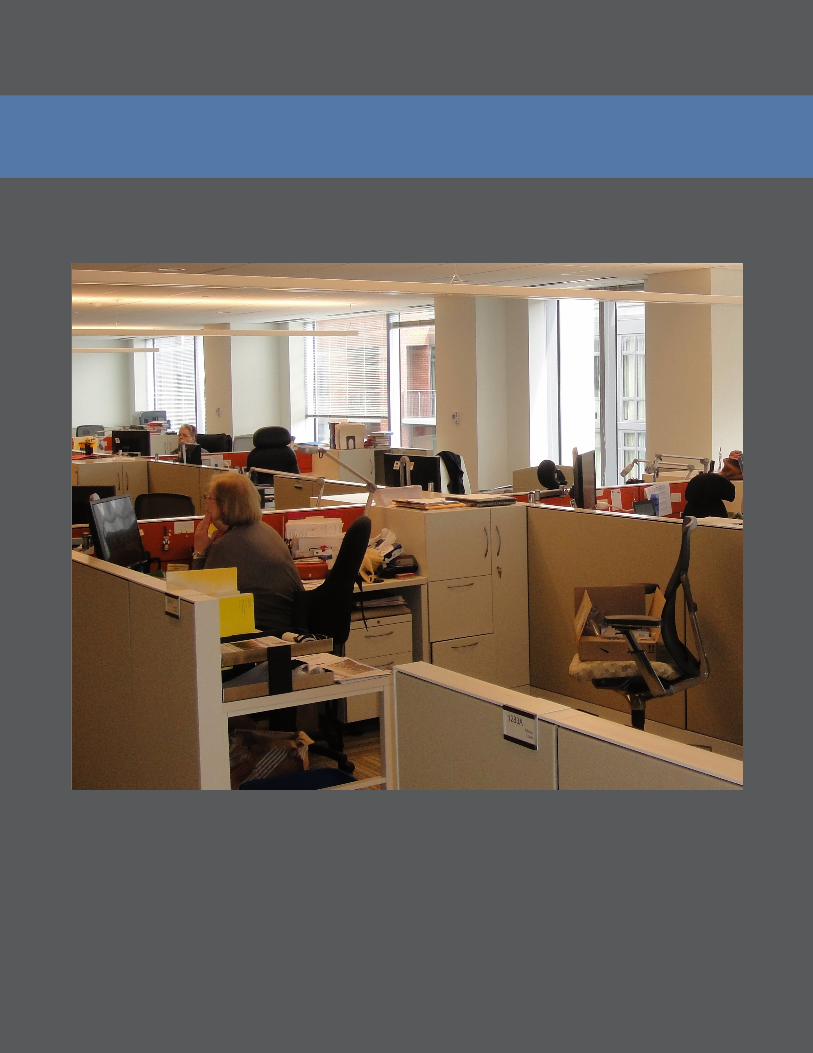
GSA for example has been knocking down walls, even dismantling cubicles to create a free-flowing layout that encourages collaboration and reduces
workspace. When renovation of GSA’s Washington headquarters is completed in 2013, the building will accomodate 4,500 workers — almost 2,000 more than a year ago — because of shared work spaces and telecommuting. GSA Headquarter office will average approximately 80 USF (92 RSF) per person of workspace.
Research Findings
1. Many public and private organizations focus on organizational mission, job function, operation and maintenance costs, security, emergency management planning, alternative work environment, wireless technology, and workspace availability when planning and allocating workspace. The majority of the 2011 participating organizations use a space per person measure as the key performance metric for square footage allocation.
2. No significant differences between government and private workspace use trends were found. Private sector survey respondents reported an average space per person of 200 USF (230 RSF), with a median of 193 USF (222 RSF) as compared to the Federal benchmark of 190 USF (218 RSF). The greater space per person average in the private sector was due to the nature of work performed by participating private sector organizations. In cases where a private sector organization used less space than a Federal organization, telework and other flexible work arrangements were responsible for reducing the organization’s overall workspace needs.
GSA’s headquarters serve as a model by averaging approximately 80 USF (92 RSF) per person of collaborative workspace.

11
Workspace Utilization and Allocation Benchmark
4 United States Office of Personnel Management: Status of Telework in the Federal Government – Report to Congress, 2010.
3. Facility managers have focused on ways to use workspace more efficiently as a means to reduce overall space use costs by reducing the amount of space occupied. The initial wave of reductions in occupied space focused on developing more efficient design standards. As a result of widespread application, the typical office standard has declined since the early 2000s from around 250 square feet per workstation to around 190 square feet or less, a substantial reduction.
4. Facility managers have successfully increased the number of associates per workspace by focusing intently on alternative workplace strategies. New wireless technology has helped the workforce become more mobile. Organizations seek ways to reduce workspace allocation per person in order to reduce operation and maintenance costs, and to improve associate morale by limiting the need for a daily commute.
5. Many facility managers now recognize wireless communication advances in alternative work
arrangements as essential and effective ways to protect an organization’s critical data, especially in times of disaster. The threat of terror attacks and natural disasters draws a great deal of attention to the need for continuity of operations (COOP) strategies that include both mobile work and telework. 6. In calendar year 2009, 113,946 Federal associates teleworked which was an increase of 11,046 associates as compared to calendar year 2008. The percentage of total teleworking associates increased from 5.24 percent in 2008 to 5.72 percent in 20094. In 2009, the number of associates who telework three or more days per week increased from 13,365 to 18,716 associates. Increasing the strategic use of telework is a high priority for President Obama and Congress, as evidenced by passage of the Telework Enhancement Act of 2010. The President and Congress have encouraged Federal agencies to expand their use of telework to reduce their real estate footprint and real estate costs.
13
Workspace Utilization and Allocation Benchmark
Federal Workspace Policy And Regulations
s an industry leader in the construction and management of office workspace, GSA’s space management policies and regulations demonstrate the agency’s leadership in
addressing workplace quality issues that influence the effectiveness and productivity of the Federal workforce.
Presidential Memorandum -- Disposing of Unneeded Federal Real Estate
In June 2010, President Barack Obama issued a memorandum directing federal agencies to generate $3 billion in cost savings by 2012 through space consolidation and the elimination of unneeded real property while moving toward a clean energy economy. GSA has taken the leadership role in achieving the President’s objective. GSA is developing policies and procedures for this new workplace strategy and is implementing systems to measure the actual use of real property. Under this Presidential memorandum, GSA will initiate new workplace strategy to assist agencies to increase the utilization of current facilities, improve space planning methods when sizing future facilities, and divest of unneeded property.
GSA and the Office of Real Property Management will assist other federal agencies in identifying workplace strategies that will reduce their real estate footprint without sacrificing productivity.
GSA Public Buildings, Property, and Works
The provisions of Chapter 33 of Subtitle II – Public Buildings and Works of Title 40 of the United States Code authorize the Administrator of General Services to construct, repair, maintain, alter, and operate United States courthouses and other public buildings of the Federal Government. In addition, 40 U.S.C. § 585 provides authority for the Administrator of General Services to lease privately owned space for Federal use. The Administrator has delegated these authorities to the Commissioner of the Public Buildings Service (PBS). All space occupied by GSA associates, whether leased or government-owned, is acquired through PBS.
A
14
Assignment and Utilization of Workspace
The most recent amendment to the Code of Federal Regulations, Title 41, Section 102-79, Assignment and Utilization of Space, addresses space allocation—specifically space assignment and utilization—within the Federal government.
The amendment states that executive agencies must provide a quality workplace environment that supports program operations, preserves the value of real property assets, meets the needs of tenant agencies, and provides childcare and physical fitness facilities in the workplace when adequately justified. An executive agency must also promote maximum workspace—consistent with mission requirements—
to maximize its government value. In addition, executive agencies must promote the optimum use of space for each assignment at the minimum cost to the government. Executive agencies must also assign space based on mission requirements and provide quality workspace that is delivered and occupied in a timely manner.
Public Law 106-346 Section 349 states that “each executive agency shall establish a policy under which eligible associates of the agency may participate in telecommuting to the maximum extent possible without diminished associate performance.” In response, GSA and the Office of Personnel Management (OPM) have partnered as lead agencies to facilitate full compliance with the law.
15
Workspace Utilization and Allocation Benchmark
The Emerging Workplace
“Companies aren’t just slashing real estate footprints. They’re looking for creative ways to use the space they have and shifting some work to home offices, third places, satellite offices and other spaces.”
~ Bud Klipa, General Manager, Steelcase
As today’s organizations face unprecedented challenges, the current practice of using alternative workplace arrangements can benefit organizations in a variety of ways, including real estate cost savings, improved continuity of operations after a disaster, and flexible work arrangements that improve associate satisfaction and productivity. Telework, hoteling, and desk sharing are a few of the alternative office solutions that may reduce both office workspace demand and associated workspace costs.
The New Federal Workplace
There have been recent dramatic changes in technology, business practices, and the demographic profile of the workforce. Team work has grown in importance, computer work takes precedence over paperwork, and increased local mobility is now standard practice rather than the exception.
GSA responded to these changes in a special way when it launched the WorkPlace 20·20 research and development program. The focus of this effort was to help agencies realign their work settings to support teams effectively at a time when organizational structures, work styles, and technology were evolving rapidly. Now the time has come for evaluation. How have those projects performed? What lessons have been learned? To answer these questions, GSA commissioned an evaluation study, The New Federal Workplace: A Report on the Performance of Six WorkPlace 20·20 Projects.
The results of WorkPlace 20·20 Projects Evaluation Study led to GSA’s recommendation to take an integrated approach to designing Federal workplaces. GSA’s recommendation means moving beyond the basic square foot per person calculation and integrating spatial, behavioral, and technical factors in workspace design and space allocation. This integrated approach leads to an effective workspace that balances the space
“Mobility is a fact of life – how most people work today. Federal workers are no exception. Mobility helps federal agencies use real estate more effectively, saving money and reducing greenhouse gas emissions.”
~ Robert A. Peck, Commissioner, GSA Public
Buildings Service
16
Workspace Utilization and Allocation Benchmark
needs of the occupying organization, and supports both collaboration and individual work. Space allocation should reflect the impact of mobility and the need for interactions ranging from informal socializing to formal, scheduled meetings. As summarized in this original study, design workplace strategies are integral components which include designing space for a mix of activities, engaging occupants in the design process, and designing workplaces to support technology and how people work today.5
Leveraging Mobility
Another key factor affecting today’s workplace is mobility. Due to advances in mobile and networking technologies, sustainability concerns, and changing workforce demographics, many associates are working with high degrees of mobility, leading to low actual utilization of physical office workspace. Associates are constantly on the go - working at home, regional offices, or with Federal partners located across town or across the globe. In a recent study of public and private sector organizations conducted by GSA’s Public Buildings Service (PBS) Applied Research Program, associates are working through many different means. Conducting head-down work at one’s desk is no longer the primary way of working. There has been a significant shift toward a more mobile workforce. This swing impacts the office workplace and the overall office workspace strategy.
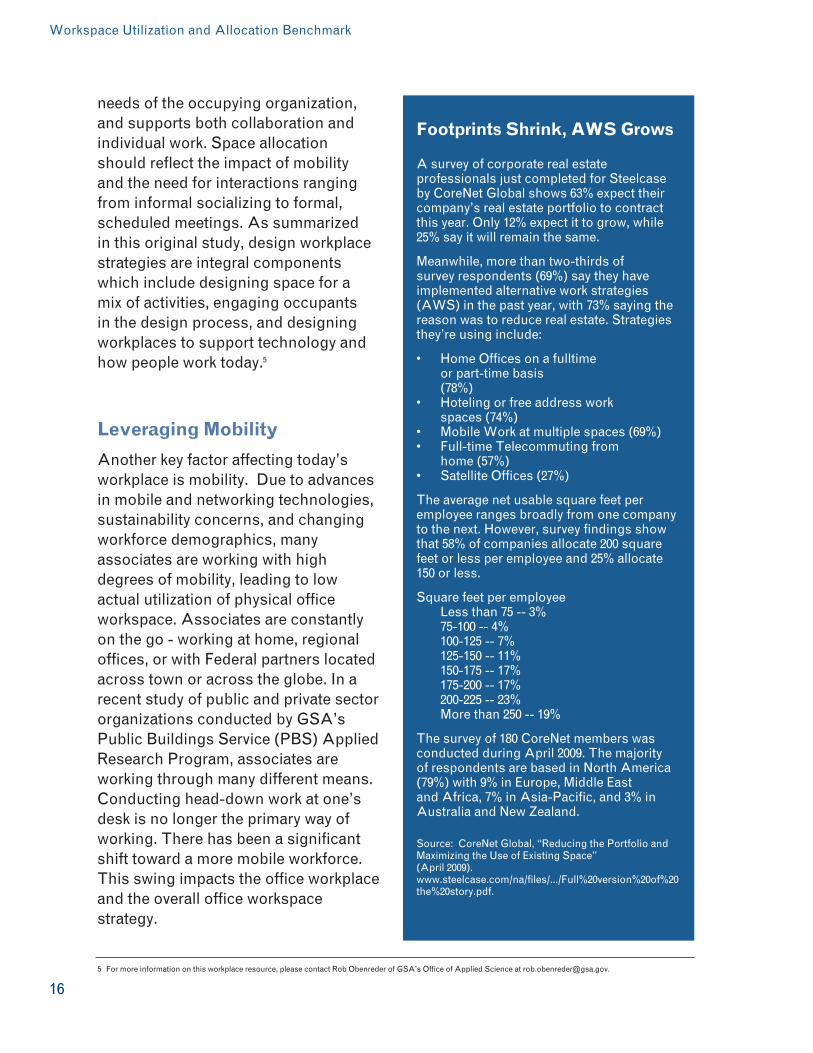
Footprints Shrink, AWS Grows
A survey of corporate real estate professionals just completed for Steelcase by CoreNet Global shows 63% expect their company’s real estate portfolio to contract this year. Only 12% expect it to grow, while 25% say it will remain the same.
Meanwhile, more than two-thirds of survey respondents (69%) say they have implemented alternative work strategies (AWS) in the past year, with 73% saying the reason was to reduce real estate. Strategies they’re using include:
• HomeOfficesonafulltime or part-time basis (78%) • Hotelingorfreeaddresswork spaces (74%) • MobileWorkatmultiplespaces(69%)• Full-timeTelecommutingfrom home (57%) • SatelliteOffices(27%)
Theaveragenetusablesquarefeetperemployee ranges broadly from one company tothenext.However,surveyfindingsshowthat58%ofcompaniesallocate200squarefeet or less per employee and 25% allocate 150 or less.
Squarefeetperemployee Less than 75 -- 3% 75-100 -- 4% 100-125 -- 7% 125-150 -- 11% 150-175 -- 17% 175-200 -- 17% 200-225 -- 23% More than 250 -- 19%
Thesurveyof180CoreNetmemberswasconductedduringApril2009.Themajorityof respondents are based in North America (79%) with 9% in Europe, Middle East and Africa, 7% in Asia-Pacific, and 3% in Australia and New Zealand.
Source: CoreNet Global, “Reducing the Portfolio and Maximizing the Use of Existing Space” (April 2009).www.steelcase.com/na/files/.../Full%20version%20of%20the%20story.pdf.
5 For more information on this workplace resource, please contact Rob Obenreder of GSA’s Office of Applied Science at [email protected].
17
Workspace Utilization and Allocation Benchmark
6 For more information on this workplace resource, please contact Patricia Cheng of GSA’s Office of Applied Research at [email protected].
As stated in GSA’s research paper entitled, Leveraging Mobility, Managing Place: How Changing Work Styles Impact Real Estate and the Workplace, individual head down work is performed in more ways, locations, and schedules than ever before. Telework and other mobile work patterns are gaining momentum in both the public and private sector. It is clear that high-level Federal mandates, widespread trends in the private sector, and mobile work will continue to grow. The larger the mobile workforce the more there will be underutilized office workspace. Studies show that the average utilization for workspace in the U.S. and Europe between the hours of 8:00 a.m. and 5:00 p.m. is 35 to 50 percent; at any given time over half of all workspaces are not being used. This presents the organization with the opportunity to eliminate underutilized workspace to reduce cost or to grow its associate base without adding to facilities.
Real estate is the second largest expense for most organizations, and facility managers can not afford to waste space. Indeed, every organization has a vested interest in optimizing the efficiency of its existing space and increasing the return on its real estate investment. Mobile work can lead to enormous savings in real estate costs, reduction of greenhouse gas emissions, and improvement of work-life balance. Beginning with the current state of mobility in the Federal government and the private sector, the Leveraging Mobility paper examines mobility through the lenses of business, people, space, and environment. Together,
these drivers provide key considerations for the implementation and expansion of a mobility program.6
Telework
“Work is what you do, not where you do it.”
~ President Barack Obama
In today’s economy, many organizations are forced to downsize staff and reduce or eliminate real property requirements wherever possible. This can lead to associates having to give up their office workspace and work virtually – or telework.
Telework, sometimes called telecommuting or flexiplace, is an innovative business solution that enables associates to work productively away from the traditional office setting. Broadly speaking, anyone who works at home, at a client’s office, in a satellite office, telework center, or on the road, is teleworking. In fact, modern technological advances have made it easier to work anytime and in any place. More and more organizations around the world are using this tool to increase productivity, recruit new associates, lower staff turnover rate, save on overhead costs, respond to emergency situations, reduce traffic congestion, and improve their staff’s work-life balance. The WorldatWork Telework Trendlines 2009, created using data from The Dieringer Research Group Inc., indicates that the number of teleworkers who work at least one day
18
Workspace Utilization and Allocation Benchmark
per month from home or another remote location increased from approximately 12.4 million in 2006 to 17.2 million in 2008. The increase in the number of telecommuters represents a two-year increase of 39 percent, and an increase of 74 percent since 2005. In 2005, the number of associates who worked from home or another remote location at least one day per month was approximately 9.9 million.
This trend toward more associates telecommuting is likely due to a combination of factors, including:• Facility cost avoidance• Productivity gains• Government mandates to increase
telework• The proliferation of high-speed and
wireless internet access• Concern over rising threat levels• Rising fuel and commuting costs• Telework’s strategic value• The trend by associates to embrace
work-life balance concepts.
Other Telework benefits:• Reduced absenteeism: Teleworkers
can work from home to avoid dangerous weather and traffic conditions. They can also continue to work at home with illness or another ailment that may have kept them away from the office to avoid transmitting disease to co-workers. According to the figures from the National Center of Health Statistics, American workers miss 20 million workdays a year due to colds and 70 million workdays because of flu.
• Improvedrecruiting: Telework enlarges the pool of available talent. The State of North Carolina had difficulty filling their Raleigh-based vacancies until they re-advertised these positions
as home-based with occasional visits to Raleigh. Over 200 qualified applicants responded.
• Reducedturnover: Because Telework is regarded as an attractive work option; associates are less willing to explore work elsewhere. After implementing its Telework Program, Philadelphia-based Cigna, a large health insurance provider, experienced a 30 percent decrease in turnover. In fact, research at Eli Lilly and Company shows that associates who telework are significantly more satisfied with their direct supervisors, a key factor in an associates’ intention to remain with their organizations.
Telework Reduces Real Estate Costs
Telework not only enables associate flexibility, it has also helped many organizations to cut costs by saving workspace. Articles drawn from material published by the Canadian Telework Association cited substantial savings through teleworking at several major corporations:• Cisco:Cisco associates telework
two days per week and report higher productivity and improved timeliness during telework, which amounts to annual savings of $277 million. Cisco’s report indicates that 91 percent of their associates state that telecommuting is somewhat or very important to their overall satisfaction. Cisco teleworkers prevented approximately 47,320 metric tons of greenhouse gas emissions from being released into the environment due to avoided travel. Associates report a fuel cost savings of $10.3 million per year.7
• SunMicrosystems: Nearly 19,000 Sun Microsystems associates; more than 56 percent of Sun’s workforce participate in the company’s “iWork” Program and work away from the office at least two
7 Marketwire, “Cisco Study Finds Telecommuting Significantly Increases Employee Productivity, Work-Life Flexibility and Job Satisfaction” (June 26, 2009). http://www.marketwire.com/press-release/Cisco-Study-Finds-Telecommuting-Significantly-Increases-Employee-Productivity-Work-Life-NASDAQ-CSCO-1009622.htm.
19
Workspace Utilization and Allocation Benchmark
8 Marketwire, “Cisco Study Finds Telecommuting Significantly Increases Employee Productivity, Work-Life Flexibility and Job Satisfaction” (June 26, 2009). http://www.marketwire.com/press-release/Cisco-Study-Finds-Telecommuting-Significantly-Increases-Employee-Productivity-Work-Life-NASDAQ-CSCO-1009622.htm.
9 Canadian Telework Association/InnoVisions Canada: “Office Space and Innovative Office Strategies” http://www.ivc.ca/officing/index.html.10 Government Executive, “Agency sees gains from telework initiative” (April 15, 2003). http://www.govexec.com/dailyfed/0403/041503td2.htm.11 Canadian Telework Association/InnoVisions Canada: “Office Space and Innovative Office Strategies” http://www.ivc.ca/officing/index.html.
days per week. Sun’s “iWork” Program has yielded an annual savings of $86.7 million related to reduced real estate and administrative expenses.
• AT&T: AT&T reports that 90 percent of its managers participate in the teleworking program on some level. The company reports annual savings of $15 million in real estate costs and estimates an annual $150 million increase in productive hours worked.
Even without telework, many of today’s knowledge workers and their managers spend more than half their time away from their offices because of travel, meetings, illness, flexible work arrangements, etc. As the use of telework increases, and with average teleworkers spending two or three days per week away from the regular office, the resulting empty office workspace can easily be used for desk sharing, hoteling, or other office workspace strategies.
Reducing or Eliminating Workspace
Many organizations have used alternative workspace arrangements to reduce or eliminate their office workspace footprint without sacrificing productivity.
AT&T
AT&T reported a savings of $3,000 per office, totaling approximately $550 million per year, by eliminating or consolidating office workspace associates no longer needed.8
IBM
About 25 percent of IBM’s 320,000 worldwide workers telecommute from home offices, saving $700 million in real estate costs.9
U.S. Patent and Trademark Office
The telework and alternative work arrangements programs at the Patent and Trademark Office (PTO) have enabled PTO to relinquish about three floors, or 47,000 square feet of office workspace. The PTO allows lawyers to reserve workspace in advance, which allows roughly five workers to share one office. The PTO expects to save roughly $1.5 million annually in office rental costs as a result.10
Nortel Networks
Of Nortel’s 13,000 teleworkers, 4,000 no longer need dedicated office workspace in a Nortel building. Overall, telecommuting allows the company to save $20 million dollars a year on real estate costs — the equivalent of two 20-story office buildings of 40,000 square feet per floor.11
Hoteling and Desk Sharing
Investing in telework and mobile office capabilities is only one component of an office workspace efficiency plan. With teleworkers spending two, three, or in some instances four days per
20
Workspace Utilization and Allocation Benchmark
week away from their permanent office, many organizations are also offering their associates a hoteling option. Hoteling allows associates who already telework to reserve office workspace
on an as needed basis without being permanently assigned to a workstation. Hoteling is normally reserved for associates who do not have an assigned personal workspace, or those who are willing to relinquish their assigned workspace. This alternative workspace strategy can also eliminate the need for additional office workspace and may save
the organization millions of dollars in real estate costs.
In a traditional work environment there is a 1-to-1 ratio of associates to workspaces. With a hoteling/desk sharing strategy there is at least an “n”-to-1 ratio of associates to workspaces. The higher the value of “n”, the more effective the workspace program will be with the prospect of yielding better workspace performance. With no loss in associate productivity, it stands to reason that a 2:1 associate to workplace ratio is twice as efficient as a 1:1 ratio. How high the ratio goes is defined by the nature of the organization, but from GSA’s research, ratios of 5:1 to 7:1 are not uncommon.
As an actual example: A high-tech
organization located in New York City has 334 workspaces in a facility made up of 108 “permanently assigned” spaces and 226 shared workspaces. There are 550 people who work “from” that office. So, the ratio for the shared space is 2.4 associate to each workspace. This organization measured the actual utilization of the shared workspace and found that the workspaces were utilized only 37 percent of the time. (Of the 226 shared workspaces only 86 were in use at any given time.) If they were to eliminate the 142 “vacant” spaces, they could achieve a ratio of more than 5 associates to every shared workspace. (Even counting the assigned spaces the ratio would be nearly 3 associates to every workspace.) And, they could save nearly $1.5 million per year by shedding the unused space.
In another example, associates in the Department of the Treasury’s Inspector General for Tax Administration (TIGTA) office formed a cross-functional team which focused on two goals: First, expand TIGTA’s current teleworking program. Second, reduce workspace in offices that have a high concentration of associates who telework more than two days per week.
TIGTA’s solution was to offer a hoteling program which allowed TIGTA to reallocate workspace and accommodate a greater number of associates in a smaller amount of workspace, ultimately reducing rent expenses by $100,000 annually. Under TIGTA’s hoteling program, associates are no longer assigned to a specific workspace.
The cost of accommodating the average Federal associate typically runs $10,000 - $15,000 annually per person. Eliminating 100 workspaces can save an organization over $1M a year.~GSA Cost Per Person Model
21
Workspace Utilization and Allocation Benchmark
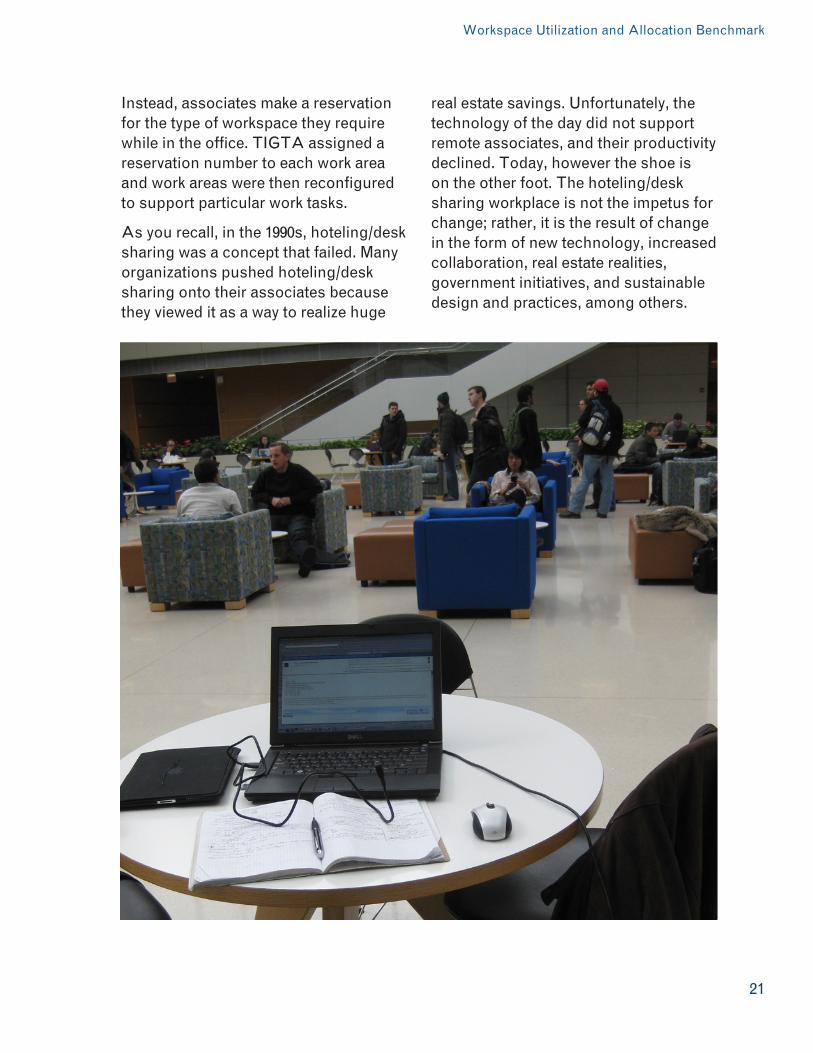
Instead, associates make a reservation for the type of workspace they require while in the office. TIGTA assigned a reservation number to each work area and work areas were then reconfigured to support particular work tasks.
As you recall, in the 1990s, hoteling/desk sharing was a concept that failed. Many organizations pushed hoteling/desk sharing onto their associates because they viewed it as a way to realize huge
real estate savings. Unfortunately, the technology of the day did not support remote associates, and their productivity declined. Today, however the shoe is on the other foot. The hoteling/desk sharing workplace is not the impetus for change; rather, it is the result of change in the form of new technology, increased collaboration, real estate realities, government initiatives, and sustainable design and practices, among others.
23
Workspace Utilization and Allocation Benchmark
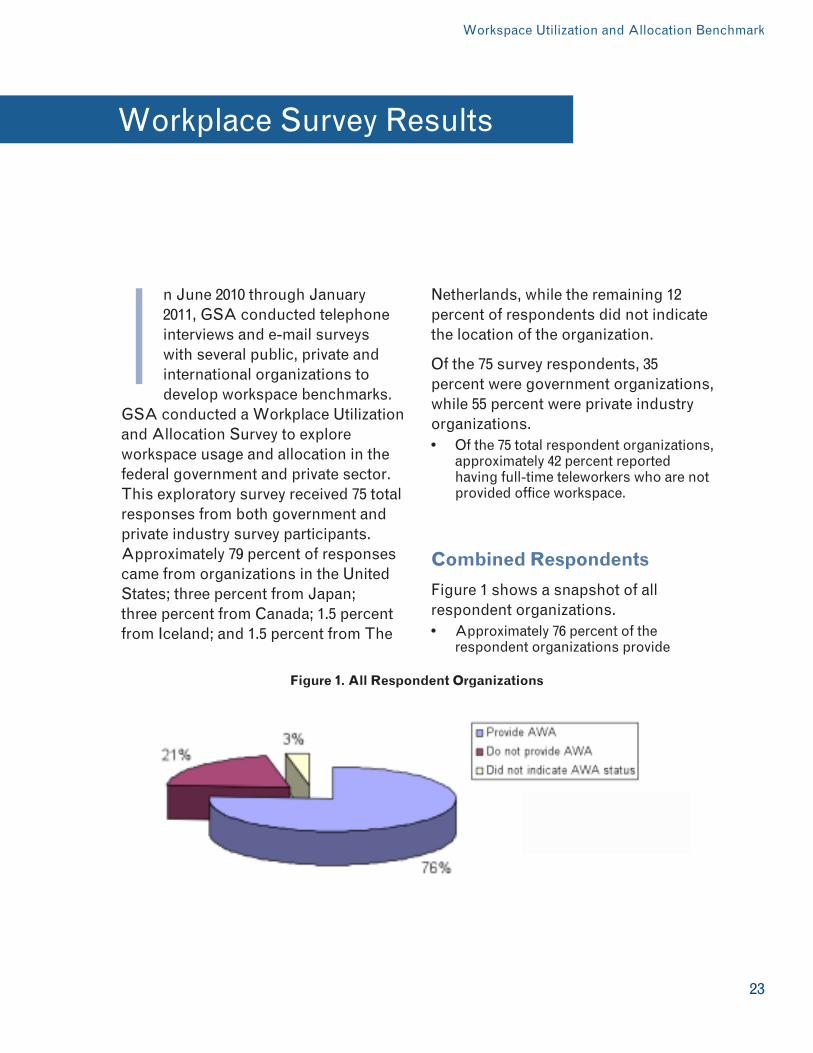
n June 2010 through January 2011, GSA conducted telephone interviews and e-mail surveys with several public, private and international organizations to develop workspace benchmarks.
GSA conducted a Workplace Utilization and Allocation Survey to explore workspace usage and allocation in the federal government and private sector. This exploratory survey received 75 total responses from both government and private industry survey participants. Approximately 79 percent of responses came from organizations in the United States; three percent from Japan; three percent from Canada; 1.5 percent from Iceland; and 1.5 percent from The
Netherlands, while the remaining 12 percent of respondents did not indicate the location of the organization.
Of the 75 survey respondents, 35 percent were government organizations, while 55 percent were private industry organizations.• Of the 75 total respondent organizations,
approximately 42 percent reported having full-time teleworkers who are not provided office workspace.
Combined Respondents
Figure 1 shows a snapshot of all respondent organizations.• Approximately 76 percent of the
respondent organizations provide
Workplace Survey Results
I
Figure 1. All Respondent Organizations
24
Workspace Utilization and Allocation Benchmark
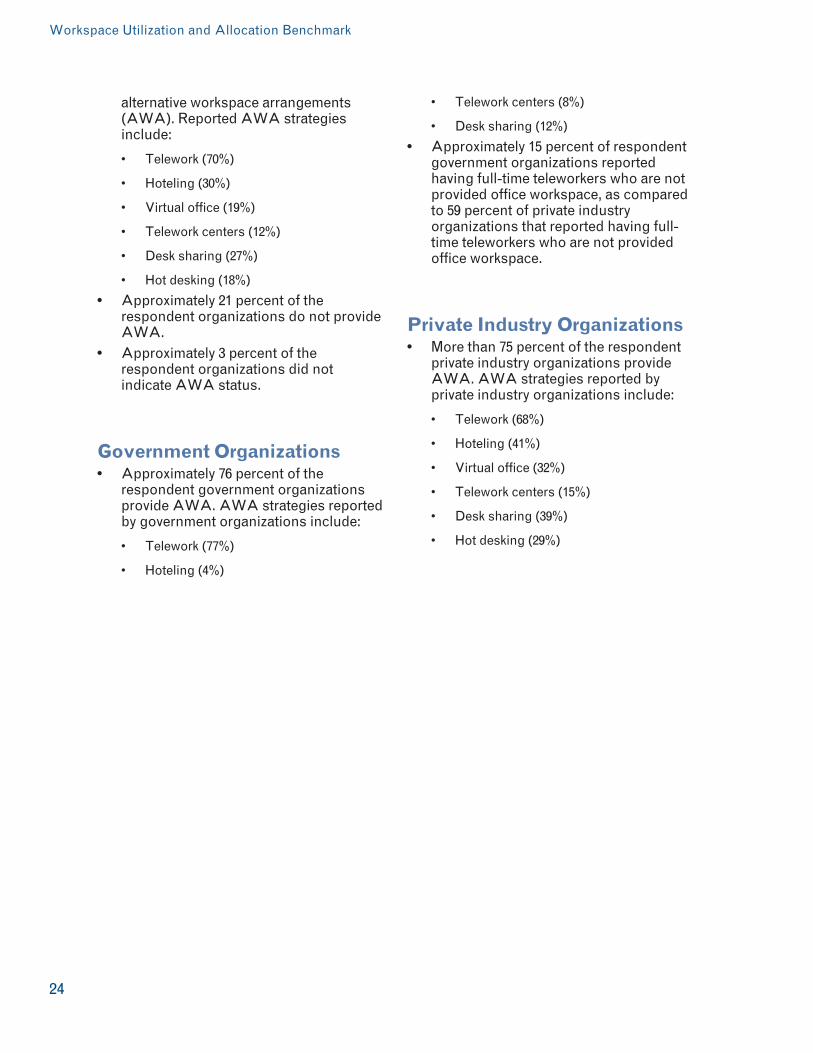
alternative workspace arrangements (AWA). Reported AWA strategies include:
• Telework(70%)
• Hoteling(30%)
• Virtualoffice(19%)
• Teleworkcenters(12%)
• Desksharing(27%)
• Hotdesking(18%)
• Approximately 21 percent of the respondent organizations do not provide AWA.
• Approximately 3 percent of the respondent organizations did not indicate AWA status.
Government Organizations• Approximately 76 percent of the
respondent government organizations provide AWA. AWA strategies reported by government organizations include:
• Telework(77%)
• Hoteling(4%)
• Teleworkcenters(8%)
• Desksharing(12%)
• Approximately 15 percent of respondent government organizations reported having full-time teleworkers who are not provided office workspace, as compared to 59 percent of private industry organizations that reported having full-time teleworkers who are not provided office workspace.
Private Industry Organizations• More than 75 percent of the respondent
private industry organizations provide AWA. AWA strategies reported by private industry organizations include:
• Telework(68%)
• Hoteling(41%)
• Virtualoffice(32%)
• Teleworkcenters(15%)
• Desksharing(39%)
• Hotdesking(29%)
25
Workspace Utilization and Allocation Benchmark
n the 2000s, facility mangers in both the Federal government and private sector typically thought they needed 200 to 400 square feet per person to build an effective office workspace. Based on GSA
research, today’s prevailing standard workspace average is a little more than 190 USF square feet per person, and the space allocation could hit a mere 60 square feet in the next 5 years.
As a continuous stream of GSA survey results and extensive research findings shows us, organizations have been gradually dialing back on office workspace allocation and grandness for years. As trends in today’s workplace environment, such as telework and desk sharing offer organizations flexibility and optimal workspace usage. However the general slowdown in economic activity has accelerated the trend as sobered facility mangers are forced to let go of their old workspace and try new ways to use less space, increase operation efficiency, and reduce overall workspace costs.
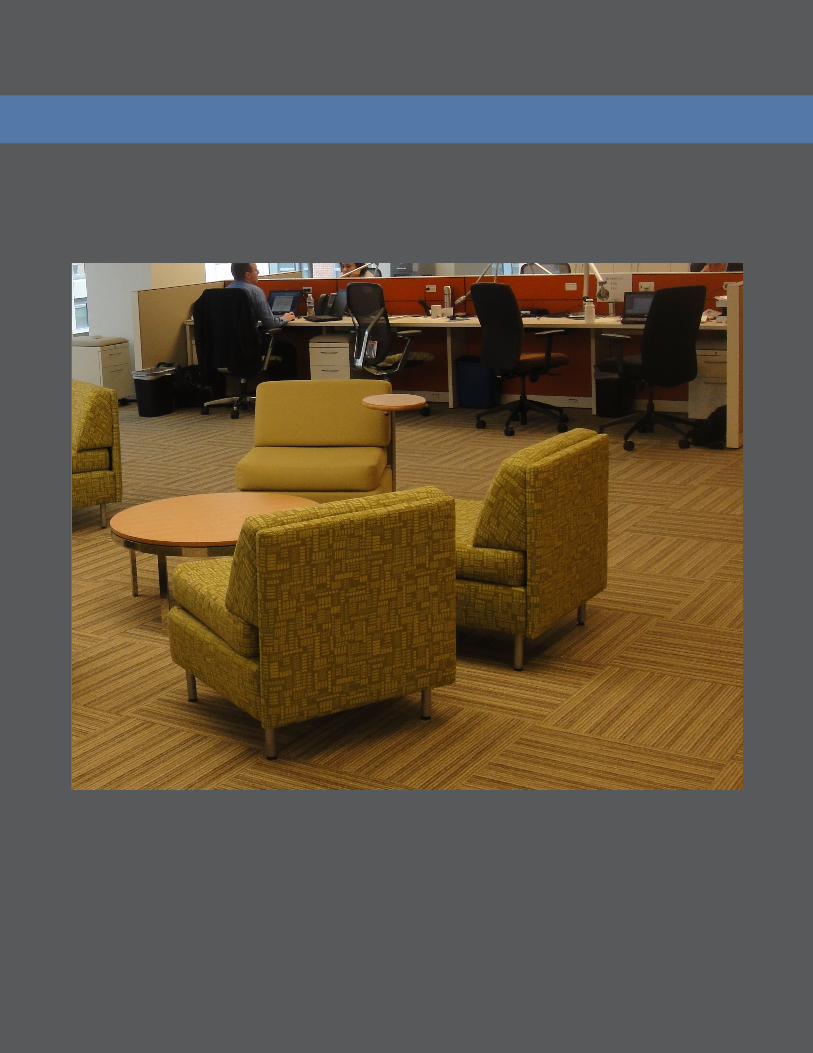
Our findings indicate that there are numerous other contributing factors at play in the push to make the allocation of the workspace smaller and more communal. Many responders are emphasizing teamwork, and the new mobile workforces that are accustomed to working anywhere but at a desk are turning up their noses at the hierarchical formality of the traditional workplace. In addition, familiar technologies such as laptop computers, smart phones and videoconferencing are finally beginning to affect the office workplace. Much like GSA’s Central Office, the new workplace is designed to squeeze together workstations while setting aside a few rooms where associates can conduct meetings and rooms to have private telephone conversations. Ideally, GSA’s design creates a workplace that is more open, collaborative, and efficient while utilizing fewer square feet per person.
Workplace Allocation Results
I
26
Workspace Utilization and Allocation Benchmark
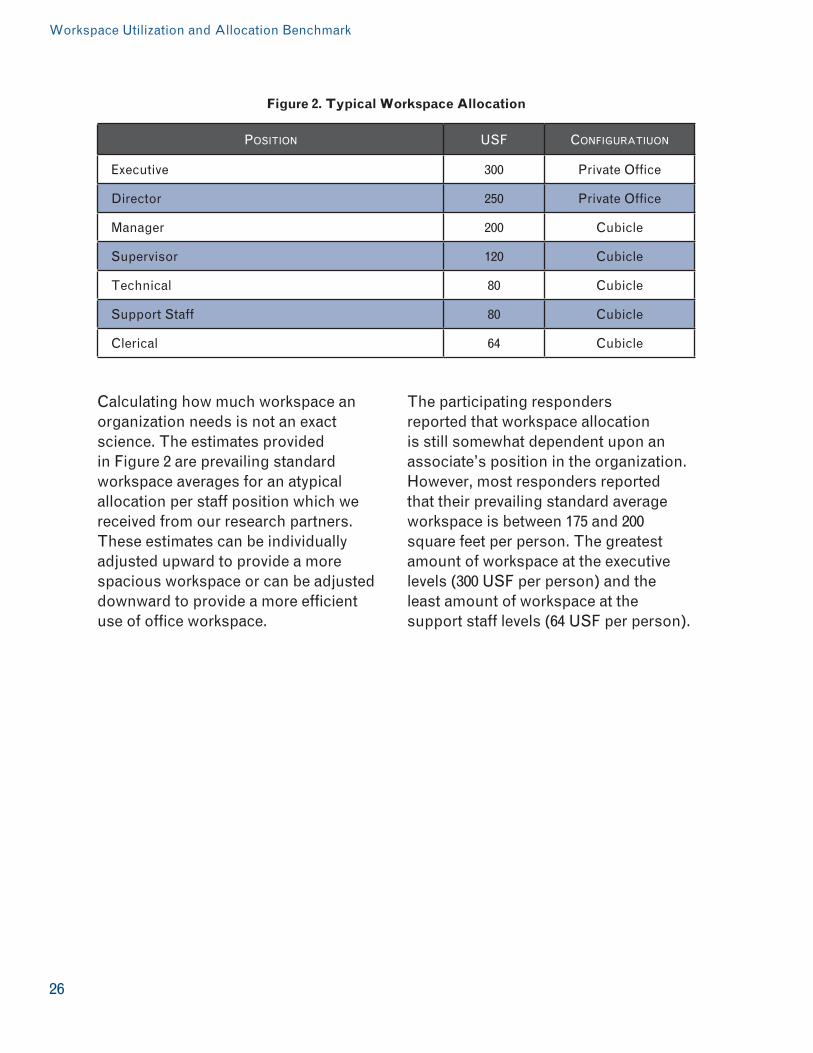
Calculating how much workspace an organization needs is not an exact science. The estimates provided in Figure 2 are prevailing standard workspace averages for an atypical allocation per staff position which we received from our research partners. These estimates can be individually adjusted upward to provide a more spacious workspace or can be adjusted downward to provide a more efficient use of office workspace.
The participating responders reported that workspace allocation is still somewhat dependent upon an associate’s position in the organization. However, most responders reported that their prevailing standard average workspace is between 175 and 200 square feet per person. The greatest amount of workspace at the executive levels (300 USF per person) and the least amount of workspace at the support staff levels (64 USF per person).
Figure 2. Typical Workspace Allocation
Position UsF ConFigUratiUon
Executive 300 Private Office
Director 250 Private Office
Manager 200 Cubicle
Supervisor 120 Cubicle
Technical 80 Cubicle
Support Staff 80 Cubicle
Clerical 64 Cubicle
27
Workspace Utilization and Allocation Benchmark
SA arbitrarily selected and benchmarked ten organizations to present a snapshot of the data received from our workplace survey. Support space, circulation,
collaborative space, amenities, storage, and other special spaces are all included in the prevailing standard workspace per staff position average.
Participating organizations include six private industry organizations.
Two of the organizations focus on manufacturing, two on business services, one is a media conglomerate, one is telecommunications and two are business services and consulting.
Participating benchmark organizations also include – one domestic government organization, one international government organization, one County Government organization and one Academic Institution.
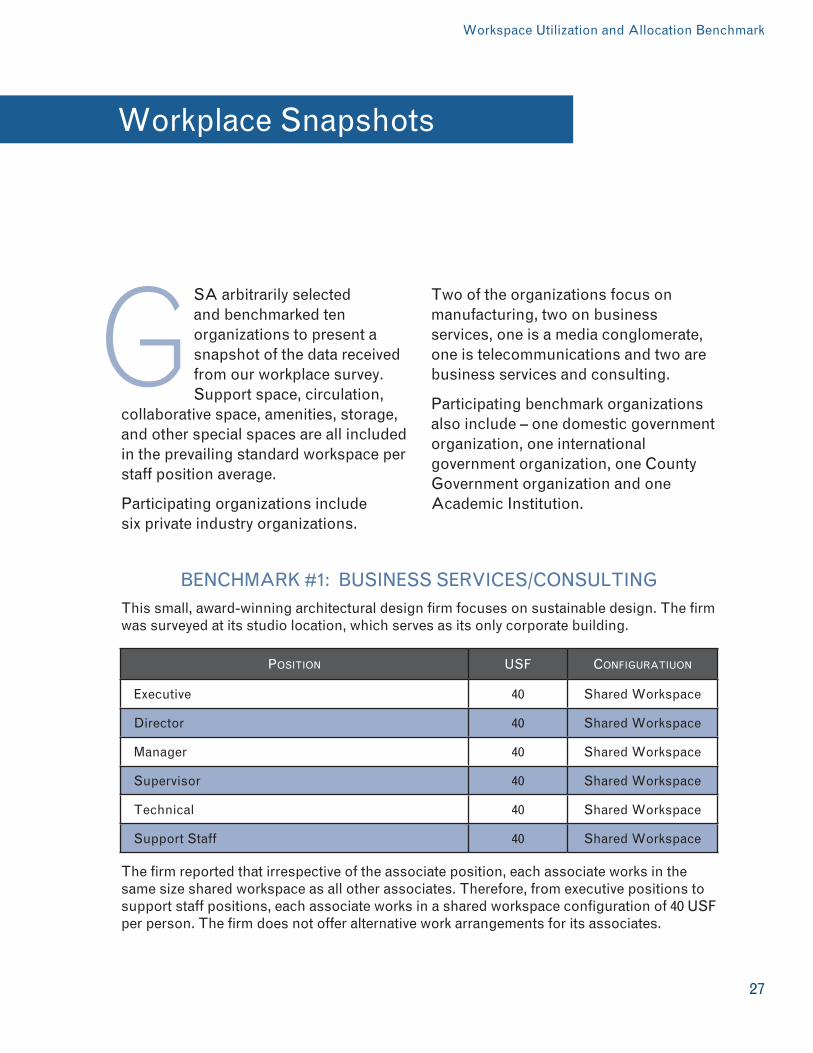
BENCHMARK #1: BUSINESS SERVICES/CONSULTINGThis small, award-winning architectural design firm focuses on sustainable design. The firm was surveyed at its studio location, which serves as its only corporate building.
Workplace Snapshots
G
Position UsF ConFigUratiUon
Executive 40 Shared Workspace
Director 40 Shared Workspace
Manager 40 Shared Workspace
Supervisor 40 Shared Workspace
Technical 40 Shared Workspace
Support Staff 40 Shared Workspace
The firm reported that irrespective of the associate position, each associate works in the same size shared workspace as all other associates. Therefore, from executive positions to support staff positions, each associate works in a shared workspace configuration of 40 USF per person. The firm does not offer alternative work arrangements for its associates.
Position UsF ConFigUratiUon
Executive 225 Private Office
Director 150 Private Office
Manager 90 Cubicle
Supervisor 65 Cubicle
Technical 65 Cubicle
Support Staff 65 Cubicle
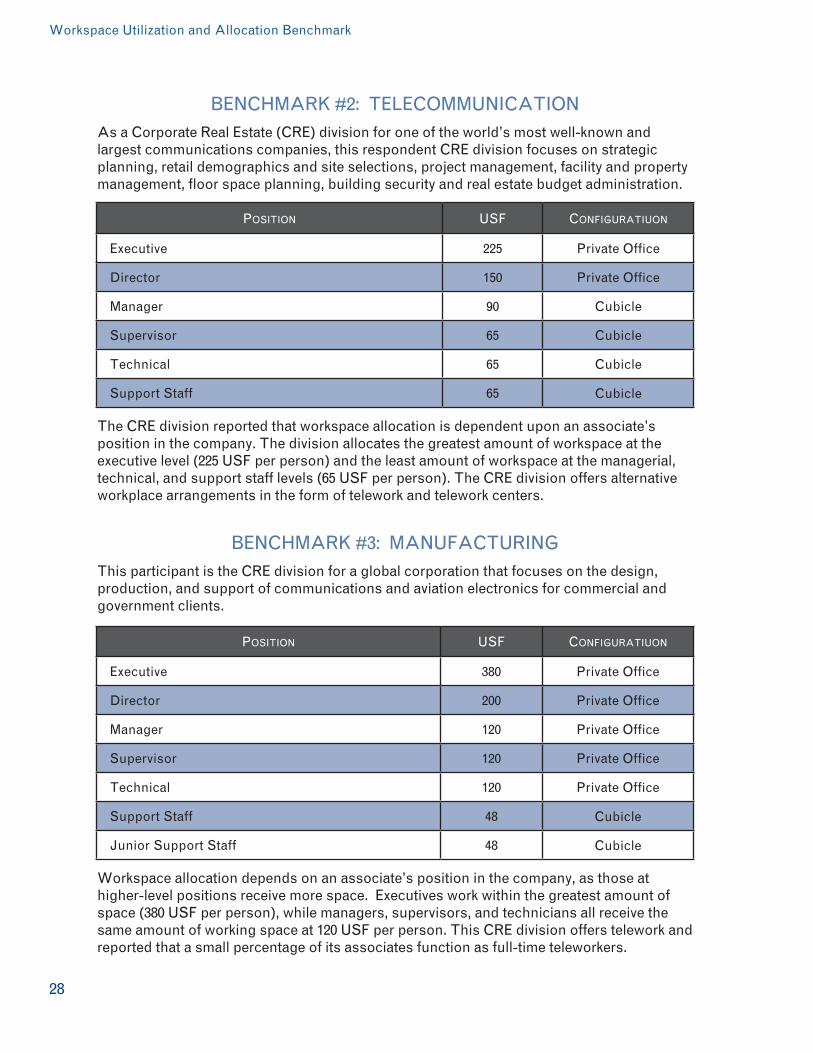
BENCHMARK #2: TELECOMMUNICATIONAs a Corporate Real Estate (CRE) division for one of the world’s most well-known and largest communications companies, this respondent CRE division focuses on strategic planning, retail demographics and site selections, project management, facility and property management, floor space planning, building security and real estate budget administration.
The CRE division reported that workspace allocation is dependent upon an associate’s position in the company. The division allocates the greatest amount of workspace at the executive level (225 USF per person) and the least amount of workspace at the managerial, technical, and support staff levels (65 USF per person). The CRE division offers alternative workplace arrangements in the form of telework and telework centers.
Position UsF ConFigUratiUon
Executive 380 Private Office
Director 200 Private Office
Manager 120 Private Office
Supervisor 120 Private Office
Technical 120 Private Office
Support Staff 48 Cubicle
Junior Support Staff 48 Cubicle
BENCHMARK #3: MANUFACTURINGThis participant is the CRE division for a global corporation that focuses on the design, production, and support of communications and aviation electronics for commercial and government clients.
Workspace allocation depends on an associate’s position in the company, as those at higher-level positions receive more space. Executives work within the greatest amount of space (380 USF per person), while managers, supervisors, and technicians all receive the same amount of working space at 120 USF per person. This CRE division offers telework and reported that a small percentage of its associates function as full-time teleworkers.
28
Workspace Utilization and Allocation Benchmark
29
Workspace Utilization and Allocation Benchmark
Position UsF ConFigUratiUon
Executive 400 Private Office
Director 300 Private Office
Manager 200 Private Office
Supervisor 120 Private Office
Technical 120 Private Office
Support Staff 80 Cubicle
Clerical 48 Cubicle
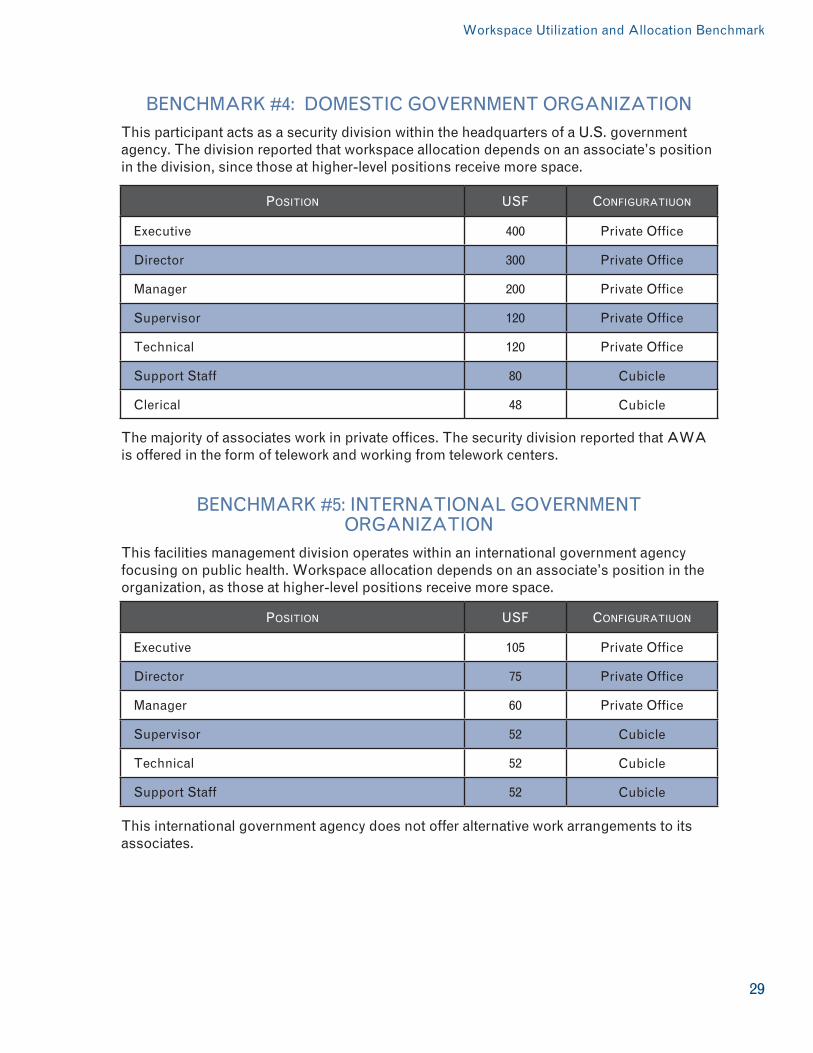
BENCHMARK #4: DOMESTIC GOVERNMENT ORGANIZATIONThis participant acts as a security division within the headquarters of a U.S. government agency. The division reported that workspace allocation depends on an associate’s position in the division, since those at higher-level positions receive more space.
The majority of associates work in private offices. The security division reported that AWA is offered in the form of telework and working from telework centers.
Position UsF ConFigUratiUon
Executive 105 Private Office
Director 75 Private Office
Manager 60 Private Office
Supervisor 52 Cubicle
Technical 52 Cubicle
Support Staff 52 Cubicle
BENCHMARK #5: INTERNATIONAL GOVERNMENT ORGANIZATION
This facilities management division operates within an international government agency focusing on public health. Workspace allocation depends on an associate’s position in the organization, as those at higher-level positions receive more space.
This international government agency does not offer alternative work arrangements to its associates.
Position UsF ConFigUratiUon
President 400 Private Office
Vice President 300 Private Office
Dean 240 Private Office
Department Chair 160 Private Office
Administrative Manager 100-160 Shared Office or Cubicle
Support Staff 64-100 Shared Office or Cubicle
Student Staff 30-64 Shared Office or Cubicle
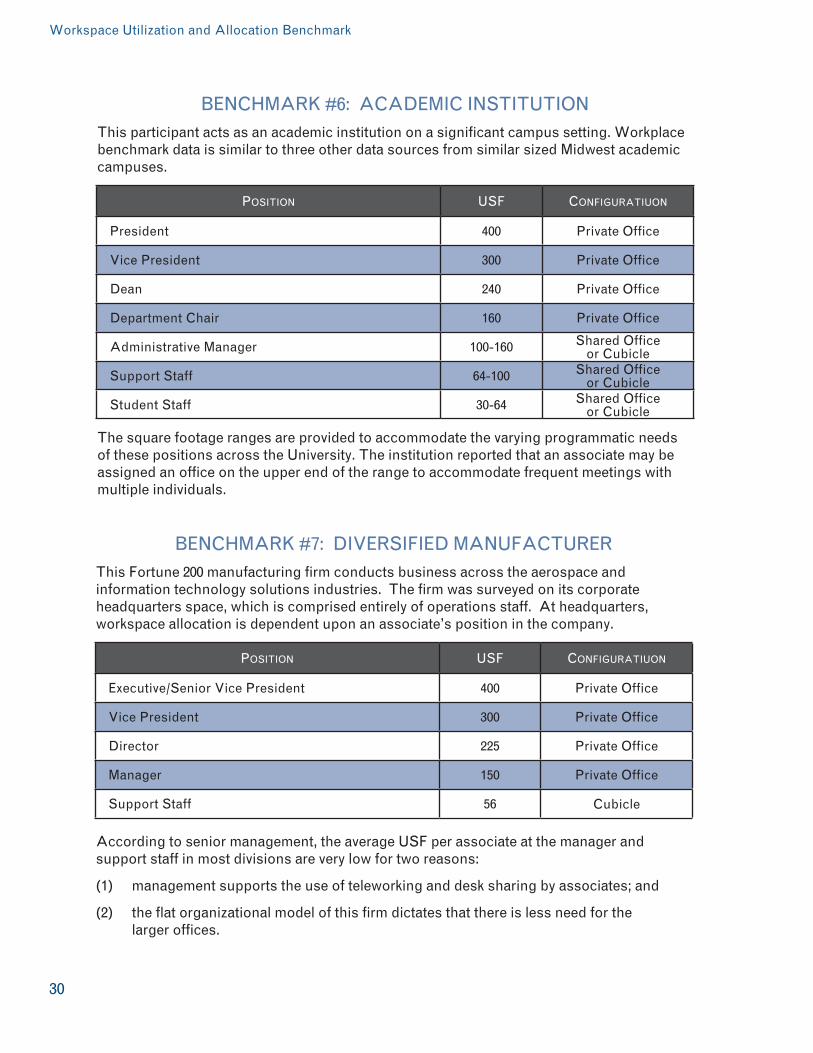
BENCHMARK #6: ACADEMIC INSTITUTIONThis participant acts as an academic institution on a significant campus setting. Workplace benchmark data is similar to three other data sources from similar sized Midwest academic campuses.
The square footage ranges are provided to accommodate the varying programmatic needs of these positions across the University. The institution reported that an associate may be assigned an office on the upper end of the range to accommodate frequent meetings with multiple individuals.
30
Workspace Utilization and Allocation Benchmark
Position UsF ConFigUratiUon
Executive/Senior Vice President 400 Private Office
Vice President 300 Private Office
Director 225 Private Office
Manager 150 Private Office
Support Staff 56 Cubicle
BENCHMARK #7: DIVERSIFIED MANUFACTURERThis Fortune 200 manufacturing firm conducts business across the aerospace and information technology solutions industries. The firm was surveyed on its corporate headquarters space, which is comprised entirely of operations staff. At headquarters, workspace allocation is dependent upon an associate’s position in the company.
According to senior management, the average USF per associate at the manager and support staff in most divisions are very low for two reasons:
(1) management supports the use of teleworking and desk sharing by associates; and
(2) the flat organizational model of this firm dictates that there is less need for the larger offices.
31
Workspace Utilization and Allocation Benchmark
Position UsF ConFigUratiUon
Senior Executives 225 Office
Executives 150 Office
Managers 64 Cubicle
Staff 64 Cubicle
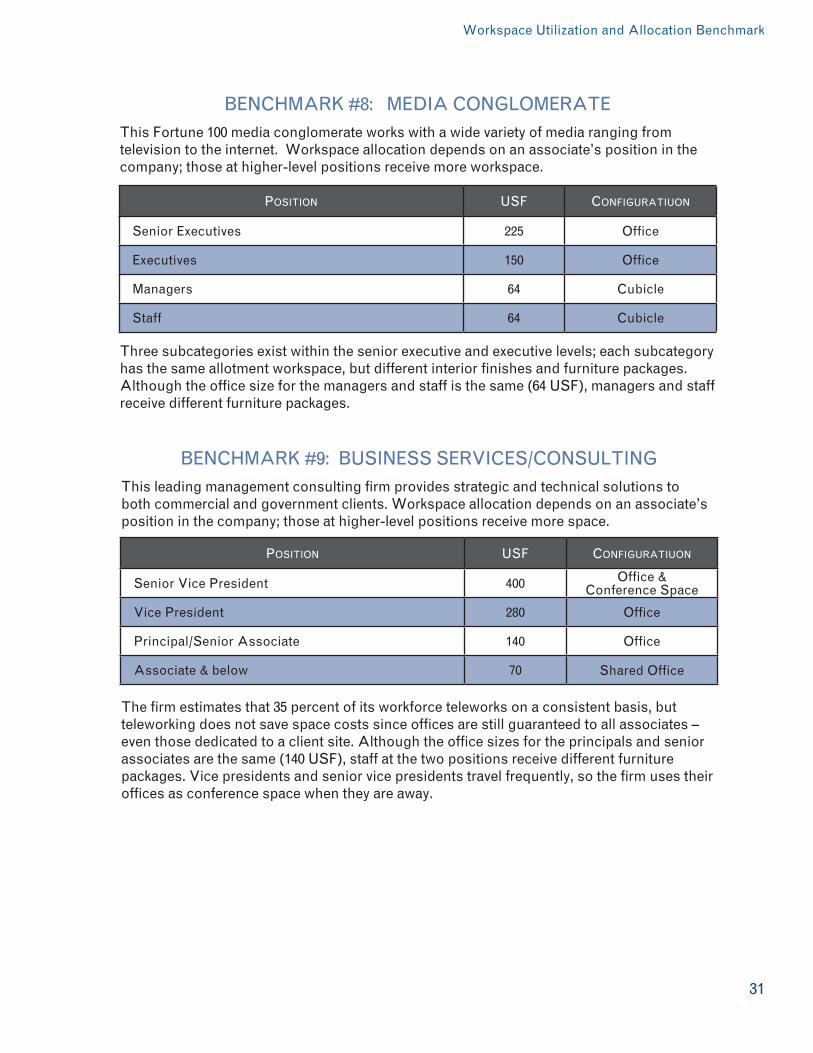
BENCHMARK #8: MEDIA CONGLOMERATEThis Fortune 100 media conglomerate works with a wide variety of media ranging from television to the internet. Workspace allocation depends on an associate’s position in the company; those at higher-level positions receive more workspace.
Three subcategories exist within the senior executive and executive levels; each subcategory has the same allotment workspace, but different interior finishes and furniture packages. Although the office size for the managers and staff is the same (64 USF), managers and staff receive different furniture packages.
Position UsF ConFigUratiUon
Senior Vice President 400 Office & Conference Space
Vice President 280 Office
Principal/Senior Associate 140 Office
Associate & below 70 Shared Office
BENCHMARK #9: BUSINESS SERVICES/CONSULTINGThis leading management consulting firm provides strategic and technical solutions to both commercial and government clients. Workspace allocation depends on an associate’s position in the company; those at higher-level positions receive more space.
The firm estimates that 35 percent of its workforce teleworks on a consistent basis, but teleworking does not save space costs since offices are still guaranteed to all associates – even those dedicated to a client site. Although the office sizes for the principals and senior associates are the same (140 USF), staff at the two positions receive different furniture packages. Vice presidents and senior vice presidents travel frequently, so the firm uses their offices as conference space when they are away.
32
Workspace Utilization and Allocation Benchmark
n today’s constantly changing workplace, organizations must find ways to remain competitive and to keep up with rapid technological advances and developments in business
environments. Learning to utilize the workplace as a strategic tool can help meet these objectives. The following case study participants—who are major players in the IT, real estate, furniture, and management consulting industries—demonstrate how to use resources when redefining the workplace as a dynamic, mobile environment.
Case Study #1: IBM Reduces Its Real Estate Footprint Through Telework
When IBM’s Norfolk, Virginia office assessed its levels of client satisfaction, staff satisfaction, and productivity, it had no idea that the findings would lead to a dramatic reduction in its real estate footprint. Assessment results showed that both IBM’s clients and staff wanted work arrangements that allowed them to collaborate at client sites on a daily basis. To accommodate this finding, the Norfolk office embarked on an eight month process designed to identify and
pilot a workable solution.
The office first developed a cross-functional research team of marketing, finance, technology, human capital, and real estate specialists, as well as IBM clients. Through field research techniques and focus groups, the team found that staff was willing to share space in the home office if they were given the technology necessary to support their customers while in the field. Since staff indicated that they did not necessarily require cubicles or desks at the IBM home office, the team explored a variety of new real estate designs. Ultimately, the team settled on a mixed use design consisting of multiple collaboration office spaces designed only for management. This design, which initially centered on a 4:1 staff-to-desk ratio, was based on the fact that staff was spending the majority of their work week at client sites. The mixed use design provided a flexible office environment for staff to return to as needed.
After announcing the pilot, the cross-functional team developed and delivered a carefully-designed communications campaign. Its key message was that this pilot was a move towards mobile work—working at customer sites or
I
Case Studies: Today’s Innovative Workplace
33
Workspace Utilization and Allocation Benchmark
in other remote offices as needed—and not simply a work-from-home program. A behavioral psychologist helped the office prepare for the cultural shift that would result from this new work arrangement. Managers and staff were encouraged to discuss potential frustrations with the new work arrangement in cultural training sessions.
Feedback from clients, staff, and management on the mixed use design was very positive.
Modeling Norfolk’s pilot, IBM implemented the same pilot program at four additional offices throughout the U.S. before implementing the mobile work program at all of its sales offices in 1995. IBM used its lessons learned from three years of pilot programs to implement the nationwide program in only two weeks. Under the program, IBM’s entire national field workforce— totaling 10,000 associates—gave up its dedicated workspaces. The nationwide program saved IBM a total of two million square feet (SF) of office space by eliminating 7500 workspaces in 1995 – resulting in approximately $100 million in annual U.S. savings.
Following the national rollout, IBM headquarters staff started to request the option of telework and alternative work environments. In response, IBM started alternative work environment programs at offices with expiring leases. Offices were deemed suitable for telework and mobile work arrangements by examining the number of staff, current use of space, and ratio of those who would telework.
IBM implemented an international rollout of telework and mobile work programs in 1996 – the same work programs are still offered today and mobile work and telework have become a global work arrangement for IBM. To support its mobile work programs, IBM hired a global mobility officer who leads a cross-functional team that works to design specific mobility programs for the company’s various regions. When designing programs, the team employs an 80/20 rule, which states that 80 percent of IBM’s support standards must be used worldwide, while 20 percent may be adapted to suit the local geography, business unit, and work culture of a specific region.
Today, 39 percent of IBM’s 300,000-member worldwide staff works in some type of a remote environment and the 4:1 staff-to-desk ratio has been gradually increased to an average of 12:1.
Over the past ten years, IBM has realized over one billion dollars in global real estate savings. While IBM does not have figures on its real estate savings in Asia Pacific and Latin America, it reports that alternative work arrangements save IBM $100 million annually in Europe. The savings realized in the U.S. and Europe is used for continued investments in leading-edge technical support for worldwide staff. In addition, IBM’s mobile quality-of-life benefits have proven instrumental in retaining and supporting both a maturing workforce and a younger generation of associates.
34
Workspace Utilization and Allocation Benchmark
Case Study #2: Sabre’s Workspace Innovation
The following case is extracted from Sabre Holdings Case Study.12
The Sabre Holdings Flexible Workspace Program (Flexspace) is an alternative, flexible space model where only a percentage of cubicles were assigned and others remained available for “flexible use.” Sabre was able to achieve significant savings within 18-months, reducing global real estate costs by 25 percent and ultimately created a sustainable enterprise transformation for value beyond the bottom line.
The seeds for Sabre’s Flexspace program were actually planted in 2000, as the company began planning for its new corporate headquarters in Southlake, Texas. The travel technology firm, with more than 9,000 associates in 59 countries was moving from being a mainframe computer-driven company with a corporate culture rooted in traditional hardwall offices to a more agile technology firm poised for growth. As executives strategized plans for Sabre’s new headquarters, they decided to look at things from the perspective of how they wanted associates to work to what building materials they wanted to use. Efficiency and flexibility would be important, both in terms of how associates would approach their work and how the building would operate.
Traditionally, gauging real estate performance means measuring real estate costs per employee. It is simply calculated by multiplying a building’s total cost per square-feet by the number
of square-feet allocated per position. But as a travel technology company, a healthy percentage of Sabre’s associates traveled on business, leaving their desks empty. Dean Sanderson, Sabre’s Vice President of Corporate Real Estate at the time, realized that if there was a way to increase utilization of the space, real estate costs could be dramatically reduced. But could it be done?
In 2006, Sabre was allocating about 350 square-feet per employee, well in line with industry standards at the time, although companies were beginning to look for ways to reduce that figure to 250 square feet. Even by traditional measures, the company had too much space. Its five headquarters buildings had 4,000 seats, but housed around 3,000 employees. After reviewing approximately six months of badge data from security checkpoints across campus, Sanderson confirmed what he and his real estate team had already speculated: employees were frequently out of the office, and on average, only 60%to65%ofthemwereactuallyintheoffice on any given day. Taking into account offsite meetings, vacation and sick time, even employees who didn’t travel and considered themselves daily on-site workers could easily be absent from their desks for one month out of the year.
If Sabre was going to fold its five headquarters offices into the two LEED-certified buildings, it would have to plan for 1.35 employees per cubicle — a significant increase from the 0.81 employees per cubicle the company had in 2006. Cubicles which varied in size depending upon an associates’ position
12 Sabre Holdings Case Study (2011) www.sabre holdings.com holdings.com/.../Sustainable_Business_Transformation_Through_Workspace_Innovation_full.pdf
35
Workspace Utilization and Allocation Benchmark
and level within the company would have be reconfigured into a standard size and outfitted with the same technology, so that associates could expect the same environment wherever they were physically placed to work. Executives too, who were the only associates with hardwall offices in the new headquarters building, would have to move to cubicles to make room for the additional meeting space required.
The figures were compelling. Flexspace would reduce Sabre’s headquarters buildings from 1.04 million square
feet, to 470,000 square feet, slashing annual operational expenses by $10 million within three years. In addition to operational savings and lease expense, the company would be able to generate additional cash by selling the other building it owned. Cost per employee at headquarters would
be cut in half, and the program would reduce global real estate costs per personbymorethan25%.
Mark Miller, Sabre’s CFO, says the program was significant because there are few things a company can do to quickly eliminate $10 million in expenses. By pushing for greater utilization of Sabre’s office space, the company was extracting more value out of its real estate assets. The cost savings which helped the company to avoid less appealing cost-cutting measures which are often necessary during weak economic cycles, such as
deep headcount reductions. “Ten million dollars is worth 100 jobs, when you consider all the costs,” Miller said.
The goal wasn’t to change the way people scheduled their work, but to more closely match the number of employees with the way they were already using the space, fitting the anticipated campus population of 3,000 employees into 2,200 seats.
Implementing a workplace transformation strategy like Flexspace can provide meaningful corporate savings that go far beyond the bottom line, and should be considered as part of any modern corporate real estate program. For Sabre, Flexspace was a corporate real estate strategy that slashed existing operating expenses by 25%,offeredatemplateforreducingthecost of future real estate expansions, and accomplished significant gains in reducing its environmental footprint.
Case Study #3: Herman Miller On Space Standards And Industry Trends
Herman Miller, Inc. (HMI), a global provider of office furniture and office design services, has observed that companies appear to be paying more attention to “human value” when making space allocation decisions. As a result, there seems to be much more focus on matching human needs with economic considerations. Therefore, organizations seem to move away from hierarchical space planning and more towards use of space that provides the best possible benefit for
Sabre reduced its headquarters footprint by 55%, from 1.04 million square-feet to 470,000 square-feet, and consolidating from five buildings to two.
36
Workspace Utilization and Allocation Benchmark
knowledge workers. Currently, 48 (6x8) SF per person is the lowest workspace allocation for knowledge workers that HMI typically sees in the marketplace. Unlike the RSF and USF metrics discussed earlier in this document, this allocation does not include common areas and only accounts for dedicated workspace. However, HMI is seeing workspace allocations as low as 36 (6x6) or 25 (5x5) SF per person for call center environments, since call center associates do not have the same storage and collaboration needs as knowledge workers.
HMI has also observed an increasing number of companies using telework to both reduce their real estate footprint and increase space allocation efficiency. HMI has observed that, traditionally, many companies have been slow to reinvent their work environments. For example, companies with telework programs often sent staff to work from home instead of redesigning their office space. In light of this trend, HMI has been working with companies to redesign office space that allows for a reduced space per person allocation. Its new “My Studio Environment” design includes a workspace with translucent sliding doors—which transmit light, block sound, and provide privacy—and sliding walls.
HMI currently recommends the following office space allocation measurements for an office that houses 100 to 120 associates:• Six private offices, at 120 SF per person • One 200 SF file room • Two to four 50 SF phone rooms • One 150-200 SF break room • Two 36 SF touch down areas • Two 120 SF conference rooms • Two 144 SF conference rooms • One 288 SF conference room • One 200 SF reception area • Two 48 SF collaboration spaces
As companies reduce individual workspace, HMI has observed that group shared space has increased. In fact, HMI believes that over the next five years, there will be a move towards 50/50 allocation of office space between individual and group needs. According to HMI, space allocation standards—such as GSA’s workspace benchmark average 195 USF per person—are reasonable, provided that planners incorporate the right elements in design. In other words, space planners should consider issues—such as associates’ functional requirements and needs for collaborative space—when making allocation decisions.
37
Workspace Utilization and Allocation Benchmark
By rethinking office design, companies are cutting real estate costs by nearly half.
DonDurfee,ResearchEditor,CFOMagazine
Remember 1999, when big companies rushed to imitate the dot-coms by crafting hip workplaces? Suddenly, relaxed dress codes, refrigerators full of Diet Coke and Snickers bars, and dogs in the halls made the corporate life seem a little less corporate.
Most of that funky aesthetic disappeared faster than you can say “New Economy,” but one facet is making a quiet comeback: the open office arrangement. Motivated more by a desire to save money on real estate than to please finicky associates, companies including Motorola, Ernst & Young, and Cisco Systems report that they have cut real estate costs significantly by adopting “alternative workplace” designs. Cisco, for example, has seen 37 to 40 percent savings from its new approach.
Capital One Financial Services Corp. has made the concept a key part of its “Future of Work” initiative by swapping traditional offices and cubicles for a mixture of unassigned desks, sofas, and conference spaces. The company’s cafeteria is designed to accommodate
informal meetings, and there are scattered café areas that look remarkably like the local Starbucks. Associates, equipped with wireless laptops, Blackberries, and cell phones, are free to work wherever they wish. Some companies are taking the idea further, combining new thinking on office space with an endorsement of telecommuting or the establishment of smaller, more modest regional offices that associates can drop in to as needed.
Empty Desks
The concept is not new; as Sandy Apgar, a partner with The Boston Consulting Group’s (BCG) real estate practice, says, “Over the years, many companies have touched on this topic but not gone much further. They run into significant resistance, especially from midlevel managers, and interest wanes.”
But there are reasons to believe that this time things may play out differently. A recent Gallup poll commissioned by CoreNet Global, a corporate real estate association, found that 20 percent of large companies expect to have between 25 and 50 percent of their associates working in unassigned spaces in 2012, and by 2020 the majority of large
Featured Article: Take My Desk — Please
The following article appears in the CFO Magazine24.
companies are expected to have adopted the practice to some extent.
The primary driver is economy: as managers work their way down the list of cost-cutting opportunities, real estate emerges as an attractive target. At most companies, property-related costs are second only to salaries and benefits. Some companies have already pared such expenses, typically by consolidating partly vacant buildings and either selling or subletting what’s left.
Alternative workplaces offer an opportunity for deeper cuts because they represent a shift from thinking about occupancy (how many people a building can accommodate if each worker is assigned a specific seat) to utilization (how many people actually use a building or office at any given time). “Companies are starting to realize that instead of being satisfied that their building is 95 percent occupied they should instead be worried that it’s only 40 percent utilized, because people are often out of the office,” says Prentice Knight, (former) CEO of CoreNet Global.
Matt Schuyler, Capital One’s executive vice president of human resources (he also oversees real estate), says he was “startled” by just how true that was after his team and the company’s finance department surveyed how office space was being used and calculated how much could be saved by reorganizing.
Double Occupancy
Research showed that associates were working somewhere other than their offices and cubicles more than half
the time. “Some people were using their offices only 5 percent of the time,” Schuyler says. By eliminating most dedicated workspaces (administrative assistants got to keep their own desks), the company has sharply reduced its needs. A building that once accommodated 650 associates, for example, now serves 1,200. Schuyler declines to say how much the company has saved, but real estate professionals say that such actions can produce savings of up to 40 percent.
Another factor pushing companies to reconsider office space is the widening gap between what workers need and what workplaces provide. At one time, office associates labored primarily in solitude; today, they spend two-thirds of their time collaborating, according to Gartner. But offices are still set up for the old style of work. “In most companies, you find that conference rooms are overbooked while offices and cubicles are empty,” says Mark Golan, Cisco’s vice president of worldwide real estate and the chairman of CoreNet. “It’s insane. Not only is it wasteful, it doesn’t suit the needs of your workforce.”
Like Capital One, Cisco’s response has been to turn the old design on its head by making the office a home away from home. “You don’t go home to a cubicle,” Golan says; “you move around the house depending on what you’re doing.” When Cisco’s associates aren’t on the road (they’re on the road about 20 percent of the time), they usually work together, so the space was reconfigured to provide open areas where associates can have quick, informal meetings, while work teams can gather in a range
38
Workspace Utilization and Allocation Benchmark
39
Workspace Utilization and Allocation Benchmark
of small and large conference rooms outfitted with video-conferencing equipment and digital whiteboards. When associates need what Capital One refers to as “heads-down quiet space” they can move to a library, where conversation is minimal and cell phones must stay on vibrate mode.
The goal is to augment the savings on real estate with enhanced productivity. Measuring productivity is never easy; as Cisco’s Golan notes, “It’s hard to isolate the effect that any one variable has on worker output.” But he says that a pilot project in the company’s call centers resulted in “very significant” improvements. Capital One attempts to crack the productivity code through worker surveys, and says that three-quarters of associates surveyed say they are now working as productively as possible, while just over half say that group productivity is up. The company also found a 24 to 31 percent reduction in the time needed to get input from managers and peers, which it says leads to faster decisions.
Making It Work
The good news is that alternative workplaces are much easier to set up than in years past. For many knowledge workers, work is almost synonymous with Internet access. Now that laptop computers are powerful and inexpensive, wireless networks proliferating, and various conferencing technologies maturing, “office space” can be created virtually by using the tools that workers would be supplied with anyway.
Full-service real estate providers have geared up to help companies make the transition. Such firms as Jones Lang LaSalle and Trammell Crow Co. now guide companies through the process, from space planning to implementation. Even furniture makers have joined the act. “A decade ago, if you wanted a mobile furniture system, you had to have it custom-built,” says Knight. Now, most components are available out of the box.
Building the new space is only half the effort, though — companies also need to persuade associates to embrace it. An office still conveys status for many, and some managers are uncomfortable with direct reports working at home or in ever-changing corners of the office. Associates may simply wonder where they are supposed to stash all their stuff.
Capital One addresses those and similar issues by launching a needs assessment that examines how work gets done in each unit. (To date, eight units of the company totaling about 2,000 associates have moved to the new system, with some of the biggest groups slated to make the move next year.) The design of each space varies depending on the needs of the people who use it. For example, in IT much of the work is done on a project basis, with teams forming and then disbanding once projects are completed. So the company created “agile project rooms,” with movable walls, electronic whiteboards, and even careful control over the thermostat, because with all that gear and people in one place, the temperature can climb to uncomfortable levels.
Associates are given the option of “going mobile,” and about 80 percent
choose to do so. They receive six to eight weeks of training on everything from how to be productive while working in virtual teams to how to use new equipment, to how to manage their own piles of paperwork when they no longer have dedicated desks. (Hint: forget hard copies and instead embrace the “paperless office.”)
Flexibility is essential. There are big differences between what suits the sales staff, who travel a lot, and the engineers, who are more office-bound and have more gear. Companies may also discover that some seemingly good ideas don’t work. Hewlett-Packard, for example, which is in the midst of a four-year overhaul of its hundreds of buildings worldwide, found that newly created small project rooms, enclosed by low partitions, were too noisy. It has
since added glass walls that extend to the ceiling.
Executives at companies that have made the move to alternative workplaces agree that the change-management issues require a lot of attention. One financial services firm in New York jump-started its process by giving managers a reduced amount of office space and left it to them to decide whether to stick with the traditional office layout, which would result in a cramped cubicle hell, or adopt a more inviting, open plan that allowed for some growth possibilities — assuming associates shared the space. As Chris Howe of BCG notes, “It doesn’t force anyone to do things a certain way, but it does make the trade-offs very clear.”
40
Workspace Utilization and Allocation Benchmark

43
Workspace Utilization and Allocation Benchmark
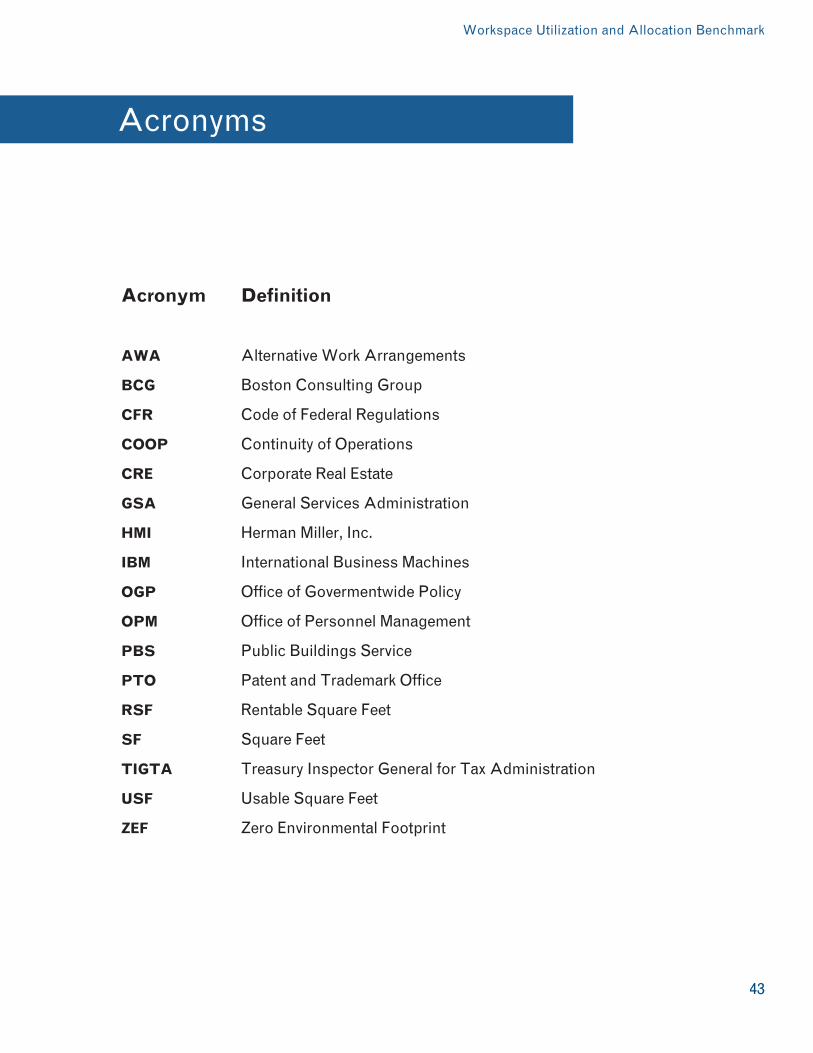
Acronym Definition
AWA Alternative Work Arrangements
BCG Boston Consulting Group
CFR Code of Federal Regulations
COOP Continuity of Operations
CRE Corporate Real Estate
GSA General Services Administration
HMI Herman Miller, Inc.
IBM International Business Machines
OGP Office of Govermentwide Policy
OPM Office of Personnel Management
PBS Public Buildings Service
PTO Patent and Trademark Office
RSF Rentable Square Feet
SF Square Feet
TIGTA Treasury Inspector General for Tax Administration
USF Usable Square Feet
ZEF Zero Environmental Footprint
Acronyms
Smarter Solutions
July 2011
GSA Office of Governmentwide Policy Office of Real Property Management Performance Measurement Division
U.S. General Services Administration1800FStreet,NWWashington, DC 20405www.gsa.gov