Embed Size (px)
Citation preview
World Geography 3202 August 2009 KeyPage 1 of 17
World Geography 3202Answer KeyAugust 2009
1. C 30. C
2. D 31. D
3. A 32. B
4. C 33. B
5. D 34. C
6. A 35. D
7. B 36. C
8. A 37. C
9. A 38. C
10. C 39. B
11. D 40. A
12. B 41. D
13. B 42. D
14. B 43. D
15. A 44. A
16. D 45. B
17. C 46. C
18. C 47. B
19. C 48. B
20. A 49. A
21. C 50. A
22. B 51. D
23. A 52. B
24. D 53. C
25. C 54. D
26. A 55. C
27. C 56. A
28. C 57. A
29. D 58. D
World Geography 3202 August 2009 Key Page 2 of 17
PART II
SECTION A TOTAL VALUE: 8%
Instructions: Do ALL questions in PART II, Section A.
Value
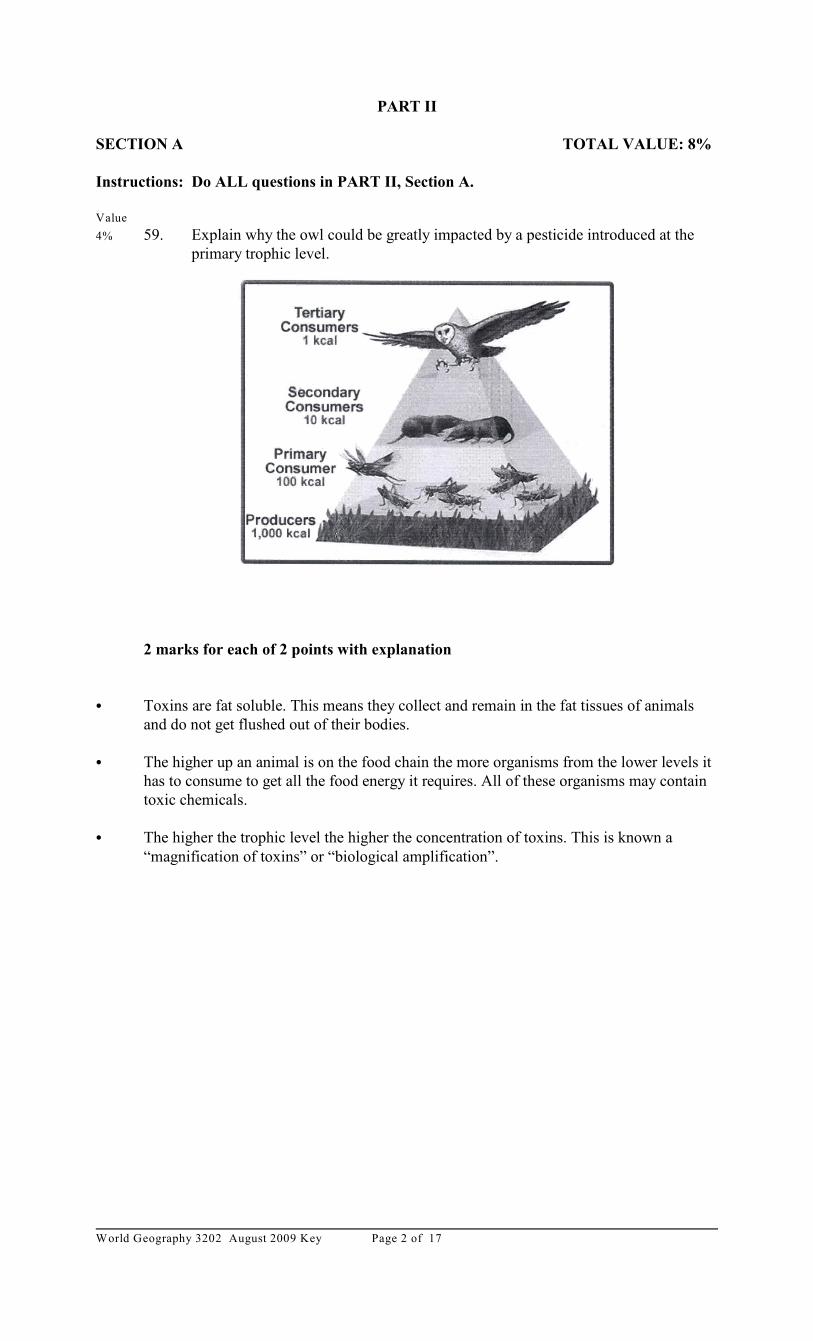
4% 59. Explain why the owl could be greatly impacted by a pesticide introduced at theprimary trophic level.
2 marks for each of 2 points with explanation
C Toxins are fat soluble. This means they collect and remain in the fat tissues of animalsand do not get flushed out of their bodies.
C The higher up an animal is on the food chain the more organisms from the lower levels ithas to consume to get all the food energy it requires. All of these organisms may containtoxic chemicals.
C The higher the trophic level the higher the concentration of toxins. This is known a“magnification of toxins” or “biological amplification”.
World Geography 3202 August 2009 KeyPage 3 of 17
Value
4% 60. Many countries have rich offshore oil resources they have known about for manyyears and have not developed. Explain two factors which could account for thislack of development.
2 marks for each of 2 factors fully explained1 mark if factor is listed
C Technology must be available to extract the resource.
C Extraction of the resource must turn a profit for the companies. If the price of oil is toolow, companies may wait and extract the oil when the price rises and a greater profit canbe realized.
C Countries often need agreement from several companies (as in the case of the HiberniaProject ) to carry out development and may not be able to achieve this agreement due to avariety of reasons. ( i.e. profit sharing, initial investment, etc. )
World Geography 3202 August 2009 Key Page 4 of 17
SECTION B TOTAL VALUE: 4%
Do only ONE of the Units in Section B.
Either: Unit 6 - Population Distribution and Growth (# 61)Or: Unit 7 - Settlement and Urbanization (# 62)
UNIT 6 - Population Distribution and Growth
Value
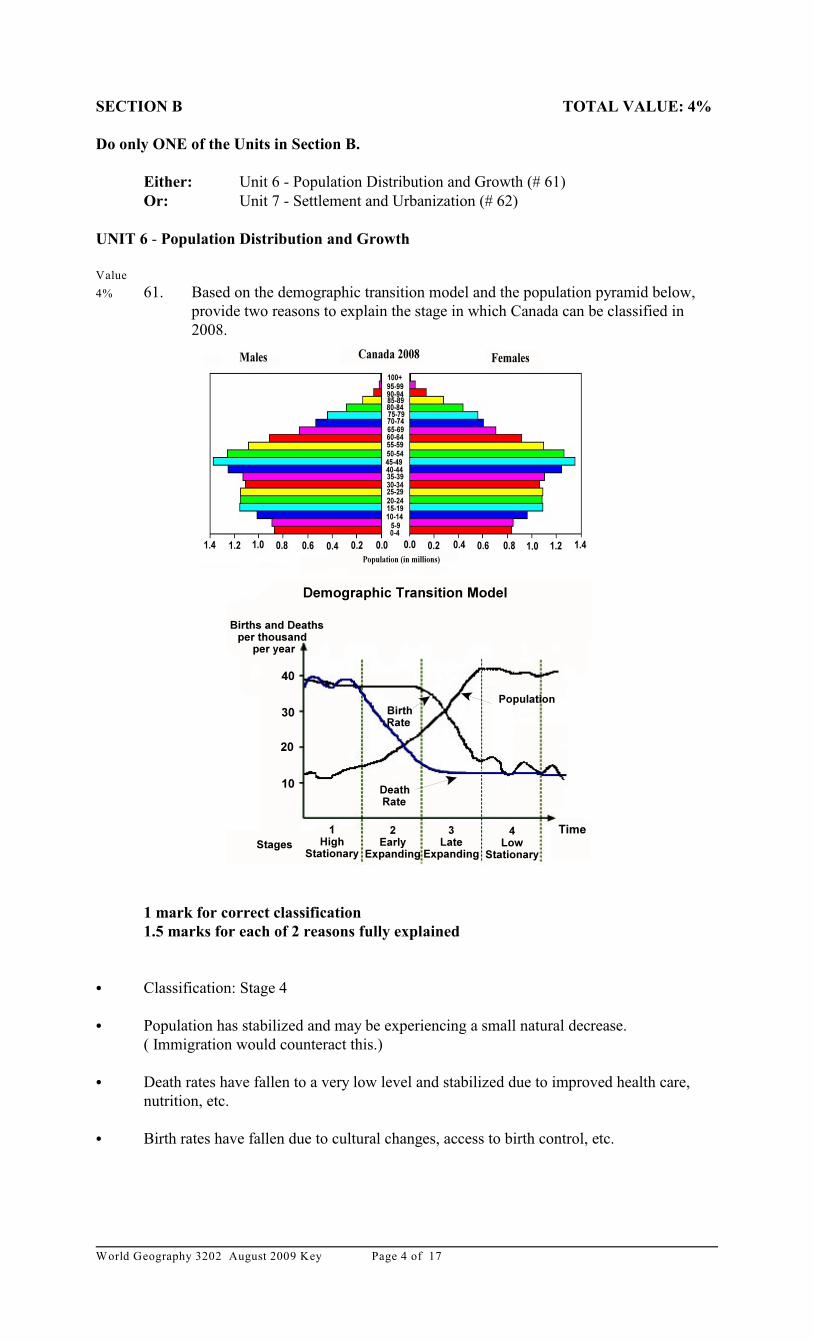
4% 61. Based on the demographic transition model and the population pyramid below,provide two reasons to explain the stage in which Canada can be classified in2008.
1 mark for correct classification1.5 marks for each of 2 reasons fully explained
C Classification: Stage 4
C Population has stabilized and may be experiencing a small natural decrease.( Immigration would counteract this.)
C Death rates have fallen to a very low level and stabilized due to improved health care,nutrition, etc.
C Birth rates have fallen due to cultural changes, access to birth control, etc.
World Geography 3202 August 2009 KeyPage 5 of 17
UNIT 7 - Settlement and Urbanization
Value
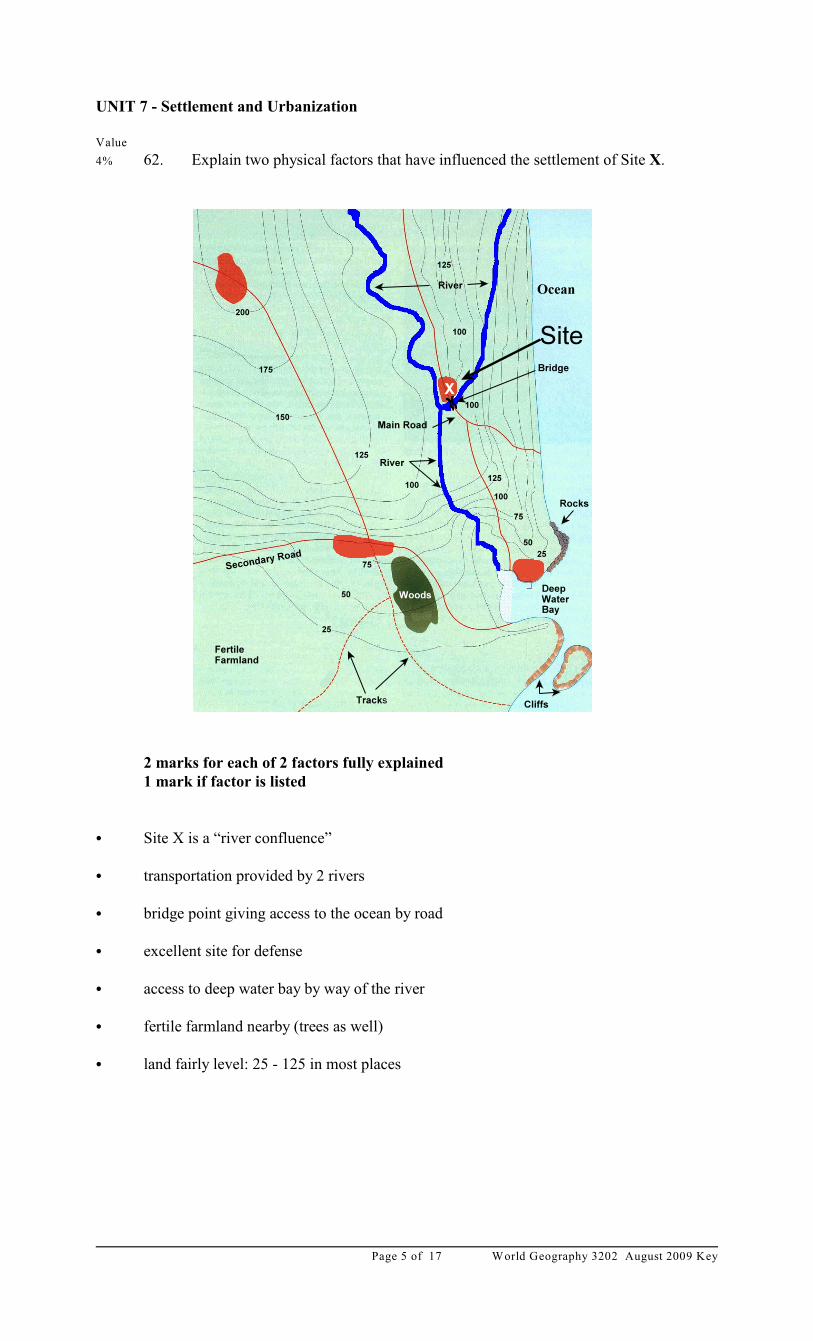
4% 62. Explain two physical factors that have influenced the settlement of Site X.
2 marks for each of 2 factors fully explained1 mark if factor is listed
C Site X is a “river confluence”
C transportation provided by 2 rivers
C bridge point giving access to the ocean by road
C excellent site for defense
C access to deep water bay by way of the river
C fertile farmland nearby (trees as well)
C land fairly level: 25 - 125 in most places
World Geography 3202 August 2009 Key Page 6 of 17
Part II
Section C TOTAL VALUE: 28%
Instructions: Do ALL questions in PART II, Section C.
Units 1-5
CASE STUDY 1: Earthquake Destruction: A Closer Look
An earthquake is a phenomenon that results from and is powered by the sudden release of storedenergy in the crust that transmits seismic waves. At Earth’s surface, earthquakes may manifestthemselves by a shaking or displacement of the ground and sometimes results in large wavesknown as tsunamis.
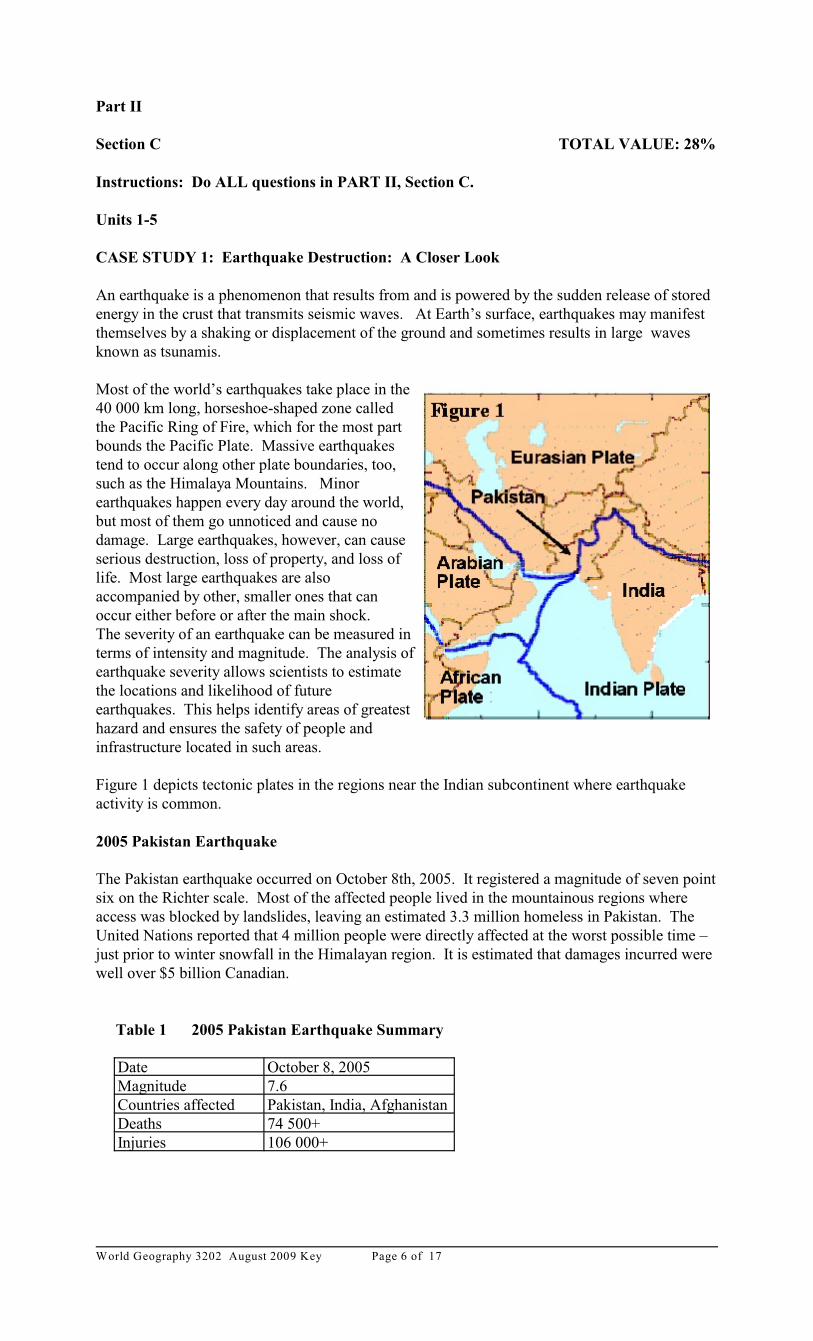
Most of the world’s earthquakes take place in the40 000 km long, horseshoe-shaped zone calledthe Pacific Ring of Fire, which for the most partbounds the Pacific Plate. Massive earthquakestend to occur along other plate boundaries, too,such as the Himalaya Mountains. Minorearthquakes happen every day around the world,but most of them go unnoticed and cause nodamage. Large earthquakes, however, can causeserious destruction, loss of property, and loss oflife. Most large earthquakes are alsoaccompanied by other, smaller ones that canoccur either before or after the main shock.The severity of an earthquake can be measured interms of intensity and magnitude. The analysis ofearthquake severity allows scientists to estimatethe locations and likelihood of futureearthquakes. This helps identify areas of greatesthazard and ensures the safety of people andinfrastructure located in such areas.
Figure 1 depicts tectonic plates in the regions near the Indian subcontinent where earthquakeactivity is common.
2005 Pakistan Earthquake
The Pakistan earthquake occurred on October 8th, 2005. It registered a magnitude of seven pointsix on the Richter scale. Most of the affected people lived in the mountainous regions whereaccess was blocked by landslides, leaving an estimated 3.3 million homeless in Pakistan. TheUnited Nations reported that 4 million people were directly affected at the worst possible time –just prior to winter snowfall in the Himalayan region. It is estimated that damages incurred werewell over $5 billion Canadian.
Table 1 2005 Pakistan Earthquake Summary
Date October 8, 2005 Magnitude 7.6 Countries affected Pakistan, India, Afghanistan Deaths 74 500+ Injuries 106 000+
World Geography 3202 August 2009 KeyPage 7 of 17
“In those camps where 40 000 people live, they have not had a lot of attention since lastyear, so the tents are run down and the facilities have not been maintained as well as theycould have been.”
Kate Simpson – International Aid Worker (Oxfam)
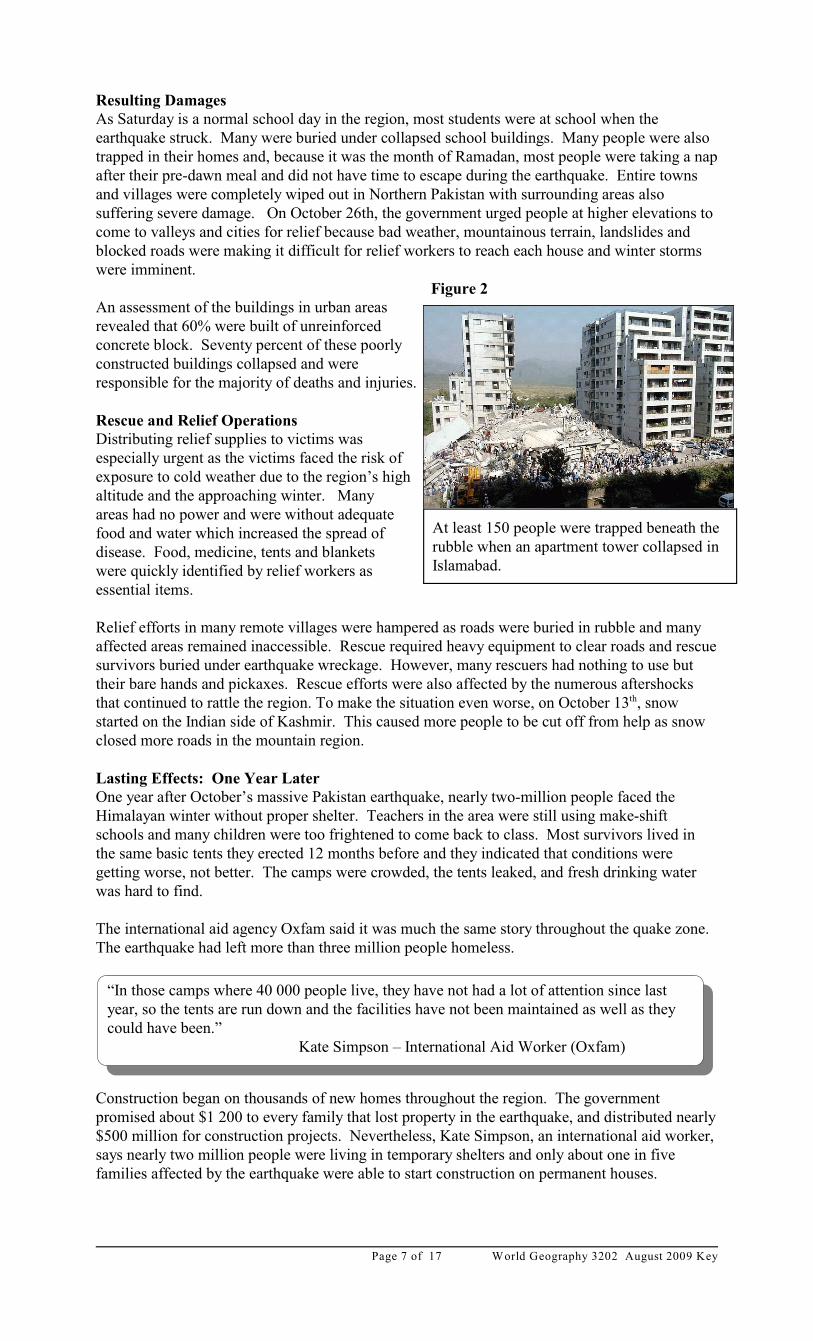
At least 150 people were trapped beneath therubble when an apartment tower collapsed inIslamabad.
Resulting DamagesAs Saturday is a normal school day in the region, most students were at school when theearthquake struck. Many were buried under collapsed school buildings. Many people were alsotrapped in their homes and, because it was the month of Ramadan, most people were taking a napafter their pre-dawn meal and did not have time to escape during the earthquake. Entire townsand villages were completely wiped out in Northern Pakistan with surrounding areas alsosuffering severe damage. On October 26th, the government urged people at higher elevations tocome to valleys and cities for relief because bad weather, mountainous terrain, landslides andblocked roads were making it difficult for relief workers to reach each house and winter stormswere imminent.
Figure 2An assessment of the buildings in urban areasrevealed that 60% were built of unreinforcedconcrete block. Seventy percent of these poorlyconstructed buildings collapsed and wereresponsible for the majority of deaths and injuries.
Rescue and Relief OperationsDistributing relief supplies to victims wasespecially urgent as the victims faced the risk ofexposure to cold weather due to the region’s highaltitude and the approaching winter. Manyareas had no power and were without adequatefood and water which increased the spread ofdisease. Food, medicine, tents and blanketswere quickly identified by relief workers asessential items.
Relief efforts in many remote villages were hampered as roads were buried in rubble and manyaffected areas remained inaccessible. Rescue required heavy equipment to clear roads and rescuesurvivors buried under earthquake wreckage. However, many rescuers had nothing to use buttheir bare hands and pickaxes. Rescue efforts were also affected by the numerous aftershocksthat continued to rattle the region. To make the situation even worse, on October 13 , snowth
started on the Indian side of Kashmir. This caused more people to be cut off from help as snowclosed more roads in the mountain region.
Lasting Effects: One Year LaterOne year after October’s massive Pakistan earthquake, nearly two-million people faced theHimalayan winter without proper shelter. Teachers in the area were still using make-shiftschools and many children were too frightened to come back to class. Most survivors lived inthe same basic tents they erected 12 months before and they indicated that conditions weregetting worse, not better. The camps were crowded, the tents leaked, and fresh drinking waterwas hard to find.
The international aid agency Oxfam said it was much the same story throughout the quake zone.The earthquake had left more than three million people homeless.
Construction began on thousands of new homes throughout the region. The government promised about $1 200 to every family that lost property in the earthquake, and distributed nearly$500 million for construction projects. Nevertheless, Kate Simpson, an international aid worker,says nearly two million people were living in temporary shelters and only about one in fivefamilies affected by the earthquake were able to start construction on permanent houses.
World Geography 3202 August 2009 Key Page 8 of 17
“Many of the quake survivors are also starved for information; how to apply forcompensation, where to pick up the money and, critically, how to properly rebuild theirhomes. Because the risk of future earthquakes is a significant issue, when people arerebuilding they need information on how to rebuild safely.”
Kate Simpson – International Aid Worker (Oxfam)
Value
4% 63. Using the case study and your geographical knowledge, provide two waysresidents of this region respond to earthquake destruction.
2 marks for each of 2 reasons
C Relief efforts were carried out but were very slow and inefficient.
C Refugee camps were constructed for people left homeless by the earthquake.
C Teachers tried to reconstruct schools but students were too afraid to return to school.
C People tried to rebuild homes but reconstruction was slow.
C Governments and NGO’s provided relief but residents found the relief hard to access.
Value
4% 64. Pakistan’s and Kashmir’s low level of development has slowed recovery effortsfrom the earthquake. Describe two social or economic factors that contributed tothis problem.
2 marks for each of 2 factors fully described1 mark if factor is listed
C poorly constructed homes
C little access to region due to inability to clear roads, etc.
C lack of adequate equipment to reach remote areas
C little attention paid to people after the event such that living conditions continued todeteriorate long after the earthquake
C poor communication networks
C people lacked the knowledge of how to rebuild more earthquake proof structures
C knowledge of proper building techniques was difficult to obtain
C difficult to get relief supplies to victims
C no power, little food and water, spread of disease
C many developing countries are involved in civil conflict and governments put money intowar efforts as opposed to development
World Geography 3202 August 2009 KeyPage 9 of 17
Value
6% 65. Using the case study and your geographical knowledge, propose three possiblesolutions to decrease deaths, injuries and the amount of property damage that mayoccur in future earthquakes.
2 marks for each solution
C early warning systems such that people may prepare or evacuate
C plans in place to make sure victims receive adequate food and water
C greater influx of money during relief effort such that life returns to normal as quickly aspossible
C obtaining adequate equipment so roads can be cleared and remote villages reached
C proper medical facilities in place
C improved communication such that victims are aware of relief efforts, etc.
C establishment of building codes
C development of evacuation plans
World Geography 3202 August 2009 Key Page 10 of 17
Units 1-5
CASE STUDY 2: The Power of Place
General Motors (GM) announced in January 1985 that it was designing an entirely new car calledthe Saturn, and it would need a factory somewhere in the United States to build it. Theannouncement touched off a fierce competition among states and localities to become home forthe plant. General Motors used geographic factors of site and situation to narrow the choice oflocations and to make the final selection.
General Motors felt that the most critical factor was the cost of delivering assembled vehiclesfrom the factory to the consumer. The company calculated the optimal location for the plant tobe within a 1.2 million square kilometre area with a radius of roughly 500 kilometres centered onsouth central Ohio. Locations outside the circle were calculated to add between $400 and $500per vehicle in freight charges, in part because truck drivers would be required to stop overnightmore often, as well as drive longer distances.
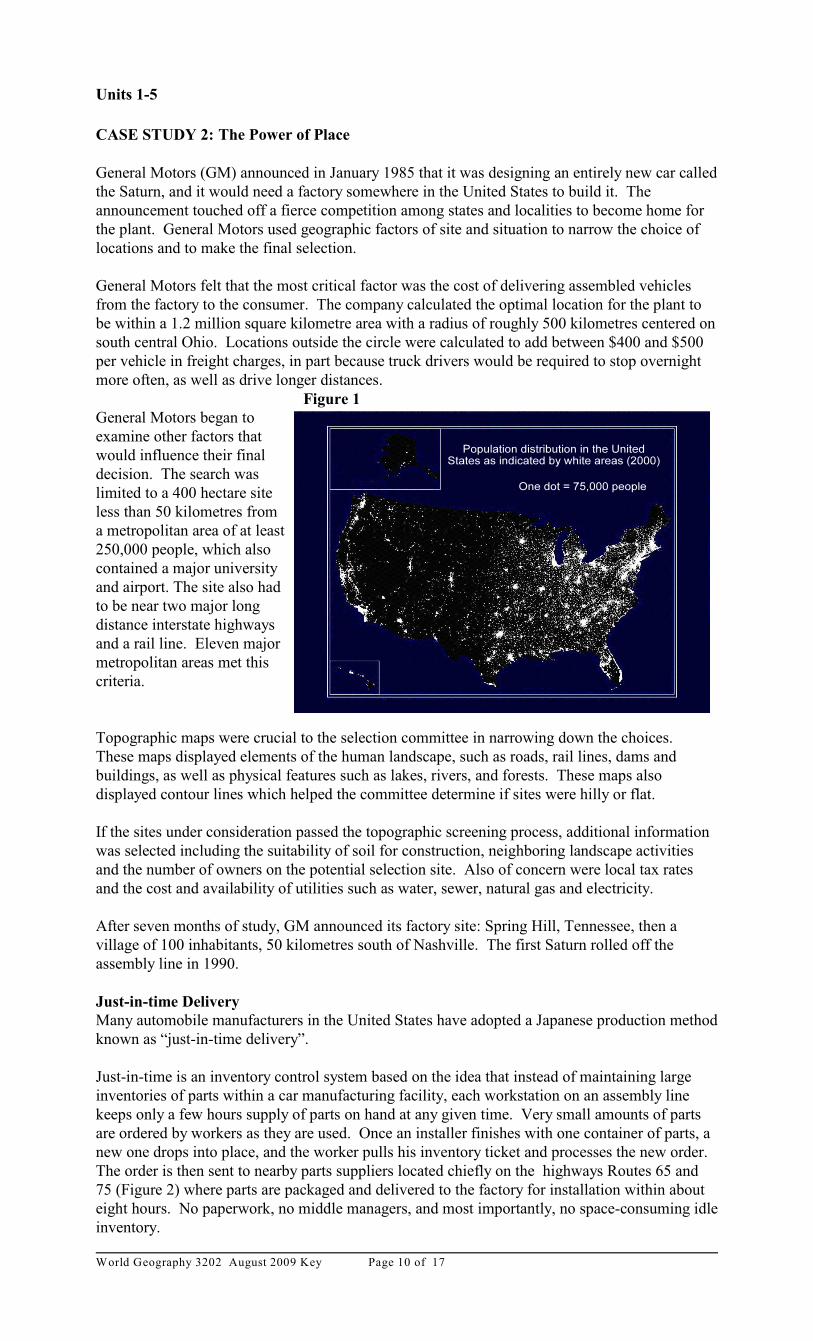
Figure 1General Motors began toexamine other factors thatwould influence their finaldecision. The search waslimited to a 400 hectare siteless than 50 kilometres from a metropolitan area of at least250,000 people, which alsocontained a major universityand airport. The site also hadto be near two major longdistance interstate highwaysand a rail line. Eleven majormetropolitan areas met thiscriteria.
Topographic maps were crucial to the selection committee in narrowing down the choices. These maps displayed elements of the human landscape, such as roads, rail lines, dams andbuildings, as well as physical features such as lakes, rivers, and forests. These maps alsodisplayed contour lines which helped the committee determine if sites were hilly or flat.
If the sites under consideration passed the topographic screening process, additional informationwas selected including the suitability of soil for construction, neighboring landscape activitiesand the number of owners on the potential selection site. Also of concern were local tax ratesand the cost and availability of utilities such as water, sewer, natural gas and electricity.
After seven months of study, GM announced its factory site: Spring Hill, Tennessee, then avillage of 100 inhabitants, 50 kilometres south of Nashville. The first Saturn rolled off theassembly line in 1990.
Just-in-time DeliveryMany automobile manufacturers in the United States have adopted a Japanese production methodknown as “just-in-time delivery”.
Just-in-time is an inventory control system based on the idea that instead of maintaining largeinventories of parts within a car manufacturing facility, each workstation on an assembly linekeeps only a few hours supply of parts on hand at any given time. Very small amounts of partsare ordered by workers as they are used. Once an installer finishes with one container of parts, anew one drops into place, and the worker pulls his inventory ticket and processes the new order. The order is then sent to nearby parts suppliers located chiefly on the highways Routes 65 and75 (Figure 2) where parts are packaged and delivered to the factory for installation within abouteight hours. No paperwork, no middle managers, and most importantly, no space-consuming idleinventory.
World Geography 3202 August 2009 KeyPage 11 of 17
Just-in-time manufacturing is reshaping the factory floor and is, on a much larger scale, alsochanging the geography of parts supply networks. The old mass production process more easilyaccommodated parts shipped from around the world - an engine from Germany, a transmissionfrom Japan, bumpers from Korea - as an integrated individual car was produced. But just-in-timeputs a premium on proximity and quality control. Parts suppliers in the Midwest have settledalong two major highways, near the assembly plants they serve.
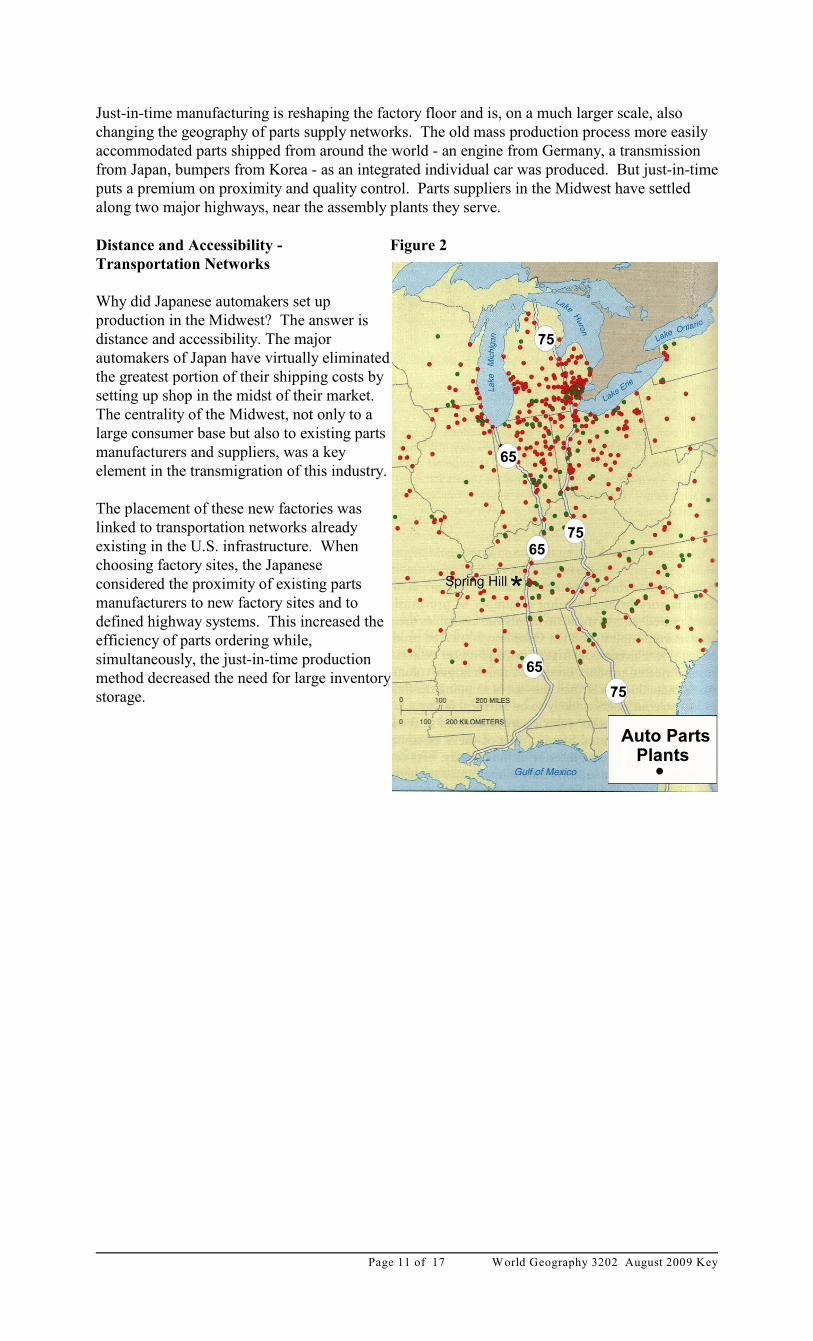
Distance and Accessibility - Figure 2Transportation Networks
Why did Japanese automakers set upproduction in the Midwest? The answer isdistance and accessibility. The majorautomakers of Japan have virtually eliminatedthe greatest portion of their shipping costs bysetting up shop in the midst of their market. The centrality of the Midwest, not only to alarge consumer base but also to existing partsmanufacturers and suppliers, was a keyelement in the transmigration of this industry.
The placement of these new factories waslinked to transportation networks alreadyexisting in the U.S. infrastructure. Whenchoosing factory sites, the Japaneseconsidered the proximity of existing partsmanufacturers to new factory sites and todefined highway systems. This increased theefficiency of parts ordering while,simultaneously, the just-in-time productionmethod decreased the need for large inventorystorage.
World Geography 3202 August 2009 Key Page 12 of 17
Value
4% 66. Automobile manufacturers use site and situation factors in deciding the locationof their factories. Explain the concepts of site and situation and provide oneexample of each from the case study.
1 mark for each definition (site and situation)1 mark for each example
C Site: physical aspects of the location
C land hilly or flat
C adequate land available for expansion
C suitability of soil for construction
C neighboring landscape activities
C cost and availability of water, sewer, natural gas, electricity, etc.
C Situation: location of the factory (site) in relation to other services in the surrounding area
C proximity to major state highways and railways
C proximity to large metropolitan area with university and airport
C local tax rates
C proximity to parts suppliers and manufacturers
C large consumer base in immediate area
Value
4% 67. Using evidence from the case study, explain whether GM’s Saturn factory iseither market or resource-oriented. Provide two pieces of evidence to supportyour choice.
1 mark for choice of market or resource-oriented1.5 marks for each of 2 pieces of evidence
C GM’s Saturn factory is “market-oriented”
C GM wanted to locate in an area of high population to provide a large consumer basewithin a small area. This would cut down on the transportation cost of the finishedproduct.
C make use of existing transportation routes and infrastructure
C proximity to existing parts manufactures and suppliers
World Geography 3202 August 2009 KeyPage 13 of 17
Value
6% 68. Anytime factories locate in an area, there is concern about pollution and theenvironment. Industry has grown in the Spring Hill area in recent years creatingenvironmental concerns. Identify three environmental risks threatening theSpring Hill area and propose a solution for each.
1 mark for identification of each of 3 risks1 mark for each of 3 solutions
C increased problems with garbage and sewage disposal
C problems with water supply
C increased air pollution from parts manufacturers
C increased air pollution from large increase in population and overall economic activity
C destruction of green zones/wetlands, etc. as industries expand
C traffic congestion and noise pollution
C destruction of forested areas by clear cutting for expansion
C solution will depend on the risk identified
World Geography 3202 August 2009 Key Page 14 of 17
SECTION D TOTAL VALUE: 10%
Do only ONE of the Units in Section D. Note: Both units use Case Study 3 below.
Either: Unit 6 - Population Distribution and Growth (#s 69 and 70)Or: Unit 7 - Settlement and Urbanization (#s 71 and 72)
CASE STUDY 3: Population Change and Urbanization
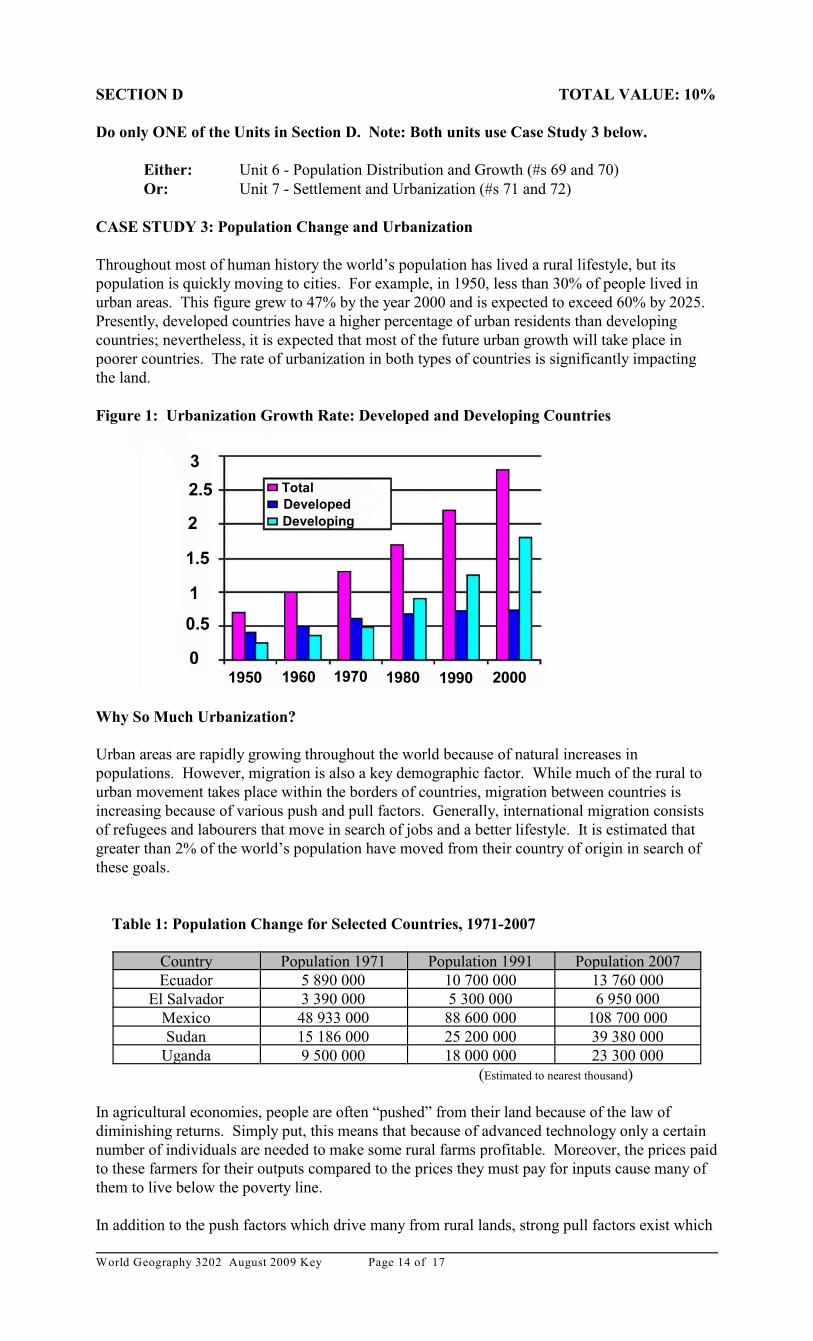
Throughout most of human history the world’s population has lived a rural lifestyle, but itspopulation is quickly moving to cities. For example, in 1950, less than 30% of people lived inurban areas. This figure grew to 47% by the year 2000 and is expected to exceed 60% by 2025. Presently, developed countries have a higher percentage of urban residents than developingcountries; nevertheless, it is expected that most of the future urban growth will take place inpoorer countries. The rate of urbanization in both types of countries is significantly impactingthe land.
Figure 1: Urbanization Growth Rate: Developed and Developing Countries
Why So Much Urbanization?
Urban areas are rapidly growing throughout the world because of natural increases inpopulations. However, migration is also a key demographic factor. While much of the rural tourban movement takes place within the borders of countries, migration between countries isincreasing because of various push and pull factors. Generally, international migration consistsof refugees and labourers that move in search of jobs and a better lifestyle. It is estimated thatgreater than 2% of the world’s population have moved from their country of origin in search ofthese goals.
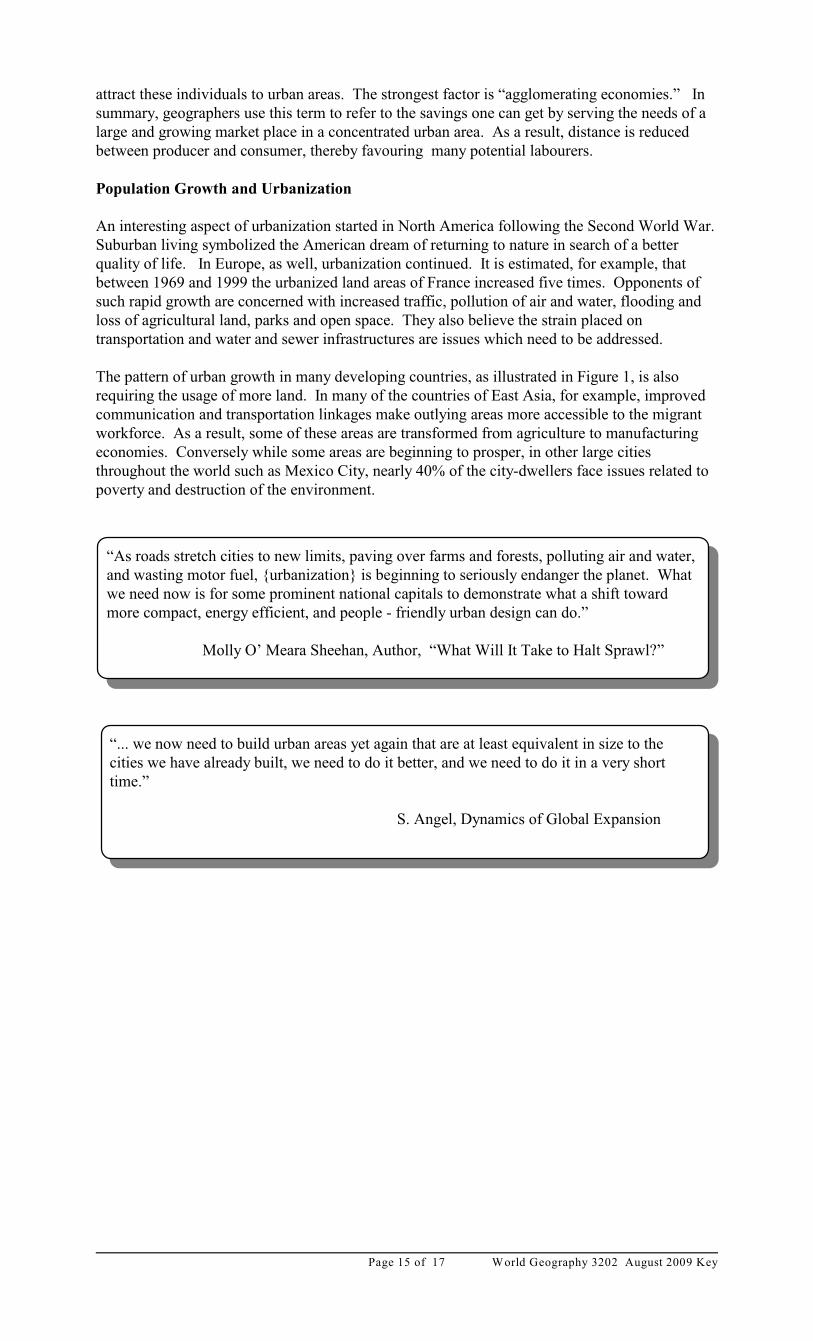
Table 1: Population Change for Selected Countries, 1971-2007
Country Population 1971 Population 1991 Population 2007Ecuador 5 890 000 10 700 000 13 760 000
El Salvador 3 390 000 5 300 000 6 950 000Mexico 48 933 000 88 600 000 108 700 000Sudan 15 186 000 25 200 000 39 380 000
Uganda 9 500 000 18 000 000 23 300 000(Estimated to nearest thousand)
In agricultural economies, people are often “pushed” from their land because of the law ofdiminishing returns. Simply put, this means that because of advanced technology only a certainnumber of individuals are needed to make some rural farms profitable. Moreover, the prices paidto these farmers for their outputs compared to the prices they must pay for inputs cause many ofthem to live below the poverty line.
In addition to the push factors which drive many from rural lands, strong pull factors exist which
World Geography 3202 August 2009 KeyPage 15 of 17
attract these individuals to urban areas. The strongest factor is “agglomerating economies.” Insummary, geographers use this term to refer to the savings one can get by serving the needs of alarge and growing market place in a concentrated urban area. As a result, distance is reducedbetween producer and consumer, thereby favouring many potential labourers.
Population Growth and Urbanization
An interesting aspect of urbanization started in North America following the Second World War. Suburban living symbolized the American dream of returning to nature in search of a betterquality of life. In Europe, as well, urbanization continued. It is estimated, for example, thatbetween 1969 and 1999 the urbanized land areas of France increased five times. Opponents ofsuch rapid growth are concerned with increased traffic, pollution of air and water, flooding andloss of agricultural land, parks and open space. They also believe the strain placed ontransportation and water and sewer infrastructures are issues which need to be addressed.
The pattern of urban growth in many developing countries, as illustrated in Figure 1, is alsorequiring the usage of more land. In many of the countries of East Asia, for example, improvedcommunication and transportation linkages make outlying areas more accessible to the migrantworkforce. As a result, some of these areas are transformed from agriculture to manufacturingeconomies. Conversely while some areas are beginning to prosper, in other large citiesthroughout the world such as Mexico City, nearly 40% of the city-dwellers face issues related topoverty and destruction of the environment.
“As roads stretch cities to new limits, paving over farms and forests, polluting air and water,and wasting motor fuel, {urbanization} is beginning to seriously endanger the planet. Whatwe need now is for some prominent national capitals to demonstrate what a shift towardmore compact, energy efficient, and people - friendly urban design can do.”
Molly O’ Meara Sheehan, Author, “What Will It Take to Halt Sprawl?”
“... we now need to build urban areas yet again that are at least equivalent in size to thecities we have already built, we need to do it better, and we need to do it in a very shorttime.”
S. Angel, Dynamics of Global Expansion
World Geography 3202 August 2009 Key Page 16 of 17
SECTION D TOTAL VALUE: 10%
Do only ONE of the Units in Section D.
Either: Unit 6 - Population Distribution and Growth (#s 69 and 70)Or: Unit 7 - Settlement and Urbanization (#s 71 and 72)
Unit 6 - Population Distribution and Growth
Value
4% 69. Using examples from the case study, describe two push and/or pull factors thatmay influence a person’s decision to migrate from rural to urban areas.
2 marks for each of 2 factors
C refugees and laborers in search of jobs and a better life style
C people pushed from agricultural land because technology is taking away their jobs
C many rural farmers are very poor because the price paid for outputs compared to that paidfor inputs leads to reduced profit. “ law of diminishing returns”
C “agglomerating economies”: the benefit a company gets by serving a large and growingmarket place in a concentrated urban area
Value
6% 70. Table 1 illustrates the trends of population change for selected developingcountries. Based on the information from the case study and your geographicknowledge, should these countries control their population growth rates? Usingthree reasons, explain why or why not.
2 marks for each of 3 reasons
C large populations increase traffic, pollution of air and water and flooding
C loss of agricultural land
C reduced space for parks and open spaces
C countries are poor and often have problems feeding and housing present populations.Increased growth will make this even more difficult.
C overcrowding and the problems it brings with it
C increased strain placed on transportation, water and sewer infrastructures
C increased crime rates, disease, etc.
C increased pressure on health care system
C higher unemployment rates in already depressed economies
C increased poverty
C environmental destruction
C more economic diversity
C more skilled workforce; more workers
C cultural and religious values, etc.
World Geography 3202 August 2009 KeyPage 17 of 17
Unit 7 - Settlement and Urbanization
Value
4% 71. Using two examples from the case study, explain how situation influenced thecontinuing trend of urbanization.
2 marks for each of 2 examples fully explained
C “agglomerating economies”: the benefit a company gets by serving a large and growingmarket place in a concentrated urban area
C as transportation and communication linkages make outlying areas more accessible to themigrant workforce, rural areas are transformed from agricultural to manufacturingeconomies
C as cities spread outward to rural areas increased numbers of agricultural workers moveinto the city in search of a better way of life
Value
6% 72. Using problems identified in the case study, suggest three strategies that could beused to improve the quality of life in cities.
1 mark for each of 3 problems1 mark for each of 3 strategies
Problems identified in the Case Study
C increased traffic
C air and water pollution
C flooding
C loss of agricultural land, parks and open spaces
C poverty
C environmental destruction
C strain on transportation, water and sewer infrastructure, etc.
C strategy depends on problems identified