Embed Size (px)
Citation preview

World Geography 3202 August 2008
WORLD GEOGRAPHY 3202
ANSWER KEY - AUGUST 2008
Multiple Choice
1. B 30. D
2. D 31. B
3. A 32. A
4. C 33. B
5. B 34. A
6. D 35. A
7. B 36. C
8. D 37. D
9. D 38. C
10. B 39. C
11. D 40. A
12. D 41. B
13. A 42. D
14. B 43. A
15. D 44. C
16. A 45. D
17. B 46. B
18. D 47. A
19. A 48. C
20. A 49. A
21. A 50. A
22. D 51. C
23. A 52. B
24. D 53. C
25. A 54. A
26. B 55. C
27. B 56. D
28. B 57. D
29. D 58. A
World Geography 3202 August 2008 2
PART II
SECTION A TOTAL VALUE: 8%
Instructions: Do ALL questions in PART II, Section A.
Value
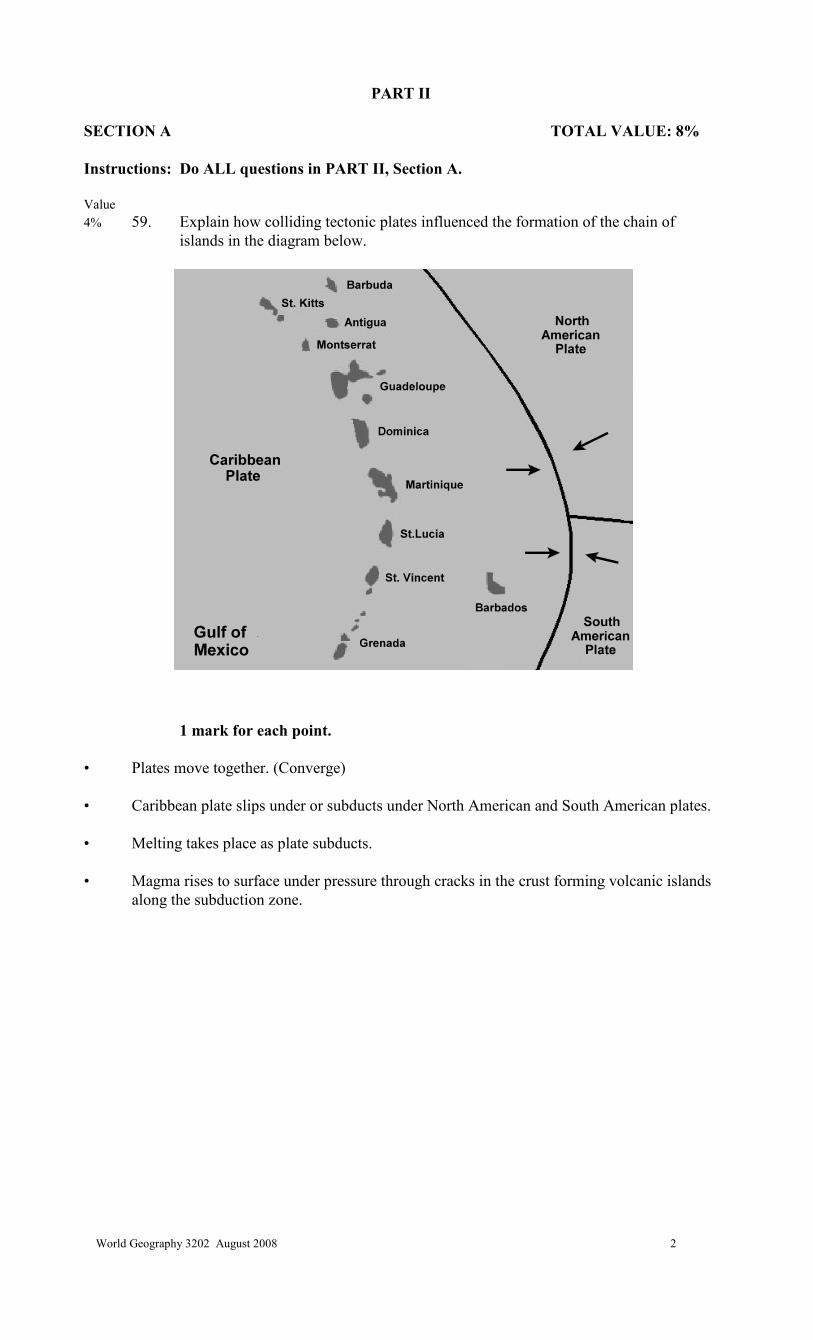
4% 59. Explain how colliding tectonic plates influenced the formation of the chain of
islands in the diagram below.
1 mark for each point.
• Plates move together. (Converge)
• Caribbean plate slips under or subducts under North American and South American plates.
• Melting takes place as plate subducts.
• Magma rises to surface under pressure through cracks in the crust forming volcanic islands
along the subduction zone.
World Geography 3202 August 2008 3
Value
4% 60. Describe a social and an economic indicator that can be used to identify a country’s
level of economic development.
2 marks for description of each.
Must have 1 social and 1 economic indicator.
Social indicator could include but not limited to:
gender equity, literacy rate, number of people per doctor, life expectancy, family size,
fertility rates, birth rates, death rates, infant mortality, etc.
Economic indicators could include but not limited to:
• percent in agriculture/primary
• GNP/GDP (per capita)
• energy consumption
• employment structures
World Geography 3202 August 2008 4
SECTION B TOTAL VALUE: 4%
Do only ONE of the Units in Section B.
Either: Unit 6 - Population Distribution and Growth (# 61)
Or: Unit 7 - Settlement and Urbanization (# 62)
UNIT 6 - Population Distribution and Growth
Value
4% 61. Describe one factor that affects birth rates and one factor that affects death rates.
2 marks each for description of factors that affect both birth and death rates.
Birth may include but not limited to:
• lack of birth control (or availability)
• education level
• employment level of women
• existence of social programs
• overall level of development; country, etc.
• culture/religion
Death rates may include but not limited to:
• health care
• disease control
• lack of safe drinking water
• nutrition levels
• poverty
• education level
• unsanitary conditions
• social programs
• level of economic development
• life expectancy at birth
• natural disasters
UNIT 7 - Settlement and Urbanization
Value
4% 62. Describe two site factors that influence the location of a settlement.
2 marks for description of each site factor.
• sheltered harbour
• peninsula
• confluence
• river island
• head of navigation
• river meanders
• acropolis
• resource
*Students may also discuss site factors such as land quality, availability of water, suitable
climate, or availability of transportation.
World Geography 3202 August 2008 5
Part II
Section C TOTAL VALUE: 28%
Instructions: Do ALL questions in PART II, Section C.
Units 1-5
CASE STUDY 1: World Fisheries: Have we Reached a Crisis?
The oceans support a wide variety of plants and animals, which co-exist in relative harmony, each
fulfilling the specific niche and role they have in the ecosystem. However, all is not well in this
complex ecosystem. Over-fishing has altered the ecological balance in some areas; as
commercially valuable species have been exhausted they have been replaced by other, less
commercially desirable, species. Deforestation, industrial pollution, agricultural runoff, domestic
sewage, and urban development have degraded fish habitat and reduced productivity. Much of the
most important and productive coastal habitat, consisting of estuaries, mangrove, wetlands, and
coral reefs, has already been damaged or destroyed by development.
Most Canadians are aware of the collapse of Atlantic groundfish stocks like the northern cod and
of the problems that beset British Columbia’s salmon fishery. Canada’s experience with its
fisheries is not unique, but is rather part of a global phenomenon in which relentless fishing
pressure and environmental degradation are pushing fish stocks to the brink of destruction.
At one time, the oceans and the fish that swam in them seemed so vast that they could hardly be
affected, much less harmed, by human activities. The nineteenth-century biologist Thomas Huxley
wrote, "I believe that the cod fishery...and probably all the great sea fisheries are inexhaustible."
Huxley, like many others, was wrong. Most of the world’s most important fish stocks have now
been fished to the limit of sustainability and beyond. A number have collapsed altogether. In 1995,
the Food and Agriculture Organization (FAO), stated that 69% of the world’s conventional species
were either fully exploited, over exploited, depleted, or rebuilding from a depleted state. The FAO
concluded that the operation of the world’s fisheries, as they existed, could not be sustained and
that significant ecological and economic damage had already occurred.
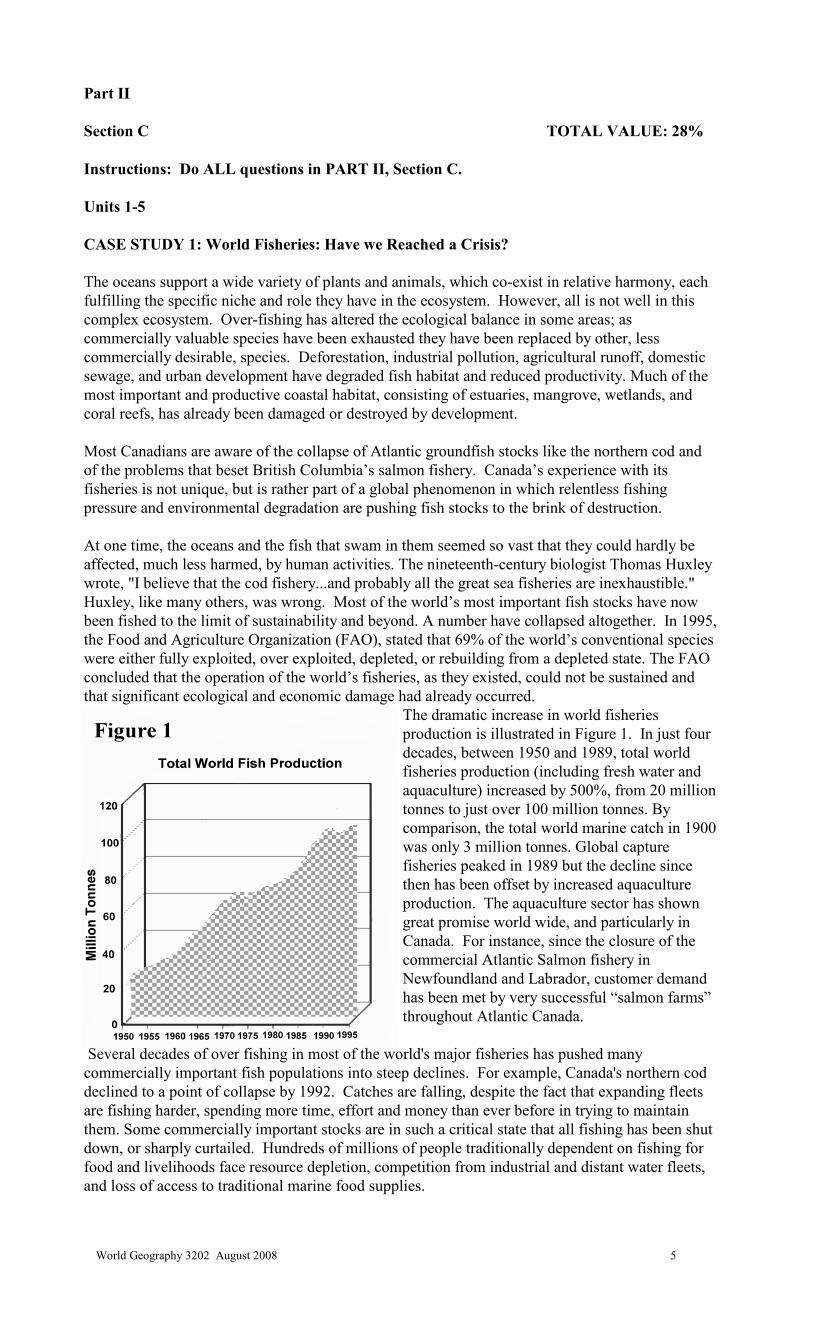
The dramatic increase in world fisheries
production is illustrated in Figure 1. In just four
decades, between 1950 and 1989, total world
fisheries production (including fresh water and
aquaculture) increased by 500%, from 20 million
tonnes to just over 100 million tonnes. By
comparison, the total world marine catch in 1900
was only 3 million tonnes. Global capture
fisheries peaked in 1989 but the decline since
then has been offset by increased aquaculture
production. The aquaculture sector has shown
great promise world wide, and particularly in
Canada. For instance, since the closure of the
commercial Atlantic Salmon fishery in
Newfoundland and Labrador, customer demand
has been met by very successful “salmon farms”
throughout Atlantic Canada.
Several decades of over fishing in most of the world's major fisheries has pushed many
commercially important fish populations into steep declines. For example, Canada's northern cod
declined to a point of collapse by 1992. Catches are falling, despite the fact that expanding fleets
are fishing harder, spending more time, effort and money than ever before in trying to maintain
them. Some commercially important stocks are in such a critical state that all fishing has been shut
down, or sharply curtailed. Hundreds of millions of people traditionally dependent on fishing for
food and livelihoods face resource depletion, competition from industrial and distant water fleets,
and loss of access to traditional marine food supplies.
World Geography 3202 August 2008 6
Destructive Production and Fishing Gear
The increased fishing pressure and the competition amongst fishing nations and their fleets
severely stresses fish stocks and the marine environment. The widespread use of unselective
fishing gear and indiscriminate fishing practices result in one-quarter of all the fish brought on
board fishing vessels being discarded, usually dead or dying. Commercial fishing vessels throw
back, on average, about 27 million tons of unwanted fish annually. That amounts to about half of
all the fish caught from the oceans each year that are actually consumed by humans. Along with
these, millions of other marine animals are being incidentally captured and killed in fishing
operations.
Some fishing gear is particularly deadly for certain fish in some situations. Drift nets
indiscriminately kill millions of marine creatures, while targeting just one or two commercially
valuable species. Marine mammals are frequently killed in great numbers in trawls, set nets and
purse seine nets. In addition, there is severe damage caused by fishing operations that use
destructive gear and fishing practices, like bottom trawling, that physically disturbs marine habitats
such as the ocean floor, sea grass beds or coral reefs.
Offshore Oil and Gas: A New Threat
Historically, offshore trawlers fished in the area of 3LT, east of Newfoundland, where drilling is
currently taking place for Hibernia and Terra Nova. But it is also an area where smaller boats (65-
footers) have fished for generations. It is home to American Plaice (flounder) which spawn
throughout the area. Up until 1992, American Plaice was a key fish stock that provided year-round
work for hundreds of fish harvesters and thousands of plant workers along the south coast of the
province. Other important species fished in the area include yellowtail, crab, cod, scallops,
swordfish, and tuna. In fact, the crab resource in this area has proven to be quite healthy and
lucrative.
“Can the two industries operate side by side?” This was the question directed to Earl McCurdy,
president of the Fish, Food and Allied Workers (FFAW) at a presentation given on April 23, 2001.
Mr. McCurdy continued by stating that “the short answer should be yes, but a lot more effort must
be made with respect to communications and discussions between the two industries. In addition,
the oil and gas industry has a responsibility to ensure its activities have minimal impacts on fish
stocks and habitat.” If a major oil or gas spill were to occur the damage could be catastrophic
destroying the whole ecosystem. Birds, a rebuilding cod stock, a lucrative crab fishery, and many
other potentially renewable resources would be destroyed. This would quickly result in a loss of
thousands of fishery related jobs. “Ultimately, we must remember that the fishery, if protected,
will provide for generations to come and will be around long after the last barrel of oil is drilled
from the Grand Banks.” (McCurdy, 2001)
Over fishing: Short-term Gain for Long-term Pain?
Today, there isn't a fishing region in the world that does not suffer from fisheries management
decisions designed to satisfy short-term economic or political objectives rather than protecting the
marine environment and conserving fish populations. Commercial fishing in many countries has
been very poorly managed. Even in a few countries where relatively advanced fisheries
management systems have been in place for many years, they have, almost without
exception, failed to control the conditions and stem the abuses that lead to over fishing and
destructive environmental impacts. Indeed, in many countries, governments have played an
important part in fueling the expansion of excessive fishing capacity and over-exploitation by
providing lucrative subsidies and taxpayer funded handouts.
Quite simply, nature's limits have been breached by too many fishing vessels catching too many
fish, very often in wasteful and destructive ways, and it cannot be allowed to continue if the oceans
and the human communities around the world that depend on them are to survive. The full
utilization of available fish stocks and profit maximization for industry have been the key goals of
short-sighted fisheries development, while protection for the environment has taken a back seat.
This has proven to be the formula for disaster in fishery after fishery, the world over, with the
disastrous consequences for marine ecosystems and humanity already plainly visible around the
world.
World Geography 3202 August 2008 7
Value
4% 63. Using the case study, identify and explain two reasons for the dramatic decline in
cod stocks.
1 mark to identify and 1 mark to explain each of two reasons.
At least one reason must come from case study.
• over-fishing
• environmental degradation
• overabundance of seals
• destructive fishing gear
• pollution
• climate change
• new catch technology
Value
4% 64. Using the case study and your geographical knowledge, describe two negative
impacts that industry and/or oil development has had on the ocean ecosystem.
2 marks for description of each negative impact.
At least one impact must come from the case study.
• drilling for oil on spawning grounds
• oil spills
• industrial pollution
• oil rig construction
*may relate to fishing industry and impacts of catch technology, etc.
(over-fishing/damage to ecosystem)
*indiscriminate fishing practices.
World Geography 3202 August 2008 8
Value
6% 65. Based on problems identified in the case study, propose and defend three possible
strategies that could lead to a sustainable fishery.
2 marks for proposal and description for each of the three strategies.
• increased scientific research and management efforts
• increased enforcement
• acquaculture
• strict industrial regulation on waste/pollution, etc.
• strict quotas
• reduction in foreign and domestic over fishing
• utilization of alternate species
• reduction in the number of full time fishers reducing pressure on fishery
• ongoing consultation between government, scientists and fishers/union reps, etc.
• increased seal hunt
World Geography 3202 August 2008 9
Units 1-5
CASE STUDY 2: A STUDY OF VOLCANIC DEVASTATION
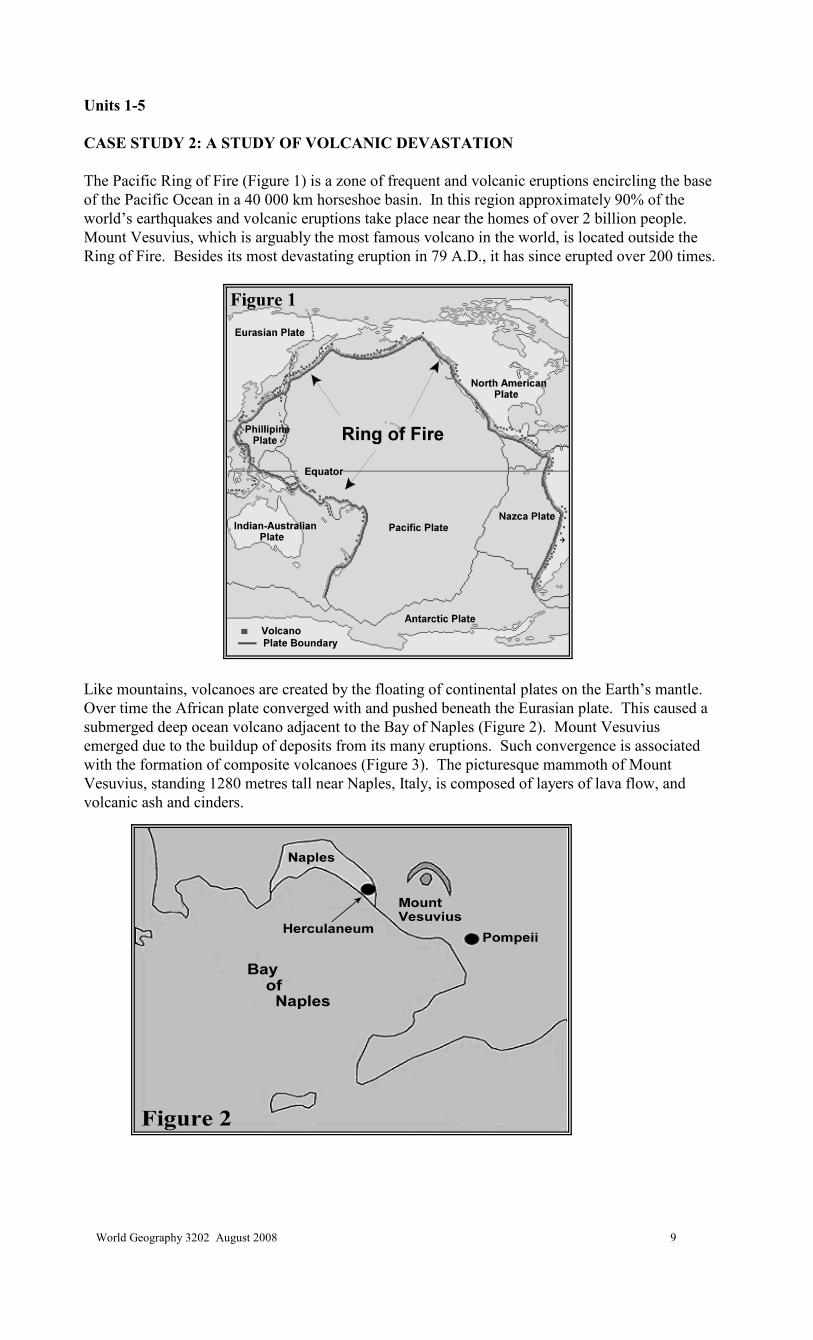
The Pacific Ring of Fire (Figure 1) is a zone of frequent and volcanic eruptions encircling the base
of the Pacific Ocean in a 40 000 km horseshoe basin. In this region approximately 90% of the
world’s earthquakes and volcanic eruptions take place near the homes of over 2 billion people.
Mount Vesuvius, which is arguably the most famous volcano in the world, is located outside the
Ring of Fire. Besides its most devastating eruption in 79 A.D., it has since erupted over 200 times.
Like mountains, volcanoes are created by the floating of continental plates on the Earth’s mantle.
Over time the African plate converged with and pushed beneath the Eurasian plate. This caused a
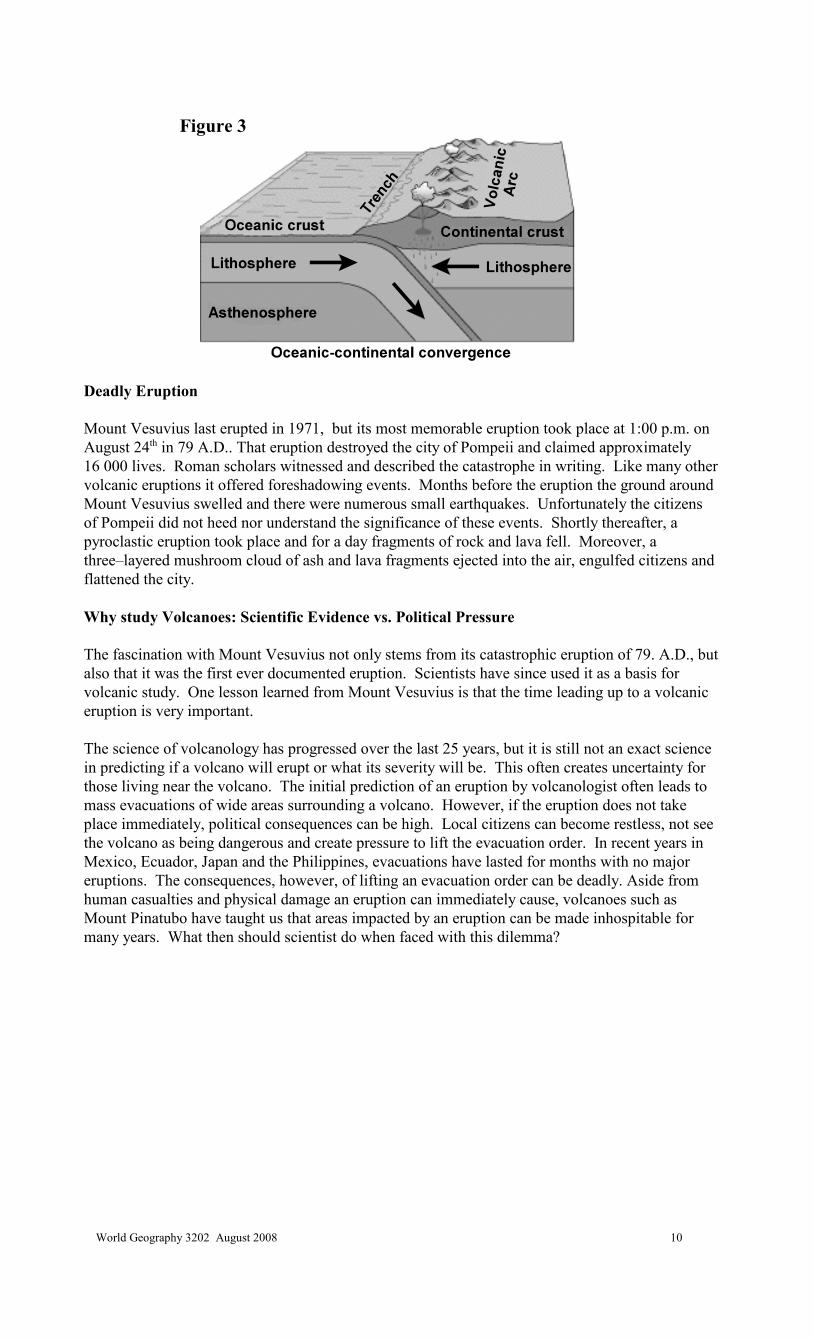
submerged deep ocean volcano adjacent to the Bay of Naples (Figure 2). Mount Vesuvius
emerged due to the buildup of deposits from its many eruptions. Such convergence is associated
with the formation of composite volcanoes (Figure 3). The picturesque mammoth of Mount
Vesuvius, standing 1280 metres tall near Naples, Italy, is composed of layers of lava flow, and
volcanic ash and cinders.
World Geography 3202 August 2008 10
Figure 3
Deadly Eruption
Mount Vesuvius last erupted in 1971, but its most memorable eruption took place at 1:00 p.m. on
August 24th in 79 A.D.. That eruption destroyed the city of Pompeii and claimed approximately
16 000 lives. Roman scholars witnessed and described the catastrophe in writing. Like many other
volcanic eruptions it offered foreshadowing events. Months before the eruption the ground around
Mount Vesuvius swelled and there were numerous small earthquakes. Unfortunately the citizens
of Pompeii did not heed nor understand the significance of these events. Shortly thereafter, a
pyroclastic eruption took place and for a day fragments of rock and lava fell. Moreover, a
three–layered mushroom cloud of ash and lava fragments ejected into the air, engulfed citizens and
flattened the city.
Why study Volcanoes: Scientific Evidence vs. Political Pressure
The fascination with Mount Vesuvius not only stems from its catastrophic eruption of 79. A.D., but
also that it was the first ever documented eruption. Scientists have since used it as a basis for
volcanic study. One lesson learned from Mount Vesuvius is that the time leading up to a volcanic
eruption is very important.
The science of volcanology has progressed over the last 25 years, but it is still not an exact science
in predicting if a volcano will erupt or what its severity will be. This often creates uncertainty for
those living near the volcano. The initial prediction of an eruption by volcanologist often leads to
mass evacuations of wide areas surrounding a volcano. However, if the eruption does not take
place immediately, political consequences can be high. Local citizens can become restless, not see
the volcano as being dangerous and create pressure to lift the evacuation order. In recent years in
Mexico, Ecuador, Japan and the Philippines, evacuations have lasted for months with no major
eruptions. The consequences, however, of lifting an evacuation order can be deadly. Aside from
human casualties and physical damage an eruption can immediately cause, volcanoes such as
Mount Pinatubo have taught us that areas impacted by an eruption can be made inhospitable for
many years. What then should scientist do when faced with this dilemma?
World Geography 3202 August 2008 11
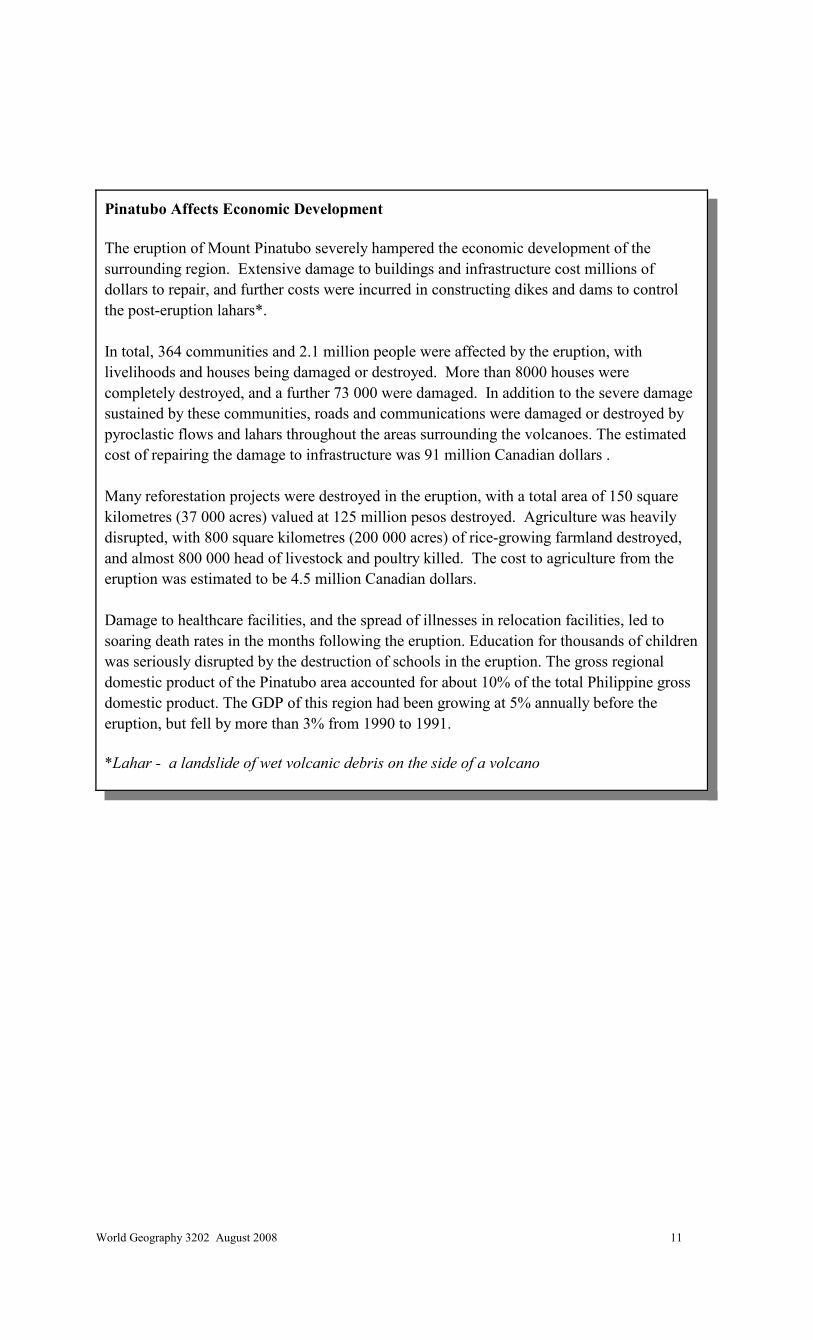
Pinatubo Affects Economic Development
The eruption of Mount Pinatubo severely hampered the economic development of the
surrounding region. Extensive damage to buildings and infrastructure cost millions of
dollars to repair, and further costs were incurred in constructing dikes and dams to control
the post-eruption lahars*.
In total, 364 communities and 2.1 million people were affected by the eruption, with
livelihoods and houses being damaged or destroyed. More than 8000 houses were
completely destroyed, and a further 73 000 were damaged. In addition to the severe damage
sustained by these communities, roads and communications were damaged or destroyed by
pyroclastic flows and lahars throughout the areas surrounding the volcanoes. The estimated
cost of repairing the damage to infrastructure was 91 million Canadian dollars .
Many reforestation projects were destroyed in the eruption, with a total area of 150 square
kilometres (37 000 acres) valued at 125 million pesos destroyed. Agriculture was heavily
disrupted, with 800 square kilometres (200 000 acres) of rice-growing farmland destroyed,
and almost 800 000 head of livestock and poultry killed. The cost to agriculture from the
eruption was estimated to be 4.5 million Canadian dollars.
Damage to healthcare facilities, and the spread of illnesses in relocation facilities, led to
soaring death rates in the months following the eruption. Education for thousands of children
was seriously disrupted by the destruction of schools in the eruption. The gross regional
domestic product of the Pinatubo area accounted for about 10% of the total Philippine gross
domestic product. The GDP of this region had been growing at 5% annually before the
eruption, but fell by more than 3% from 1990 to 1991.
*Lahar - a landslide of wet volcanic debris on the side of a volcano
World Geography 3202 August 2008 12
Value
4% 66. With the aid of Figures 1 and 3, explain how compressional forces at plate
boundaries can lead to volcanic activity.
1 mark for each point.
• As plates move together the oceanic crust subducts or moves underneath the
continental crust.
• Melting occurs as the oceanic crust moves to greater depths.
• Magma under pressure rises
• Volcanoes occur as magma reaches the earth’s surface through cracks or fissures in
the continental crust.
Value
4% 67. Explain two ways people respond to living in regions prone to volcanic activity.
2 marks for each description.
* Response may discuss before or after volcanic activity.
Before
• evacuation plans
• preparedness
• education
• monitoring of seismic activity
After
• evacuation of region
• adequate medical attention
• availability of temporary shelter and food supplies
• construction of dikes and dams
• government influx of money to rebuild damaged region
World Geography 3202 August 2008 13
Value
6% 68. Describe two negative economic effects that result from a volcanic eruption and
propose a solution for each.
1 mark for each negative economic effect and 2 marks for each solution.
Negative economic effects:
• excessive damage to buildings and infrastructure cost millions to repair
• costs incurred to construct dikes and dams to control post eruption lahars
• destruction of environment and environmental projects
• damage to health care facilities/spread of disease
• loss of educational opportunities
• destruction of farmland
• loss of life
• crop destruction
• damage to roads/communication facilities, etc.
*Solutions may vary according to economic effect discussed.
World Geography 3202 August 2008 14
SECTION D TOTAL VALUE: 10%
Do only ONE of the Units in Section D. Note: Both units use Case Study 3 below.
Either: Unit 6 - Population Distribution and Growth (#’s 69 and 70)
Or: Unit 7 - Settlement and Urbanization (#’s 71 and 72)
CASE STUDY 3: World Population: Trends and Challenges
The world population growth rate has decreased from its peak of 2 percent per year in the late
1960s to 1.2 percent today. The United Nations projects the world’s population will reach 7 billion
persons by 2012, 8 billion by 2027, and 9 billion by 2050.
While the overall population of the world will increase throughout the next four decades,
considerable diversity is expected in the population growth of various countries. The population of
many countries, especially those of Africa and Asia, will significantly increase; yet, fertility levels
in some developed countries are so low that it will lead to a significant population decline.
Population geographers will continue to closely watch this trend along with the trends of
urbanization and population ageing.
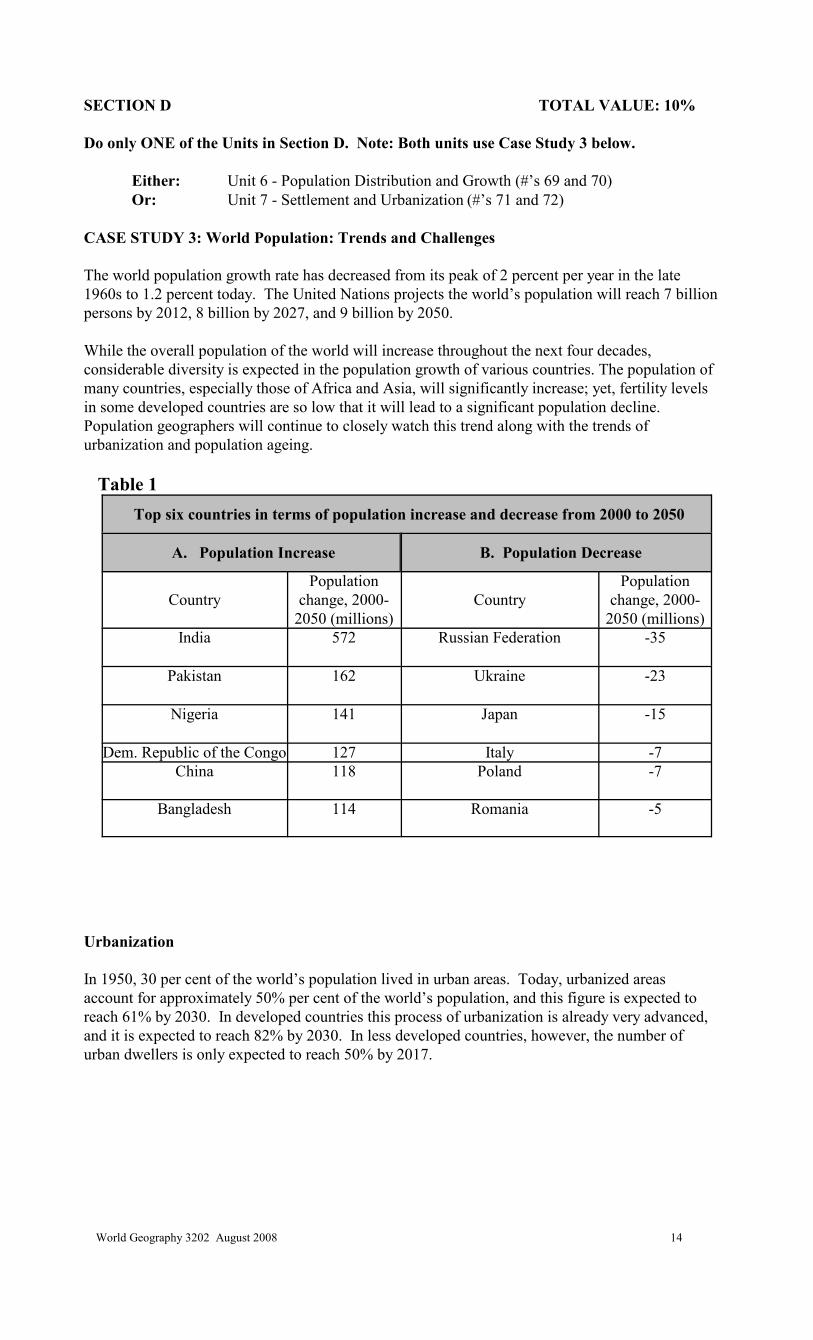
Table 1
Top six countries in terms of population increase and decrease from 2000 to 2050
A. Population Increase B. Population Decrease
Country
Population
change, 2000-
2050 (millions)
Country
Population
change, 2000-
2050 (millions)
India 572 Russian Federation -35
Pakistan 162 Ukraine -23
Nigeria 141 Japan -15
Dem. Republic of the Congo 127 Italy -7
China 118 Poland -7
Bangladesh 114 Romania -5
Urbanization
In 1950, 30 per cent of the world’s population lived in urban areas. Today, urbanized areas
account for approximately 50% per cent of the world’s population, and this figure is expected to
reach 61% by 2030. In developed countries this process of urbanization is already very advanced,
and it is expected to reach 82% by 2030. In less developed countries, however, the number of
urban dwellers is only expected to reach 50% by 2017.
World Geography 3202 August 2008 15
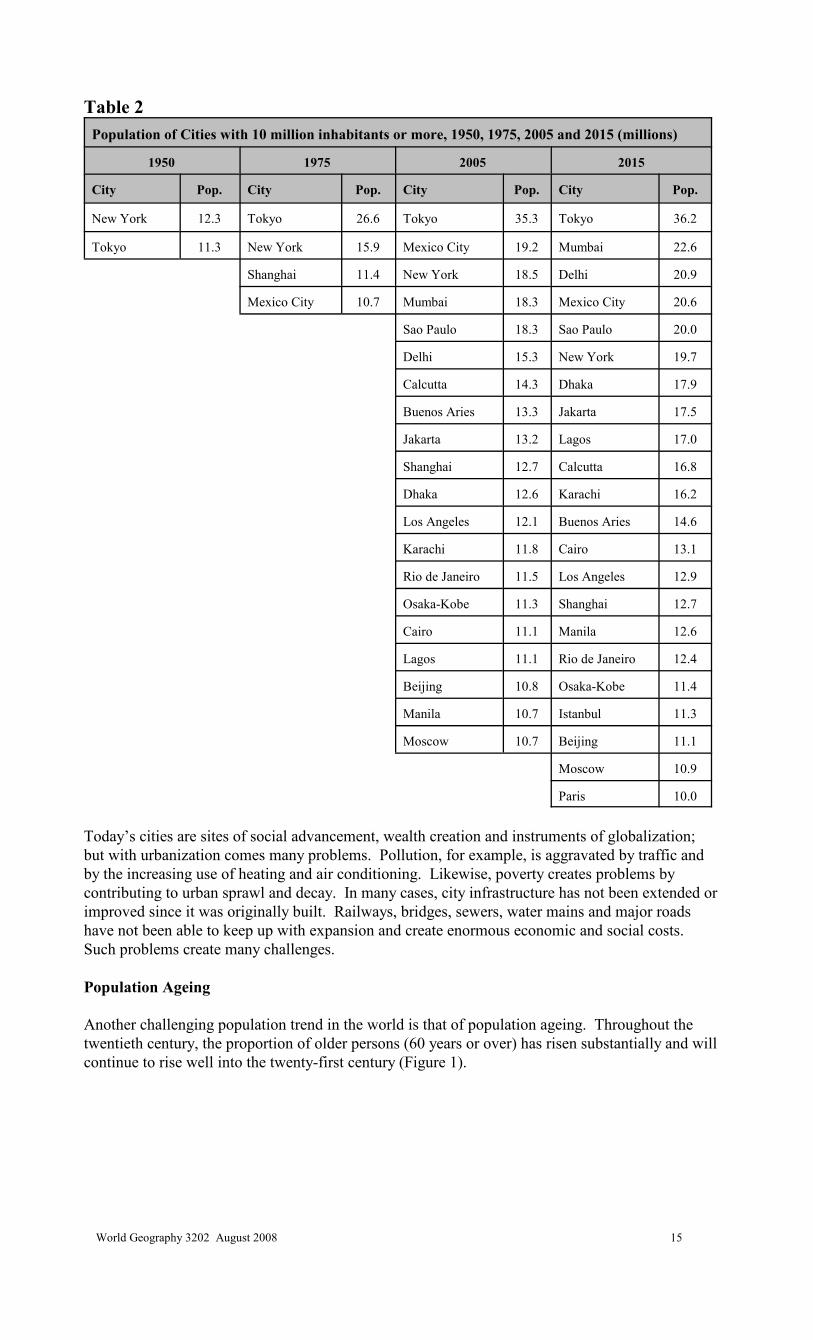
Table 2
Population of Cities with 10 million inhabitants or more, 1950, 1975, 2005 and 2015 (millions)
1950 1975 2005 2015
City Pop. City Pop. City Pop. City Pop.
New York 12.3 Tokyo 26.6 Tokyo 35.3 Tokyo 36.2
Tokyo 11.3 New York 15.9 Mexico City 19.2 Mumbai 22.6
Shanghai 11.4 New York 18.5 Delhi 20.9
Mexico City 10.7 Mumbai 18.3 Mexico City 20.6
Sao Paulo 18.3 Sao Paulo 20.0
Delhi 15.3 New York 19.7
Calcutta 14.3 Dhaka 17.9
Buenos Aries 13.3 Jakarta 17.5
Jakarta 13.2 Lagos 17.0
Shanghai 12.7 Calcutta 16.8
Dhaka 12.6 Karachi 16.2
Los Angeles 12.1 Buenos Aries 14.6
Karachi 11.8 Cairo 13.1
Rio de Janeiro 11.5 Los Angeles 12.9
Osaka-Kobe 11.3 Shanghai 12.7
Cairo 11.1 Manila 12.6
Lagos 11.1 Rio de Janeiro 12.4
Beijing 10.8 Osaka-Kobe 11.4
Manila 10.7 Istanbul 11.3
Moscow 10.7 Beijing 11.1
Moscow 10.9
Paris 10.0
Today’s cities are sites of social advancement, wealth creation and instruments of globalization;
but with urbanization comes many problems. Pollution, for example, is aggravated by traffic and
by the increasing use of heating and air conditioning. Likewise, poverty creates problems by
contributing to urban sprawl and decay. In many cases, city infrastructure has not been extended or
improved since it was originally built. Railways, bridges, sewers, water mains and major roads
have not been able to keep up with expansion and create enormous economic and social costs.
Such problems create many challenges.
Population Ageing
Another challenging population trend in the world is that of population ageing. Throughout the
twentieth century, the proportion of older persons (60 years or over) has risen substantially and will
continue to rise well into the twenty-first century (Figure 1).
World Geography 3202 August 2008 16
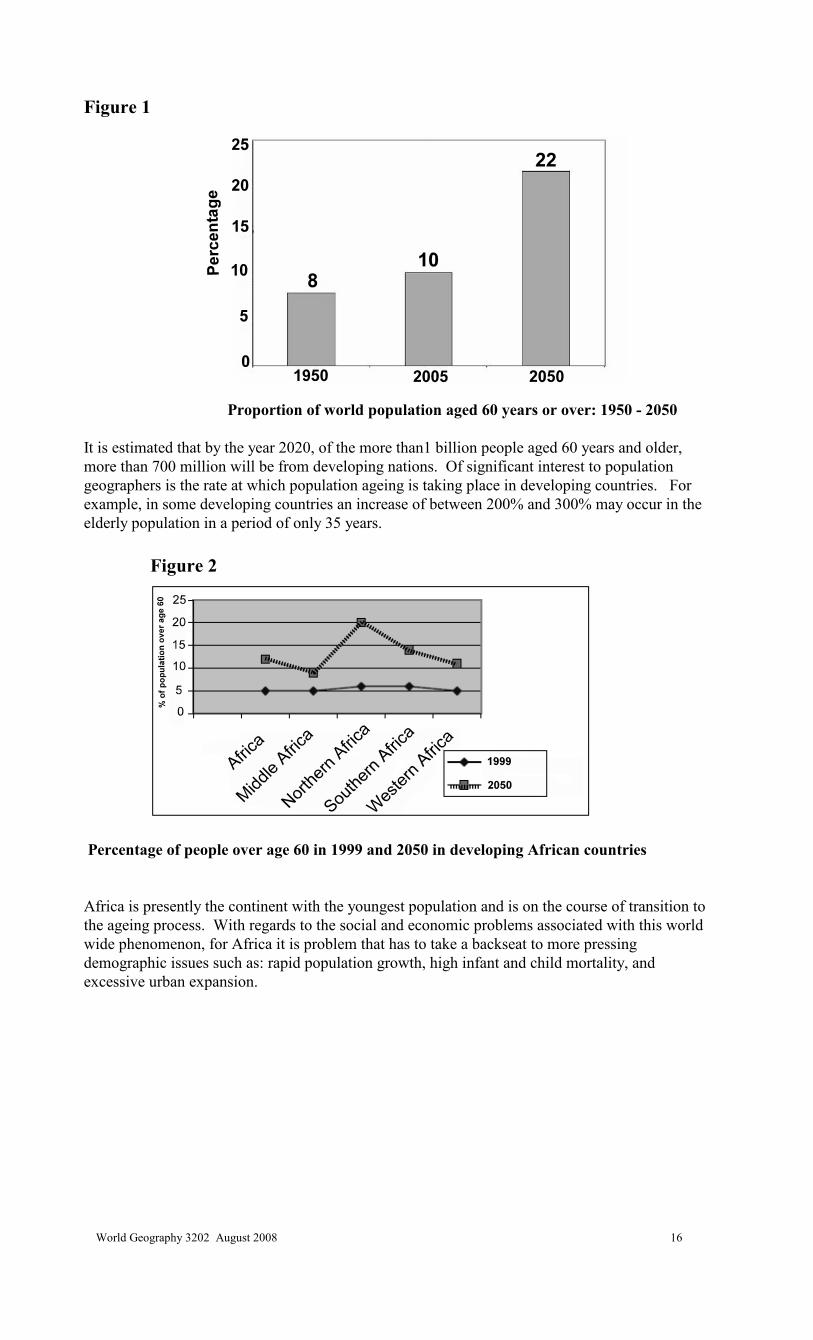
Figure 1
Proportion of world population aged 60 years or over: 1950 - 2050
It is estimated that by the year 2020, of the more than1 billion people aged 60 years and older,
more than 700 million will be from developing nations. Of significant interest to population
geographers is the rate at which population ageing is taking place in developing countries. For
example, in some developing countries an increase of between 200% and 300% may occur in the
elderly population in a period of only 35 years.
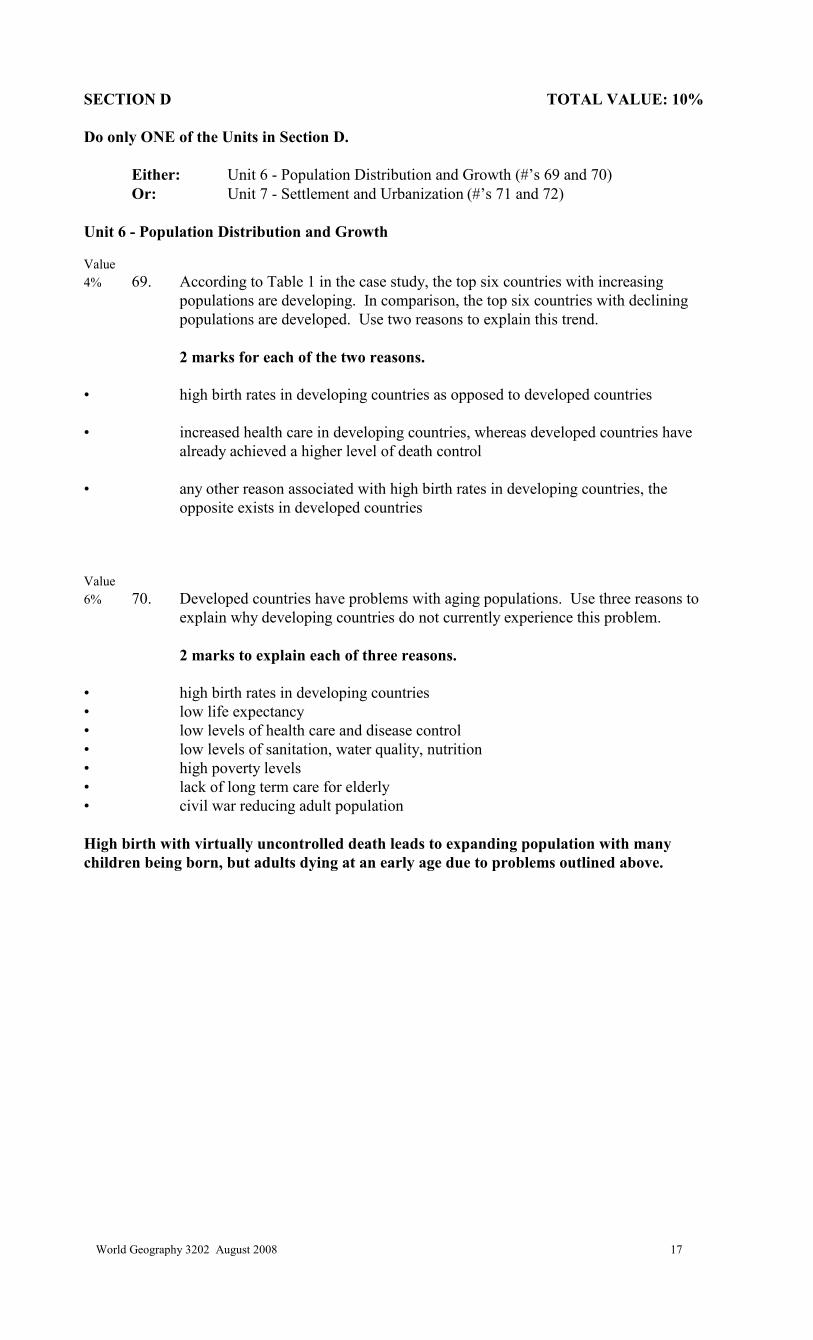
Figure 2
Percentage of people over age 60 in 1999 and 2050 in developing African countries
Africa is presently the continent with the youngest population and is on the course of transition to
the ageing process. With regards to the social and economic problems associated with this world
wide phenomenon, for Africa it is problem that has to take a backseat to more pressing
demographic issues such as: rapid population growth, high infant and child mortality, and
excessive urban expansion.
World Geography 3202 August 2008 17
SECTION D TOTAL VALUE: 10%
Do only ONE of the Units in Section D.
Either: Unit 6 - Population Distribution and Growth (#’s 69 and 70)
Or: Unit 7 - Settlement and Urbanization (#’s 71 and 72)
Unit 6 - Population Distribution and Growth
Value
4% 69. According to Table 1 in the case study, the top six countries with increasing
populations are developing. In comparison, the top six countries with declining
populations are developed. Use two reasons to explain this trend.
2 marks for each of the two reasons.
• high birth rates in developing countries as opposed to developed countries
• increased health care in developing countries, whereas developed countries have
already achieved a higher level of death control
• any other reason associated with high birth rates in developing countries, the
opposite exists in developed countries
Value
6% 70. Developed countries have problems with aging populations. Use three reasons to
explain why developing countries do not currently experience this problem.
2 marks to explain each of three reasons.
• high birth rates in developing countries
• low life expectancy
• low levels of health care and disease control
• low levels of sanitation, water quality, nutrition
• high poverty levels
• lack of long term care for elderly
• civil war reducing adult population
High birth with virtually uncontrolled death leads to expanding population with many
children being born, but adults dying at an early age due to problems outlined above.
World Geography 3202 August 2008 18
Unit 7 - Settlement and Urbanization
Value
4% 71. Describe two reasons why urbanization is occurring at a faster rate in developing
countries than in developed countries.
2 marks for each of two reasons.
• Many people in developing countries work in primary sector of economy which is
rural based but travel to cities to earn money.
• Urbanization is more of a recent phenomenon in developing nations, whereas it has
been taking place in developed nations for years.
• Developing nations are beginning to industrialize and people move to cities in
search of work and to escape rural poverty.
• More opportunities exist in cities (education/recreation, etc.);people in
developing countries are just beginning to give up their rural way of life and move
to cities in search of a higher quality of life.
Value
6% 72. “Today’s cities are sites of social advancement, wealth creation and instruments of
globalization but with urbanization comes many problems.” State three problems
that occur due to rapid urbanization and propose a solution for each.
1 mark to state each problem and 1 mark for each solution.
Problems may include but not limited to the following:
• traffic congestion/transportation problems
• high crime rates
• high cost of living
• pollution/noise - traffic - heating - air conditioning
• development of slums
• inadequate housing
• infrastructure being stretched past limits
• poor public sanitation and drinking water
• widespread disease
• urban sprawl and decay
*Solutions will vary according to problem discussed.