Embed Size (px)
Citation preview
Worldwide trends in fishing interest indicated byinternet search volumeG . R . W I LDEDepartment of Biological Sciences, Texas Tech University, Lubbock, TX, USA
K . L . POPEU.S. Geological Survey—Nebraska Cooperative Fish and Wildlife Research Unit, School of Natural Resources, University ofNebraska, Lincoln, NE, USA
Abstract There is a growing body of literature that shows internet search volume on a topic, such as fishing, is aviable measure of salience. Herein, internet search volume for ‘fishing’ and ‘angling’ is used as a measure of publicinterest in fishing, in particular, recreational fishing. An online tool, Google Insights for Search, which allows one tostudy internet search terms and their volume since 2004, is used to examine trends in interest in fishing for 50countries. Trends in normalised fishing search volume, during 2004 through 2011, varied from a 72.6% decrease(Russian Federation) to a 133.7% increase (Hungary). Normalised fishing search volume declined in 40 (80%) of thecountries studied. The decline has been relatively large in English-speaking countries, but also has been large inCentral and South American, and European countries. Analyses of search queries provide a low-cost means of gaininginsight into angler interests and, possibly, behaviour in countries around the world.
K E Y W O R D S : anglers, angling, Google Insights for Search, recreational fishing, salience.
Introduction
Humans have harvested fish for food for at least42 000 years (O’Connor et al. 2011) and in the last halfcentury, there has been a steady increase in the globaleffort directed toward both commercial (Swartz et al.2010; Anticamara et al. 2011) and recreational fisheries(Arlinghaus et al. 2002; Cooke & Cowx 2004). Theincrease in human population over the past century andthe increase in importance of fish as both food and recre-ation have resulted in the global collapse of many fishpopulations as a result of commercial overharvest (Hil-born et al. 2003; Coleman et al. 2004), and there is agrowing concern for the potential of recreational fishingto contribute to, or cause, the collapse of recreationallyimportant fish stocks (Post et al. 2002; Cooke & Cowx2006; Lewin et al. 2006). Thus, there is a need to tracklocal, national and international trends in fishing effort,which is easier for commercial fishing than recreationalfishing and is easier in developed countries than devel-oping countries.
Arguably, the three most consistently measured char-acteristics of both commercial and recreational fishingare participation, effort and harvest. Information on par-ticipation can be obtained from licence (permit) andstamp sales. Detailed information on effort and harvestcan be obtained by in-person surveys, mail and tele-phone surveys, log books and numerous other means(Guthrie et al. 1991; Pollock et al. 1994), although col-lection of this information is expensive and requires con-siderable time and manpower. Further, currentcollections of information on recreational fishing effortand harvest are generally localised, and it is unknownhow local efforts and harvests scale up to national andinternational efforts and harvests, especially for recrea-tional fishing. Current collections of recreational infor-mation on national and international scales arelogistically constrained by costs that produce low-resolu-tion data collected along with inherent time lags inreporting of data. For example, current monitoring ofparticipation in recreational fishing within the USAlogistically has a temporal resolution of 5 years and a
Correspondence: Gene R. Wilde, Department of Biological Sciences, Texas Tech University, Lubbock, TX 79409, USA (e-mail: [email protected])
© 2012 Blackwell Publishing Ltd doi: 10.1111/fme.12009
Fisheries Management and Ecology, 2013, 20, 211–222
211
Fisheries Managementand Ecology
lag of 2 years for reporting of data. Thus, currentdetailed information on participation, effort and harvestin recreational fishing usually is unavailable.In recent years, the internet has become an important
source of information and component of people’s work,social lives and leisure activities (Amichai-Hamburger &Ben-Artzi 2000; Amichai-Hamburger & Hayat 2011).There is growing evidence of a relationship between vol-ume of internet searches and subsequent human behav-iour. For example, spatial and temporal patterns in casesof influenza can be tracked, in real time, using internetsearch volume, as patients often search for informationon symptoms before visiting a doctor for diagnosis andtreatment (Ginsberg et al. 2009). Volume of search que-ries is also correlated with patient presentations for kid-ney stone occurrence (Breyer et al. 2011), cancerawareness (Metcalfe et al. 2011) and a variety of otherdiseases (e.g. Brownstein et al. 2009; Pelat et al. 2009).Search volume also is correlated with unemploymentrates (Askitas & Zimmermann 2009), perceptions ofunemployment (Scheitle 2011) and transactions in stockmarkets (e.g. Preis et al. 2010). Thus, internet searchvolume is a viable measure of issue salience, or interest,in a variety of disciplines including fisheries (Martinet al. 2012). Herein, internet search volumes for ‘fishing’and ‘angling’ are used as a measure of public interest infishing and, in particular, recreational fishing. An onlinetool, Google Insights for Search, which allows one tostudy internet search terms and their volume since 2004,is used to examine trends in interest of fishing for 50countries.
Methods
Google Insights for Search (Google 2010) allows one tocompare the frequency of words and phrases used in Go-ogle search queries within and among geographicregions. Google Insights for Search analyses a portion ofGoogle searches to compute the number of searches thathave been conducted for search queries of interest andthen scales that number to the total number of Googlesearches performed over time. Thus, the results indicatethe likelihood that a user in a selected geographic areawill search for a particular term or phrase and reflect rel-ative, rather than absolute, search volume. GoogleInsights for Search normalises results so that the greatestvalue, across regions and time, is arbitrarily set to 100and all other values in the comparison are scaled againstthat observation (i.e. each observation is divided by themaximum value in a set of comparisons and is thenmultiplied by 100).Google Insights for Search was used to assess geo-
graphic and temporal patterns in fishing interest, as mea-
sured by internet search volume. ‘Fishing’ and ‘angling’plus translations of both terms in 20 languages (Table 1)were used as search terms. Translations into non-Englishlanguages were obtained from Google Translate. In twosets of languages (Danish, Norwegian and Swedish; andItalian, Portuguese and Spanish), the translations wereequivalent. In some cases, Google Translate failed totranslate ‘angling’ or translated it as ‘fishing’. Collec-tively, these terms (‘fishing’ and ‘angling’ plus transla-tions) combined to 30 terms, the maximum that can beentered into a single search. Analyses were restricted tothese languages so that observed trends among countriesin normalised search volume would be comparable.Google Insights for Search allows search terms to beexamined in up to five geographic regions (i.e. countries)at a time. Included herein are results for 50 countries(Table 2).Preliminary studies indicated that New Zealand had
the greatest mean normalised search volume regardlessof the other countries with which it was compared with(i.e. New Zealand results always included the nominalvalue of 100). Therefore, New Zealand was included inall comparisons (New Zealand + four other countries) asa standard, which allowed direct comparisons of meannormalised search volume among countries.Google Insights for Search was accessed on 31
December 2011 to download data used in this analysis.On that date, the total available time series (1 January2004 to 31 December 2011) for each country wasobtained. Google Insights for Search allows users todownload weekly (or monthly, for smaller countries)search volume for each country searched. Monthlymeans were calculated from the downloaded weekly
Table 1. The English words ‘angling’ and ‘fishing’ were translatedusing Google Translate into 20 languages
Language Translation
Croatian RibolovCzech RybařeníDanish, Swedish, Norwegian fiske + fiskeriDutch hengelen + vissenFinnish kalastus + onkiminenFrench PècheGerman Angeln + FischenGreek wάρela + akιeίaHungarian horgászás + halászatIndonesian memancing + penangkapan ikanItalian, Portuguese, Spanish pesca + pesquerasJapanese 釣り
Polish rybacki + wędkarstwoRomanian PescuitRussian УжeниeSerbian pибoлoв + пeцaњe
© 2012 Blackwell Publishing Ltd
G. R. WILDE & K. L. POPE212
values, resulting in a maximum of 96 (12 months 9
8 years) observations for a given country. R statisticalsoftware was used to conduct an STL (Cleveland et al.1990), a seasonal-trend decomposition procedure, tomodel trends in search volume. The STL uses Loess, anonparametric regression, to model the seasonal effectsof each time series iteratively and then the long-termtrend. The STL models were used to show only thegeneral nature of long-term trends in fishing searches,and no statistical inferences were made.
Results
Mean normalised search volume varied from 5 (RussianFederation) to 63 (New Zealand) in the 50 countriesstudied (Table 2). Differences among countries reflectdifferences in the relative volume of fishing searches(i.e. interest in fishing) and indicate that fishing searchesare 12-times more likely in New Zealand than in theRussian Federation, for example. There were no obviouscontinental or intercontinental patterns in mean norma-lised search volume, except that fishing searches gener-ally were more likely in English-speaking countries.Trends in normalised fishing search volume, during2004 through 2011, varied from a 72.6% decrease(Russian Federation) to a 133.7% increase (Hungary). Ingeneral, a trend for increased normalised fishing search
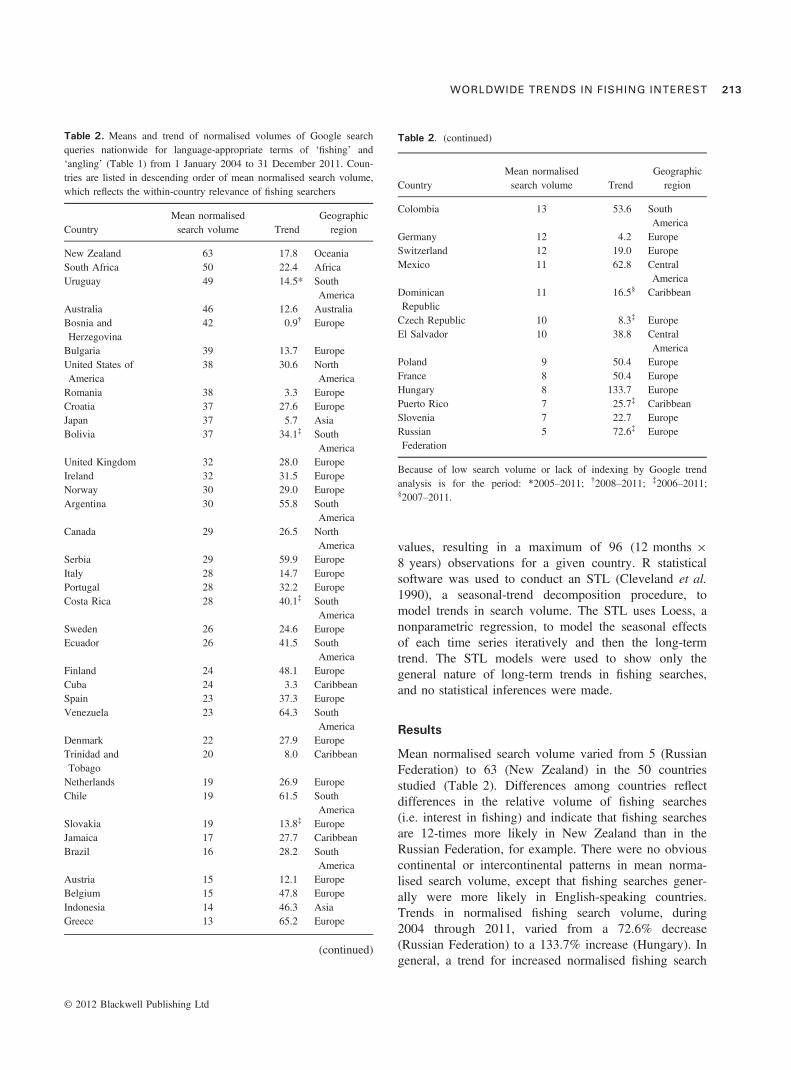
Table 2. Means and trend of normalised volumes of Google searchqueries nationwide for language-appropriate terms of ‘fishing’ and‘angling’ (Table 1) from 1 January 2004 to 31 December 2011. Coun-tries are listed in descending order of mean normalised search volume,which reflects the within-country relevance of fishing searchers
CountryMean normalisedsearch volume Trend
Geographicregion
New Zealand 63 17.8 OceaniaSouth Africa 50 �22.4 AfricaUruguay 49 �14.5* South
AmericaAustralia 46 �12.6 AustraliaBosnia andHerzegovina
42 0.9† Europe
Bulgaria 39 �13.7 EuropeUnited States ofAmerica
38 �30.6 NorthAmerica
Romania 38 �3.3 EuropeCroatia 37 �27.6 EuropeJapan 37 5.7 AsiaBolivia 37 34.1‡ South
AmericaUnited Kingdom 32 �28.0 EuropeIreland 32 �31.5 EuropeNorway 30 �29.0 EuropeArgentina 30 �55.8 South
AmericaCanada 29 �26.5 North
AmericaSerbia 29 �59.9 EuropeItaly 28 �14.7 EuropePortugal 28 �32.2 EuropeCosta Rica 28 �40.1‡ South
AmericaSweden 26 �24.6 EuropeEcuador 26 �41.5 South
AmericaFinland 24 �48.1 EuropeCuba 24 3.3 CaribbeanSpain 23 �37.3 EuropeVenezuela 23 �64.3 South
AmericaDenmark 22 �27.9 EuropeTrinidad andTobago
20 8.0 Caribbean
Netherlands 19 �26.9 EuropeChile 19 �61.5 South
AmericaSlovakia 19 13.8‡ EuropeJamaica 17 �27.7 CaribbeanBrazil 16 �28.2 South
AmericaAustria 15 �12.1 EuropeBelgium 15 �47.8 EuropeIndonesia 14 �46.3 AsiaGreece 13 �65.2 Europe
(continued)
Table 2. (continued)
CountryMean normalisedsearch volume Trend
Geographicregion
Colombia 13 �53.6 SouthAmerica
Germany 12 �4.2 EuropeSwitzerland 12 �19.0 EuropeMexico 11 �62.8 Central
AmericaDominicanRepublic
11 16.5§ Caribbean
Czech Republic 10 8.3‡ EuropeEl Salvador 10 �38.8 Central
AmericaPoland 9 �50.4 EuropeFrance 8 �50.4 EuropeHungary 8 133.7 EuropePuerto Rico 7 �25.7‡ CaribbeanSlovenia 7 �22.7 EuropeRussianFederation
5 �72.6‡ Europe
Because of low search volume or lack of indexing by Google trendanalysis is for the period: *2005–2011; †2008–2011; ‡2006–2011;§2007–2011.
© 2012 Blackwell Publishing Ltd
WORLDWIDE TRENDS IN FISHING INTEREST 213
volume was more likely in eastern European and Carib-bean countries than elsewhere. There was no correlationbetween mean normalised search volume and trend infishing searches (P = 0.2995).Normalised search volume for fishing, in all lan-
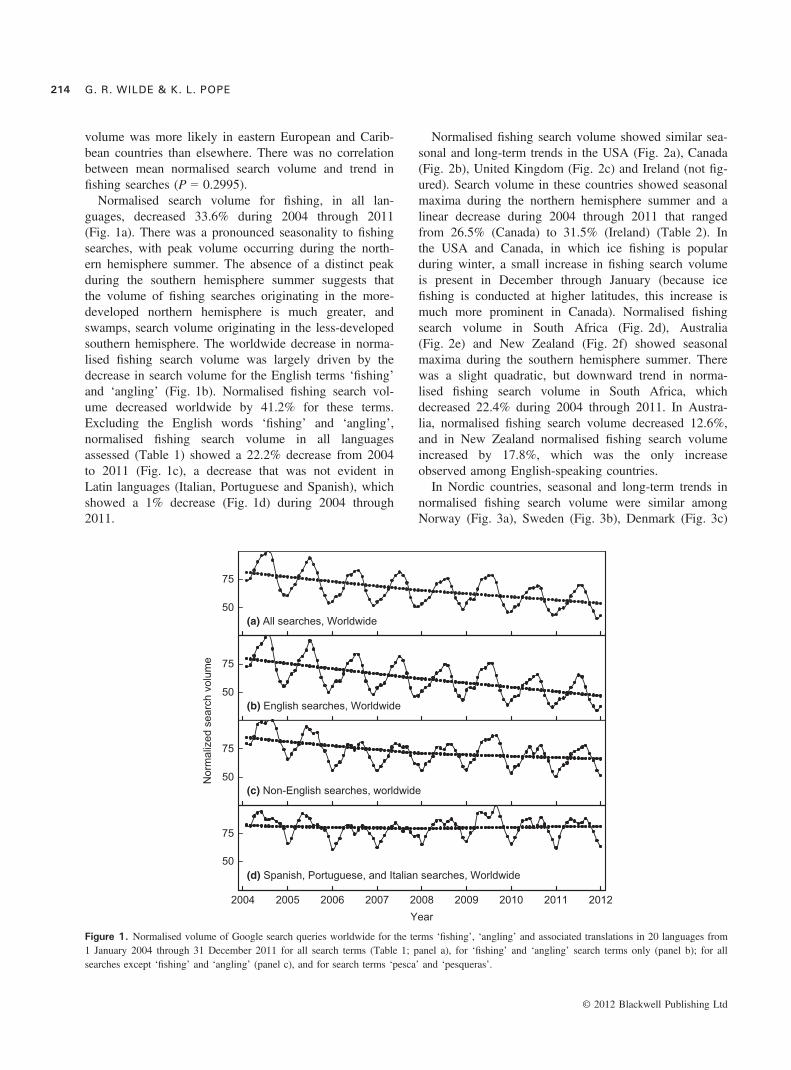
guages, decreased 33.6% during 2004 through 2011(Fig. 1a). There was a pronounced seasonality to fishingsearches, with peak volume occurring during the north-ern hemisphere summer. The absence of a distinct peakduring the southern hemisphere summer suggests thatthe volume of fishing searches originating in the more-developed northern hemisphere is much greater, andswamps, search volume originating in the less-developedsouthern hemisphere. The worldwide decrease in norma-lised fishing search volume was largely driven by thedecrease in search volume for the English terms ‘fishing’and ‘angling’ (Fig. 1b). Normalised fishing search vol-ume decreased worldwide by 41.2% for these terms.Excluding the English words ‘fishing’ and ‘angling’,normalised fishing search volume in all languagesassessed (Table 1) showed a 22.2% decrease from 2004to 2011 (Fig. 1c), a decrease that was not evident inLatin languages (Italian, Portuguese and Spanish), whichshowed a 1% decrease (Fig. 1d) during 2004 through2011.
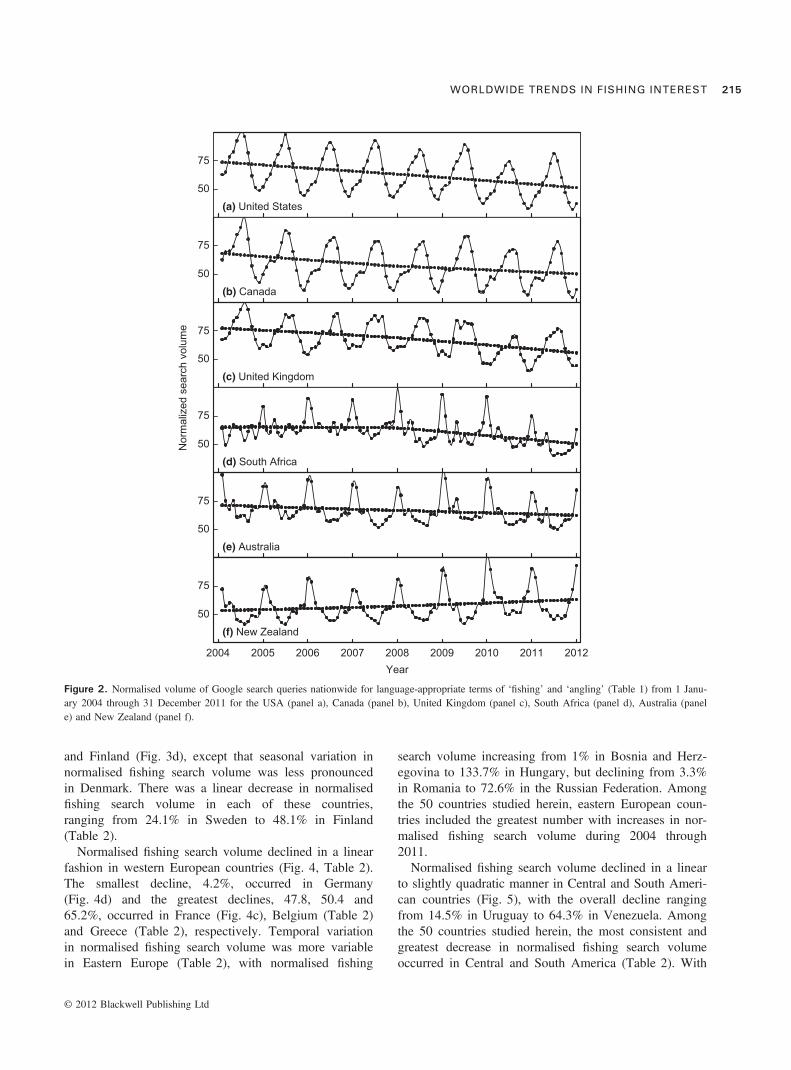
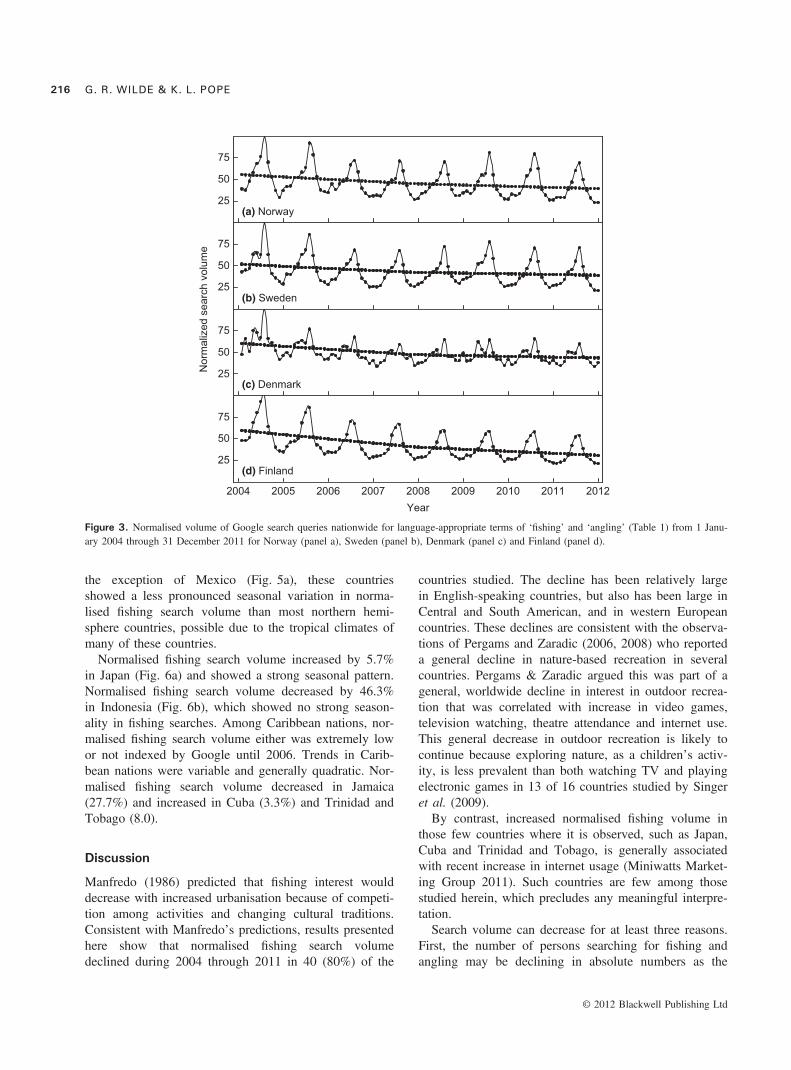
Normalised fishing search volume showed similar sea-sonal and long-term trends in the USA (Fig. 2a), Canada(Fig. 2b), United Kingdom (Fig. 2c) and Ireland (not fig-ured). Search volume in these countries showed seasonalmaxima during the northern hemisphere summer and alinear decrease during 2004 through 2011 that rangedfrom 26.5% (Canada) to 31.5% (Ireland) (Table 2). Inthe USA and Canada, in which ice fishing is popularduring winter, a small increase in fishing search volumeis present in December through January (because icefishing is conducted at higher latitudes, this increase ismuch more prominent in Canada). Normalised fishingsearch volume in South Africa (Fig. 2d), Australia(Fig. 2e) and New Zealand (Fig. 2f) showed seasonalmaxima during the southern hemisphere summer. Therewas a slight quadratic, but downward trend in norma-lised fishing search volume in South Africa, whichdecreased 22.4% during 2004 through 2011. In Austra-lia, normalised fishing search volume decreased 12.6%,and in New Zealand normalised fishing search volumeincreased by 17.8%, which was the only increaseobserved among English-speaking countries.In Nordic countries, seasonal and long-term trends in
normalised fishing search volume were similar amongNorway (Fig. 3a), Sweden (Fig. 3b), Denmark (Fig. 3c)
50
75
Nor
mal
ized
sea
rch
volu
me
50
75
50
75
(a) All searches, Worldwide
(b) English searches, Worldwide
(c) Non-English searches, worldwide
Year2004 2005 2006 2007 2008 2009 2010 2011 2012
50
75
(d) Spanish, Portuguese, and Italian searches, Worldwide
Figure 1. Normalised volume of Google search queries worldwide for the terms ‘fishing’, ‘angling’ and associated translations in 20 languages from1 January 2004 through 31 December 2011 for all search terms (Table 1; panel a), for ‘fishing’ and ‘angling’ search terms only (panel b); for allsearches except ‘fishing’ and ‘angling’ (panel c), and for search terms ‘pesca’ and ‘pesqueras’.
© 2012 Blackwell Publishing Ltd
G. R. WILDE & K. L. POPE214
and Finland (Fig. 3d), except that seasonal variation innormalised fishing search volume was less pronouncedin Denmark. There was a linear decrease in normalisedfishing search volume in each of these countries,ranging from 24.1% in Sweden to 48.1% in Finland(Table 2).Normalised fishing search volume declined in a linear
fashion in western European countries (Fig. 4, Table 2).The smallest decline, 4.2%, occurred in Germany(Fig. 4d) and the greatest declines, 47.8, 50.4 and65.2%, occurred in France (Fig. 4c), Belgium (Table 2)and Greece (Table 2), respectively. Temporal variationin normalised fishing search volume was more variablein Eastern Europe (Table 2), with normalised fishing
search volume increasing from 1% in Bosnia and Herz-egovina to 133.7% in Hungary, but declining from 3.3%in Romania to 72.6% in the Russian Federation. Amongthe 50 countries studied herein, eastern European coun-tries included the greatest number with increases in nor-malised fishing search volume during 2004 through2011.Normalised fishing search volume declined in a linear
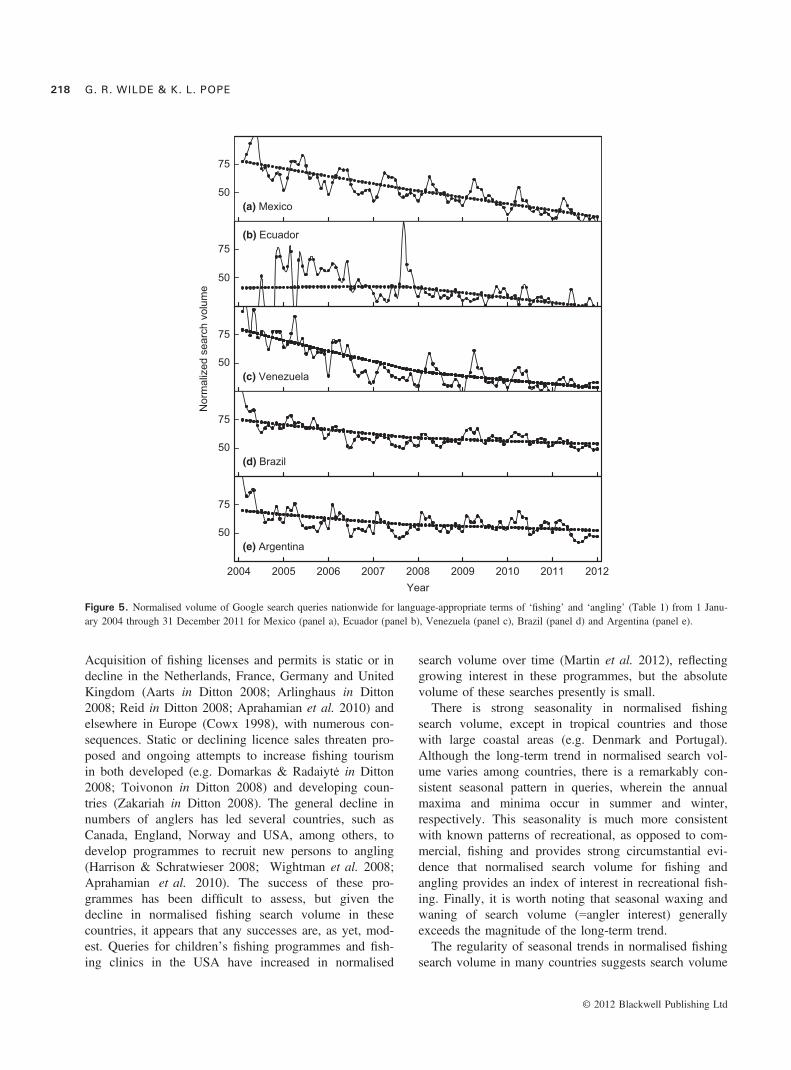
to slightly quadratic manner in Central and South Ameri-can countries (Fig. 5), with the overall decline rangingfrom 14.5% in Uruguay to 64.3% in Venezuela. Amongthe 50 countries studied herein, the most consistent andgreatest decrease in normalised fishing search volumeoccurred in Central and South America (Table 2). With
50
75
50
75
Nor
mal
ized
sea
rch
volu
me
50
75
50
75
(a) United States
(b) Canada
(c) United Kingdom
(d) South Africa
50
75
(e) Australia
Year2004 2005 2006 2007 2008 2009 2010 2011 2012
50
75
(f) New Zealand
Figure 2. Normalised volume of Google search queries nationwide for language-appropriate terms of ‘fishing’ and ‘angling’ (Table 1) from 1 Janu-ary 2004 through 31 December 2011 for the USA (panel a), Canada (panel b), United Kingdom (panel c), South Africa (panel d), Australia (panele) and New Zealand (panel f).
© 2012 Blackwell Publishing Ltd
WORLDWIDE TRENDS IN FISHING INTEREST 215
the exception of Mexico (Fig. 5a), these countriesshowed a less pronounced seasonal variation in norma-lised fishing search volume than most northern hemi-sphere countries, possible due to the tropical climates ofmany of these countries.Normalised fishing search volume increased by 5.7%
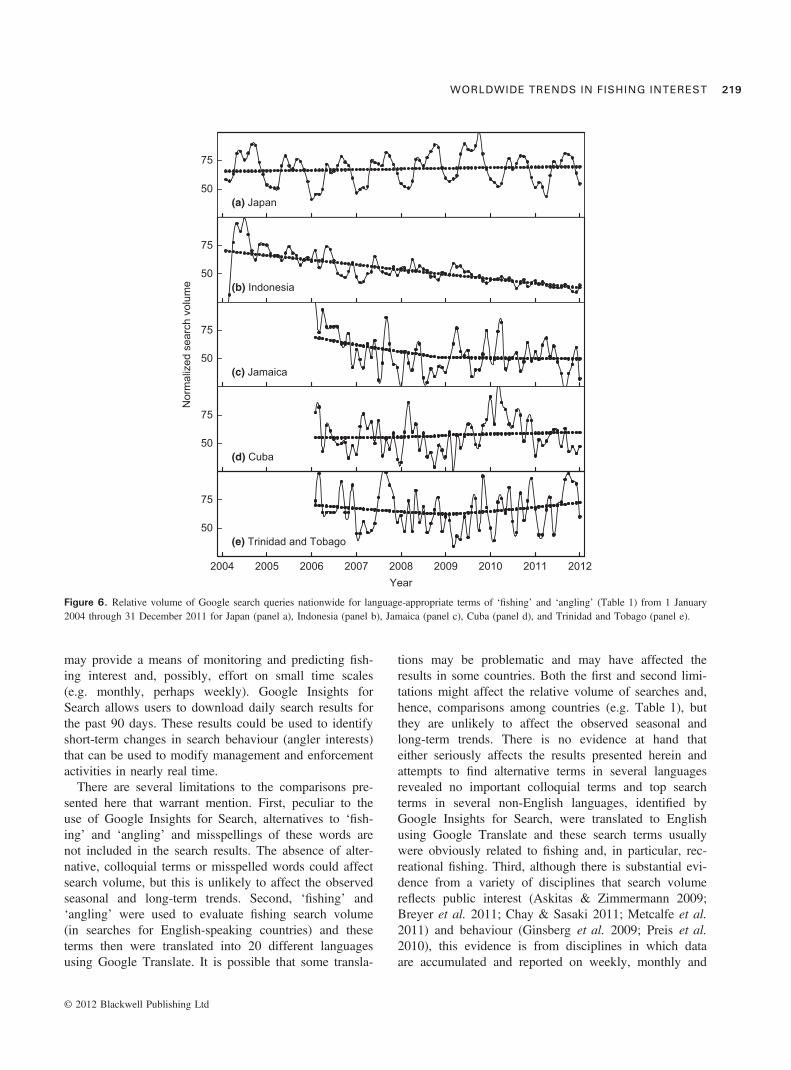
in Japan (Fig. 6a) and showed a strong seasonal pattern.Normalised fishing search volume decreased by 46.3%in Indonesia (Fig. 6b), which showed no strong season-ality in fishing searches. Among Caribbean nations, nor-malised fishing search volume either was extremely lowor not indexed by Google until 2006. Trends in Carib-bean nations were variable and generally quadratic. Nor-malised fishing search volume decreased in Jamaica(27.7%) and increased in Cuba (3.3%) and Trinidad andTobago (8.0).
Discussion
Manfredo (1986) predicted that fishing interest woulddecrease with increased urbanisation because of competi-tion among activities and changing cultural traditions.Consistent with Manfredo’s predictions, results presentedhere show that normalised fishing search volumedeclined during 2004 through 2011 in 40 (80%) of the
countries studied. The decline has been relatively largein English-speaking countries, but also has been large inCentral and South American, and in western Europeancountries. These declines are consistent with the observa-tions of Pergams and Zaradic (2006, 2008) who reporteda general decline in nature-based recreation in severalcountries. Pergams & Zaradic argued this was part of ageneral, worldwide decline in interest in outdoor recrea-tion that was correlated with increase in video games,television watching, theatre attendance and internet use.This general decrease in outdoor recreation is likely tocontinue because exploring nature, as a children’s activ-ity, is less prevalent than both watching TV and playingelectronic games in 13 of 16 countries studied by Singeret al. (2009).By contrast, increased normalised fishing volume in
those few countries where it is observed, such as Japan,Cuba and Trinidad and Tobago, is generally associatedwith recent increase in internet usage (Miniwatts Market-ing Group 2011). Such countries are few among thosestudied herein, which precludes any meaningful interpre-tation.Search volume can decrease for at least three reasons.
First, the number of persons searching for fishing andangling may be declining in absolute numbers as the
25
50
75
Nor
mal
ized
sea
rch
volu
me
25
50
75
25
50
75
(a) Norway
(b) Sweden
(c) Denmark
Year2004 2005 2006 2007 2008 2009 2010 2011 2012
25
50
75
(d) Finland
Figure 3. Normalised volume of Google search queries nationwide for language-appropriate terms of ‘fishing’ and ‘angling’ (Table 1) from 1 Janu-ary 2004 through 31 December 2011 for Norway (panel a), Sweden (panel b), Denmark (panel c) and Finland (panel d).
© 2012 Blackwell Publishing Ltd
G. R. WILDE & K. L. POPE216
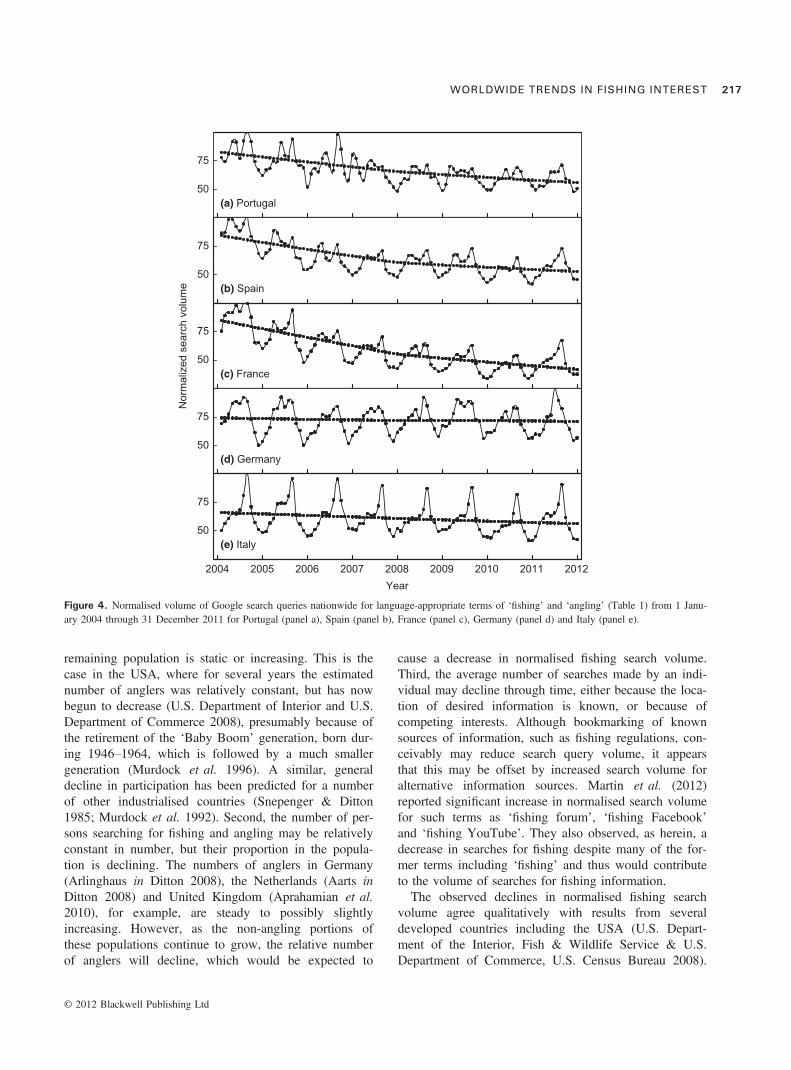
remaining population is static or increasing. This is thecase in the USA, where for several years the estimatednumber of anglers was relatively constant, but has nowbegun to decrease (U.S. Department of Interior and U.S.Department of Commerce 2008), presumably because ofthe retirement of the ‘Baby Boom’ generation, born dur-ing 1946–1964, which is followed by a much smallergeneration (Murdock et al. 1996). A similar, generaldecline in participation has been predicted for a numberof other industrialised countries (Snepenger & Ditton1985; Murdock et al. 1992). Second, the number of per-sons searching for fishing and angling may be relativelyconstant in number, but their proportion in the popula-tion is declining. The numbers of anglers in Germany(Arlinghaus in Ditton 2008), the Netherlands (Aarts inDitton 2008) and United Kingdom (Aprahamian et al.2010), for example, are steady to possibly slightlyincreasing. However, as the non-angling portions ofthese populations continue to grow, the relative numberof anglers will decline, which would be expected to
cause a decrease in normalised fishing search volume.Third, the average number of searches made by an indi-vidual may decline through time, either because the loca-tion of desired information is known, or because ofcompeting interests. Although bookmarking of knownsources of information, such as fishing regulations, con-ceivably may reduce search query volume, it appearsthat this may be offset by increased search volume foralternative information sources. Martin et al. (2012)reported significant increase in normalised search volumefor such terms as ‘fishing forum’, ‘fishing Facebook’and ‘fishing YouTube’. They also observed, as herein, adecrease in searches for fishing despite many of the for-mer terms including ‘fishing’ and thus would contributeto the volume of searches for fishing information.The observed declines in normalised fishing search
volume agree qualitatively with results from severaldeveloped countries including the USA (U.S. Depart-ment of the Interior, Fish & Wildlife Service & U.S.Department of Commerce, U.S. Census Bureau 2008).
50
75
50
75
Nor
mal
ized
sea
rch
volu
me
50
75
50
75
(a) Portugal
(b) Spain
(c) France
(d) Germany
Year2004 2005 2006 2007 2008 2009 2010 2011 2012
50
75
(e) Italy
Figure 4. Normalised volume of Google search queries nationwide for language-appropriate terms of ‘fishing’ and ‘angling’ (Table 1) from 1 Janu-ary 2004 through 31 December 2011 for Portugal (panel a), Spain (panel b), France (panel c), Germany (panel d) and Italy (panel e).
© 2012 Blackwell Publishing Ltd
WORLDWIDE TRENDS IN FISHING INTEREST 217
Acquisition of fishing licenses and permits is static or indecline in the Netherlands, France, Germany and UnitedKingdom (Aarts in Ditton 2008; Arlinghaus in Ditton2008; Reid in Ditton 2008; Aprahamian et al. 2010) andelsewhere in Europe (Cowx 1998), with numerous con-sequences. Static or declining licence sales threaten pro-posed and ongoing attempts to increase fishing tourismin both developed (e.g. Domarkas & Radaiytė in Ditton2008; Toivonon in Ditton 2008) and developing coun-tries (Zakariah in Ditton 2008). The general decline innumbers of anglers has led several countries, such asCanada, England, Norway and USA, among others, todevelop programmes to recruit new persons to angling(Harrison & Schratwieser 2008; Wightman et al. 2008;Aprahamian et al. 2010). The success of these pro-grammes has been difficult to assess, but given thedecline in normalised fishing search volume in thesecountries, it appears that any successes are, as yet, mod-est. Queries for children’s fishing programmes and fish-ing clinics in the USA have increased in normalised
search volume over time (Martin et al. 2012), reflectinggrowing interest in these programmes, but the absolutevolume of these searches presently is small.There is strong seasonality in normalised fishing
search volume, except in tropical countries and thosewith large coastal areas (e.g. Denmark and Portugal).Although the long-term trend in normalised search vol-ume varies among countries, there is a remarkably con-sistent seasonal pattern in queries, wherein the annualmaxima and minima occur in summer and winter,respectively. This seasonality is much more consistentwith known patterns of recreational, as opposed to com-mercial, fishing and provides strong circumstantial evi-dence that normalised search volume for fishing andangling provides an index of interest in recreational fish-ing. Finally, it is worth noting that seasonal waxing andwaning of search volume (=angler interest) generallyexceeds the magnitude of the long-term trend.The regularity of seasonal trends in normalised fishing
search volume in many countries suggests search volume
50
75
50
75
Nor
mal
ized
sea
rch
volu
me
50
75
50
75
(a) Mexico
(b) Ecuador
(c) Venezuela
(d) Brazil
Year2004 2005 2006 2007 2008 2009 2010 2011 2012
50
75
(e) Argentina
Figure 5. Normalised volume of Google search queries nationwide for language-appropriate terms of ‘fishing’ and ‘angling’ (Table 1) from 1 Janu-ary 2004 through 31 December 2011 for Mexico (panel a), Ecuador (panel b), Venezuela (panel c), Brazil (panel d) and Argentina (panel e).
© 2012 Blackwell Publishing Ltd
G. R. WILDE & K. L. POPE218
may provide a means of monitoring and predicting fish-ing interest and, possibly, effort on small time scales(e.g. monthly, perhaps weekly). Google Insights forSearch allows users to download daily search results forthe past 90 days. These results could be used to identifyshort-term changes in search behaviour (angler interests)that can be used to modify management and enforcementactivities in nearly real time.There are several limitations to the comparisons pre-
sented here that warrant mention. First, peculiar to theuse of Google Insights for Search, alternatives to ‘fish-ing’ and ‘angling’ and misspellings of these words arenot included in the search results. The absence of alter-native, colloquial terms or misspelled words could affectsearch volume, but this is unlikely to affect the observedseasonal and long-term trends. Second, ‘fishing’ and‘angling’ were used to evaluate fishing search volume(in searches for English-speaking countries) and theseterms then were translated into 20 different languagesusing Google Translate. It is possible that some transla-
tions may be problematic and may have affected theresults in some countries. Both the first and second limi-tations might affect the relative volume of searches and,hence, comparisons among countries (e.g. Table 1), butthey are unlikely to affect the observed seasonal andlong-term trends. There is no evidence at hand thateither seriously affects the results presented herein andattempts to find alternative terms in several languagesrevealed no important colloquial terms and top searchterms in several non-English languages, identified byGoogle Insights for Search, were translated to Englishusing Google Translate and these search terms usuallywere obviously related to fishing and, in particular, rec-reational fishing. Third, although there is substantial evi-dence from a variety of disciplines that search volumereflects public interest (Askitas & Zimmermann 2009;Breyer et al. 2011; Chay & Sasaki 2011; Metcalfe et al.2011) and behaviour (Ginsberg et al. 2009; Preis et al.2010), this evidence is from disciplines in which dataare accumulated and reported on weekly, monthly and
50
75
50
75
Nor
mal
ized
sea
rch
volu
me
50
75
50
75
(a) Japan
(b) Indonesia
(c) Jamaica
(d) Cuba
Year2004 2005 2006 2007 2008 2009 2010 2011 2012
50
75
(e) Trinidad and Tobago
Figure 6. Relative volume of Google search queries nationwide for language-appropriate terms of ‘fishing’ and ‘angling’ (Table 1) from 1 January2004 through 31 December 2011 for Japan (panel a), Indonesia (panel b), Jamaica (panel c), Cuba (panel d), and Trinidad and Tobago (panel e).
© 2012 Blackwell Publishing Ltd
WORLDWIDE TRENDS IN FISHING INTEREST 219
quarterly bases. By contrast, most recreational fisherydata, particularly licence sales on a national scale, arereported on an annual basis. Therefore, the exact natureof the relationship between search volume (=angler inter-est) and licence sales (=angler behaviour) is unknownand represents an area that would benefit from empiricalresearch. At present, the limited time series available(8 years) for Google Insights for Search and the annual,and often delayed, reporting of licence and participationdata preclude any detailed analysis of the relationshipbetween these variables and normalised search volume.Despite the limitations of the use of search queries,
these data potentially hold considerable promise forfishery management. Issue salience is typically mea-sured by means of special questions in surveys (Dear-ing & Rogers 1996), which are able to focus on onlya portion of the multi-faceted concept termed salience(Gadziala & Becker 1983). Thus, these surveys pro-vide only vague and indirect measures of latent statesand actions because survey responses only identify themost important problem(s) perceived by the respondenton the day the questionnaire is completed. Informationseeking, as observed through internet search queries, isan excellent indicator of issue salience. Compared withsurvey questions, there is no interviewer bias or socialdesirability involved with internet search queries, thesummations of search volumes are completely unobtru-sive, and observations occur in the field rather than inan artificial setting. Google search queries represent anactive pursuit of information by the searcher (Schar-kow & Vogelgesang 2011) and arguably predict futureaction more closely than do survey responses (e.g.Preis et al. 2010). This suggests Google Insights forSearch may be particularly useful in tracking anglerand public interest in emerging issues. For example, inthe USA, normalised search volume for ‘Asian carp’increases sharply, and very quickly, following newsmedia reports, attempts to document or arrest theexpanding distribution of these fish in the Great Lakes(G. R. Wilde, unpublished data).Cooke and Cowx (2004) suggested the United Nations
Food and Agricultural Organisation should include partici-pation and harvest statistics for recreational fisheries intheir fishery assessments. However, they noted that datacollection would be a challenge in many countries. Forexample, Griffiths and Lamberth (2002) described infor-mation used to assess the recreational fishery in SouthAfrica, which included club logbooks, results from com-petitive fishing events, voluntarily contributed catch cardsand occasional observations by enforcement officers. Grif-fiths & Lamberth commented on the biases and generalunreliability of these data, but it is exactly these kinds ofdata that are used to assess fishing in many countries that
have not yet developed formal data collection pro-grammes. Until better data collection schemes are put intoplace, analyses of search queries provide a low-cost meansof gaining insight into angler dynamics and interests incountries around the world.
Acknowledgments
Use of trade names is for descriptive purposes only anddoes not imply endorsement by the U.S. Government.The Nebraska Cooperative Fish and Wildlife ResearchUnit is jointly supported by a cooperative agreementamong the U.S. Geological Survey, the Nebraska Gameand Parks Commission, the University of Nebraska, theU.S. Fish and Wildlife Service, and the Wildlife Man-agement Institute.
References
Amichai-Hamburger Y. & Ben-Artzi E. (2000) The relationshipbetween extraversion and neuroticism and the different usersof the Internet. Computers in Human Behavior 16, 441–449.
Amichai-Hamburger Y. & Hayat Z. (2011) The impact of theInternet on the social lives of users: a representative samplefrom 13 countries. Computers in Human Behavior 27, 585–589.
Anticamara J.A., Watson R., Gelchu A. & Pauly D. (2011)Global fishing effort (1950–2010): trends, gaps, andimplications. Fisheries Research 107, 131–136.
Aprahamian M.W., Hickley P., Shields B.A. & Mawle G.W.(2010) Examining changes in participation in recreationalfisheries in England and Wales. Fisheries Management andEcology 17, 93–105.
Arlinghaus R., Mehner T. & Cowx I.G. (2002) Reconcilingtraditional inland fisheries management and sustainability inindustrialized countries, with emphasis on Europe. Fish andFisheries 3, 261–316.
Askitas N. & Zimmermann K.F. (2009) Google econometricsand unemployment forecasting. Applied Economics Quarterly55, 107–120.
Breyer B.N., Sen S., Aaronson D.S., Stoller M.L., Erickson B.A.& Eisenberg M.L. (2011) Use of Google Insights for Search totrack seasonal and geographic kidney stone incidence in theUnited States. Urology 78, 267–271.
Brownstein J.S., Freifeld C.C. & Madoff L.C. (2009) Digitaldisease detection- harnessing the web for public healthsurveillance. New England Journal of Medicine 360, 2153–2157.
Chay S. & Sasaki N. (2011) Using online tools to assess publicresponses to climate change mitigation policies in Japan.Future Internet 3, 117–129.
Cleveland W.S., McRae J.E. & Terpenning I. (1990) STL: aseasonal-trend decomposition procedure based on loess.Journal of Official Statistics 6, 3–73.
© 2012 Blackwell Publishing Ltd
G. R. WILDE & K. L. POPE220

Coleman F.C., Figueira W.F., Ueland J.S. & Crowder L.B.(2004) The impact of United States recreational fisheries onmarine fish populations. Science 305, 1958–1960.
Cooke S.J. & Cowx I.G. (2004) The role of recreational fishingin global fish crises. BioScience 54, 857–859.
Cooke S.J. & Cowx I.G. (2006) Contrasting recreational andcommercial fishing: searching for common issues to promoteunified conservation of fisheries resources and aquaticenvironments. Biological Conservation 128, 93–108.
Cowx I.G. (1998) Aquatic resource planning for resolution offisheries management issues. In: T.J. Pitcher & C.E.Hollingworth (eds) Recreational Fisheries: Ecological,Economic and Social Evaluation. Oxford, UK: BlackwellPublishing, pp. 97–105.
Dearing J.W. & Rogers E.M. (1996) Communication Concepts6: Agenda-Setting. Thousand Oaks, CA: Sage Publications,Inc., 152 pp.
Ditton R.D. (2008) An international perspective on recreationalfishing. In: Ø. Aas (ed.) Global Challenges in RecreationalFisheries. Oxford, UK: Blackwell, pp. 5–55.
Gadziala S. & Becker L. (1983) A new look at agenda-settingin the 1976 election debates. Journalism Quarterly 60, 122–126.
Ginsberg J., Mohebbi M.H., Patel R.S., Brammer L., SmolinskiM.S. & Brilliant L. (2009) Detecting influenza epi-demics using search engine query data. Nature 457, 1012–1014.
Google. (2010) Google Insights for Search Help. Availableat: http://www.google.com/support/insights/ (accessed 31December 2010).
Griffiths M.H. & Lamberth S.J. (2002) Evaluating the marinerecreational fishery in South Africa. In: T.J. Pitcher & C.E.Hollingworth (eds) Recreational Fisheries: Ecological,Economic and Social Evaluation. Oxford, UK: BlackwellPublishing, pp. 227–251.
Guthrie D., Hoenig J.M., Holliday M., Jones C.M., Mill M.J.,Moberly S.A. et al. (eds) (1991) Creel and Angler Surveys inFisheries Management. Bethesda, MD: American FisheriesSociety, Symposium 12, 528 pp.
Harrison J.C. & Schratwieser J. (2008) The role of non-governmental organizations in recreational fisheriesmanagement: challenges, responsibilities and possibilities. In:Ø. Aas (ed.) Global Challenges in Recreational Fisheries.Oxford, UK: Blackwell, pp. 324–337.
Hilborn R., Branch T.A., Ernst B., Magnusson A., Minte-VeraC.V., Scheuerell M.D. et al. (2003) State of the world’sfisheries. Annual Review of Environment and Resources 28,359–399.
Lewin W.-C., Arlinghaus R. & Mehner T. (2006) Documentedand potential biological impacts of recreational fishing:insights for management and conservation. Reviews inFisheries Science 14, 305–367.
Manfredo M.J. (1986) Recreational fishing. In: The President’sCommission on Americans Outdoors (ed.) The President’sCommission on Americans Outdoors: A Literature Review.
Washington, DC: US Government Printing Office, pp.Activities 31–39.
Martin D.R., Pracheil B.M., DeBoer J.A., Wilde G.R., & Pope K.L. (2012) A look at today’s angler: how technology revealspatterns in the internet age. Fisheries 37, 000–000.
Metcalfe D., Price C. & Powell J. (2011) Media coverage andpublic reaction to a celebrity cancer diagnosis. Journal ofPublic Health 33, 80–85.
Miniwatts Marketing Group. (2011) InternetWorld Stats: Usage andPopulation Statistics.Available at : http://www.internetworldstats.com/stats.htm(accessed25July2012).
Murdock S.H., Backman K., Ditton R.B., Hoque M.N. & EllisD. (1992) Demographic change in the United States in the1990’s and the Twenty-first Century: implications for fisheriesmanagement. Fisheries 17, 6–13.
Murdock S.H., Loomis D.K., Ditton R.B. & Hoque M. (1996)The implications of demographic change for recreationalfisheries management in the United States. Human Dimensionsof Wildlife 1, 14–37.
O’Connor S., Ono R. & Clarkson C. (2011) Pelagic fishing at42,000 years before the present and the maritime skills ofmodern humans. Science 334, 1117–1121.
Pelat C., Turbelin C., Bar-Hen A., Flahault A. & Valleron A.(2009) More diseases tracked by using Google trends.Emerging Infectious Diseases 15, 1327–1328.
Pergams O.R.W. & Zaradic P.A. (2006) Is love of nature in theUS becoming love of electronic media? 16-year downtrend innational park visits explained by watching movies, playingvideo games, internet use, and oil prices. Journal ofEnvironmental Management 80, 387–393.
Pergams O.R.W. & Zaradic P.A. (2008) Evidence for afundamental and pervasive shift away from nature-basedrecreation. Proceedings of the National Academy of ScienceUSA 105, 2295–2300.
Pollock K.H., Jones C.M. & Brown T.L. (1994) Angler SurveyMethods and Their Application in Fisheries Management.Bethesda, MD: American Fisheries Society, SpecialPublication 25, 371 pp.
Post J.R., Sullivan M., Cox S., Lester N.P., Walters C.J.,Parkinson E.A. et al. (2002) Canada’s recreational fisheries:the invisible collapse? Fisheries 27, 6–15.
Preis P., Reith D. & Stanley H.E. (2010) Complex dynamics ofour economic life on different scales: insights from searchengine query data. Philosophical Transactions. Series A,Mathematical, Physical, and Engineering Sciences 368, 5707–5719.
Scharkow M. & Vogelgesang J. (2011) Measuring the publicagenda using search engine queries. International Journal ofPublic Opinion Research 23, 104–113.
Scheitle C.P. (2011) Google’s Insights for Search: a noteevaluating the use of search engine data in social research.Social Science Quarterly 92, 285–295.
Singer D.G., Singer J.L., D’Agostino H. & DeLong R. (2009)Children’s pastimes and play in sixteen nations: is free-playdeclining? American Journal of Play 1, 283–312.
© 2012 Blackwell Publishing Ltd
WORLDWIDE TRENDS IN FISHING INTEREST 221

Snepenger D.J. & Ditton R.B. (1985) A longitudinal analysis ofnationwide hunting and fishing indicators: 1955-1980. LeisureSciences 7, 297–319.
Swartz W., Sala R., Tracey S., Watson R. & Pauly D. (2010)The spatial expansion and ecological footprint of fisheries(1950 to present). PLoS ONE 5(12), e15143.
U.S. Department of the Interior, Fish and Wildlife Service & U.S. Department of Commerce, U.S. Census Bureau (2008) 2006
National Survey of Fishing, Hunting, and Wildlife-AssociatedRecreation. Washington, DC: U.S. Department of the Interior,Fish and Wildlife Service, 168 pp.
Wightman R., Sutton S., Matthews B.E., Gillis K., Colman J. &Samuelsen J.R. (2008) Recruiting new anglers: driving forces,constraints, and examples of success. In: Ø. Aas (ed.) GlobalChallenges in Recreational Fisheries. Oxford, UK: Blackwell,pp. 303–323.
© 2012 Blackwell Publishing Ltd
G. R. WILDE & K. L. POPE222