Embed Size (px)
Citation preview
Woven and Knit Fabrics
The woven and knit fabrics industry consists of establishments engaged in the production of a variety of fabrics from yarn (see Table 1). Woven and knit fabrics are used in apparel, industrial and home fumishing applications, including clothing, drapery, upholstery, towels, sheeting, belts, typewriter ribbons and hosiery.
Shipments of all textile products slowed in 1988, but the effect on domestic fabric producers was reduced by a slight shift to sourcing fabrics domestically. The slack demand for textile end products was especially evident in the market for unfinished, undyed fabrics (greige goods). By mid-1988, the inventories of fabric producers
-began to climb, as fabric users saw little need to purchase in excess of cr-rrrent reqr-rirementc until c!ear-cut signals cf strengthened consumer demand was evident.
Shipments of manmade fiber broadwoven fabric rose sharply in 1987 and climbed another 8.2 percent, to $10 billion, in 1988. This sector benefitted from the increased use of manmade fibers in blends
with natural fibers for apparel, as well as continued growth in the industrial fabric market in which manmade fibers dominate. Ship- ments of woven cotton declined 4.5 percent in constant dollars in 1988 after two successive years of growth.
problems facing U. S. textile mills. In the first quarter of 1990, textile and apparel imports alone repre- sented over 30 percent of the U.S. trade deficit. Textile and apparel imports for 1989 showed a 13 percent gain over 1987's record- breaking figure. Fabric imports alone were up 26 percent in 1989 *I
(see Figure 1). This double-digit import growth is occurring at a time when the textile market is expecting sluggish growth in 1990 (about 1 percent).
Technological developments and market forces are causing structural changes in this industry. Vertical integration is becoming common- place, as major fabric producers acquire interests in pr: pro0ucticn facilities and/or apparel companies. Horizontal integration is also taking place with increasing frequency. Mergers, acquisitions, restructurings and consolidations have become common. Recently, Burlington Industries went private and sold off several divisions. Also, West Point-
Imports are still one of the major
SIC 221-225
Pepperell acquired much of J. P. Stevens, but was then acquired by the Farley Group. In knitting, the major change has been the rapid growth of Sara Lee, which has purchased L'eggs, Hanes, Stedman and Pannill.
The ongoing structural changes make it difficult to provide an up- to-date, accurate listing of the leading companies. Nevertheless, some of the major players can be
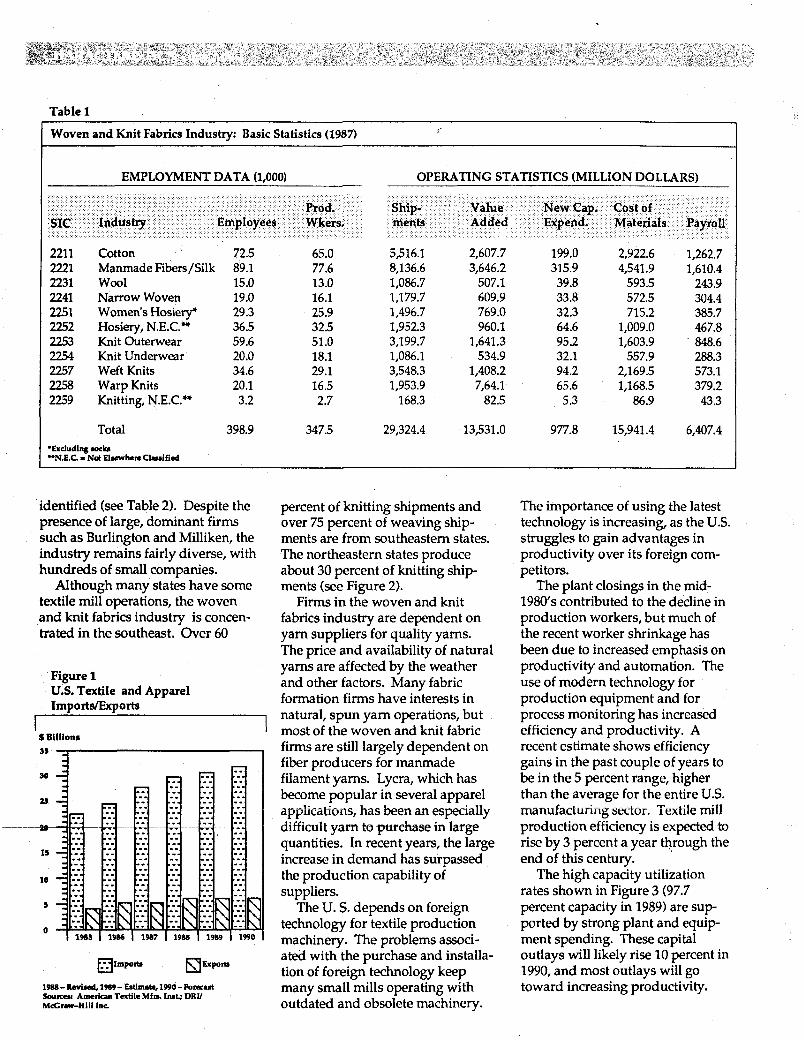
Table 1
Woven and Knit Fabrics Industry: Basic Statistics (1987)
EMPLOYMENT DATA (1,000)
Prod. SIC Industry Employees Wkers.
221 1 2221 2231 2241 2251 2252 2253 2254 2257 2258 2259
Cotton Manmade Fibers/Silk Wool Narrow Woven Women's Hosiery* Hosiery, N.E.C.- Knit Outerwear Knit Underwear Weft Knits Warp Knits Knitting, N.E.C."
72.5 89.1 15.0 19.0 29.3 36.5 59.6 20.0 34.6 20.1 3.2
398.9
65.0 77.6 13.0 16.1 25.9 32.5 51.0 18.1 29.1 16.5 2.7
347.5
OPERATING STATISTICS (MILLION DOLLARS)
Ship- Value New Cap. Cost of ments Added Expend. Materials Payroll
5,516.1 8,136.6 1,086.7 1,179.7 1,496.7 1,952.3 3,199.7 1,086.1 3,548.3 1,953.9
168.3
29,324.4
2,607.7 3,646.2
507.1 609.9 769.0 960.1
1,641.3 534.9
1,408.2 7,64.1
82.5
13,531 .O
199.0 315.9 39.8 33.8 32.3 64.6 95.2 32.1 94.2 65.6 5.3
2,922.6 1,262.7 4,541.9 1,610.4
593.5 243.9 572.5 304.4 715.2 385.7
1,009.0 467.8 1,603.9 ' 848.6
557.9 288.3 2,169.5 573.1 1,168.5 379.2
86.9 43.3
977.8 15,941.4 6,407.4
identified (see Table 2). Despite the presence of large, dominant firms such as Burlington and Milliken, the industry remains fairly diverse, with hundreds of small companies.
Although many states have some textile mill operations, the woven and knit fabrics industry is concen- trated in the southeast. Over 60
Figure 1 U.S. Textile and Apparel Imports/Exports
S Billions I
19M - Revlsd, 1911J - Eathate, 195-0 - Foracut Sourca: American Textile Mfm. INL; DRY McCmv-HilI Inr
percent of knitting shipments and over 75 percent of weaving ship- ments are from southeastem states. The northeastern states produce about 30 percent of knitting ship- ments (see Figure 2).
Firms in the woven and knit fabrics industry are dependent on yam suppliers for quality yams. The price and availability of natural yams are affected by the weather and other factors. Many fabric formation firms have interests in natural, spun yam operations, but most of the woven and knit fabric firms are still largely dependent on fiber producers for manmade filament yams. Lycra, which has become popular in several apparel applications, has been an especially difficult yarn to purchase in large quantities. In recent years, the large increase in demand has surpassed the production capability of suppliers.
The U. S. depends on foreign technology for textile production machinery. The problems associ- ated with the purchase and installa- tion of foreign technology keep many small mills operating with outdated and obsolete machinery.
The importance of using the latest technology is increasing, as the US. struggles to gain advantages in productivity over its foreign com- petitors.
The plant closings in the mid- 1980's contributed to the decline in production workers, but much of the recent worker shrinkage has been due to increased emphasis on productivity and automation. The use of modern technology for production equipment and for process monitoring has increased efficiency and productivity. A recent estimate shows efficiency gains in the past couple of years to be in the 5 percent range, higher than the average for the entire U.S. manufacturing sector. Textile miii production efficiency is expected to rise by 3 percent a year through the end of this century.
The high capacity utilization rates shown in Figure 3 (97.7 percent capacity in 1989) are s u p ported by strong plant and equip ment spending. These capital outlays will likely rise 10 percent in 1990, and most outlays will go toward increasing productivity.
. . . I .
, '.
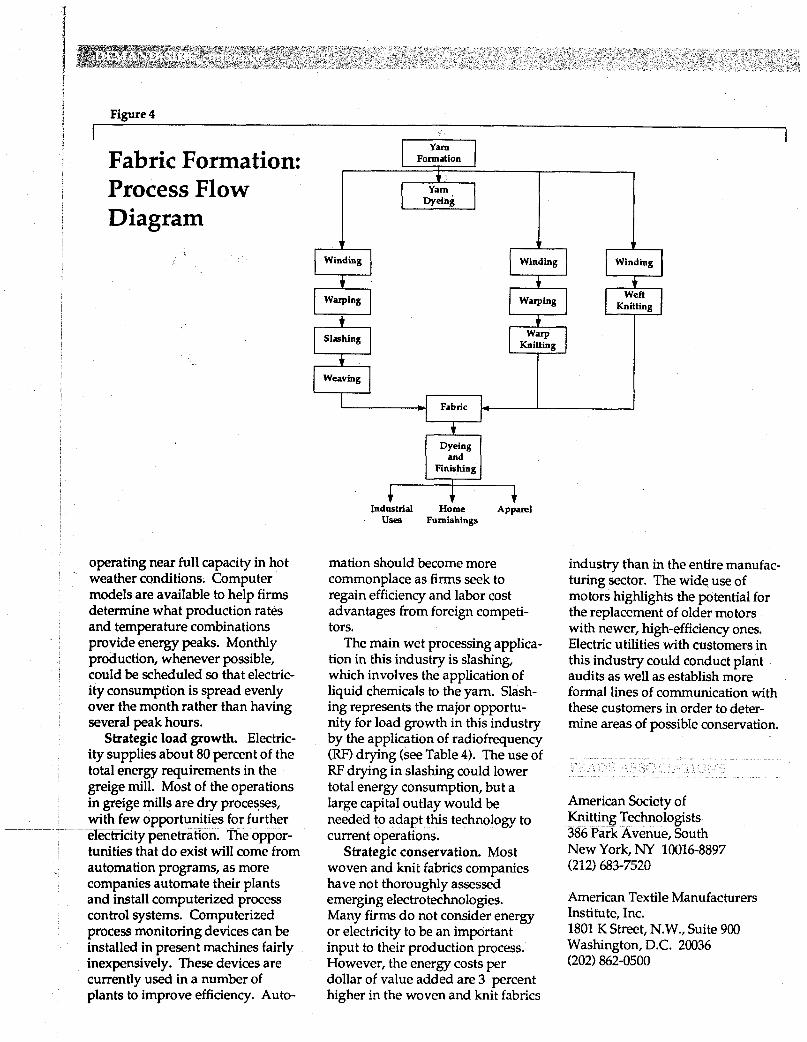
Figure 4
I Fabric Formation: Process Flow Diagram
operating near full capacity in hot weather conditions. Computer models are available to help firms determine what production rates and temperature combinations provide energy peaks. Monthly production, whenever possible, could be scheduled so that electric- ity consumption is spread evenly over the month rather than having several peak hours.
Strategic load growth. Electric- ity supplies about 80 percent of the total energy requirements in the greige mill. Most of the operations in greige mills are dry processes, with few opportunities for further e7ectricity penetration. The oppor- tunities that do exist will come from automation programs, as more companies automate their plants and install computerized process control systems. Computerized process monitoring devices can be installed in present machines fairly inexpensively. These devices are currently used in a number of plants to improve efficiency. Auto-
~~ ~~~~ ~~
1"1 Formation
F, Dyeing A Winding L; Winding A Winding
t t Slashing warp
Knitting
Weaving I
I 1
i + 4 Industrial Home Appaml Uses Fumishings
mation should become more commonplace as firms seek to regain efficiency and labor cost advantages from foreign competi- tors.
tion in this industry is slashing, which involves the application of liquid chemicals to the yarn. Slash- ing represents the major opportu- nity for load growth in this industry by the application of radiofrequency (RF) drying (see Table 4). The use of RF drying in slashing could lower total energy consumption, but a large capital outlay would be needed to adapt this technology to current operations.
Strategic conservation. Most wuven and knit iabrics companies have not thoroughly assessed emerging electrotechnologies. Many firms do not consider energy or electricity to be an important input to their production process. However, the energy costs per dollar of value added are 3 percent higher in the woven and knit fabrics
The main wet processing applica-
industry than in the entire manufac- turing sector. The wide use of motors highlights the potential for the replacement of older motors with newer, high-efficiency ones. Electric utilities with customers in this industry could conduct plant audits as well as establish more formal lines of communication with these customers in order to deter- mine areas of possible Conservation.
American Society of Knitting Technologists 386 Park Avenue, South New York, NY 10016-8897 (212) 683-7520
American Textile Manufacturers Institute, Inc. 1801 K Street, N.W., Suite 900 Washington, D.C. 20036 (202) 862-0500
V/N
n. L L 8 6 6P' 06' Ps' Is' i9' SL' 68 I 09 I
0' I rz'v I
V 6 I I'9SP I'L06 P'PLZ 9.11s O'L6E 9'98P P'ZSE f 3 8 Z 6EZ I'L ZZ6E'E
L'806
I'Z LOP s'86 OEZ P'SS OS€ OS6 68Z ZLZ 8'99s 2'961
6'8PZ
9 991 08P 6 6 p'9z 6 Z I 9 6 8'L E'ZI E'Z9 s'ZP
8'6S9
SI I'PZ s'os 'E'EI 061 I'ZZ P'n i' I Z 6 P I S'POE 9ESI
6522 8sn Lszz EZz ESZZ ZSZZ E i z IPZZ IEZZ rm rm
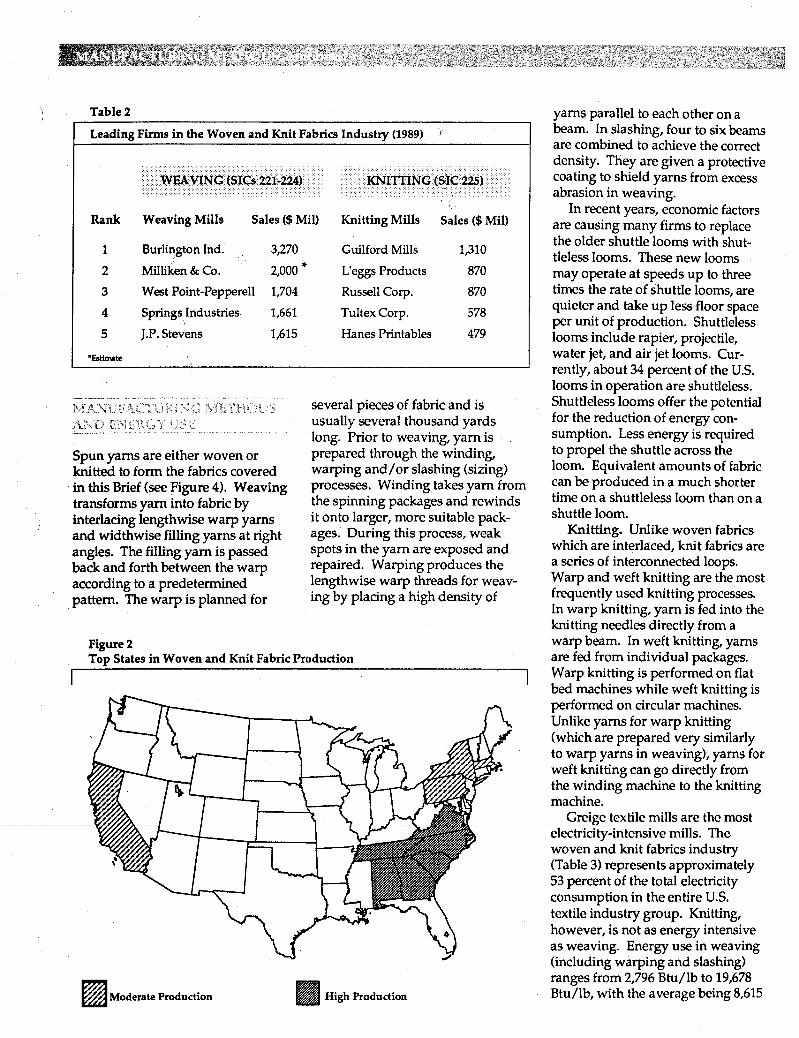
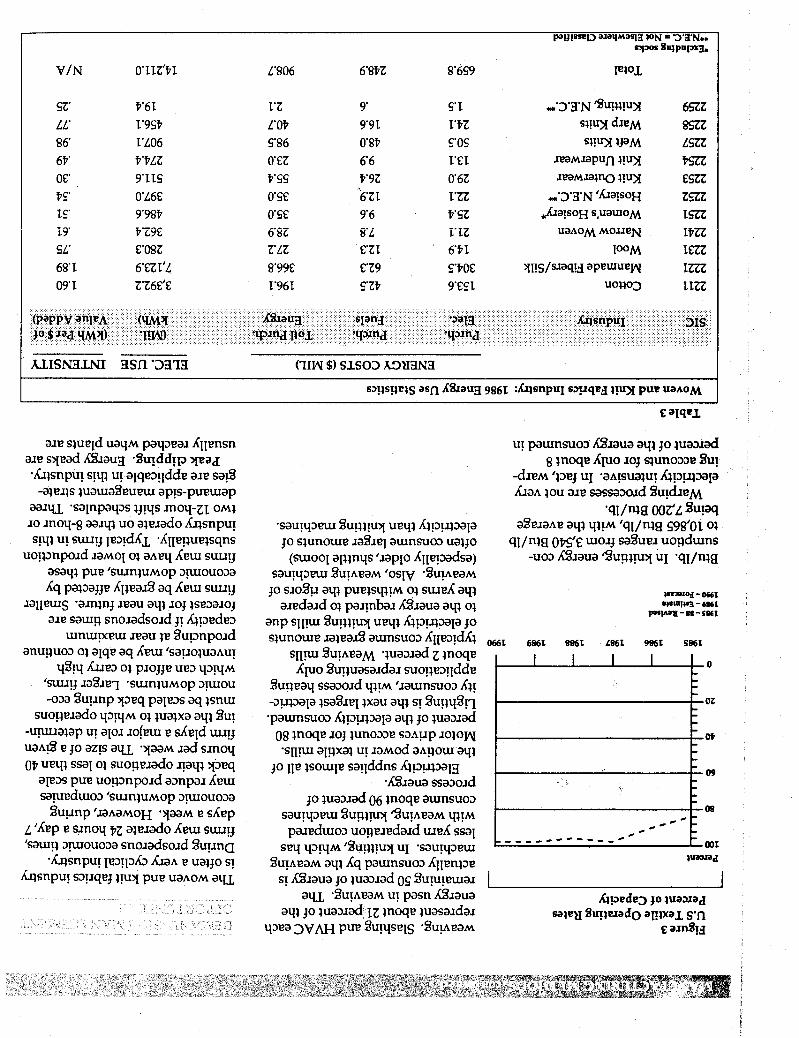
Table 2
Leading Firms in the Woven and Knit Fabrics Industry (1989) 1
WEAVING (SICS 221-224) KNITTING (SIC 225)
Rank Weaving Mills Sales ($ Mil) Knitting Mills Sales ($ Mil)
1 Burlington Ind. 3,270 Guilford Mills 1,310
2 Milliken & Co. 2,000 * L'eggs Products 870 3 West Point-Pepperell 1,704 Russell Corp. 870
4 Springs Industries 1,661 Tultex Corp. 578
5 J.P. Stevens 1,615 Hanes Printables 479
*Estimate
Spun yams are either woven or knitted to form the fabrics covered in this Brief (see Figure 4). Weaving transforms yam into fabric by interlacing lengthwise warp yams and widthwise filling yarns at right angles. The filling yam is passed back and forth between the warp according to a predetermined pattem. The warp is planned for
several pieces of fabric and is usually several thousand yards long. Prior to weaving, yarn is prepared through the winding, warping and/or slashing (sizing) processes. Winding takes yam from the spinning packages and rewinds it onto larger, more suitable pack- ages. During this process, weak spots in the yarn are exposed and repaired. Warping produces the lengthwise warp threads for weav- ing by placing a high density of
Figure 2 Top States in Woven and Knit Fabric Production
Moderate Production High Production
yams parallel to each other on a beam. In slashing, four to six beams are combined to achieve the correct density. They are given a protective coating to shield yarns from excess abrasion in weaving.
In recent years, economic factors are causing many firms to replace the older shuttle looms with shut- tleless looms. These new looms may operate at speeds up to three times the rate of shuttle looms, are quieter and take up less floor space per unit of production. Shuttleless looms include rapier, projectile, water jet, and air jet looms. Cur- rently, about 34 percent of the U.S. looms in operation are shuttleless. Shuttleless looms offer the potential for the reduction of energy con- sumption. Less energy is required to propel the shuttle across the loom. Equivalent amounts of fabric can be produced in a much shorter time on a shuttleless loom than on a shuttle loom.
Knitting. Unlike woven fabrics which are interlaced, knit fabrics are a series of interconnected loops. Warp and weft knitting are the most frequently used knitting processes. In warp knitting, yarn is fed into the knitting needles directly from a warp beam. In weft knitting, yams are fed from individual packages. Warp knitting is performed on flat bed machines while weft knitting is performed on circular machines. Unlike yarns for warp knitting (which are prepared very similarly to warp yarns in weaving), yarns for weft knitting can go directly from the winding machine to the knitting machine.
Greige textile mills are the most electricity-intensive mills. The woven and knit fabrics industry (Table 3 j represenis approximaieiy 53 percent of the total electricity consumption in the entire U.S. textile industry group. Knitting, however, is not as energy intensive as weaving. Energy use in weaving (including warping and slashing) ranges from 2,796 Btu/lb to 19,678 Btu/lb, with the average being 8,615
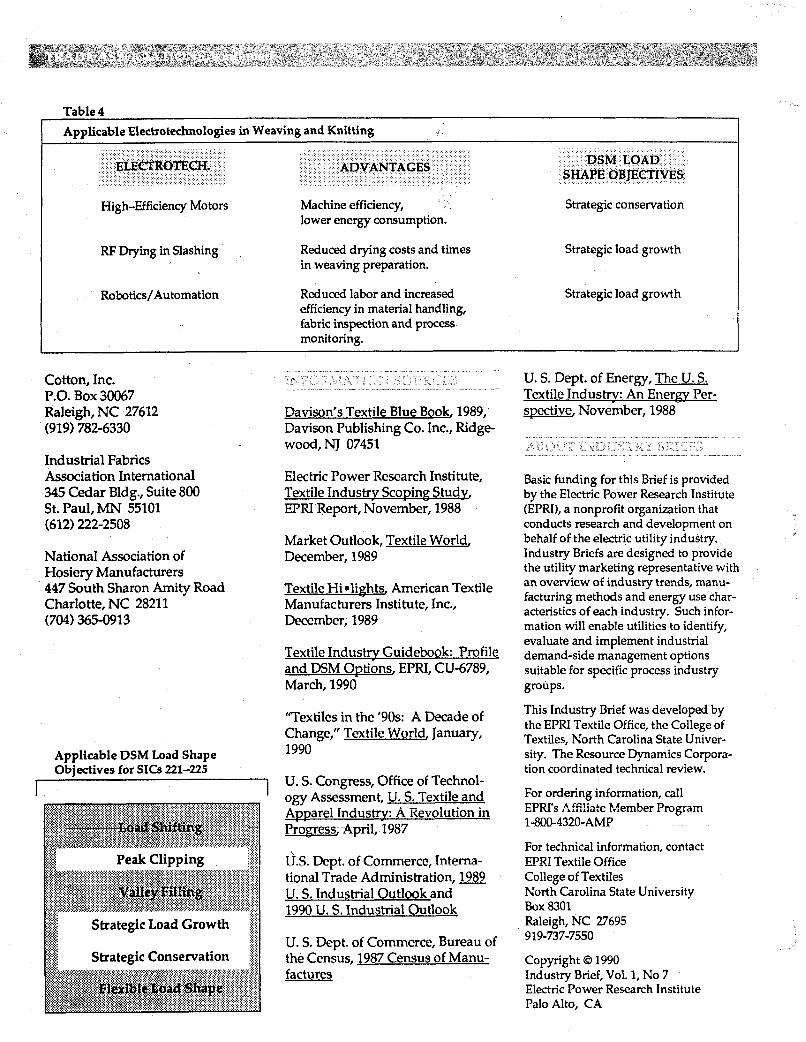
Applicable Electrotechnologies in Weaving and Knitting
ELECTROTECH.
High-Efficiency Motors
RF Drying in Slashing
Robotics/ Automation
ADVANTAGES
Machine efficiency, ’ lower energy consumption.
Reduced drying costs and times in weaving preparation.
Reduced labor and increased efficiency in material handling, fabric inspection and process monitoring.
Strategic conservation
Strategic load growth
Strategic load growth
Cotton, Inc. P.O. Box 30067 Raleigh, NC 27612 (919) 782-6330
Industrial Fabrics Association International 345 Cedar Bldg., Suite 800 St. Paul, MN 55101 (612) 222-2508
National Association of Hosiery Manufacturers 447 South Sharon Amity Road Charlotte, NC 2821 1 (704) 365-0913
Davison’s Textile Blue Book, 1989, Davison Publishing Co. Inc., Ridge- wood,NJ 07451
Electric Power Research Institute, Textile Industrv Scoping Study, EPRI Report, November, 1988
Market Outlook, Textile World, December, 1989
Textile Himlights, American Textile Manufacturers Institute, Inc., December, 1989
Applicable DSM Load Shape Objectives for SICS 221-225 z
,:.:.:.: $$$I Peak Clipping x.:.:., fjg .... 2..
Strategic Load Growth
Strategic Conservation
Textile Industrv Guidebook: Profile and DSM Options, EPRI, CU-6789, March, 1990
“Textiles in the ‘90s: A Decade of Change,” Textile World, January, 1990
U. S. Congress, Office of Technol- ogy Assessment, U. S. Textile and Apparel Industrv: A Revoiution in Propress, April, 1987
U.S. Dept. of Commerce; Interna- tional Trade Administration, 1989 U. S. Industrial Outlook and 1990 U. S. Industrial Outlook
U. S. Dept. of Commerce, Bureau of the Census, 1987 Census of Manu- factures
U. S. Dept. of Energy, The U. S. Textile Industrv: An Enerm Per- spective, November, 1988
Basic funding for this Brief is provided by the Electric Power Research Institute (EPRI), a nonprofit organization that conducts research and development on behalf of the electric utility industry. Industry Briefs are designed to provide the utility marketing representative with an overview of industry trends, manu- facturing methods and energy use char- acteristics of each industry. Such infor- mation will enable utilities to identify, evaluate and implement industrial demand-side management options suitable for specific process industry groups.
This Industry Brief was developed by the EPRI Textile Office, the College of Textiles, North Carolina State Univer- sity. The Resource Dynamics Corpora- tion coordinated technical review.
For ordering information, call EPR!’s Affi!iate Menber Pngiam 1-800-4320-AMP
For technical information, contact EPRI Textile Office College of Textiles North Carolina State University Box 8301 Raleigh, NC 27695 919-737-7550
Copyright 0 1990 Industry Brief, Vol. I, No 7 Electric Power Research Institute Palo Alto, CA