Embed Size (px)
Citation preview

ISSN 1750-4171
DEPARTMENT OF ECONOMICS
DISCUSSION PAPER SERIES
Health Insurance Competition in Germany – The Role of Advertising
Bettina Becker and Silke Uebelmesser
WP 2010 - 05
Dept Economics Loughborough University Loughborough LE11 3TU United Kingdom Tel: + 44 (0) 1509 222701 Fax: + 44 (0) 1509 223910 http://www.lboro.ac.uk/departments/ec
1
Health Insurance Competition in Germany
− the Role of Advertising####
Bettina Beckera
Loughborough University
Silke Uebelmesserb
CES, University of Munich, CESifo
March 2010
Abstract
In the 1990s, competition among health insurance funds (‘sickness funds’) was introduced in Germany. As one means of competition, free choice of initial health funds and subsequent switching between them was made available to all insured. Since then, the number of funds has decreased substantially, and funds have had to engage in competitive strategies to remain in the market. In this paper, we want to analyse the funds’ advertising activities in the face of the changed competitive environment. This has not been possible to date due to a lack of data. We use two new datasets to get a first insight into the potential effects of competition on funds’ advertising strategies; one of the volume and cost of advertisements and one of their contents. Our results suggest that competition has been associated with an increase in the amount of advertising. As to the adverts themselves, we find that there was a decrease in the share of advertisements of a ‘general’ content in favour of advertisements of a more ‘fund-specific’ content. The data therefore indicate that once the market was open to switching of funds by the insured, funds’ advertising efforts changed to differentiating their own perceived strengths from those of competitor funds. These observations allow us to draw some tentative conclusions about the relevance of (attempts of) risk selection by health funds via advertisements and about the general success of the pro-competitive legislation.
JEL Classification: I11; I18; G22; M37
Keywords: Regulated competition; health insurance market; risk selection; advertising; Germany
# We would like to thank Mathias Kifmann, Paul Ruud and Jürgen Wasem as well as participants at the European Conference of Health Economics and a seminar at the Universities of Munich and Augsburg for helpful comments and discussion. We would also like to thank Tanja Manhart, Ewa Puchala and Denitza Toteva for excellent research assistance. a Bettina Becker, Department of Economics, Loughborough University, Loughborough, LE11 3TU, UK, Tel.: +44 (0)1509 222719, Fax: +44 (0)1509 223910, Email: [email protected]. b Silke Uebelmesser (corresponding author), CES, University of Munich, Schackstrasse 4, 80539 Munich, Tel.: +49 (89) 2180-5020, Fax: +49 (89) 397 303, Email: [email protected].
2
1. Introduction
The demographic evolution, in particular rising life-expectancies, as well as the technological
progress in the health sector are largely seen as the main causes of the increase in health
expenditures during the last decades. As a reaction to these developments, a number of pro-
competition reforms were introduced in the German health sector in the 1990s to increase
cost-efficiency and thus alleviate the financial pressure on the health system.1 For the public
health insurance funds (‘sickness funds’), major changes followed from the Health Care
Structure Act (Gesundheitsstrukturgesetz) passed in 1992, which extended free choice of
health fund to everyone from 1996 onwards, while free choice had previously been restricted
to only a small group of insured. Since the passing of this law, the number of health funds has
decreased substantially, and funds have had to engage in competitive strategies to remain in
the market. One such strategy is advertising.2
In a regulated competitive market such as the German health sector, advertising may also be
used by the funds as one means of indirect risk selection: Instead of reducing costs through
increasing efficiency, funds may opt to reduce costs through selective enrolment or ‘cream-
skimming’ of low-risk individuals. As Van de Ven and Van Vliet (1992, 42) point out,
“solving the problem of cream-skimming is a necessary condition for a successful
implementation of a wide range of market oriented strategies in health care, which are being
discussed these days in so many countries”. While direct risk selection in Germany is
prohibited by law, there is anecdotal evidence that health insurance funds engage in indirect
risk selection. Advertising in the German health insurance market may therefore have two
faces: First, to simply remain in the market, and second, to increase the share of low-risk
members.
In this paper, we analyse the funds’ advertising activities in the changed competitive
environment. This has not been possible to date due to a lack of data. We use two new
datasets to get a first insight into the potential effects of these changes, one of the volume and
cost of all advertisements placed by the main German health funds in all German newspapers
and magazines, and one of the contents of the advertisements placed in the most advertising-
intensive magazine Stern.
Our results suggest that competition has been associated with an increase in the amount of
advertising by German health insurance funds. In addition, we find that the introduction of
1 For a discussion of the different reforms, see, e.g., Busse and Riesberg (2004). 2 Advertising strategies have been analysed in other contexts, e.g. financial markets (e.g. Cronqvist, 2005; Jain and Wu, 2000; Mullainathan and Shleifer, 2005) and the pharmaceutical industry (e.g. Avery et al., 2008, for a
3
competition has been associated with a decrease in the share of advertisements of a ‘general’
content in favour of advertisements of a more ‘fund-specific’ content. The data therefore
indicate that once the market was open to switching of funds by the insured, funds’
advertising efforts changed to differentiating their own perceived strengths from those of
competitor funds.
In this paper, we analyse this not yet studied but relevant topic by way of using the new
datasets to examine the associations in the data from which we elicit and discuss the research
questions that we subject to econometric scrutiny in our current research (Becker and
Uebelmesser, 2010, and Becker, Hole and Uebelmesser, 2010). The paper is structured as
follows. Section 2 provides some background information about the German health funds
sector. Section 3 presents the quantitative and qualitative data and examines the associations
between the introduction of the competitive measures and the advertising activities. Section 4
evaluates the potential of risk selection by health funds in Germany and relates this to the
observed advertising activities. Section 5 concludes.
2. Institutional background
Regulation of health insurance in Germany dates back to 1883 when the first Health Insurance
Act was implemented. In 2007, about 88% of the German population were insured with a so-
called ‘public’ health insurance fund with contribution rates related to wage income but not to
individual risk. These insured include mostly employees, students, pensioners, unemployed
and those not insured on their own but as a family member, for example children.3,4
Initially, not everyone was eligible to join all health insurance funds. By the end of the 1980s,
only about 60% of the insured had some choice (Buchner and Wasem, 2003). In general,
everyone had access to the regional, or basic, funds (Allgemeine Ortskrankenkasse AOK).
However, employees whose employing company or guild had founded a fund were confined
to joining this company fund (Betriebskrankenkasse BKK) or guild fund
(Innungskrankenkasse IKK). The so-called substitute funds were available for blue-collar
study on direct-to-consumer advertising, and more generally Scherer, 2000; Schweitzer, 2007), but not yet in the context of health insurance markets. 3 Of those who are not insured with a ‘public’ health insurance fund, 80% are insured with a private insurance. These are mostly the self-employed, civil servants, and employees with an income above a threshold level (€ 48.600 in 2009). In contrast to public funds, the private funds’ premia are related to individual risks but not to wage income. In this paper, we consider public health insurance funds only. 4 In legal terms, there is a distinction between contributing members and so-called family members, i.e. those not insured in their own right but through an insured member of the family. In addition, contributing members can be obligatory or voluntary members depending on whether their wage income falls short or exceeds the threshold level which allows them to choose a private fund (cf. Footnote 3). We refer here to the different groups together as insured or members.
4
workers (Ersatzkasse für Arbeiter EAR) as well as for white-collar workers (Ersatzkasse für
Angestellte EAN), where ‘substitute’ refers to the fact that membership of these funds was a
substitute for membership of the AOK, BKK and IKK.
The regional insurance funds faced higher average risk portfolios compared with the BKK,
IKK and the substitute funds as the share of low-income insured, for example social aid
recipients, unemployed and pensioners, was relatively high. 5 As the higher cost, which
followed, required the regional funds to charge higher contribution rates, the risk structure as
well as the contribution rates differed widely across funds. Furthermore, many of their insured
had little or no possibility to switch to a fund with a lower contribution rate.
This inequality was considered ‘unfair’, and as a consequence, the German health sector saw
a number of pro-competition reform measures in the 1990s. Beside increasing (cost-)
efficiency, the reforms were intended to remedy the unequal eligibility of different groups of
insured to switch their health funds. The Health Care Structure Act passed in December 1992
marked a major step in that direction. From 1996 onwards, every insured was to have free
choice between all open health insurance funds on a yearly basis. Up to 2001, switching funds
was possible on an annual basis at the end of each calendar year, while since 2002 switching
has been facilitated by allowing for changes on a monthly basis subject to a two-months
notice period. However, once a fund is changed, further changes within the following 18
months are permitted only if the insurance fund increases the contribution rate.
In order to promote ‘fair’ competition, the Health Care Structure Act subjected funds to ‘open
enrolment’ (Kontrahierungszwang), which requires them to insure every applicant, and to
‘community rating’ (Diskriminierungsverbot), which prevents them from charging different
premia for different risk types. In addition, 95% of the benefits packages are equalised
between health insurance funds, as determined by the Social-Code-Book V (Buchner and
Wasem, 2003).6
In order to prevent the selection of low risks, or ‘cream-skimming’, which is prohibited by
law, the ‘Risk Equalisation Scheme’ (Risikostrukturausgleich) was implemented in 1994 as
part of the Health Care Structure Act. It was meant to compensate health funds for a relatively
adverse risk portfolio by re-allocating monetary funds between them according to their
relative risk structure. The re-allocation is based on the so-called risk adjusters age, gender,
disability and sickness allowances entitlement. Income is also taken into account as far as this
5 It is a well-documented empirical observation that income and health are positively related (e.g., Ettner, 1996). 6 Only since 2004 has it been possible for health funds to offer bonus programmes to their insured. Limiting our analysis to the period 1990 to 2003 enables us to analyse the effect of increased competition on advertising within an otherwise rather stable environment.
5
affects the revenues rather than the costs of the health insurance funds. It is, however, only
equalised to 92% across funds. The idea here was that different contribution rates should then
reflect only differences in cost efficiency for a standardised risk structure of the insured
(Buchner and Wasem, 2003). The Risk Equalisation Scheme was reformed when the
enrolment in disease management programmes was introduced as a further risk adjuster and
when a risk pool was established in order to better share the financial risks related to high-risk
individuals.7 From 2009 onwards, the Risk Equalisation Scheme has also included morbidity
as laid down in the Health Insurance Competition Strengthening Act (GKV-
Wettbewerbsstärkungsgesetz) of 2007.
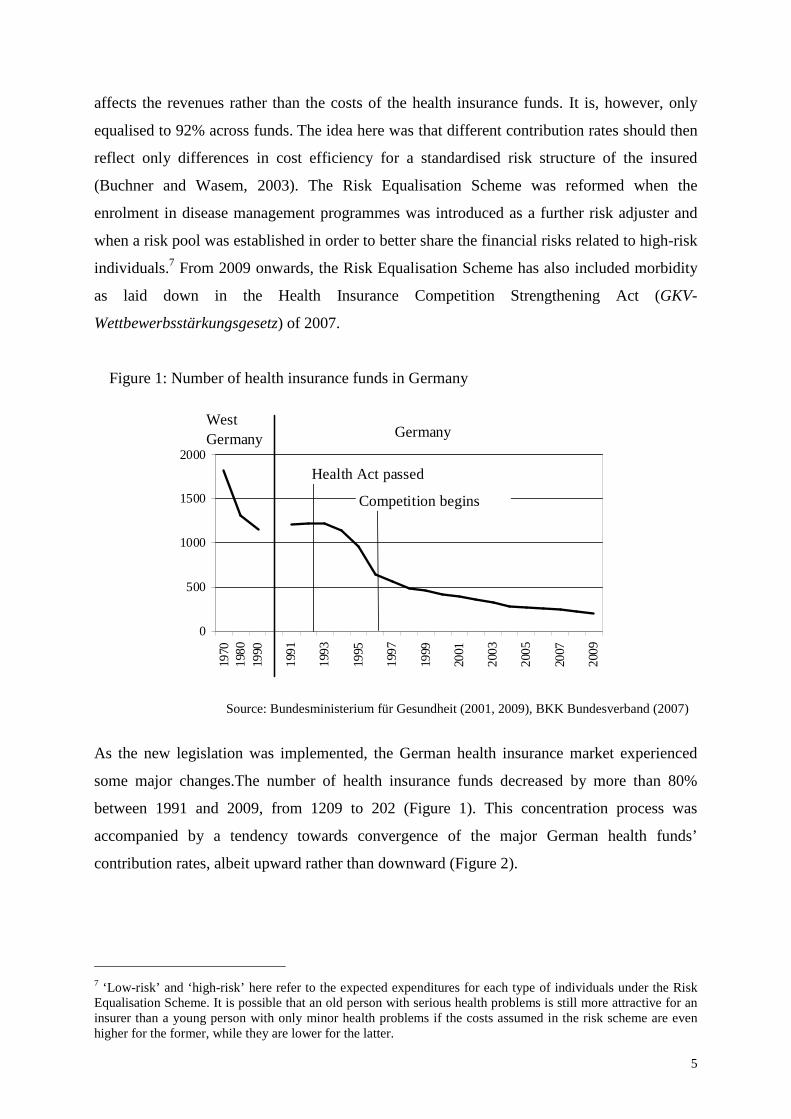
Figure 1: Number of health insurance funds in Germany
0
500
1000
1500
2000
1970
1980
1990
1991
1993
1995
1997
1999
2001
2003
2005
2007
2009
GermanyWest Germany
Health Act passed
Competition begins
Source: Bundesministerium für Gesundheit (2001, 2009), BKK Bundesverband (2007)
As the new legislation was implemented, the German health insurance market experienced
some major changes.The number of health insurance funds decreased by more than 80%
between 1991 and 2009, from 1209 to 202 (Figure 1). This concentration process was
accompanied by a tendency towards convergence of the major German health funds’
contribution rates, albeit upward rather than downward (Figure 2).
7 ‘Low-risk’ and ‘high-risk’ here refer to the expected expenditures for each type of individuals under the Risk Equalisation Scheme. It is possible that an old person with serious health problems is still more attractive for an insurer than a young person with only minor health problems if the costs assumed in the risk scheme are even higher for the former, while they are lower for the latter.
6
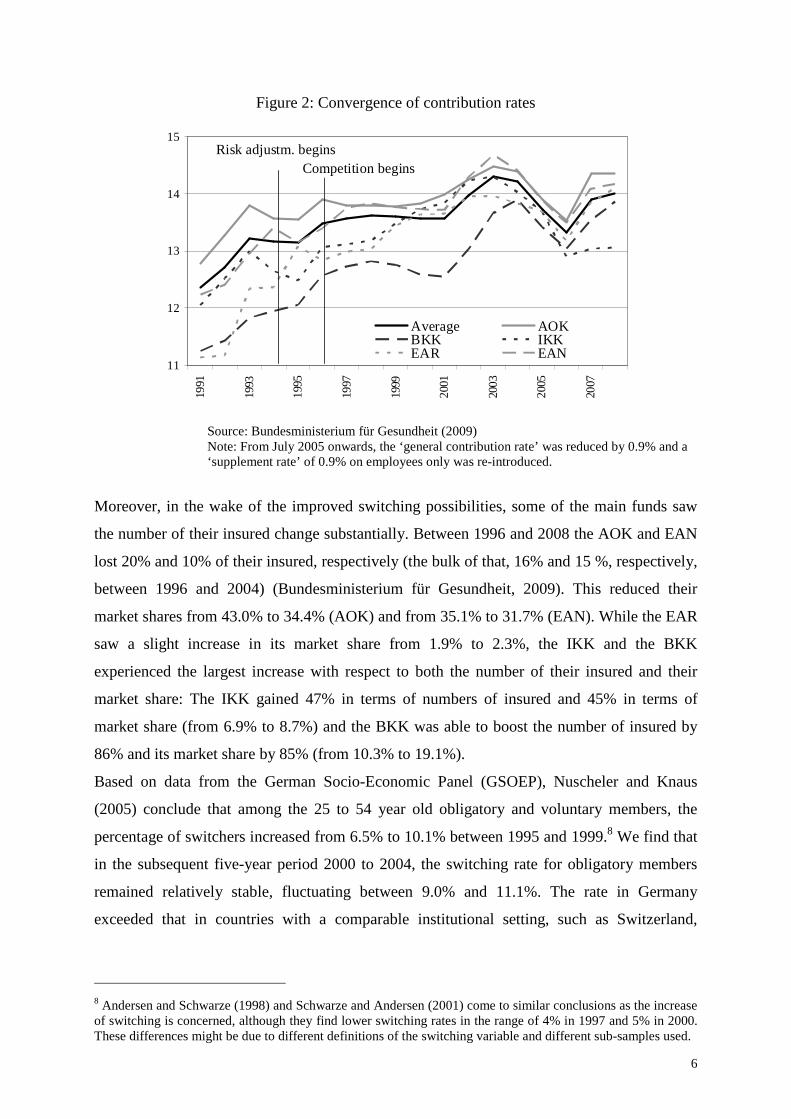
Figure 2: Convergence of contribution rates
11
12
13
14
15
1991
1993
1995
1997
1999
2001
2003
2005
2007
Average AOKBKK IKKEAR EAN
Risk adjustm. beginsCompetition begins
Source: Bundesministerium für Gesundheit (2009)
Note: From July 2005 onwards, the ‘general contribution rate’ was reduced by 0.9% and a ‘supplement rate’ of 0.9% on employees only was re-introduced.
Moreover, in the wake of the improved switching possibilities, some of the main funds saw
the number of their insured change substantially. Between 1996 and 2008 the AOK and EAN
lost 20% and 10% of their insured, respectively (the bulk of that, 16% and 15 %, respectively,
between 1996 and 2004) (Bundesministerium für Gesundheit, 2009). This reduced their
market shares from 43.0% to 34.4% (AOK) and from 35.1% to 31.7% (EAN). While the EAR
saw a slight increase in its market share from 1.9% to 2.3%, the IKK and the BKK
experienced the largest increase with respect to both the number of their insured and their
market share: The IKK gained 47% in terms of numbers of insured and 45% in terms of
market share (from 6.9% to 8.7%) and the BKK was able to boost the number of insured by
86% and its market share by 85% (from 10.3% to 19.1%).
Based on data from the German Socio-Economic Panel (GSOEP), Nuscheler and Knaus
(2005) conclude that among the 25 to 54 year old obligatory and voluntary members, the
percentage of switchers increased from 6.5% to 10.1% between 1995 and 1999.8 We find that
in the subsequent five-year period 2000 to 2004, the switching rate for obligatory members
remained relatively stable, fluctuating between 9.0% and 11.1%. The rate in Germany
exceeded that in countries with a comparable institutional setting, such as Switzerland,
8 Andersen and Schwarze (1998) and Schwarze and Andersen (2001) come to similar conclusions as the increase of switching is concerned, although they find lower switching rates in the range of 4% in 1997 and 5% in 2000. These differences might be due to different definitions of the switching variable and different sub-samples used.
7
Belgium, Israel and the Netherlands (Laske-Aldershof et al., 2004). In addition, of course, the
effect of the threat of switching should not be underestimated.9
3. Advertising by German health insurance funds
In order to gain a first insight into the impact of the changes in the competitive market
structure on the advertising activities of the health insurance funds, we analyse a new dataset
of advertisements placed by the main German funds over the period 1990 to 2003, provided
by Nielsen Media Research (2005), and complement this with data on advertising contents we
collected from the most advertising-intensive magazine Stern for the period 1992 to 2003.
a) Data on the number and costs of advertisements
We have obtained the data on the number of advertisements placed in newspapers and
magazines by the main German health insurance funds, i.e. the federal associations of the
AOK and BKK as well as the large individual funds Barmer, TK, and DAK (all belonging to
the group of substitute funds), along with the data on the costs of these adverts, from Nielsen
Media Research (2005), a company specialised in the collection of data on advertising.
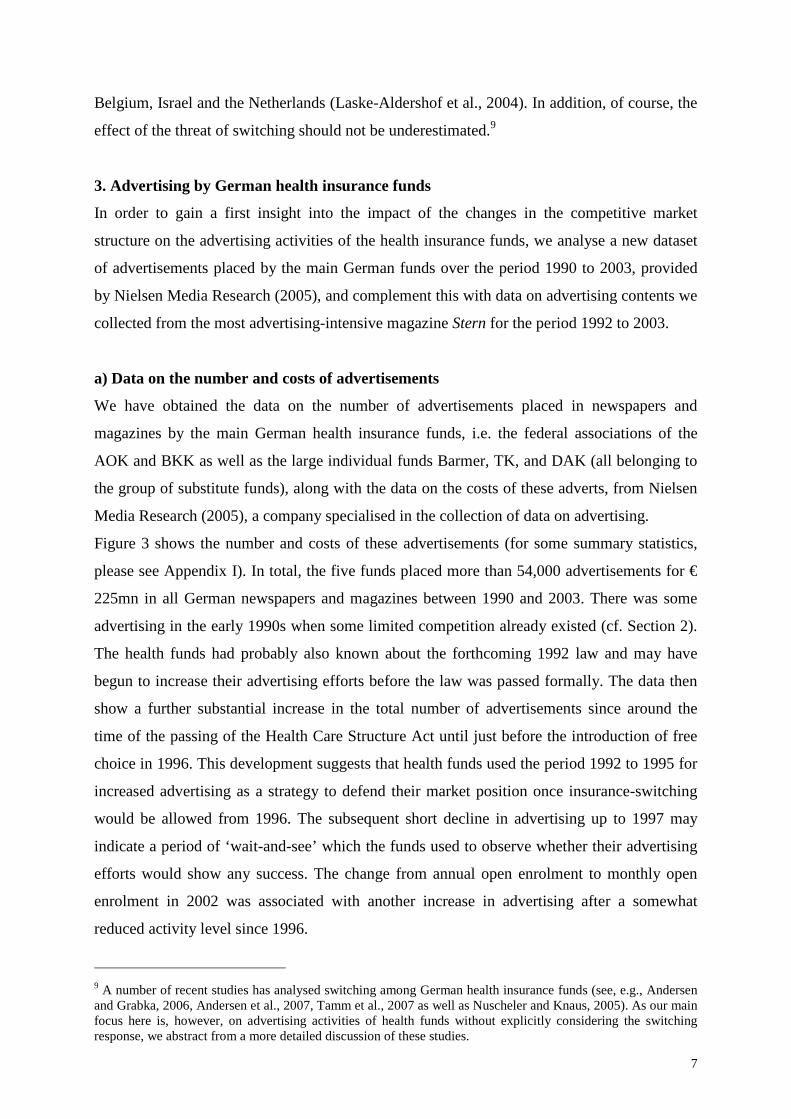
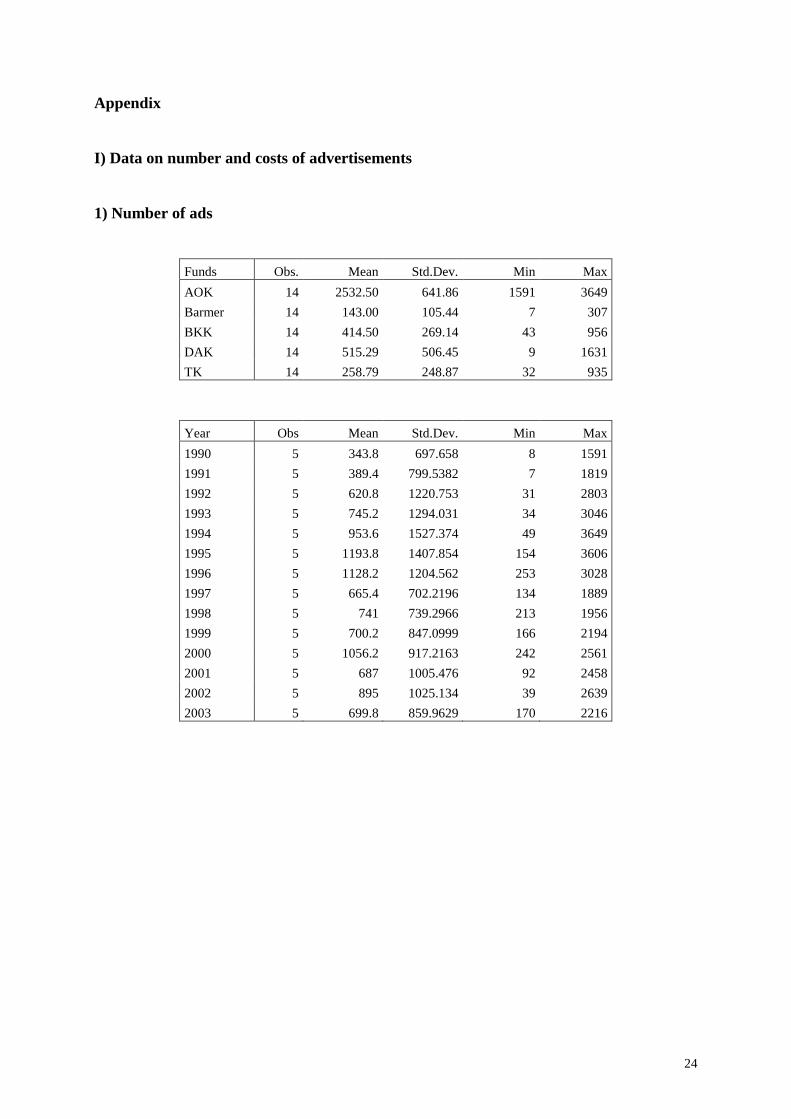
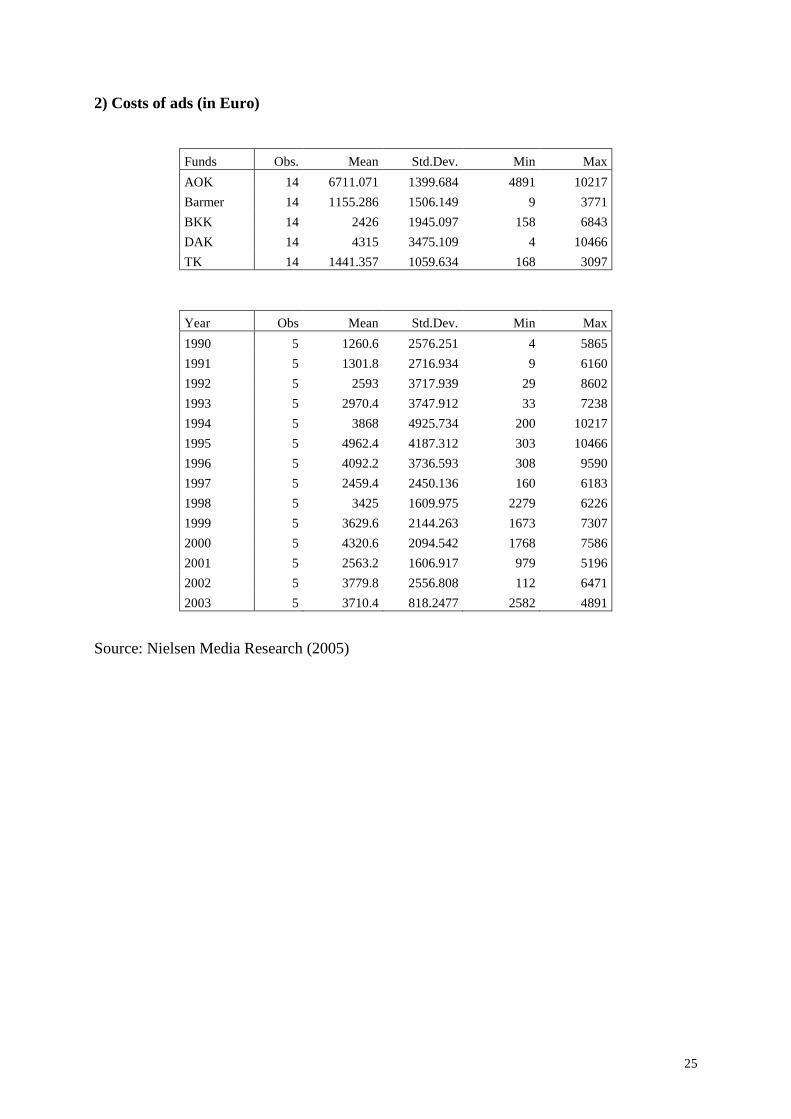
Figure 3 shows the number and costs of these advertisements (for some summary statistics,
please see Appendix I). In total, the five funds placed more than 54,000 advertisements for €
225mn in all German newspapers and magazines between 1990 and 2003. There was some
advertising in the early 1990s when some limited competition already existed (cf. Section 2).
The health funds had probably also known about the forthcoming 1992 law and may have
begun to increase their advertising efforts before the law was passed formally. The data then
show a further substantial increase in the total number of advertisements since around the
time of the passing of the Health Care Structure Act until just before the introduction of free
choice in 1996. This development suggests that health funds used the period 1992 to 1995 for
increased advertising as a strategy to defend their market position once insurance-switching
would be allowed from 1996. The subsequent short decline in advertising up to 1997 may
indicate a period of ‘wait-and-see’ which the funds used to observe whether their advertising
efforts would show any success. The change from annual open enrolment to monthly open
enrolment in 2002 was associated with another increase in advertising after a somewhat
reduced activity level since 1996.
9 A number of recent studies has analysed switching among German health insurance funds (see, e.g., Andersen and Grabka, 2006, Andersen et al., 2007, Tamm et al., 2007 as well as Nuscheler and Knaus, 2005). As our main focus here is, however, on advertising activities of health funds without explicitly considering the switching response, we abstract from a more detailed discussion of these studies.
8
The breakdown by health insurance funds conveys further interesting insights. From 1990 to
1994, the AOK and DAK were by far the most advertising-active health insurance funds.
With free choice becoming available to all, the BKK funds also began to advertise much more
actively, and since then BKK advertisements made up an important part of total
advertisements over the sample period. The DAK also continued its high advertising activities
whereas the AOK reduced the number of advertisements somewhat. The TK and Barmer
advertised considerably more since 1995 and 1998, respectively, than before.
Figure 3: Volume of advertisements in newspapers and magazines (1990 to 2003):
Main German health insurance funds
0
5001000
150020002500
3000
35004000
19
90
19
91
19
92
19
93
19
94
19
95
19
96
19
97
19
98
19
99
20
00
20
01
20
02
20
03 0
1000
2000
3000
4000
5000
6000
7000 AOK
Barmer
BKK
DAK
TK
Numbers
Total (right axis)
Numbers
0
2000
4000
6000
8000
10000
12000
1990
1991
1992
1993
1994
1995
1996
1997
1998
1999
2000
2001
2002
2003
0
5000
10000
15000
20000
25000
30000AOK
Barmer
BKK
DAK
TK
In 1000 Euro
Total (right axis)
In 1000 Euro
Source: Nielsen Media Research (2005) (see Appendix I.1 and I.2)
9
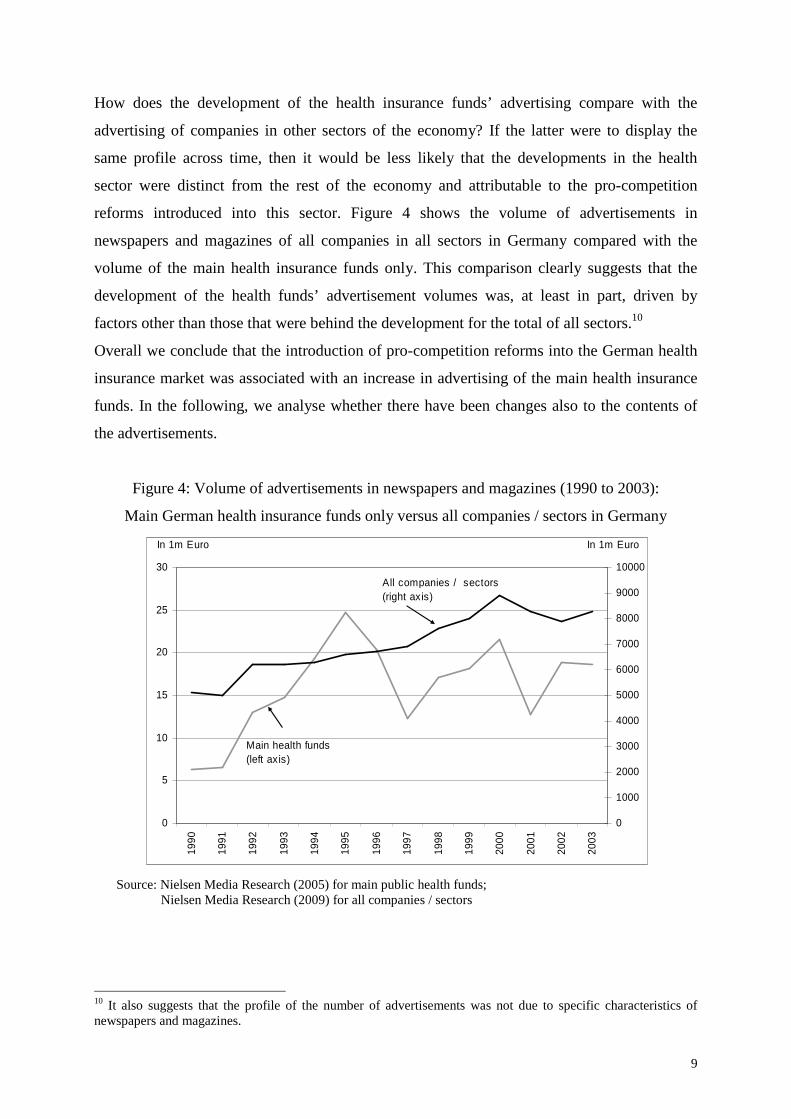
How does the development of the health insurance funds’ advertising compare with the
advertising of companies in other sectors of the economy? If the latter were to display the
same profile across time, then it would be less likely that the developments in the health
sector were distinct from the rest of the economy and attributable to the pro-competition
reforms introduced into this sector. Figure 4 shows the volume of advertisements in
newspapers and magazines of all companies in all sectors in Germany compared with the
volume of the main health insurance funds only. This comparison clearly suggests that the
development of the health funds’ advertisement volumes was, at least in part, driven by
factors other than those that were behind the development for the total of all sectors.10
Overall we conclude that the introduction of pro-competition reforms into the German health
insurance market was associated with an increase in advertising of the main health insurance
funds. In the following, we analyse whether there have been changes also to the contents of
the advertisements.
Figure 4: Volume of advertisements in newspapers and magazines (1990 to 2003):
Main German health insurance funds only versus all companies / sectors in Germany
0
5
10
15
20
25
30
1990
1991
1992
1993
1994
1995
1996
1997
1998
1999
2000
2001
2002
2003
0
1000
2000
3000
4000
5000
6000
7000
8000
9000
10000
All companies / sectors (right axis)
Main health funds(left axis)
In 1m Euro In 1m Euro
Source: Nielsen Media Research (2005) for main public health funds; Nielsen Media Research (2009) for all companies / sectors
10 It also suggests that the profile of the number of advertisements was not due to specific characteristics of newspapers and magazines.
10
b) Data on the contents of advertisements
We briefly discuss some data from the German Socio-Economic Panel (GSOEP) and findings
from a recent survey (Braun et al., 2006), which allow us to draw some conclusions about
which factors are most relevant for individuals’ decisions of whether or not to switch health
funds. We will then examine to which extent these factors are reflected in the contents of
Stern’s advertisements.
b1) Survey information about switching intentions
Participants in the GSOEP from 1997 were asked about the motives which guided their
switching decisions, i.e. whether they had switched to a different health insurance fund in the
past year and whether they intended to switch in the future. Even though these detailed
questions were only included in the survey of 1997, they are still interesting for our purposes
as they provide some suggestive evidence of the very early impact of the reforms.
For the individuals who changed their health insurance fund in 1996, the contribution rate was
the most important motive, featuring in 42% of the responses, followed by the benefits and
services offered (21% and 16%, respectively). The image of the fund affected the choice of
15% of respondents. The criteria that would be most relevant for a further switch were again
the contribution rate (69%), followed by benefits (54%) and services (31%). The image of the
fund would be important for only 7%.
For advertising purposes, the reasons why individuals do not intend to switch also are of
interest, not least because non-switchers present by far the majority of the insured. 77% of
respondents were generally satisfied with their present fund. More relevant in the context of
our analysis, 15% of respondents found that the differences between the various funds were
not explicit enough to warrant switching.
A more recent survey helps to gain further insights into possible barriers to switching which
are relevant almost ten years after the introduction of free choice of fund (Braun et al., 2006).
Once again, it turns out that most insured were satisfied with their health fund. In addition, the
insured very often underestimated the saving potential of switching to a cheaper fund and
wrongly assumed important legal drawbacks as a consequence of switching. 23% of the
respondents did not see any difference between the various health insurance funds. For 64%,
however, funds appeared to differ with respect to the general ‘goodwill’, while 45% perceived
differences in the contribution rates and 36% in the benefits and services offered.
Hence the contribution rate as well as the benefits and services offered seem to be an
important criterion for switchers and non-switchers alike. This could be seen as suggesting
11
that advertisements which tend to focus on fund-specific information are likely to receive
relatively more attention by potential switchers. The observation that about every fifth person
does not see any significant difference between the health funds could encourage funds (even
further) to stress specific characteristics, as perceived differences and the intention to switch
health funds are positively correlated (Braun et al., 2006). Another way of achieving such a
differentiation, not strictly related to fact-based information, could be to create a fund-specific
image. Even though the image does not seem to be very essential for individuals who are
considering a future switch, 15% of those who did change their fund in 1996 retrospectively
admitted that the image had played a role in their decision. A careful analysis of the contents
is thus required to evaluate whether funds seem to choose strategies as suggested by the
observations here.
b2) Contents of the advertisements in Stern
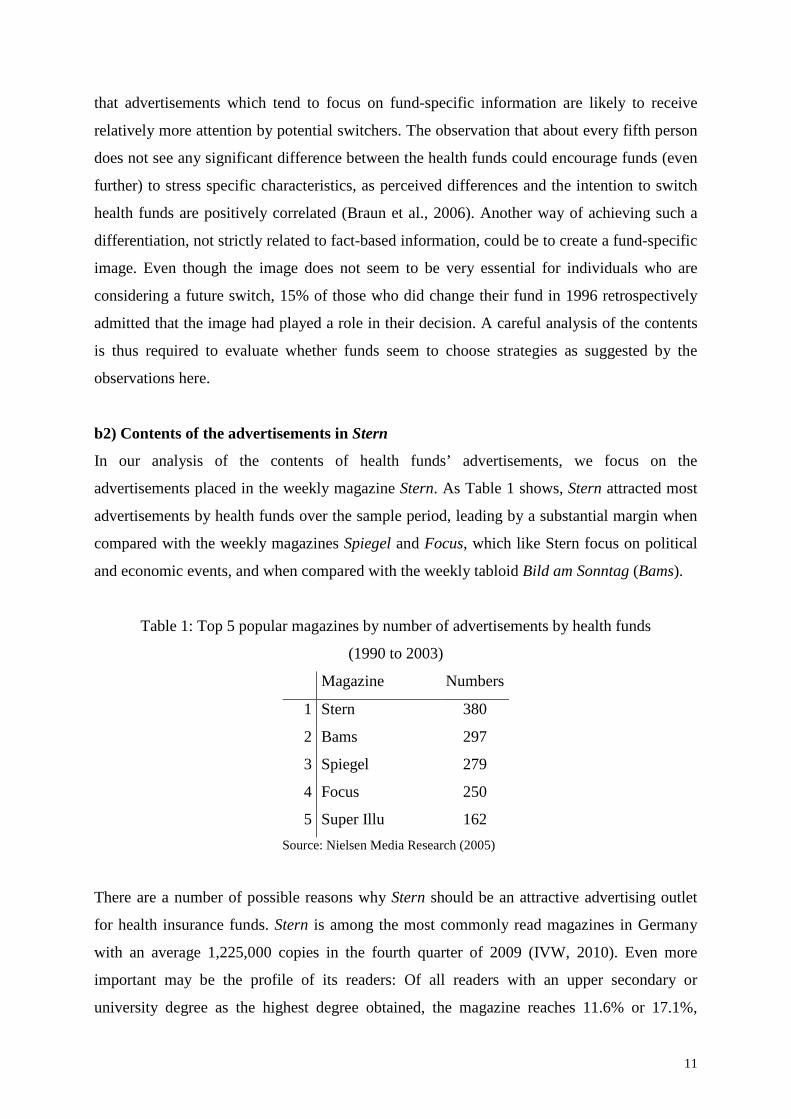
In our analysis of the contents of health funds’ advertisements, we focus on the
advertisements placed in the weekly magazine Stern. As Table 1 shows, Stern attracted most
advertisements by health funds over the sample period, leading by a substantial margin when
compared with the weekly magazines Spiegel and Focus, which like Stern focus on political
and economic events, and when compared with the weekly tabloid Bild am Sonntag (Bams).
Table 1: Top 5 popular magazines by number of advertisements by health funds
(1990 to 2003)
Magazine Numbers
1 Stern 380
2 Bams 297
3 Spiegel 279
4 Focus 250
5 Super Illu 162
Source: Nielsen Media Research (2005)
There are a number of possible reasons why Stern should be an attractive advertising outlet
for health insurance funds. Stern is among the most commonly read magazines in Germany
with an average 1,225,000 copies in the fourth quarter of 2009 (IVW, 2010). Even more
important may be the profile of its readers: Of all readers with an upper secondary or
university degree as the highest degree obtained, the magazine reaches 11.6% or 17.1%,

12
respectively, as Table 2 shows. The readers comprise more than 40% of those with a monthly
net income of above €1500 and a smaller but still relevant share of those with a net income of
€1250 to1500. Furthermore, the share of readers between 30 and 59 years of age amounts to
between 17.9% and 21.8% and is slightly higher than for the younger or older age groups.
While the readership is thus not representative for the insured population, it can be argued that
it is most interesting for health insurance funds. Among the three groups of characteristics
provided in Table 2, education, income and age, the relatively high educational level of Stern
readers makes this magazine particular attractive: Education is likely to be positively
correlated with health status and in contrast to age and income it is not part of the Risk
Equalisation Scheme (see Section 2).
Table 2: Structure of readers
Stern
Upper secondary degree (no university degree) 11.6% (3)
University degree 17.1% (4)
Indiv. net income between €1250 and €1500 14.0% (5)
Indiv. net income ≥ € 1500 41.8% (3)
Age group 20 to 29 13.2% (6)
Age group 30 to 39 17.9% (6)
Age group 40 to 49 21.8% (4)
Age group 50 to 59 17.2% (5)
Age group 60 to 69 14.1% (6)
Source: Burda Advertising Center – Presse I (2008) (In parenthesis: ranking for the respective characteristics among all 176 German magazines)
Out of the 347 advertisements by the main German health insurance funds placed in Stern,
which are in the dataset from Nielsen Media Research, we have identified 323 (93%), so that
our sample appears to be fairly representative of the population of all Stern advertisements
(see Appendix II.5 for more details).11 These manually collected advertisements provide a
unique opportunity to analyse any potential change of advertising strategies in response to the
changed institutional environment, which cannot be captured by a mere look at the
quantitative data.
11 We can only speculate why we did not manage to find the remaining 24 advertisements. One reason might be that they are of rather small size.
13
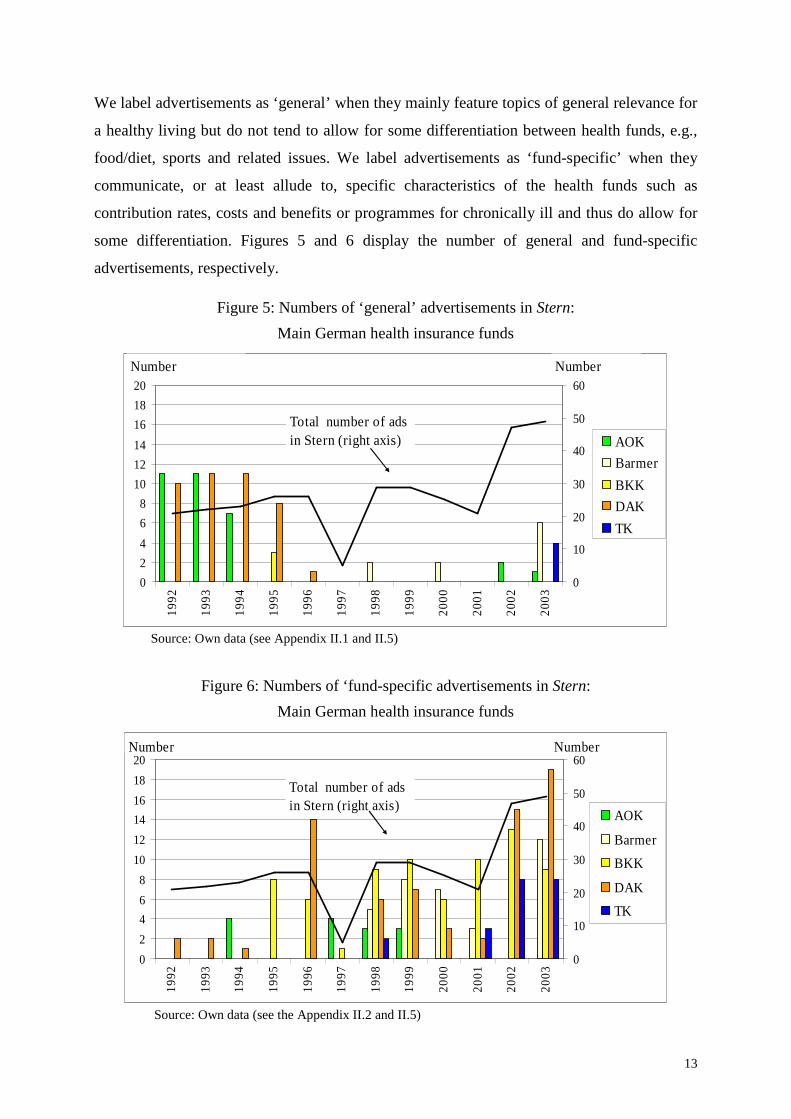
We label advertisements as ‘general’ when they mainly feature topics of general relevance for
a healthy living but do not tend to allow for some differentiation between health funds, e.g.,
food/diet, sports and related issues. We label advertisements as ‘fund-specific’ when they
communicate, or at least allude to, specific characteristics of the health funds such as
contribution rates, costs and benefits or programmes for chronically ill and thus do allow for
some differentiation. Figures 5 and 6 display the number of general and fund-specific
advertisements, respectively.
Figure 5: Numbers of ‘general’ advertisements in Stern:
Main German health insurance funds
0
2
4
6
8
10
12
14
16
18
20
19
92
19
93
19
94
19
95
19
96
19
97
19
98
19
99
20
00
20
01
20
02
20
03 0
10
20
30
40
50
60
AOK
Barmer
BKK
DAK
TK
Total number of ads in Stern (right axis)
Number Number
Source: Own data (see Appendix II.1 and II.5)
Figure 6: Numbers of ‘fund-specific advertisements in Stern:
Main German health insurance funds
0
2
4
6
8
10
12
14
16
18
20
19
92
19
93
19
94
19
95
19
96
19
97
19
98
19
99
20
00
20
01
20
02
20
03 0
10
20
30
40
50
60
AOK
Barmer
BKK
DAK
TK
Total number of ads in Stern (right axis)
Number Number
Source: Own data (see the Appendix II.2 and II.5)
14
The data show that the number of general advertisements was higher before the introduction
of the various reforms whereas the number of fund-specific advertisements was higher
afterwards. As to the funds which were most active we find that general advertisements were
mainly placed by the AOK and DAK, and fund-specific contents were prevalent in the
advertisements by the BKK, Barmer and TK as well as again the DAK. So, the DAK seems to
have maintained its high activity level over the whole period studied while at the same time
adjusting the content to the changed institutional environment in contrast to the other funds.
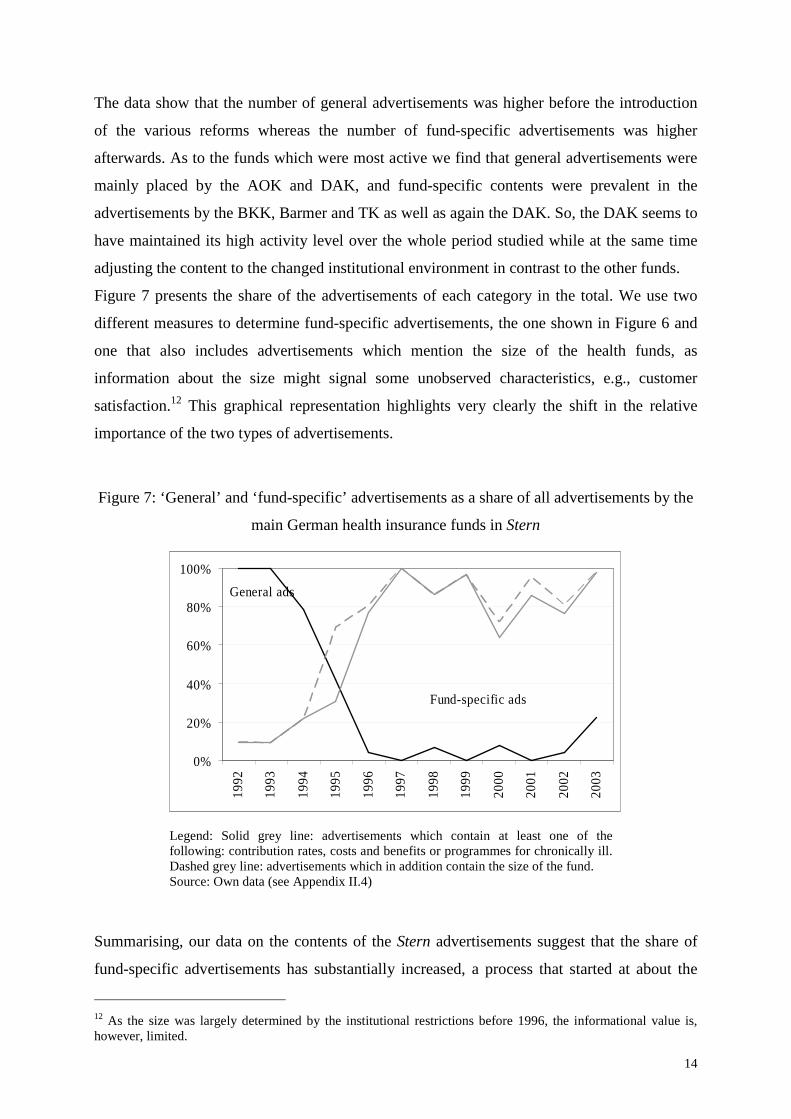
Figure 7 presents the share of the advertisements of each category in the total. We use two
different measures to determine fund-specific advertisements, the one shown in Figure 6 and
one that also includes advertisements which mention the size of the health funds, as
information about the size might signal some unobserved characteristics, e.g., customer
satisfaction.12 This graphical representation highlights very clearly the shift in the relative
importance of the two types of advertisements.
Figure 7: ‘General’ and ‘fund-specific’ advertisements as a share of all advertisements by the
main German health insurance funds in Stern
0%
20%
40%
60%
80%
100%
1992
1993
1994
1995
1996
1997
1998
1999
2000
2001
2002
2003
Fund-specific ads
General ads
Legend: Solid grey line: advertisements which contain at least one of the following: contribution rates, costs and benefits or programmes for chronically ill. Dashed grey line: advertisements which in addition contain the size of the fund. Source: Own data (see Appendix II.4)
Summarising, our data on the contents of the Stern advertisements suggest that the share of
fund-specific advertisements has substantially increased, a process that started at about the
12 As the size was largely determined by the institutional restrictions before 1996, the informational value is, however, limited.
15
same time when competitive measures were introduced into the German health insurance
market, in contrast to general advertisements. Comparison with survey data suggests that the
contents have changed towards the factors that matter most in individuals’ decisions of
whether or not to switch health funds.
4. Risk selection, advertising and competition of health insurance funds
We are now in a position to discuss the results of our analysis in the light of the intended
outcome of the pro-competitive legislation. We are in particular interested in analysing
whether competition among health insurance funds works as intended. Does it lead to more
cost-efficiency, or do funds try to attract good risks, i.e. do they engage in risk selection?13
It is useful to consider the objective function of health insurance funds when they are subject
to regulation such as in the German health market. We conjecture here that the objective of
health funds, being non-profit organisations, is to increase their size in terms of the number of
insured, as one strategy to remain in the market.14 According to a survey of health fund
managers, guaranteeing the continuity of the fund ranks first on their agenda (Haenecke,
2001). Besides, it is common practice that the contracts with the fund management contain
clauses according to which bonuses are related to the growth of the fund (Höppner et al.,
2006) while growth itself is linked to an increase in the reputation of the management.
From the discussion of the institutional framework of the German health market in Section 2,
we know that benefits are largely determined by law and therefore largely equal across funds.
It is often claimed that competition then takes place in terms of the price, i.e. the contribution
rate, rather than in terms of the quality of service (Lauterbach and Wille, 2001; Greß, 2002). 15
A lower price implies a competitive advantage. With perfect risk compensation, a fund would
be the cheaper the more efficiently it operated. With imperfect risk compensation, the risk
13 A related aspect is the question whether health funds, which resort to indirect risk selection, are successful, i.e. whether via their advertising strategy they manage to affect the switching behaviour and through this the risk structure of their insured. See Becker and Uebelmesser (2010) for an econometric analysis of this question, and Becker, Hole and Uebelmesser (2010) for an analysis of the heterogeneity of households’ preferences for individual health funds.
14 Hart (1983) considers the case of firms run by so-called ‘satisficing’ managers who do not value profits per se but gain private benefits from keeping their job by maintaining the firm afloat. This may hold for managers of a non-profit organisation such as the German health insurance funds. In the model by Hart (1983), an increase in competition may then induce otherwise reluctant managers to increase their efforts to reduce costs in order to avoid bankruptcy. Cost reduction via increases in efficiency would be one way for health funds to reduce their contribution rate to attract new members, cost reduction via a lower risk portfolio would be an additional or an alternative way, and possibly a less costly one in terms of effort involved. 15 For empirical analyses that show that the contribution rate is a significant factor of an individual’s probability to switch their fund, see for example Andersen and Schwarze (1998), Schwarze and Andersen (2001), as well as Nuscheler and Knaus (2005) for Germany and Buchmueller and Feldstein (1997) as well as Strombom et. al. (2002) for analyses for the US.
16
structure of the insured becomes important. It is then well possible that funds benefit from
successful risk selection and a favourable risk structure.
Was there any incentive in the German health care market for health insurance funds to
engage in risk selection for the period under consideration? As has been shown by different
studies for Germany (Breyer and Kifmann, 2001; Jacobs et al., 2002; Lauterbach and Wille,
2001), the number of risk adjusters under the current Risk Equalisation Scheme was far from
sufficient to adequately reflect individual risks. For example, as discussed in relation to the
characteristics of the Stern readers in Section 3, the educational level was not part of the Risk
Equalisation Scheme even though education is likely to be positively correlated with the
health status. Buchner and Wasem (2003) also demonstrate that risk compensation was less
than perfect: Low-cost health funds with a less than 100% ratio of actual to standardised
expenditures have grown fast in recent years, while funds with a ratio above 100% have lost
members. Together with open enrolment, these shortcomings of the risk scheme have created
incentives for insurers to engage in risk selection so as to either achieve or maintain a low risk
profile.16,17
There is so far only anecdotal evidence that health funds engage in risk selection (e.g., Van de
Ven et al., 2003; Buchner and Wasem, 2003). Glazer and McGuire (2006) conclude that it is
not possible to evaluate the significance of the problem as there is no reported evidence on its
prevalence. Nuscheler and Knaus (2005) indirectly test for risk selection of BKK funds. They
do not find evidence for risk selection of BKKs when by comparing the health characteristics
of individuals who switch to a BKK to the characteristics of those who switch to a non-
BKK.18 While the authors analyse the possible outcome or output of (successful) risk
selection, we in this paper have the data to focus on a potential instrument of, or input to, risk
selection, namely advertising.
How can these reflections about potential risk selection incentives be related to our analysis of
the advertising activities of health insurance funds? For this, we resort to our content analysis.
We consider first advertisements which focus on ‘general’ topics loosely related to health
issues. By placing advertisements of this type, the funds might aim at providing incentives for
the insured to improve their health status and thus lower the funds’ health expenditures while
16 See Höppner et al. (2006) for an overview of possible risk selection strategies and Van de Ven and Ellis (2000) for a discussion of several welfare-decreasing effects of risk selection. 17 Observing that mainly the young and healthy switch funds is, of course, not proof of risk selection as switching costs might be lower for them (see Cutler and Zeckhauser, 2000; Nuscheler and Knaus, 2005). 18 The analysis is based on the assumptions that non-BKKs do not engage in risk selection and can thus be taken as a benchmark, and that BKKs and non-BKKs are sufficiently homogeneous otherwise.
17
at the same time accepting that an advertisement of general content may also have positive
spill-over effects on members of rival funds. One might, therefore, expect that general
advertisements due to their public-goods character are mainly placed by large health funds
and that the number of these advertisements falls when competition is introduced, if
competition is assumed to reduce the size of individual funds.19 This is indeed what we
observe (cf. Figure 5).
In contrast to general advertisements, the number of fund-specific advertisements has
increased since 1994/1995 (cf. Figure 6). The change in the relative importance of both types
of advertisements as shown in Figure 7 can result from two different strategies.
On the one hand, the traditional theory of advertising postulates that advertisements
communicate objectively useful information (Stigler, 1961 and in particular Nelson, 1970,
1974) which consumers use to rationally update their beliefs before making their choices. As
individuals need information about the main characteristics of the health funds to be able to
make a well-founded switching decision, one would expect that more competition would lead
to an increase of the number of advertisements which convey ‘fundamental’ information
about fund-specific facts, such as the contribution rate of a health fund, as the rational
consumer’s demand for this type of information should increase. If advertisements indeed
contained this information, this would indicate that competition works as intended. It pays for
the funds to compete along the lines stipulated by law in contrast to pursuing risk selection
activities.
On the other hand, an increase of fund-specific advertisements might also follow from an
incentive of the health insurance funds to create a subjective image, which can help in
competing for the insured in two ways (Bagwell, 2008): First, it would allow funds to
artificially differentiate themselves from competitors despite the a-priori homogeneity
imposed on the funds by law, which might justify a mark-up on contribution rates ceteris
paribus relative to competitors. Second, an image that would be appealing particularly to good
risks could then enable the fund to reduce its contribution rate, thus becoming even more
attractive to consumers. If funds followed this behavioural strategy, the introduction of
competition should, similarly to the traditional theory, increase the number of fund-specific
advertisements.20 Competition would then, however, be associated with more risk selection.
19 This line of reasoning could provide another reason why the funds advertised already before the passing of the Health Care Structure Act (cf. Figure 3). 20 Of course, also ‘general’ advertisements might be placed in order to create an image. But as this type of advertisement is no longer very important, we abstract here from further discussing it.
18
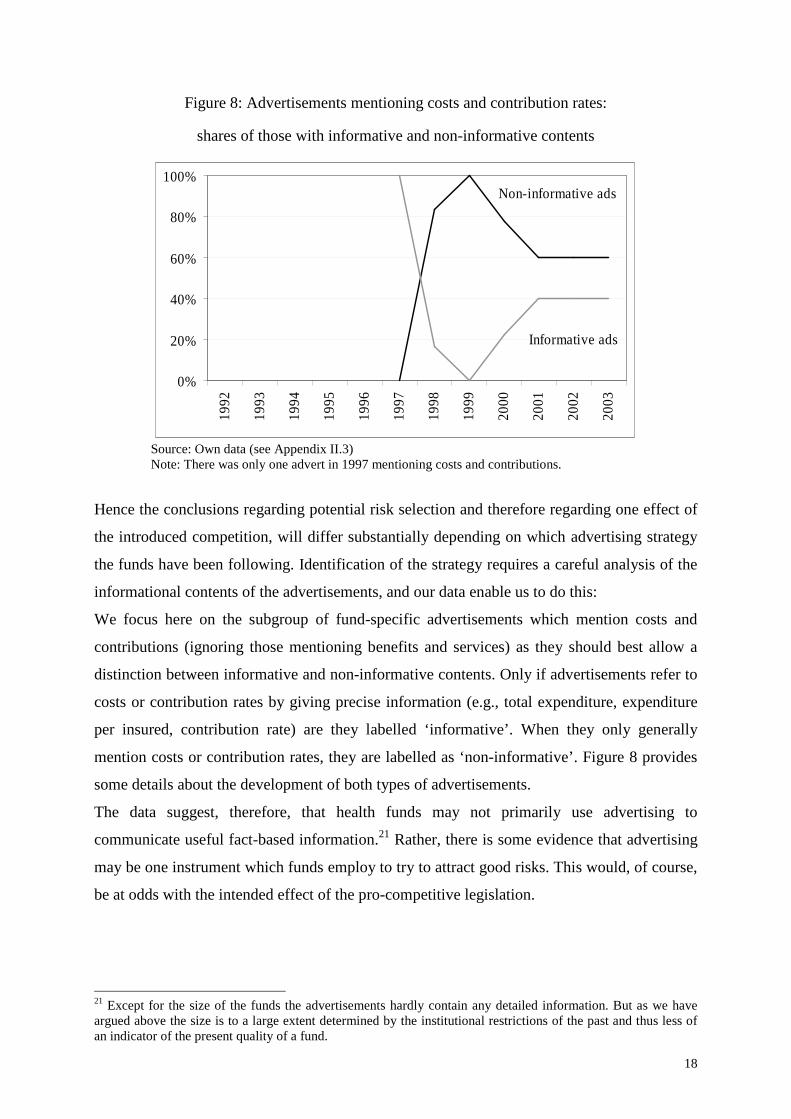
Figure 8: Advertisements mentioning costs and contribution rates:
shares of those with informative and non-informative contents
0%
20%
40%
60%
80%
100%
1992
1993
1994
1995
1996
1997
1998
1999
2000
2001
2002
2003
Non-informative ads
Informative ads
Source: Own data (see Appendix II.3) Note: There was only one advert in 1997 mentioning costs and contributions.
Hence the conclusions regarding potential risk selection and therefore regarding one effect of
the introduced competition, will differ substantially depending on which advertising strategy
the funds have been following. Identification of the strategy requires a careful analysis of the
informational contents of the advertisements, and our data enable us to do this:
We focus here on the subgroup of fund-specific advertisements which mention costs and
contributions (ignoring those mentioning benefits and services) as they should best allow a
distinction between informative and non-informative contents. Only if advertisements refer to
costs or contribution rates by giving precise information (e.g., total expenditure, expenditure
per insured, contribution rate) are they labelled ‘informative’. When they only generally
mention costs or contribution rates, they are labelled as ‘non-informative’. Figure 8 provides
some details about the development of both types of advertisements.
The data suggest, therefore, that health funds may not primarily use advertising to
communicate useful fact-based information.21 Rather, there is some evidence that advertising
may be one instrument which funds employ to try to attract good risks. This would, of course,
be at odds with the intended effect of the pro-competitive legislation.
21 Except for the size of the funds the advertisements hardly contain any detailed information. But as we have argued above the size is to a large extent determined by the institutional restrictions of the past and thus less of an indicator of the present quality of a fund.
19
5. Conclusions
We analyse the associations between the pro-competition measures recently introduced into
the German health sector and the advertising activities of the major health insurance funds.
We use two new datasets in this paper, one of the volume and costs of all advertisements
placed by the main German health insurance funds in all German newspapers and magazines,
and one of the advertisements placed in the most advertising-intensive magazine Stern.
Our results suggest that competition has gone hand-in-hand with an increase in advertising.
Although the amount of fund-specific information in advertisements has increased, we have
seen that even these advertisements are still relatively little informative. In line with this, a
substantial number of survey respondents who did not even consider switching said that they
did not see any significant differences between the various funds. This suggests that it may be
important for health funds to create an insurance-specific image, with which to generate
spurious differentiation and increase consumers’ perception of the fund. This would then
further increase the evidence in favour of the behavioural model of advertising and run
contrary to the goals of the pro-competition reforms. In future research it would be interesting
to see how far our tentative results for Germany may be applied to other countries with a
similar institutional setting.
20
References
Andersen, Hanfried H. and Johannes Schwarze (1998): „GKW‚ 97: Kommt Bewegung in die
Landschaft? Eine empirische Analyse der Kassenwahlentscheidung“, Arbeit und
Sozialpolitik 9/10, 11-23.
Andersen, Hanfried H. and Markus M. Grabka (2006): „Kassenwechsel in der GKV 1997 –
2004: Profile – Trends – Perspektive“, in: Dirk Göpffarth, Stefan Greß, Klaus Jacobs,
Jürgen Wasem (Hrsg.): Jahrbuch Risikostrukturausgleich 2006, Asgard-Verlag: Sankt
Augustin, 145-189.
Andersen, Hanfried H., Markus M. Grabka and Johannes Schwarze (2007): „Premium rates,
competition among health insurance funds and the health care reform 2007“,
Jahrbücher für Nationalökonomie und Statistik 227, 429-450.
Avery, Rosemary J., Donald Kenkel, Dean R. Lillar, Alan Mathios and Hua Wang (2008):
“Health disparities and direct-to-consumer advertising of pharmaceutical products”,
in: Lorens Helmchen, Robert Kaestner, Anthony Lo Sasso (eds.): Advances in Health
Economics and Health Services Research 19, 71-94.
Bagwell, Kyle (2008): „The economic analysis of advertising”, in: Mark Armstrong und
Robert Porter (Hrgs.): Handbook of Industrial Organization, vol. 3, Elsevier B.V.:
Amsterdam, 1701-1844.
Becker, Bettina and Silke Uebelmesser (2010): “The impact of print media advertising on
public health insurance switching”, mimeo, Loughborough University and University
of Munich.
Becker, Bettina, Arne Hole and Silke Uebelmesser (2010): “Heterogeneity of household
preferences for health insurance companies”, mimeo, Loughborough University,
University of Sheffield and University of Munich.
BKK Bundesverband (2007): Entwicklung der Anzahl der Krankenkassen in der GKV, Berlin.
Braun Bernhard, Stefan Greß, Karin Höppner, Gerd Marstedt, Heinz Rothgang, Marcus
Tamm, Jürgen Wasem (2006): „Barrieren für einen Wechsel der Krankenkasse: Loya-
lität, Bequemlichkeit, Informationsdefizite?“, in: Jan Böcken, Bernhard Braun, Robert
Amhof, Melanie Schnee (Hrsg.): Gesundheitsmonitor 2006, Verlag Bertelsmann
Stiftung: Gütersloh, 11-31.
Breyer, Friedrich und Mathias Kifmann (2001): “Optionen der Weiterentwicklung des
Risikostrukturausgleichs in der GKV“, DIW Diskussionspapier Nr. 236, Berlin.
Buchner, Florian and Jürgen Wasem (2003): „Needs for further improvement: Risk
adjustment in the German health insurance system“, Health Policy 65, 21-35.

21
Bundesministerium für Gesundheit (2001): Daten des Gesundheitswesens 2001, Bonn.
Bundesministerium für Gesundheit (2009): Daten des Gesundheitswesens 2009, Berlin.
Burda Advertising Center GmbH (2008): Reichweitenanalyse (ma 2008) Pressemedien I,
http://ma.bik-gmbh.de/burda/ (20 August 2008).
Busse Reinhard and Annette Riesberg (2004): Health care systems in transition: Germany,
WHO Regional Office for Europe on behalf of the European Observatory on Health
Systems and Policies: Copenhagen.
Cronqvist, Henrik (2005): “Advertising and portfolio choice”, Working Paper CeRP N°
44/05, Moncalieri.
Cutler, David M. and Richard J. Zeckhauser (2000): “The Anatomy of health insurance”, in:
Anthony J. Culyer and Joseph P. Newhouse (eds.): Handbook of Health Economics
1A, Elsevier: Amsterdam, 563-643.
Ettner, Susan L. (1996): “New evidence on the relationship between income and health”,
Journal of Health Economics 15, 67-85.
Glazer, Jacob and Thomas G. McGuire (2006): “Contending with risk selection in
competitive health insurance markets”, Perspektiven der Wirtschaftspolitk 7, 75-91.
Greß, Stefan, Peter Groenwegen, Jan Kerssens, Bernhard Braun and Jürgen Wasem (2002):
“Free choice of sickness funds in regulated competition: Evidence from Germany and
The Netherlands”, Health Policy 60, 235-254.
Greß, Stefan (2002): “Freie Kassenwahl und Preiswettbewerb in der GKV – Effekte und
Perspektiven”, Vierteljahresheft zur Wirtschaftsforschung 71, 490-497.
Hart, Oliver (1983): “The market mechanism as an incentive scheme“, Bell Journal of
Economics, 14, 366-382.
Haenecke, Henrik (2001): „Unternehmensziele von Krankenkassen – Eine empirische
Analyse“, Arbeit und Sozialpolitik 1-2, 27-34.
Höppner, Karin, Stefan Greß, Heinz Rothgang and Jürgen Wasem (2006): „Instrumente der
Risikoselektion – Theorie und Empirie“, in: Dirk Göpffarth, Stefan Greß, Klaus
Jacobs, Jürgen Wasem (eds.): Jahrbuch Risikostrukturausgleich 2006, Asgard-Verlag:
Sankt Augustin, 119-144.
IVW (2010): Auflagenzahlen Print, http://www.ivw.de/index.html (1 March 2010)
Jacobs, Klaus, Peter Reschke, Dieter Cassel and Jürgen Wasem (2002): Zur Wirkung des
Risikostrukturausgleichs in der gesetzlichen Krankenversicherung – Eine Untersu-
chung im Auftrag des Bundesministeriums für Gesundheit: Endbericht, Schriftenreihe
des Bundesministeriums für Gesundheit, Bd. 140, Nomos: Baden-Baden.
22
Jain, Prem and Johanna Shuang Wu (2000), “Truth in mutual fund advertising: Evidence on
future performance and fund flows,” Journal of Finance 55, 937-958.
Lauterbach, Karl W. and Eberhard Wille (2001): Modell eines fairen Wettbewerbs durch den
Risikostrukturausgleich. Sofortprogramm “Wechselkomponente und solidarische
Rückversicherung” unter Berücksichtigung der Morbidität (Abschlussbericht).
Laske-Aldershof, Trea, Frederik Schut, Konstantin Beck, Stefan Greß, Amir Shmueli and Ca-
rine Van de Voorde (2004): “Consumer mobility in social health insurance markets: A
five-country comparison”, Applied Health Economics and Health Policy 3, 229-241.
Mullainathan, Sendhil and Andrei Shleifer (2005): “Persuasion in finance”, mimeo, Harvard
University.
Nelson, Phillip (1970): “Information and consumer behavior”, Journal of Political Economy
78, 311-329.
Nelson, Phillip (1974): “Advertising as information”, Journal of Political Economy 82, 729-
754.
Nielsen Media Research (2005): “Data on ads placed by AOK, Barmer, BKK, DAK, TK in
newspapers and magazines”, Nielsen Median Research GmbH (acquired by purchase).
Nielsen Media Research (2009): “Data on the development of gross advertisement
expenditures 1990-2008” (Brutto-Werbemarkt), http://www.ip-deutschland.de/ipd/
forschung_und_service/mediaforschung/werbemarktdaten/entwicklung_des_werbemar
ktes.cfm (25 February 2010).
Nuscheler, Robert and Thomas Knaus (2005): “Risk selection in the German public health
insurance system”, Health Economics 14, 1253-1271.
Scherer, Frederic .M. (2000): “The pharmaceutical industry”, in: Anthony J. Culyer and
Joseph P. Newhouse (eds.): Handbook of Health Economics, vol. 1A, Elsevier:
Amsterdam, 1297-1336.
Schwarze, Johannes and Hanfried H. Andersen (2001): „Kassenwechsel in der Gesetzlichen
Krankenversicherung: Welche Rolle spielt der Beitragssatz?“, DIW Diskussionspapier
267, Berlin.
Schweitzer, Stuart O. (2007): Pharmaceutical Economics and Policy, Oxford University
Press: New York.
Stern (1992-2003): Weekly magazine, Gruner + Jahr.
Stigler, George (1961): „The economics of information“, Journal of Political Economy 69,
213-225.
Stigler, George (1987): The Theory of Price, MacMillan Publishing: New York.

23
Strombom, Bruce A., Buchmueller, Thomas C. and Paul J. Feldstein (2002): „Switching
costs, price sensitivity and health plan choice“, Journal of Health Economics 21, 89-
116.
Tamm, Marcus, Harald Tauchmann, Jürgen Wasem and Stefan Greß (2007): “Price
elasticities and social health insurance choice in Germany - A dynamic panel data
approach”, Health Economics 16, 243-256.
Van de Ven, Wynand P.M.M., Konstantin Beck, Florian Buchner, Dov Chernichovsky,
Lucien Gardiol, Alberto Holly, Leida M. Lamers, Erik Schokkaert, Amir Shmueli,
Stephan Spycher, Carine Van de Voorde, René C.J.A. van Vliet, Jürgen Wasem, Irith
Zmora (2003): „Risk adjustment and risk selection on the sickness fund insurance
market in five European countries“, Health Policy 65, 75-98.
Van de Ven, Wynand P.M.M. and Randall P. Ellis (2000): “Risk adjustment in competitive
health plan markets”, in: Anthony J. Culyer and Joseph P. Newhouse (eds.): Handbook
of Health Economics, vol. 1A, Elsevier: Amsterdam, 755-845.
Van de Ven, Wynand P.M.M. and René C. J. A. van Vliet (1992): “How can we prevent
cream skimming in a competitive health insurance market?”, in: Peter Zweifel und H.
E. Frech III (eds.): Health Economics Worldwide. Dodrecht, Kluwer Academic Pub-
lishers, 23-46.
24
Appendix
I) Data on number and costs of advertisements
1) Number of ads
Funds Obs. Mean Std.Dev. Min Max
AOK 14 2532.50 641.86 1591 3649
Barmer 14 143.00 105.44 7 307
BKK 14 414.50 269.14 43 956
DAK 14 515.29 506.45 9 1631
TK 14 258.79 248.87 32 935
Year Obs Mean Std.Dev. Min Max
1990 5 343.8 697.658 8 1591
1991 5 389.4 799.5382 7 1819
1992 5 620.8 1220.753 31 2803
1993 5 745.2 1294.031 34 3046
1994 5 953.6 1527.374 49 3649
1995 5 1193.8 1407.854 154 3606
1996 5 1128.2 1204.562 253 3028
1997 5 665.4 702.2196 134 1889
1998 5 741 739.2966 213 1956
1999 5 700.2 847.0999 166 2194
2000 5 1056.2 917.2163 242 2561
2001 5 687 1005.476 92 2458
2002 5 895 1025.134 39 2639
2003 5 699.8 859.9629 170 2216
25
2) Costs of ads (in Euro)
Funds Obs. Mean Std.Dev. Min Max
AOK 14 6711.071 1399.684 4891 10217
Barmer 14 1155.286 1506.149 9 3771
BKK 14 2426 1945.097 158 6843
DAK 14 4315 3475.109 4 10466
TK 14 1441.357 1059.634 168 3097
Year Obs Mean Std.Dev. Min Max
1990 5 1260.6 2576.251 4 5865
1991 5 1301.8 2716.934 9 6160
1992 5 2593 3717.939 29 8602
1993 5 2970.4 3747.912 33 7238
1994 5 3868 4925.734 200 10217
1995 5 4962.4 4187.312 303 10466
1996 5 4092.2 3736.593 308 9590
1997 5 2459.4 2450.136 160 6183
1998 5 3425 1609.975 2279 6226
1999 5 3629.6 2144.263 1673 7307
2000 5 4320.6 2094.542 1768 7586
2001 5 2563.2 1606.917 979 5196
2002 5 3779.8 2556.808 112 6471
2003 5 3710.4 818.2477 2582 4891
Source: Nielsen Media Research (2005)
26
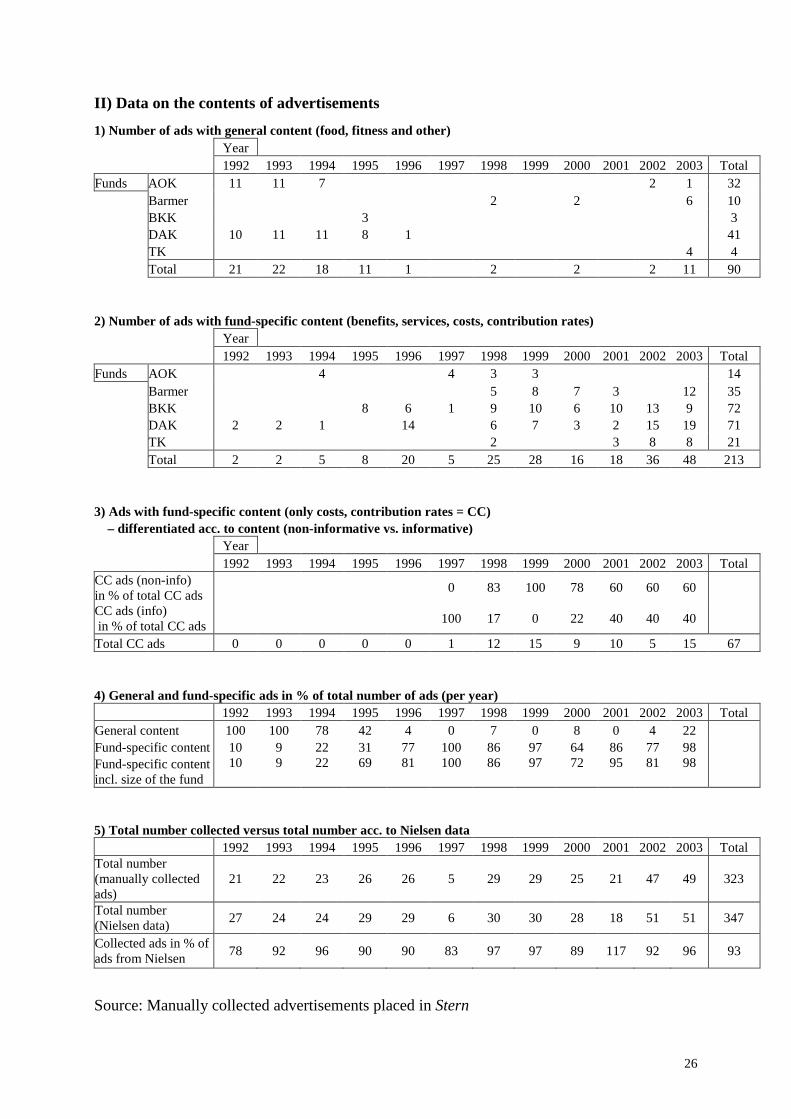
II) Data on the contents of advertisements
1) Number of ads with general content (food, fitness and other) Year 1992 1993 1994 1995 1996 1997 1998 1999 2000 2001 2002 2003 Total Funds AOK 11 11 7 2 1 32 Barmer 2 2 6 10 BKK 3 3 DAK 10 11 11 8 1 41 TK 4 4 Total 21 22 18 11 1 2 2 2 11 90 2) Number of ads with fund-specific content (benefits, services, costs, contribution rates) Year 1992 1993 1994 1995 1996 1997 1998 1999 2000 2001 2002 2003 Total Funds AOK 4 4 3 3 14 Barmer 5 8 7 3 12 35 BKK 8 6 1 9 10 6 10 13 9 72 DAK 2 2 1 14 6 7 3 2 15 19 71 TK 2 3 8 8 21 Total 2 2 5 8 20 5 25 28 16 18 36 48 213 3) Ads with fund-specific content (only costs, contribution rates = CC) – differentiated acc. to content (non-informative vs. informative) Year 1992 1993 1994 1995 1996 1997 1998 1999 2000 2001 2002 2003 Total CC ads (non-info) in % of total CC ads
0 83 100 78 60 60 60
CC ads (info) in % of total CC ads
100 17 0 22 40 40 40
Total CC ads 0 0 0 0 0 1 12 15 9 10 5 15 67 4) General and fund-specific ads in % of total number of ads (per year)
1992 1993 1994 1995 1996 1997 1998 1999 2000 2001 2002 2003 Total General content 100 100 78 42 4 0 7 0 8 0 4 22 Fund-specific content 10 9 22 31 77 100 86 97 64 86 77 98 Fund-specific content incl. size of the fund
10 9 22 69 81 100 86 97 72 95 81 98
5) Total number collected versus total number acc. to Nielsen data
1992 1993 1994 1995 1996 1997 1998 1999 2000 2001 2002 2003 Total Total number (manually collected ads)
21 22 23 26 26 5 29 29 25 21 47 49 323
Total number (Nielsen data)
27 24 24 29 29 6 30 30 28 18 51 51 347
Collected ads in % of ads from Nielsen
78 92 96 90 90 83 97 97 89 117 92 96 93
Source: Manually collected advertisements placed in Stern