Embed Size (px)
Citation preview
187187
Writing instruments inks: microspectrophotometry forensic analysis and characterisation
Ana Cristina de Almeida Assis
Scientific Police Laboratory, Judiciary Police, Portugal
Filipa Isabel Romano Inácio
Department of Chemistry, University of Coimbra, Portugal
João Sérgio Seixas de Melo
Coimbra Chemistry Centre, Department of Chemistry, University of
Coimbra, Portugal
Carlos Farinha
Scientific Police Laboratory, Judiciary Police, Portugal
Abstract
An important aspect in the analysis of written documents is the type of materials used in questionable
documents. The present study aims to characterise and create a database of the absorption spectra
in the visible region, obtained by microspectrophotometry (in reflectance mode), of inks from blue
and black writing instruments, such as ballpoint pens and liquid ink pens (rollerball pens, gel pens,
felt-tip pens and fountain pens). The study was performed with 167 ink samples of 36 different brands
commonly used in national and international markets. To validate the possible use of the database
a preliminary blind test with 22 samples yielding a consistent and accurate match of 13 samples
revealed that this technique has a good potential to obtain a list of inks with the same spectral
characteristics. To evaluate the differentiation level of this method the samples were grouped based on
the overlap of the 1st derivative spectra. As this grouping systematisation was found to present some
limitations when we have a large number of samples, a multivariate analysis of the data was made.
For this, a hierarchical cluster analysis (HCA) was performed. The discrimination power was calculated
and compared with another works.
Keywords
Document examination, ink analysis, blue and black writing instruments, microspectrophotometry,
hierarchical cluster analysis (HCA)
188
European Police Science and Research Bulletin · Issue 16 · Summer 2017
Introduction
The technological development of the past 30 years has put us in a digital era, in which
we increasingly resort to electronic means for identification and commercialisation pur-
poses. However, documents continue to play a key role in different segments. They are
used in the establishment of various relationships, whether personal, financial, commercial
or institutional. In order to serve the most varied interests and conveniences, documents
are in constant threat of being susceptible to imitations or changes. The forgery and coun-
terfeiting of documents is associated with different types of crimes, particularly trafficking
of drugs, weapons, vehicles and people, money laundering, organised illegal immigration,
homicides, kidnapping, paedophilia, international terrorism, corruption, theft, swindling,
economic and financial crimes (Hammond, 2013).
Scientific analysis of documents, as part of forensic science, aims to clarify the nature of
a document for legal purposes (Ellen, 1997). In the Portuguese Scientific Police Labora-
tory different types of analysis to all kinds of questionable documents using appropriate
methodologies and instrumentation are performed. One of the aspects of the document
analysis is to detect evidence of tampering. This kind of alterations, where a different ink of
a manual writing instrument, although of the same colour, has been used, is very common
and involves overlap and adds features, obliteration and insertion of new entries and signa-
tures for various types of documents such as bank checks, invoices and contracts.
Nowadays one can find more easily manual writing instruments since they are often used
in the production/filling of a certain document or used to sign it. Writing instruments are
divided into two major (and broad) categories: (1) ballpoint pens and (2) liquid ink pens.
In the first category are the inks of the ballpoint pens which are unique in that their inks
are viscous — oils or glycols are used as solvents and colourants, which are mostly dyes.
In the second category the inks of the rollerball and gel pens, felt pens and fountain pens
are included. In this category, inks are liquid or gel using solvents and aqueous solutions in
their constitution, and whose colourants may be dyes, pigments or both. The colourants
(dyes or pigments) are one of the main components used in the writing ink composition
and are responsible for the colour of the writing instruments (Ezcurra et al. 2010; Brunelle et
al., 2003; Andrasko, 2002).
Microspectrophotometry in the analysis of questionable documents
Colour is a feature with an important role in forensic comparative studies. A visual descrip-
tion of colour, particularly a comparison between two objects is difficult because the hu-
man eye sees only within a narrow range of the electromagnetic radiation (the visible re-
gion), and even in this range it is not uniformly sensitive to all wavelengths. Moreover, the
lighting and observation conditions can compromise the visual result of the comparison
made by the observer (Zi ba-Palus, 2006; Martyna et al. 2013).
Writing instruments inks: microspectrophotometry forensic analysis and characterisation
189
Microspectrophotometry is a technique that allows the comparison of colour between
small samples from different materials, such as fibres, fabrics, paints or plastics (Zi ba-Palus,
2006; Pfefferli, 1983).
The microspectrophotometer consists of an optical microscope coupled to a spectropho-
tometer connected to a computer via an analogue-digital converter (Zi ba-Palus, 2006;
Martin, 2014). It can be used for analysis in the visible and ultraviolet regions, and spectra in
transmittance or reflectance mode can also be obtained (Martin, 2014).
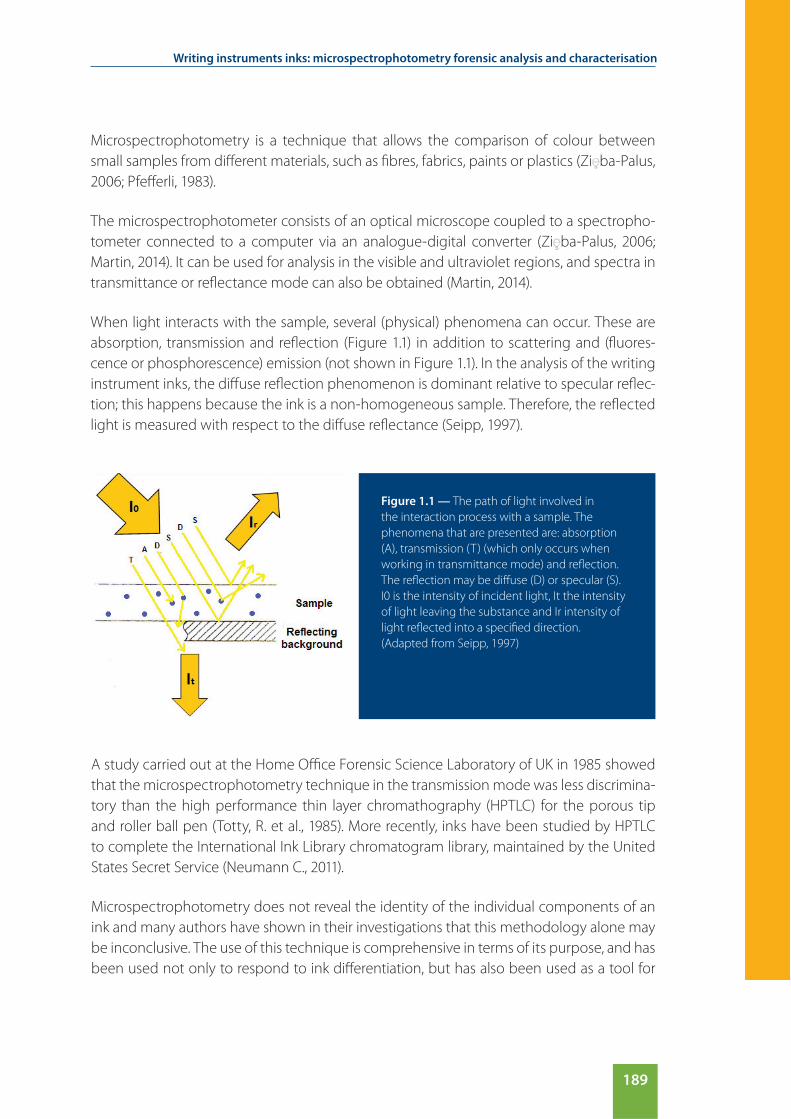
When light interacts with the sample, several (physical) phenomena can occur. These are
absorption, transmission and reflection (Figure 1.1) in addition to scattering and (fluores-
cence or phosphorescence) emission (not shown in Figure 1.1). In the analysis of the writing
instrument inks, the diffuse reflection phenomenon is dominant relative to specular reflec-
tion; this happens because the ink is a non-homogeneous sample. Therefore, the reflected
light is measured with respect to the diffuse reflectance (Seipp, 1997).
Figure 1.1 — The path of light involved in
the interaction process with a sample. The
phenomena that are presented are: absorption
(A), transmission (T) (which only occurs when
working in transmittance mode) and reflection.
The reflection may be diffuse (D) or specular (S).
I0 is the intensity of incident light, It the intensity
of light leaving the substance and Ir intensity of
light reflected into a specified direction.
(Adapted from Seipp, 1997)
A study carried out at the Home Office Forensic Science Laboratory of UK in 1985 showed
that the microspectrophotometry technique in the transmission mode was less discrimina-
tory than the high performance thin layer chromathography (HPTLC) for the porous tip
and roller ball pen (Totty, R. et al., 1985). More recently, inks have been studied by HPTLC
to complete the International Ink Library chromatogram library, maintained by the United
States Secret Service (Neumann C., 2011).
Microspectrophotometry does not reveal the identity of the individual components of an
ink and many authors have shown in their investigations that this methodology alone may
be inconclusive. The use of this technique is comprehensive in terms of its purpose, and has
been used not only to respond to ink differentiation, but has also been used as a tool for
190
European Police Science and Research Bulletin · Issue 16 · Summer 2017
classification and dating (Zi ba-Palus J. et al., 2012). In 2013, the colour of 40 blue pen inks
(36 ballpont and 4 gel) was studied in the three colour systems defined by the International
Commission on Illumination (CIE) through the spectra in the visible region obtained by mi-
crospectrophotometry (Martyna, A. et al., 2013). More recently, this technique was also used
in the study of the sequence of intersecting lines (Biao Li, 2016), showing positive results.
Reflectance microspectrophotometry showed less discriminatory power when compared to
Thin Layer Chromatography (TLC) and filtered light examination (visible luminescence, infra-
red luminescence and infrared reflectance) (Roux, C. et al., 1999). UV-VIS spectrophotometry
was also compared with TLC and Fourier Transform Infrared Spectrometry in the analysis of 21
black and 12 blue ballpoint inks, being verified the complementarity of the FTIR by detecting
resins and solvents in addition to the colouring agents (Causin, V. et al.). In most of the studies
performed with this technique no chemometric methods were used for sample differentiation.
Aim of the study
This study aims to characterise and to analyse writing instrument inks in order to create
a database of the absorption spectra in the visible region with a non-destructive reflec-
tance mode microspectrophotometry technique. In the present work, the objects of study
are the inks from blue and black writing instruments, such as ballpoint pens and liquid ink
pens (rollerball pens, gel pens, felt-tip pens and fountain pens). To facilitate these com-
parisons and evaluate the discrimination level of the technique, the data obtained from the
writing instrument inks will be grouped according to the first derivative of the observed
peaks in the visible region and with a hierarchical cluster analysis method (HCA).
Materials and Instrumentation
Sample characterisation and the ink database
80 blue inks [56 ballpoint pens (BBn), 17 rollerball and gel pens (LBn), 5 felt pens (FBn) and 2
fountain pens (FOBn)] and 87 black inks [55 ballpoint pens (BKn), 17 rollerball and gel pens
(LKn), 5 felt-tip pens (FKn) and 10 fountain pens (FOKn)] were analysed. They came either
from national (Portuguese) or international markets from 36 different brands (and some
models) such as BIC, Pentel, Uni Mitsubishi Pencil, Paper Mate, Corvina, Reynolds, Molin,
ACVILA, Lecce Pen, RTC, Office Cover, Pelikan, LINC, STABILO, A.G. SPALDING BROS, WATER-
MAN, mab, PLUS B-2, Unix, Epene, Fegol, Q-CONNECT, PARKER, MONTE LEMA, AURORA, Ro-
tring, Fisher Space Pen, PILOT, STAEDTLER ZEBRA, Ergo marker, HERO, LAMY, CROSS, MONT
BLANC and ‘white label’ — see tables 2.1 to 2.4.
Writing instruments inks: microspectrophotometry forensic analysis and characterisation
191
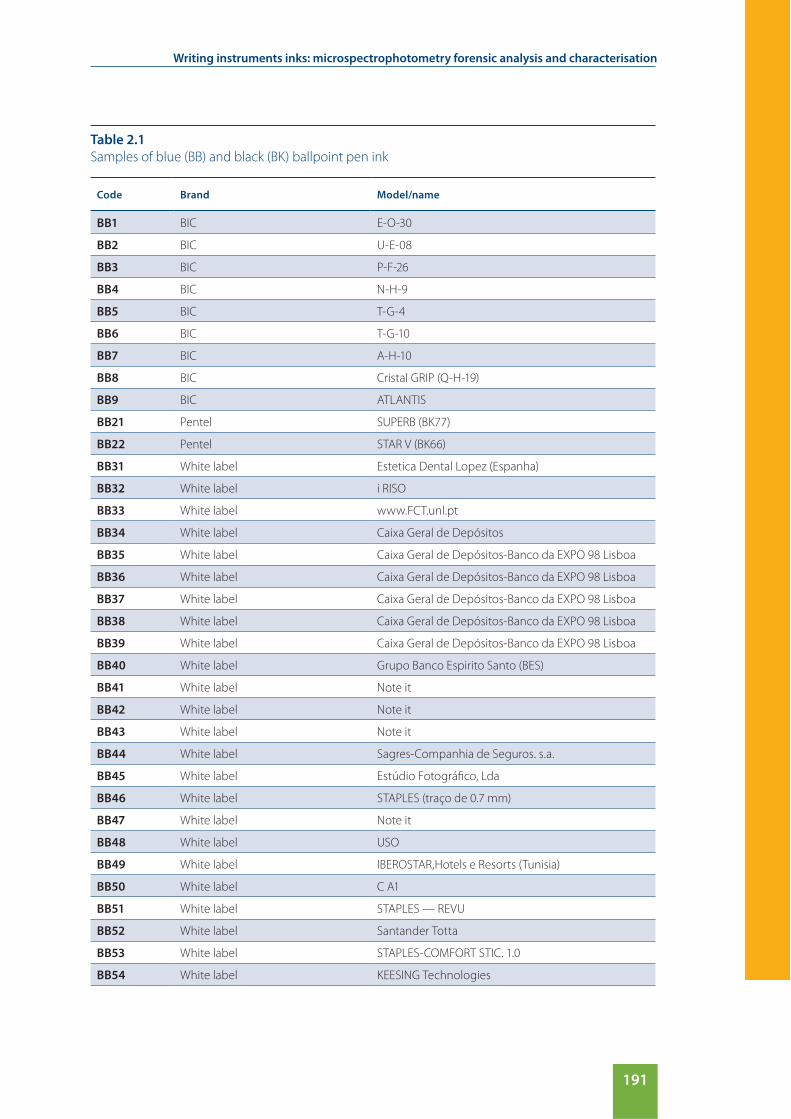
Table 2.1
Samples of blue (BB) and black (BK) ballpoint pen ink
Code Brand Model/name
BB1 BIC E-O-30
BB2 BIC U-E-08
BB3 BIC P-F-26
BB4 BIC N-H-9
BB5 BIC T-G-4
BB6 BIC T-G-10
BB7 BIC A-H-10
BB8 BIC Cristal GRIP (Q-H-19)
BB9 BIC ATLANTIS
BB21 Pentel SUPERB (BK77)
BB22 Pentel STAR V (BK66)
BB31 White label Estetica Dental Lopez (Espanha)
BB32 White label i RISO
BB33 White label www.FCT.unl.pt
BB34 White label Caixa Geral de Depósitos
BB35 White label Caixa Geral de Depósitos-Banco da EXPO 98 Lisboa
BB36 White label Caixa Geral de Depósitos-Banco da EXPO 98 Lisboa
BB37 White label Caixa Geral de Depósitos-Banco da EXPO 98 Lisboa
BB38 White label Caixa Geral de Depósitos-Banco da EXPO 98 Lisboa
BB39 White label Caixa Geral de Depósitos-Banco da EXPO 98 Lisboa
BB40 White label Grupo Banco Espirito Santo (BES)
BB41 White label Note it
BB42 White label Note it
BB43 White label Note it
BB44 White label Sagres-Companhia de Seguros. s.a.
BB45 White label Estúdio Fotográfico, Lda
BB46 White label STAPLES (traço de 0.7 mm)
BB47 White label Note it
BB48 White label USO
BB49 White label IBEROSTAR,Hotels e Resorts (Tunisia)
BB50 White label C A1
BB51 White label STAPLES — REVU
BB52 White label Santander Totta
BB53 White label STAPLES-COMFORT STIC. 1.0
BB54 White label KEESING Technologies

192
European Police Science and Research Bulletin · Issue 16 · Summer 2017
Code Brand Model/name
BB55 White label LaborSpirit,Lda
BB56 White label TECHNO SPEC
BB57 White label ---
BB81 Uni Mitsubishi Pencil Lakubo (uni SG-100 (07) blue)
BB91 Paper Mate Ink Joy 100 1.0M (Ponta:1.0 mm)
BB101 Corvina WH-T (Ponta:1.0 mm)
BB102 Corvina 51 (Ponta:1.0 mm)
BB106 Reynolds Medium 048
BB116 molin twisty
BB121 ACVILA FINE 309
BB126 Lecce Pen ---
BB127 Lecce Pen ---
BB128 Lecce Pen ---
BB131 RTC ---
BB132 RTC ---
BB136 Office Cover ASTRO (Ponta: 1.0 mm)
BB141 Pelikan ---
BB151 LINC Glycer fine
BB156 STABILO galaxy 818 M
BB161 A.G. SPALDING BROS. ---
BB166 WATERMAN STANDARD MAX. (MOYENNE/MEDIUM)
BK1 BIC Z-E-17
BK2 BIC E-O-32
BK3 BIC H-E-5
BK4 BIC I-H-30
BK5 BIC I-H-6
BK6 BIC SOFT Feel Med. USA
BK7 BIC Cristal GRIP (Q-H-11)
BK8 BIC ATLANTIS 1.2
BK9 BIC Cristal STYLUS (T-L-03 Tunisia)
BK21 Pentel SUPERB (BK77)
BK22 Pentel STAR V
BK23 Pentel SUPERB (BK77)
BK31 White label STAPLES (Traço de 0.7 mm)
BK32 White label Note it
BK33 White label Note it
BK34 White label USO
BK35 White label Grupo Banco Espirito Santo (BES)
Writing instruments inks: microspectrophotometry forensic analysis and characterisation
193
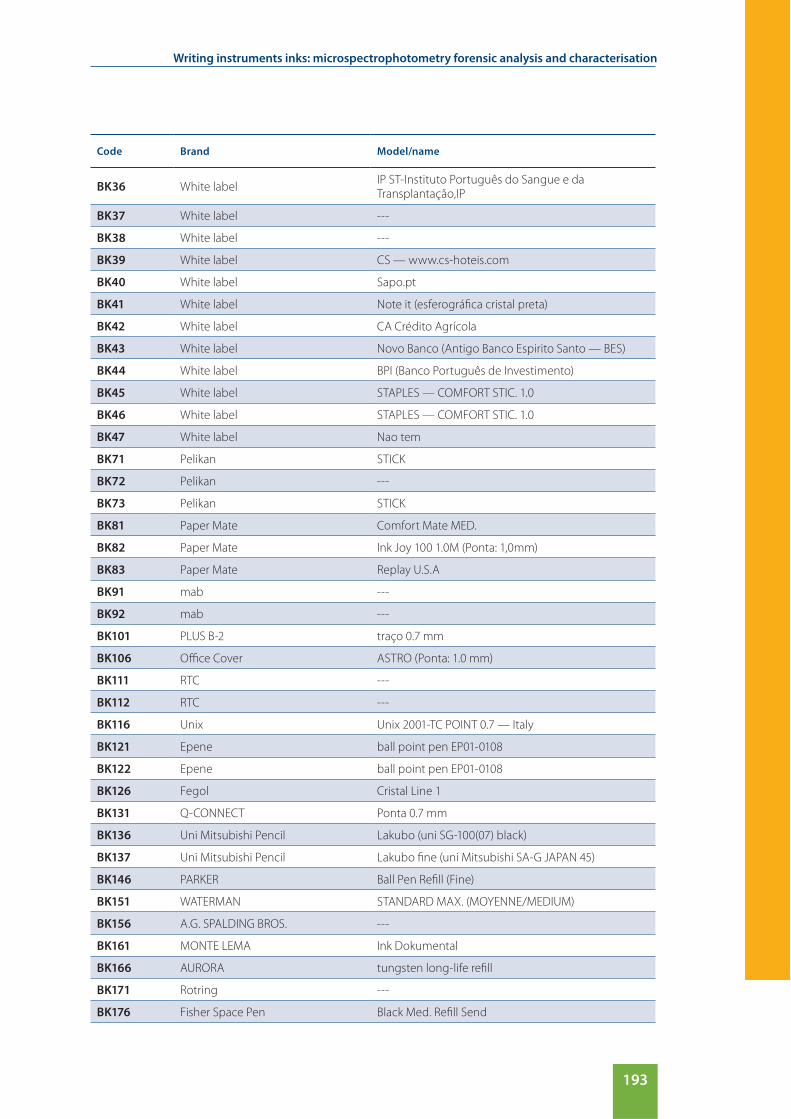
Code Brand Model/name
BK36 White labelIP ST-Instituto Português do Sangue e da Transplantação,IP
BK37 White label ---
BK38 White label ---
BK39 White label CS — www.cs-hoteis.com
BK40 White label Sapo.pt
BK41 White label Note it (esferográfica cristal preta)
BK42 White label CA Crédito Agrícola
BK43 White label Novo Banco (Antigo Banco Espirito Santo — BES)
BK44 White label BPI (Banco Português de Investimento)
BK45 White label STAPLES — COMFORT STIC. 1.0
BK46 White label STAPLES — COMFORT STIC. 1.0
BK47 White label Nao tem
BK71 Pelikan STICK
BK72 Pelikan ---
BK73 Pelikan STICK
BK81 Paper Mate Comfort Mate MED.
BK82 Paper Mate Ink Joy 100 1.0M (Ponta: 1,0mm)
BK83 Paper Mate Replay U.S.A
BK91 mab ---
BK92 mab ---
BK101 PLUS B-2 traço 0.7 mm
BK106 Office Cover ASTRO (Ponta: 1.0 mm)
BK111 RTC ---
BK112 RTC ---
BK116 Unix Unix 2001-TC POINT 0.7 — Italy
BK121 Epene ball point pen EP01-0108
BK122 Epene ball point pen EP01-0108
BK126 Fegol Cristal Line 1
BK131 Q-CONNECT Ponta 0.7 mm
BK136 Uni Mitsubishi Pencil Lakubo (uni SG-100(07) black)
BK137 Uni Mitsubishi Pencil Lakubo fine (uni Mitsubishi SA-G JAPAN 45)
BK146 PARKER Ball Pen Refill (Fine)
BK151 WATERMAN STANDARD MAX. (MOYENNE/MEDIUM)
BK156 A.G. SPALDING BROS. ---
BK161 MONTE LEMA Ink Dokumental
BK166 AURORA tungsten long-life refill
BK171 Rotring ---
BK176 Fisher Space Pen Black Med. Refill Send
194
European Police Science and Research Bulletin · Issue 16 · Summer 2017
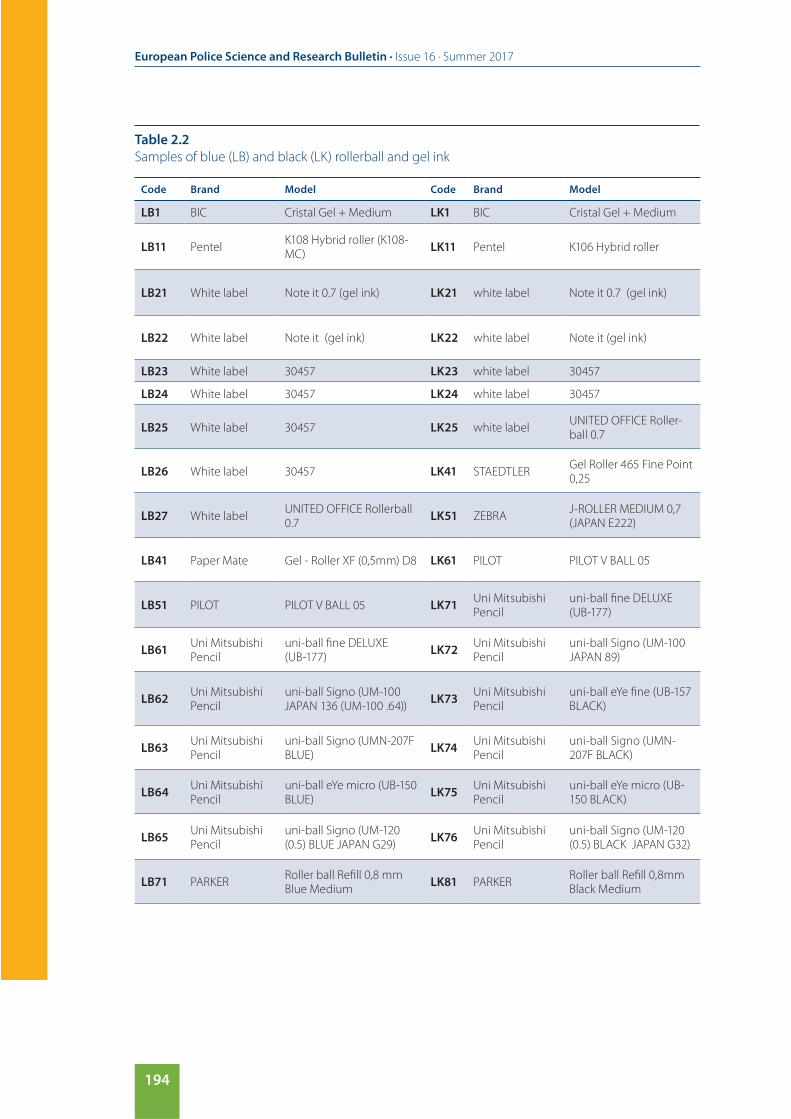
Table 2.2
Samples of blue (LB) and black (LK) rollerball and gel ink
Code Brand Model Code Brand Model
LB1 BIC Cristal Gel + Medium LK1 BIC Cristal Gel + Medium
LB11 PentelK108 Hybrid roller (K108-MC)
LK11 Pentel K106 Hybrid roller
LB21 White label Note it 0.7 (gel ink) LK21 white label Note it 0.7 (gel ink)
LB22 White label Note it (gel ink) LK22 white label Note it (gel ink)
LB23 White label 30457 LK23 white label 30457
LB24 White label 30457 LK24 white label 30457
LB25 White label 30457 LK25 white labelUNITED OFFICE Roller-ball 0.7
LB26 White label 30457 LK41 STAEDTLERGel Roller 465 Fine Point 0,25
LB27 White labelUNITED OFFICE Rollerball 0.7
LK51 ZEBRAJ-ROLLER MEDIUM 0,7 (JAPAN E222)
LB41 Paper Mate Gel - Roller XF (0,5mm) D8 LK61 PILOT PILOT V BALL 05
LB51 PILOT PILOT V BALL 05 LK71Uni Mitsubishi Pencil
uni-ball fine DELUXE (UB-177)
LB61Uni Mitsubishi Pencil
uni-ball fine DELUXE (UB-177)
LK72Uni Mitsubishi Pencil
uni-ball Signo (UM-100 JAPAN 89)
LB62Uni Mitsubishi Pencil
uni-ball Signo (UM-100 JAPAN 136 (UM-100 .64))
LK73Uni Mitsubishi Pencil
uni-ball eYe fine (UB-157 BLACK)
LB63Uni Mitsubishi Pencil
uni-ball Signo (UMN-207F BLUE)
LK74Uni Mitsubishi Pencil
uni-ball Signo (UMN-207F BLACK)
LB64Uni Mitsubishi Pencil
uni-ball eYe micro (UB-150 BLUE)
LK75Uni Mitsubishi Pencil
uni-ball eYe micro (UB-150 BLACK)
LB65Uni Mitsubishi Pencil
uni-ball Signo (UM-120 (0.5) BLUE JAPAN G29)
LK76Uni Mitsubishi Pencil
uni-ball Signo (UM-120 (0.5) BLACK JAPAN G32)
LB71 PARKERRoller ball Refill 0,8 mm Blue Medium
LK81 PARKERRoller ball Refill 0,8mm Black Medium
Writing instruments inks: microspectrophotometry forensic analysis and characterisation
195
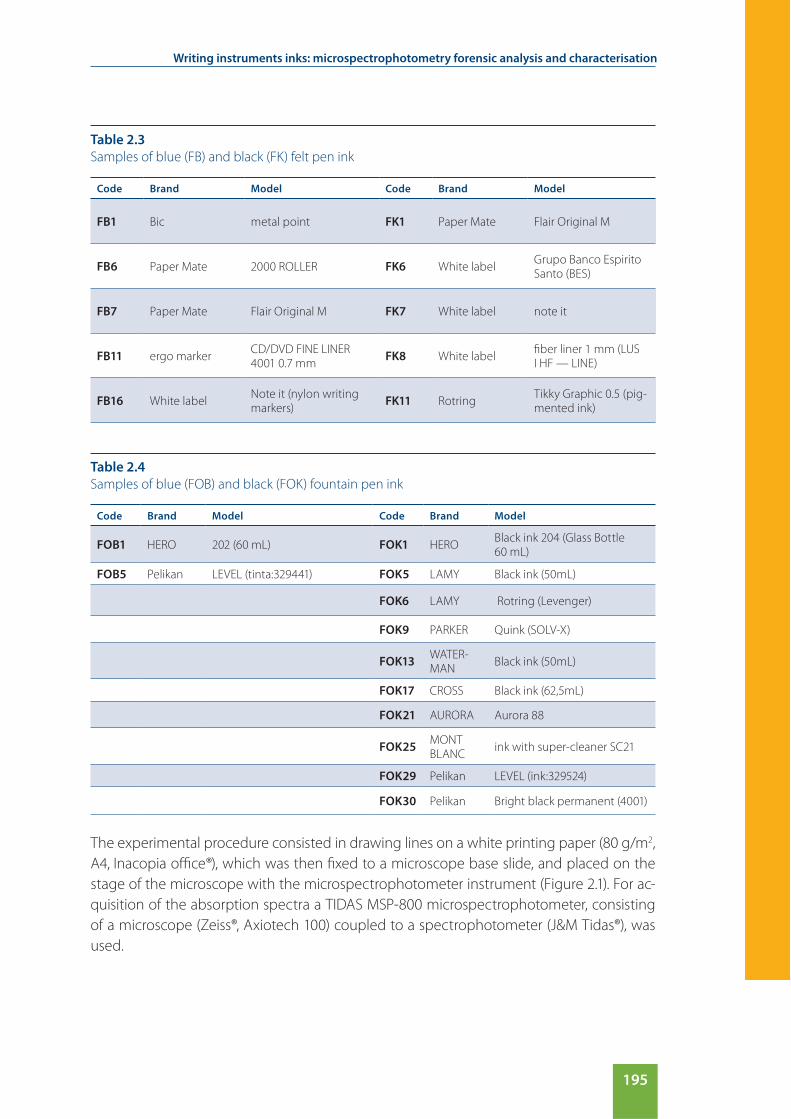
Table 2.3
Samples of blue (FB) and black (FK) felt pen ink
Code Brand Model Code Brand Model
FB1 Bic metal point FK1 Paper Mate Flair Original M
FB6 Paper Mate 2000 ROLLER FK6 White labelGrupo Banco Espirito Santo (BES)
FB7 Paper Mate Flair Original M FK7 White label note it
FB11 ergo markerCD/DVD FINE LINER 4001 0.7 mm
FK8 White labelfiber liner 1 mm (LUS I HF — LINE)
FB16 White labelNote it (nylon writing markers)
FK11 RotringTikky Graphic 0.5 (pig-mented ink)
Table 2.4
Samples of blue (FOB) and black (FOK) fountain pen ink
Code Brand Model Code Brand Model
FOB1 HERO 202 (60 mL) FOK1 HEROBlack ink 204 (Glass Bottle 60 mL)
FOB5 Pelikan LEVEL (tinta:329441) FOK5 LAMY Black ink (50mL)
FOK6 LAMY Rotring (Levenger)
FOK9 PARKER Quink (SOLV-X)
FOK13WATER-MAN
Black ink (50mL)
FOK17 CROSS Black ink (62,5mL)
FOK21 AURORA Aurora 88
FOK25MONT BLANC
ink with super-cleaner SC21
FOK29 Pelikan LEVEL (ink:329524)
FOK30 Pelikan Bright black permanent (4001)
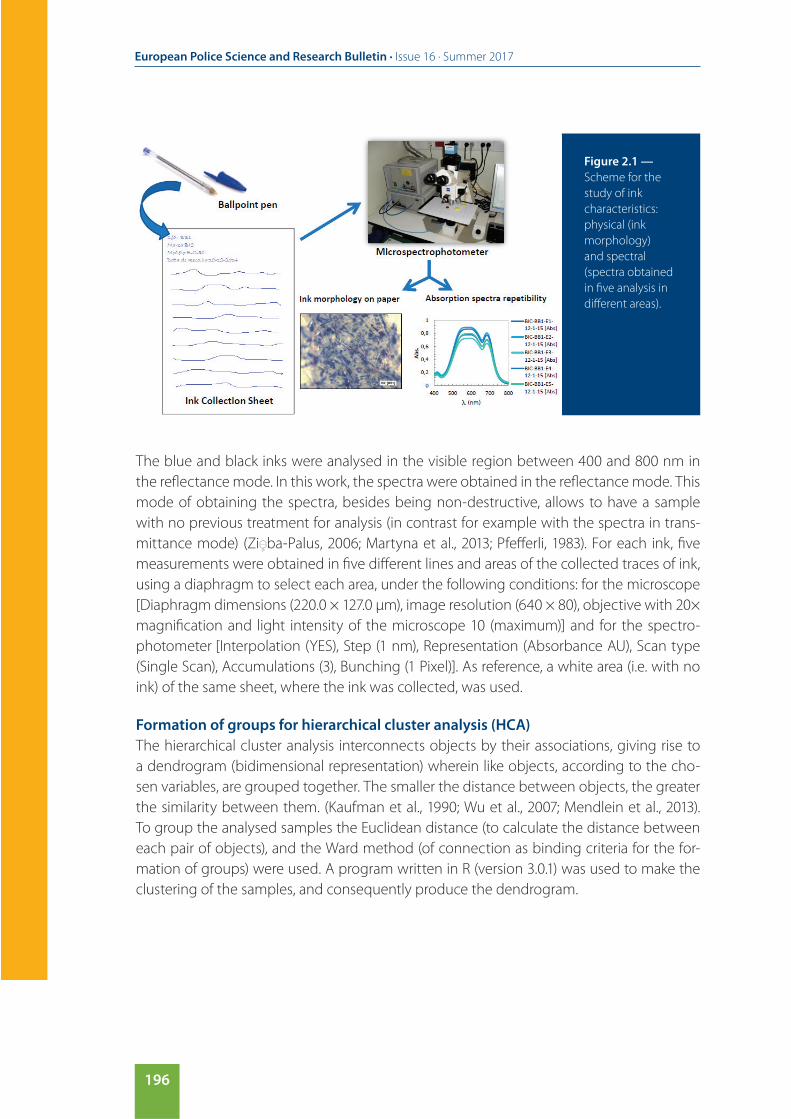
The experimental procedure consisted in drawing lines on a white printing paper (80 g/m2,
A4, Inacopia office®), which was then fixed to a microscope base slide, and placed on the
stage of the microscope with the microspectrophotometer instrument (Figure 2.1). For ac-
quisition of the absorption spectra a TIDAS MSP-800 microspectrophotometer, consisting
of a microscope (Zeiss®, Axiotech 100) coupled to a spectrophotometer (J&M Tidas®), was
used.
196
European Police Science and Research Bulletin · Issue 16 · Summer 2017
The blue and black inks were analysed in the visible region between 400 and 800 nm in
the reflectance mode. In this work, the spectra were obtained in the reflectance mode. This
mode of obtaining the spectra, besides being non-destructive, allows to have a sample
with no previous treatment for analysis (in contrast for example with the spectra in trans-
mittance mode) (Zi ba-Palus, 2006; Martyna et al., 2013; Pfefferli, 1983). For each ink, five
measurements were obtained in five different lines and areas of the collected traces of ink,
using a diaphragm to select each area, under the following conditions: for the microscope
[Diaphragm dimensions (220.0 × 127.0 μm), image resolution (640 × 80), objective with 20×
magnification and light intensity of the microscope 10 (maximum)] and for the spectro-
photometer [Interpolation (YES), Step (1 nm), Representation (Absorbance AU), Scan type
(Single Scan), Accumulations (3), Bunching (1 Pixel)]. As reference, a white area (i.e. with no
ink) of the same sheet, where the ink was collected, was used.
Formation of groups for hierarchical cluster analysis (HCA)
The hierarchical cluster analysis interconnects objects by their associations, giving rise to
a dendrogram (bidimensional representation) wherein like objects, according to the cho-
sen variables, are grouped together. The smaller the distance between objects, the greater
the similarity between them. (Kaufman et al., 1990; Wu et al., 2007; Mendlein et al., 2013).
To group the analysed samples the Euclidean distance (to calculate the distance between
each pair of objects), and the Ward method (of connection as binding criteria for the for-
mation of groups) were used. A program written in R (version 3.0.1) was used to make the
clustering of the samples, and consequently produce the dendrogram.
Figure 2.1 —
Scheme for the
study of ink
characteristics:
physical (ink
morphology)
and spectral
(spectra obtained
in five analysis in
different areas).
Writing instruments inks: microspectrophotometry forensic analysis and characterisation
197
The HCA analysis which was based on the five parameters [(i) number of visible bands and
(ii) associated wavelength, (iii) absorption value at the wavelengths in (ii) and (iv) the values
of the 1st derivative for the wavelength maxima and (v) the presence/absence of fluores-
cence in the investigated samples] lead to the association in 3-5 different groups (subdivid-
ed in other subcategories). With regard to the fluorescence (an additional parameter for the
construction of dendrograms), the samples were excited in the visible region between 485
and 610 nm and the presence or absence of luminescence was observed with the naked
eye through a spectral video comparator (foster + freeman®, VSC5000).
Results and discussion
Characterisation of the writing ink instruments
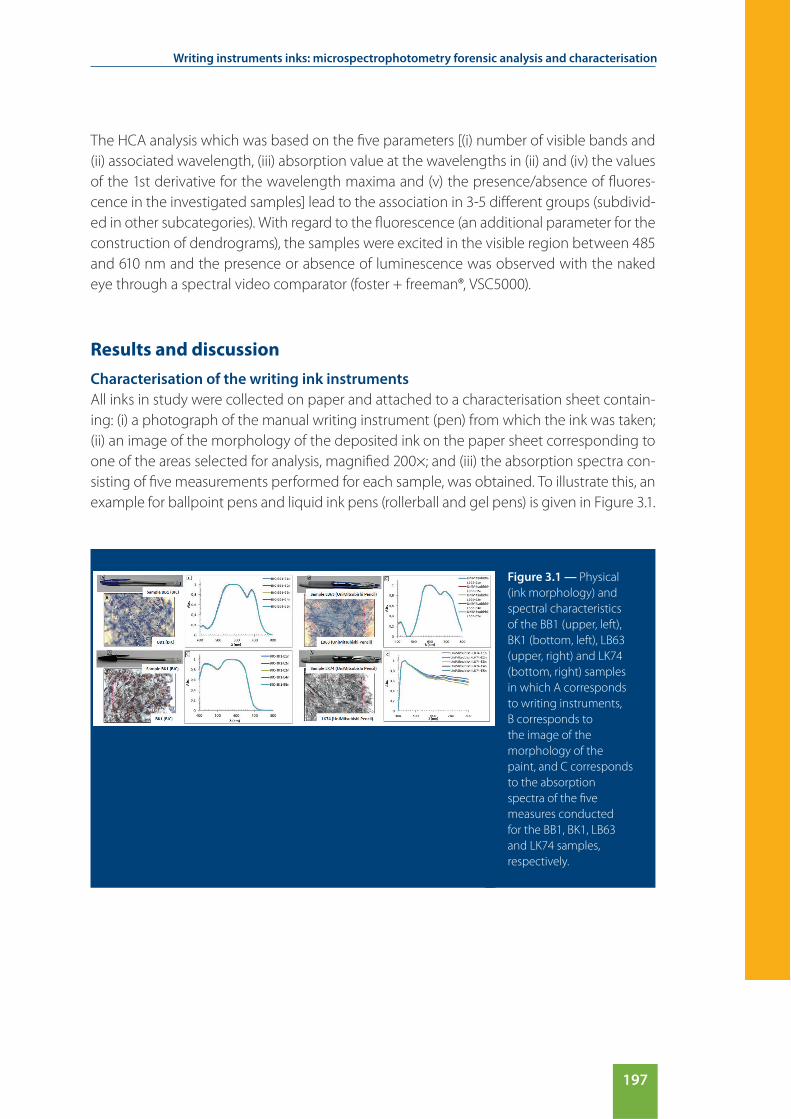
All inks in study were collected on paper and attached to a characterisation sheet contain-
ing: (i) a photograph of the manual writing instrument (pen) from which the ink was taken;
(ii) an image of the morphology of the deposited ink on the paper sheet corresponding to
one of the areas selected for analysis, magnified 200×; and (iii) the absorption spectra con-
sisting of five measurements performed for each sample, was obtained. To illustrate this, an
example for ballpoint pens and liquid ink pens (rollerball and gel pens) is given in Figure 3.1.
Figure 3.1 — Physical
(ink morphology) and
spectral characteristics
of the BB1 (upper, left),
BK1 (bottom, left), LB63
(upper, right) and LK74
(bottom, right) samples
in which A corresponds
to writing instruments,
B corresponds to
the image of the
morphology of the
paint, and C corresponds
to the absorption
spectra of the five
measures conducted
for the BB1, BK1, LB63
and LK74 samples,
respectively.
198
European Police Science and Research Bulletin · Issue 16 · Summer 2017
Database
The collection of the 167 inks led to the creation of an absorption spectra database. The dif-
ferent types of collected ink allowed the construction of libraries according to the physical
(ink morphology) and spectral characteristics of each ink. The average spectrum, obtained
from five spectra for each of those inks, was added to the appropriate library. This procedure
leads to the creation of eight libraries, including: Ballpoint pen blue ink — code BBn, Ballpoint
pen black ink — code BKn, Liquid (rollerball/gel) pen blue ink — code LBn, Liquid (rollerball/gel)
pen black ink — code LKn, Felt-tipped pen blue ink — code FBn, Felt-tipped pen black ink —
code FKn, Fountain pen blue ink — code FOBn and Fountain pen black ink — code FOKn.
To further validate the generated database libraries, i.e. if they are functional, a preliminary
test with 22 blind samples (knowing that 14 were already entered in the database and the
remaining eight were not) taken on white printing paper (80 g/m2, A4, Inacopia office®) was
made. This set of samples is composed of writing instruments inks of blue (9) and black (13)
colour. In order to have the preliminary test as close as possible to a practical case, it was
initially assumed that all samples were unknown (considered blind samples). With the aid of
optical microscopy (e.g. magnifying lens), a pre-selection of the type of ink present on each
sample was made, thus facilitating the choice of the most appropriate library. Out of the 22
samples, 13 have been correctly identified. The remaining nine were totally unknown and
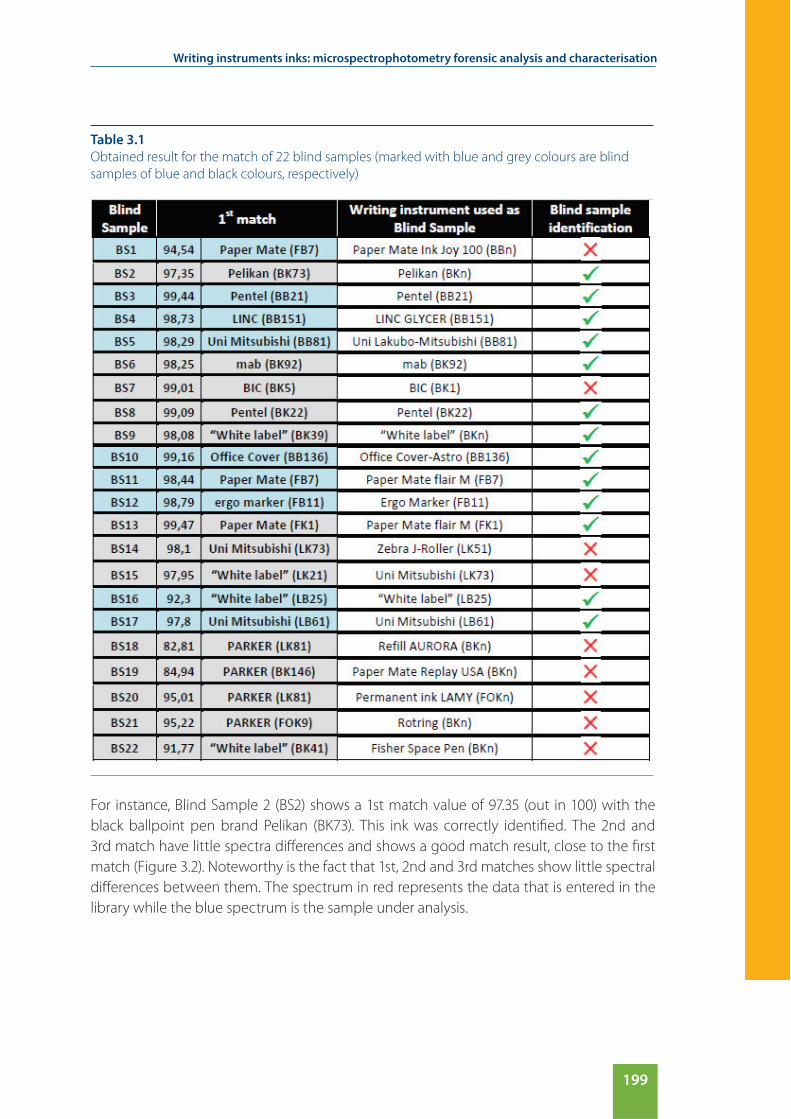
have been added to the generated libraries after analyses. Table 3.1 summarises the results
for the 22 blind samples.
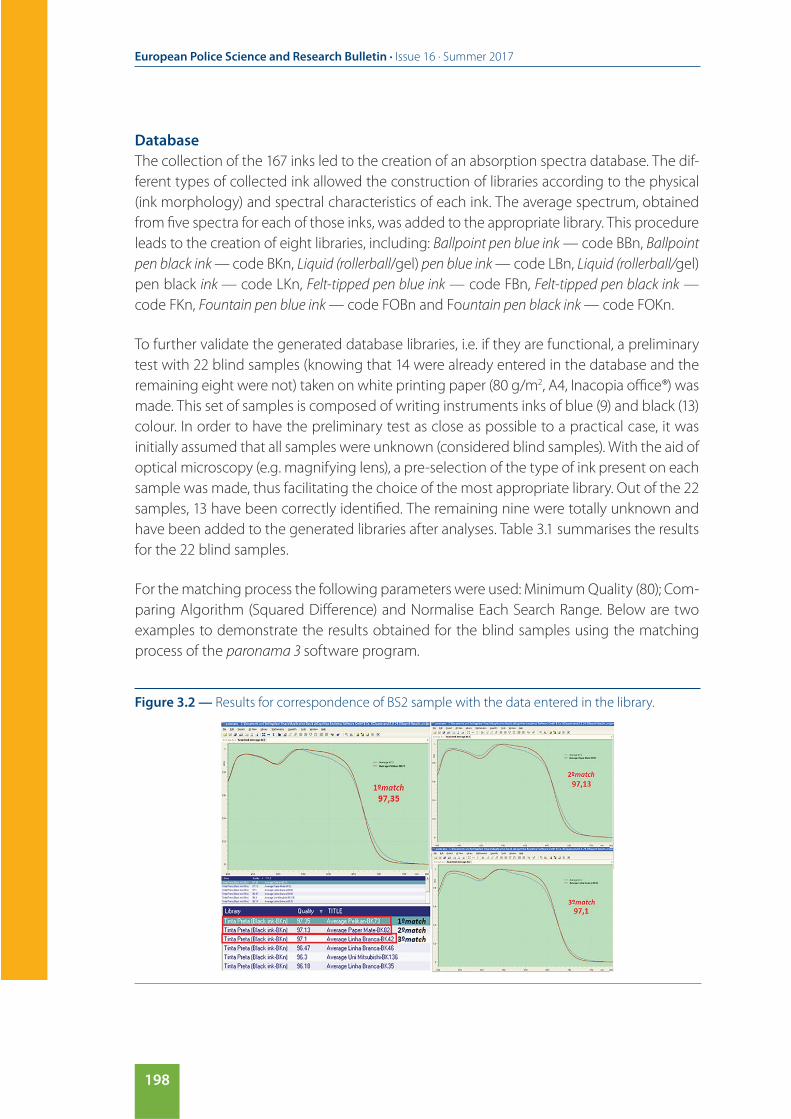
For the matching process the following parameters were used: Minimum Quality (80); Com-
paring Algorithm (Squared Difference) and Normalise Each Search Range. Below are two
examples to demonstrate the results obtained for the blind samples using the matching
process of the paronama 3 software program.
Figure 3.2 — Results for correspondence of BS2 sample with the data entered in the library.
Writing instruments inks: microspectrophotometry forensic analysis and characterisation
199
For instance, Blind Sample 2 (BS2) shows a 1st match value of 97.35 (out in 100) with the
black ballpoint pen brand Pelikan (BK73). This ink was correctly identified. The 2nd and
3rd match have little spectra differences and shows a good match result, close to the first
match (Figure 3.2). Noteworthy is the fact that 1st, 2nd and 3rd matches show little spectral
differences between them. The spectrum in red represents the data that is entered in the
library while the blue spectrum is the sample under analysis.
Table 3.1
Obtained result for the match of 22 blind samples (marked with blue and grey colours are blind
samples of blue and black colours, respectively)
200
European Police Science and Research Bulletin · Issue 16 · Summer 2017
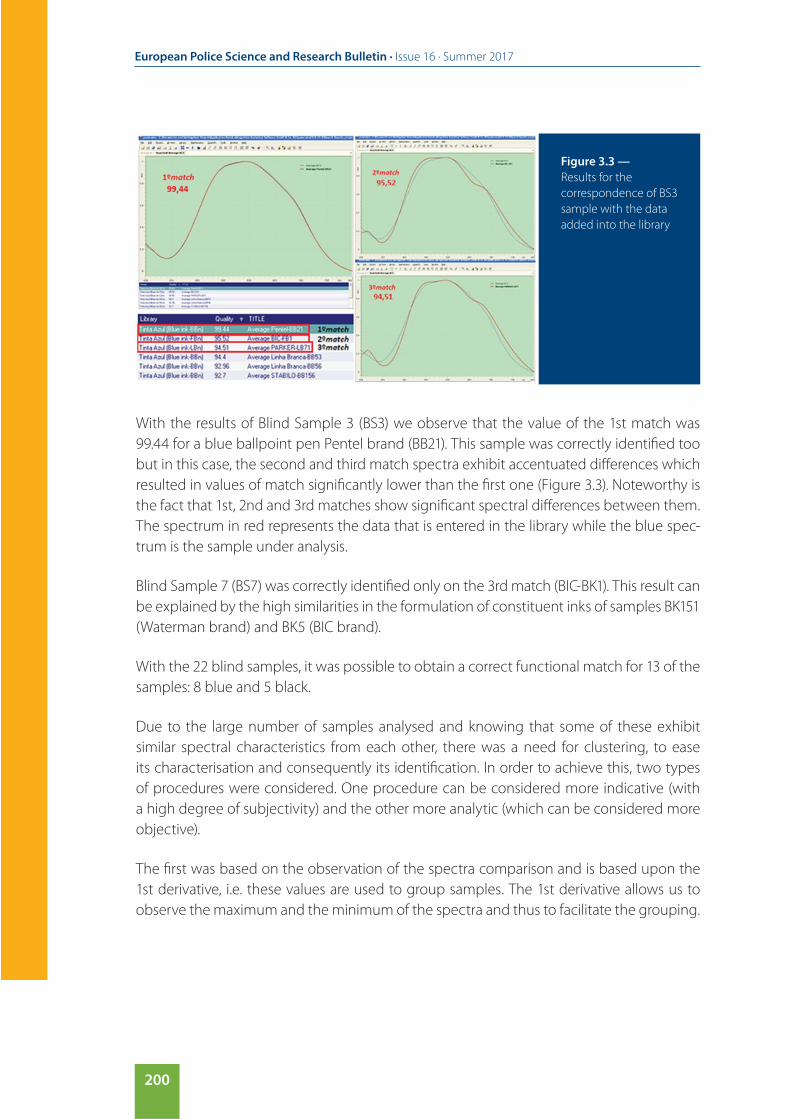
With the results of Blind Sample 3 (BS3) we observe that the value of the 1st match was
99.44 for a blue ballpoint pen Pentel brand (BB21). This sample was correctly identified too
but in this case, the second and third match spectra exhibit accentuated differences which
resulted in values of match significantly lower than the first one (Figure 3.3). Noteworthy is
the fact that 1st, 2nd and 3rd matches show significant spectral differences between them.
The spectrum in red represents the data that is entered in the library while the blue spec-
trum is the sample under analysis.
Blind Sample 7 (BS7) was correctly identified only on the 3rd match (BIC-BK1). This result can
be explained by the high similarities in the formulation of constituent inks of samples BK151
(Waterman brand) and BK5 (BIC brand).
With the 22 blind samples, it was possible to obtain a correct functional match for 13 of the
samples: 8 blue and 5 black.
Due to the large number of samples analysed and knowing that some of these exhibit
similar spectral characteristics from each other, there was a need for clustering, to ease
its characterisation and consequently its identification. In order to achieve this, two types
of procedures were considered. One procedure can be considered more indicative (with
a high degree of subjectivity) and the other more analytic (which can be considered more
objective).
The first was based on the observation of the spectra comparison and is based upon the
1st derivative, i.e. these values are used to group samples. The 1st derivative allows us to
observe the maximum and the minimum of the spectra and thus to facilitate the grouping.
Figure 3.3 —
Results for the
correspondence of BS3
sample with the data
added into the library
Writing instruments inks: microspectrophotometry forensic analysis and characterisation
201
This process is considered to have a high dose of subjectivity because it strongly depends
on the observer and its degree of subjectivity. The second process should be considered
more objective because it uses a multivariate analysis: hierarchical cluster analysis (HCA).
This method allows testing how a set of elements relates to each other, and how they are
similar according to the variables used.
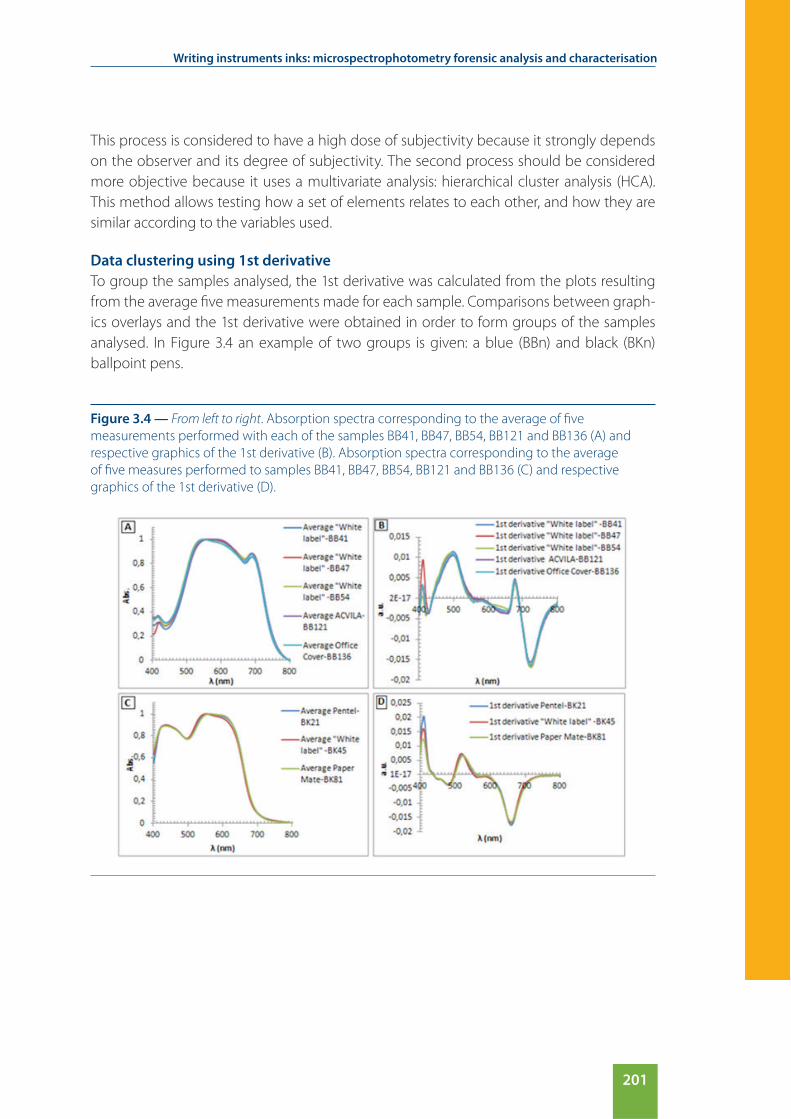
Data clustering using 1st derivative
To group the samples analysed, the 1st derivative was calculated from the plots resulting
from the average five measurements made for each sample. Comparisons between graph-
ics overlays and the 1st derivative were obtained in order to form groups of the samples
analysed. In Figure 3.4 an example of two groups is given: a blue (BBn) and black (BKn)
ballpoint pens.
Figure 3.4 — From left to right. Absorption spectra corresponding to the average of five
measurements performed with each of the samples BB41, BB47, BB54, BB121 and BB136 (A) and
respective graphics of the 1st derivative (B). Absorption spectra corresponding to the average
of five measures performed to samples BB41, BB47, BB54, BB121 and BB136 (C) and respective
graphics of the 1st derivative (D).

202
European Police Science and Research Bulletin · Issue 16 · Summer 2017
In general, certain groups could be created using the graphic overlay of the 1st derivative
of the samples. In Table 3.2 the number of generated groups and respective number of
samples per group is summarised.
The association into these types of groups (solely based on the overlapping of the graphs
of the 1st derivative) reveals that microspectrophotometry may be considered an excel-
lent non-destructive technique for ink differentiation. The problem is that when there are
a large number of samples to analyse, this grouping becomes insufficient, making this type
of analysis impractical, since this is done manually. Therefore, it is necessary to use another
type of analysis in order to be able to associate all the samples analysed in groups. To do
this, we have used the hierarchical cluster analysis (HCA).
Table 3.2
Number of groups formed using the superposition of the graphics 1st derivative,
taking into account the number of available samples for each type of ink
Writing instruments Groups Samples Number of samples per group (G1 to G26)
Ballpoint pens
Blue ink 26 562, 3, 1, 3, 1, 3, 1, 3, 2, 2, 4, 2, 5, 2, 2, 1, 1, 3, 2, 5, 2, 1, 2, 1, 1,1
Black ink 26 5513, 2, 2, 3, 3, 1, 3, 3, 2, 2, 2, 1, 2, 1, 1, 1, 1, 2, 1, 2, 2, 1, 1, 1, 1,1
Liquid ink pens
Rollerball and gel blue ink 12 17 5, 1, 1, 1, 2, 1, 1, 1, 1, 1, 1, 1
Rollerball and gel black ink 5 17 13, 1, 1, 1, 1
Felt blue ink 5 5 1, 1, 1, 1, 1
Felt black ink 4 5 1, 2, 1, 1
Fountain blue ink 2 2 1, 1
Fountain black ink 7 10 2, 3, 1, 1, 1, 1,1
Data clustering using hierarchical cluster analysis (HCA)
The formation of groups using hierarchical cluster analysis (HCA) was already explained. For
each set of data (BBn, BKn, LBn, LKn, FBn, FKn, FOKn) there is a dendrogram in which each
object is represented by the sample code. As an example, for the blue ballpoint pens, the
following brands were grouped in the following three groups (Figure 3.5).

Writing instruments inks: microspectrophotometry forensic analysis and characterisation
203
Figure 3.5 — Dendrogram constructed by hierarchical clustering (Ward binding method) on
the data set of 56 samples ballpoint pen ink of blue colour (BBn) (1). Different colours are used to
represent the groups formed according to their similarities. Each formed group is represented by
two sub-groups (i) and (ii).
According to the dendrogram shown in Figure 3.5, for the ballpoint pens of blue (BBn)
there are three major groups: Group I (blue): Molin, Pelikan, RTC, Paper Mate, ‘White label’,
Uni Mitsubishi Pencil, Pentel, A.G.SPALDING BROS and BIC. Group II (green): WATERMAN, BIC,
‘White label’, ACVILA; BIC and Office Cover. Group III (red): Corvina, ‘White label’, Lecce Pen,
STABILO, LINC, Reynolds, Pentel and RTC.
For black ballpoint pens there are also three major groups: Group I (PARKER, RTC, BROS AG-
SPALDING, Pentel, Mitsubishi Pencil Uni, Paper Mate, ‘White label’ BIC Epene, and Pelikan);
Group II (Fisher Space Pen, PLUS B-2, Pelikan, BIC, Epene, Paper Mate, ‘White label’ Rotring,
Office Cover, WATERMAN, Pentel, Fegol); Group III (MONTE LEMA, Pelikan, AURORA, Unix,
mab, ‘White label’ Uni Mitsubishi Pencil, BIC, Q-CONNECT).
(1) There are cases in which the same brand appears in different groups (examples: RTC, Pentel, Bic, ‘White
label’); this is because the analyses were made with different models for each brand.
204
European Police Science and Research Bulletin · Issue 16 · Summer 2017
Blue rollerball and gel pens have five major groups: Group I (‘White label’, BIC, Paper Mate
and Uni Mitsubishi Pencil); Group II (‘White label’); Group III (PARKER, PILOT and ‘White label’);
Group IV (‘White label’); Group V (Pentel). For black rollerball and gel pens have four major
groups: Group I (PARKER); Group II (Uni Mitsubishi Pencil); Group III (‘White label’, BIC, Uni Mit-
subishi Pencil, Pentel); Group IV (‘White label’, Uni Mitsubishi Pencil, PILOT, ZEBRA, STAEDTLER).
Blue felt-tip pens have two major groups: Group I (‘White label’, ergo marker, Paper Mate);
Group II (Paper Mate, BIC). For black felt-tip pens exists two major groups: Group I (‘White
label’, Rotring); Group II (‘White label’, Paper Mate).
Black colours fountain pens have four major groups: Group I (Pelikan, LAMY, MONT BLANC);
Group II (HERO); Group III (AURORA, CROSS, WATERMAN, PARKER); Group IV (Pelikan). The
two blue Fountain pen (Hero and Pelikan brand) were not submitted to HCA analysis.
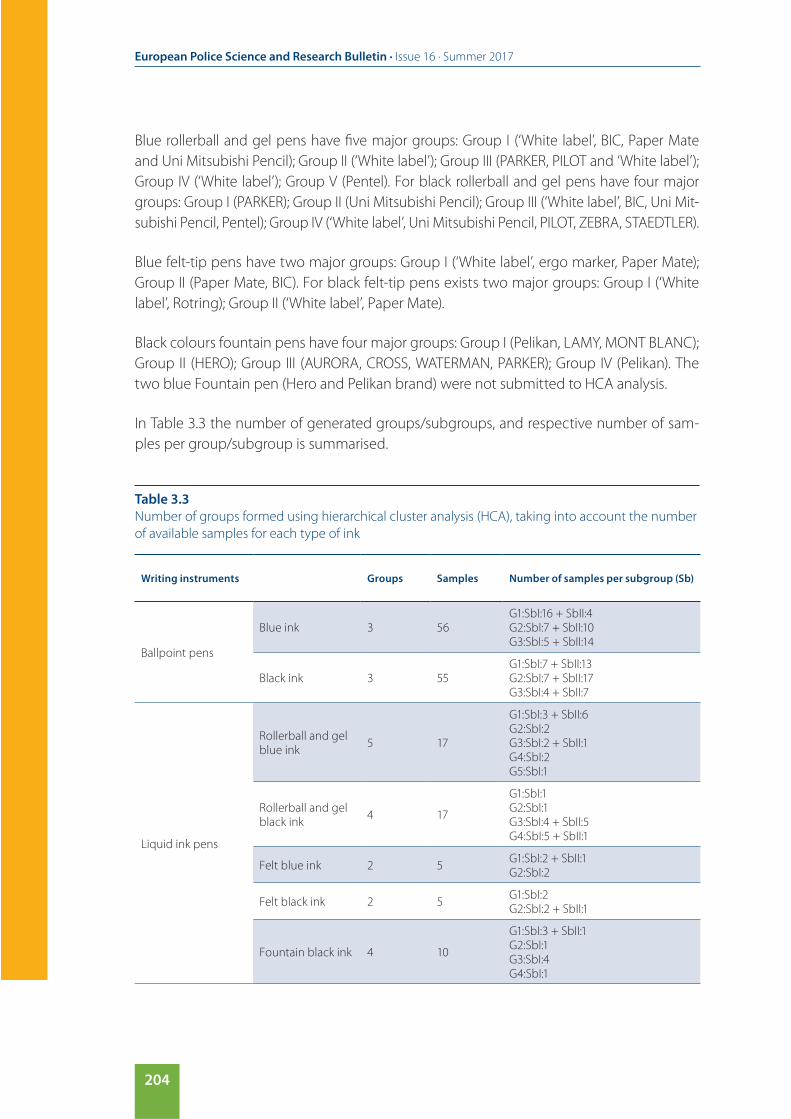
In Table 3.3 the number of generated groups/subgroups, and respective number of sam-
ples per group/subgroup is summarised.
Table 3.3
Number of groups formed using hierarchical cluster analysis (HCA), taking into account the number
of available samples for each type of ink
Writing instruments Groups Samples Number of samples per subgroup (Sb)
Ballpoint pens
Blue ink 3 56G1:SbI:16 + SbII:4G2:SbI:7 + SbII:10G3:SbI:5 + SbII:14
Black ink 3 55G1:SbI:7 + SbII:13G2:SbI:7 + SbII:17G3:SbI:4 + SbII:7
Liquid ink pens
Rollerball and gel blue ink
5 17
G1:SbI:3 + SbII:6G2:SbI:2G3:SbI:2 + SbII:1G4:SbI:2G5:SbI:1
Rollerball and gel black ink
4 17
G1:SbI:1G2:SbI:1G3:SbI:4 + SbII:5G4:SbI:5 + SbII:1
Felt blue ink 2 5G1:SbI:2 + SbII:1G2:SbI:2
Felt black ink 2 5G1:SbI:2G2:SbI:2 + SbII:1
Fountain black ink 4 10
G1:SbI:3 + SbII:1G2:SbI:1G3:SbI:4G4:SbI:1
Writing instruments inks: microspectrophotometry forensic analysis and characterisation
205
The HCA data analysis suggests that for the blue ballpoint pens, black rollerball and gel
pens, black and blue felt tip pens and fountain pens, there is no brand with more than one
model found in the same group. In the black ballpoint pens, the mab brand appears in the
same group and sub-group, and the same happens with the blue rollerball and gel pens
from the Uni Mitsubishi Pencil brand.
Discriminating power
The analysed ink samples were grouped in two different ways by visual comparison through
the superimposition of the absorption spectra and their respective first derivatives and by
the application of a hierarchical cluster analysis (HCA) statistical method. In order to evaluate
the discriminating power of microspectrophotometry, several authors used discriminating
power (DP) according to the work developed by Smalldon and Moffat (Smalldon et al., 1973).
The discriminating power (DP) is defined as the ‘probability that two distinct samples se-
lected at random from the parent population would be discriminated in at least one at-
tribute if the series of attributes were determined’ and is calculated using the formula DP
= 1 – [(Number of discriminated pairs)/(Number of possible sample pairs)] (Smalldon et al.,
1973). The number of possible pairs is calculated using the formula [n (n-1)]/2, where n is
the total number of samples. For example, in the qualitative analysis of blue ballpoint inks
we have [56 (56-1)]/2 = 1 540 possible pairs of compared samples. For this class of inks the
qualitative analysis of the results obtained with this technique has a power of discrimination
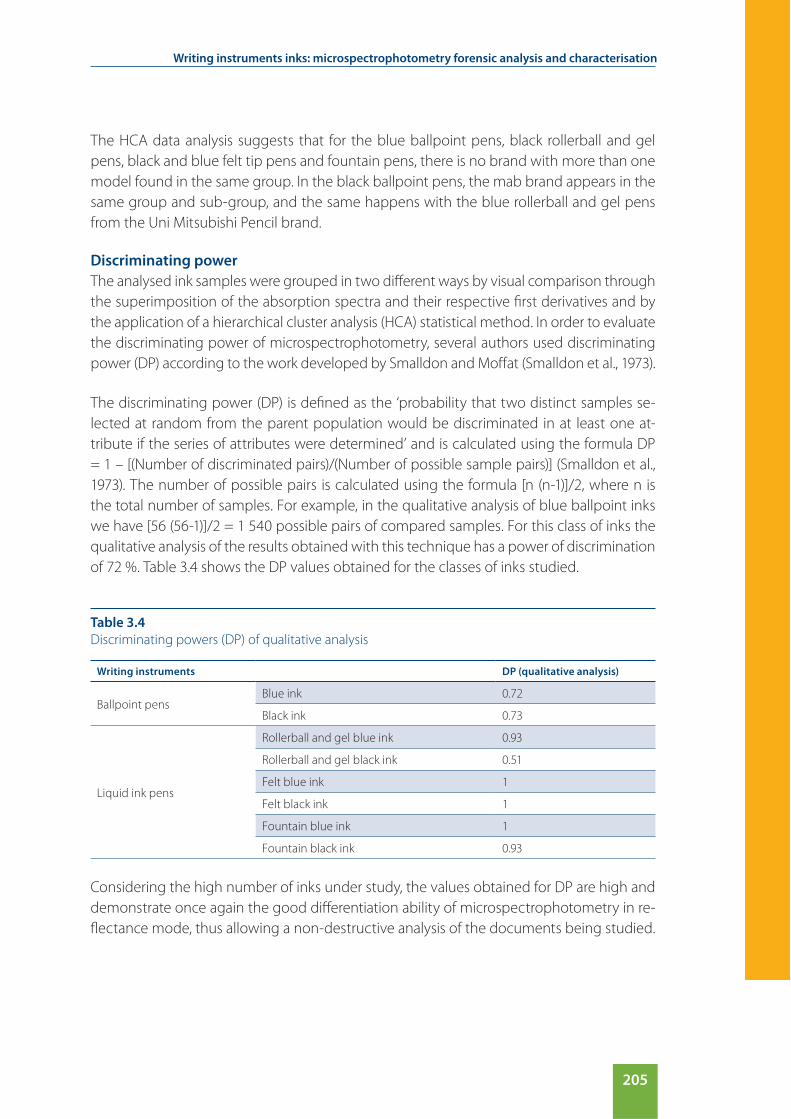
of 72 %. Table 3.4 shows the DP values obtained for the classes of inks studied.
Table 3.4
Discriminating powers (DP) of qualitative analysis
Writing instruments DP (qualitative analysis)
Ballpoint pensBlue ink 0.72
Black ink 0.73
Liquid ink pens
Rollerball and gel blue ink 0.93
Rollerball and gel black ink 0.51
Felt blue ink 1
Felt black ink 1
Fountain blue ink 1
Fountain black ink 0.93
Considering the high number of inks under study, the values obtained for DP are high and
demonstrate once again the good differentiation ability of microspectrophotometry in re-
flectance mode, thus allowing a non-destructive analysis of the documents being studied.

206
European Police Science and Research Bulletin · Issue 16 · Summer 2017
Totty et al., 1985, obtained a DP of 0.86 for black inks and 0.84 for a total of 16 blue inks.
These inks were taken from porous tip pens and spectras were obtained in transmission
mode in the visible region. Roux, et al., 1999, obtained DP of 0.83 to both 49 blue and 42
black ballpoint pen inks with the Olympus microspectrophotometer in reflection mode.
More recently, Causin, V. et al., 2008, obtained a DP value of 0.96 for the 21 black ballpoint
pen inks and 0.79 for the 12 blue ones. In this study, the spectra were obtained in the trans-
mission mode in the UV-VIS region. The microspectrophotometry system used in our study
and the differentiation of spectra in a visual form allows the obtaining of a good DP, howev-
er the different modes of acquisition and different types of pens used in the previous stud-
ies do not allow a linear comparison for all class of inks. The final result of the differentiation
using this statistical method should always be obtained based on the last subgroups (and
not the first ones); however this result should always be validated by the forensic expert.
Conclusions
The identification and dating of writing inks remain a major challenge in the forensic exami-
nation of questionable documents. Given the need to increasingly provide relevant informa-
tion to our justice system, we explore and develop techniques and methodologies to gener-
ate forensic intelligence. Microspectrophotometry is undoubtedly a very effective technique
to differentiate inks. This study demonstrated a wide applicability in terms of ink writing
instruments and its high discrimination power for the different type of inks in analysis.
The 167 analysed ink samples were grouped into 87 distinct groups by overlapping the
spectra of the 1st derivative and 37 groups using a hierarchical clustering analysis (HCA).
Despite the HCA analysis showing a smaller number of groups, this type of chemometric
method provides us with a sophisticated and efficient approach to differentiate ink samples
essential when we have a large number of samples to compare.
The creation of the database constitutes a way to provide a list of inks with the same spec-
tral characteristics as the analysed sample, however these groups show that different ink
brands have similar spectral characteristics. This is an ongoing work, whose subsequent
steps will (i) increase the number of samples analysed, (ii) analyse through HPLC and HPTLC
all the inks to establish a more powerful database, (iii) add other variables to HCA method,
(iv) another chemometric algorithms.
Acknowledgments
JSSM thanks the Fundação para a Ciência e Tecnologia (Portugal) and FEDER-COMPETE for fi-
nancial support through the Coimbra Chemistry Centre (project PEst-OE/QUI/UI0313/2014).
Dr. Catherine de Castro, Msc Tânia Cova and Prof. Alberto Canelas Pais are kindly acknowl-
edged for the support with the hierarchical cluster analysis (HCA).
Writing instruments inks: microspectrophotometry forensic analysis and characterisation
207
References
• Andrasko, J. (2002), Changes in Composition of Ballpoint Pen Inks on Aging in Darkness, Journal of Forensic
Sciences, 47(2), 324-327.
• Brunelle, R. L. and Crawford, K. R. (2003), Advances in the Forensic Analysis and Dating of Writing Ink, Charles
Thomas Publisher, Ltd.
• Ellen, D. (1997), The scientific examination of questioned documents. Methods and techniques, London: Taylor and
Francis.
• Causin, V. et al. (2008), The Discrimination Potential of Ultraviolet-Visible Spectrophotometry, Thin Layer
Chromatography, and Fourier Transform Infrared Spectroscopy for the Forensic Analysis of Black and Blue
Ballpoint Inks, Journal of Forensic Science, 53(6), 1468-1473.
• Ezcurra, M., Góngora, J. M., Maguregui, I. and Alonso, R. (2010), Analytical methods for dating modern writing
instrument inks on paper, Forensic Science International, 197, 1-20.
• Hammond, D. L. (2013), Overview of Forensic Document Examination, In: Siegel, J. A. and Saukko, P. J. (Eds.),
Encyclopedia of Forensic Sciences (2nd ed.), pp. 391-394, Elsevier Ltd.
• Kaufman, L. and Rousseeuw, P. J. (1990), Finding Groups in Data: An Introduction to Cluster Analysis, New York:
Wiley.
• Li, B. (2016), An Examination of the Sequence of Intersecting Lines using Microspectrophotometry, Journal of
Forensic Science, 61(3), 809-814.
• Martin, P. and Eyring, M. (2014), Microspectrophotometry, Experimental Methods in the Physical Sciences, 46,
489-517.
• Martyna, A., Lucy, D., Zadora, G. et al. (2013), The evidential value of microspectrophotometry measurements
made for pen inks, Analytical Methods, 5(23), 6788-6795.
• Mendlein, A., Szkudlarek, C. and Goodpaster, J. (2013), Chemometrics, In: Siegel, J. and Saukko, P.. Encyclopedia
of Forensic Sciences (2nd ed), pp. 646-651, Elsevier Ltd.
• Neumann, C., Ramotowski, R. and Genessay, T. (2011), Forensic examination of ink by high-performance thin
layer chromatography — the United States Secret Service Digital Ink Library, Journal of Chromatography A,
1218(19), 2793-2811.
• Pfefferli, P. W. (1983), Application of Microspectrophotometry in Document Examination, Forensic Science
International, 23, 129-136.
• Roux, C., Novotny, M., Evans, I. and Lennard, C. (1999), A study to investigate the evidential value of blue and
black ballpoint pen inks in Australia, Forensic Science International, 101, 267-176.
• Seipp, U. (1997), Applications of UV/VIS-Microspectrophotometry and microspectrofluorimetry in document
examination, International Journal of Forensic Document Examiners, 3, 14-30.
• Smalldon, K. W. and Moffat, A. C. (1973), The calculation of discriminating power for a series of correlated
attributes, Journal of the Forensic Science Society, 13(4), 291-295.
• Totty, R. N., Ordidge, M. R. and Onion, L. J. (1985), A comparison of the use of visible microspectrometry and
high performance thin layer chromatography for the discrimination of aqueous inks used in porous tip and
roller ball pens, Forensic Science International, 28, 137-144.
• Wu, J., Mo, C. and Gan, G. (2007), Data Clustering: Theory, Algorithms and Applications, siam.
• Zi ba-Palus, J. (2006), Microspectrophotometry in Forensic Science, In: Encyclopedia of Analytical Chemistry,
John Wiley & Sons, Ltd.
• Zi ba-Palus, J. and Trzcinska, B. (2012), Comparing the color of forensic traces, Analytical Letters, 45, 1333-1346.