Embed Size (px)
Citation preview
WRITTEN EXAMINATIONS FOR THE MASTER OF SCIENCE DEGREE
in the
Department of BiostatisticsSchool of Public Health
University of North Carolina at Chapel Hill
assembled and edited byDANA QUADE
Institute of Statistics Mimeo Series No. 1465
First edition: September 1984Second edition: January 1988
WRITTEN EXAMINATIONS
for the degree
MASTER OF SCIENCE
in the
DEPARTMENT OF BIOSTATISTICS
School of Public Health
University of North Carolina at Chapel Hill
assembled and edited by
DANA QUADE
First edition: September 1984
Second edition: January 1988

TABLE OF CONTENTS
Page
Introduction 1
12 April 1980 4
11-12 April 1981 12
3-4 April 1982 19
29 May 1982 ("Special offer", Part II only) 28
15-16 January 1983 29
9-10 April 1984 ("Special") 40
21-22 January 1984 49
15 April 1984 (Part II only) 58
26-27 January 1985 66
13-14 April 1985 ("Special") 76e 18-19 January 1986 84
12-13 April 1986 ("Special") 92
14-15 March 1987 98
7-8 May 1987 108
INTRODUCTION
This publication contains the written examinations which the Department
of Biostatistics has set for candidates for the degree Master of Science
(MS), beginning in 1980. Prior to that time, MS candidates took the "Basic
Doctoral Written Examination" as their Master's Written Examination, although
the standard for acceptable performance was set lower for them than for
doctoral candidates. (Copies of the Basic Examination are available in
the Institute of Statistics Mimeo Series as Issues #1343: Closed-book Parts
and #1344: Take-home Parts.) The Departmental Examinations Committee
prepares and conducts all Department-wide written examinations, and arranges
for their grading.
During the years 1980 through 1982 the MS examination consisted of
two Parts, Part I being closed-book, and Part II open-book. Each Part
~ consisted of 5 questions, of which #4 and #5 were considered more difficult
than the others; the MS candidate was expected to answer 3 of the 5 questions,
within a period of 3 hours. (MPH and MSPH candidates took the same examination,
but under more lenient rules; see Mimeo Series #1329.)
Beginning in 1983 the MS examination has been entirely separate.
There are two Parts: Part I (Theory) is closed-book, and Part II (Applications)
is open- book. In each part there are 4 questions, of which the candidate
is to answer 3. The time limit was originally set at 3 hours for each
Part; but, starting in 1985, 4 hours are now allowed for Part II. This
examination is given each Spring. Special re-examinations for the MS have
been combined with the MPH examination later in the year, however, and
these have been conducted under different rules; see the copies of the
examiaations which follow.
•
-2-
A team of two graders is appointed for each question. Where
possible, all graders are members of the Department of Biostatistics and
of the Graduate Faculty, and no individual serves on more than one team
for the same examination (the two Parts counting separately in this con
text). The members of each grading team prepare for their question an
"official answer" covering at least the key points. They agree before
hand on the maximum score possible for each component, the total for any
question being 25. The papers are coded so that the graders are unaware
of the candidates' identities, and each candidate's answer is marked
independently by each of the two graders. The score awarded reflects the
effective proportion correctly answered of the question. The two graders
then meet together and attempt to clear up any major discrepancies between
their scores. Their joint report may include comments on serious short
comings in any candidate's answer.
On the basis of a condidate's total score on a paper, the Examinations
Committee recommends to the faculty whether the candidate is to be passed,
failed, or passed conditionally. In the last case, the condition is spec
ified, together with a time limit. All final decisions are by vote of the
faculty. Examination papers are not identified as to candidate until after
the verdicts of PASS and FAIL have been rendered. Once the decisions have
been made, advisors are free to tell their students unofficially; the
official notification, however, is by letter from the Chairman of the
Examinations Committee. Actual scores are never released, but the "official
answers" are made public, and candidates who are not passed unconditionally
are permitted to see the graders' comments on their papers. A candidate
whose performance is not of the standard required may be reexamined at
-3-
the next regularly scheduled examination, or at an earlier date set by
the Examinations Committee. One reexamination is pE~rmitted automatically.
Candidates whose native language is not English are not to be allowed
extra time on Department-wide (not individual COUrSE!) examinations. This
condition may be waived for individual candidates at: the discretion of the
Department Chairman upon petition by the candidate at least one week prior
to the examination.
NOTE. Most of what follows reproduces the examinations exactly as they
were originally set; however, minor editorial changes and corrections
have been made, particularly in order to SaVE! space.
-4-
BASIC MASTER LEVEL WRITTEN EXAMINATION IN BIOSTATISTICS
PART I
(April 12, 1980)
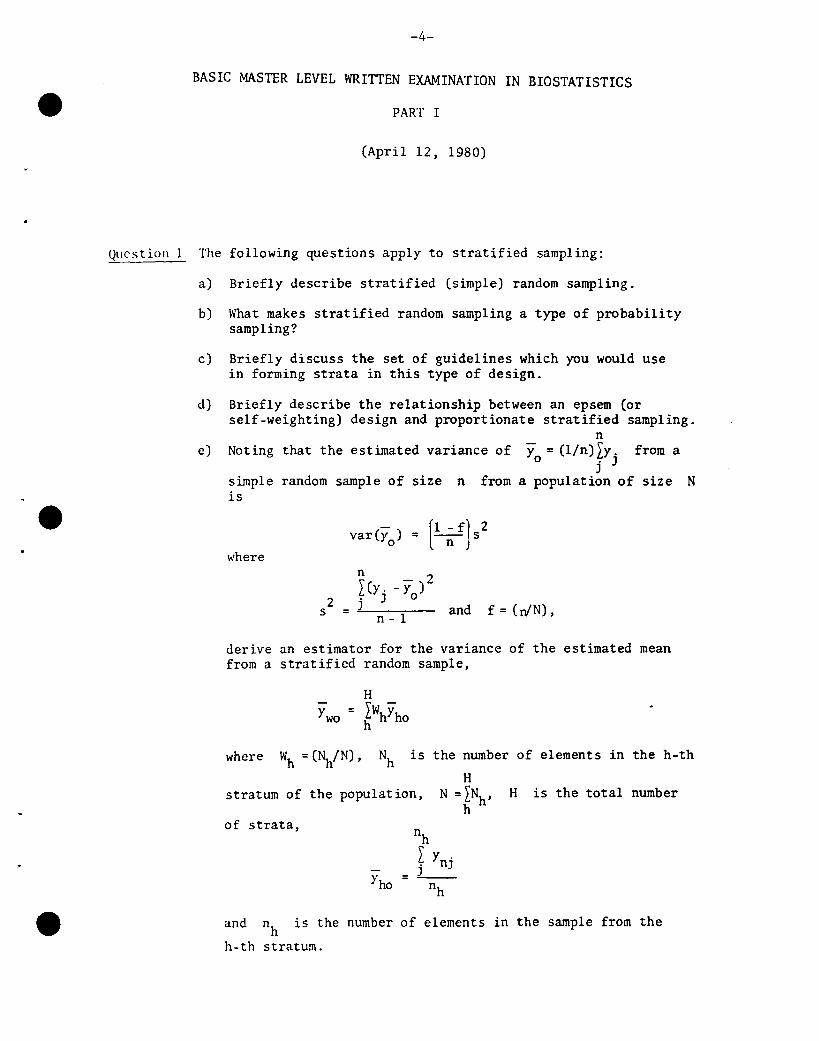
Question 1 The following questions apply to stratified sampling:
a)
b)
c)
d)
e)
Briefly describe stratified (simple) random sampling.
What makes stratified random sampling a type of probabilitysampling?
Briefly discuss the set of guidelines which you would usein forming strata in this type of design.
Briefly describe the relationship between an epsem (orself-weighting) design and proportionate stratified sampling.
nNoting that the estimated variance of y = (lin) LY. from a
o j J
simple random sample of size n from a population of size Nis
- fl - f) 2var(yo) = l-n- swhere
and f = (rv'N),
derive an estimator for the variance of the estimated meanfrom a stratified random sample,
where Wh = (Nh/N), Nh is the number of elements in the h-th
Hstratum of the population, N =LNh , H is the total number
hof strata,
and nh
is the number of elements in the sample from the
h-th stratum.
"-5-
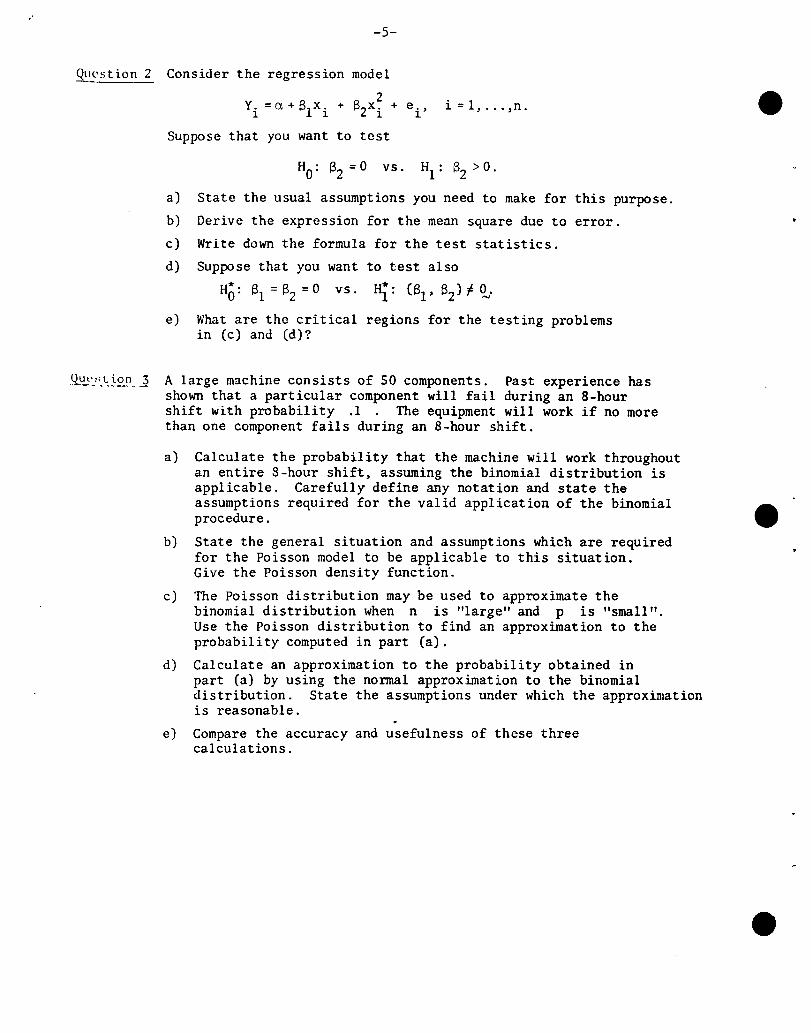
Qlwstio~ Consider the regression model
Y. =a. + SIX.2
+ B2xi + e. ,1 1 1
Suppose that you want to test
i=l, ... ,n.
HO: 82 = 0 vs. HI: 82 > O.
a) State the usual assumptions you need to make for this purpose.
b) Derive the expression for the mean square due to error.
c) Write down the formula for the test statistics.
d) Suppose that you want to test also
HO: 131 = 132 =0 vs. Hi: (131' 132) F Cl,.
e) What are the critical regions for the t1esting problemsin Cc) and Cd)?
~~~~io~-l A large machine consists of 50 components. Past experience hasshown that a particular component will fail during an 8-hourshift with probability .1 . The equipment will work if no morethan one component fails during an 8-hour shift.
a) Calculate the probability that the machine will work throughoutan entire 8-hour shift, assuming the binomial distribution isapplicable. Carefully define any notation and state theassumptions required for the valid application of the binomial aprocedure. •
b) State the general situation and assumptions which are requiredfor the Poisson model to be applicable to this situation.Give the Poisson density function.
c) The Poisson distribution may be used to approximate thebinomial distribution when n is "largE~" and p is "small".Use the Poisson distribution to find an approximation to theprobability computed in part (a).
d) Calculate an approximation to the probability obtained inpart (a) by using the normal approximation to the binomialdistribution. State the assumptions under which the approximationis reasonable.
e) Compare the accuracy and usefulness of these threecalculations.
-6-
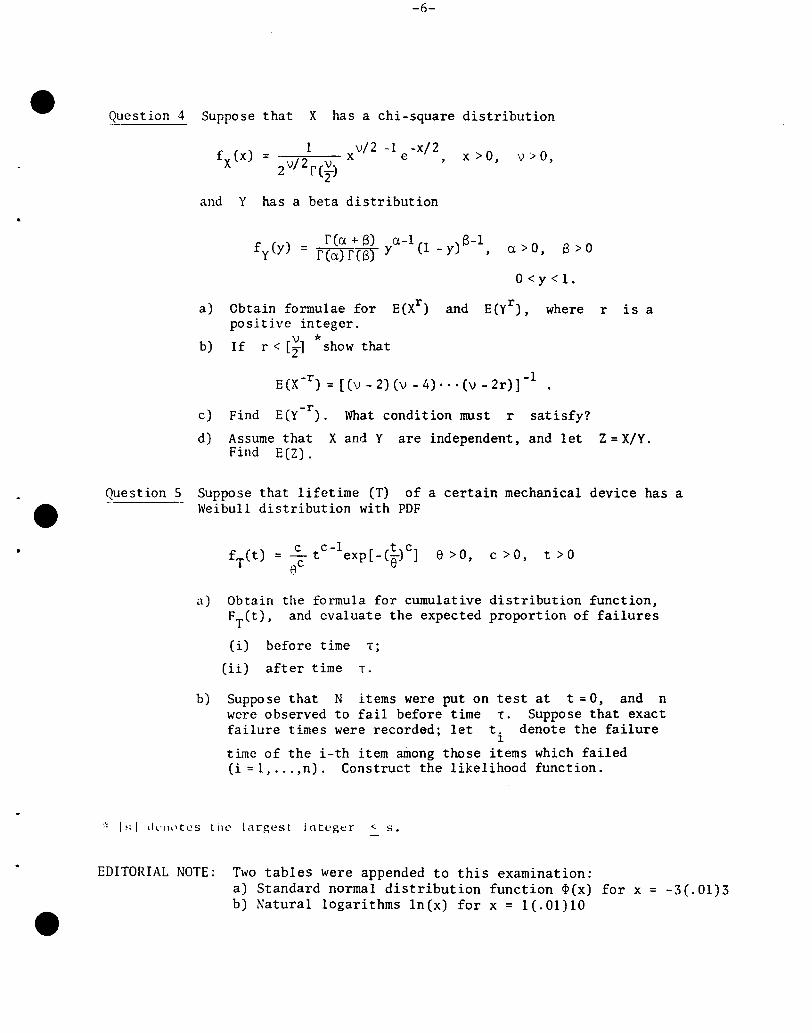
Question 4 Suppose that X has a chi-square distribution
and Y has a beta distribution
x > 0, v > 0,
f (a + 13) a.-I 13-1fy(Y) = f(a.)rW Y (1 -y) , a. >0, B >0
O<y<l.
a)
b)
Obtain formulae for E(Xr )positive integer.
\) *If r < [2] show that
where r is a
-r -1E(X ) = [(v - 2) (v - 4) .. · (v - 2r)]
c) Find E(y-r). What condition must r satisfy?
d) Assume that X and Yare independent, and let Z = X/Y.Find E(Z).
Question 5 Suppose that lifetime (T) of a certain mechanical device has aWeibull distribution with PDF
c c-l t cf (t) = - t exp [ - (-)] e > 0, C > 0, t > 0T fl e
a) Obtain the formula for cumulative distribution function,FTCt), and evaluate the expected proportion of failures
(i) before time T;
Cii) after time T.
b) Suppose that N items were put on test at t = 0, and nwere observed to fail before time T. Suppose that exactfailure times were recorded; let t. denote the failure
1.
time of the i-th item among those items which failedCi = 1, ... ,n). Construct the likelihood function.
EDITORIAL NOTE: Two tables were appended to this examination:a) Standard normal distribution function ~(x) for x = -3(.01)3b) Natural logarithms In(x) for x = 1(.01)10
-7-
BASIC MASTER LEVEL WRITTEN E~~INATION IN BIOSTATISTICS
PART II
(Ap=il 12, 1980)
M.P.H. and M.S.P.H. students are to answer any two questionsduring the two-hour period (1 pm - 3 pm). M.S. studentsare to answer three questions of which not more than 2should be from Section A - time period 1 pm - 4 pm
You are required to answer on~y wh~t is asked in thequestions and not att you know about the topics.
Q~~_c5tio..n_I A survey of 320 families, each with 5 children, revealed thefollowing distribution:
No. of girls
No. of famil ies
o
18
1
56
2
110
3
88
4
40
5
8
Total
320
a) Is the result consistent with the hypothesis that male andfemale births are equally probable?
Test this hypothesis at the significance level Ct = 0.05,Ci = 0.01
b) I~at is the maximum likelihood estimate of the probabilityof a female birth?
-8-
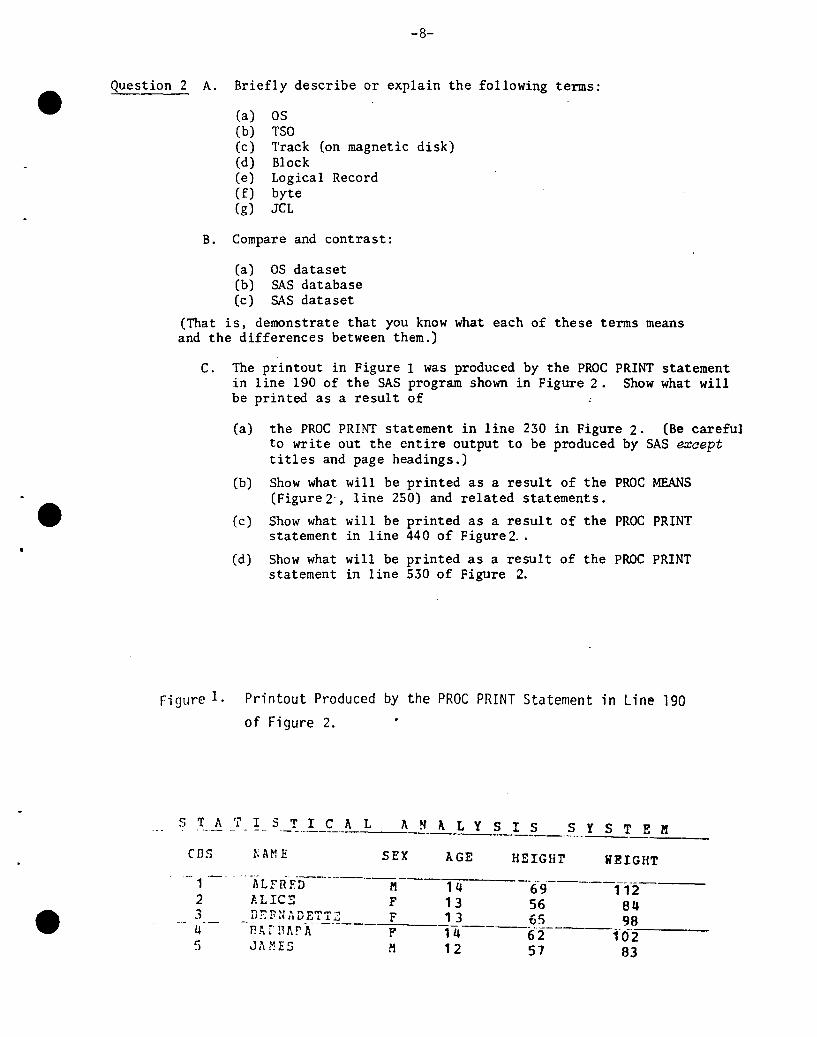
Question 2 A. Briefly describe or explain the following terms:
(a) OS(b) 1'50(c) Track (on magnetic disk)(d) Block(e) Logical Record(f) byte(g) JCL
B. Compare and contrast:
(a) OS dataset(b) SAS database(c) SAS dataset
(That is, demonstrate that you know what each of these terms meansand the differences between them.)
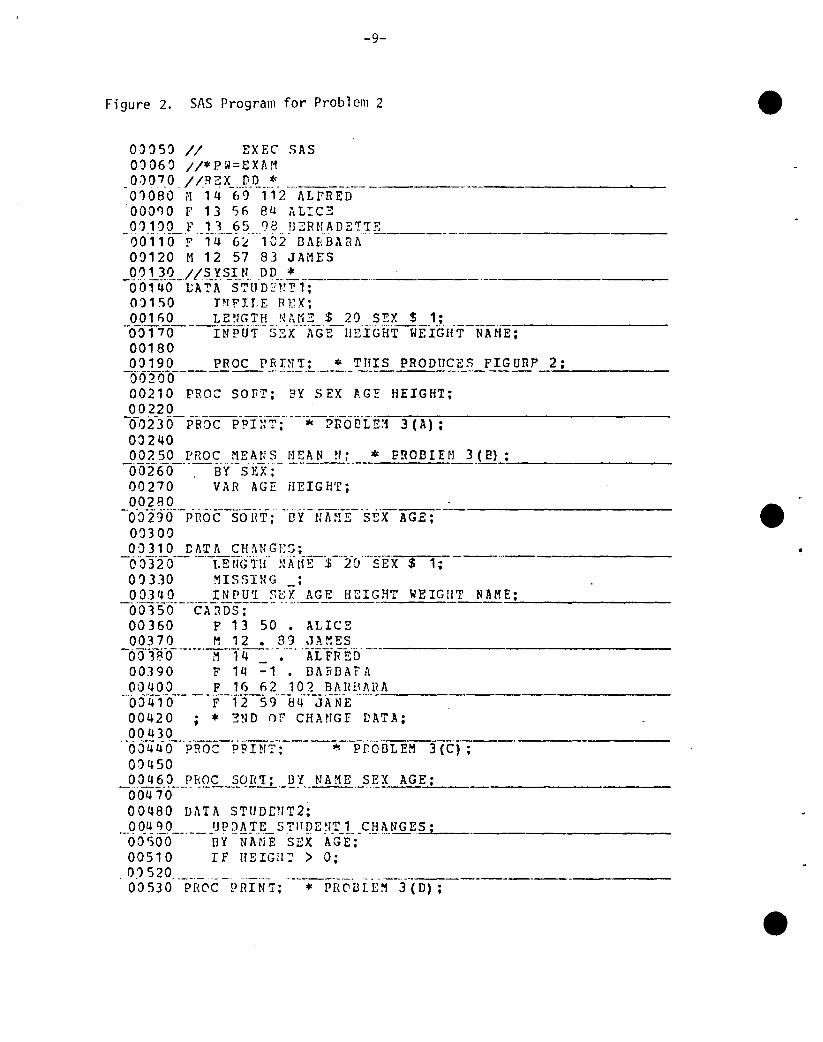
C. The printout in Figure 1 was produced by the PROC PRINT statementin line 190 of the SAS program shown in Figure 2. Show what willbe printed as a result of
(a) the PROC PRINT statement in line 230 in Figure 2. (Be carefulto write out the entire output to be produced by SAS excepttitles and page headings.)
(b) Show what will be printed as a result of the PROC MEANS(Figure2c , line 250) and related statements.
(c) Show what will be printed as a result of the PROC PRINTstatement in line 440 of Figure 2" .
Cd) Show what will be printed as a result of the PROC PRINTstatement in 1ine 530 of Figure 2.
Figure 1. Printout Produced by the PROC PRINT Statement in Line 190
of Figure 2.
s _T._~ .J _!_ S_~_.!-_~ h_L__J\ N ~ L Y S I ? ? __ Y S T E l'I----
cns tAM E SEX AGE HEIGHT WEIGHTlILFriF.-O-------11
ALIeS F12345
1 4 6-9------f1213 56 84
D~FN~DETT: F 13 65 98f3A r f1l\!' A-- -------=P-- 14----6-2 f62~---
JArES M 12 57 83
-9-
Figure 2. SAS Program for Problem 2
0)'5~ /1 EXEC SAS01 06 a 1/* P ~ =E XA11
_0:)07.0. / /R2X_ ..PJL.~. __._.__._ .. . _01080 M 14 69 112 ALfREDOOO~O r 13 56 84 ALIC301100 F 13 65 ~8 DZRNADETTE00 f10--F-"4·-G~-- 1 02- D,\F. BA nl\ "._---._._.
00120 M 12 57 83 JAMES_o.? 1.~_Q._1 IS_,! SXtl_ D D. .!.. .._. .00140 VA!A S~UDE~!l;
0)150 TNFILE REX~
00160 LENGTH NAM2 $ 20 SEX $ 1;-O)T7-0---iNPuf"-- 5E-x-·--~fG·E--II Ei·ob HTW·E~r'G I{T-ifAtj E;001800~190 FRoe PRD1T; * THIS PROOne~?_F_~GURP.__2;-002(,-0------- -- -.._._.- ._._.- -.- =....:------00210 PROC SOFT; BY SEX ~.GE HEIGHT;00220 -
-OO;fJO-PROe p-?I~r'i'-:· -"·ic--iifof.J"Lft:1 3 (A) ;0024000250 Prloe MEANS HEAN!I~ >Ie PRODIHl 3J_~..L;
-0026-b-··-·-EiY--SJ.:X ; .. -- ..----.---- -'----------00270 VAR AGE HEIGHT:00280
-·o-~f2':fo--p'ncjc--'~i"O-TIT: ··DY-r:h11-E;- ·sE"x- AGE:---
OCl30000310 CA~A CH~NGES;-6S}~ro-- -"·-I.Erfi:;--i'li" NAt'IE--$--io··..s·EX $----,-;----...0~330 ~ISSING _;00340 INPUtI SEX AGE HEIGHT WEIGHT NAME;-O·o3'so----EA-:.iDS;---·· .....------.. ~--------
00360 F 13 50 • ALICE003 7 0 M 12 • 8 ') .H. ~ ES
-60·f~fo---·--·M-l· 4=.---- ..-. ·ALFRED00390 F 1Q -1 • DARDAF!'!00400 F 16 62 102 BARBARA--b"6"ij-'--0"----p--T·.25CJ---"8 4---j ANi __ uO ---'----
00420 ; * ~ND OF CHAnGE DATA;00430
·'0 J 4 UO-'-pg 0 C--PR I NT-:----~--pri-oBL EM 3 (e) ;01450
._01.:!§_9__..r~r~Q~~QB1.i..)U __ NAME._?~UG~ _0047000480 DATA STUOBNT2;
.__0 Q~'!.9__. UP ::!~J.E_S Til pE _~l_T_1..cJj~.~G E=.S.....; __OOSOO BY NANE SEX AGE;00510 IF HEIGH:' > 0;
. 0) 520..__. ... _.__ _ 0.__••__"_.__
00530 PROC PRINT; * PR(1BLE~ 3 (D) :
-10-
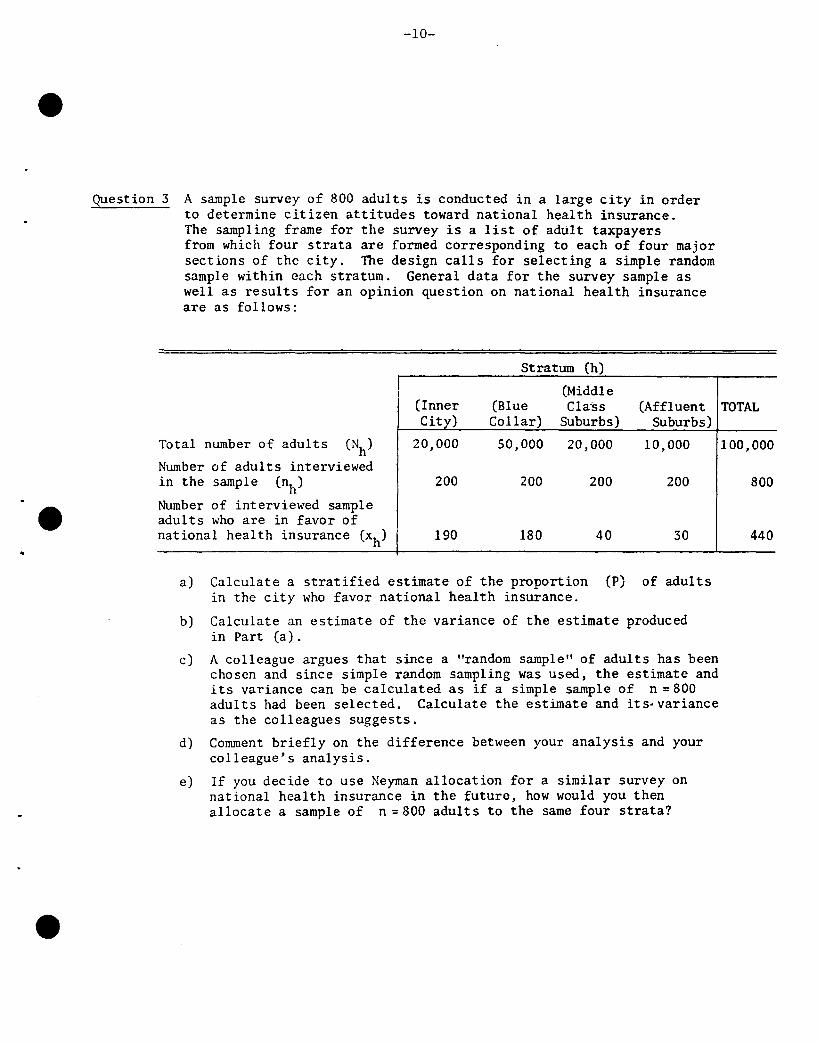
Question 3 A sample survey of 800 adults is conducted in a large city in orderto determine citizen attitudes toward national health insurance.The sampling frame for the survey is a list of adult taxpayersfrom which four strata are formed corresponding to each of four majorsections of the city. The design calls for selecting a simple randomsample within each stratum. General data for the survey sample aswell as results for an opinion question on national health insuranceare as follows:
Stratum (h)
(Middle(Inner (Blue Class (Affluent TOTALCity) Collar) Suburbs) Suburbs)
Total number of adults (Nh) 20,000 50,000 20,000 10,000 100,000
Number of adults interviewedin the sample (nh) 200 200 200 200 800
e Number of interviewed sampleadults who are in favor ofnational health insurance (xh) 190 180 40 30 440
a) Calculate a stratified estimate of the proportion (P) of adultsin the city who favor national health insurance.
b) Calculate an estimate of the variance of the estimate producedin Part (a).
c) A colleague argues that since a "random sample" of adults has beenchosen and since simple random sampling was used. the estimate andits variance can be calculated as if a simple sample of n = 800adults had been selected. Calculate the estimate and its-varianceas the colleagues suggests.
d) Comment briefly on the difference between your analysis and yourcolleague's analysis.
e) If you decide to use Neyman allocation for a similar survey onnational health insurance in the future, how would you thenallocate a sample of n = 800 adults to the same four strata?
-11-
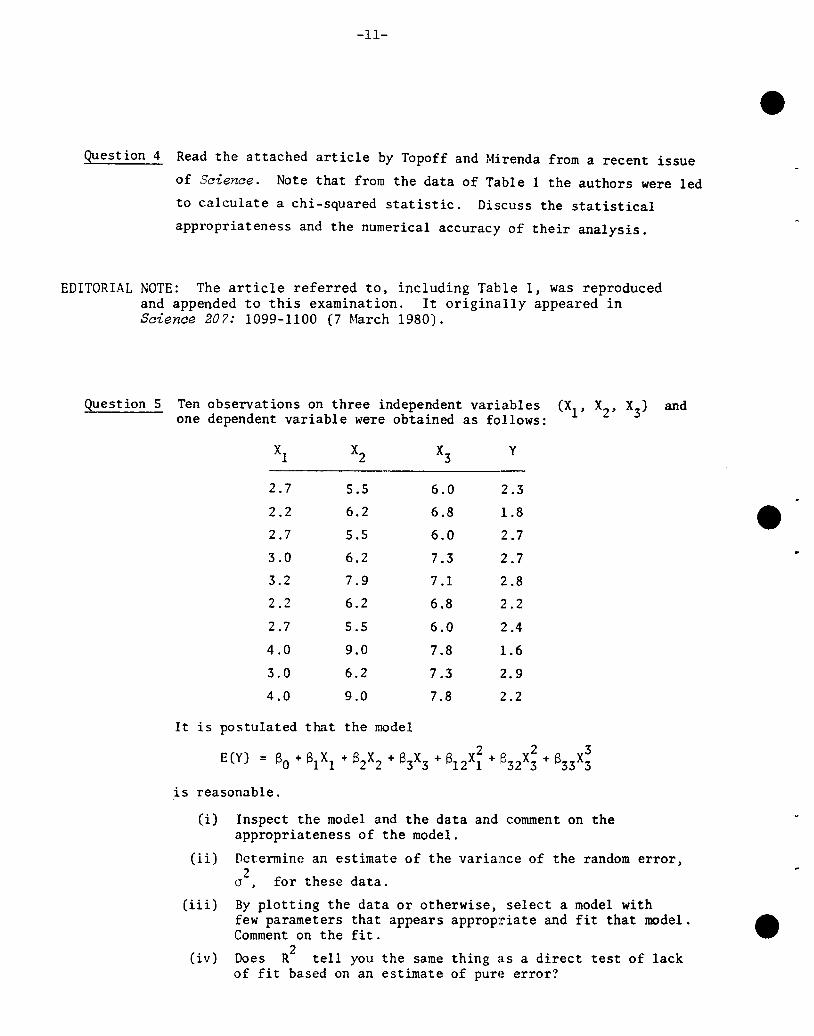
Question 4 Read the attached article by Topoff and Mirenda from a recent issue
of Science. Note that from the data of Table 1 the authors were led
to calculate a chi-squared statistic. Discuss the statistical
appropriateness and the numerical accuracy of their analysis.
EDITORIAL NOTE: The article referred to, including Table 1, was reproducedand appended to this examination. It origina.lly appeared inScience 207: 1099-1100 (7 March 1980).
Question 5 Ten observations on three independent variables (Xl' X2 , X3) andone dependent variable were obtained as follows:
Xl X2 X3 Y
2.7 5.5 6.0 2.3
2.2 6.2 6.8 1.8 e2.7 5.5 6.0 2.7
3.0 6.2 7.3 2.7
3.2 7.9 7.1 2.8
2.2 6.2 6.8 2.2
2.7 5.5 6.0 2.4
4.0 9.0 7.8 1.6
3.0 6.2 7.3 2.9
4.0 9.0 7.8 2.2
It is postulated that the model
is reasonable.
(i)
(i i)
(iii)
(iv)
Inspect the model and the data and comment on theappropriateness of the model.
Determine an estimate of the variance of the random error,
02
, for these data.
By plotting the data or otherwise, select a model withfew parameters that appears appropriate and fit that model.Comment on the fit.
2Does R tell you the same thing as a direct test of lackof fit based on an estimate of purl~ error?
-12-
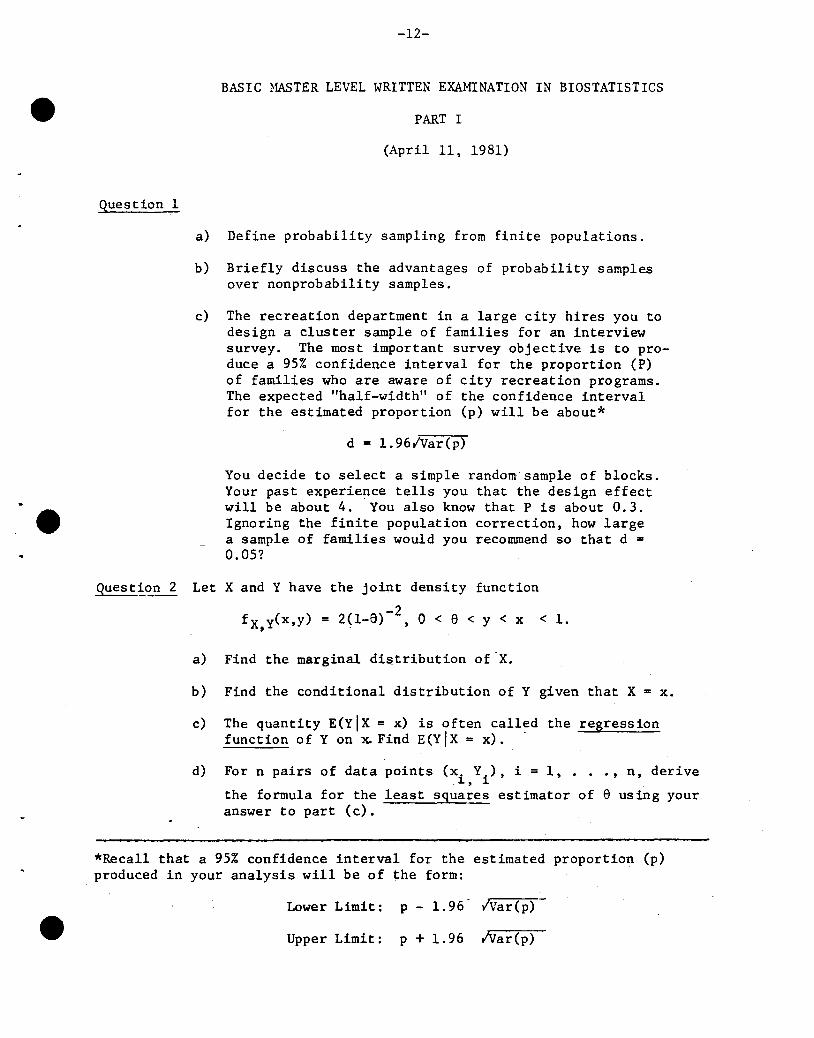
BASIC ~~TER LEVEL WRITTEN EXAMINATION IN BIOSTATISTICS
PART I
(April 11, 1981)
Question 1
a) Define probability sampling from finite populations.
b) Briefly discuss the advantages of probability samplesover nonprobability samples.
c) The recreation department in a large city hires you todesign a cluster sample of families for an interviewsurvey. The most important survey objective is to produce a 95% confidence interval for the proportion (P)of families who are aware of city recreation programs.The expected "half-width" of the confidence intervalfor the estimated proportion (p) will be about*
d = 1. 96/Var(p)
You decide to select a simple random sample of blocks.Your past experience tells you that the design effectwill be about 4. You also know that P is about 0.3.Ignoring the finite population correction, how largea sample of families would you recommend so that d =0.05?
Question 2 Let X and Y have the joint density function
-2fX,Y(x,y) = 2(1-8) ,0 < e < y < x < 1.
a)
b)
c)
d)
Find the marginal distribution of X.
Find the conditional distribution of Y given that X = x.
The quantity E(YIX = x) is often called the regressionfunction of Y on ~ Find E(YIX = x).
For n pairs of data points (x. Y.), i = 1, •.. , n, derive1, 1
the formula for the least squares estimator of e using youranswer to part (c).
*Reca11 that a 95% confidence interval for the estimated proportion (p)produced in your analysis will be of the form:
Lower Limit: p - 1.96 IVar(p)
Upper Limit: p + 1.96 lVar(p)
-13-
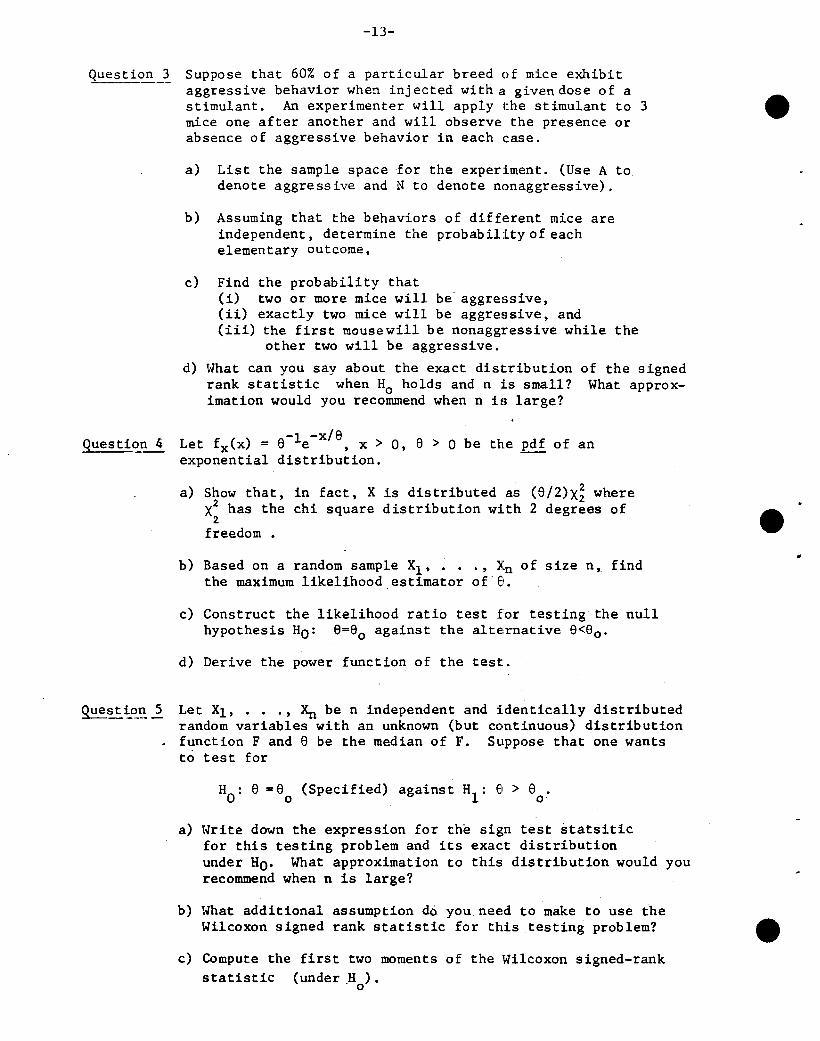
Question 3 Suppose that 60% of a particular breed of mice exhibitaggressive behavior when inj ected with a given dose of astimulant. An experimenter will apply the stimulant to 3mice one after another and will observe the presence orabsence of aggressive behavior in each case.
a) List the sample space for the experiment. (Use A todenote aggressive and N to denote nonaggressive).
b) Assuming that the behaviors of different mice areindependent, determine the probabil:lty of eachelementary outcome.
c) Find the probability that(i) two or more mice will be- aggressive,(ii) exactly two mice will be aggressive, and(iii) the first mouse will be nonaggressive while the
other two will be aggressive.
d) What can you say about the exact distribution of the signedrank statistic when Ho holds and n is small? What approximation would you recommend when n is large?
Question 4 -1 -x/8Let fx(x) = 8 e ,x > 0, 8 > ° be the pdf of anexponential distribution.
a) Show that, in fact, X is distributed as (8/2)X~ wherel has the chi square distribution wi,th 2 degrees of
2freedom •
b) Based on a random sample Xl' ••. , Xn of size n, findthe maximum likelihood estimator of'€I.
c) Construct the likelihood ratio test for testing the nullhypothesis HO: 8=80 against the alternative 8<80 ,
d) Derive the power function of the test.
Quest~~~ Let Xl, ••• , Xn be n independent and identically distributedrandom variables with an unknown (but continuous) distribution
. function F and 8 be the median of F. Suppose that one wantsto test for
HO
: 8 =8 (Specified) against HI: e > 8 •o 0'
a) Write down the expression for the sign test statsiticfor this testing problem and its exact distributionunder HO' What approximation to this distribution would yourecommend when n is large?
b) What additional assumption do you need to make to use theWilcoxon signed rank statistic for this testing problem?
c) Compute the first two moments of the Wilcoxon signed-rankstatistic (under H ).
'0
Question 1
5 points
6 points
9 points
5 points
Question 2
-14-
PART II
(April 12, 1981)
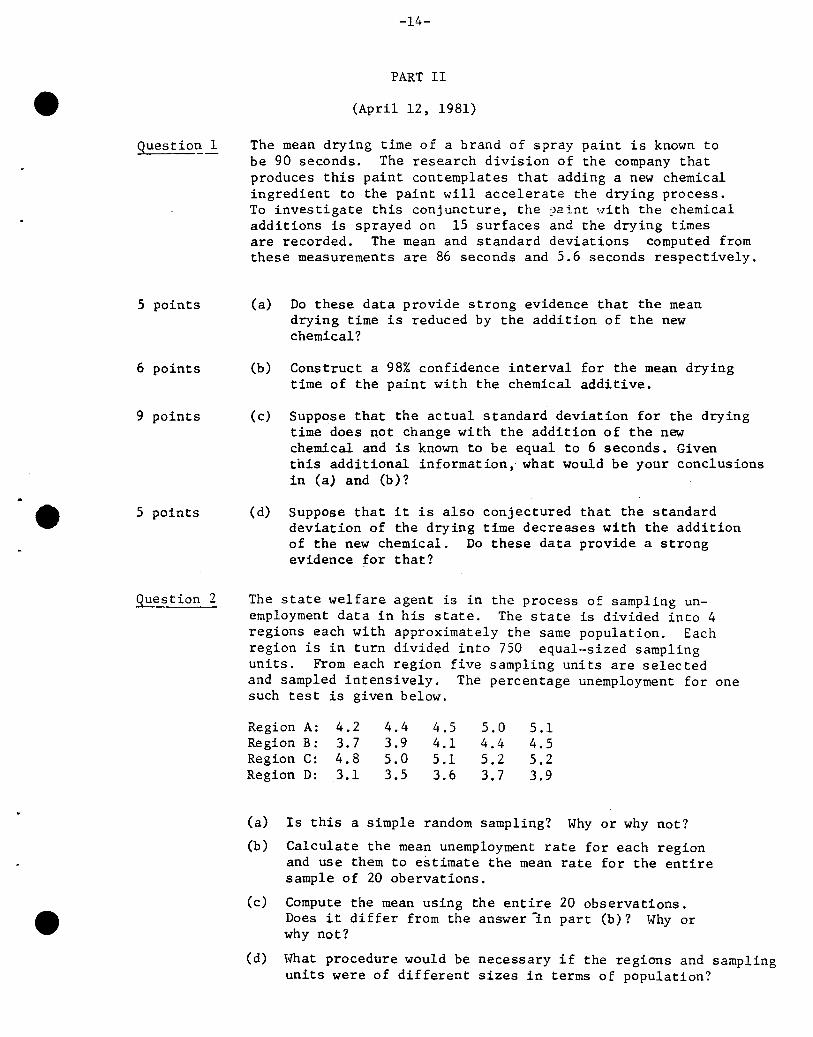
The mean drying time of a brand of spray paint is known tobe 90 seconds. The research division of the company thatproduces this paint contemplates that adding a new chemicalingredient to the paint will accelerate the drying process.To investigate this conjuncture, the 2aint ~Jith the chemicaladditions is sprayed on 15 surfaces and the drying timesare recorded. The mean and standard deviations computed fromthese measurements are 86 seconds and 5.6 seconds respectively.
(a) Do these data provide strong evidence that the meandrying time is reduced by the addition of the newchemical?
(b) Construct a 98% confidence interval for the mean dryingtime of the paint with the chemical additive.
(c) Suppose that the actual standard deviation for the dryingtime does not change with the addition of the newchemical and is known to be equal to 6 seconds. Giventhis additional information, what would be your conclusionsin (a) and (b)?
(d) Suppose that it is also conjectured that the standarddeviation of the drying time decreases with the additionof the new chemical. Do these data provide a strongevidence for that?
The state welfare agent is in the process of sampling unemployment data in his state. The state is divided into 4regions each with approximately the same population. Eachregion is in turn divided into 750 equal-sized samplingunits. From each region five sampling units are selectedand sampled intensively. The percentage unemployment for onesuch test is given below.
Region A: 4.2 4.4 4.5 5.0 5.1Region B: 3.7 3.9 4.1 4.4 4.5Region C: 4.8 5.0 5.1 5.2 5.2Region D: 3.1 3.5 3.6 3.7 3.9
(a) Is this a simple random sampling? Why or why not?
(b) Calculate the mean unemployment rate for each regionand use them to estimate the mean rate for the entiresample of 20 obervations.
(c) Compute the mean using the entire 20 observations.Does it differ from the answer ~n part (b)? Why orwhy not?
(d) What procedure would be necessary if the regions and samplingunits were of different sizes in terms of population?
Question 3
-15-
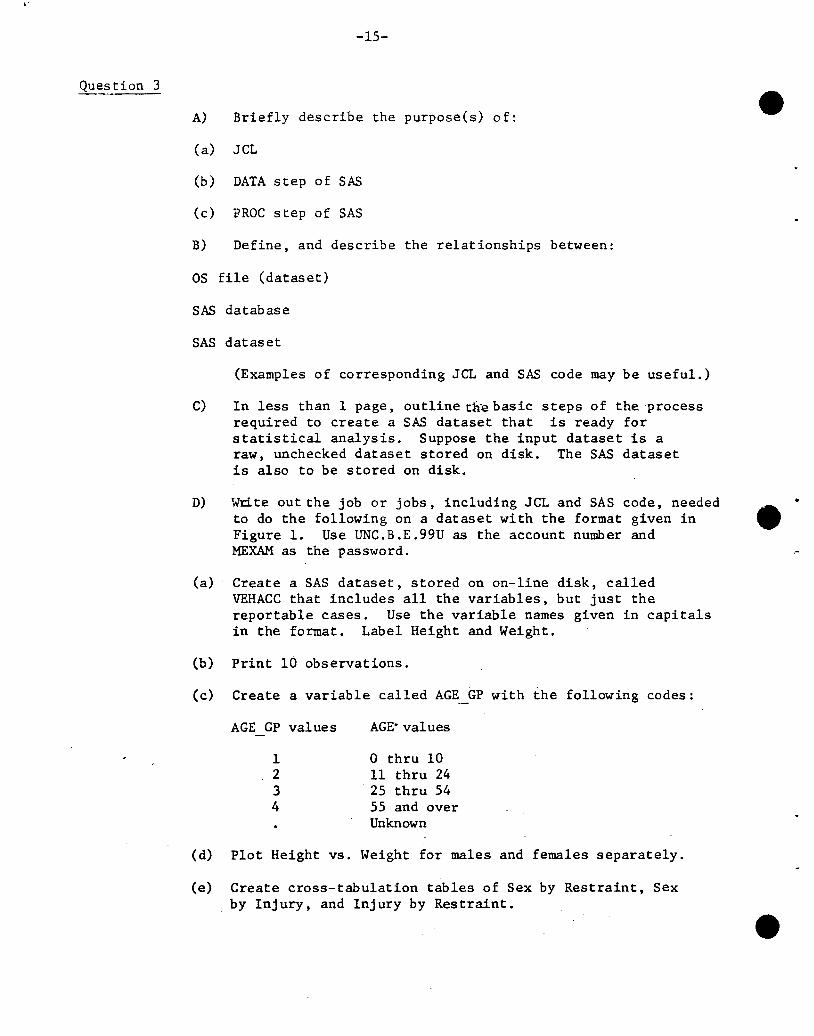
A) Briefly describe the purpose(s) of:
(a) JCL
(b) DATA step of SAS
(c) PROC step of SAS
B) Define, and describe the relationships between:
as file (dataset)
SAS database
SAS dataset
(Examples of corresponding JCL and SAS code may be useful.)
C) In less than 1 page, outline tlle basic steps of the processrequired to create a SAS dataset that is ready forstatistical analysis. Suppose the input dataset is araw, unchecked dataset stored on disk. The SAS datasetis also to be stored on disk.
D) Wtite out the job or jobs, including JCL and SAS code, neededto do the following on a dataset with the format given inFigure 1. Use UNC.B.E.99U as the account number andMEXAM as the password.
(a) Create a SAS dataset, stored on on-line disk, calledVEHACC that includes all the variables, but just thereportable cases. Use the variable names given in capitalsin the format. Label Height and Weight.
(b) Print 10 observations.
(c) Create a variable called AGE GP with the following codes:
AGE GP values
1234
AGE' values
o thru 1011 thru 2425 thru 5455 and overUnknown
(d) Plot Height vs. Weight for males and females separately.
(e) Create cross-tabulation tables of Sex by Restraint, Sexby Injury, and Injury by Restraint.
-16-
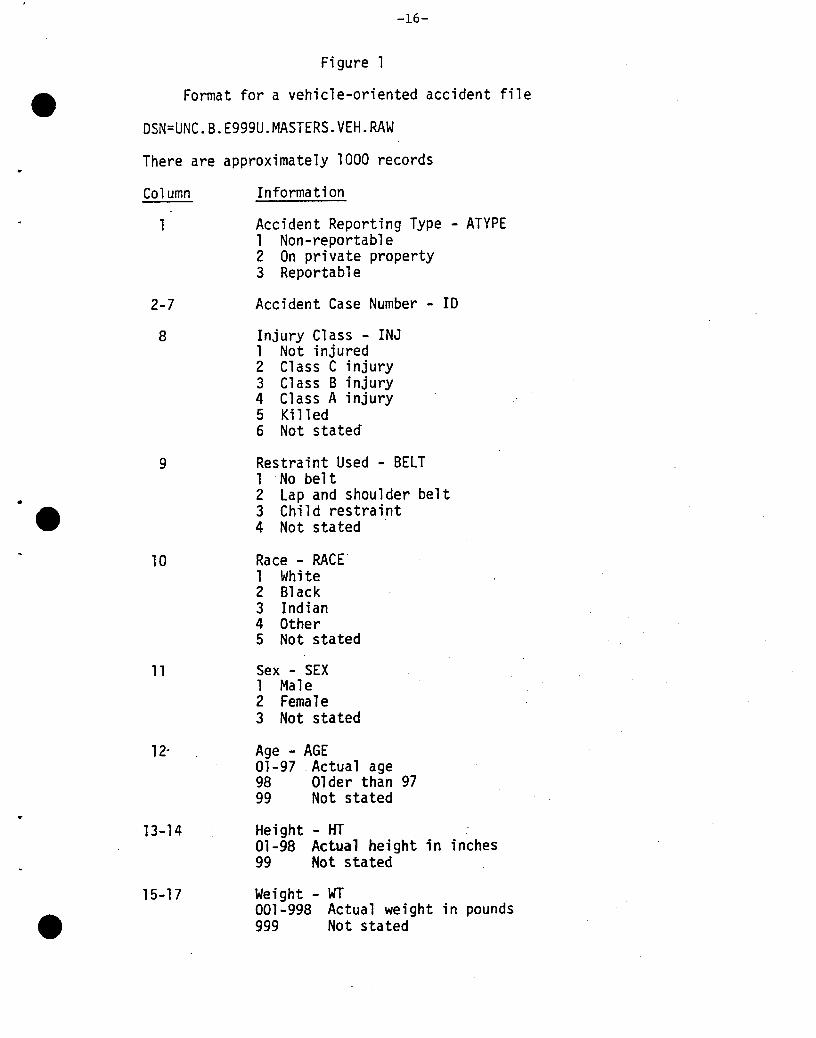
Figure 1
Format for a vehicle-oriented accident file
DSN=UNC.B.E999U.MASTERS.VEH.RAW
There are approximately 1000 records
..
Column
1
2-7
8
9
Information
Accident Reporting Type - ATYPE1 Non-reportable2 On private property3 Reportable
Accident Case Number - 10
Injury Class - INJ1 Not injured2 Class C injury3 Class B injury4 Class A injury5 Ki lled6 Not stated
Restraint Used - BELT1 No belt2 Lap and shoulder belt3 Child restraint4 Not stated
10 Race - RACE1 White2 Black3 Indian4 Other5 Not stated
11 Sex - SEX1 Male2 Female3 Not stated
12- Age - AGE01-97 Actual age98 Older than 9799 Not stated
13-14 Height - HT01-98 Actual height in inches99 Not stated
15-17 Weight - WI001-998 Actual weight in pounds999 Not stated
-17-
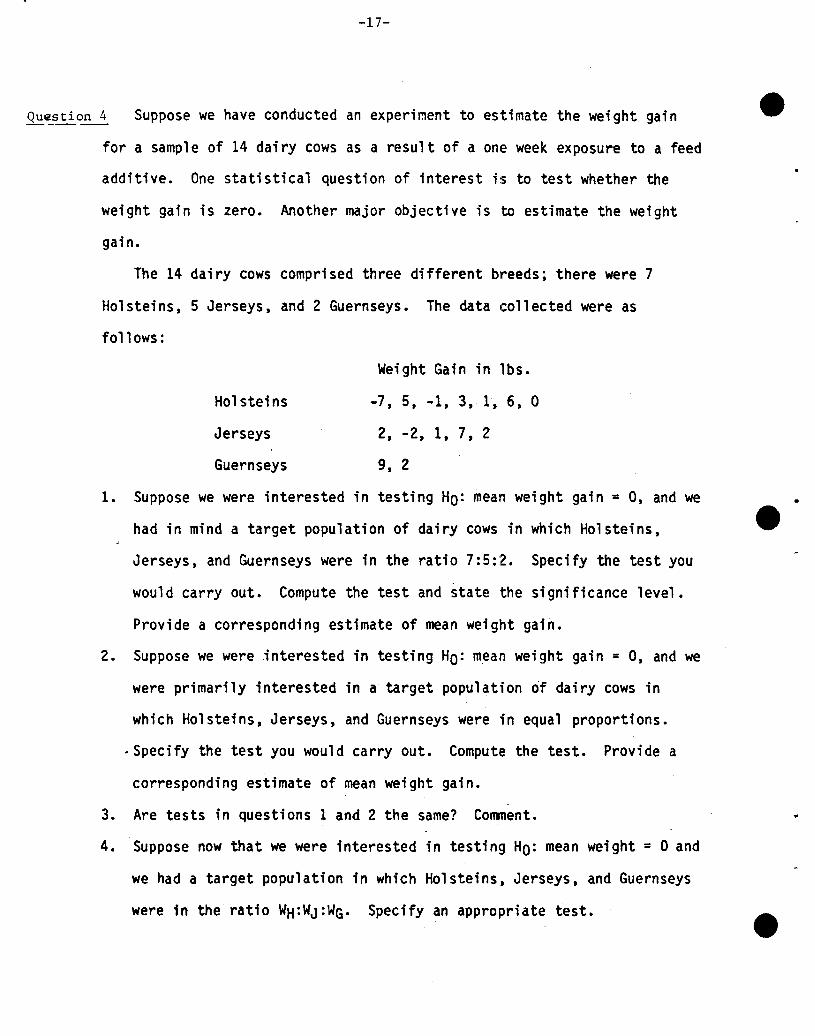
Qu~stion 4 Suppose we have conducted an experiment to estimate the weight gain
for a sampl e of 14 dai ry cows as a resul t of a ont:! week exposure to a feed
additive. One statistical question of interest is to test whether the
weight gain is zero. Another major objective is to estimate the weight
gain.
The 14 dairy cows comprised three different breeds; there were 7
Holsteins, 5 Jerseys, and 2 Guernseys. The data collected were as
follows:
Wei ght Gai n in 'lbs.
Holsteins -7, 5, -1, 3, 1, 6, 0
Jerseys 2, -2, 1, 7, 2
Guernseys 9, 2
1. Suppose we were interested in testing HO: mean weight gain = 0, and we
had in mind a target population of dairy cows in which Holsteins,
Jerseys, and Guernseys were in the rati 0 7: 5::2. Speci fy the test you
would carry out. Compute the test and state the significance level.
Provide a corresponding estimate of mean weight gain.
2. Suppose we were interested in testing HO: mean weight gain = 0, and we
were primarily interested in a target population of dairy cows in
which Holsteins, Jerseys, and Guernseys were in equal proportions •
. Specify the test you would carry out. Compute the test. Provide a
corresponding estimate of mean weight gain.
3. Are tests in questions 1 and 2 the same? Comment.
4. Suppose now that we were interested in testing HO: mean weight = 0 and
we had a target population in which Holsteins, Jerseys, and Guernseys
were in the ratio WH:WJ:WG. Specify an appropriate test.
,e Question 5
-18-
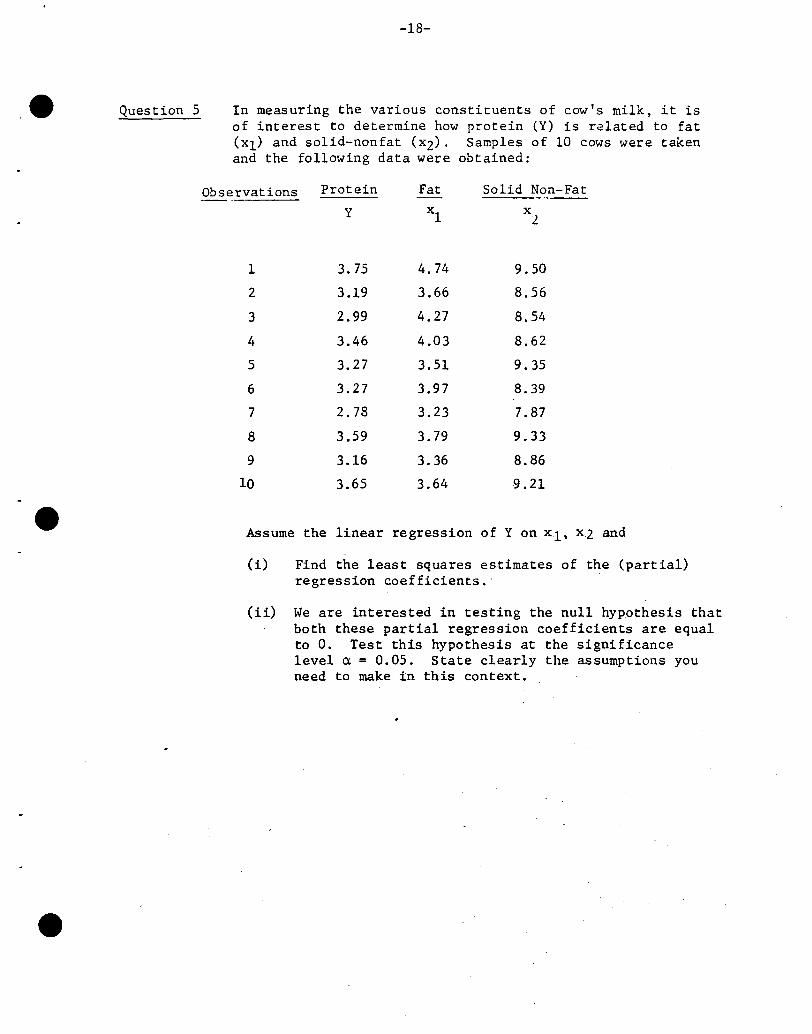
In measuring the various constituents of cow's milk, it isof interest to determine how protein (Y) is related to fat(Xl) and solid-nonfat (x2). Samples of 10 cows were takenand the following data were obtained:
Observations Protein Fat Solid Non-Fat----Y Xl X
2
1 3.75 4.74 9.50
2 3.19 3.66 8.56
3 2.99 4.27 8.54
l. 3.46 4.03 8.62
5 3.27 3.51 9.35
6 3.27 3.97 8.39
7 2.78 3.23 7.87
8 3.59 3.79 9.33
9 3.16 3.36 8.86
10 3.65 3.64 9.21
e Assume the linear regression of Y on Xl. x2 and
(i) Find the least squares estimates of the (partial)regression coefficients.-
(ii) We are interested in testing the null hypothesis thatboth these partial regression coefficients are equalto O. Test this hypothesis at the significancelevel CI. = 0.05. State clearly the assumptions youneed to make in this context.
-19-
BASIC MASTER LEVEL WRITTEN EXAMINATION IN BIOSTATISTICS
PART I
(April 3~ 1982)
Question 1.
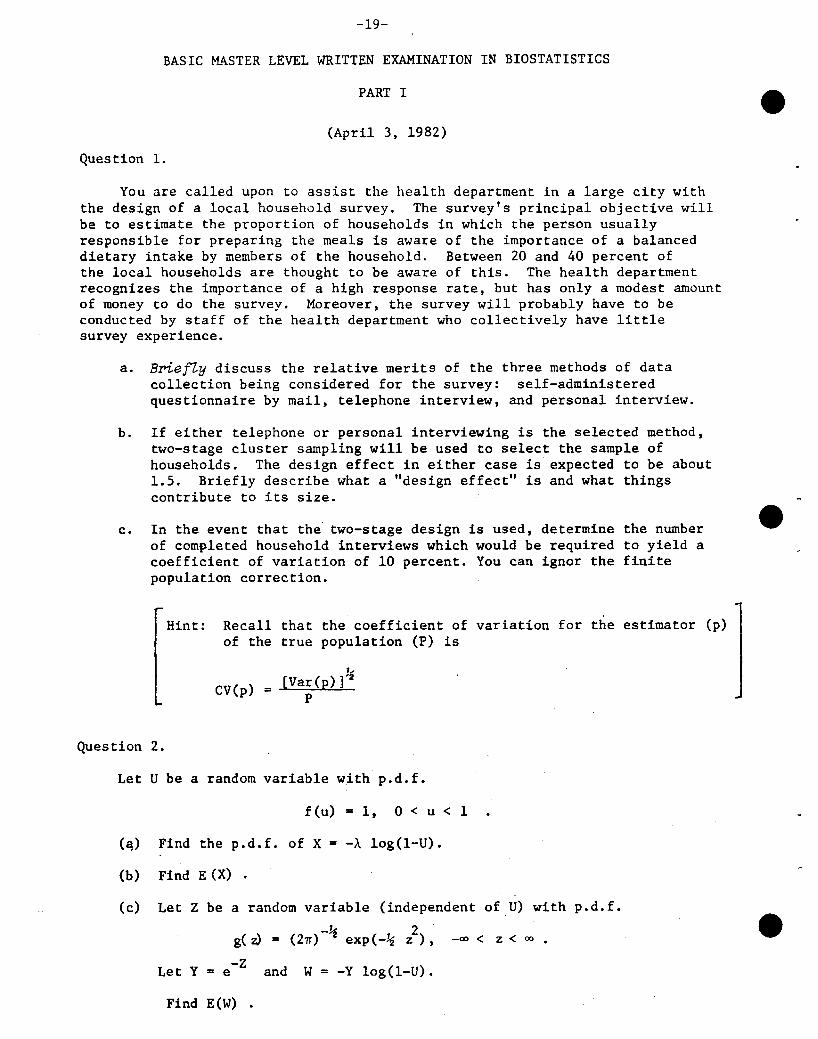
You are called upon to assist the health department in a large city withthe design of a local household survey. The survey's principal objective willbe to estimate the proportion of households in which the person usuallyresponsible for preparing the meals is aware of the importance of a balanceddietary intake by members of the household. Between 20 and 40 percent ofthe local households are thought to be aware of this. The health departmentrecognizes the importance of a high response rate~ but has only a modest amountof money to do the survey. Moreover, the survey will probably have to beconducted by staff of the health department who collectively have littlesurvey experience.
a. Brief1y discuss the relative merits of the three methods of datacollection being considered for the survey: self-administeredquestionnaire by mail, telephone interview, and personal interview.
b. If either telephone or personal interviewing is the selected method,two-stage cluster sampling will be used to select the sample ofhouseholds. The design effect in either case is expected to be about1.5. Briefly describe what a "design effect" is and what thingscontribute to its size.
c. In the event that the two-stage design is used, determine the numberof completed household interviews which would be required to yield acoefficient of variation of 10 percent. You can ignor the finitepopulation correction.
Hint: Recall that the coefficient of variation for the estimator (p)of the true population (P) is
Question 2.
CV(p)
7,
= [Var(p) ]'2P
Let U be a random variable with p.d.f.
f(u) = 1, 0 < u < 1
(~) Find the p.d.f. of X = -A log(l-U).
(b) Find E (X) .
(c) Let Z be a random variable (independent of U) with p.d.f.
-k 2 -g( ~ = (27T) 2 exp (-~ z) ~ -00 < Z < 00 •
Let Y -Z= e and w= -Y log(l-U).
Find E(W) .
.'-20-
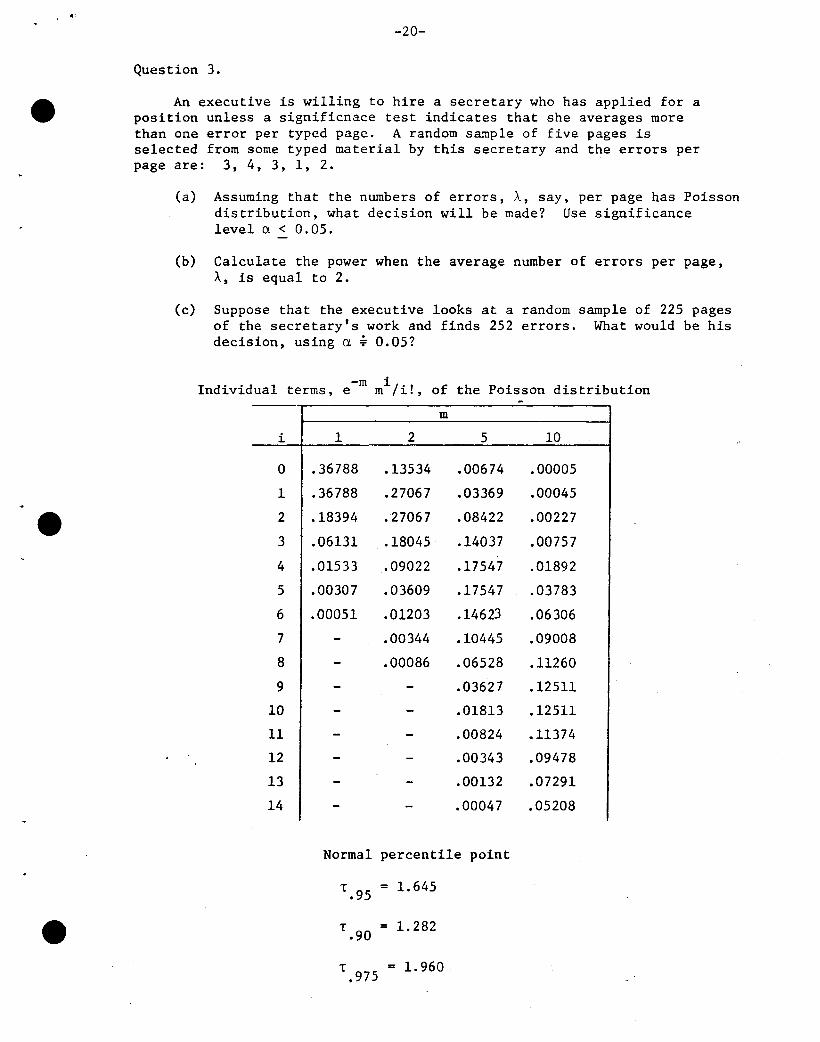
Question 3.
An executive is willing to hire a secretary who has applied for aposition unless a significnace test indicates that she averages morethan one error per typed page. A random sample of five pages isselected from some typed material by this secretary and the errors perpage are: 3, 4, 3, l, 2.
(a) Assuming that the numbers of errors, A, say, per page has Poissondistribution, what decision will be made? Use significancelevel a < 0.05.
(b) Calculate the power when the average number of errors per page,A, is equal to 2.
(c) Suppose that the executive looks at a random sample of 225 pagesof the secretary's work and finds 252 errors. What would be hisdecision, using a ~ 0.05?
Individual terms, e-m mi/i!, of the Poisson distribution~
m
i 1 2 5 10
0 .36788 .13534 .00674 .00005
1 .36788 .27067 .03369 .00045
2 .18394 .27067 .08422 .00227
3 .06131 .18045 .14037 .00757
4 .01533 .09022 .17547 .01892
5 .00307 .03609 .17547 .03783
6 .00051 .01203 .14623 .06306
7 - .00344 .10445 .09008
8 - .00086 .06528 .11260
9 - - .03627 .12511
10 - - .01813 .12511
11 - - .00824 .11374
12 - - .00343 .09478
13 - - .00132 .07291
14 - - .00047 .05208
Normal percentile point
= 1.645
T.90
= 1. 282
T.975
= 1.960,
" ('
-21-
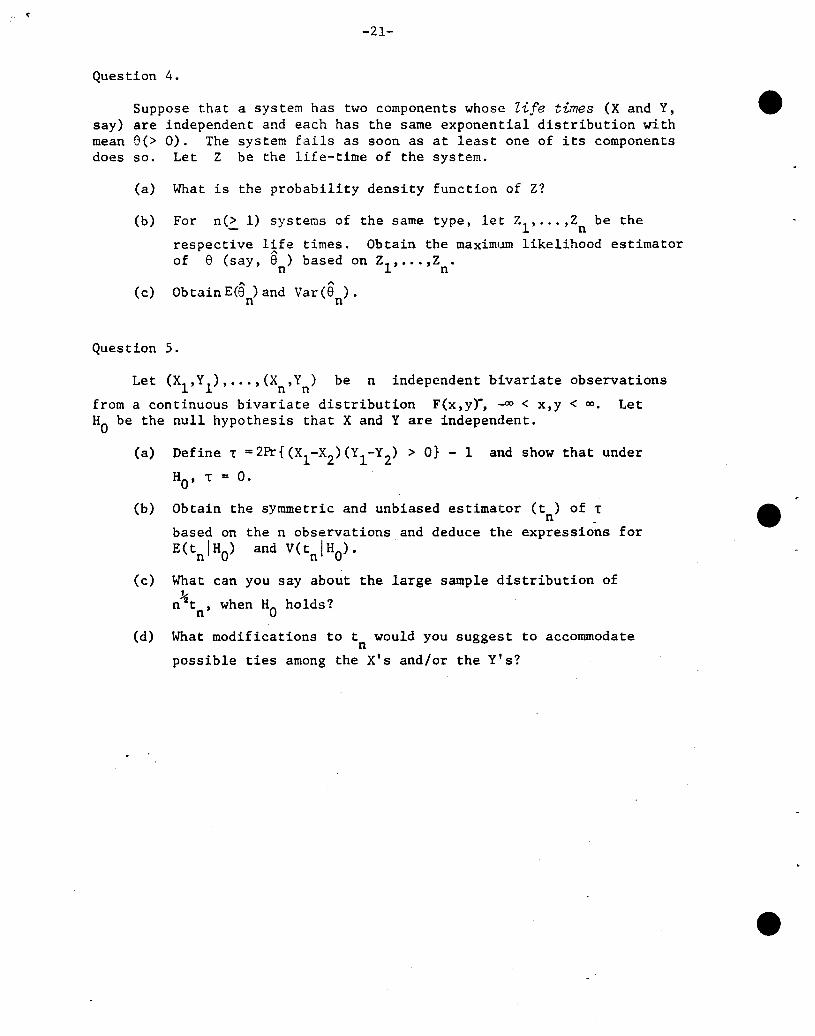
Question 4.
Suppose that a system has two components whose life times (x and Y,say) are independent and each has the same exponential distribution withmean e(> 0). The system fails as soon as at least one of its componentsdoes so. Let Z be the life-time of the system.
(a)
(b)
(c)
What is the probability density function of Z?
For n(~ 1) systems of the same type, let Zl' ... ,Zn be the
respective life times. Obtain the maximum likelihood estimatorof e (say, en) based on Zl, ••• ,Zn.
Obtain ECe ) and Var (6 ).n n
Question 5.
Let (Xl,Yl), •.. ,(Xn,Yn) be n independent b:lvariate observations
from a continuous bivariate distribution F(x,yr,·..oo < x,y < 00. LetH
Obe the null hypothesis that X and Yare independent.
(a) Define 1" =2Pr{(Xl -X2)(Yl-Y2) > O} - 1 and show that under
HO' 1" = O.
(b)
(c)
(d)
Obtain the symmetric and unbiased estimator (t ) of 1"n _based on the n observations and deduce the expressions forE(tnIHO) and V(tnIHO).
What can you say about the large sample distribution ofk
n 2 t n • when HO holds?
What modifications to t would you suggest to accommodaten
possible ties among the X's and/or the y" s?
-22-
PART II
(April 4, 1982)
Q.l. An investigator is planning a study to evaluate a new medication forthe treatment of hypertension. She knows from past experience thatfor patients with hypertension the mean diastolic blood pressure is105 mm •• the standard deviation is 15 mm. and the correlation betweentwo measurements is 0.7.
(a) Find the sample size needed if she uses each patient as hisown control. Assume a = 0.05, a = 0.1, a one-sided testand that she wants to detect a change in blood pressure of10 mm.
(b) Suppose she takes a group of patients and randomly dividesthem into two groups. She will give one group the new drugand the other group will get no treatment. If she willcompare the change in the blood pressure in the treatedgroup to that in the control group. what sample size does
. she need? Use the same assumptions as above.
(c) Discuss the relative merits of the two designs.
(d) Suppose the design in part (b) is chosen and that a total of10 patients will be used. Use the attached table of-randomnumbers to prepare a randomization schedule such that 5patients will be assigned to treatment and 5 to control.Please give details about how the table is used so that thegrader can reconstruct your schedule.
EDITORIAL ~OTE: An attached table presented 3000 random digits in 60 rowsof 50 digits each.
-23-
Q.2. An experiment was conducted to determine whether seleniumsupplementation is associated with reduced incidence of benignovarian tumors in pregnant cows. One treatment group and one controlgroup, of approximately equal sizes (N ~ 25 in each) were used. Eachcow in the treatment group received the same amount of selenium,injected once, a fixed number of weeks before the end of pregnancy.
To verify that the treatment raised the blood levels of twoimportant proteins throughout pregnancy, for each cow blood sampleswere taken before injection and after the end of pregnancy. Theconcentrations of the proteins were determined at each of thesetwo times for each cow. The important questions of interest hereare whether blood levels were similar in the two treatment groupsbefore treatment, whether these blood levels changed betweentreatment and the end of pregnancy within each treatment group,and whether the change was greater in the treated than in thecontrol group if the latter also had a change. (If the treatmentis effective, blood levels should increase.)
For each protein, the investigators determ:i:.ned whether differencesexisted by the use of rwo-way ANOVA (with factors treatment, andtime when blood drawn), followed by the use of Tukey's multiplecomparison method with P = .05 •
(a) Evaluate the method of analysis. Are the r,equired asswnptionsmet? Does the analysis answer the questions of interest?
(b) If you find the current analysis inappropriate, propose a betterone, showing how to answer the primary questions with levelP = .05. If you find the current analysis ,appropriate, discussthe use of Tukey's multiple comparison test vs. some othermethod to answer the primary questions.
Q.3.A. Briefly describe the purpose(s) 6f:
(1) .JCL
(2) DATA step of SAS
(3) PROC step of SAS
B. Define, and describe the relationships between:
OS file (dataset)
SAS database
SAS dataset
(Examples of corresponding JCL and SAS code may be useful.)
C. List the major components of a large modern (:omputer (CPU, etc.), andbriefly describe fhe functions of each component and describe therelationship among them. A simple diagram may help you in organizing ~
your answer. .,
D. List each type of JCL statement and briefly describe the function of each.Write a valid job (or jobs) including at least one example of each typeof statement.
-24-
Q.4. A dentist who was responsible for dental care of cerebral palsiedchildren in a state institution wanted to determine whether he shouldrecommend that electric toothbrushes be purchased for routine use bythe patients. He wanted to be as objective as possible in arrivingat a decision, and decided to consult with a statistician aboutdesigning an experiment to determine whether short term improvementin oral hygiene could be demonstrated. In answering the majorquestion, "Should the purchase of electric toothbrushes be recommendedfor this institution?", there are other considerations over and aboveany real improvement in oral hygiene of patients which should betaken into account but these were ignored in designing the study.
Study Design and Conduct of Trial
It was decided that the study should be designed to determine whetherbrushing with electric toothbrushes resulted in "cleaner teeth" thanbrushing with regular toothbrushes during a two week period. First,a search of the literature for measures of tooth cleanliness resultedin a decision to use the debris index, which is an average of debrisscores for six teeth,* as the response variable, i.e., the variablewhich is to be altered (hopefully) by "treatment". Next, factorswhich could (potentially) influence results were listed:
1. Age
2. Race
3. Sex
4. Degree of ability to care for teeth (brushes own teeth orbrushed by nurse)
5. Initial level of cleanliness (debris index)
6. Placebo effects:
(a) Attitudes and actions of children and nurses
(b) Attitude and actions of examining dentist
Because only 35 children were available for the initial examinationit was impractical to stratify (or control) on all of these variables.However, randomization, a way of balancing the effect of variableswhich cannot be controlled, was used.
The study was carried out as follows:
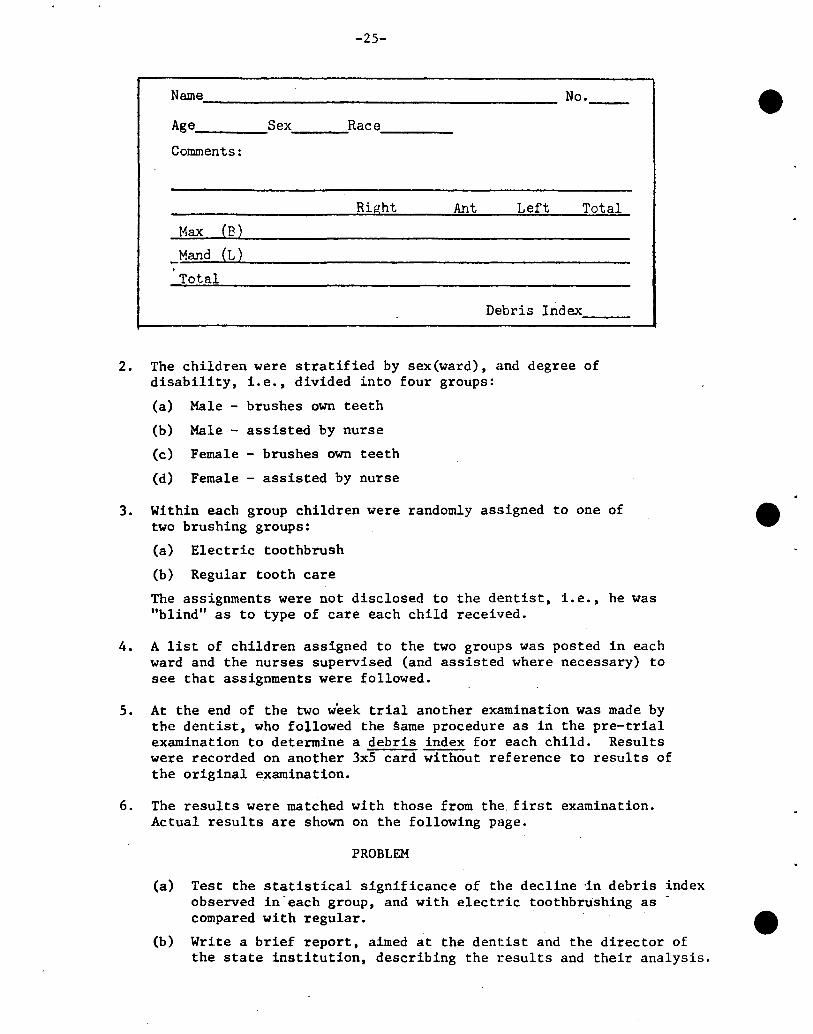
1. Each child was examined by the dentist and a pre-trial debrisindex was determined using the following 3x5 form for recording.
*Greene, J.C. and Vermillion, J.R. "Oral Hygiene Index - A Hethodfor Classifying Oral Hygiene Status", JADA, bl:172-179, (Aug. 1960).
-25-
Name. , _
Age. Sexo Race. _
Comments:
No.
Right
Max (B)
_Mand (L)
Total
Ant Left Total
DElbris Index
2. The children were stratified by sex (ward) , and degree ofdisability, i.e., divided into four groups:
(a) Male - brushes own teeth
(b) Male - assisted by nurse
(c) Female - brushes own teeth
(d) Female - assisted by nurse
3. Within each group children were randomly assigned to one oftwo brushing groups:
(a) Electric toothbrush
(b) Regular tooth care
The assignments were not disclosed to the dl~ntist, 1. e., he was"blind" as to type of care each child recei1'ed.
4. A list of children assigned to the two groups was posted in eachward and the nurses supervised (and assisted where necessary) tosee that assignments were followed.
5. At the end of the two week trial another examination was made bythe dentist, who followed the ~ame procedurl:! as in the pre-trialexamination to determine a debris index for each child. Resultswere recorded on another 3x5 card without rl:!ference to results ofthe original examination.
6. The results were matched with those from thl:!. first examination.Actual results are shown on the following page.
PROBLEM
(a) Test the statistical significance of the decline -in debris indexobserved in"each group, and with electric toothbrushing ascompared with regular. .
(b) Write a brief report, aimed at the dentist and the director ofthe state institution, describing the l~esults and their analysis.
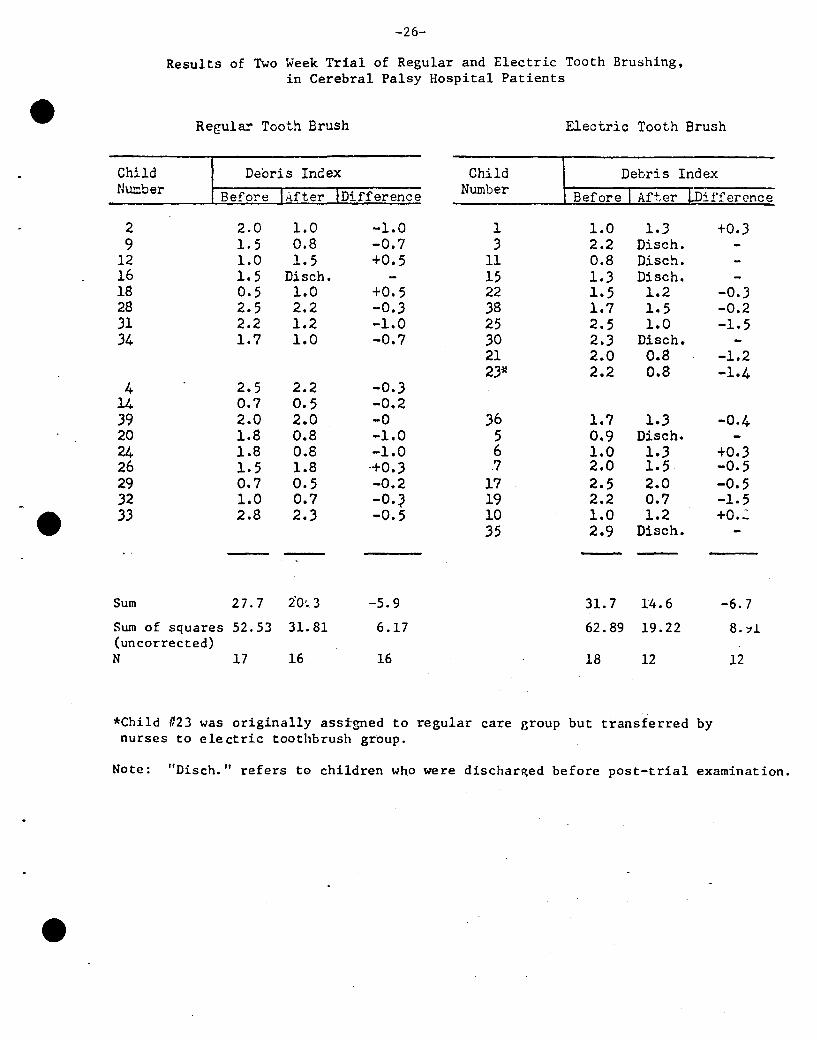
-26-
Results of Two Week Trial of Regular and Electric Tooth Brushing.in Cerebral Palsy Hospital Patients
Regular Tooth Brush Electric Tooth Brush
Child Debris Index Child Debris IndexNumber Before Difference Number Before iffercnce
2 2.0 1.0 -1.0 1 1.0 1..3 +0.39 1.5 0.8 -0.7 .3 2.2 Disch.
12 1.0 1.5 +0. ; 11 0.8 Disch.16 1.5 Disch. 15 1.3 Disch.18 0.5 1.0 +0.5 22 1.5 1.2 -0•.328 2.5 2.2 -0•.3 .38 1.7 1.5 -0.2.31 2.2 1.2 -1.0 25 2.5 1.0 -1.5.34 1.7 1.0 -0.7 .30 2•.3 Disch.
21 2.0 0.8 -1.22.3* 2.2 0.8 -1.4
4 2.5 2.2 -0.314 0.7 0.5 -0.2.39 2.0 2.0 -0 36 1.7 1.3 -0·420 1.8 0.8 -1.0 5 0.9 Disch.24 1.8 0.8 -1.0 6 1.0 1.3 +0.326 1.5 1.8 +0.3 7 2.0 1.5 -0.529 0.7 0.5 -0.2 17 2.5 2.0 -0.532 La 0.7 -O.~ 19 2.2 0.7 -1.5
e 33 2.8 2.3 -0.5 10 1.0 1.2 +0.':'35 2.9 Disch.
-Sum 27.7 2'0'.3 -5.9 31. 7 14.6 -6.7
Sum of squares 52.53 31. 81 6.17 62.89 19.22 8.:11(uncorrected)N 17 16 16 18 12 12
*Child #23 was originally ass~gned to regular care Broup but transferred bynurses to electric toothbrush group.
Note: "Disch." refers to children who were dischan~ed before post-trial examination.
-27-
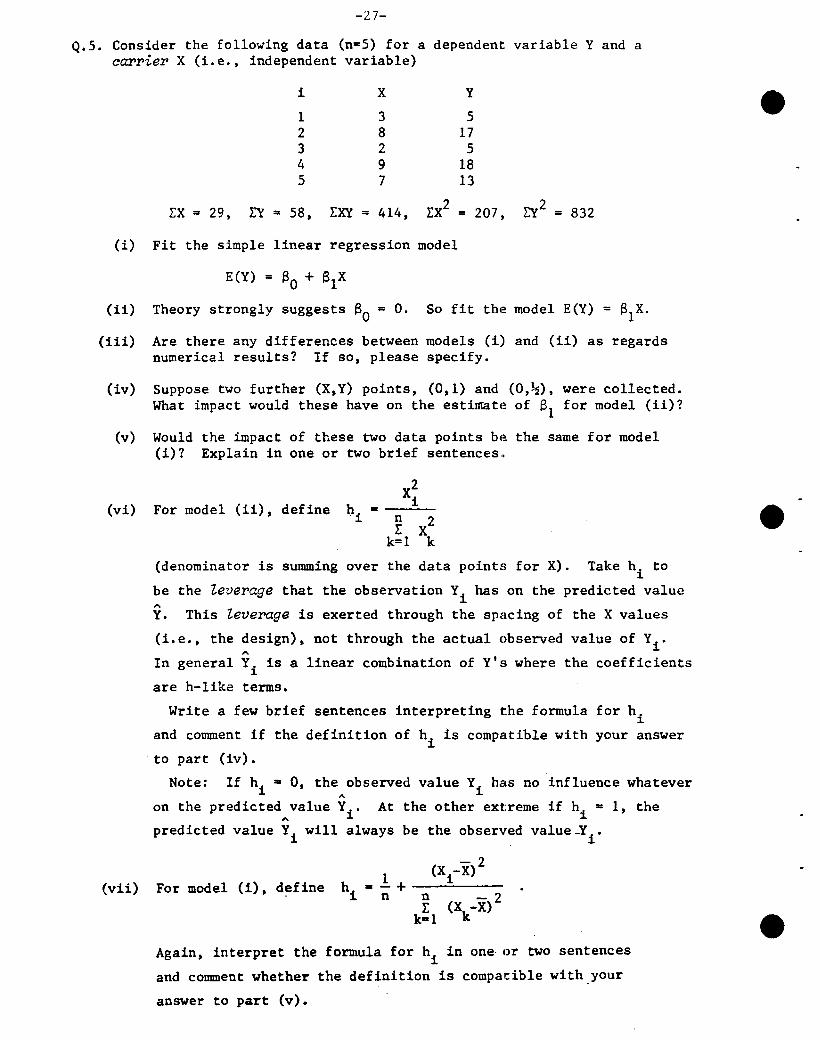
Q.5. Consider the following data (n=5) for a dependent variable Y and acarrier X (i.e., independent variable)
i X Y
I 3 52 8 173 2 54 9 185 7 13
EX = 29, L:Y= 58, EXY = 414, EX2= 207, L:y2 = 832
(i) Fit the simple linear regression model
E{Y) = So + SIX
(ii) Theory strongly suggests eO ... o. So fit th4:! model E{Y) = SIX'
(iii) Are there any differences between models (i) and (ii) as regardsnumerical results? If so, please specify.
(iv) Suppose two further (X,Y) points, (0,1) and (O,~), were collected.What impact would these have on the estinratl~ of 13
1for model (ii)?
(v) Would the impact of these two data points bE~ the same for model(i)? Explain in one or two brief sentences"
(vi) For model (ii), defineX2
h ... ii n
x2I:
k=1 k
(denominator is summing over the data points for X). Take hi to
be the Zeverage that the observation Yi
has on the predicted value'"Y. This Zeverage is exerted through the sp~lcing of the X values
(Le., the design), not through-the actual observed value of Yi •
In general Yi
is a linear combination of y's where the coefficients
are h-like terms.
Write a few brief sentences interpreting the formula for h.l.
and comment if the definition of hi is compatible with your answer
'to part (iv).
Note: If hi = 0, the observed value Yi has no influence whatever'"on the predicted",value Yi • At the other extreme if hi ... 1, the
predicted value Yi
will always be the observed value -Yi
'
(vii) For model (i), define
Again, interpret the formula for hi in one, or two sentences
and comment whether the definition is compatible with_your
answer to part (v).
-28-
BASIC MASTER LEVEL WRITTEN EXAMINATION IN BIOSTATISTICS
PART II
Special Offer: May 29, 1982
INSTRUCTIONS:
a) This is an open book examination.
b) M.P.H. and M.S.P.H. students are to answer any two questionsduring the two-hour period (1:30 pm - 3:30 pm). M.S. studentsare to answer three questions of which not more than 2should be from Group A - time period 1:30 - 4:30 pm.
c) Put the answers to different questions on separate setsof papers.
d) Put your code letter, not your name, on each page.
e) Return the examination with a signed statement of honorpledge on a page separate from your answers.
f) You are required to answer only what is asked in the questionsand not all you know about the topics.
EDITORIAL NOTE: This "special offer" was identical with the regular Part IIgiven on 12 April 1981 (see pages 14-18).
-29-
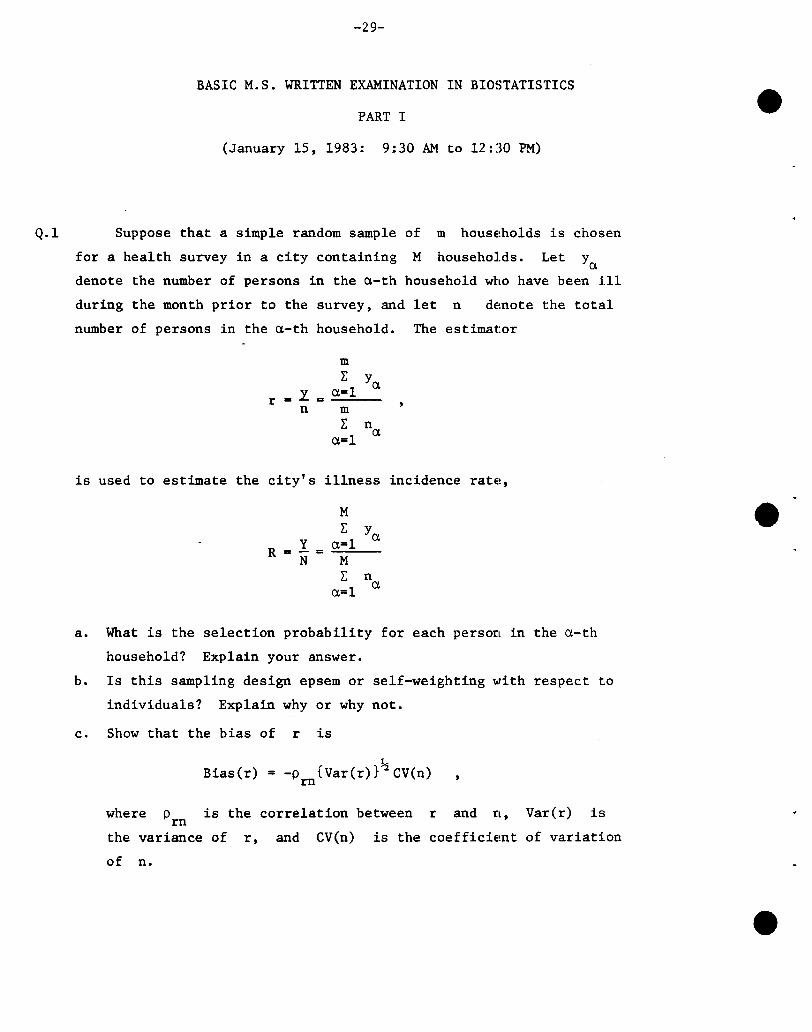
BASIC M.S. WRITTEN EXAMINATION IN BIOSTATISTICS
PART I
(January 15, 1983: 9:30 AM to 12:30 PM)
Q.l Suppose that a simple random sample of m hOUSE!holds is chosen
for a health survey in a city containing M households. Let Ya
denote the number of persons in the a-th household who have been ill
during the month prior to the survey, and let n denote the total
number of persons in the a.-th household. The estimator
mr Ya.
r = y. = a.=ln m
r na.=l a.
is used to estimate the city's illness incidence ratE!,
Mr Ya.
y a.=lR=-= MNr n
a.=l a.
a. What is the selection probability for each person in the a.-th
household? Explain your answer.
b. Is this sampling design epsem or self-weighting with respect to
individuals? Explain why or why not.
c. Show that the bias of r is
~Bias(r) = -p {Var(r)} CV(n)rn
where is the correlation between r and n, Var(r) is
the variance of r, and CV(n) is the coefficiEmt of variation
of n.
....oo<y<-+oo
-30-
Q.2 Researchers believe that the prevalence (Y) of byssinoses in
workers in textile manufacturing plants is linearly related to the
mean daily cotton dust level (X). Under the assumption that zero
cotton dust level implies zero prevalence, the regression equation
relating the mean of Y to X is
E(Y IX=x) = ~x
a. Given the n pairs of data points (xi,Yi ), i = 1,2, ... ,n,
chosen randomly from the conditional distribution
1 2--(y-13x)
202
show that the maximum likelihood estimator of 13 is
~ =n n 2r x.Y. / r xi
. 1 ~ ~ . 1~= ~=
A
b. Show that the maximum likelihood estimator 13 of 13 found in
part (a) is also the least squares estimator of 13; in other
words, show that S minimizes the function
n 2r [Yi-E(Y.lx=x.)]
i=l ~ ~
with respect to 13.A
c. Show that E(I3) = 13 given the conditional density in part (a) .A 2 n 2
d. Show that V(I3) = o / r xi given the conditional density in
(a) .i=l
partA
e. Show that 13 is normally distributed given the conditional
density in part (a).
-31-
Q.3 A scientist hypothesizes the following esoteric theory for cellular
damage in humans due to radiation exposure. A particular cell in an
individual is "hit" by radiation X times during the course of the
individual's lifetime, with the number X of such hits having the
Poisson distribution
x -AA ePX(x) = x! x = 0,1, ... ,00
For any such hit, there is a fixed probabili.ty p that some basic
structural change will occur in the cell; also, the occurrences (or
not) of structural changes for different hits are assumed to be mutually
independent.
The random variable of interest is Y, the total number of
structural changes that the particular cell undergoes during the
course of the individual's lifetime.
a. What is pr(Y=ylx=xo)? In other words, what is the conditional
distribution of Y given that a particular cell experiences
exactly Xo hits?
b. Using the result in part (a), show that the unconditional
distribution of Y, namely pr(Y=y), is Poisson with mean
Ap.c. The scientist further hypothesizes that a particular cell will
become cancerous if it undergoes at least k structural changes.
Given the result in part (b), what is the probability that a
particular cell will become cancerous? (JUST SET UP YOUR ANSWER).
[NOTE: You do not need to be able to work parts (a) and (b) in
order to answer this question.]
Q.4 Let X be distributed as a Poisson variate with mean PA, and
independently, let Y be distributed as a Poisson variate with mean
A. The parameters p and A are both positive.
a. Show that the distribution of X given X + Y = m is the
binomial one:
O<x<m
b. Find the maximum likelihood estimator (MLE) of p from (a).
c. Find the asymptotic variance of the MLE, conditional on m.
d. Find the unconditional information in part (c).
-32-
BASIC ~l.S. WRITTEN EXAMINATION IN BIOSTATISTICS
PART II
(January 16, 1983: 2:00 to 5:00 PM)
Q.l It has recently been discovered that certain blood chemistry
measurements correlate highly with the clinical diagnosis of "depression".
One of these, the DST test, is estimated to have 70% sensitivity and 96%
specificity for depression; another, the TSH test, has low sensitivity,
only 25%, but it seems to have 100% specificity, since no false positive
has yet been documented.
1. Assuming that the two tests operate independently (which
agrees with the limited evidence available), what sensitivity
and specificity could you achieve by applying both to the
same subject?
The above results were obtained in subjects who were not physically
ill. There is interest in applying the tests to cervical cancer
patients, in whom the clinical diagnosis of depression is difficult
becaupe depressive symptoms are easily confused with those of the
cancer itself. You are called in to help design a study to find out
whether the two tests have different sensitivity and specificity in
such patients. You are told that between 2 and 3 new patients per week
will be available, that about 25% to 35% of these patients will actually
have depression by clinical criteria, and that the study can continue
for about 6 to 8 months.
2. Discuss generally the points that you would stress as a
statistician in talking with the principal investigator.
And more specifically, perform some calculations to indicate
what success the study is likely to have in meeting its
objectives.
Note: sensitivity = pr (+ test result/diseased)
specificity = pr (- test result/not diseased)
-33-
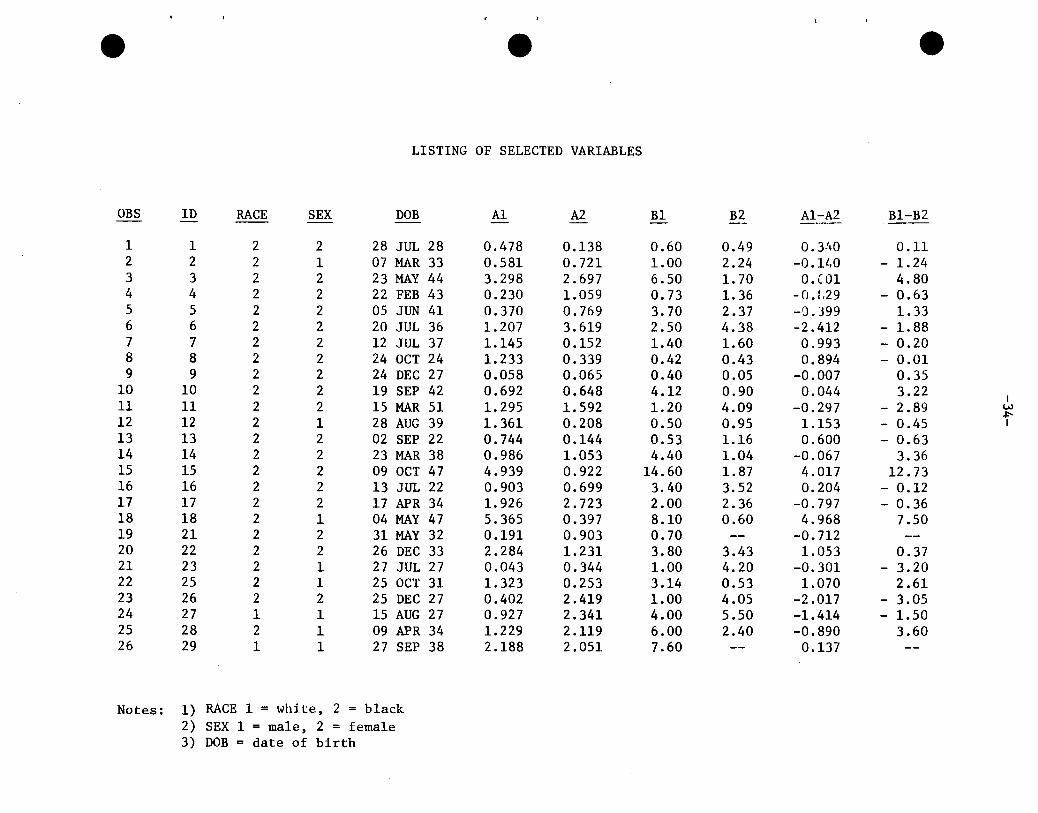
Q.2 Twenty-six subjects with essential hypertE!nsion were classified
as "low" or "nonnal" with respect to plasma renin activity (PRA) in
1974-75, using two different methods. The SamE! subjects were re-examined
and reclassified in 1982.
The data for this study are given in the accompanying table. A
subject had "low" PRA by Method A (PRA-sodium index) in 1974-75 (in
1982) if Al < .555 (A2 < .555); by Method B (PRA after furosemide)
according as Bl or B2 < 1.75 (A and B do not measure PRA in the
same units.)
1. Do the two methods of classification agree with each other?
2. Does the classification by anyone method remain consistent
over a long period of time (i.e., from 1974-75 to 1982)?
3. Do these data indicate any general decrease in PRA with
increasing age (as has been found in other studies)?
NOTE: For furposes of this exam, satisfactory answers can
be given which require very little computation.
e e
LISTING OF SELECTED VARIABLES
e
OBS ID RACE SEX DaB Al A2 B1 B2 A1-A2 B1-B2- -
1 1 2 2 28 JUL 28 0.478 0.138 0.60 0.49 0.3!10 0.112 2 2 1 07 MAR 33 0.581 0.721 1.00 2.24 -0.1lr0 - 1.243 3 2 2 23 MAY 44 3.298 2.697 6.50 1. 70 0.C01 4.804 4 2 2 22 FEB 43 0.230 1.059 0.73 1.36 -0.1.29 - 0.635 5 2 2 05 JUN 41 0.370 0.769 3.70 2.37 -0.399 1.336 6 2 2 20 JUL 36 1.207 3.619 2.50 4.38 -2.412 - 1.887 7 2 2 12 JUL 37 1.145 0.152 1.40 1.60 0.993 - 0.208 8 2 2 24 OCT 24 1.233 0.339 0.42 0.43 0.894 - 0.019 9 2 2 24 DEC 27 0.058 0.065 0.40 0.05 -0.007 0.35
10 10 2 2 19 SEP 42 0.692 0.648 4.12 0.90 0.044 3.22I
11 11 2 2 15 MAR 51 1.295 1.592 1.20 4.09 -0.297 - 2.89 w.p.
12 12 2 1 28 AUG 39 1.361 0.208 0.50 0.95 1.153 - 0.45 I
13 13 2 2 02 SEP 22 0.744 0.144 0.53 1.16 0.600 - 0.6314 14 2 2 23 MAR 38 0.986 1.053 4.40 1.04 -0.067 3.3615 15 2 2 09 OCT 47 4.939 0.922 14.60 1.87 4.017 12.7316 16 2 2 13 JUL 22 0.903 0.699 3.40 3.52 0.204 - 0.1217 17 2 2 17 APR 34 1.926 2.723 2.00 2.36 -0.797 - 0.3618 18 2 1 04 MAY 47 5.365 0.397 8.10 0.60 4.968 7.5019 21 2 2 31 MAY 32 0.191 0.903 0.70 -- -0.71220 22 2 2 26 DEC 33 2.284 1.231 3.80 3.43 1.053 0.3721 23 2 1 27 JUL 27 0.043 0.344 1.00 4.20 -0.301 - 3.2022 25 2 1 25 OCT 31 1.323 0.253 3.14 0.53 1.070 2.6123 26 2 2 25 DEC 27 0.402 2.419 1.00 4.05 -2.017 - 3.0524 27 1 1 15 AUG 27 0.927 2.341 4.00 5.50 -1.414 - 1.5025 28 2 1 09 APR 34 1.229 2.119 6.00 2.40 -0.890 3.6026 29 1 1 27 SEP 38 2.188 2.051 7.60 -- 0.137
Notes: 1) RACE 1 = white. 2 = black2) SEX 1 = male, 2 = female3) DaB = date of birth
-35-
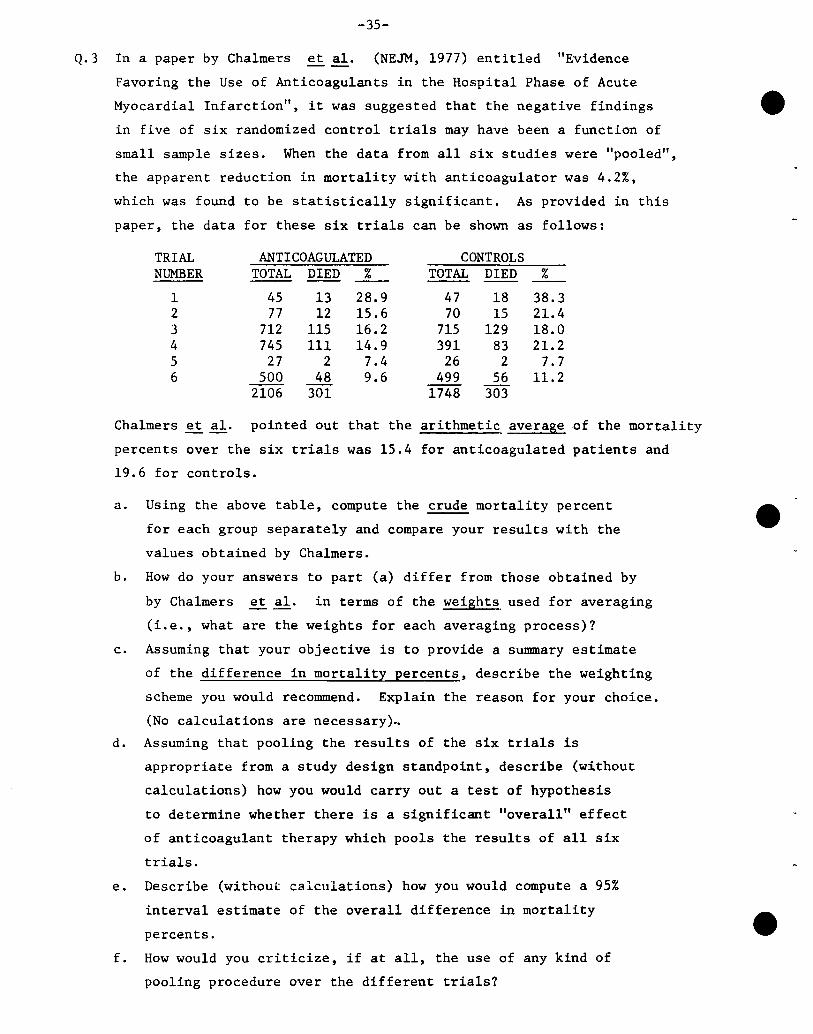
Q.3 In a paper by Chalmers et al. (NEJM, 1977) entitled "Evidence
Favoring the Use of Anticoagulants in the Hospital Phase of Acute
Myocardial Infarction", it was suggested that the negative findings
in five of six randomized control trials may have been a function of
small sample sizes. When the data from all six studies were "pooled",
the apparent reduction in mortality with anticoagulator was 4.2%,
which was found to be statistically significant. As provided in this
paper, the data for these six trials can be shown as follows:
TRIAL ANTICOAGULATED CONTROLSNUMBER TOTAL DIED % TOTAL DIED %
1 45 13 28.9 47 18 38.32 77 12 15.6 70 15 21.43 712 115 16.2 715 129 18.04 745 111 14.9 391 83 21.25 27 2 7.4 26 2 7.76 500 48 9.6 499 56 11.2
2106 301 1748 303
Chalmers et al. pointed out that the arithmetic. average of the mortality
percents over the six trials was 15.4 for anticoagulated patients and
19.6 for controls.
a. Using the above table, compute the crude mortality percent
for each group separately and compare your results with the
values obtained by Chalmers.
b. How do your answers to part (a) differ from those obtained by
by Chalmers et al. in terms of the weights. used for averaging
(i.e., what are the weights for each averaging process)?
c. Assuming that your objective is to provide a summary estimate
of the difference in mortality percents, describe the weighting
scheme you would recommend. Explain the reason for your choice.
(No calculations are necessary)N
d. Assuming that pooling the results of the six trials is
appropriate from a study design standpoint, describe (without
calculations) how you would carry out a test of hypothesis
to determine whether there is a significant "overall" effect
of anticoagulant therapy which pools the results of all six
trials.
e. Describe (without calculations) how you would compute a 95%
interval estimate of the overall difference in mortality
percents.
f. How would you criticize, if at all, the use of any kind of
pooling procedure over the different trials?
-36-
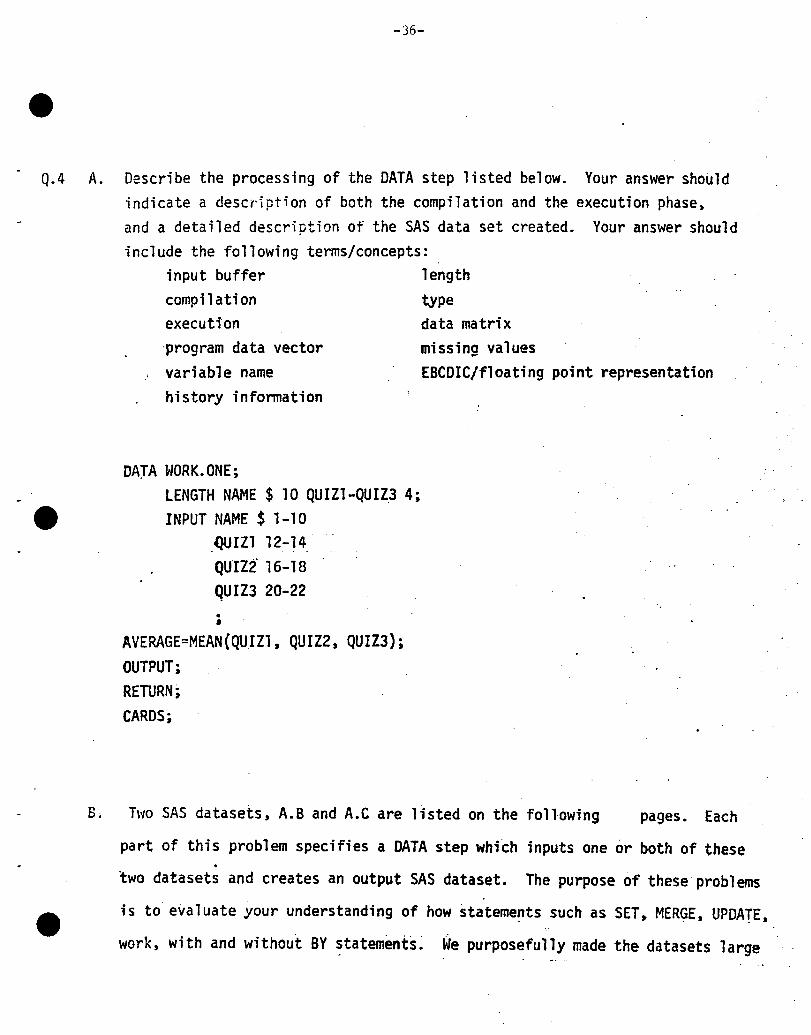
Q.4 A. Describe the processing of the DATA step listed below. Your answer shouldindicate a deSCt1pt i on of both the compilation and the execution phasesand a detailed descr1ption of the SAS data set created. Your answer shouldinclude the following terms/concepts:
input buffer 1engthcompilation typeexecution data matrix'program data vector missing values
, variable name EBCDIC/floating point representationhistory information
DArA WORK. ONE;LENGTH NAME $ 10 QUIZ1-QUIZ3 4;
~ INPUT NAME $ 1-10
{)OIZl 12-~ 4
QUIZi- 16-18
QUIZ3 20-22.,
AVERAGE=MEAN{QUIZ1, QUIZ2, QUIZ3)iOUTPUT;RETURN;CARDS;
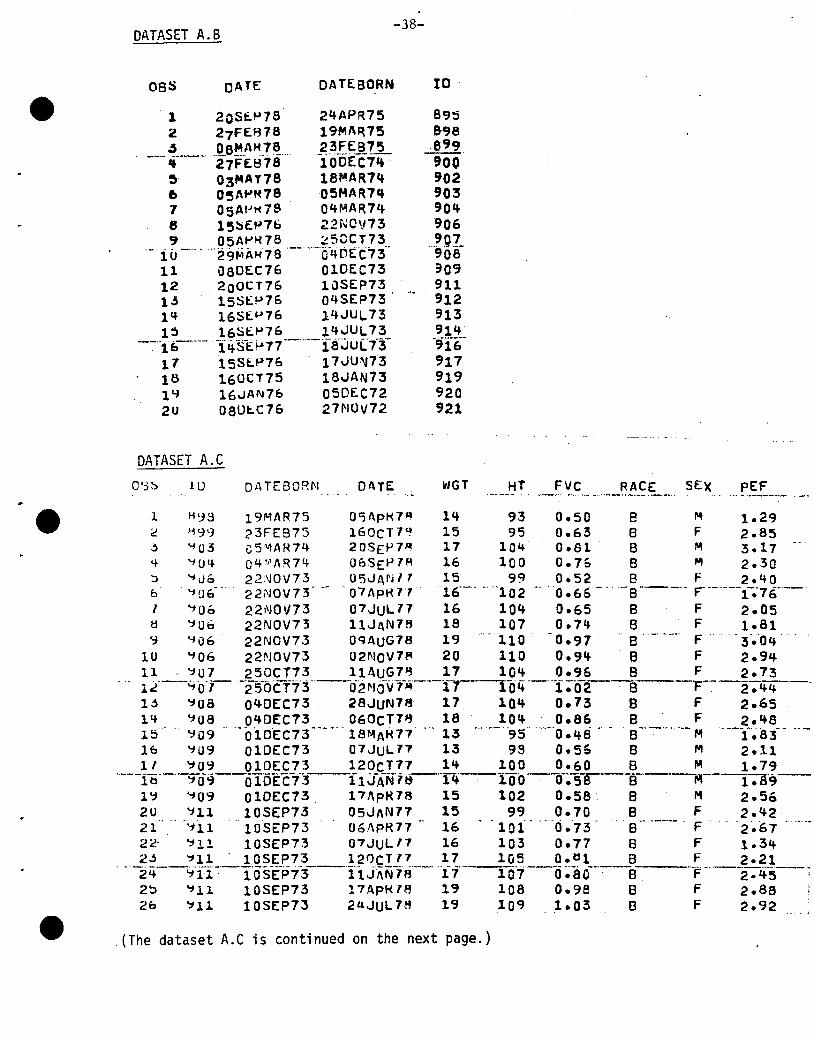
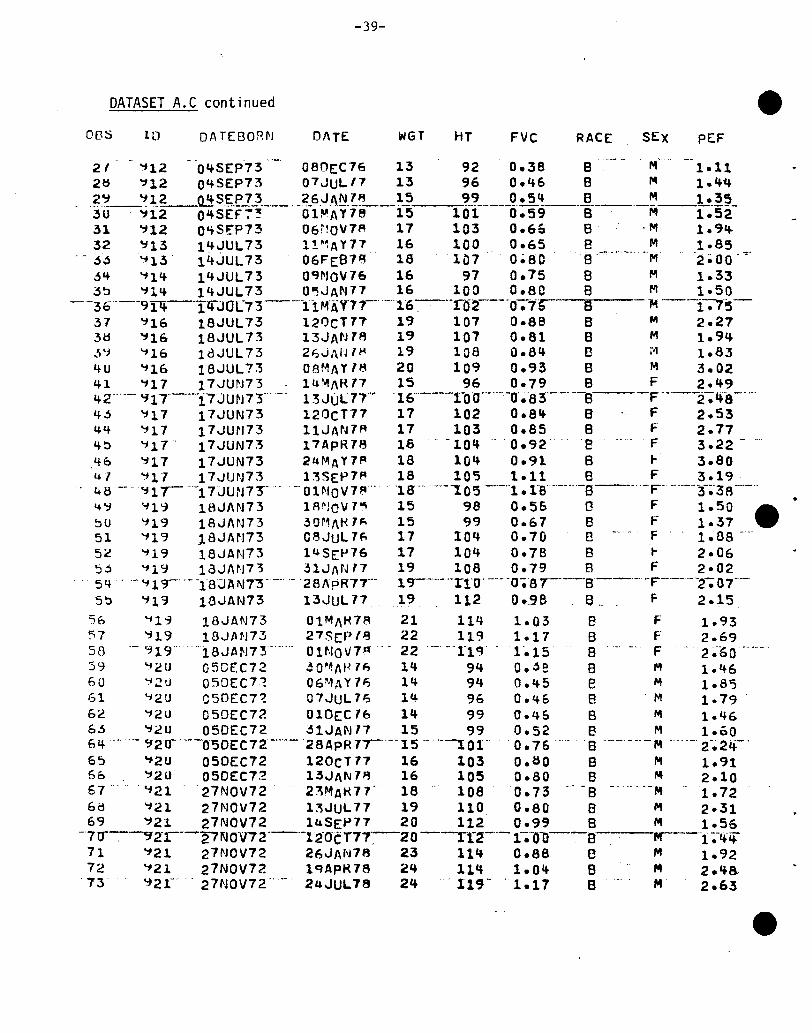
B. Two SAS datasets s A.B and A.C are llsted on the following pages. Each
part of this problem specifies a DATA step which inputs one or both of these.two datasets and creates an output SAS dataset. The purpose of these problems
is to evaluate your understanding of how stateme~ts such as SET, MERGEs UPDATE.
work, with and without BY statements~ We purposefully made the datasets large
.e
-37-
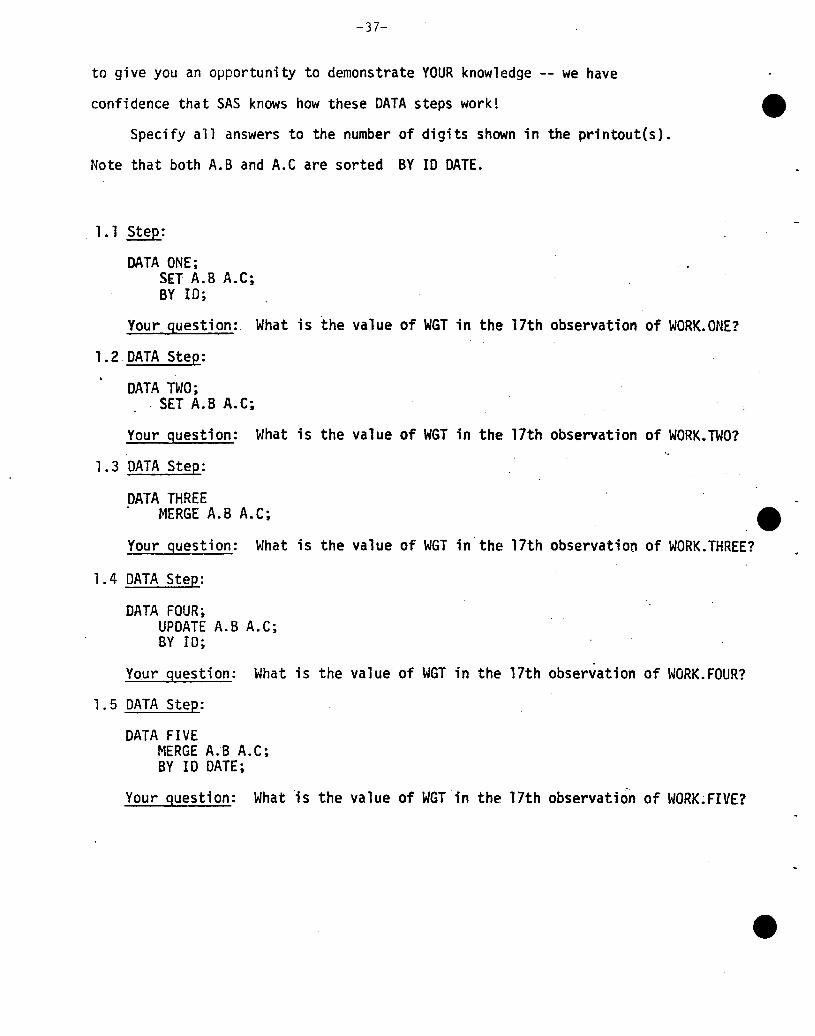
to give you an opportunity to demonstrate YOUR knowledge -- we have
confidence that SAS knows how these DATA steps work!
Specify all answers to the number of digits shown in the printout{s).
Note that both A.B and A.C are sorted BY ID DATE.
1.1 Step:
DATA ONE;SET A.B A.C;BY 10;
Your question: What is the value of WGT in the 17th observation of WORK. ONE?
1.2. DATA Step:
DATA TWO;. SET A. B A. C;
Your guestion: What is the value of WGT in the 17th observation of WORK. TWO?
1. 3 DATA Step:
DATA THREE. MERGE A.B A.C;
Your question: What is the value ofWGT in the 17th observation of WORK.THREE?
1.4 DATA Step:
DATA FOUR;UPDATE A.B A.C;BY 10;
Your guestion: What is the value of WGT in the 17th observation of WORK. FOUR?
1. 5 DATA Step:
DATA FIVENERGE A.B A.C;BY 10 DATE;
Your question: What is the value of WGT in the 17th observation of WORK~FIVE?
DATASET A.B
oss DATE
-38-
DAT£BORN IO
. 1 20S~P78· 24APR752 27FEB78 19MAR7S
--- ~--_d--~-~~i:'~~-- -~Bb~-!~~~ 03MAT78 18MAR1~
6 05Afo'R78 0~HAR7~
7 05AI-'t<79 04fo11AR74e 15~EP7b ~2NOV73
~ 05Afo'H78 ~50CT73.- i u _.... -··29MAHie ·__·····-b"4t''itd C73··
11 080£C76 010£C7312 200CT76 1uS£P7313 15SEP76 Q4S£P7314 16SEP76 14JUL731~ 16SEfo'76 14JUL73
--:-·'1&--- -Iq.sE~77--h--f8~uL73-11 15S~P76 17JUN7318 160C175 18JAN73lY 16~AN76 050EC722U 08U~C76 27NOV72
DATASET A.C
8958-CJ8
.8CJCJ900902903904906907
"90S:109911912913914"916917919920921
lLJ Dt\ TEBORfI.1 DATE: L'JGT HT FVC RACE SEX PEF
1 H~3 19MAR75 O~ApH7~ 14 93 0.50 8 M 1.29c H99 23FES75 160CT7~ 15 95 0.63 8 F 2.85~ '"f03 cSl\llAR74 20SEP7 R 17 104 0.81 8 M 3.17"4 '"fU~ 04~AR74 06SEP7R 16 100 0.7& 8 M 2.30~ '"fu& 22NOV73 U5JAN17 15 99 0.52 B F 2.40o '1Uo'-" 22j\JOV73 -01 AptHf16'-- ""102"0 .6Sd
- "-8---h F--·---1.-.·76--·I '106 22NOV73 01JUL17 16 10~ 0.65 8 F 2.05~ '1Ub 22NOV73 11JAN78 18 107 O.7~ 8 F 1.819 '100 22NOV73 09AUG78 19 110 0.97 . B' F' . '-3~~4
1U '106 22NOV73 02NOV7~ 20 110 0.94 . B F 2.9411 '101 250CT73 11AUG7~ 17 104 0.9& S F 2.731';(--'-1'o-7-··-~'5-0CT73"---d2r-JO-VTJ4---1r--rO,*-- -1;02--'-8-·-.--"F-'~-2-;4~--Ij '1U8 040EC73 28JUN78 17 lQ4 0.73 S F 2.6514 '108 040EC73 060CT78 18 104 0.86 B F 2.4615 '109 ··0'tOEC73 la~"AtH7 13 95·' 0.4S···S--·--.... --M·--1'.83--16 ~09 010EC73 Q7JUL77 13 99 0.5& 8 M 2.1111 '109 OlOEC73 120CT71 14 100 0.60 B M 1.79
··---i~·-"'1O.;j--cTDEC73 ii;JA-N·l~·-r4--1-00-l)~sr--B·--jIlI---1-;a·9--
l~ '109 010EC73. 17 ApR18 15 102 0.58 B M 2.562U '111 10SEP73 05JAN71 15 99 0.70 8 F 2.4221 'jl1 "10'SEP73 06l\pR71 16 101" ~·-"(j.·73 8~-·~--·_·_· F·' '2'.672~' ~11 10SEP73 07JULf7 16 103 0.77 8 F 1.342j '111 10SEP73 120CT17 17 105 0.~1 B F 2.21
··2L+--'1·ii~·-TOS-E:"pf3---'iiJi\N18--'--' '17'---1 0'''--0 ~'a0-----8 -'F ·..--2:-4-5-·....-;2~ ~11 10SEP73 17ApHIR 19 108 0.ge 8 F 2.8826 '111 10SEP7J 2UJUL7~ 19 10~. 1.03 B F 2.92
(The dataset A.C is continued on the next page.)
-39-
DATASET A.C continued
OE3S III DATEBORI'J DATE WGT HT FVc RACE SEX PEF
21 ':112' - '04SEP73 080EC16 13 92 0.38 8 . rof 1.112tl ~12 04SEP73 Q7JuLI1 13 96 0.46 8 M 1.4~
;ij--~t~~~~~-~-~_o__ o-~t~1~-i}-0-t-~ 1 ~_~ ~o:; ; __0~-----~--~:~~-31 ~12 0~SEP73 06MOV1R 17 103 0.6& B ·M 1.9~
32 ~13 14JUL73 1!~AY17 16 100 0.65 8 M 1.S5- - j~ ':'f13° 14.JUL73 06FEB1~ 18 101 0~8C So M 2 ~OO . .".
jq ':11l+ 14JUL73 O~NOV16 16 97 0.75 S M 1.333~ ':114 14JUL73 O~JAN11 16 100 O.SO S M 1.50
--36°--9~-TlfJUL73-_u11M-l\Y'71--,_016-,----r02----o-;1r--S OM ----i-;r-s-37 ~16 18JUL73 120CT77 19 107 0.88 S M 2.273tl ~16 18JUL73 13JAI'J7R 19 107 O.Sl S M 1.94~~ ':'116 18JUL73 2~JANIH 19 108 0.84 B M 1.834U ':116 18JUL73 OBMI\Yl~ 20 109 0.93 8 M 3.0241 ':111 17JUN73 luMAR77 15 96 0.79 8 F 2.4942"-- ':J17°---i7JUN73"-' 13JUL77·· °16°----1-00--·-·0--lJ~083°--·u-S F-"-2-;'fS-'--4~ ~17 17JUN73 120CT17 17 102 0.84 S F 2.5344 ':117 17JWJ73 11JAtJ1R 11 103 0.85 8 F 2.774~ ':117 00 17JUN73 17ApR18 18 0.0 -104 .. '0.92. 08 F 3.22 - 0'40 ~17 17JUN73 2uMAY7R 18 104 0.91 8 ~o 3.8047 ':'fl1 17JUN73 13SEP7R 18 10~ 1.11 B F 3.1948-- 0 "11r-,u1 7JUN73- -- 0 H10V 1~o. 018" ---""105---"1.1080_o--· ..-S----ouF- -,0---'3-;-3If-'-"4 ~ '-119 18J J\l\J 73 1 R ~J 0 V7" 15 98 0 .55 0 F 1 .50 A~u ':119 18JAN73 ~OMAH7~ 15 99 0.67 8 F 1.37 ~51 ':119 18JAN73 C8JUL7~ 17 104 0.70 B F l;OS _.,5~ '-119 18JAN73 14 SEP16 17 104 0.78 B ~ 2.065j ':'119 IdJAN73 ~IJAN77 19 108 0.79 B F 2.0254 .- '-119- 0 '-T8JAN7T--"- 28I\pR77--- lc;r-'---rl'O' ..·--O-;S1---·S'----·-F----·--2""";07'·-5~ '113 18JAN73 13JUL17 19 112 0.98 e. F- 2.15
S6 ':'Il~ 18JAN73 01MI\H7R 21 114 1.03 8 F 1.9357 '119 13JftN73 27SCPI8 22 119 1.17 8 F 2.6958 .. ~19"18JAN73-'0-, OHIOV7 n -' 22 0,--0'11cr 1 0.15 S F2~-bO"'"
59 '1~U 05CEC72 ~O~I\P7~ 14 94 o.je 8 M 1.466U '12U 050EC72 06MAY1~ 14 94 0.45 e M 1.8~
61 ':'I2U C50EC7~ 07JUL1~ 14 96 0.4& 8 M 1.7962 ':12U Q50EC72 OlOEC7b 14 99 0.46 8 M 1.466~ '12U 050EC72 31JAN17 15 99 0.52 B M 1.006 4 0_"-Cjzcr"--050E C72'--··_028 ApR 7,---15 0- '--, 01" '0.76 -'0' 8--- - _. - M - -..... 2-.24-'65 ':12U 050EC72 120C177 16 103 0.80 8 M 1.9160 ~2U 050EC72 13JAN78 16 10~ 0.80 8 M 2.1067 "0 . "f21 -27NOV72 - 2::'lMAt<71' 0 18 1080.73 " -8 - "'--M -1.726M ':121 27NOV72 13JUL17 19 110 0.80 8 M 2.3169 '121 27NOV72 I~SE~17 20 112' 0.99 S M 1.56
-7r:r-,~2T---2,NOV72---'-l2"0CT77'0
-20----rr2----l-;°O·O--e-----,.r--·"1 ;-~if
11 ~21 27NOV72 26JAN78 23 114 0.88 8 M 1.9272 ':121 27NOV72 lqAPH78 24 114 1.04 S M 2.4a73 ~21- 27NOV72 .. ·.. 2~JUL18 24 '119-- '1.17 S M 2.63
-40-
[)rJ'ARTr.tLNT OF BIOSTATISTICS
Special MS Examination, 1983April 9, 1983: 1 - 4 PM
Part I
Answer any three of the following questions. This is a closed bookexamination.
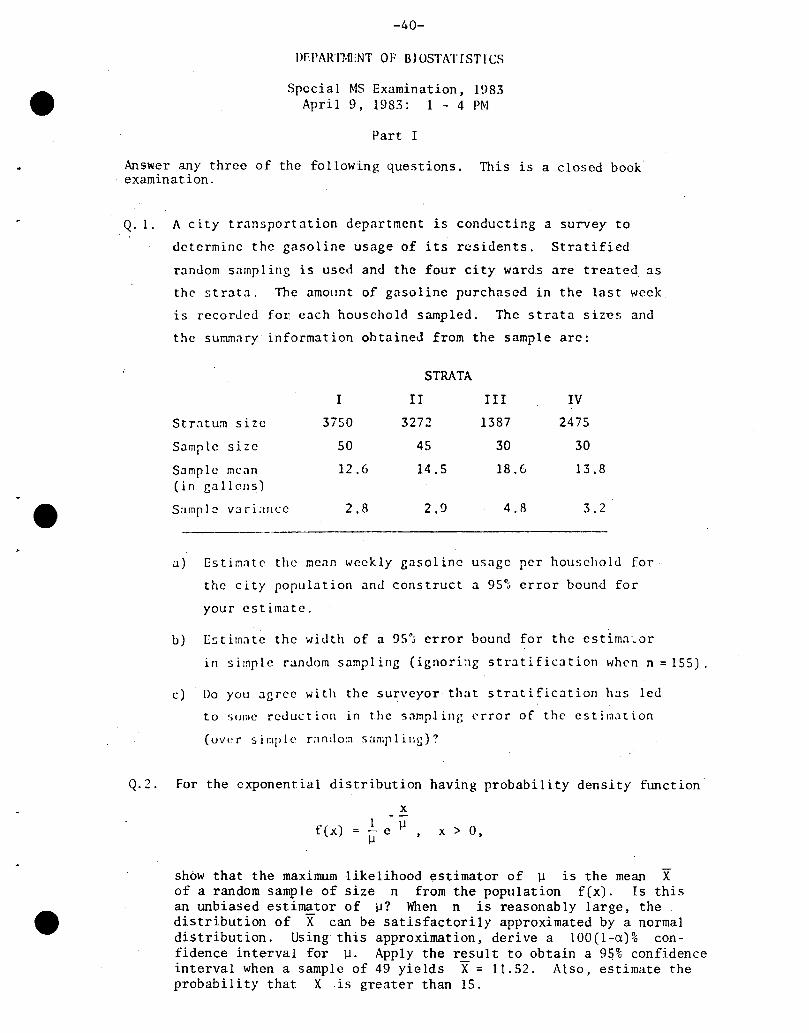
Q.l. A city transportation department is conducting a survey to
determine the gasoline usage of its residents. Stratified
random sampling is used and the four city wards are treated as
the strata. The amount of gasoline purchased in the last week
is recorded for each household sampled. The strata siz-cs and
the summary information ohtained from the sample are:
STRATA
I II III IVStratum size 3750 3272 1387 2475
Sample size 50 4S 30 30
Sample mean 12.6 14.5 18.6 13.8(in gallolls)
e Sarnpl~ vari;lIlce 2.8 2.9 4.8 3.2
a) [stir.late the mean weekly gasoline usage per household for
the city population and construct a 95% error bound for
your estimate.
b) Estim:lte the willth of a 9S"j error bound for the estima·~or
in simple random sampling (ignorbg stratific3tion when n = ISS).
c) Do you 3grec with the surveyor that str3tific3tion has led
to ';Olne reduct iOIl in the sarnp.I in!~ error of the estimat ion
(over sir:Jplc r:lndo::l samplill~)?
Q.2. For the exponential distribution having probability density function
f(x)
xle lJlJ
x > 0,
show that the maximum likelihood estimator of lJ is the mean Xof a random sample of size n from the popUlation f(x). Is thisan unbiased estimator of lJ? When n is reasonably large, thedistribution of X can be satisfactorily approximated by a normaldistribution. Using this approximation, derive a 100(1-a)% confidence interval for lJ. Apply the result to obtain a 95% confidenceinterval when a sample of 49 yields X= 11.52. Also, estimate theprobability that Xis greater than 15.
-41-
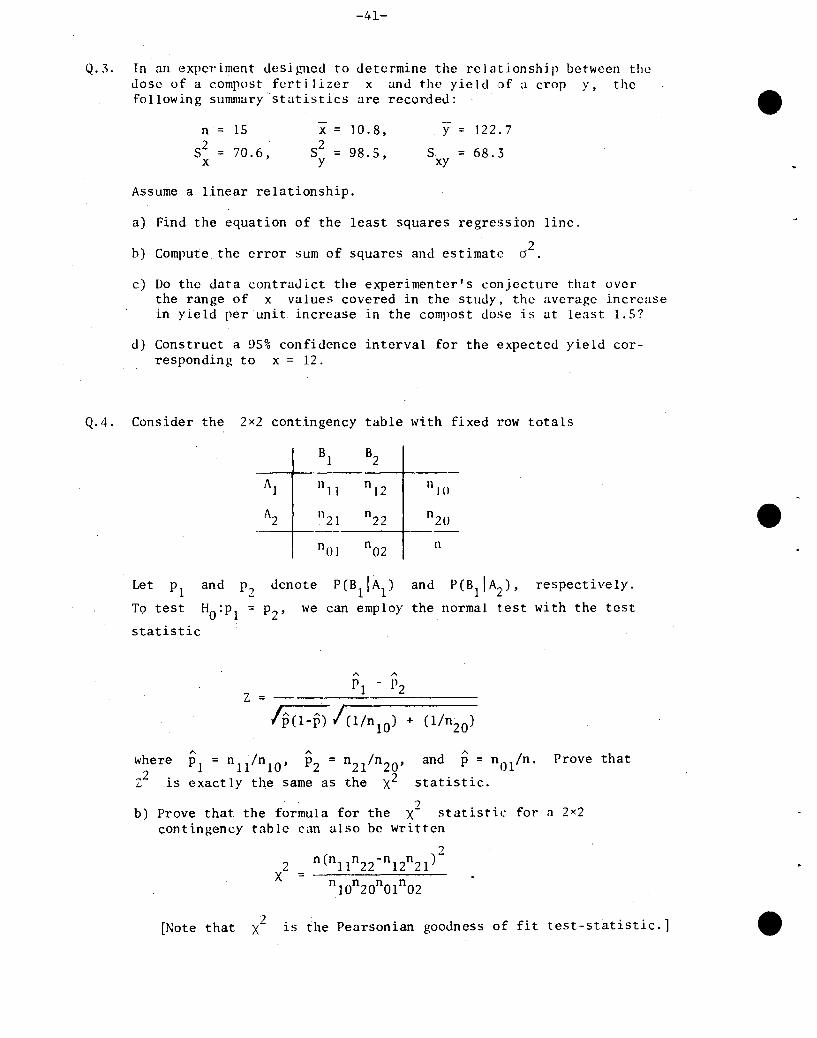
Q.3. In an experiment UCSll-.'llCd to detcrmine the rc 1atlonship betwcen theJose of a compost fert i ] izer x and the yic ld of a crop y, thefollowing summary statistics are recorded:
n 15
S2 = 70 6. ,x
x = 10.8,
S2 = 98 5y .,
y = 122.7
S = 68 ..3xy
Assume a linear relationship.
a) Find the equation of the least squares regression line.
b) Compute the error sum of squares and estimate 2a .
c) Do the data contraJict the experimenter's conj.ecturc that ovcrthe range of x values covered in the study, the averagc increasein yield per unit increase in the compost dose is at least 1.5?
d) Construct a 95% confidence interval for the expected yield corresponding to x = 12.
Q.4. Consider the 2x2 contingency table with fixed row totals
B1 B2
A] 11 11 n l2 1110
1\2 Iln n22 n20 enOI
n02 Il
Let PI and P2
To test HO:P1
statistic
denote PCBIIAl) and pCB]IA2), respectively.
P2' we can employ the normal test with the test
A A
PI - P2Z =
/PC1-P') I C1/n10
) +
where PI = n 11 /n 10 , P2 = n21 /n 20 ,
Z2 is exactly the same as the X2and P= nO/no
statistic.
Prove that
7b) Prove that the formula for the X- statisti.c for a 2x2
contingency table can also be written
2X
..,I1Cn]ln22-n12n21)-
n10n20n01n02
[Note that 2X is the Pearsonian goodness of fittest-statistic. 1
-42-
SPECIAL MS WRITTEN EXAMINATION IN BIOSTATISTICS, PART II
April 10, 1983
(1 PM - 4 PM)
INSTRUCTIONS:
a) This is an open-book "in class" examination.
h) Answer from Part I any two of the 3 questions which follow. Alsoanswer Q.4 from Part II. (Thus 3 answers in all)
c) Put the answers· to different questions on separate sets of papers.
d) Put your code letter, not your name on each page.
e) Return the examination with a signed statement of the honor pledge ona page separate from your answer.
PART I (of PART II)
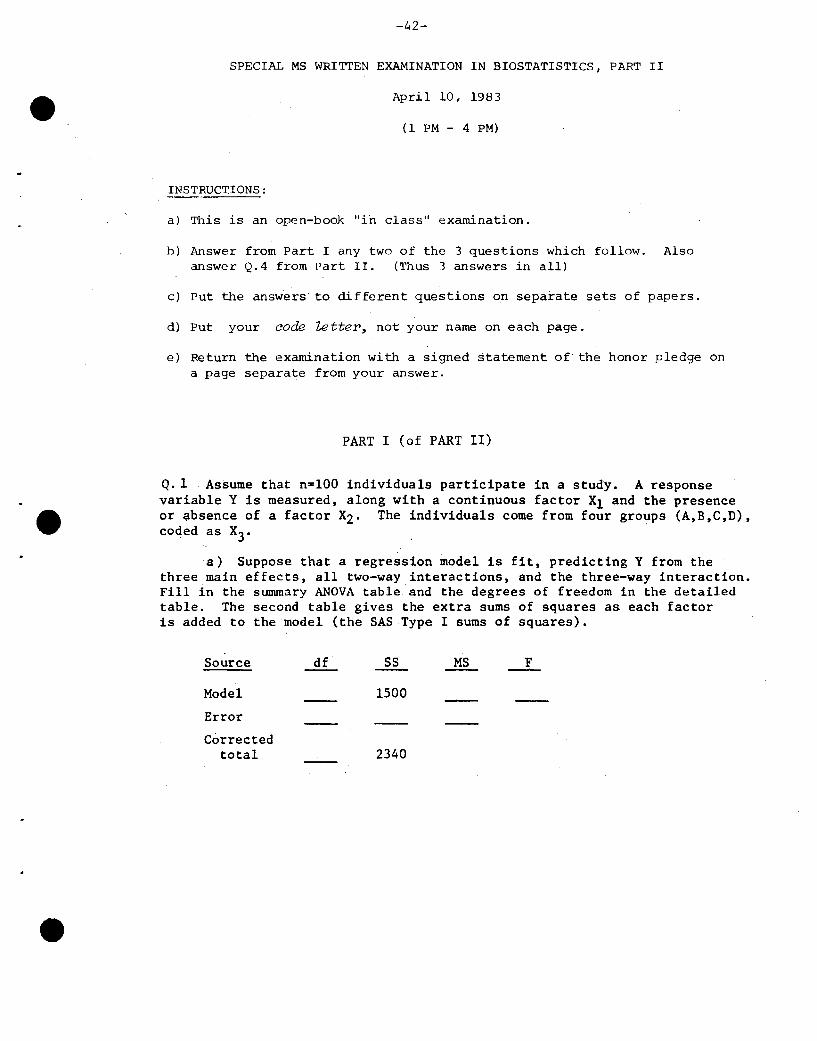
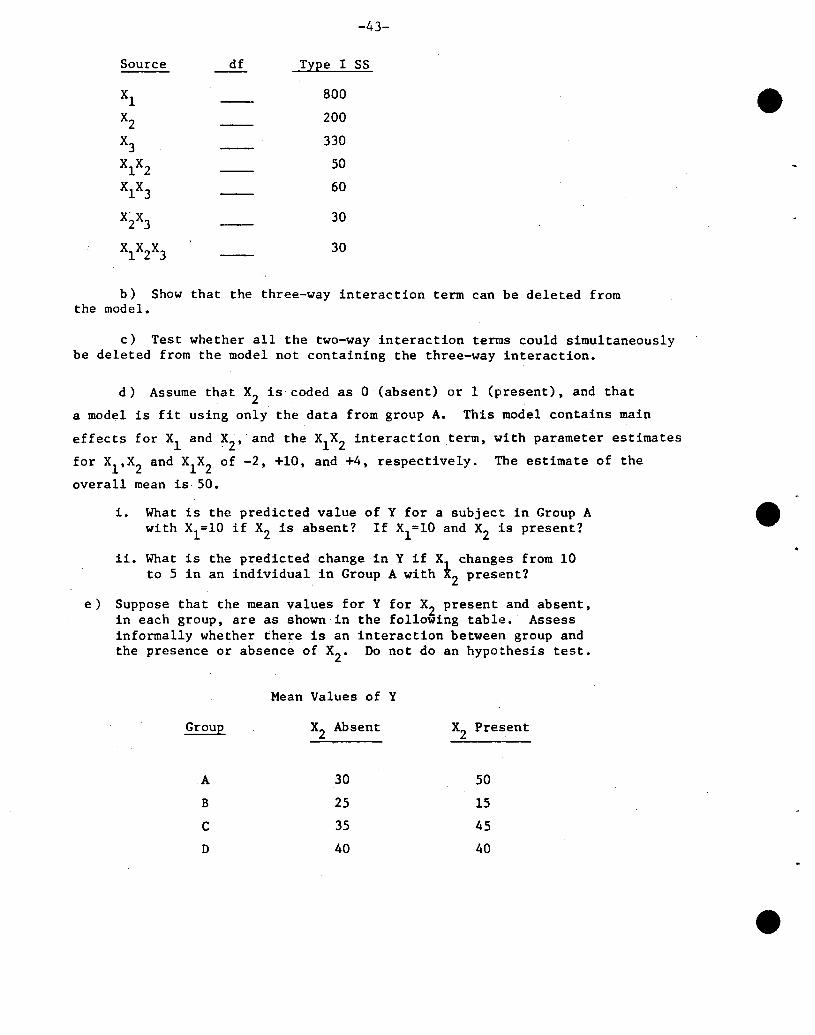
Q.l Assume that n=IOO individuals participate in a study. A responsevariable Y is measured, along with a continuous factor Xl and the presenceor absence of a factor X2. The individuals come from four groups (A,B,C,D),coded as X3 •
a) Suppose that a regression model is fit, predicting Y from thethree main effects, all two-way interactions, and the three-way interaction.Fill in the summary ANOVA table and the degrees of freedom in the detailedtable. The second table gives the extra sums of squares as each factoris added to the model (the SASType I sums of squares).
Source
Model
Error
Correctedtotal
df SS
1500
2340
MS F
Source
XlXzX3XlXZXl X3
Xi X3
Xl
XZX3
b) Show that the three-way interaction term can be deleted fromthe model.
c) Test whether all the two-way interaction terms could simultaneouslybe deleted from the model not containing the three-way interaction.
d) Assume that Xz is coded as 0 (absent) or 1 (present), and that
a model is fit using only the data from group A. This model contains main
effects for Xl and XZ,"and the XlXZ interaction term, with parameter estimates
for Xl,XZ
and XlXZ
of -Z, +10, and +4, respectively. 1be estimate of the
overall mean is 50.
i. What is the predicted value of Y for a subject in Group Awith Xl=lO if Xz is absent? If Xl=lO and X2 1s present?
ii. What is the predicted change in Y if Xl changes from 10to 5 in an individual. in Group A with X2 presl~nt?
e) Suppose that the mean values for Y for X2 present and absent,in each group, are as shown in the following table. Assessinformally whether there is an interaction between group andthe presence or absence of X2 • Do not do an hypothesis test.
Mean Values of Y
Group X2 Absent X2 Present
A 30 50
B 25 15
C 35 45
D 40 40
-44-
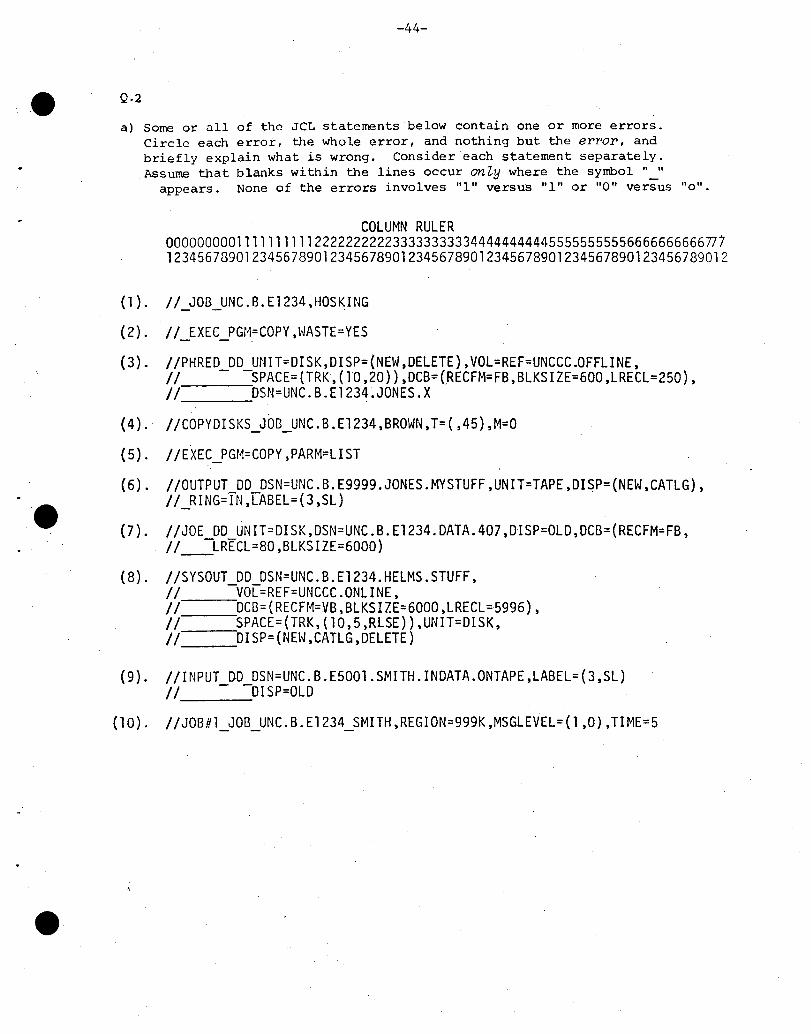
Q.2
a) Some or all of the JC~ statements below contain one or more errors.Circle each error, the whole error, and nothing but the err~r, andbriefly explain what is wrong. Consider each statement separately.Assume that blanks within the lines occur onZy where the symbol "_"
appears. None of the errors involves "1" versuS "1" or "0" versus "a".
COLUMN RULER000000000111111111122222222223333333333444444444455555555556666666666n7123456739012345678901234567890123456789012345678901234567890123456789012
(l) .
(2).
(3).
(4) .
(5).
(6).
e (7) .
(8) .
II_JOB_UNC.B.E1234,HOSKING
II_EXE C_PGI·l= COpy ,HASTE=YES
IIPHRED DO UNIT=DISK,DISP={NEH ,DELETE), VOL=REF=UNCCC.OFFLINE,II - -SPACE=(TRK,(lO,20)),DCB=(RECFM=FB,BLKSIZE=600,LRECL=250),II DSN=UNC.B.E1234.JONES.X
IICOPYDISKS_JOB_UNC.B.E1234,BROWN,T=(,45),M=0
I IEXEC_PGr~=cOPY ,PARM=LIST
IIOUTPUT DO DSN=UNC.B.E9999.JONES.MYSTUFF,UNIT=TAPE,DISP=(NEW,CATLG),I I _RING=TN, LABEL= (3 ,SL)
IIJOE DO UNIT=OISK,DSN=UNC.B.E1234.DATA.407,DISP=OLD,DCB=(RECFM=FB,II~LRIcL=80,BLKSIZE=6000)
IISYSOUT DO DSN=UNC.B.E1234.HELMS.STUFF,II -VO[=REF=UNCCC.ONLINE,II DCB=(RECFM=VB,BLKSIZE=6000,LRECL=5996),II SPACE=(TRK,(lO,5,RLSE)),UNIT=DISK,II DISP=(NEH,CATLG,OELETE)
(9). I/INPUT OD OSN=UNC.B.E5001.SMITH.INDATA.ONTAPE,LABEL=(3,SL)II - -OISP=OLD
(l 0) . I I JOB#l_JOB_UNC. B. E1234_SMITH ,REGION=999K ,MSGLEVEL= (1 ,0) ,TI ME=5
-45-
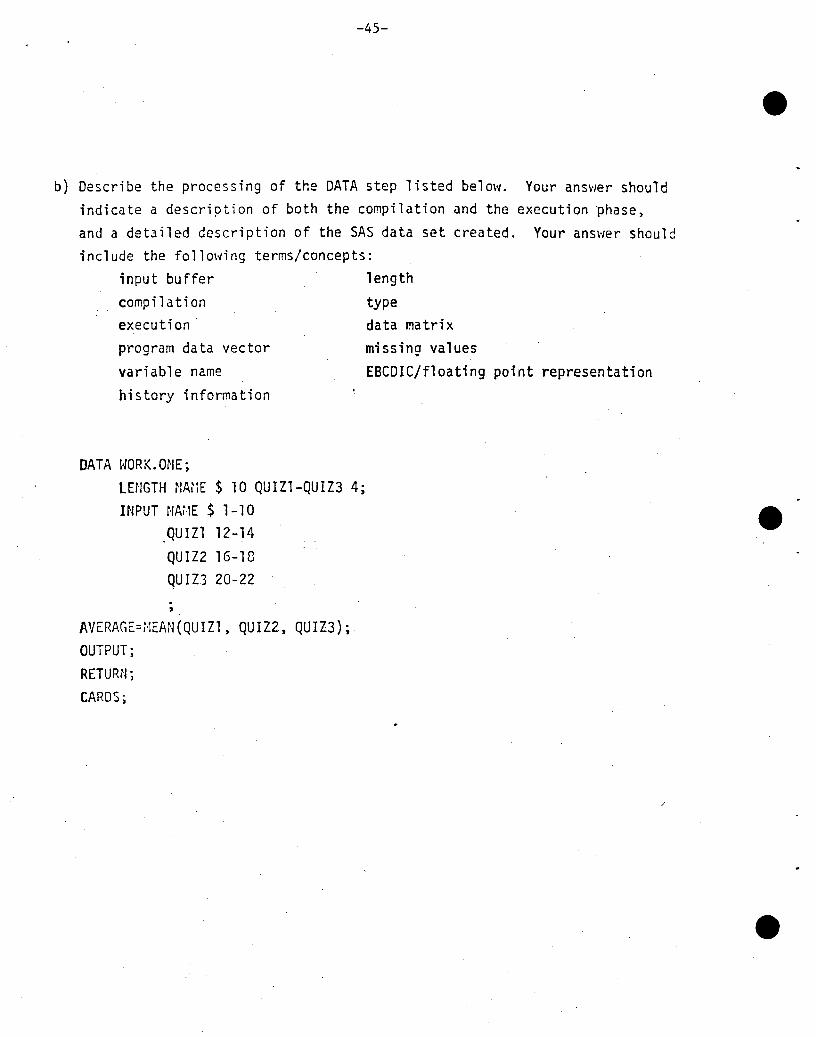
b) Describe the processing of the DATA step listed below. Your ans~/er shouldindicate a description of both the compilation and the execution phase.and a detailed description of the SAS data set created. Your ans~/er shouldinclude the following terms/concepts:
input buffer lengthcompilation typeexecution· data matrixprogram data vector
variable namehistory information
missing values
EBCDIC/floating point representation
DATA t-JORK.ONE;LErlGTH NMiE $ 10 QUIZ1-QUIZ3 4;INPUT NAME $ 1-10
QUIZl 12-14QUIZ2 16-18QUIZ] 20-22;
AVERAGE=MEAN(QUIZ1, QUIZ2, QUIZ3);OUTPUT;RETURN;
CAfWSj
-46-
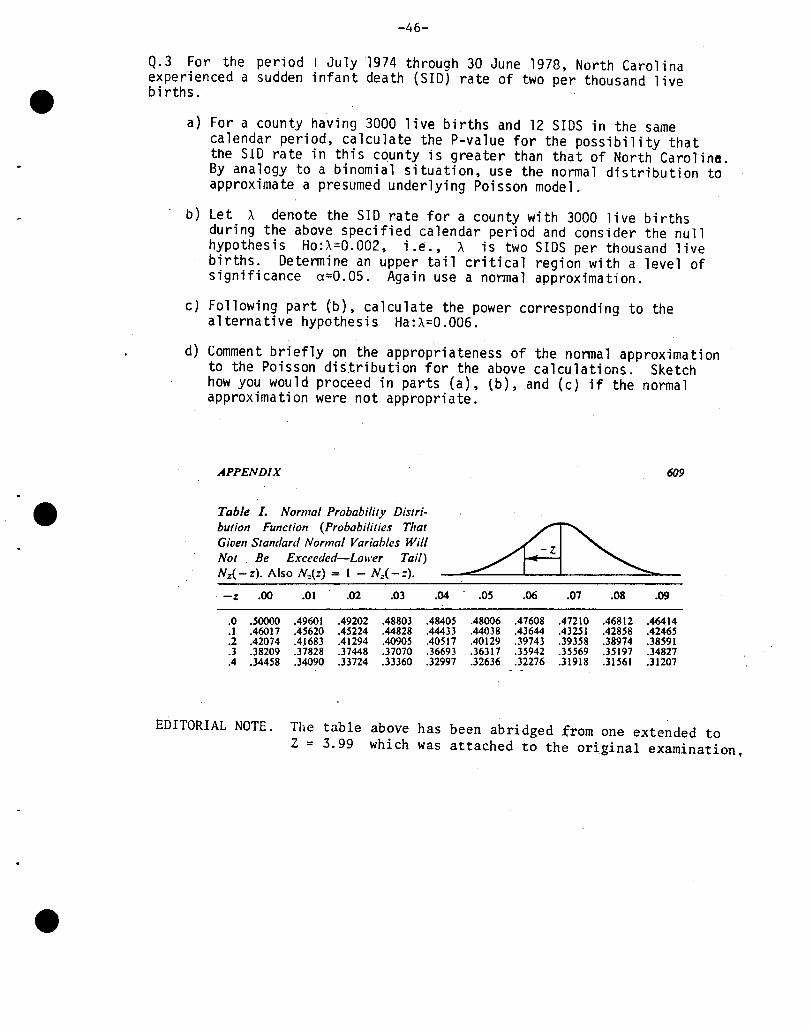
Q.3 For the period I July 1974 through 30 June 1978, North Carolinaexperienced a sudden infant death (SID) rate of two per thousand 1ivebirths.
a) For a county having 3000 live births and 12 SIDS in the samecalendar period, calculate the P-va1ue for the possibility thatthe SID rate in this county is greater than that of North Caroline.By analogy to a binomial situation, use the normal distribution toapproximate a presumed underlying Poisson model.
b) Let :\ denote the SID rate for a county with 3000 live birthsduring the above specified calendar period and consider the nullhypothesis Ho::\=0.002, i.e., :\. is two SIDS per thousand livebirths. Determine an upper tail critical region with a level ofsignificance a=0.05. Again use a normal approximation.
c) Following part (b), calculate the power corresponding to thealternative hypothesis Ha::\=0.006.
d) Comment briefly on the appropriateness of the normal approximationto the Poisson distribution for the above calculations. Sketchhow you would proceed in parts (a), lb), and (c) if the normalapproximation were not appropriate.
APPENDIX 609
Table I. Normal Probability Distri-bution Function (Probabilities That
~Given Standard Normal Variables WillNot Be Exceeded-Lower Tail)Nz( - z). Also N:(z) = I - Nz ( - :).
-z .00 .01 .02 .03 .04 .05 .06 .07 .08 .09
.0 .50000 .49601 .49202 .48803 .48405 .48006 .47608 .47210 .46812 .46414
.] .46017 .45620 .45224 .44828 .44433 .44038 .43644 .43251 .42858 .42465
.2 .42074 .4J683 .41294 .40905 .40517 .40129 .39743 .39358 .38974 .38591
.3 .38209 .37828 .37448 .37070 .36693 .36317 .35942 .35569 .35197 .34827
.4 .34458 .34090 .33724 .33360 .32997 .32636 .32276 .319]8 .3]561 .3]207
EDITORIAL NOTE. The table above has been abridged from one extended toZ = 3.99 which was attached to the original examination,
-47-
PART II (of PART II)
Q.4 A clinical trial is conducted to assess the efficacy of a new drug to alle
viate symptoms of depression. Patients are randomized to Drug (D) or Placebo (P)
in equal proportions at three psychiatric clinics. A total of 120 patients are
entered with 20 patients allocated to each treatment group at each clinic.
Patients are tested for depression at baseline and at weeks 1, 2, 3, and 4•
. About 30% dropout occurs by week 4 (this attrition is to be expected in
depression trials) and so, the statistical analyst decides to concentrate on
"final rated value" as the main dependent variable. The scale of measurement of
major interest is Total Score of Hamilton Depression Scel1e. This scale is from
0--62 with
0-13 ~ little or no depression (essentially "cured")
14-19~ minor depression (not sick enough to enter trial but not wellenough to be "cured")
20-29 ~ moderate depress ion
> 30 ~ severe depress i on.
Some controversy ensues about the univariate statistical analysis of the
final rated values of the Hamilton Depression Scale. One aspect of the contro~
versy is that there is significant treatment x clinic interaction. Clinic 1"
shows a preference for placebo (non-significant); clinic 2 shows a preference
for drug (non-significant); clinic 3 shows a significant preference for drug.
The other aspect of the controversy is whether to adjust for the pre HAMD score
via covariance analysis. In clinic 1, placebo patients are a little more severe
at baseline (not significant, p = .19); in clinic 2, there are no treatment group
differences at baseline (p = .56); in clinic 3, drug patients are more severe at
baseline (near significance, p = .08). Six different methods of analysis to
test treatment effects are proposed by different statisticians. These are as
follows:
-48-
1. Two-way ANOVA
Two-way ANOVA of final HAMD scores employing treatment and clinic as maineffects and treatment by clinic interaction.
2. Two-way ANOVA of differences
Two way ANOVA of "final HAMD score minus pre HAMD score" employing treatmentand clinic as main effects and treatment x clinic interaction.
3. Two-way ANCOVA
ANCOVA of final HAMD scores employing pre HAMD score as a covariate. Themain effects treatment and clinic would be included in the model and sowould treatment x clinic interaction.
4. Separate ANOVA's
A t-test on final HAMD scores for each clinic separately.
5. Separate ANCOVA' s--different slopes
ANCOVA on final HAMD scores for each clinic separately. The covariate ispre HAMD score and the main effect is treatment (i.e •• covariance adjustedt-test).
6. Separate ANCOVA's--common slope
ANCOVA on final HAMD scores for each clinic separately. The (linear)covariate is pre HAMD score but with a slope that is derived from a pooledanalysis of all three clinics. The main effect is treatment.
Question
(l8points)i. Comment on each of the proposed analyses outlining the advantagesand disadvantages of each.
(7 points) ii. Which of the six analysis strategies would you choose? Explainwhy.
NOTE: For the purposes of this question. assume that the usual parametricassumptions of normally and independently distributed errors with zero mean andconstant variance are reasonably appropriate. In other words. do not deal withthe issues regarding whether a non-parametric or parametric analysis isappropriate.
-49-
BASIC MASTER LEVEL WRITTEN EXAMINATION IN BIOSTATISTICS
PART I
(Januarv 21. 1984)9:30 AM to 12:30 PM
1. Suppose that the main purpose of a statewide household surveyis to estimate the proportion (P) of North Carolina householdswithout any form of health insurance. A self-weighting household sample is selected by using simple random sau~ling in eachof three stages, with clusters of unequal size in the first twostages. The estimator of P is the simple proporti.on of uninsuredhouseholds in the sample. The estimate turns out to be 0.24,with a standard error of 0.02 and a design effect of 1.2.
(a) State whether or not the estimator of P is unbiased.Briefly explain your answer.
(b) How many sample households produced the estimate (Le.,0.24)?
(c) How many sample households, chosen by simple random sampling(i.e., no cluster sampling), would have been needed to producethe same amount of statistical precision (Le., st.andard errorof 0.02)?
2. Let Xl' X2 ,_••• 'Xn be
2~ n - 2S (-1) l: (X.-X) •
n i=l 1
a random sample from N(~,a2)"
Using the fact that
2(n-l)S ~ X2
0 2 (n-l)
Let
solve the following problems:
(b) Find random variables A and B such that pr(A<a2<B)=(l-a),O<a<l.
(c) Let t>O and O<p<1. Use Tchebysheff I s Theorem to find thesmallest sample size n such that
pr{IS2_a21<ta2}~p.
[HINT: Your lower bound for n will be a function of t and p.)
-50-
3. Let Y be normally dintributed with mean ~ and variance 02 A
random sample of size n is drawn of values of Y. The sample
mean is used to estimate ~ and to test H :~=O. For partsa
(a) and (b), assume that 0 2 is known.
Suppose that detection of a fixed alternative ~=m 0 is of
interest, and that the hypothesis test is done with a=.05.
(a) Determine the chance of rejecting H (the power of the test)a
if the sample size is chosen so that the half-width of a 95%
confidence interval for ~ is m.
(b) Suppose that sample size is determined to obtain a given
power for the fixed alternative ~=m. Show that, with this
sample size, the half-width of a 95% confidence interval for
~ is a fixed percent of m, the percent depending on the power
but not on m and not on 0 2 •
(c) Show how that analysis is modified if the variance is
unknown. Give a very brief proof that your result in (a) is
still valid.
4. Suppose that the length of life of electric tube, T, has an
exponential probability density function
-AtfT(t)=Ae , t>O, 1..>0.
In a sample of n tubes observed for a period 1", d tubes failed,
while the lifetimes of the remaining tubes were greater than 1".
(a)
(b)
(c)
Find the maximum likelihood estimator of I.. (I.. , say).n
Find the approximate expected value of I.. •n
Show that the approximate variance (its lower bound) of
~ is Var6)n n
-51-
BASIC MASTER LEVEL WRITTEN EXAMINATION IN BIOSTATISTICS
PART II
(January 22, 1984: 2-5 PM)
1. Assume that the dataset UNC.B.E555V.BIOSTAT.LIPID.LAB contains datarecords keyed from the attached Lipid Laboratory Data Form. Assuming thisis a catalogued dataset stored at TUCC, write the program needed to createa permanent SAS dataset from this file, perform some basic edits. andprint some descriptive statistics. This program should consist of theappropriate JCL and three SAS steps which perform the following tasks:
a) Read the data records and create a SAS dataset named LABONE. This SASdataset should be stored in a SAS data library created by your job andnamed
UNC.B.E555V.BIOSTAT.LIPID.SASDATA
Read each of the fields except those identified aH "always blank."Use the SAS variable names shown in the attached table. Provideappropriate formats and labels for these variableH. This portion ofthe program should include JCL statements to read the data file andcreate the SAS data library. Assume the following JCL statements aregiven:
//EXAM JOB UNC.B.E123X,STUDENT//*PW=LUCK/ / EXEC SAS
b) Write a SAS DATA step to read LABONE and create a temporary SASdataset named LABCLEAN containing only those data values that passthe following edit tests:
variable
FORMNOCHYLOTRIGTRIGBLKTRIGADJ
valid values
SLDAII, 2, 90-20000-99TRIG-TRIGBLK (i.e., the value of TRIG minus the
value of TRIGBLK)
This step should print an error message on the SAS log, withappropriate information, for each data value which fails an edit andthen set the value to missing.
c) Write a SAS PROC step to print descriptive statistics (including thenumber of missing values, mean, minimum value, maximum value, andvariance) for the variables TRIG and TRIGADJ. Provide appropriatetitling information.
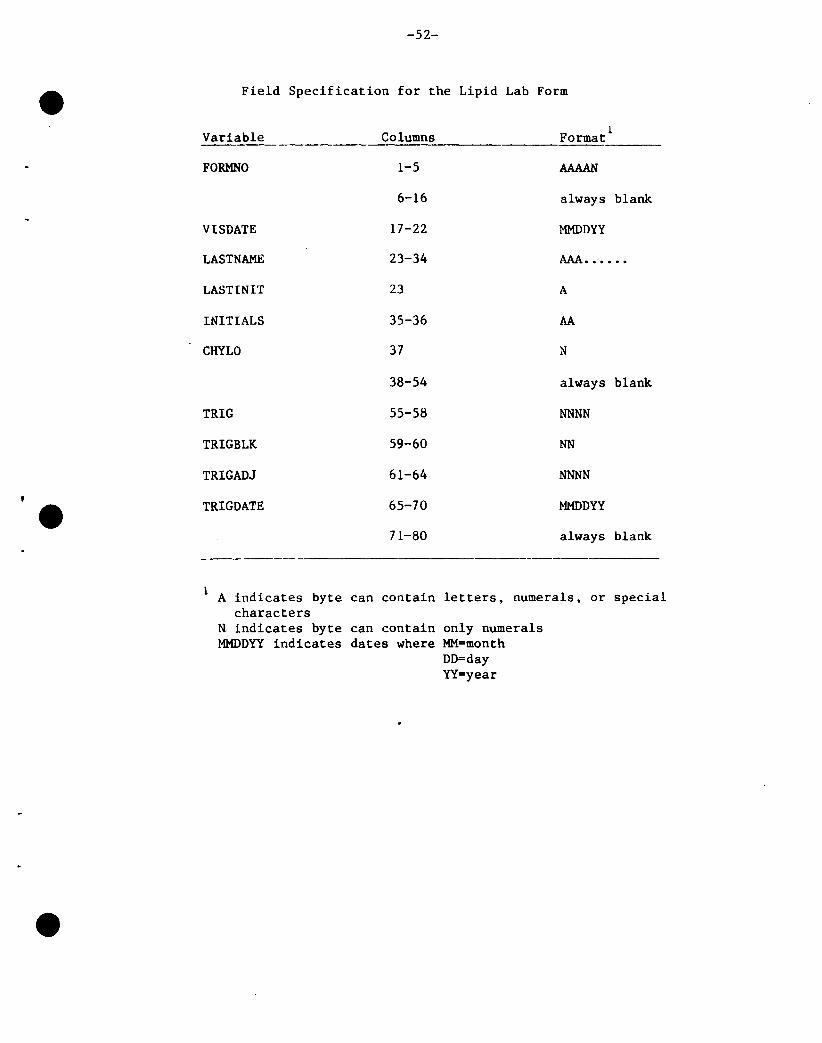
-52-
Field Specification for the Lipid Lab Form
Variable Columns Format1
----FORMNO 1-5 AAAAN
6-16 always blank
VISDATE 17-22 MMDDYY
LASTNAME 23-34 AAA. ••••••
LASTINIT 23 A
INITIALS 35-36 AA
CHYLO 37 N
38-54 always blank
TRIG 55-58 NNNN
TRIGBLK 59-60 NN
TRIGADJ 61-64 NNNN
e TRIGDATE 65-70 MMDDYY
71-80 always blank
A indicates byte can contain letters, numerals, or specialcharacters
N indicates byte can contain only numeralsMMDDYY indicates dates where MM=month
DD=dayYY=year
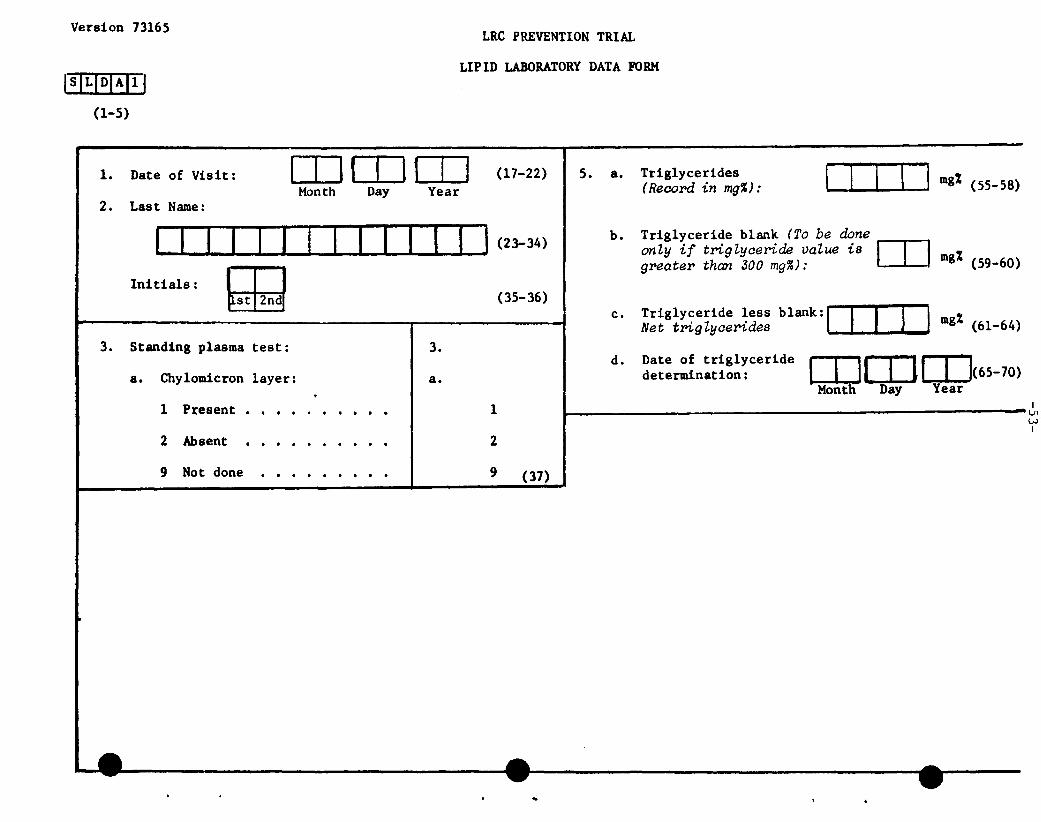
Version 73165
~(1-5)
LRC PREVENTION TRIAL
LIPID LABORATORY DATA FORM
1. Date of Visit:
2. Last Name:
OJOJITJMonth Day Year
(17-22) 5. a. Triglycerides(Record in mg%): CIT.IJ mg% (55-58)
Standing plasma test:
a. Chylomicron layer:
Triglyceride less blank:ITIJ]Net triglycerides mg% (61-64)
rnm [0(65-70)Month Day Year
Date of triglyceridedetermination:
Triglyceride blank (To be doneonly if triglyceride value is OJgreater than 300 mg%): mg% (59-60)
d.
c.
b.(23-34)
(35-36)
3.
a.
Q;JInitials:
3.
1 Present • • • • • • • • • •
2 Absent .
1
2
I -~~
I
9 Not done • • 9 (37)
,---------e •
-54-
2 Femoral antiversion (toeing in) is customarily detected andmeasured by X-ray technique. It is desired to minimize the useof X-rays because it exposes the gonadal area to possible hazard.Thus variation in X-ray technique to minimize X-ray exposure isa common object of study. The following data resulted in onesuch study in which various degrees of antiversion were producedin a model and then read on X-ray film by three technicians.Each technician read each film twice in random order.
Technician
1 2 3
0 5,2 3,3 -8,-2
15 18,17 17,16 18,15Angle
of antiversion 30 34,34 32,35 34,34in model
45 46,46 44,46 43,45
60 66,61 60,59 48,56
1) Investigate the bias in the new method.
2) Do the three technicians differ more than expected by chance'!
3) Do the technicians' biases vary with the angle?
4) Write a 1/2 page report summarizing your findings.
3 Data concerning the amount of heat evolved in calories per gramof cement (Y) as a function of the amount of each of four ingredients (Xl, X2, X3, X4) in the mix are presented in Table 1.Be brief and to the point in your response to each part.
(a) An all possible regression function s analysis is reportedin Table 2. Interpret the results of this analysis.
(b) A stepwise regression analysis is reported in Table 3. Interpretthe results of this analysis.
(c) How many variables would you include in a regression model?Which are they?
(d) What have you learned from this problem about setting theentry and exit criteria when performing stepwise regression ona data set too large for an all possible regression functionsanalysis?
(e) Describe what other analyses you would perform to assesswhether the assumptions underlying regression analysis are met,for the regression model chosen in (c).
(f) How would you use the regression model selected in (c) topredict the amount of heat that is likely to evolve from yetanother mix of cement?
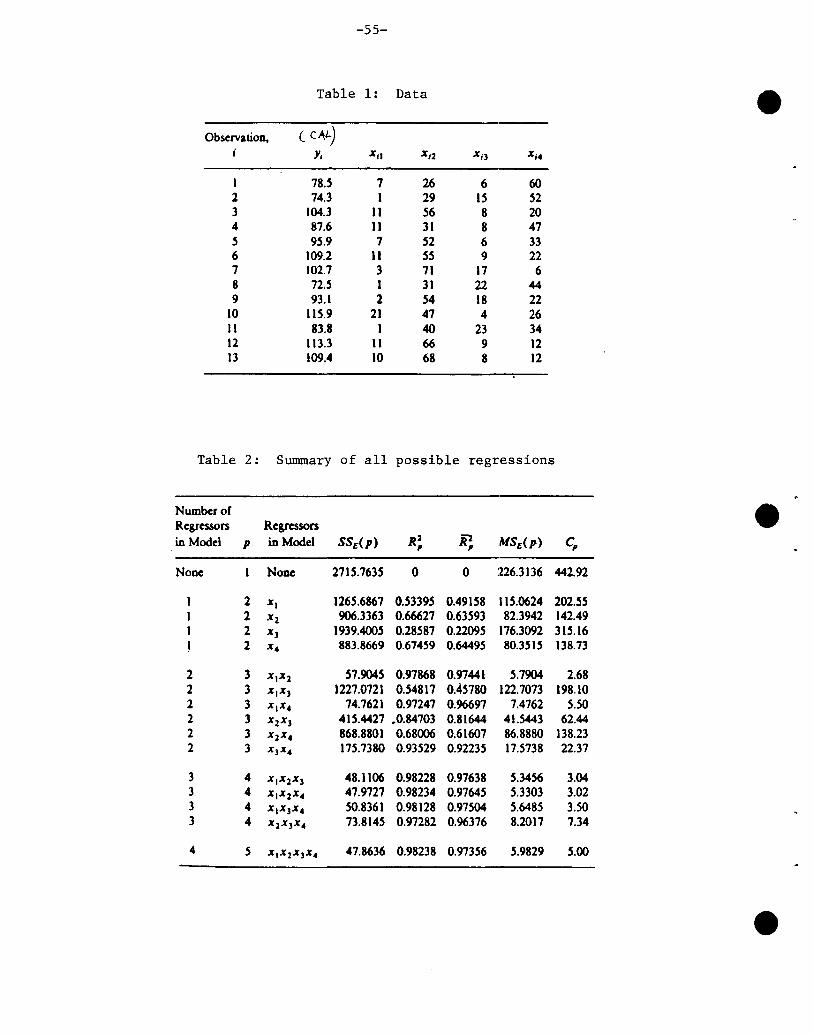
-55-
Table 1: Data
Observation, ( cAL..); Yi Xii X/2 Xi) Xi.
1 78.5 7 26 6 602 74.3 I 29 15 523 104.3 II 56 8 204 87.6 II 31 8 475 95.9 7 52 6 336 109.2 II 55 9 227 102.7 3 71 17 68 72.5 I 31 22 449 93.1 2 54 18 22
10 115.9 21 47 4 2611 83.8 1 40 23 3412 113.3 II 66 9 1213 109.4 10 68 8 12
Table 2: Summary of all possible regressions
Numbcrof eRegressors Regressorsin Model P in Model SSE(P) R2 iP MSE(p) Cpp p
None None 2715.7635 0 0 226.3136 442.92
2 x. 1265.6867 0.53395 0.49158 115.0624 202.552 X2 906.3363 0.66627 0.63593 82.3942 142.492 x) 1939.4005 0.28587 0.22095 176.3092 315.162 x. 883.8669 0.67459 0.64495 80.3515 138.73
2 3 X.X2 57.9045 0.97868 0.97441 5.7904 2.682 3 XIX) 1227.0721 0.54817 0.45780 122.7073 198.102 3 XIX. 74.7621 0.97247 0.96697 7.4762 5.502 3 X2 X) 415.4427 .0.84703 0.81644 41.5443 62.442 3 X2 X• 868.8801 0.68006 0.61607 86.8880 138.232 3 X3 X• 175.7380 0.93529 0.92235 17.5738 22.37
3 4 XIX2 X ) 48.1106 0.98228 0.97638 5.3456 3.043 4 XI X2X• 47.9727 0.98234 0.97645 5.3303 3.023 4 X.X3 X• 50.8361 0.98128 0.97504 5.6485 3.503 4 X2 x 3x• 73.8145 0.97282 0.96376 8.2017 7.34
4 5 X,X2 X3X• 47.8636 0.98238 0.97356 5.9829 5.00
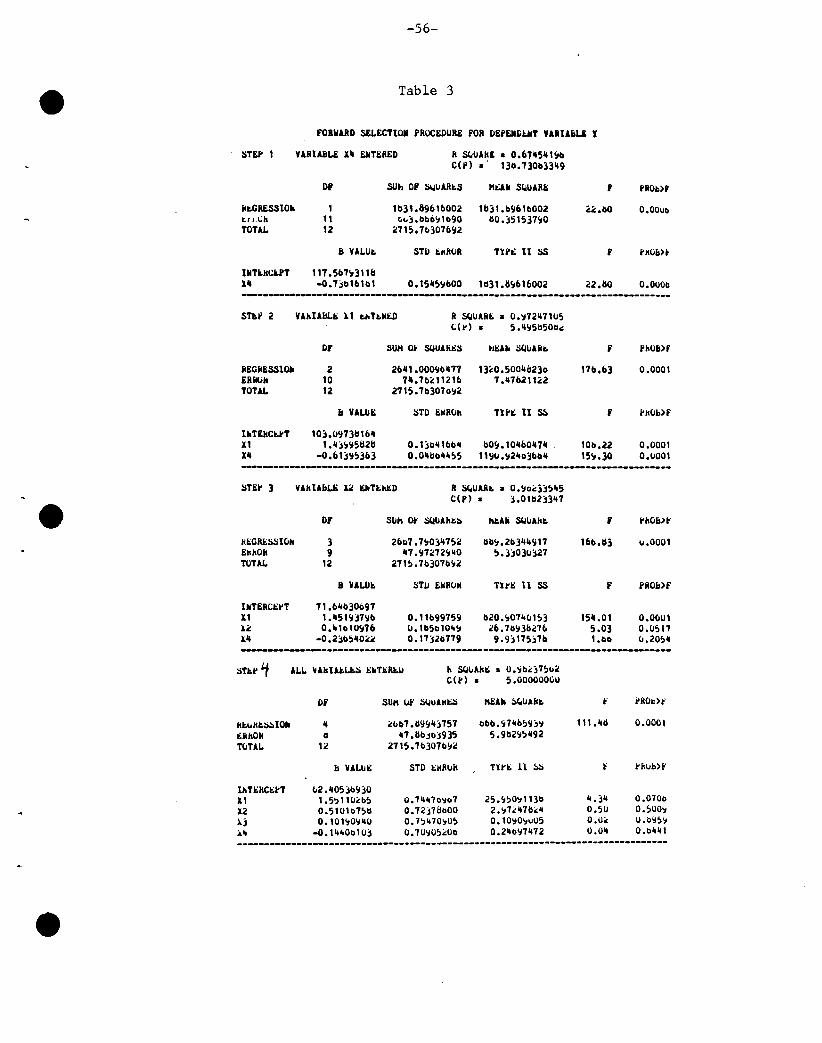
-56-
Table 3
FORWARD SEL£CTI011 PROCEDURE FOR D£P£N~~T VARIA&Li I
liT£I' 1 II SUUAft£ • 0.67_5"~0
C(I') .' 1311.730b33'9
Of SUh OF ~ulJlt.S Mt:lll SClIIAR/l; f i'ROI:M
ftt.GIlESS10. 1 lb31.896111002 1&31.b96111002 22.bO O.OOuot.r "L:h 11 C. ..).bbo'11090 1l0.)51~3nO
TOTAL 12 ;:715.70307692
8 VALUI> STU LIIIIIJR Tn.,; 11 liS F hO&)~
IIlT~ftC&PT 117 .507'1311&Xll -0.7)01111111 0.15'~'JIIOO 11131.1I~1I16002 22.110 0.0000
SUP 2 VAilU&l.1> ),1 tJoTt.ftED R ~IIAR£ • 0.~72_710~
C(I') • 5"'1511501l~
Of SUM Ot' ~UlIl";li tll>n liCllJARe. F l'hO&>f
REGRESSlO. 2 211111.000'Jo'77 1320.500Ilil23o 1711.b3 0.0001ERRtiIl 10 7/i.70"112111 7._711211<:2TOTAL 12 2715.703070'12
II VALli': liTO EJlR(jh Tnt; 11 ~ F Ph(jb)f
lUEIICt.i'T 10).0973111b_Xl 1._i'1958211 0.':;0_'00" bO~.10_bO_711 100.22 0.0001X_ -0.61)'1'3113 0.0_&0'11,5 119U.'J211030111l 15<".30 0.0001--------------------------------------------------------------------------------lin1' 3 VAhlAIlLE 12 thTEh&D R ~uARt. • 0.'10,,;)5'5
C(P) • ,.01112)3'7e OF SUk ct' :l4!uAht.::. !tAU ~lJAht. f PIIO&>I:
IiEGREliSl01l 3 2bo7 .7<"0)'752 llb9.2113-1I'J17 160.11; u.OOOl£1111011 9 '7.·,m~72'J"0 '.3,030,27TOTAL 12 271!l.7030711'J2
8 VALU!:. STU EIIROII Tnt: n ss F I'ROII>F
IIlTERCt:I'T 71.b'b30097Xl 1.'51'J'7'111 0.111199759 b20.'107"lJl~3 15/i.Ol 0.0001l2 0.loloI0'J76 0.lb51110"<" 26.71193b27t. 5.03 0.0~17
III -0.2)05_02ir! 0.17)20779 9.9) 17~j711 1.110 CJ.20511
:>TI:.1' '1 ALL VAkl~L&:> t:IlTI>RI:.IJ h ~uAII"; • 0.'102j7'uir!CU·) • 5.000000"0
OF SUM 1.11:' :l(,juAIII>:> I\t:AIl ::'"UAftl:. t' ..ROc)!:'
III:."ftl:.::.::.lOh II 2bIl7.11'J9I1j757 000.<J7I1b59i'1 111.'0 0.0001iii110ft II 117.110)0::1935 5.9112'J~1I92
T(jTAL 12 2715.7030711'J2
& VALli!:: STO I::IIRI.III TYI'I:: 11 ~ 1'" I'hub)t'
IhTI>RCI::PT lJ2.1I0~)b'J)0
II 1.5,110"115 O.7....7o'J"7 25.'J!l0'J1130 ". jll 0.0700X2 0.510107511 0.72)7&000 2.'1nIl711"Ji 0.50 0.~00'1
lj 0.101'10'1"U 0.7,"70'10, 0.10'10'lu05 0.0" 0.0'15'J.... -0.111'0010) 0.70'10,"00 0.2_0'J71172 0.0_ o .blllll
--------------------------------------------------------------------------------
-57-
4 In a retrospective study of the possible effect of blood group authe incidence of peptic ulcers, Woolf (1955) obtained data fromthree cities. The table below gives for each city data for blood groupso and A only. In each city, blood group is recorded for peptic-ulcer subjects and for a control series of individuals not havingpeptic ulcer.
Blood groups for peptic ulcer and control subjects
Peptic ulcer Control
Croup 0 Group A Group 0 Group ALondon 911 579 4578 4219Manchester J61 246 4532 3775Newcastle 396 219 6598 5261
Source: Woolf (1955). On estimating the relation betweenblood group and disease. Annals of Human Genetics, 19:251-3.
(a) Investigate the association between blood group and pepticulcer status at each locality. Use a confidence intervalmethod and interpret its implications to the hypothesis of norelationship.
(b) Assess the homogeneity of any blood group by peptic ulcerstatus association across localities. Use an appropriatesignificance test. Also, if homogeneity is supported, providea confidence interval for the blood group by peptic ulcer statusassociation for the combined data from all threl::! localities.
(c) Discuss briefly the interpretation of the results from (a)and (b).
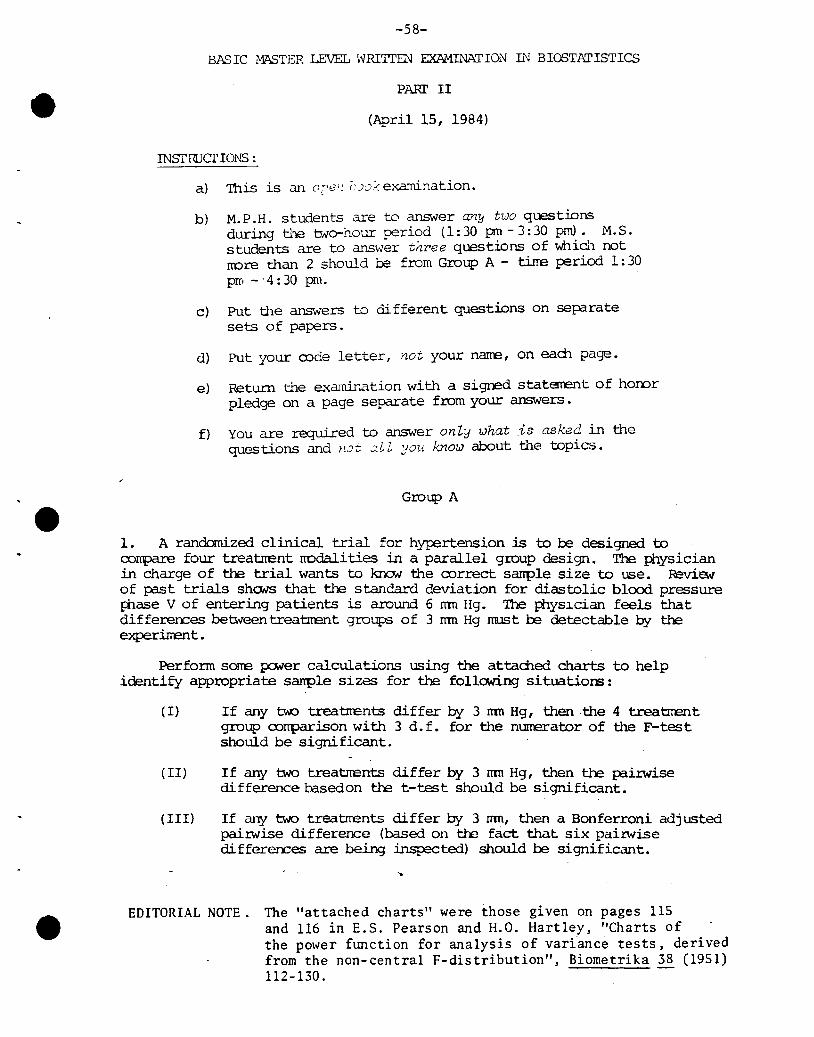
-58-
BASIC MASTER LEVEL WRITTEN EXAl."1INATIOt.\J IN BIOSTATISTICS
PARI' II
(April 15, 1984)
INSTR.JCTIONS:
a)
b)
c)
d)
e)
f)
M.P.H. students are to answer any two qu=stiDnsduring the two-hour period (1: 30 pm - 3: 30 pm). M. S.students are to ans•.,rer three questiDns of which notnore than 2 should l:::e from Group A - tirre period 1: 30prrt -' 4 : 30 pm.
Put the answers to different questions on separatesets of papers.
Put your rode letter, not your narre, on each page.
Return the e.'(amlnation with a signed statarent of hororpledge on a page separate from your answers.
You are required to answer onZy what is asked in thequestions and ,10<; J.ll ~/OU know about the topics.
Group A
1. A randomized clinical trial for hypertension is to be designed tooonpare four treatrrent nodalities in a parallel group design. The physicianin charge of the trial wants to kr:Ic:M the rorrect sanple size to use. Revie.vof past trials shO'lS that t.h: standard deviation for diastolic blcx:x:l pressure];hase V of entering patients is around 6 nm Hg. 'lbe IXlysJ.cian feels thatdiffererces between treatIrent groups of 3 nm Hg IlUlSt l:::e detectable by theexpe.rirrent. .
Perform sorre power calculations using the attached charts to helpidentify appropriate sanple sizes for the following situations:
(I) If any tw::> treatrrents differ by 3 nm Hg, then the 4 treatrrentgroup oonparison with 3 d.f. for the numerator of the F-testshould be significant.
(II) If arij two treatnents differ by 3 nm Hg, then t.h: paiI:wisedifference basedon the t-test should be significant.
(III) If any two treatrrents differ by 3 nm, then a Bonferroni adjustedpahwise difference (based on tl'c fact that six pairwisedifferences are being inspected) should be significant.
EDITORIAL NOTE. The "attached charts" were those given on pages 115and 116 in E.S. Pearson and H.D. Hartley, "Charts ofthe power ftmction for analysis of variance tests, derivedfrom the non-central F-distribution", Biometrika 38 (1951)112-130.
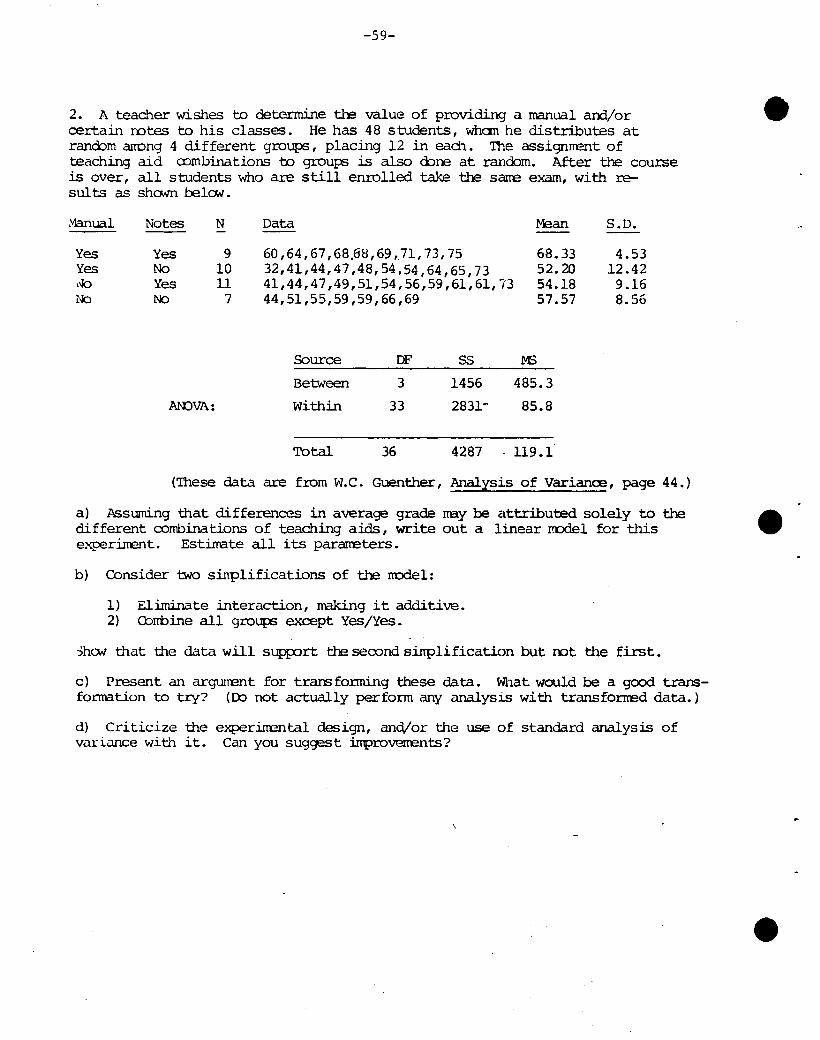
-59-
2. A teacher wishes to determine th3 value of providing a manual am/orcertain mtes to his classes. He has 48 students, whan he distributes atranoom anong 4 different groups, placing 12 in ead1. The assignrrent ofteaching aid rombinations to groups is also <:boo at random. After the courseis over, all students who are still enrolled take the sane exam, with results as sham belCM .
.'1anual Notes N Data r-Ean S.D.--Yes Yes 9 60,64,67,68~8,69,71,73,75 68.33 4.53Yes No 10 32,41,44,47,48,54.54,64,65,73 52.20 12.42,'110 Yes 11 41,44,47,49,51,54,56,59,61,61,73 54.18 9.16~ No 7 44,51,55,59,59,66,69 57.57 8.56
Source OF 55 MS
Between 3 1456 485.3
N:lJVA: Within 33 2831- 85.8
Total 36 4287 . 119.1
('Ihese data are from W.C. Guenther, Analysis of Variance, page 44.)
a) Assuming that differences in average grade rray be attributed solely to thedifferent combinations of teaching aids, write out a linear rrodel for thisexperirrent. Estirra.te all its pararreters.
b) Consider two sinp1ifications of the rrodel:
1) Eliminate interaction, making it additive.2) Cbrrbine all groups except Yes/Yes.
:5ho.v that the data will s~rt the second sinp1ification but mt the first.
c) Present an argurrent for transfonning these data. What would be a good transforrration to try? ([0 not actually Perform any analysis with transfo:rrred data.)
d) Criticize the experi..nEntal design, and/or the use of standard analysis ofvadill1Ce with it. Can you suggest irrproverrents?
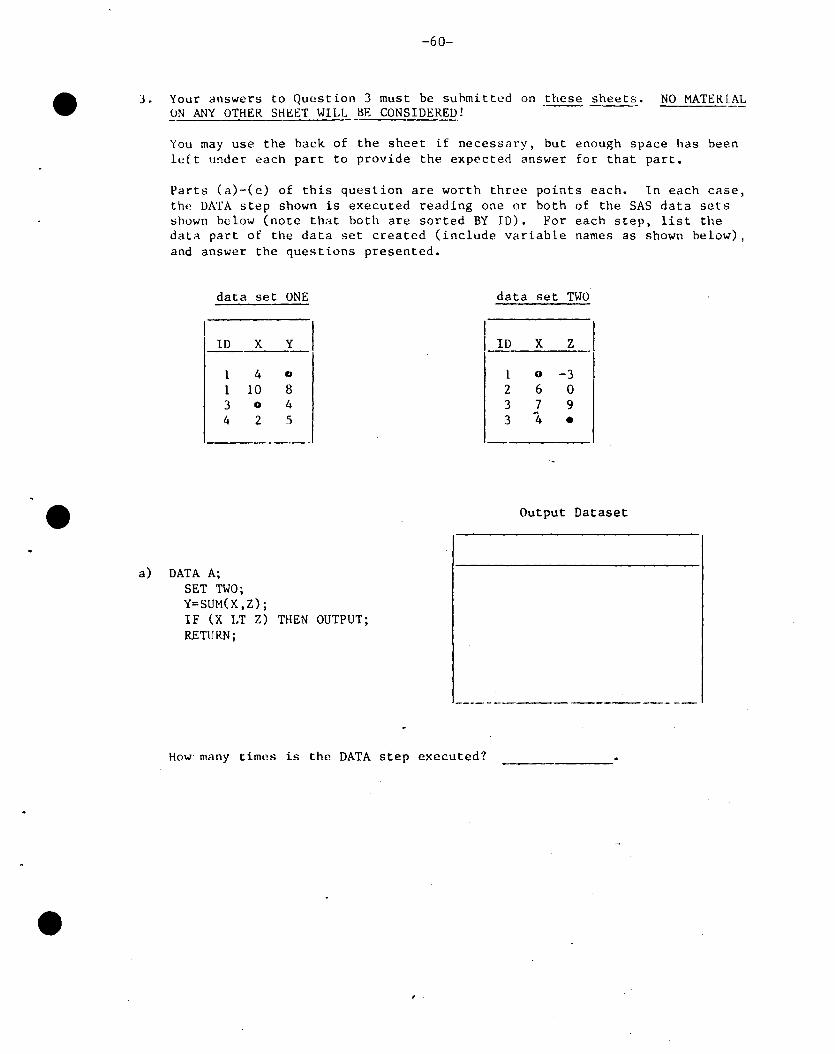
-60-
J. Your answers to Question 3 must be suhmitted on .these sheets. NO MATERLALON ANY OTHER SHk':ET WILL HE CONSIDERED!
You may use the back of the sheet if necessary, but enough space has beenleft under each part to provide the expected answer for that part.
Parts (a)-(e) of this question are worth three points each. In each case,the DATA step shown is executed reading one or both of the SAS data setsshown below (note that both are sorted BY 10). For each step, list thedata part of the data set created (include variable names as shown below),and answer the questions presented.
data set ONE data set TWO
I y_1L!.L X ID X Z
1 4 (I 1 0 -31 10 8 2 6 03 0 4 3 7 94 2 5 3 '4 •
-_._-
Output Dataset
a) DATA A;SET TWO;Y=SUM(X,Z);IF (X LT Z) THEN OUTPUT;RETURN;
_________0 _
How many times is the DATA step executed?
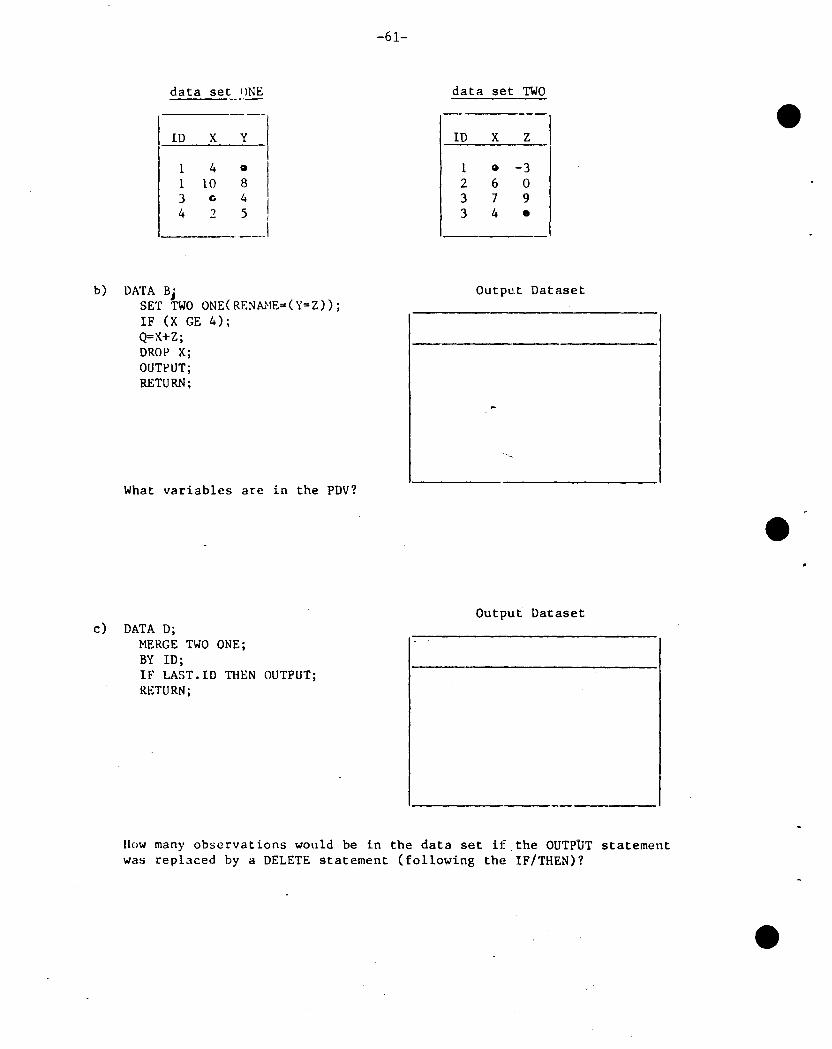
-61-
data set ONE
--10 X Y
1 4 0
I1 10 83 c; 4 ,4 2 5
J
b) DATA BjSET TWO ONE( RENA.'lE=( Y=Z));IF (X GE 4);Q=X+Z;DROP X;OUTPUT;RETURN;
What variables are in the PDV?
c) DATA D;MERGE TWO ONE;BY 10;IF LAST.ID THEN OUTPUT;RETURN;
Output Dataset
I1-------1
Output Dataset
How many observations would be in the data set if.the OUTPlJT statementwas replaced by a DELETE statement (following the IF/THEN)?
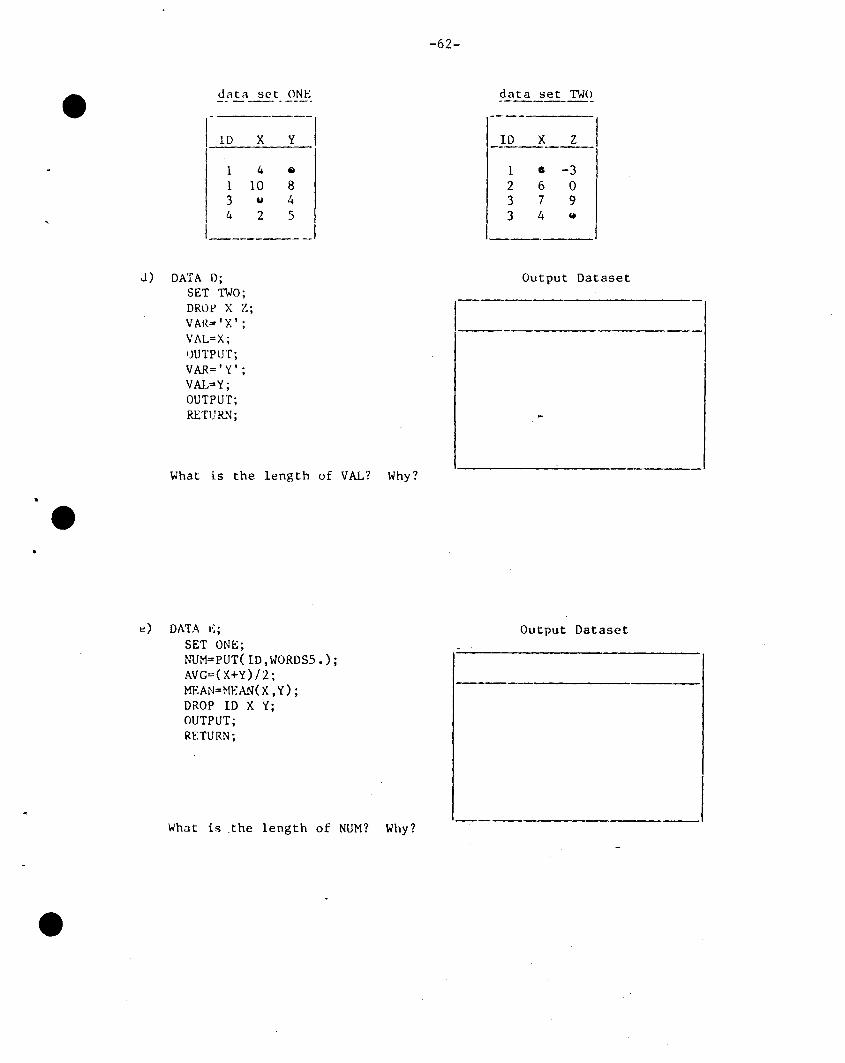
data set ONE
10 X Y
14.1 10 83 u 4425
1 -'
J) DATA 0;SET TWO;DROl:' X Z;VAR= 'X';VAL=X;fJUTPUT;VAR=' '{ ';VAL=Y;OUTPUT;RETURN;
What is the length of VAL? Why?
e) DATA I~;
SET ONE;NUM=PUT(ID,WORDSS.);AVG=(X+Y)/2;MEAN=t-1EA.N(X, y.);DROP 10 X Y;OUTPUT;RETURN;
Whilt is .the length of NUM? Why?
-62-
data set TWO
[~D - X z IliS -3 I2603793 4 If
______1
Output Dataset
I1 ---
Output Dataset
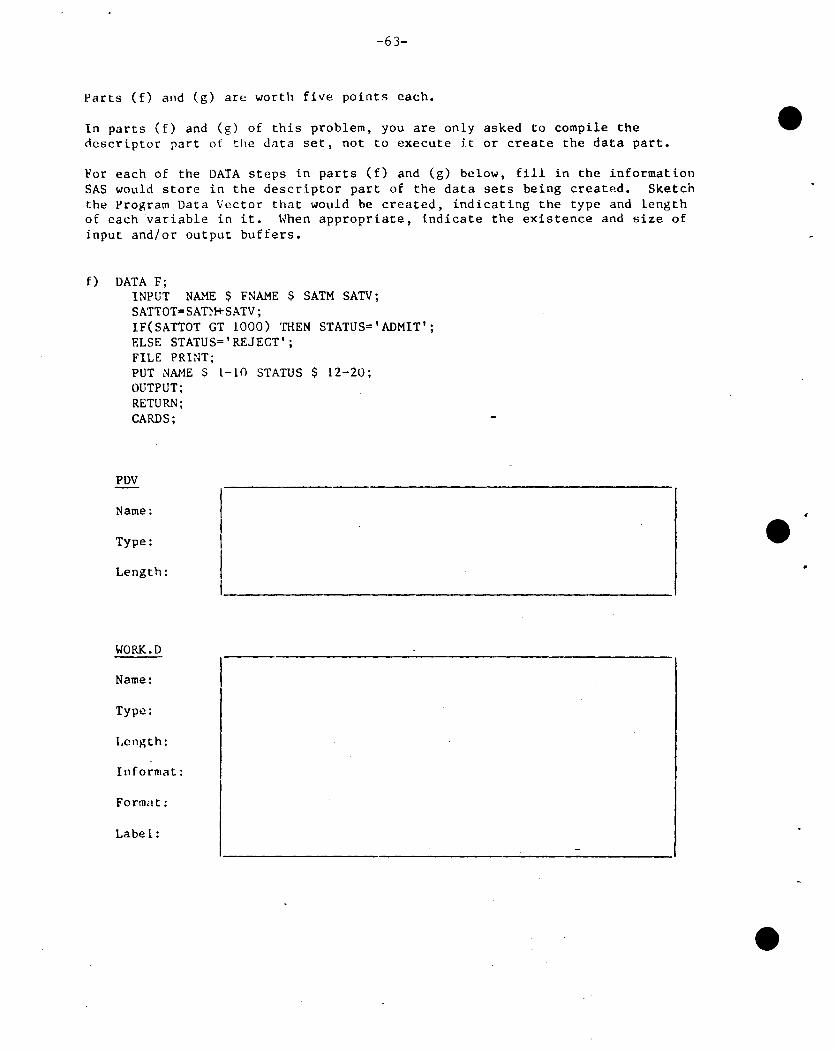
-63-
Parts (f) and (g) are worth five points each.
In parts (f) and (g) of this problem, you are only asked to compile thecicscriptor part of the d;lta set, not to execute it or create the data part.
For each of the DATA steps in parts (f) and (g) below, fill in the informat ionSAS would store in the descriptor part of the data sets being created. Sketchthe Program Data Vector that would be created, indicating the type and lengthof each variable in it. When appropriate, indicate the existence and size ofinput and/or output buffers.
f) DATA F;INPUT NAME $ FNAME $ SATM SATV;SATTOT=SAT}~SATV;
IF(SATtOT GT 1000) THEN STATUS='ADMIT';ELSE STATUS='REJECT';FILE PRniT;PUT NAME $ l-lO STATUS $ 12-20;OUTPUT;RETURN;CARDS;
PDV
Name:
Type:
Length:
WORK.D
Name:
Type:
Length:
Informat:
Format:
Label:
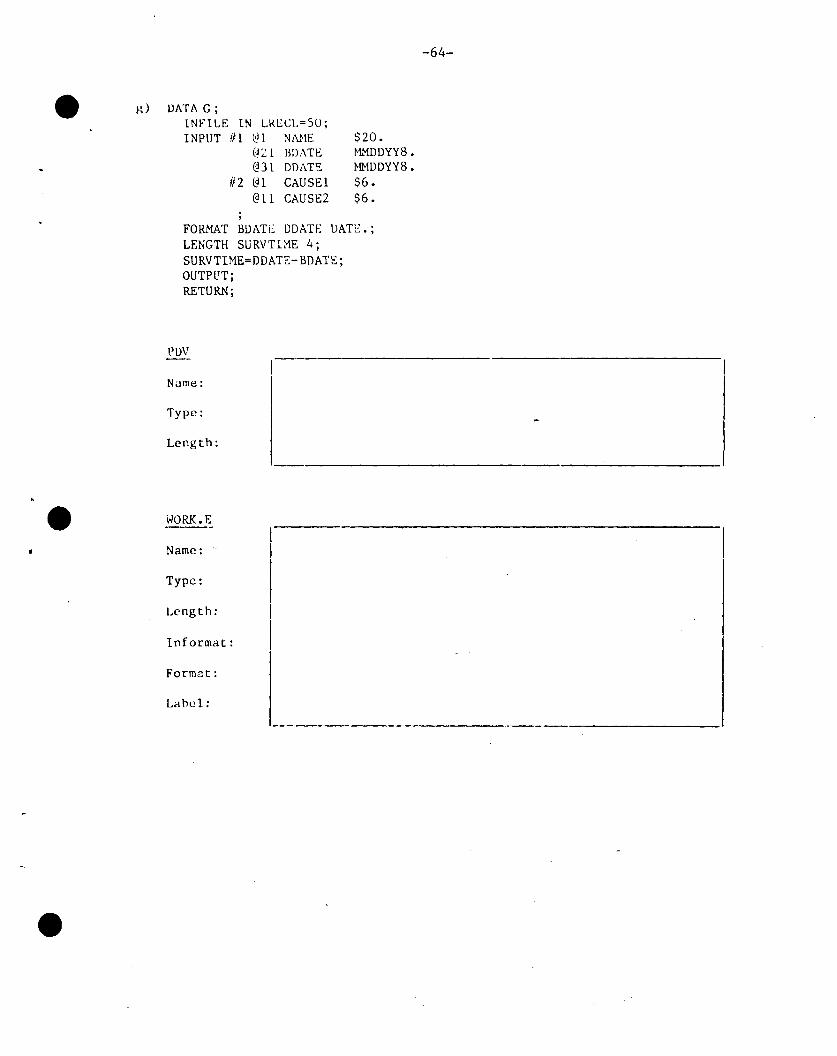
g) DATA G;lNfILE IN LKECL=5U;INPUT if 1 III NAt-IE
(~21 l)DATE@31 ODATE
if 2 @1 CAU SE1@ll CAUSE2
$20.~L.'1DDYY8 •NMDOYY8.
$6.$6.
-64-
•
FORMAT BDATi~ DDATE DATE.;LENGTH SURVTIME 4;SURVTINE=DDATE-BDATE;OUTPUT;RETURN;
PDV
Name:
Type:
Length:
WORK.E
Name:
Type:
Length:
Informat:
Format:
Lahel:
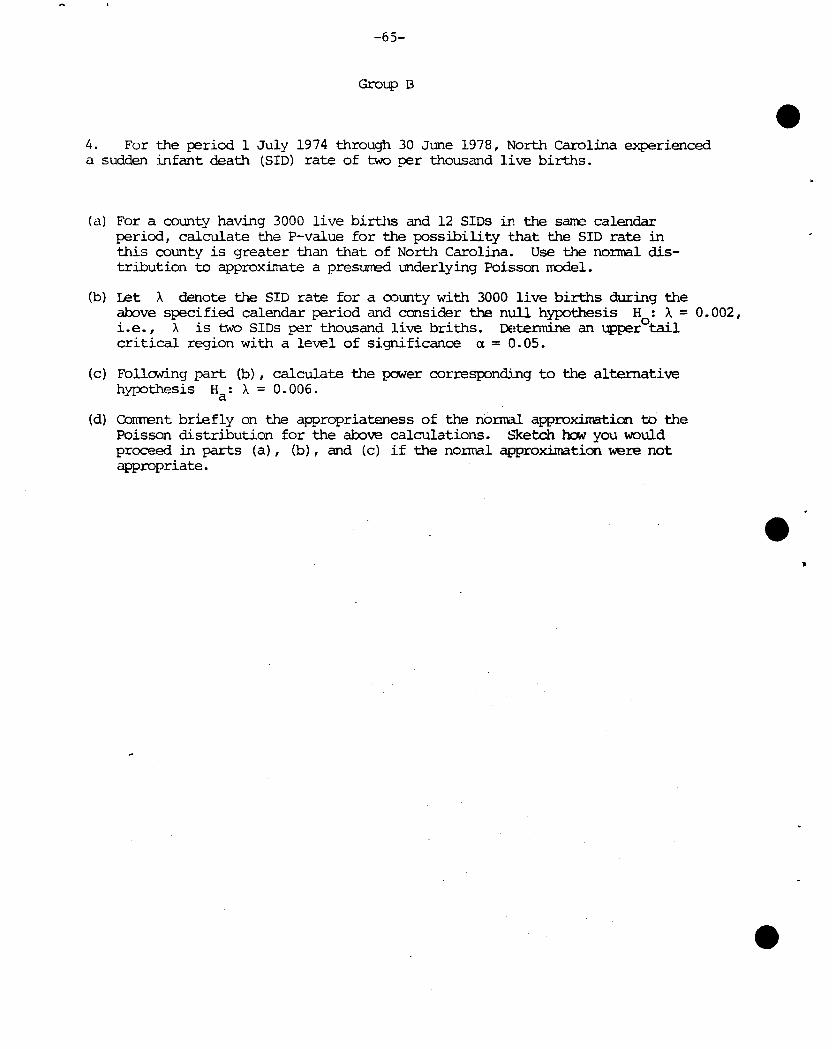
-65-
Group B
4. For the t:eriod 1 July 1974 through 30 June 1978, North carolina experienceda sudden infant death (SID) rate of two per thousand live births.
(a) For a county having 3000 live births and 12 SIDs in the same calendarperiod, calculate the P-value for the possibility that the SID rate inthis county is greater than that of North Carolina. Use the nonnal distribution to approximate a presurred mderlying Poisson rrodel.
(b) Let A denote the SID rate for a county with 3000 live births during theaOOve specified calendar period and consider the null hypothesis H: A = 0.002,Le., A is two SIDs per thousand live briths. Detennine an upper°tailcritical region with a level of significance a. = 0.05.
(c) Follc:wing part (b), calculate the power corresponding to the alternativehypothesis Ha : A = 0.006.
(d) COrment briefly on the appropriateness of the no:rnal approximation to thePoisson distribution for the above calculations. Sketch how you wouldproceed in Parts (a), (b), and (c) if the nonnal approximation were notappropriate.
-66-
MS WRITTEN EXAMINATION IN BIOSTATISTICS
PART I
(January 26, 1985; 10 AM to 1 PM)
Question 1
A student health service has a record of the total number of eligiblestudents (N) and of the total number of visits (Y) made by students during ayear. Some students made no visits. The service wishes to estimate themean number of visits (Y/Nl) for the Nl students who made at least onevisit, but does not know the value of ~. A simple random sample of neligible students is taken in which nl students made at least one visit andtheir total number of visits was y. Ignoring the finite population correction:
a. Show that ylnl
is an unbiased estimator of Y/NI
•
b. Show that the variance of y/nl ,where Sf is the variance of tHemaking at least one visit.
conditioned on nl' is si/n ,number of visits among stu~ents
c. An alternative estimator of YINI would be Yn/Nnr Show that thealternative estimator is biased and that the ratio of the bias tothe true value (Y/N
1) is approximately (N - Nl)/nN
l.
Hint: If P is a binomial estimator of P = 1 - Q based on ntrials, then
Question 2
Consider the density function-x2 /2e
fx(x; e) = ~ e , x > 0, e > o.
a)
b)
c)
d)
e)
Find E(X) and V(X).
Find a sufficient statistic for e based don a ran am sampleXl 'X2 '···'Xn of size n from fX(x;e).
Find an unbiased estimator of e which is a function of a sufficientstatistic for e. Also, find the variance of this unbiasedes timator of e.
Let Xl,X2'··., Xn be a random sample of size n from fX(x;e).
Find E[X(l)] and V[X(l)l, the mean and variance of the smallestobservation in this sample.
Let Xl,X2~ ... , Xn be a,random sample from fX(x;8), where n islarge. Flnd an apprOXlmate 95% confidence interval for e which_ nis a function only of X = n- 1 L: X.•
i=l 1.
-67-
Question 3
Let Xl and Xz be independent exponential random variables with thePDF's
a) Obtain the joint distribution of
Y --.!L- and YZ = }L + XzI Xl+XZ -J.
b) Obtain the marginal PDF's of YI and YZ' What known distributionsdo they represent?
c) Are Yl
and YZ independent?
d) Obtain the rth moment of each of Yl and YZ'
Question 4
Let X be a Poisson random variable with probability mass function
I x-A.PX(X;A) = -, A e , A>O. x=O, 1,Z, ....,
x·
a) Derive the moment of generating function, MX(t), of x.
b) Obtain the mean and the variance of this distribution.
-68-
M.S. WRITTEN EXAMINATION IN BIOSTATISTICS
PART II
(January 27, 1985: 1:00 to 5:00 PM)
Question 1
An experimenter wished to measure the difference inconcentration of tobacco mosaic virus prepared by two methods.For each of 8 leaves, one half was chosen at random forinoculation with virus prepared by the first method, and theother half by the second. The lesions found subsequently werecounted as an index of virus concentration in the preparation.The following data resulted.
Lesions on halfinoculated with
Leaf Number Preparation 1 Preparation 2
1 9 102 17 113 31 184 18 145 7 66 , 8 7,7
I20 17
I 8 10 5
a} Calculate a parametric 95% confidence interval forthe true mean difference in number of lesions.
b} What does this tell you about the true meandifference between the two preparations?
c} Select and perform a nonparametric test for thesame location in distribution of the number oflesions for the two preparations.
d} Discuss the comparability of the results fromparts (b) and (c).
-69-
Question 2
Mercury levels (micrograms /gm body weight) were measured in fish atvarious distance above and below the source of pollution. The data are:
Distance from Source
5.5 km above 3.7 km below 21 km below 133 km belowplant plant plant plant
.45 1.64 1.56 .65
.35 1.67 1.55 .59
.32 1.85 1.69 .69
.68 1.57 1.67 .62
.53 1.59 1.60 .70
.34 1.61 1.68 .64
.61 1.53 1.65 ".- . .81
•41 1.40 1.59 .58
.51 1. 70 1. 75 .53
.71 1.48 1.49 . 75
a) Provide a descriptive graph of these data. eb) Comment on the reasonableness of the assumptions 'for a linear
regression analyses of these data. How are the data 5.5 km abovethe plant useful?
c) Provide an estimate of the distance below the plant where themercury levels should be as they were above the plant.
d) Sketch a line representative of the trend of decreasing mercurylevels below the plant.
e) Describe the essential technical difficulties in obtaining aconfidence interval for the estimate in paI't (c) given theanalysis in part (d).
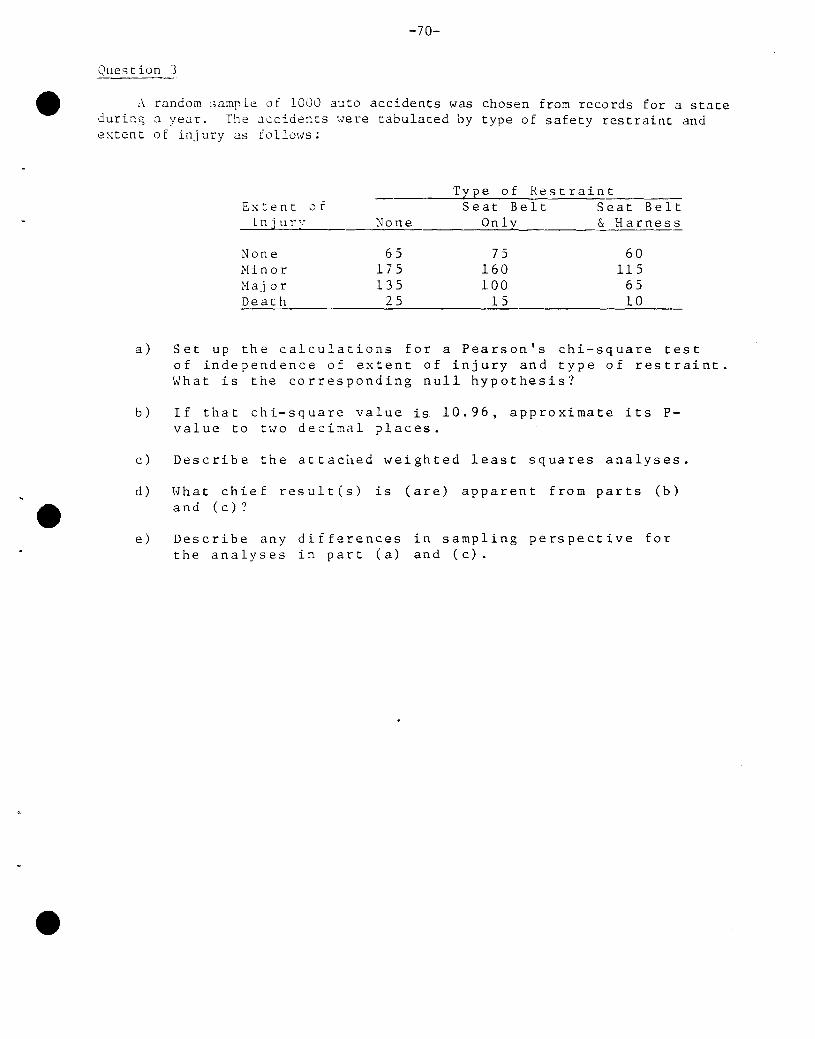
-70-
Question 3
A random sample of 1000 auto accidents was chosen from records for a stateduring a year. The accidents were tabulated by type of safety restraint andextent of injury as follows:
Extent ofInjury ~one
Type of RestraintSeat Belt Seat Belt
Only & Harness
;.jane:-linor:-laj orDeath
65175135
25
75160100
15
60115
6510
a) Set up the calculations for a Pearson's chi-square testof independence of extent of injury and type of restraint.What is the corresponding null hypothesis?
b) If that chi-square value is 10.96, approximate its Pvalue to two decimal places.
c) Describe the attached weighted least squares analyses.
d) Hhat chief result(s) is (are) apparent from parts (b)and (c)?
e) Describe any differencesthe analyses in part (a)
in sampling perspective forand (c).
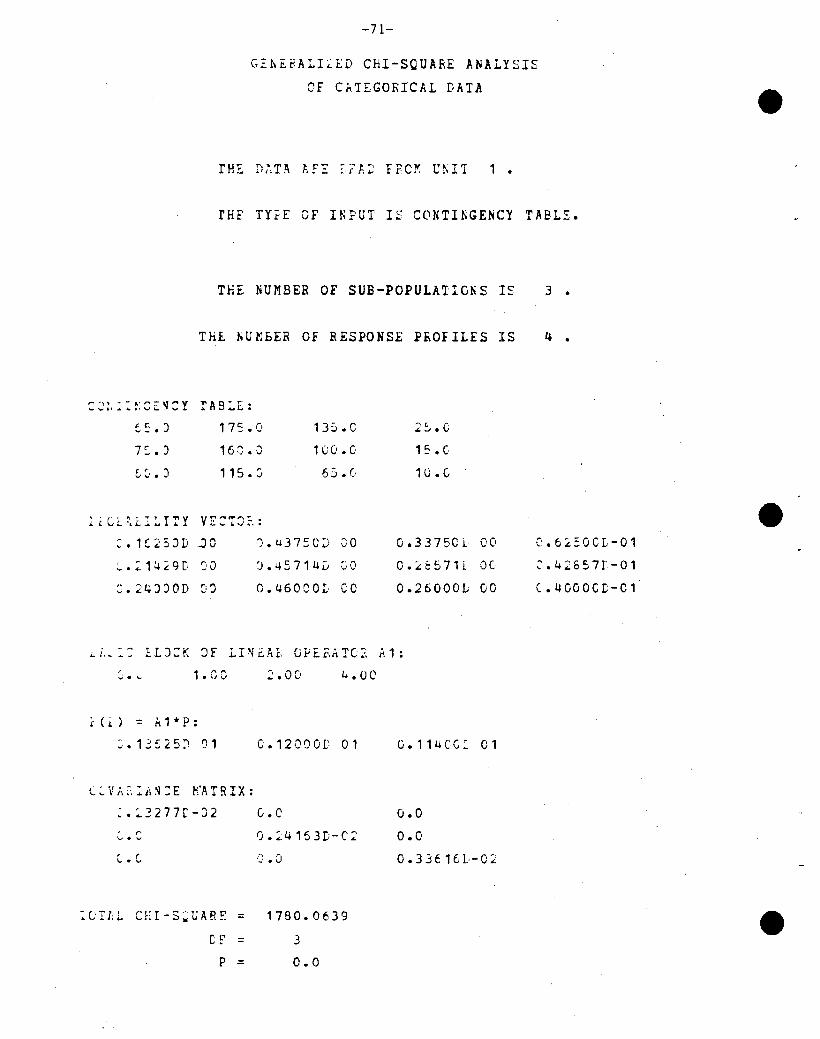
-71-
G~hE~ALI~ED CHI-SQUARE ANALYSIS
OF ChTEGORICAl DATA
THE DATA APE ;FA~ FFC~ C~IT 1.
rHE TY?E OF INPUT IS CONTI~GENCY TABLE.
THE NUMBER OF SUB-POPULATIONS IS 3.
THE NUM~ER Of RESPONSE P~OfILES IS 4.
~ :;:1 '~ : r: C E: , : y TAS:'E:t ~ • ') 17:: .0 13S. C 2:'.C
7':...') 168.0 1(;0.C 15 • C
E,~, • ') 115.~ 65.0 10.0
: iCL,:~1:.::'II'Y Vr:T8:. :,-, H 2SJD -JO ().u37SCV VO 0.33750l. 00 ('.6250C[-01~ .:".:1429D :'0 0.457140 VI.) 0.:':b571L or ~.42057r-01
:).24JJOD :<) O.46000L co 0.26000D 00 Ce4000CD-C1
~~.:: ELJ:K JF LINiA1 GPEEATC2 A1:
,J. \..' 1.80 2.00 4.0C
dd = A1*P:
=.13525~ 01 0.120000 01
l~Vh2:~S:E KATRIX::.~3277r-02 c.c
:CHL CEI-S~l;ARF. = 1780.0639
c: = 3
P = 0.0
0.114CO: 01
0.0
0.0
0.33f16L-02
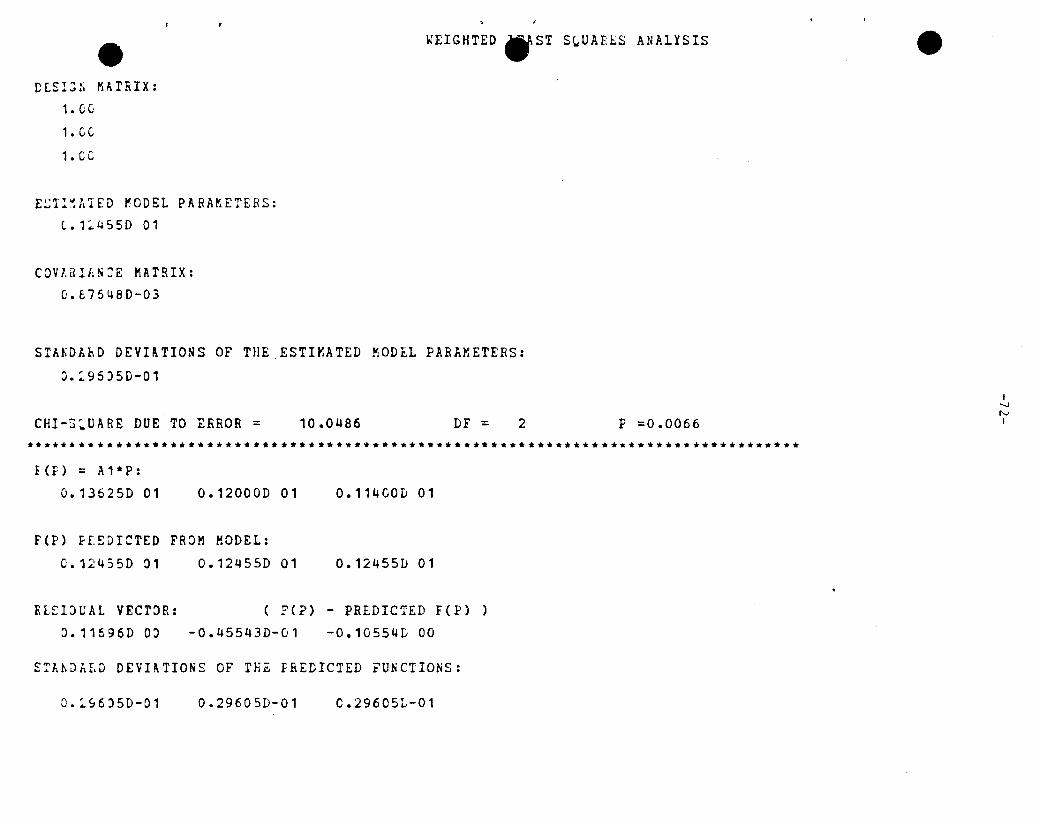
eDLS:r:;t. K"rRIX:
1.0C
1. CC
1.CC
E~!I~hlED ~ODEL PARAr.ETERS:(..1:'455D 01
cov~arAN:E MATRIX:
0.£7548D-03
~EIGHTED ~ST SQUAB1S ANALYSIS e
STAKDAhD DEVI~TIONS OF THE.ESTIMATED MODEL PARAMETERS:
:l.:'95)5D-01
CHI-S~UARE DUE TO ERROR = 10.0486 OF = 2 P =0.0066
I-...JNI
****.* •• ****************.********************.**.***************.** •• *.*.***.**** •• **
f(f) = A1·P:
0.136250 01 0.120000 01 0.11400D 01
F(P) prEDICTED FR~M MODEL:0.124550 01 0.12455D 01 0.12455D 01
RL£I:>CAL VECTOR:D.115960 OD
( rep) - PREDICTED F(P) )
-0.455430-01 -0.10554L 00
S:h~~h~D DEVI~TIONS OF THE FREDICTED FUNCTIONS:
0.:'96350-01 0.29605D-01 0.296051;-01
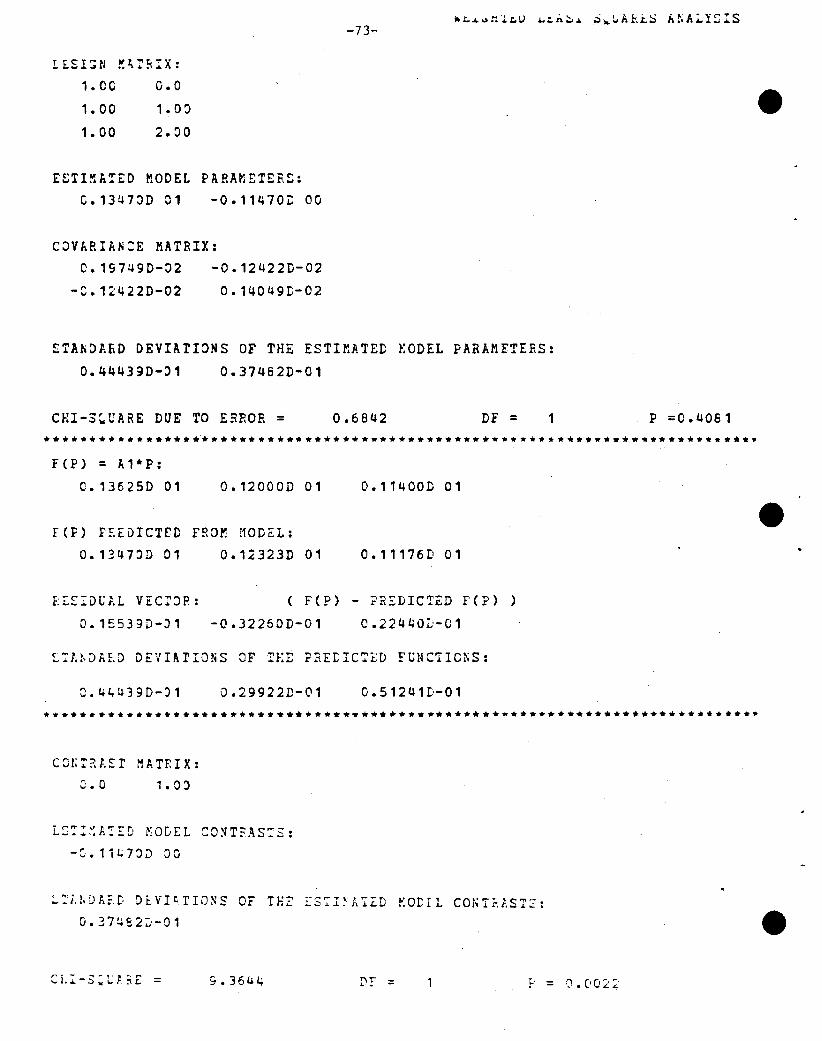
-73-
LEsr:;tl ~~rRIX:
1.ce
1.00
1.00
0.0
1.00
2.00
E~!l~h!ED MODEL PARAMETERS:C.134700 01 -0.11470~ 00
COVhRIAN:E MATRIX:0.197490-02 -0.124220-02
-C.124220-02 0.14049C-02
STA~DARO DEVIATIONS OF THE ESTIMATED lOOEL PARAMETERS:0.444390-~1 0.374620-01
CHI-3~UARE DUE TO ERROR = 0.6842 OF = 1 P =0.4061
*****************~*******************************.**************************7
F(P) = A1*P:
0.136250 01 0.12000D 01 O.11400D 01
reF) PEEDICTED FROM ~ODE1:
0.13470D 01 0.12323D 01 O.11176D 01
f: :: S:: l) lJ ;. L VECl' J P. :
0.15539D-:l1
( F(P) - PREDICTED rep) )
-O.32260D-01 C.22440L-01
S~A~~ASD DEVIArIONS OF TEE ?aEtlc~ED FCNC71C~S:
~.44U390-,)1 0.29922D-01 0.51241L-01
****************************************.***********.************************
C8/;'::H.;:r Mft.TRIX:
[;.0 1.00
LST:~A:ED MODEL :O~T~AS:S:
-C.1i~70D 00
~ :' i, !.[)f.. r, [; DEVIt. rIO ~ S 0F TE::: ~S': I ~ J, ~ LD ~: at r Leo l~ T? f. ST::: :O.37~82~-01
9.36UL; '"Ir -... ,. . - 1 F' = O.C'OL2
-74-
Question 4
The catalogued OS file UNC.B.E522U.BIOSlll.DSPA.RAW contains 2000 datarecords keyed from the attached DopIer Systolic Blood Pressure Form. Theserecords are each 80 bytes long. Each field is keyed as specified by thecolumn number(s) in parentheses following the boxes or numbers for the datavalues. Note that not all columns are used since some questions have beeneliminated to simplify the form for this exam. Also note that each formgenerates two records, DSPAl and DSPA2, as indicated by the record identifiersin columns 1-5. For each part below give the JCL and/or SAS statementsnecessary to perform the tasks described.
Job 1
Create a catalogued on line dataset named UNC.B.E522U.DSPA.MYCOPYcontaining a copy of the records in the OS file described above. Theoutput data set should be blocked with 100 logical records (of 80 byteseach) per physical record.
Job 2
Read the data set created in Job 1, creating a SAS data set from it.The SAS data set should have 12 variables, one corresponding to eachkeyed item on the form. Use the information on the form to chooseappropriate variable names, types, lengths and input formats. Permanentlystore the data set in an online SAS data library created by this job.
Job 3
a) Produce a listing of subjects' last name and initials, sorted by"date form completed", from earliest to latest.
b) Produce a vertical bar chart showing the percentage of forms having3 bars, one for each of the 3 possible responses to question 10.
c) Produce a scatter plot of right ankle artery pressure versus left(question 7), using the response to question 9 as the plottingsymbol. When question 9 is missing, use an asterik (*) as theplotting symbol.
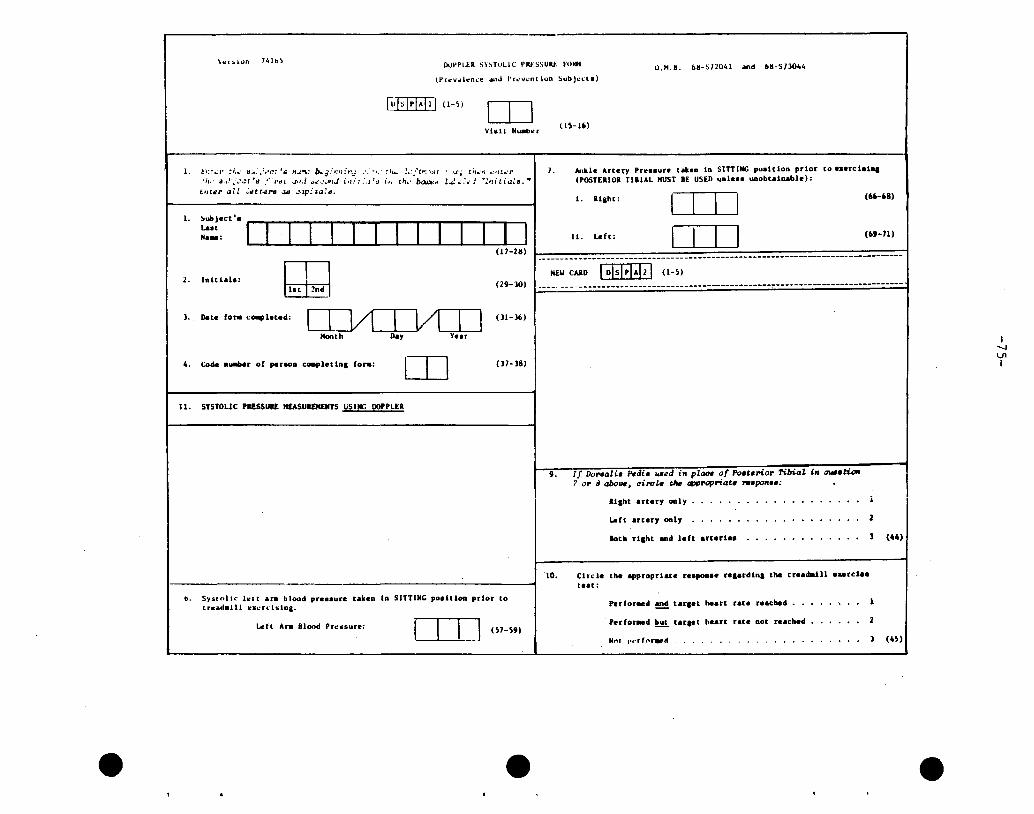
\l~r~lon 141b~ [)<JPPl.U SYSrlll.lC PIltSSUKf. t"!11lH 0.H.8. b8-S12041 .nd bB-SIJ044
(Prltv",l~n~e otnJ t'rll."vcnlion Subjcl:le)
[uIpTAfiJ (H) OJVialt NUllbt!r
(IS-I/o)
I. subj.ct '.La••Na.:
l. b:~ ...·I' :;;.: ~A: ..;~c: '.s PJ..l.....: b.::~;·r.·l:"r:J _', ~/.' ~"~ ~ ...'f"t~ ....:;[.-;~; the"j c/ltc:!r
·Ii.' 8_,~..:.!~r'd "··'·dl ..1./,J ~c~..),lJ i'lI'r,'.,:1:J i,i, tJIl' b~t4 1.J!,,·c! "l'l;tilJls."e,'ltf/,. all ~rltr-c"8 old oJ'lp:: tald.
.---" --- - -----------------------------------------------------------------------
.------------------------------- ------------------------------------------------
Ankle Artery Pr~••ure tak.a tn SITTING po.ttion prior to ex.ret.lna(POSTERIOR TIBIAL KUST IE USED unle.. unobtalnabl.):
1. IIlh': [IT] ("-,a)
11. Laf" [IT] (109-11)
NEW CARD~ (I-S)
7.
(29-]0)
(17-28)wlal.lala:2.
1. Dat. fo ... c.... l.t.d: (l1-]6)
4. Code D_r of p.raon ca.pletlDI fo...: IT] (l1-18)
I......V1I
II. SYSTOLIC PUSSUI£ IlEASUIDlElITS USING DOPPLER
9. If Do,..ali. p.di....ed i" place of Po.t.no,. 7'ibiaZ i" awdi...7 0,. d abo.... "iI'CL. tIur ""'l'Opnat• ....po"..,
Ilaht artery ooly
Left artery only
loth rlaht and left arterl•• (44)
10. Circle 'he .pproprlat. r ••pon.. r•••rdlna the tr••da111 ...rd..te.t:
o. SY:ilolic l~'-l ara blood preaaure taken in SITTINe po.Ulon prior tolrt!ilet.111 .XCf4-tsina. Perfor.d ~ urlet heart rau ruched ••
LdL Ara Blood Prt!liliure: c::Irl (SI-S9)- Perfoned but tarlet heart rate aot reached
Nnr I"'rfnrwd (4S)
e e e
-76-
DEPARTMENT OF BIOSTATISTICS
Special MS Examination, 1985
April 13, 1985: 10 AM - 1 PM
INSTRUCTIONS:
a) Answer any three of the following questions. This is aclosed book examination.
b) Put the answers to different questions on separate setsof papers.
c) Put your code letter, not your name, on each page.
d) Return the examination with a signed statement of honorpledge on a page separate from your answers.
e) You are required to an swer on 7y lJti'1 t is czckf'd in thequestions and not ~ll you knolJ about the topics.
Question 1
Let the joint density function of two continuous random variables
X and Y be
2(y + x8)/8 O<x<l, 0<y<8
a) Show that the marginal distribution of X is
f (x) = 1/ + XX 2 , O<x<l
b) Show that the conditional distribution of Y given X x is
c) E(ylx = xl is oft f d t hen re er;-e 0 as t e "regre~sion equation" of
Y on x. For this problem, show that
E(ylx = x) = 8z
where z = (2 + 3x) /3 (l + 2x)
-77-
(117 Continued)
Question 2
Suppose that a survey is done to estimate a rate (P*) which can be
expressed as a constant (K) times a proportion (p). Assuming simple
random sampling (SRS), the appropriate estimator of P* is
p* = Kp, where p is the corresponding sample proportion.
Ignoring the finite population correction, verify the following
properties of p* for an element sample of size n from a popula
tion with N elements:
a) True Variance:NP* (K-p*)
Var(p*l = n(N-l)
b) Coefficient of Variation: CV(p*l •N(K-P*)n(N-l)P*
c) Assuming that 3K .. 10 , P* .. 20, and N = 10
6 (so that the
finite population correction can be ignored), how large a sample
would be needed in the survey yo yield a standard error or 5
for the estimator p*?
d) Suppose that it is desired to estimate the parameter e using n
pairs of data points (x~, Y.), i = 1,2, ••• ,n. A reasonable~ ~
criterion for choosing an estimator § of e is to choose e to
minimize the quantity
"Show that the choice for e which mioimizes the abc:>ve expression
is
n n2'" E z.Y. / Ee = z.
i=l ~ ~ i=l ~
e) For the n = 3 pairs of (x, y) data points (-1, 1) , (0, 01
(1, what is '"and 3) , the value of 8?
-78-
Ouestion 3'"
Let the continuous random variables X and y have joint distribution
fX,y(x,y)_L,
(4xy) 2 O<x<y<l
a) Find the joint density of the random variables
U = Ix/y and V = IY
b) Demonstrate whether or not U and V are independent random
variables.
c) Find E{ylx x).
Question 4.
To assess the harmful effects of certain environmental contaminants
(e.g., arsenic or lead), researchers often adopt an experimental
strategy which involves injecting a number of pregnant female mice
with different doses of the substance in question and then observing
the effects on the fetuses in each litter. One possible statistical
model for the situation where a continuous response (e.g., fetal birth
weight) is recorded for each fetus is
Y.. = n; + E: ••~J ... ~J
is the observed response associated. with the j-th fetus".vhere Y..~J
in the i-th litter (or, equivalently, dose level). Consider the
following two different sets of assumptions concerning the above
model:
-79-
(114 Continued)
ASSUMPTION SET I:
2(i) n. - N(]J. , 0
1)
1 1
2(ii) E: •• - N(O, O
2)
1J
(iii) h {} d {"" } are all mutually independentten. an c. ••1 1J
random variables.
ASSUMPTION SET II:
(i)
(i1)
is a _fixed, unknown constant representing the "effect"niof the i-th dose level.
2E: •• - N (0, a )1J
(iii) for j"# j',
COV (£ .. , £"0') =1J 1 J {
0
0
- when
when i 'I i'
(i.e., observations in ~he same litter are correlated).
a) What is E (Y .• )1J
under Assumption Set I and under Assumption set II?
b) What is Var (Yij
) under Assumption Set I and under Assumption
Set II?
c) What is the correlation between Y. . and Y.. I for j"# j'1J 1J
(i.e., between two observations in the same litter) under
Assumption Set I and under Assumption Set II?
d) Under Assumption Set I, show that
are independent conditional on ni
Y.. and Y.. I1J J.Jbeing fixed.
for j "# j'
NOTE: cov (Y •• , Y •• , Ini ) =1J 1J
E [Y. •Y. • , In.] - E (Y. . In. )E (Y. . , In. )1J 1J 1 1J 1 1J 1
-80-
BASIC ~ASTER LEVEL WRITTEN EXAMINATION IN BIOSTATISTICS
PART II
(April 14, 1985)
INSTRUCTIONS:
a) This is an open book examination.
b) M.P.H. students are to answer any two questions duringthe three-hour period (2 PM - 5 PM). M.S. students areto answer three questions -- time period 1 PM - 5 PM.
c) Put'the answers to different questions on separate setsof papers.
d) Put your code letter, not your name, on each page.
e) Return the examination with a signed statement of honorpledge on a page separate from your answers,
f) You are required to answer only what is asked in thequestions and not all you know about the topics.
Question 1.
Two faculty members independently graded the responses to anexam question answered by seven students. Each grader assigned ascore between 0 and 25 to each response. Professor One stored hisgrades in a SAS dataset in a catalogued SAS data library stored ononline disk at TUCC. The PROe CONTENTS output for this dataset isattached. Professor Two stored his grades on a scrap of paper,reproduced below. Write a program, including all necessary JCLand SAS statements to do the following:
1) Produce a scatter plot of Professor one's score versusProfessor Two's score, using the student's ID letter asthe plotting symbol. Title and label the plot appropriately.
2) Produce a report listing each student whose two scores differby five or more points. The listing should include thestudents ID, the two scores, and the difference betweenthe scores.
NOTES: In your JCL use the account code UNC.B .E1234, a progrcuranername of SMITH, and a password of SECRET-. You may assumethat each student has exactly one record in each "file",and that no values are missing in either "file".
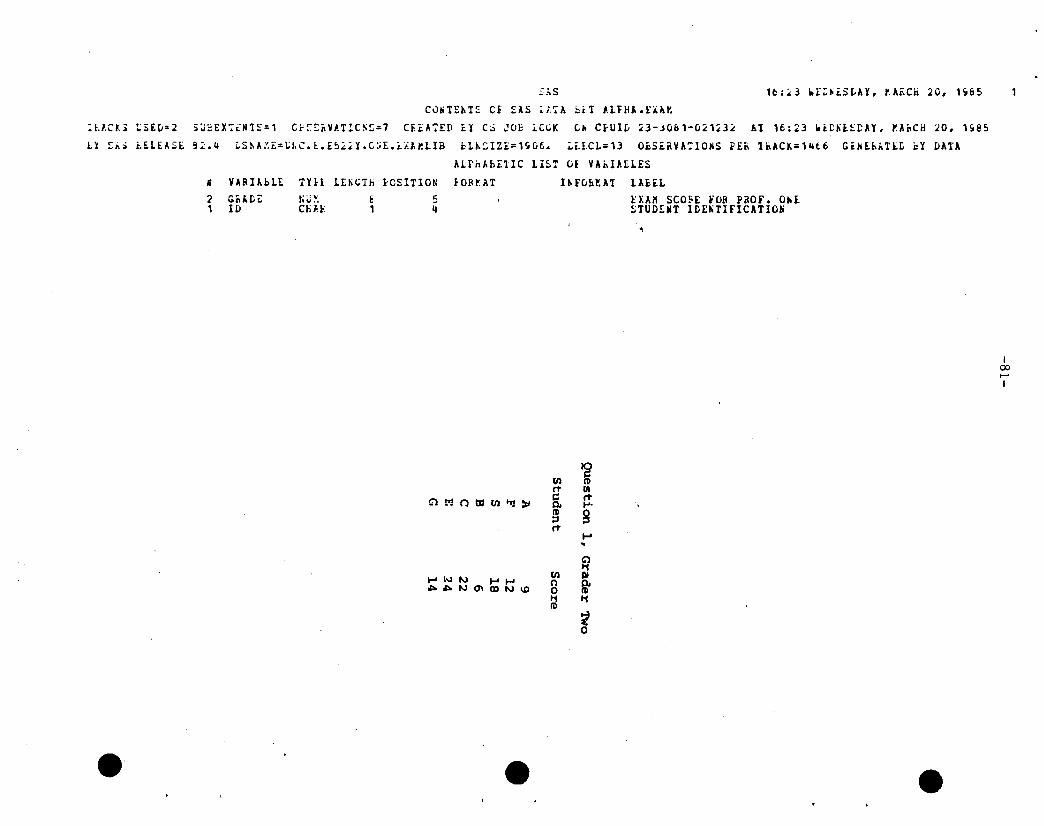
5
"C1
TYfL LE~CTh iC5ITION
'''''''v ..CtiH
YARHbLECCiAD t:Ii)
Ii
'21
~;S 1t:~3 ~[~~,SLAY, r.AACn 20, 1~65
C0~TEhTS CF 5AS Lt7A ~it ~LFHA.E~A~
l~lCr.~ ~~Ev:2 ~~=EX:i"15:1 Ci·~£~V#.T1CSS:1 CF.iA7ED EY C~ JOb ~CuK C~ C~Ulv ~3-jO&1-u~1~3~ At 1f:23 .i~Kl~~AY, ~A~CH ~O, 1~@5
LY ~,~ ~ELEASE 9~.4 LS.A~~=~LC.l.E5~~Y.C~E.~iAMLIB bL~SIZE=1~u6& ~~fCL=13 OiSiaVA:IOMS iE~ thACK=14t6 CiHEh'TlL ~Y DATA
AlrnhbElIC LrS~ OF VAhIAELES
FORrAT I~Fuh~A! LAbELEXAM SCO~E fOR P~OF. OhESTuorNT IDE~rIFICATION
I00....I
en ~rt III~ rtG'l!:':!OlJ1tn"':l):l Q. po(l) g::lrt ....
"Ci111
en III.... I~ ~ ........ n~""~O\(X)~IO 0
11 11(l)
~0
e e e
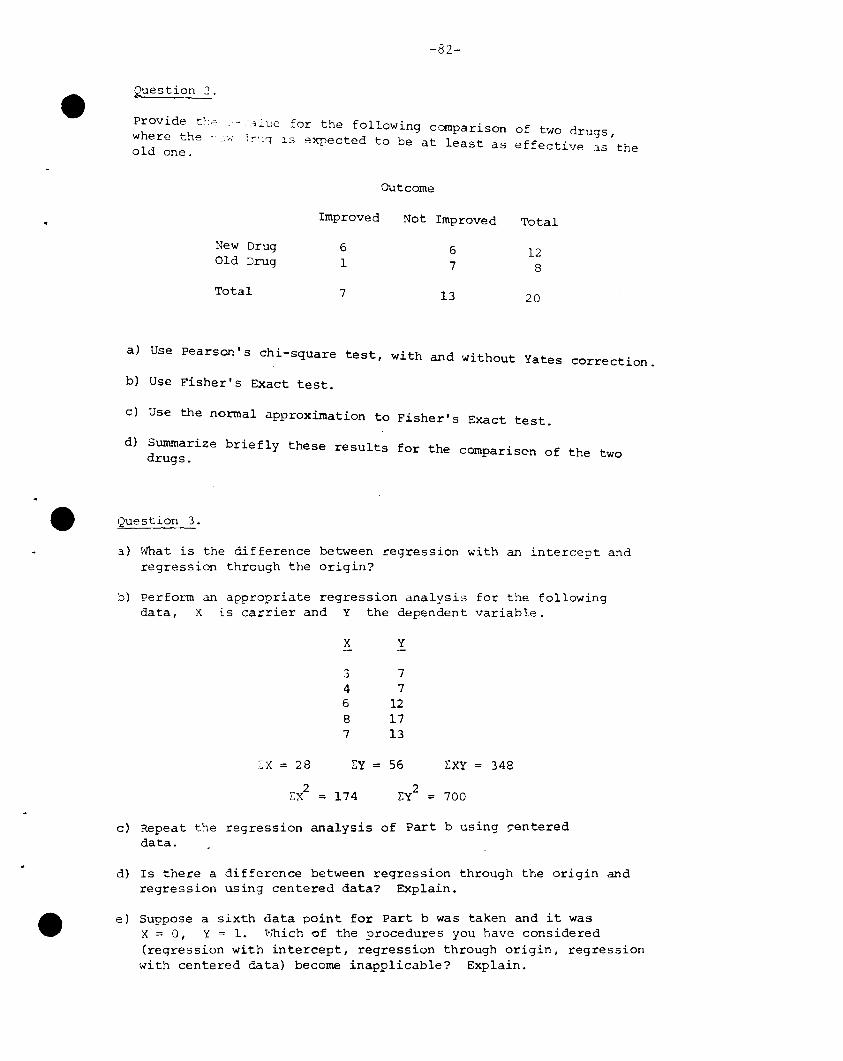
-82-
Question 2.
Provide t:--.,where theold one.
- ·3lue for the following comparison of two drugs,·d ;::-'1'1 is expected to be at least as effective ::is the
Outcome
Improved Not Improved Total
New Drug 6 6 12Old Drug 1 7 8
Total 7 13 20
a) Use pearson's chi-square t t 'thes , w~ and without Yates correction.
b) Use Fisher's Exact test.
c) Use the normal approximation to Fisher's Exact test.
d) Summarize briefly these results f or the comparison of the twodrugs.
e Question 3.
a) What is the difference between regression with an intercept andregression through the origin?
b) Perform an appropriate regression analysis for the followingdata, X is carrier and Y the dependent variable.
X Y
3 74 76 128 177 13
:::X = 28 ~y = 56 ~XY 348
r.i = 174
c) Repeat the regression analysis of Part busing gentereddata.
d) Is there a difference between regression through the origin andregression using centered data? Explain.
e) Suppose a sixth data point for Part b was taken and it wasX = 0, Y = 1. '·'hich of the procedures you have considered(regression with intercept, regression through origin, regressionwith centered data) become inapplicable? Explain.
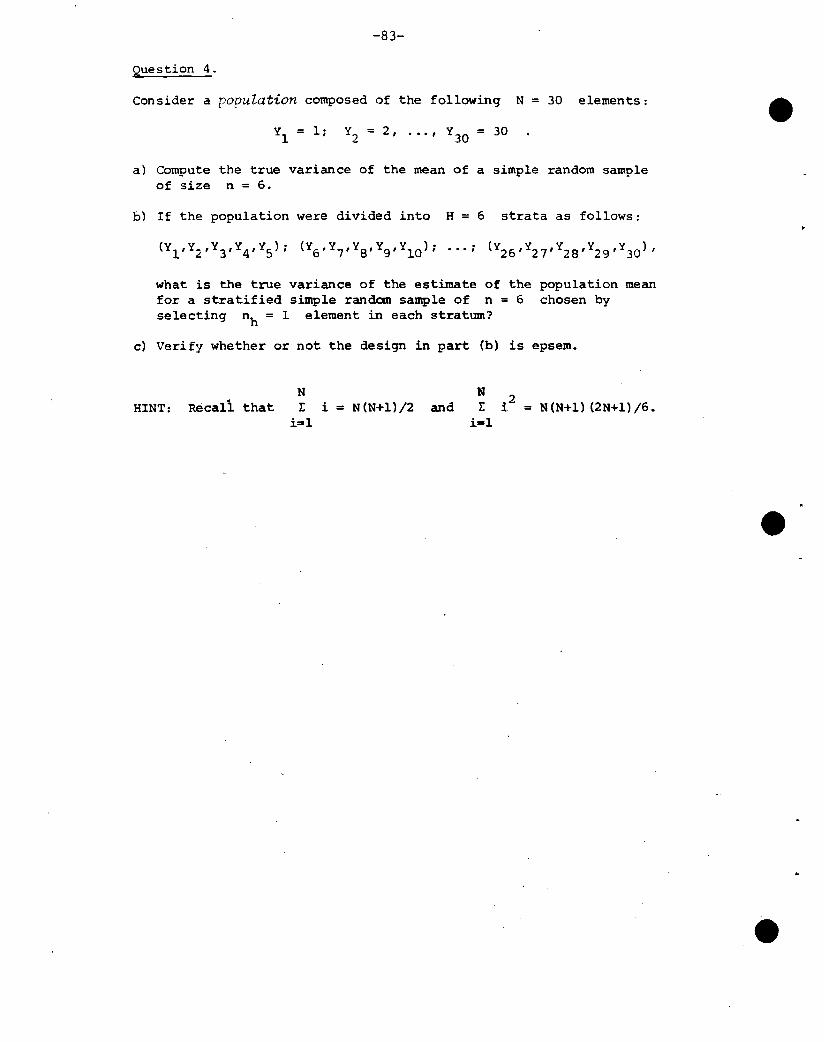
-83-
Question 4.
Consider a population composed of the following N = 30 elements:
y = 1;1 Y2 = 2, ••• , Y30 = 30
a) Compute the true variance of the mean of a simple random sampleof size n = 6.
b) If the population were divided into H = 6 strata as follows:
what is the true variance of the estimate of the population meanfor a stratified simple random sample of n = 6 chosen byselecting nh = 1 element in each stratum?
c) Verify whether or not the design in part (b) is epsem.
HINT: Recall thatN1:
i:=li := N(N+l)/2 and
NL
i=-l
2:i. :: N(N+l) (2N+l)/6.
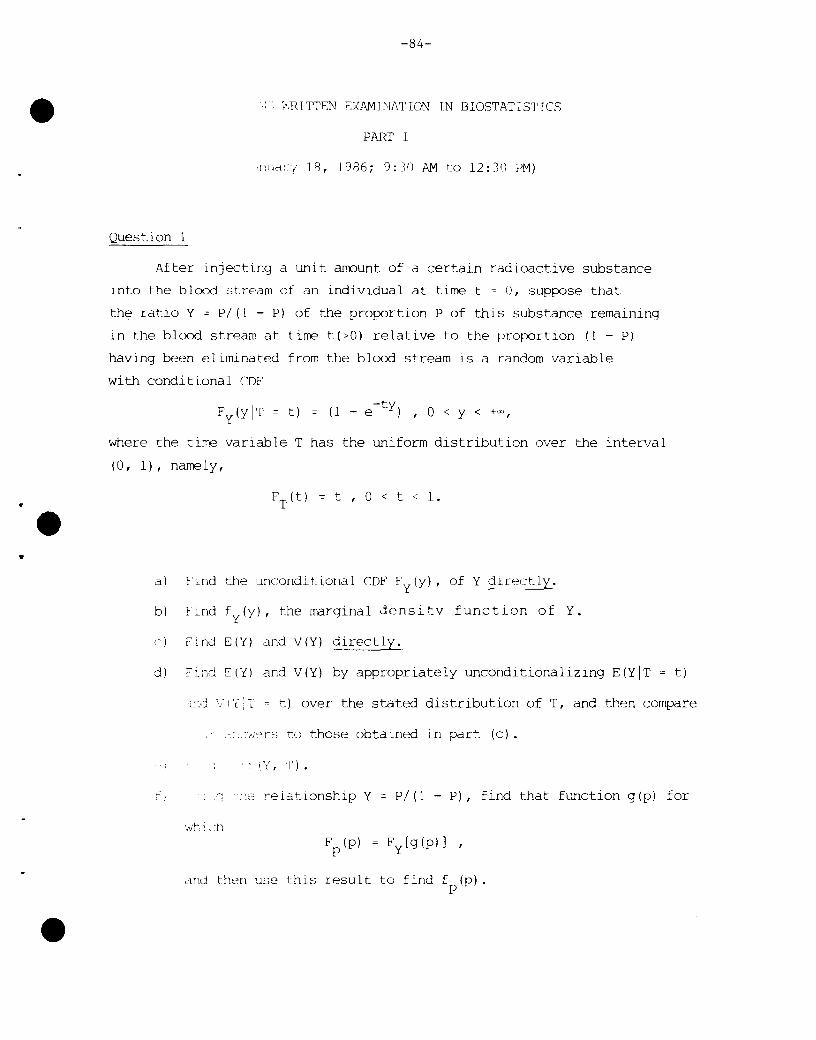
•
•
-84-
I\RTT'TF:N EXAMINATION IN BIOSTATISTICS
PART I
';,UdC/ 18, 1986; 9:JO AM to 12:]0 PM)
Question 1
After injecting a unit amount of a certain radioactive substance
into the blood stream of an individual at time t ~ 0, suppose that
the ratio Y = P/(l - P) of the proportion P of this substance remaining
in the blood stream at time t(>O) relative to the proportion (1 - P)
having been eliminated from the blood stream is a random variable
with conditional CDF
-tyFy(YIT = t) = (1 - e ), 0 < y < +00,
where the time variable T has the uniform distribution over the inteD/al
(0, 1), namely,
t,O<t<l.
a) Fi.nd the unconditional CDF Fy(Y), of Y directly.
b) Find fy(Y), the marginal jensitv function of Y.
c) Fi nd E (Y) dnd V (Y) directly.
d) Find E(Y) and V(Y) by appropriately unconditionalizing E(Y!T = t)
nJ \. ('{ :1 = t) over the stated distribution of T, and then compare
,: .. :'dec:; to those obtained in part (c) •
. : iY, T).
:~ relationship Y p/(l - P), find that function g(p) for
dnd then use this result to find f (p).P
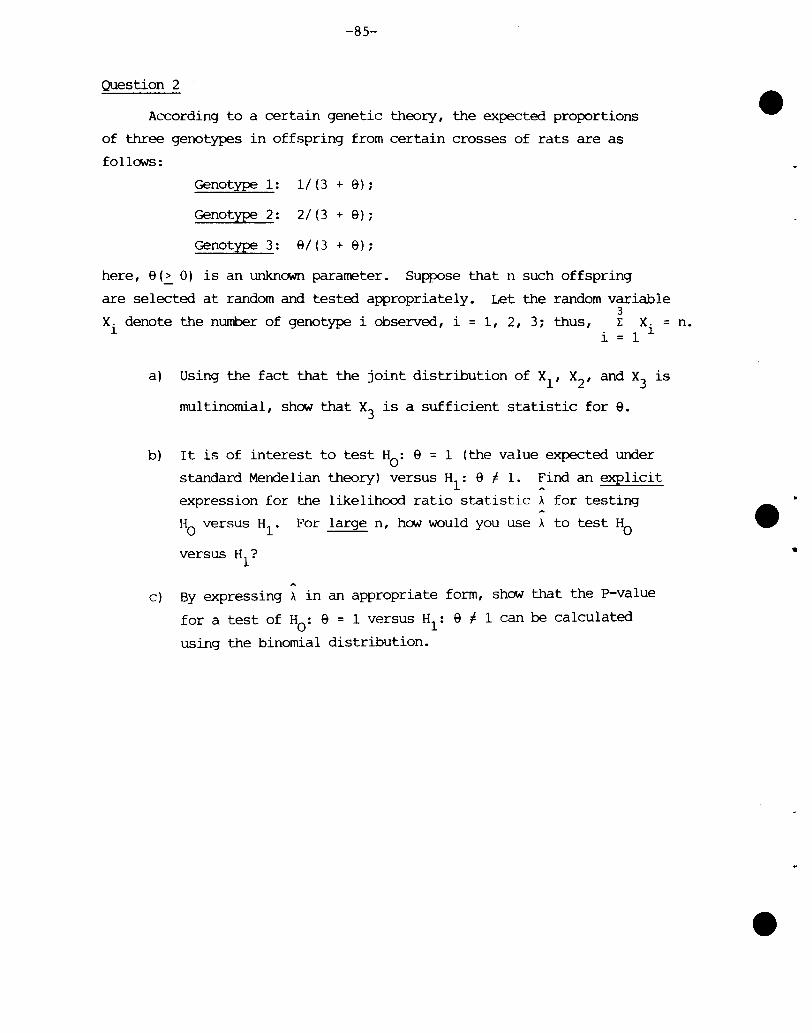
-85-
Question 2
According to a certain genetic theory, the expected proportions
of three genotypes in offspring from certain crosses of rats are as
follONs:
Genotype 1: 1/ (3 + 9);
Genotype 2: 2/ (3 + 9);
Genotype 3: 9/ (3 + 9);
here, 9 (.::.. 0) is an unknONn parameter. Suppose that n such offspring
are selected at random and tested appropriately. Let the random variable3
X. denote the number of genotype i observed, i = 1, 2, 3; thus, EX. = n.1 i = 1 1
a) Using the fact that the joint distribution of Xl' X2, and X3 is
multinomial, shON that X3 is a sufficient statistic for 9.
b) It is of interest to test HO: 9 = 1 (the value expected under
standard Mendelian theory) versus H1: 9 f 1. Find an explicit
expression for the likelihood ratio statistic A for testing
HO versus H1. For large n, hON would you use A to test HO
versus HI?
c) By expressing A in an appropriate form, shON that the P-value
for a test of HO
: 9 = 1 versus H1: 9 f 1 can be calculated
using the binomial distribution.
•
-86-
Ques+- :
,. ,'rung program for hypertensive patients in a:ertain community
+-~l'+- 3. potential patient have n independe:1t readings of his
or her blood pressure taken at each of k separate clinic visits.
The reason for requiring a total of k'n blcxx1 pressure readings on
each subject is that blood pressure readings are known to fluctuate
considerably, both between and within visits. A model used to account
for these two sources of variab1lity is as follows. If Y, , denotes1J
the observed blood pressure reading for a randomly selected individual
for the j-th of the n readings taken at the i-th visit, then
Y .. =9+0:, +11 .. ,1J 1 1J
where 9 is a fixed unknown constant, £'1
, n, ,1J
£' dnd n, , are independent, i1 1J
1, 2, ... , k and j 1,2, ... ,n.
•a) Find E(Y, ,), and discuss its meaning with regard to the hyper
1J
tension screening program described above.
b ) ~" 1 nd V (y, ,) •1J
-EY1-
1 n- I: Y, " fi:1d'1(Y, ).n, 1 1J 1·J=
tY, ,'. :-~d S (e 1 J), and then use the result to infer the form of the
;L'O':Cioution of Y"1J.
-87-
Question 4
Suppose that associated with every member of some population
of N elements are two measures, a y-variable and an x-variable. When
a simple random sarrple of size n is chosen, the sample means, Y and x ,o 0
may be used to estimate the corresponding population me..ans, Yand X,
respectively.
a) The covariance between Yo and Xo is
Cov (Yo' xo ) = (l-f) Syx/n,
where f = nlN and S is another covariance. Give a clearyx
intuitive explanation of the conceptual difference between
cov(yo' xo ) and Syx.
b) Note that r = Yo/xo may be used to estimate R = Y/X when n is
sufficiently large. Decompose the mean square error of r,
MSE(r) = E(r _R)2, into bias and variance components.
c) One rationale for obtaining a variance expression for r is
to note that
• (y - RX )IXo 0
Using this ration~le and stating any additional assumptions,
develop an expression for Var(r).
d) Assuming that the two measures are uncorrelated in the
population and that r is unbiased, show that the coefficient
of variation for r is approximately
CV(r) = [{CV(Yo
)}2 + {CV (Xo
)}2]1/2
-88-
MS WRITTEN EXAMINATION IN BIOSTATISTICS
PART II: APPLICATIONS
(January 19, 1986; 1:00 PM to 5:00 PM)
INSTRUCTIONS
a) This is an open-book examination.
b) The time limit is four hours.
c) Answer any three of the four questions which follow.
d) Put the answers to different questions on separate sheetsof paper.
e) Since your papers will be xeroxed for back-up purposes, usea pen/pencil and paper combination which will reproduce clearly.
f) Put your code letter, not your name, on each question.
g) Return the examination with a signed statement of the honorpledge on a page separate from your answers. Do not identifyyour code letter on the honor pledge; use your name.
Question 1
Four vaccines were treated with six evenly spaced levels of
an addi'i-ve that was supposed to increase the antibody response. The
dat-a, "113tions, and summary statistics are provided in Table 1 for
rm ..to analysis of variance, reporting on the possibili tyJOY dose response pattern may depend upon the vaccine.
Gi presuming a common dose response pattern across vaccines,examlne theqnificance and adequacy of a linear trend onthe amount at additive.
c) Calculate 95% confidence limits for the true average antibodyresponse, presuming a true linear trend, at the mean amountof additive.
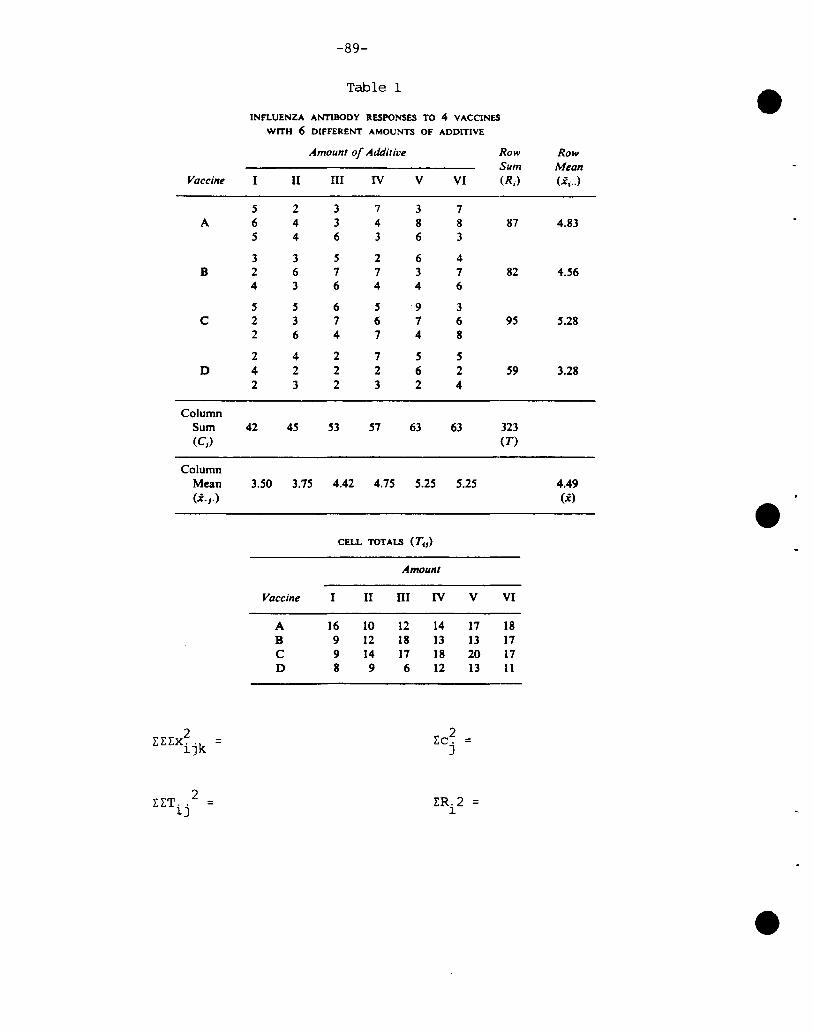
2 2HEx. 'k Ec. =
1J J
EET ..2 ER.2= =
1J 1
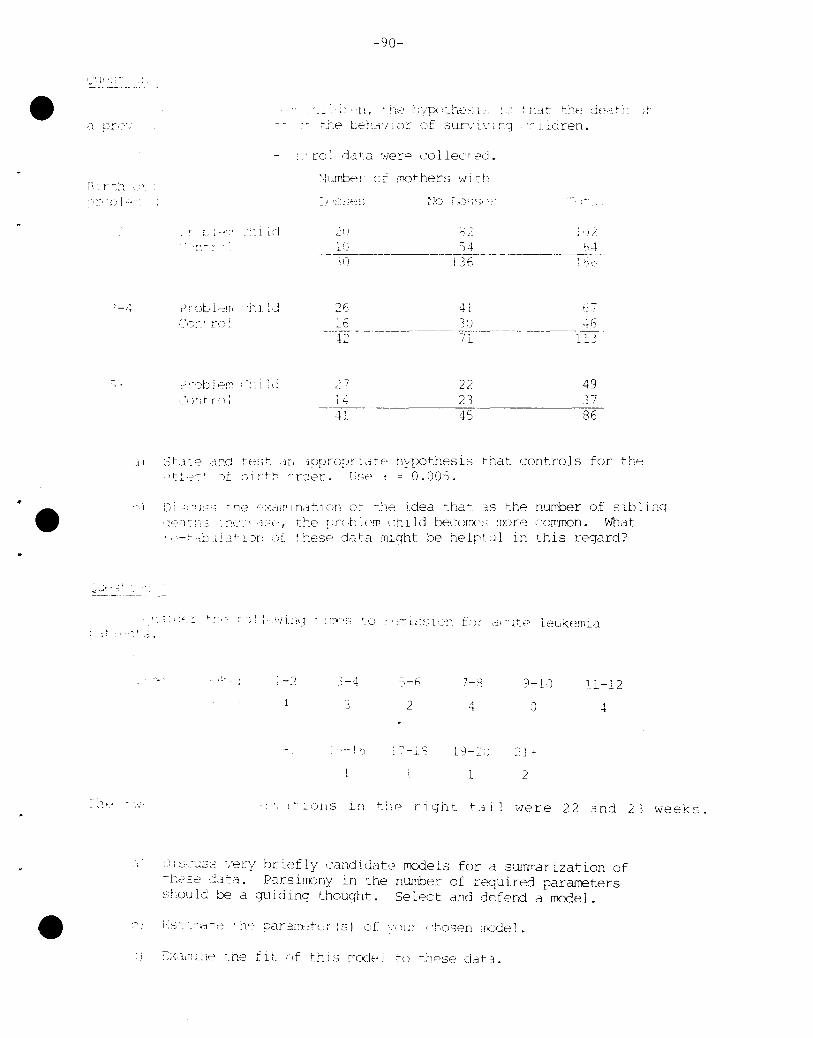
-90-
.,"
1 ( C).:) ., 4_._~-~---- -'-~---13 6 ---- ._-_._--; ;, " -
\)IllT'ber
.2(1
frot hers '",i c h
: 1}2
, 1--,'1'
., .. ~ 'cb 1Pr:' t~.: c1:>mt e:l
2r:, J' 0• L
i6 30 46l' , ' 11'.L ;l. L.L-.J
,~
27. 49L~ /
i4 23 374J 45 86
1i :·)t3 f e anej test.lnmpropriatE:' h"pothesis that controls for th,,=,.)t~·f;~c~- (jf t)it-th ~_:'rder. Ilse:t. = 0.005.
::JL."'''j>~':; 'r',e ,':~afTllndtl()n of '::'f:> idea that 3.3 thp number of siblii;q:~':l~r;:; 1 "CC"Ft", the prcb1efT1 child bE'COrilE,,; :rore common. What,,-J-,b.il J+ ,':JfC :,f tr,esp data 'lllght be helpful in this regard?
leukern:.a
-1 1-4 ::,-1) 7-2 9-L') 11-12
1 3 2 4 0 4
"-,- I - L·') L0-::' ::'1 ..L 1 2
'lons ln t:,e riqht tai 1 "Nere 22 and 23 weeks.
,) CnSCJs." '/ery bripf ly candidate rrodels for a summarization of'-j-;Pse' :lata. Parsimony in the nwnber of required parameters:'rou ld be a guidlng thought. Se lect and defend a mode 1.
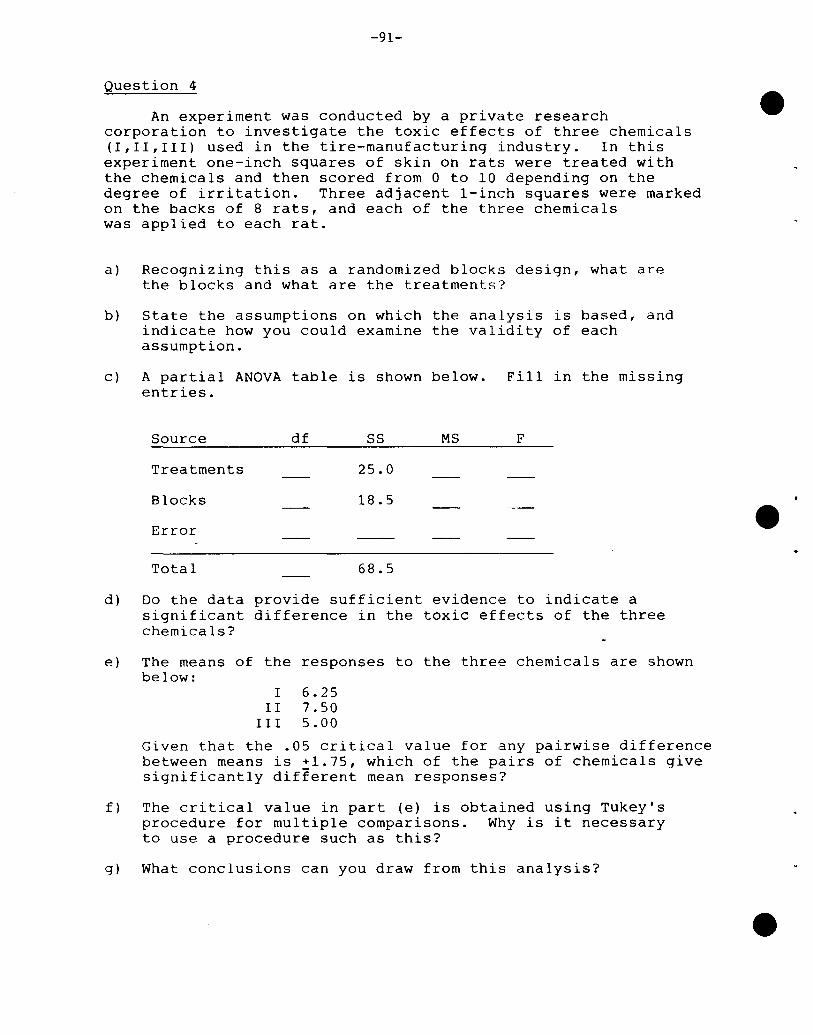
-91-
Question 4
An experiment was conducted by a private researchcorporation to investigate the toxic effects of three chemicals(1,11,111) used in the tire-manufacturing industry. In thisexperiment one-inch squares of skin on rats were treated withthe chemicals and then scored from 0 to 10 depending on thedegree of irritation. Three adjacent 1-inch squares were markedon the backs of 8 rats, and each of the three chemicalswas applied to each rat.
a) Recognizing this as a randomized blocks design, what arethe blocks and what are the treatments?
b) State the assumptions on which the analysis is based, andindicate how you could examine the validity of eachassumption.
c) A partial ANOVA table is shown below. Fill in the missingentries.
Source
Treatments
Blocks
Error
Total
df SS
25.0
18.5
68.5
MS F
d) Do the data provide sufficient evidence to indicate asignificant difference in the toxic effects of the threechemicals?
e) The means of the responses to the three chemicals are shownbelow:
I 6.25II 7.50
III 5.00
Given that the .05 critical value for any pairwise differencebetween means is +1.75, which of the pairs of chemicals givesignificantly different mean responses?
f) The critical value in part (e) is obtained using TUkey'sprocedure for multiple comparisons. Why is it necessaryto use a procedure such as this?
g) What conclusions can you draw from this analysis?
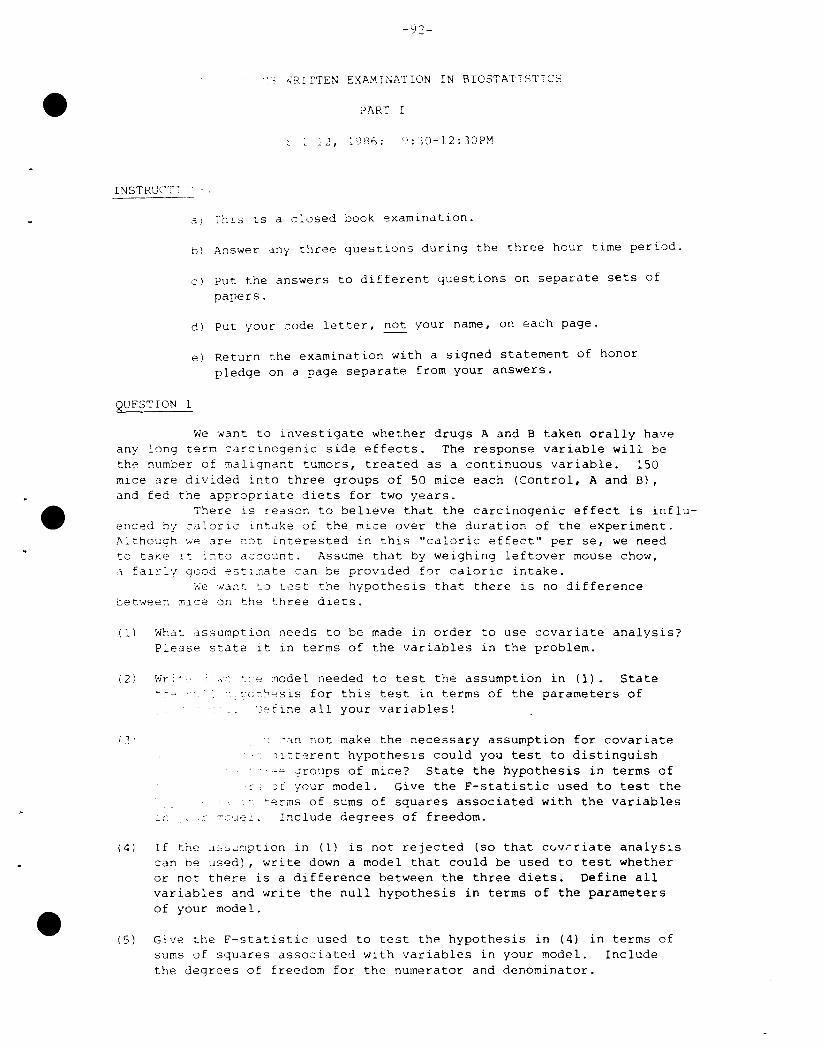
-9~-
" ~RITTEN EXAMINATION IN BIOSTATISTICS
?ART I
C\ : ,30 -12: 30 PM
INSTRUCT c '
,'i) i'hL3 LS d closed book exam~nation.
b) Answer any three questions during the three hour time period.
c) Put the answers to different questions on separate sets ofpapers.
d) Put your code letter, not your name, on each page.
e) Return the examination with a signed statement of honorpledge on a page separate from your answers.
QUESTION 1
We ~ant to investigate whether drugs A and B taken orally haveany long term carcinogenic side effects. The response variable will bethe number of malignant tumors, treated as a continuous variable. 150mice are divided into three groups of 50 mice each (Control, A and B),and fed the appropriate diets for two years.
There is reason to believe that the carcinogenic effect is influenced by caloric Lntake of the m~ce over the duration of the experiment.Although ~e are not interested in this "caloric effect" per se, we needto take It into account. Assume that by weighing leftover mouse chow,a falrly good estImate can be provided for caloric intake.
~e ~ant to test the hypothesis that there is no differencebet~een mlce on the three die~s.
(1) What assumption needs to be made in order to use covariate analysis?Please state it in terms of the variables in the problem.
(2 )
( 3
r,..lr i" - ~~e model needed to test the assumption in (1). State- ccc~Qsis for this test in terms of the parameters of
~efine all your variables!
:an not make the necessary assumption for covariatejlfferent hypothesis could you test to distinguish"e ~roups of mice? State the hypothesis in terms of)[ jour model. Give the F-statistic used to test the
terms of sums of squares associated with the variables-"leI. Include degrees of freedom.
(4) If the ~ssumption in (1) is not rejected (so that c0vrriate analysiscan be used), write down a model that could be used to test whetheror not there is a difference between the three diets. Define allvariables and write the null hypothesis in terms of the parametersof your model.
(5 ) Give the F-statistic used to test the hypothesis in (41 insums of squares associated with variables in your model.the degrees of freedom for the numerator and denominator.
terms ofInclude
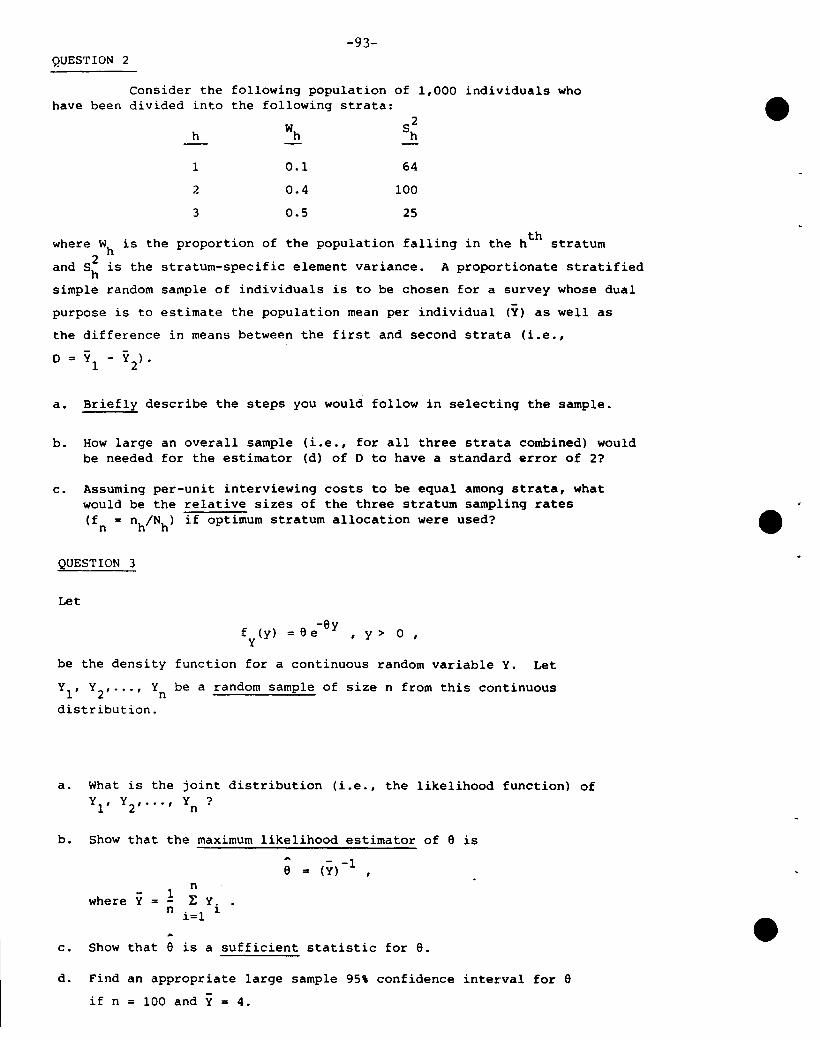
-93-QUESTION 2
Consider the following population of 1,000 individuals whohave been divided into the following strata:
h
1
2
3
0.1
0.4
0.5
64
100
25
thwhere W
his the proportion of the population falling in the h stratum
and S~ is the stratum-specific element variance. A proportionate stratified
simple random sample of individuals is to be chosen for a survey whose dual
purpose is to estimate the population mean per individual (Y) as well as
the difference in means between the first and second strata (i.e.,
o = Y1 - Y2)·
a. Briefly describe the steps you would follow in selecting the sample.
b. How large an overall sample (i.e., for all three strata combined) wouldbe needed for the estimator (d) of 0 to have a standard error of 2?
c. Assuming per-unit interviewing costs to be equal among strata, whatwould be the relative sizes of the three stratum sampling rates(f
nnh/N
h) if optimum stratum allocation were used?
QUESTION 3
Let
-eyf (y) = e e , y > a ,
Y
be the density function for a continuous random variable Y. Let
Y1
, Y2,· .. , Y
nbe a random sample of size n from this continuous
distribution.
a. What is the joint distribution (i.e., the likelihood function) ofY
1, Y
2, .. ·, Y
n?
b. Show that the maximum likelihood estimator of e is
.. - -1e = (Y) ,
where Y1 n
E Y.n i=l 1.
c. Show that e is a sufficient statistic for e.
d. Find an appropriate large sample 95\ confidence interval for eif n = 100 and Y = 4.
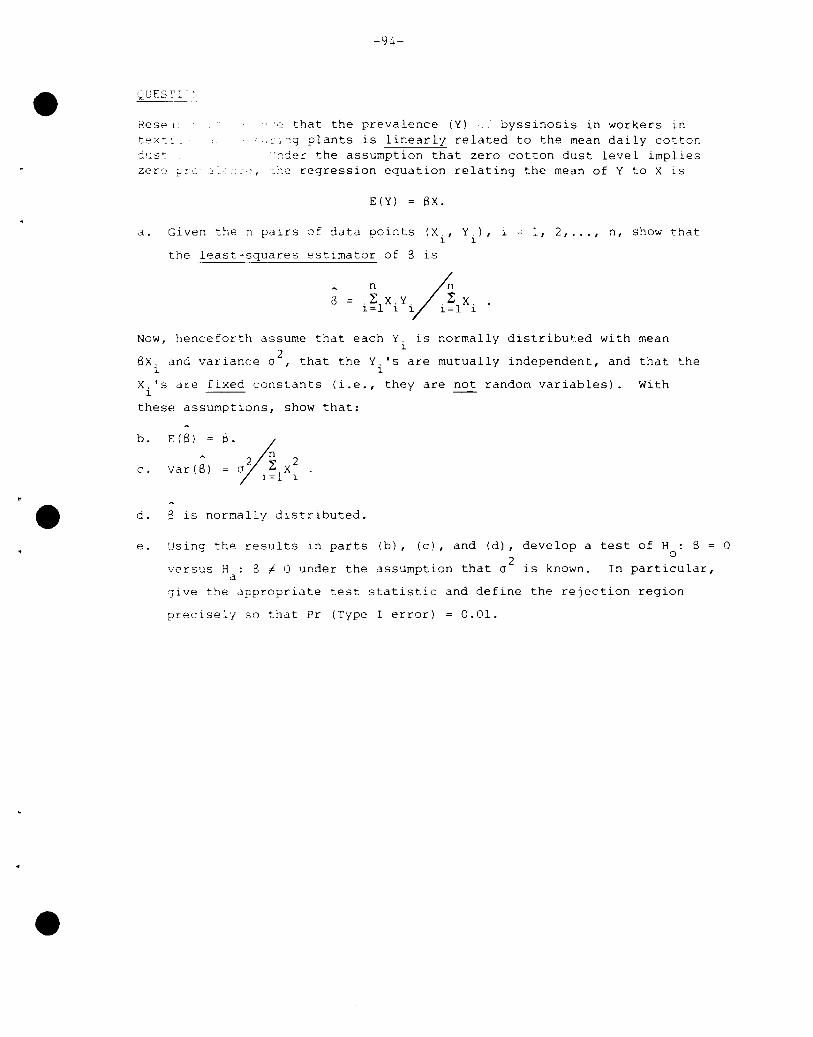
Rese 1:
text:. ~
-94-
.~ that the prevalence (Y) byssinosis in workers in,~Ing plants is linearly related to the mean daily cotton
nder the assumption that zero cotton dust level impliest~e regression equation relating the mean of Y to X is
E(Y) = BX.
a. Given the n pairs of data points (X, Y), i1 1
the least-squares estimator of B is
A n ~B = .~ x.Y.! X.1=1 1 1 1=1 1
1,2, ... , n, show that
Now, henceforth assume that each Y. is normally distributed with mean1
Bx. and variance 02
, that the Y, 's are mutually independent, and that the1 1
X. 's are fixed constants (i.e., they are not random variables). With1 ---
these assumptions, show that:
b.
c.
d.
E(Bl = B. yjA 2 n 2
Var(8) = 0 .~.lX'1= 1
B is normally distributed.
e. using the results in parts (b), (cl, and (d), develop a test of H : 8 = 0o
versus H : S ~ 0 under the assumption that 02
is known. In particular,a
~ive the appropriate test statistic and define the rejection region
precisely so that Pr (Type I error) = 0.01.
-95-
SPECIAL MS WRITTEN EXAMINATION IN BIOSTATISTICS
PART II
April 13, 1986: 9:30AM to 1:30PM
INSTRUCTIONS:
a) This is an open book examination.
b) Answer any three questions.
c) Put the answers to different questions on separate sets ofpapers.
d) Put your CODE LETTER, (not your name), on each page.
e) Return the examination with a signed statement of honorpledge on a page separate from your answers.
f) You are required to answer only what is asked in thequestions, and not all you know about the topics.
QUESTION 1
a. (10 points: 1 pnt/part)Briefly describe or explain (in one or two sentences) the followingterms:
(1 ) OS(2) TSO(3) Track (on magnetic disk)(4) Block(5) parity bit(6) Field(7) JCL(8) EBCDIC(9) Collating sequence
(10) Backup
b. (15 points: 3 pnts/part)In a brief paragraph, possibly using diagrams or Figures, compareand contrast each group of terms:
(1) OS file, SAS data library, SAS dataset(2) Logical record, physical record(3) JCL step, SAS step(4) DSN, ddname(5) Program data vector, input buffer
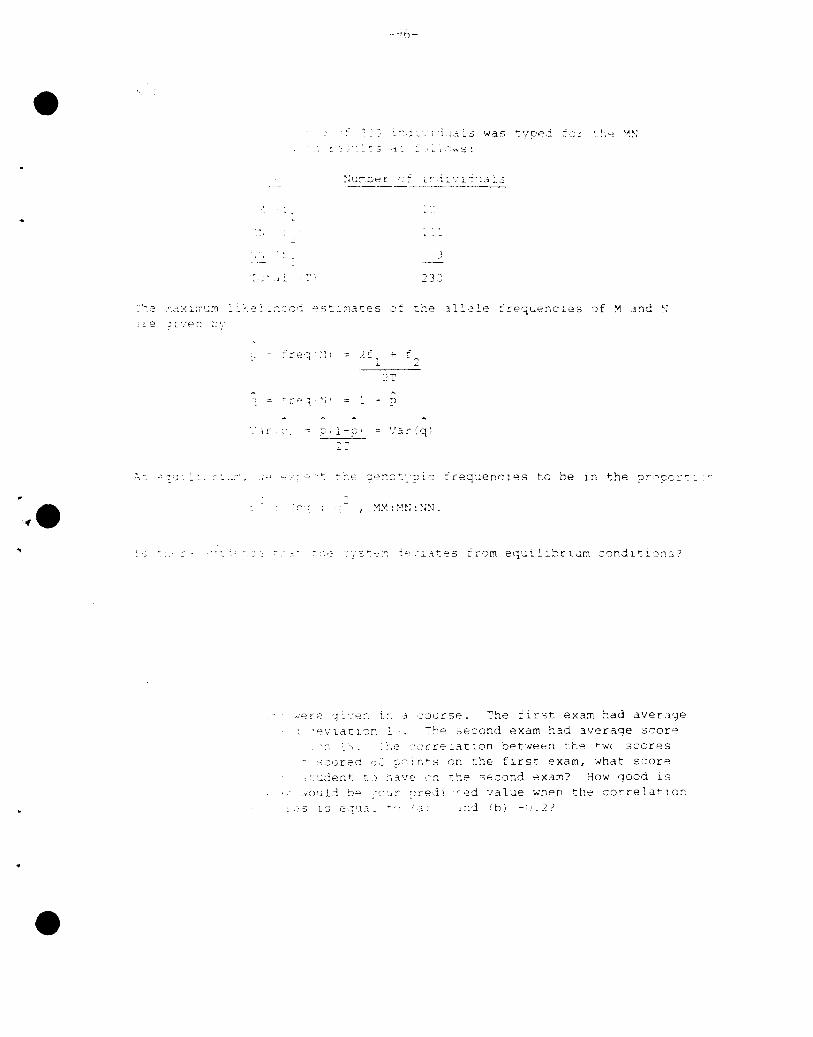
....;s:
_ 1
2]J
2:,
- ~)
2
··~e
~~re 11',"en ~_ :OlJrse. The first exam had average'~Vla(lan 1 ~he second exam had 3veraae score
. - ~~e -ccre~atlon between ~~e ~wc scoreson the first exam, what score~~e second exam? How good isred value when the correlatlon
'-3:.:: I.";.'red
-,..:.C:ent
:/oulj be... jl Ib) ·2?
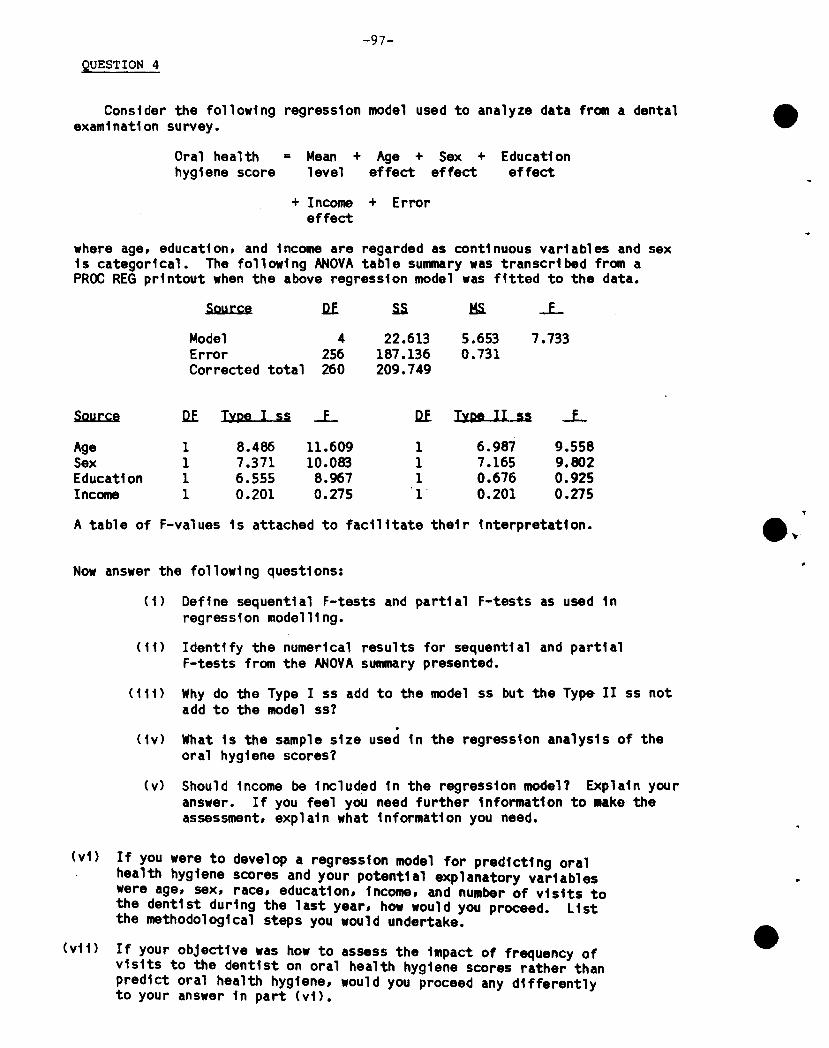
-97-
QUESTION 4
Consider the following regression model used to analyze data from a dentalexamination survey.
Oral health = Mean + Age + Sex + Educationhygiene score level effect effect effect
+ Income + Erroreffect
where age, education, and income are regarded as continuous variables and sexis categorical. The following ANOYA table summary was transcribed from aPROC REG printout when the above regression model was fitted to the data.
Source Uf SS HS. -L
Model 4 22.613 5.653 7.733Error 256 187.136 0.731Corrected total 260 209.749
Source Uf Type I ss -L Uf Type II ss ..L...
Age 1 8.486 11.609 1 6.987 9.558Sex 1 7.371 10.083 1 7.165 9.802Education 1 6.555 8.967 1 0.676 0.925Income 1 0.201 0.275 1 0.201 0.275
~
A table of F-values is attached to facilitate their interpretation. e~
Now answer the following questions:
(1) Define sequential F-tests and partial F-tests as used inregression modelling.
(ii) Identify the numerical results for sequential and partialF-tests from the ANOYA summary presented.
(11 1) Why do the Type I ss add to the model ss but the Type II ss notadd to the model ss? .
(iv) What is the sample size used in the regression analysis of theoral hygiene scores?
(v) Should income be included in the regression model? Explain youranswer. If you feel you need further information to mako theassessment, explain what information you need.
(vi) If you were to develop a regression model for predicting oralhealth hygiene scores and your potential explanatory variableswere age, sex, race, education, income, and number of visits tothe dentist during the last year, how would you proceed. Listthe methodological steps you would undertake.
(vii) If your objective was how to assess the impact of frequency ofvisits to the dentist on oral health hygiene scores rather thanpredict oral health hygiene, would you proceed any differentlyto your answer in part (vi).
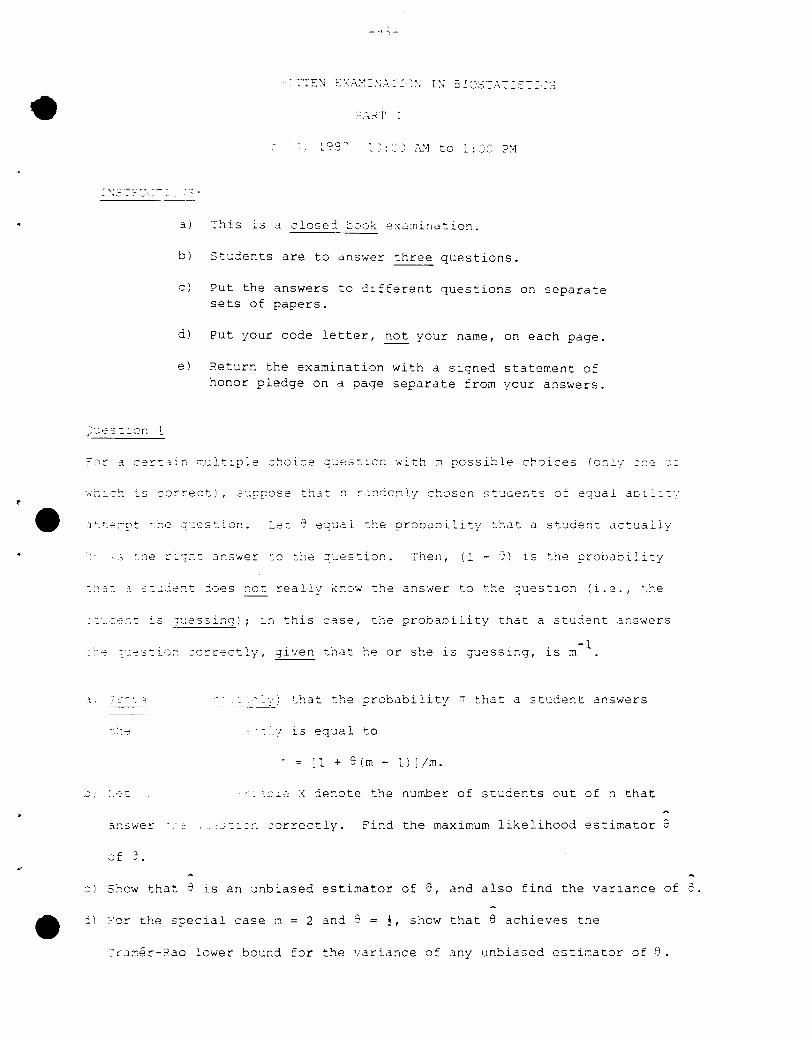
- -I "\_
198'
a) This is a closed ~ook examination.
b) Students are to answer three questions.
c) Put the answers to different questions on separatesets of papers.
d) Put your code letter, not your name, on each page.
e) Return the examination with a signed statement ofhonor pledge on a page separate from your answers.
:or 3 C2r~~~n ~ultipie ~~oice q~es~ion with ~ possible choices (onl'/ ::--.~
~hl'=~ is ~8rrect), s~~pose ~hat ~ ~3~dcmly shosen s~~dents of equal 3bil~~~'
~e~ ~ equal ~he probability that a stude~t actually
,~ :~e ~iS~: answer ~o ~he ~~es~ion. Then, (1 - 8) is ~he prooability
~:'~: ) s~~Gent ioes ~ot ~eallv k~ow the answer to the question (i.e., the
=_~:~~: is ~~essi~g); l~ ~his case, the probability that a student a~swers
::'..lestl.C~ ::c:r-r2ctly, gi'/en that he or she is guessir.g,-1
is m
___' '--":') ~hat the probability ;r that a student answers
/ lS equal to
:1 + 8(m - 1) Jim.
_ '.C i.e :< denote the number of students out of n that
of 9.
~s::::~ ::orrectly. Find the maximum likelihood estimator 9
0) Show that e is an unbiased estimator of S, and also find the variance of 8.
i) ?or the special case m = 2 and e = !, show that 8 achieves the
~carn~r-Rao lower bound for the variance of any unbiased estimator of S
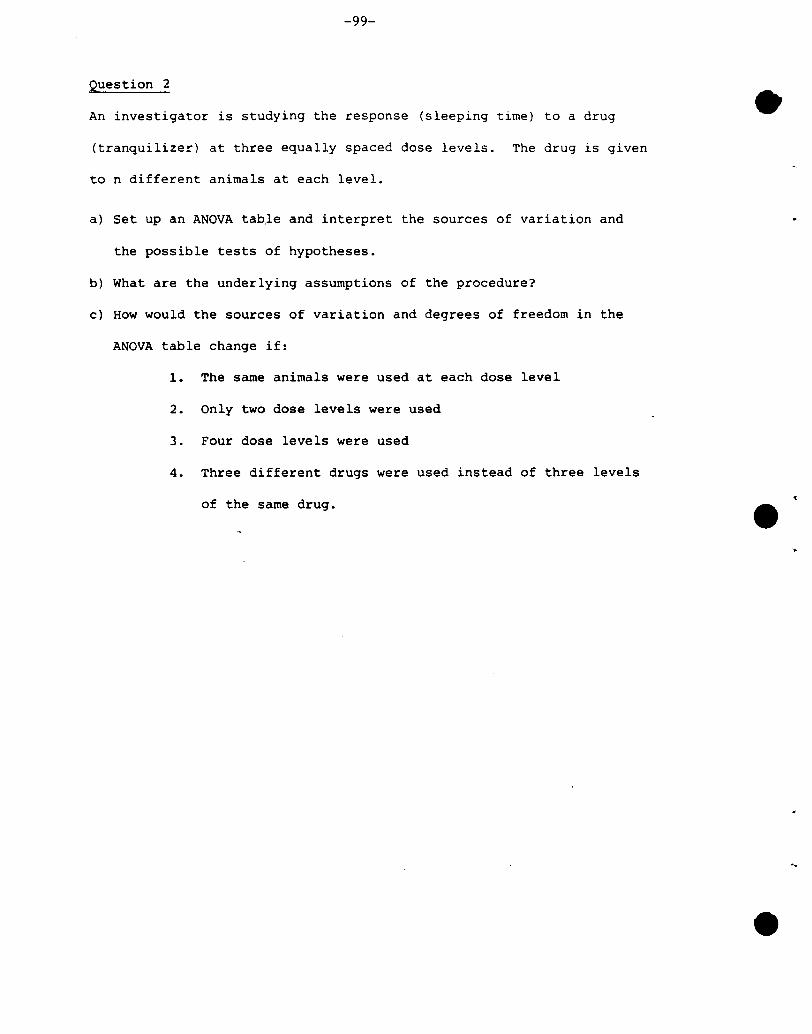
-99-
Question 2
An investigator is studying the response (sleeping time) to a drug
(tranquilizer) at three equally spaced dose levels. The drug is given
to n different animals at each level.
a) Set up an ANOVA tab.le and interpret the sources ()f variation and
the possible tests of hypotheses.
b) What are the underlying assumptions of the procedure?
c) How would the sources of variation and degrees of freedom in the
ANOVA table change if:
1. The same animals were used at each dose level
2. Only two dose levels were used
3. Four dose levels were used
4. Three different drugs were used instead of three levels
of the same drug. •
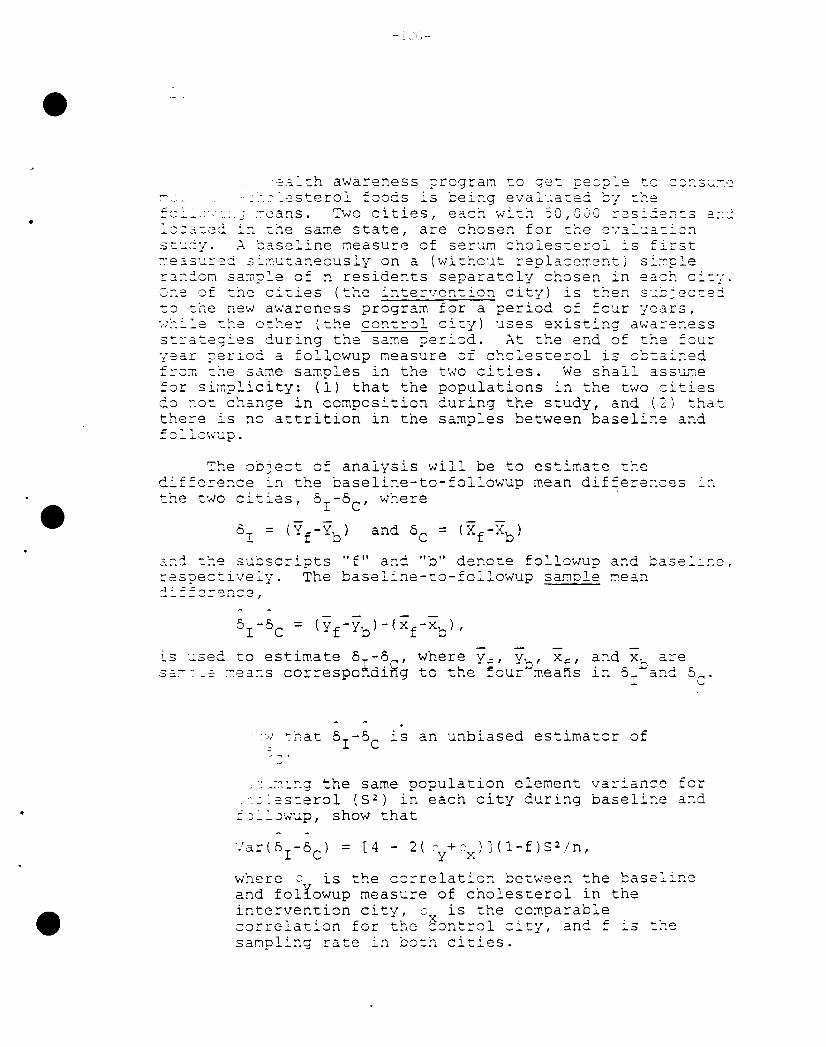
•
'~~~~h awareness ?rogram to get pe~?le tc c~~s~~~
_~'~esterol foods is being eval~ated by the:c.:._~" ; ~<2~ns. Two cities, each 'with SO,OGO res:de::ts 20:-.::::lcc~~ed in the same state, are chosen for the e~~l~ation
st~dy. A baseline measure of ser~ cholesterol is first~e~sured simutaneously on a (without replacement) si~ple
random sam?le of n residents separately chosen in each city.One of the cities (the intervention city) is then s~b~ec:ed
~o the new awareness program for a period of four years,~hile the other (the control city) uses existing awarenessstrategies during the same period. At the end of the fouryear period a followup measure of cholesterol is obtainedfrom the same samples in the two cities. We shall ass~~e
=or sim?licity: (1) that the populations in the two citiesdo not change in composition during the study, and (2) tha~
there is no attrition in the samples between baseline and
~he object of analysis will be todifference in the baseline-to-followupthe two cities, 0r-oe' where
estimate themean differences
3.;.j the subscripts "f" a".d "b" denote followup and baselir.e I
respectively. The baseline-to-followup sample mean~-=-=:2:-ence,
is used to estimate 0r-oe' where y-, Yb' x f ' and xb areS~~:_2 ~eans corresponding to the four means in 5 r and cC '
is an unbiased estimator of
c~~~:ng the same population element variance for-::esterol (52) in each city during baseline and
~~:lcwup, show that
'/ar(or-oc) = [4 - 2( C'y+cx )](1-f)5 2 /n,
where 0 is the correlation between the baselineand fol{owup measure of cholesterol in theintervention city, 2 is the comparablecorrela~ion for the e8nt~81 city, and f is ~~esampling rate in both cities.
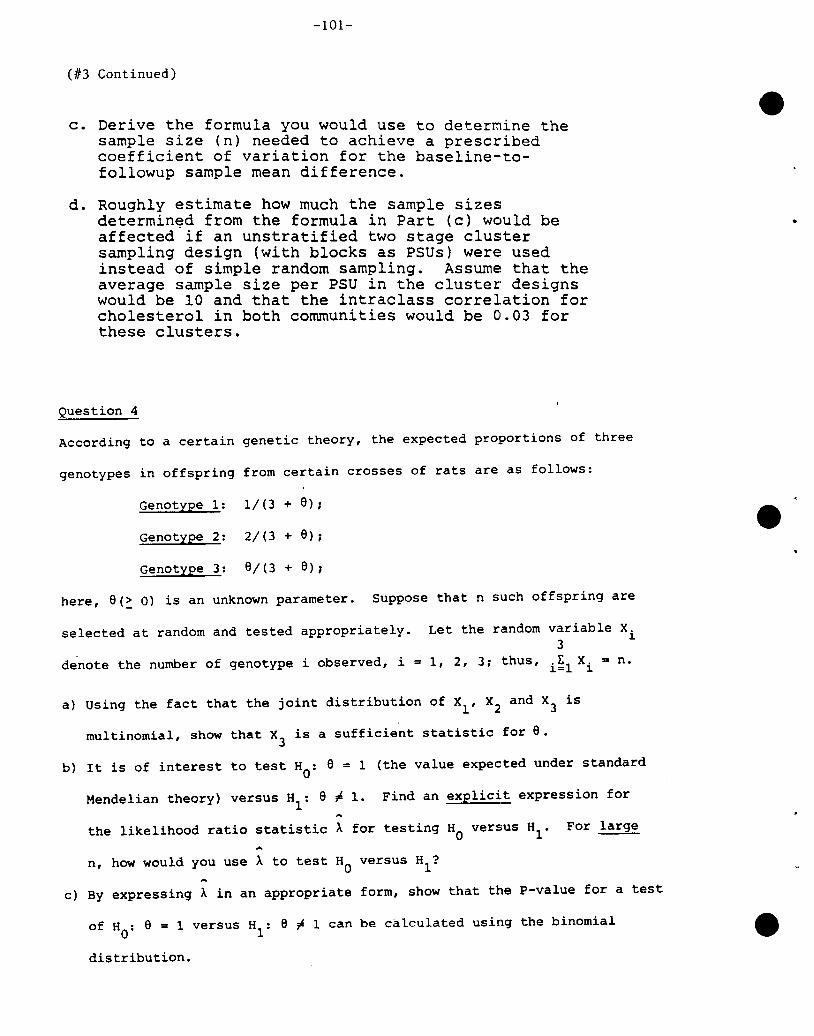
-101-
(1/3 Continued)
c. Derive the formula you would use to determine thesample size (n) needed to achieve a prescribedcoefficient of variation for the baseline-tofollowup sample mean difference.
d. Roughly estimate how much the sample sizesdetermin~d from the formula in Part (c) would beaffected if an unstratified two stage clustersampling design (with blocks as PSUs) were usedinstead of simple random sampling. Assume that theaverage sample size per PSU in the cluster designswould be 10 and that the intraclass correlation forcholesterol in both communities would be 0.03 forthese clusters.
Question 4
According to a certain genetic theory, the expected proportions of three
genotypes in offspring from certain crosses of rats are as follows:
Genotype 1: 1/(3 + 6)~
Genotype 2: 2/(3 + 6)~
Genotype 3: 6/(3 + 6)~
here, 6(~ 0) is an unknown parameter. Suppose that n such offspring are
•
selected at random and tested appropriately. Let the random
denote the number of genotype i observed, i = 1, 2, 3~ thus,
variable X.3 1.
.I:1
X. = n.1.= 1.
a) Using the fact that the joint distribution of Xl' X2 and X3 is
multinomial, show that X3
is a sufficient statistic for 6.
b) It is of interest to test HO
: 6 = 1 (the value expected under standard
Mendelian theory) versus Hl
: 6 F 1. Find an explicit expression for
the likelihood ratio statistic A for testing HO versus Hl • For large
n, how would you use A to test HO versus Hl ?
c) By expressing A in an appropriate form, show that the p-value for a test
of HO
: 6 = 1 versus Hl
: 6 ~ 1 can be calculated using the binomial
distribution.
e e,
e;;.
i ~,
i l
, I
'J >:, I~"j pJVi ',j(t Irij' <D() ,Div I,I'm
p.
I J ([)
ClI' C)
II
j r"
CJ (U() ,.,. I··~j (.1'-), tJ'1 IJ(lJ I' ,I
t-) It; : fIt" ,0
(J1,1 C~
:J t,J() :>.;(lJ, I
~.J" t<CD \) ()
t--f, :1)
~)' ~
'J,I
1 '
()
I'I,) \ j dJ
II, I';
I t II
t} • r \ll
I" I'"it t-J
r) i t ( o~
,,,
l~' ,( ,
j.
t i, ~ j
>~ I J ( ); 1 U' t f J ~: pi\. I I !I: I
• ) ~ ~ l
(I '& ~ ell t)<
\11 t t \.l·tj \ t 'o.J'}, ('i. t'
(lJ I j (I (I
til I
; ,
) '- ii' i
I" I" ,I ,.(', (lJ t j' : ~
;jJ (lJ (1)
~ 1. ~"' I I, t
C.o I ~', ,
I
t'·'t ' I {j
t-j Jo::YI' (lJ
,t 1 'Ij I'IlJ ,ll P,D •j I j
(I p, ,-"\'II 'II
lJ\), ttl
'J() r'1"I) \I)~J t j
ct~u ;;1
lJ\), (I (j
l J Ul ~ j
O'dI~ I'UJ d
IIIp. I't- J. \.)
(/1 ( 0 d,II pl rJ :)' ,-J,0 UJ () CD , IGi I J :<m f: Ij IfJUl ,: VI tD U)
~ j t oj (11
(t () ~: t- I)
I' ~j I ' ()I ' Vl c1 • J
V,
' ..,v
I.) ("J
I I
I I(j
l'jr..J ( I
,I l)
, ]
1".~j (/1
() dI J ~:
([) IJP.) '-... ~
Vi
III ".m ~J,1.
;"U[D• j
{.
'.' I
I'
(II " II[11 : J lj')..
~: t 11
(lJ }Il ~1.
: J II 'I j
I) ct (jJ :1"t t) I I L I I J
t ,.) ~.J :r~
(lJ lJ t'() II
W "(/i ,~
:), '
, .~,
\) ;' .J
I)' ,I t j
dj I J (~ (J I
;J .l Ii
I j Ul dj '. ~
U-; I j (l.0-'~ ~ I- )
i III :)
flo "1.1
1'-
Cj t~"
t-!J ~j
[·l.ll1
I, ,
I] d:i: ~).
t'J ([)
. I
: "(LJ 'tl,0i' ~ t j
U 10 "". :Ui ~ t"~ I j ~L'"
~J J i ... ~ (D I Jc~ VI ,Il t'J:J... lJ· it-[, (11 ,-'
:,. ,ll:-< ()t'J ~:,.!J (t
\ l en ctC) IJ':-r. ')1 <D~ ~ :' t
j t·L
'J
, ,
--1 I
II
I I I
, J I ~
t .' ~ I J(. ,1 :.-
()
H·, 0It,
,.~j
fl. ctIJ(ll
, j
\if
, j
'oJ
',' I rI ~ 1 ~ ~
ill
t' ) I J
,! II!
(tJ \LJ\[1 ',)
.1, " l I
I I ~. I j
I 'IF, \ II' ([)\.! ; 1; ~.L
Ij
\L t,.k·~ "":
1\.1 lJ!,D (I t)
" LJ I J
I" Cd~ j I j' IJ
o III:~ (t tJ'III ~J' '<'t..1 ~:
IJ~d(t ':~J ;-l :.<Ij () I)
U
"i.v (J
I J I I. ~~
.J 1)
() ,l' Cd0J ..; CD
'el Iji-J ,-< :.j(I ('. P[" I, 'j
I· , ~,' \1.
"
,',
{jl
,1
(,~
(J; • j
UCO()( j
IJ~l.
VJ
\..1 l I ~. Jt t~ p.J
I' ,D
([) c,tJ i- t J t ....
\ t ......tlJ de.., {/J t L
p. \\, '<)
I'
'11ill '(j
" 0t~· t-J
(I, 1'~j ()
(j Ittil c1 CIl .. ~~ t :J' t j
• ~ (TJ l:~ \.,)
f" • j Ir ,II.......~ CJ r J
I)
UJ
I'
I)
{,
:.1
lliI·" IJ~j P
lj\.),
" (lJ '1 tI()' I' I; , ,CD () j' CD It,
", CO (ll(11 (lJ • I
I)'ll>
{"
JI () -: II
I! i l
u ,],I:, , j ~).
(i) ~r' (lJcli
;.
Ujf: llJtj , •••
rJ 0'\ uin (ffj c1 ,t
'.-: t"J([) >..
([)Ij
to
Ie IP Ii,Po I~' I)~
': CJIi) (lJ (lJ
III '(j,' Ut--..J ~j ~ .. C) "f-)
f-J,'-" ()1 ' IJ \D II·
U (!J I'J ; ~ (DH) Ul 0J
di'(j;"P, ill(l) IJ,Jt'· Ie (IJ
o ..:; ([)
\.t l..',J
l" t J ' 0>(DC)
p.IJ(l) (1J I"i D UcI ~; ()If CD p)
1--) f-JIJ <D~D
dCD
'tl(lJ plI-J. "
00, t-,J.o p' (lJH) (I P
(lJ d, ' ({J OJ0) t:l
'el p. ill(lJ (0fJ III H)
() d [Il(lJ p' ,ttj U) [Il
" 1-';", t.., .
.Ipi, I
.; I_ I I''" t j UlP-
O ill'll () UIII P ()d ,I tJt" I j UU,,D l>lP UI "d d P'VJ (ll
1 '.
I·'
(lUI",
,tIJiD
~.1IJ· UJI" ,j 0
~ IJ 0 ,tt1 tj ''J ,I :).Po CD r. t tJ' <D
UJ ell CD~ (II p,
,;.tJ' ()Ij '--+'ell(D
P' c,II) ltvo. 0 (J
'J ill 'J Ul pJ~ Ii, 0 'd f'() 0 ,~ I'd 'j'd (-j 00,I~' CD pl I Jo C, 1-' ()tj ~ll () ,:
p. () 'llp. ~3 >: ,t,~iJ I' I J ": c.
<...: V1 t! 1 • ()UJ (lJ <D 1 • ()
t'j. rl. l .. : ~ ~
o Ij
t' I J~ \It },
tro ell I
,I 'i llit·J' pl (fj I')
U"O:. l1 J It(fO, (1) IL ,t I"
I J ~j (l) (l.
l) .'.\) IJ~~ ~.~ tJ ,L
't! I J 00. I" (()UI III f 1. I"
(t •. f ~.! \. t
I' :' I' I>,) (lJ (Ji ClJtJ VJ
I J tlJU 'Itj ()
IJ
~~) t - ,1
(I (11 ij ,1
~ : k',) (. t(1 l:" t}(1) (u
!j I(.!
d ~0 \) \ l'It tJ tj
pJ t ~ ,1
fJU, ' t; (JI) ,~) ~ "
v,() cl lj' '.H) ~D t ~
(" t (j ~
f-'- I' r:I~ U '{jI-J t:J - (0tj ',i(1)000t'l It, 0 IjUl 0 ct
It ~
tJ' fJ Vl(1) I j ~ll
1-" .....(1) tJ P.H)oo •
If,ll) VIo tJ' etd 0 tJ'
1 J ~1l
o d ct~-t.l l-..J
"..c: (t1-' IJ'o pl (1)tJ 1'1,
()O, ct 00(\) I-J
dfj(1)Ij pl~Il pl cttJ P. (1)UI ~:l 1'1'(i I-J·o Ul ;3'J UIO(t I" 1'1III 0 ct<t~plIJ· I-Jo et I-J.tJ 0 (t
~P. d-~ tr IJI J (1) tJI"tJ t.)' d
(JD, 0 : J'Ul (l)
d'tlt)· I'·m (t
ill1 '
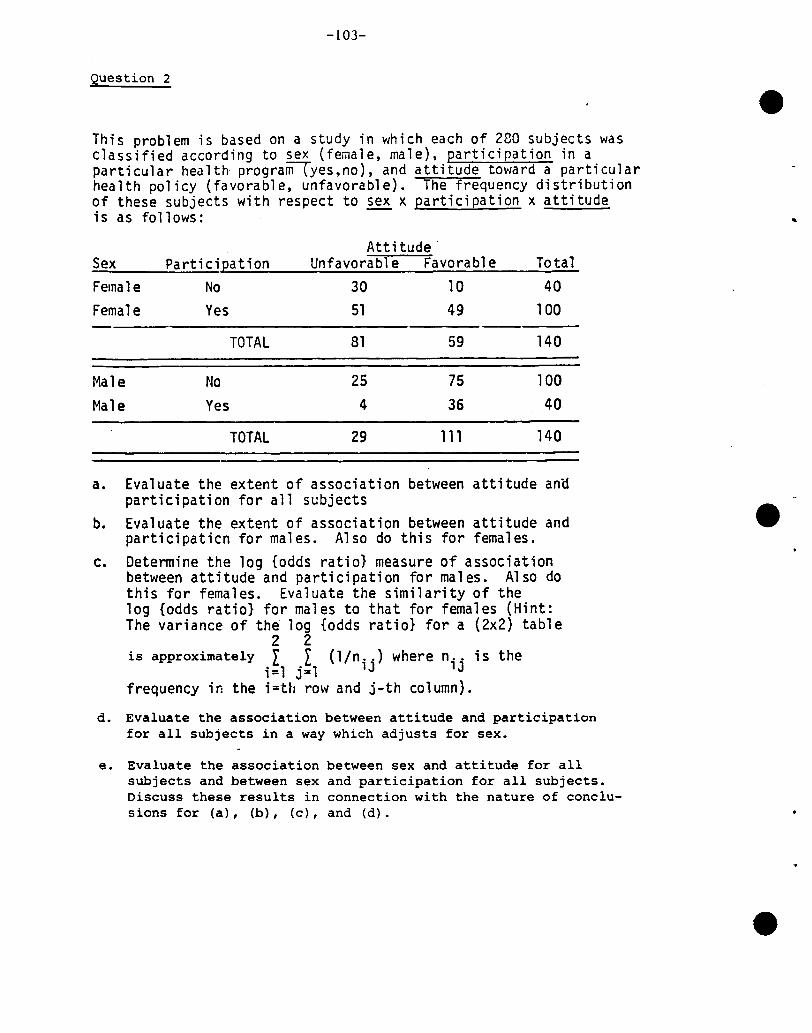
-103-
Question 2
This problem is based on a study in which each of 280 subjects wasclassified according to sex (female, male), participation in aparticular health prograii!Tyes,no) , and attitude to\'/ard a particularhealth policy (favorable, unfavorable). The frequency distributionof these subjects with respect to sex x participation x attitudeis as follows:
AttitudeSex Parti ci pat ion Unfavorable Favorab1 e TotalFemale No 30 10 40Female Yes 51 49 100
TOTAL 81 59 140
Male No 25 75 100
Male Yes 4 36 40
TOTAL 29 111 140
a. Evaluate the extent of association between attitude antlparticipation for all subjects
b. Evaluate the extent of association between attitude andparticipaticn for males. Also do this for females.
c. Determine the log {odds ratio} measure of associationbetween attitude and participation for males. Also dothis for females. Evaluate the similarity of thelog {odds ratio} for males to that for females (Hint:The variance of the log {odds ratio} for a (2x2) table
2 2is approximately r r (l/n .. ) where n.. ;s the
;=1 j=l lJ lJfrequency in the i=th row and j-th column).
d. Evaluate the association between attitude and participationfor all subjects in a way which adjusts for sex.
e. Evaluate the association between sex and attitude for allsubjects and between sex and participation for all subjects.Discuss these results in connection with the nature of conclusions for (a), (b), (c), and (d).
..
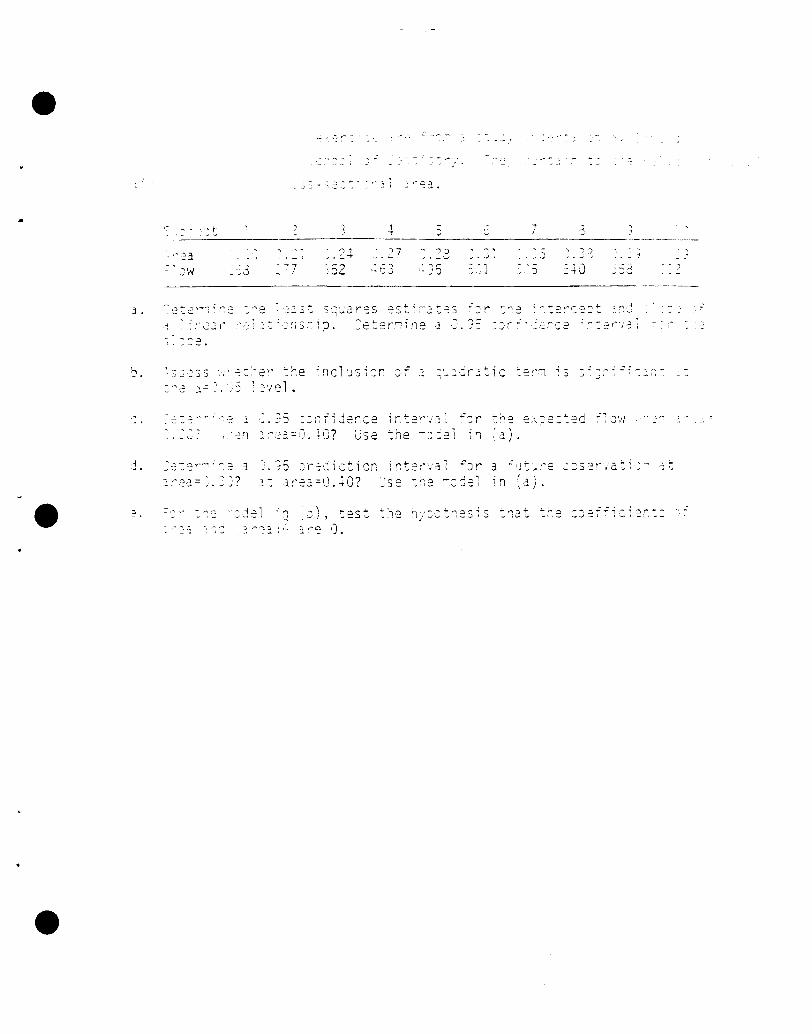
- ..... ..:
:1 •
~ ,,;:.:\
J'{o/
.. .; ;'2·,]' ('
~=e~
.1 J ,-
24., 7 )0 "
,~ 0 -v
~
52 63 . -- 1/ ~
~ ~ J 0',j
~~~3t squares 2sti~at~s
'Jnsr~lp. Ce~2r~ine A ~ •
!f
. J
-'
J. ~:t:2r ~he
.,J : :~\/e 1•inchsian
'..I.?5 ::n fi dencel.Jse
":"C: e<,:e::edfa) •
:2::;::-;~" 3.
2:''=3.= " :j?? 5 : r2 oj i ctic n i r. ~ 2 (' '/ a 1 ~ J r a
}: dr::3,=iJ.';'O?Jse ::i2 .-::d21 in ,r ~ \\'~ I .
,:,"::'::<
~ \\ '-'! , :·e5 t
'J.
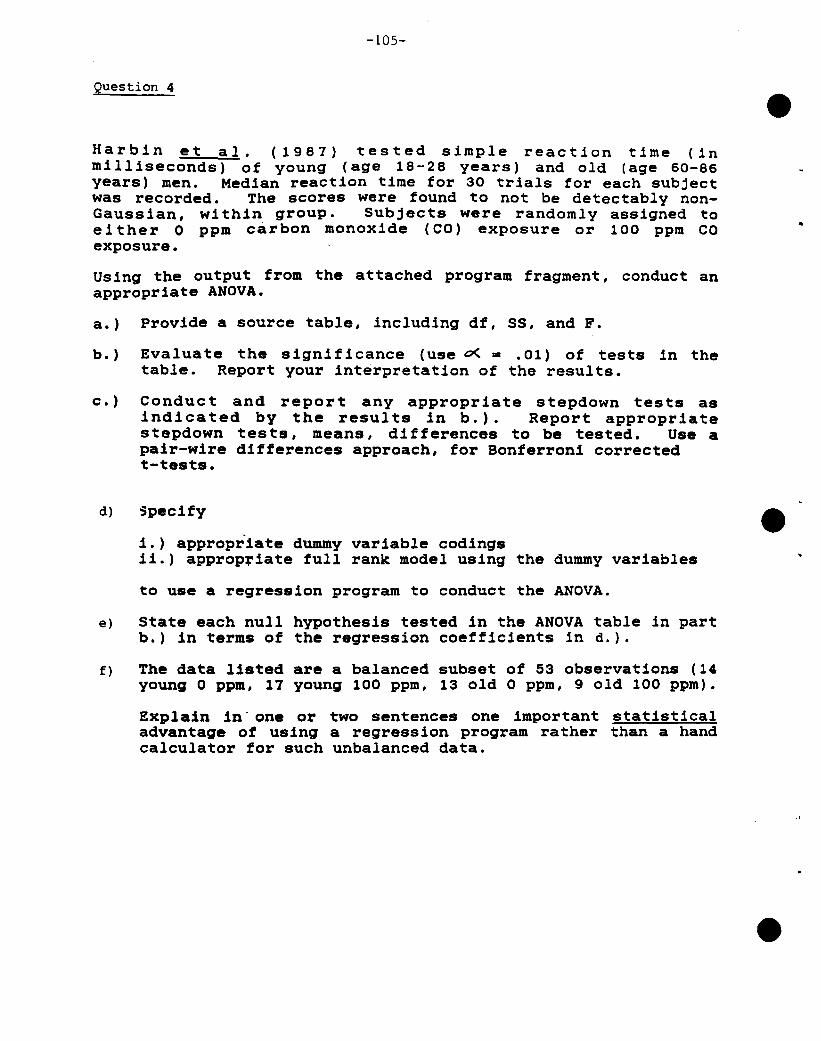
-105-
Question 4
Harbin et al. (1981) tested simple reaction time (inmilliseconds) of young (age 18-28 years) and old (age 60-86years) men. Median reaction time for 30 trials for each subjectwas recorded. The scores were found to not be detectably nonGaussian, within group. SUbjects were randomly assigned toeither 0 ppm carbon monoxide (CO) exposure or 100 ppm COexposure.
Using the output from the attached program fragment, conduct anappropriate ANOVA.
a.) Provide a source table, including df, 55, and F.
b.) Evaluate the significance (use 0< = .01) of tests in thetable. Report your interpretation of the results.
c.) Conduct and report any appropriate stepdown tests asindicated by the results in b.). Report appropriatestepdown tests, means, differences to be tested. Use apair-wire differences approach, for Bonferroni correctedt-tests.
d) '3pecify
i.) appropriate dummy variable codingsii.) approp~iate full rank model using the dummy variables
to use a regression program to conduct the ANOVA.
e) State each null hypothesis tested in the ANOVA table in partb.) in terms of the regression coefficients in d.).
f) The data listed are a balanced subset of 53 observations (14young 0 ppm, 17 young 100 ppm, 13 old 0 ppm, 9 old 100 ppm).
Explain in' one or two sentences one important statisticaladvantage of using a regression program rather than a handcalculator for such unbalanced data.
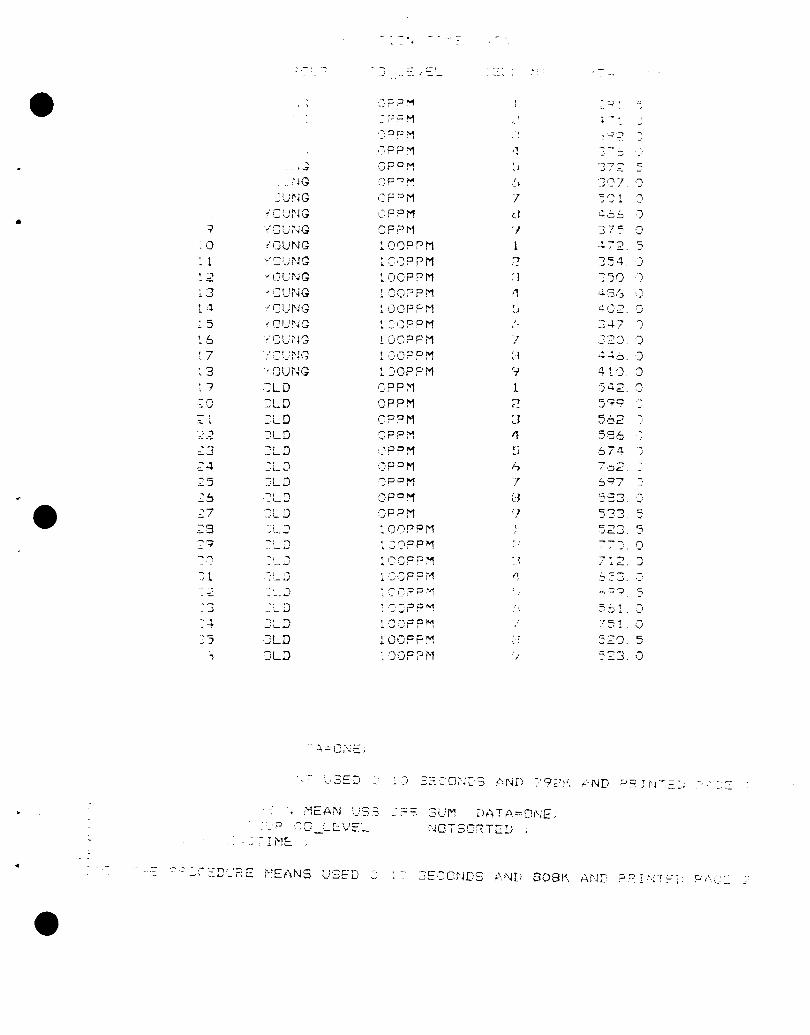
__ =- I
-. ,
402. G
250 ()J54 .'J
:) :;. 1 ~,
r51 :.J5;;:0. 55;:3 0
S'Jl 'J~6,~ :J
~7'" 0'-~ 72. 5
583. -.J
533 552:3 5
_ 0
:247 ).)
Jo
599"
562 ~
586674162S97
(Ll
,:
'7c '.
:.1II
A
'I
'J
tOPPM
()PPM
10tJPPMD~JP? !"1
l<JCPPM
C'PPMCPPMOPPM
OPPMOPPM'OOPPM:':;OPPM:OCPPMlJCP P:1
iJOPPMCPPM
:OOPPM• ::>JPPM:OOPPM':::::OPPM~OOPPi'-1
.~?PM
.:r:' ,:oM'J?PMi::CPPMOPPM
('PPMSPP:'1('-PPMS'PPM
JLD
iiJUNG
'SUNG/OUNG
,''-''
-"I .....,
- '--- ,-'
(C'...)!'JG
.'~G
"::UNG
JLD:::LD
~L.J
""":; ~~.' .~- ....'
(CUi'4G
iOUNG
CLDOLD
(CU~~G
;' :='!_:~Hi'~:]UNG
:JLD:::LD='LDJLD
-:t
o1
" .'.
. ...,1 .-/
•
• ;'1EAN ,_'5::3;~ CO_Le\.'EL
~ ,~ ';- Il'lE
SUM [l.\ T fi,=-ONE;:\~OTSORTE!J ;
• - ~~:CED0RE MEANS USED J
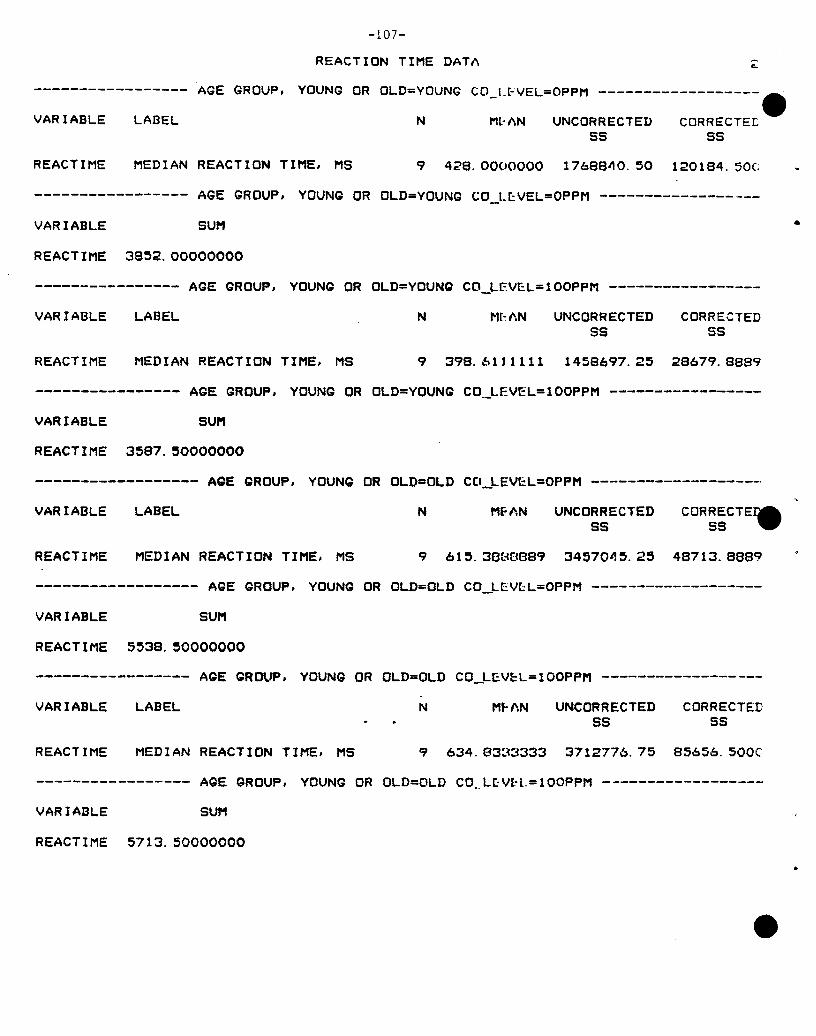
-107-
REACTION TIME DATA
VARIABLE LABEL
AGE GROUP, YOUNG OR OLD=YOUNG CO_L~VEL=OPPM ------------------~
N M~AN UNCORRECTED CORRECTEL55 55
REACTIME MEDIAN REACTION TIME, M5 9 428.0000000 1768840. SO 120184.50C
VARIABLE
AGE GROUP, YOUNG OR OLD=YOUNG CO~_~VEL=OPPM
5UM •
REACTIME 3852.00000000
---------------- AGE GROUP, YOUNG OR OLD=YOUNG CO_LEVEL=100PPM -----------------
VARIABLE
REACTIME
LABEL
MEDIAN REACTION TIME, M5
N M~AN UNCORRECTED CORRECTED55 55
9 398.61'1111 1458697.25 28679.8889
---------------- AGE GROUP, YOUNG OR OLD=YOUNG CO._LEVEL=100PPM -----------------
VARIABLE 5UM
REACTIME 3587. 50000000
------------------ AGE GROUP, YOUNG OR OLD=OLD CCI_LEVEL=OPPM -------------------.
VARIABLE
REACTIME
LABEL
MEDIAN REACTION TIME, M5
N MEAN UNCORRECTED55
615.3888889 3457045.25
CORRECTE~5S ,.,
48713.8889
------------------ AGE GROUP, YOUNG OR OLD=OLD CO_LEV~L=OPPM
VARIABLE SUM
REACTIME 5538. 50000000
----------------- AGE GROUP, YOUNG OR OLD=OLD CO_LEVcL=100PPM ------------------
VARIABLE
REACTIME
LABEL
MEDIAN REACTION TIME, M5
N M~~N UNCORRECTED CORRECTEDSS 5S
9 634.8333333 3712776.75 85656. soor
----------------- AGE GROUP, YOUNG OR OLD=OLD CO.. L~V~L=100PPM
VARIABLE SUM
REACTIME 5713. 50000000
•
•
-~ . - ..:.- ,,,,
-. /-. '-~ .::: - -.:':l y-- ~ .- .- -- - , :,ot
::0 t:
o - c:-,-, .=: ~ -; nl y ',. _.a t
3.11 you !<now ::.;::::::
,... ,
is asked
, ... ,
.:. .(- <. - - -
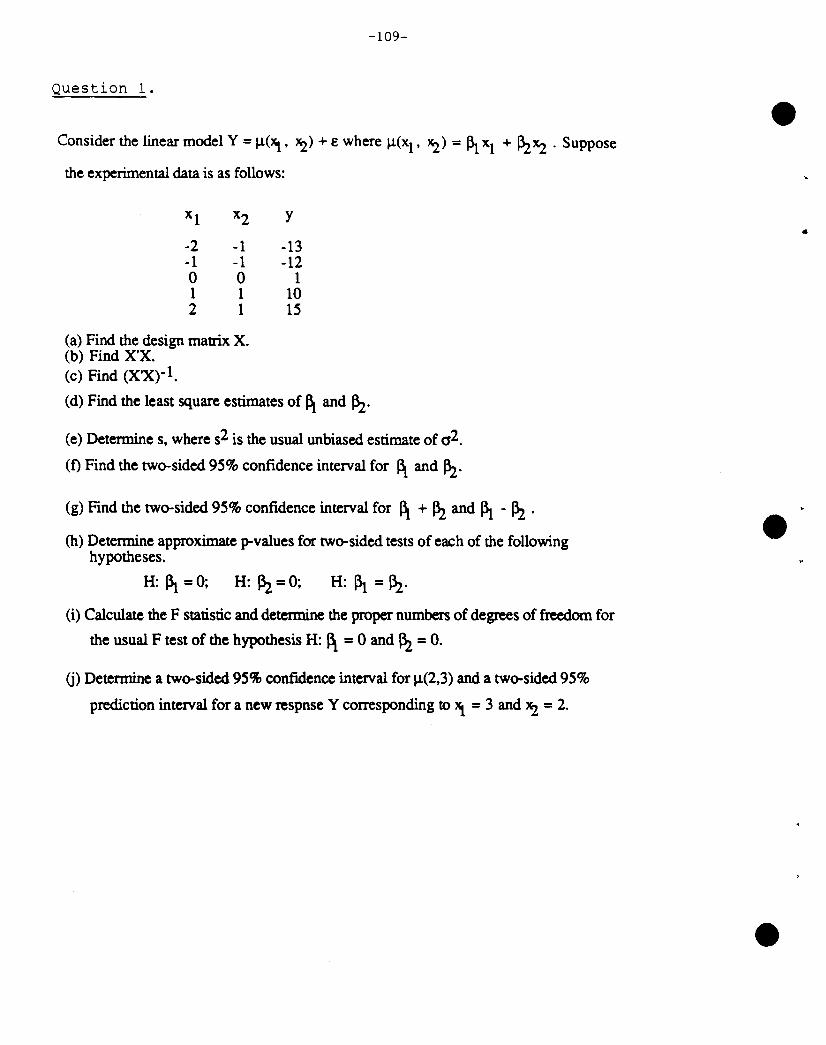
-109-
Question 1.
Consider the linear model Y =~(", '2) + £ where ~(xI' '2) =l3t xl + ~~ . Suppose
the experimental data is as follows:
Xl x2 Y
-2 -1 -13-1 -1 -120 0 11 1 102 1 15
(a) Find the design matrix X.(b) Find X'X.(c) Find (X'Xt l .
(d) Find the least square estimates of 1\ and ~.
(e) Determine s, where s2 is the usual unbiased estimate of 0 2.
(f) Find the two-sided 95% confidence interval for 1\ and ~.
(g) Find the two-sided 95% confidence interval for l\ + ~ and 11 -~ .(h) Determine approximate p-values for two-sided tests of each of the following
hypotheses.
H: 11 = 0; H: ~ =0; H: 11 =~.
(i) Calculate the F statistic and detennine the proper numbers of degrees of freedom for
the usual F test of the hypothesis H: 1\ =0 and ~ =O.
0) Determine a two-sided 95% confidence interval for ~(2,3) and a two-sided 95%
prediction interval for a new respnse Y corresponding to" =3 and '2 =2.
•
-, ..... __ 4
;-' '-..:. L _ -"- __ ..... _
a. n·:'
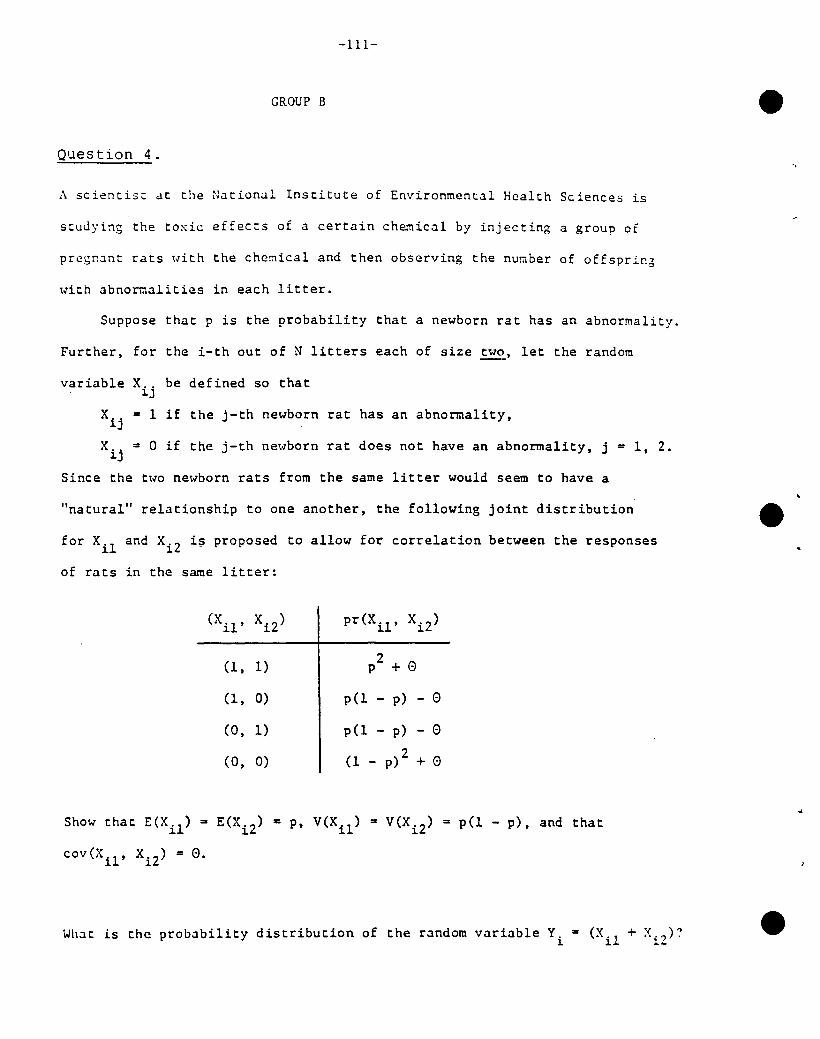
-111-
GROUP B
Question 4.
A scientist dt the National Institute of Environmental Health Sciences is
studying the toxic effects of a certain chemical by injecting a group of
prcgn~nt rats ~Jith the che~ical and then observing the nu~ber of offspring
with abnormalities in each litter.
Suppose that p is the probability that a newborn rat has an abnormality.
Further, for the i-th out of N litters each of size ~, let the random
variable X.. be defined so that1.)
X.. = 1 if the j-th newborn rat has an abnormality.1.)
X.. = a if the j-th newborn rat does not have an abnormality. j = 1. 2.1.)
Since the t,.o newborn rats from the same litter would seem to have a
"natural" relationship to one another. the following joint distribution
for XiI and Xi2 i~ proposed to allow for correlation between the responses
of rats in the same litter:
(Xu' XiZ
) pr (XU' XiZ )
(1. 1)Z
0p +
(I, 0) pel - p) - 0
(a, 1) pel - p) - 0
(0. 0) Z 0(1 - p) +
Show that E(Xil) ~ E(XiZ ) • P. V(Xil) = V(XiZ ) = pel - p), and that
cov(Xil • XiZ ) = 0.
Wh.:lt is the probability distribution of the r.:lndom variable Y. = (X'l + X.?),?1. 1. 1_
"
..

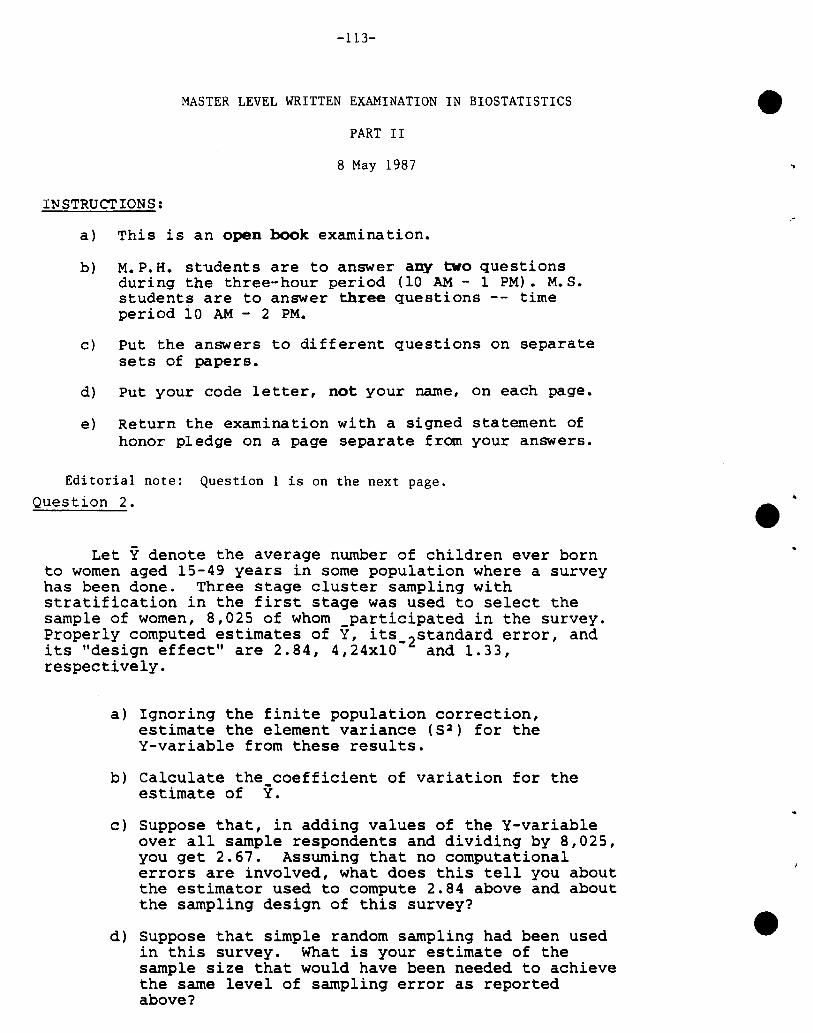
-113-
MASTER LEVEL WRITTEN EXAMINATION IN BIOSTATISTICS
PART II
8 May 1987
INSTRUCTIONS:
a) This is an open book examination.
b) M.P.H. students are to answer any two questionsduring the three-hour period (10 AM - 1 PM). M.S.students are to answer three questions -- timeperiod 10 AM - 2 PM.
c) Put the answers to different questions on separatesets of papers.
d) Put your code letter, not your name, on each page.
e) Return the examination with a signed statement ofhonor pledge on a page separate from your answers.
Editorial note: Question 1 is on the next page.
Question 2.
Let Ydenote the average number of children ever bornto women aged 15-49 years in some population where a surveyhas been done. Three stage cluster sampling withstratification in the first stage was used to select thesample of women, 8,025 of whom participated in the survey.Properly computed estimates of Y, its_ 2standard error, andits "design effect" are 2.84, 4,24xlO and 1.33,respectively.
a) Ignoring the finite population correction,estimate the element variance (S~) for theY-variable from these results.
b) Calculate the coefficient of variation for theestimate of Y.
c) Suppose that, in adding values of the Y-variableover all sample respondents and dividing by 8,025,you get 2.67. Assuming that no computationalerrors are involved, what does this tell you aboutthe estimator used to compute 2.84 above and aboutthe sampling design of this survey?
d) Suppose that simple random sampling had been usedin this survey. What is your estimate of thesample size that would have been needed to achievethe same level of sampling error as reportedabove?
..
-= -= I
,,'
j);...,
;,
;- ...... -. ~
_l".ll.
..lI1G ,'(
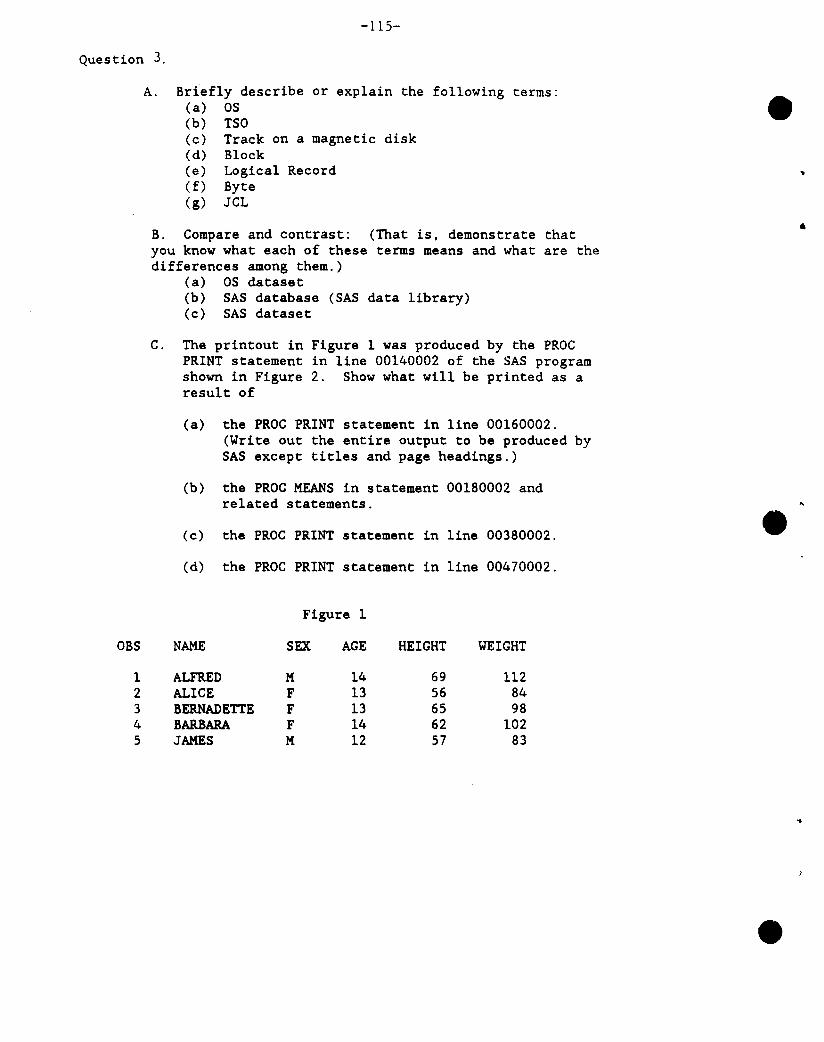
-115-
Question 3.
A. Briefly describe or explain the following terms:(a) OS(b) TSO(c) Track on a magnetic disk(d) Block(e) Logical Record(f) Byte(g) JCL
B. Compare and contrast: (That is, demonstrate thatyou know what each of these terms means and what are thedifferences among them.)
(a) OS dataset(b) SAS database (SAS data library)(c) SAS dataset
C. The printout in Figure 1 was produced by the PROCPRINT statement in line 00140002 of the SAS programshown in Figure 2. Show what will be printed as aresult of
(a) the PROC PRINT statement in line 00160002.(Write out the entire output to be produced bySAS except titles and page headings.)
(b) the PROC MEANS in statement 00180002 andrelated statements. ..
(c) the PROC PRINT statement in line 00380002. e(d) the PROC PRINT statement in line 00470002.
Figure 1
OBS NAME SEX AGE HEIGHT WEIGHT
1 ALFRED M 14 69 1122 ALICE F 13 56 843 BERNADETTE F 13 65 984 BARBARA F 14 62 1025 JAMES M 12 57 83
..

, ,
•
•
,
,;,--..,
: '
~: \]-6 (oj
,j:'~'~ ~-.~' 'I~"""- -~- .::..
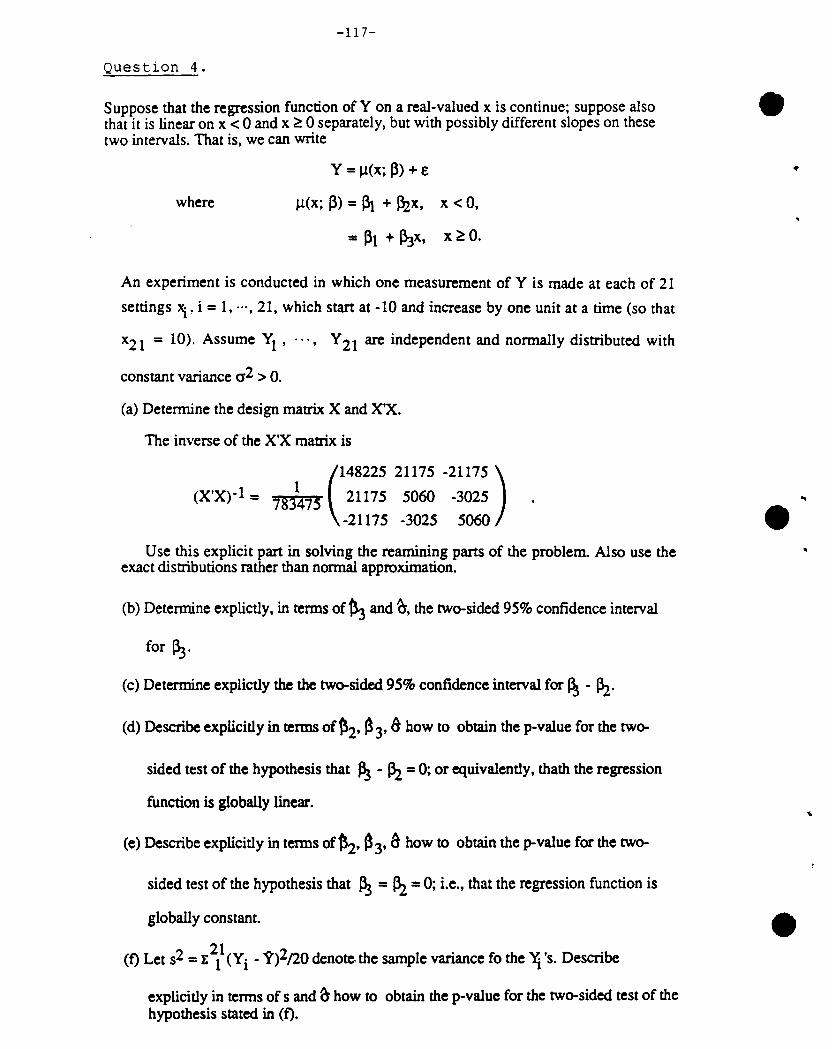
-117-
Question 4.
Suppose that the regression function of Y on a real-valued x is continue; suppose alsothat it is linear on x < 0 and x ~ 0 separately, but with possibly different slopes on thesetwo intervals. That is, we can write
where
Y =J,L(x; ~) + £
J,L(x; ~) = 131 + ~x, x < 0,
= ~1 + ~x, x ~ o...
An experiment is conducted in which one measurement of Y is made at each of 21
settings ~, i = 1, .'., 21, which stan at -10 and increase by one unit at a time (so that
x21 = 10). Assume Y1 ' "., Y21 are independent and normally distributed with
constant variance 0 2 > o.(a) Determine the design matrix X and X'X.
The inverse of the X'X matrix is
(
148225 21175 -21175 )
(X'X)-1 = 783~75 21175 5060 -3025
-21175 -3025 5060
Use this explicit pan in solving the reamining pans of the problem. Also use theexact distributions rather than normal approximation.
(b) Determine explictly, in terms of~ and &-, the two-sided 95% confidence interval
for l3.3.
(c) Determine explictly the the two-sided 95% confidence interval for 11- ~.
(d) Describe explicitly in terms of~2' ~3' ahow to obtain the p-value for the two-
sided test of the hypothesis that l3.3 - ~ = 0; or equivalently, thath the regression
function is globally linear.
(e) Describe explicitly in terms of~, ~3' &how to obtain the p-value for the two-
sided test of the hypothesis that I3j =l3l, =0; Le., that the regression function is
globally constant.
(t) Let s2 = t 2l (Yi - ?)2/20 denote the sample variance fo the 'i's. Describe
explicitly in terms of s and c1 how to obtain the p-value for the two-sided test of thehypothesis stated in (t).


![Master`s Degree Program: KINESIOLOGY Education ... [2sem].pdf · Master`s Degree Program: KINESIOLOGY Education-qualification degree: MASTER Proffessional qualification: Kinesiologist](https://img.pdfslide.net/doc/110x75/5abf482e7f8b9a5d718e133a/masters-degree-program-kinesiology-education-2sempdfmasters-degree-program.jpg)