Embed Size (px)
Citation preview

www.melbourneinstitute.com
IP and SMEs: Australian Evidence
Dr. Paul H. JensenUniversity of Melbourne
WIPO Expert Panel on IP and SMEs,Geneva, 17-18th September 2009

2
I will cover two recent research projects which have analysed the use and effectiveness of IP by Australian firms
1. Factors Affecting the Use of Intellectual Property Protection by SMEs in Australia (Jensen & Webster 2006)
2. IP, Technological Conditions and New Firm Survival (Jensen et al. 2008; 2010)
OVERVIEW

3
OBJECTIVES
The Australian Govt. commissioned IPRIA:“…to determine whether the level of intellectual property protection by Australian SMEs is at sub-optimal levels, and the reasons for this...”
There are 3 key components to the study:– How does the existing level of IPR protection by
SMEs compare with that of large companies?– What is the optimal level of IPR use? If there are
differences in IPR use, does this imply market failure?
– What inhibits SMEs’ use of the IPR system?
4
METHODOLOGY
The methodology involved:– Consultation with key stakeholders – Analysis of IP Australia database on patents,
trade marks & registered designs to establish level of activity
– Surveying 100 SME “Innovation Partners” and “Innovation Advisors” to identify factors inhibiting SMEs’ use of IPRs
– Conduct 10 case studies of SMEs I will focus on: IPR activity levels, survey
results Other results are available in Jensen &
Webster (2006)
5
AUSTRALIAN SMEs
SME definition: <200 employees & <$200m assets
According to ABS data, there are 608,000 SMEs and 3,000 large firms in Australia
SMEs are important to the Australian economy:– Employ 69% of total workforce– Account for 49% of value-added– Own approximately 15% of business assets
SMEs: mainly in manufacturing, retail trade and business services
6
DATA ISSUES
“Matching” IP administrative data to IBISWorld and AOD data on firm characteristics, since there is no universal firm-level dataset in Australia
Excluding individuals from the analysis, the matching rates across the various IPRs were:– Patents (60% of Aust. company applications)– Trade marks (50% of Aust. company applications)– Designs (40% of Aust. company applications)
No evidence of any systematic bias. That is, matched sample is representative.
7
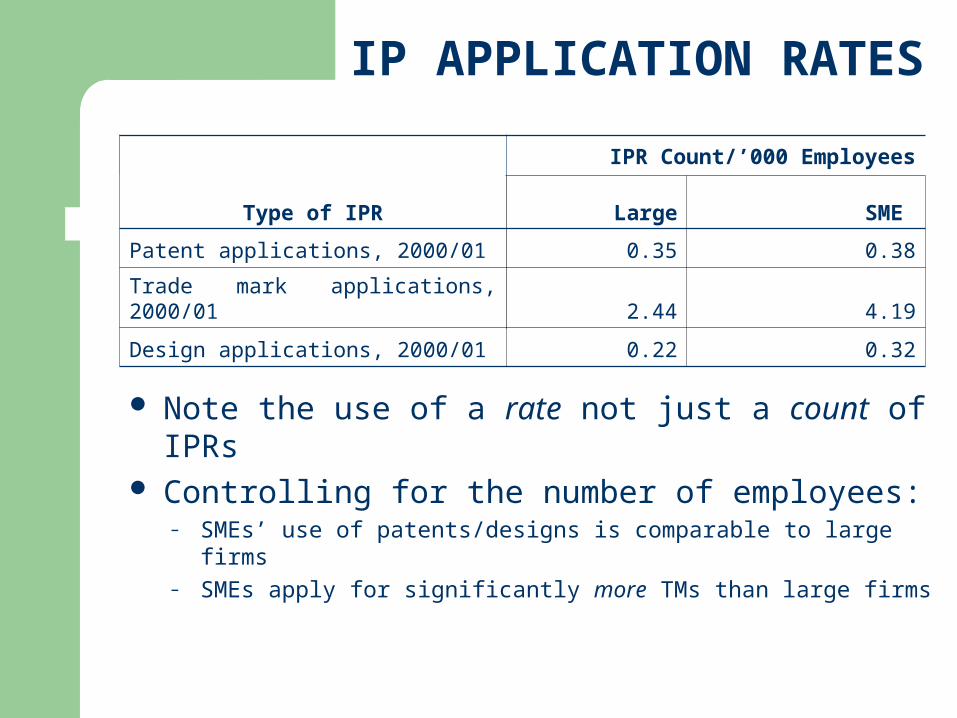
IP APPLICATION RATES
IPR Count/’000 Employees
Type of IPR Large SME
Patent applications, 2000/01 0.35 0.38
Trade mark applications, 2000/01 2.44 4.19
Design applications, 2000/01 0.22 0.32
Note the use of a rate not just a count of IPRs Controlling for the number of employees:
– SMEs’ use of patents/designs is comparable to large firms– SMEs apply for significantly more TMs than large firms
8
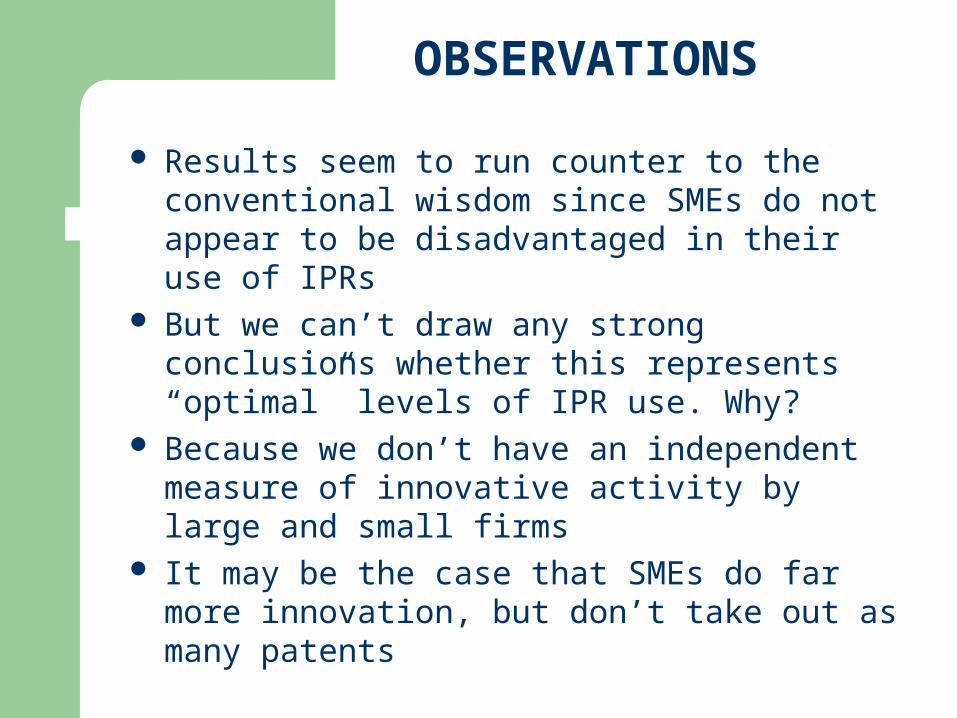
OBSERVATIONS
Results seem to run counter to the conventional wisdom since SMEs do not appear to be disadvantaged in their use of IPRs
But we can’t draw any strong conclusions whether this represents “optimal” levels of IPR use. Why?
Because we don’t have an independent measure of innovative activity by large and small firms
It may be the case that SMEs do far more innovation, but don’t take out as many patents
9
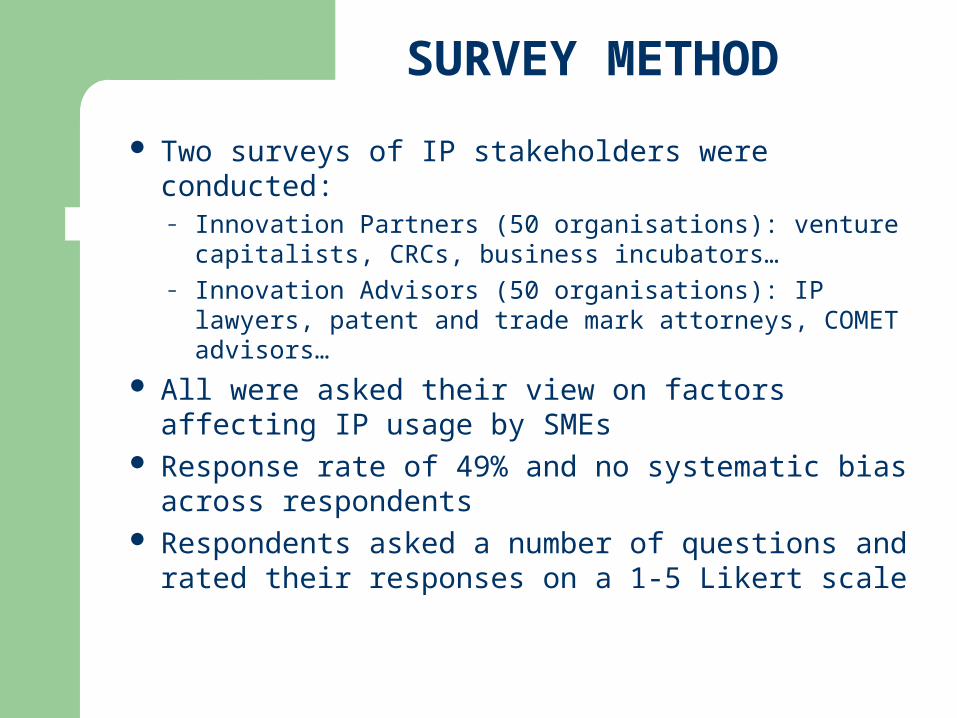
SURVEY METHOD
Two surveys of IP stakeholders were conducted:– Innovation Partners (50 organisations): venture
capitalists, CRCs, business incubators…– Innovation Advisors (50 organisations): IP lawyers,
patent and trade mark attorneys, COMET advisors…
All were asked their view on factors affecting IP usage by SMEs
Response rate of 49% and no systematic bias across respondents
Respondents asked a number of questions and rated their responses on a 1-5 Likert scale
10
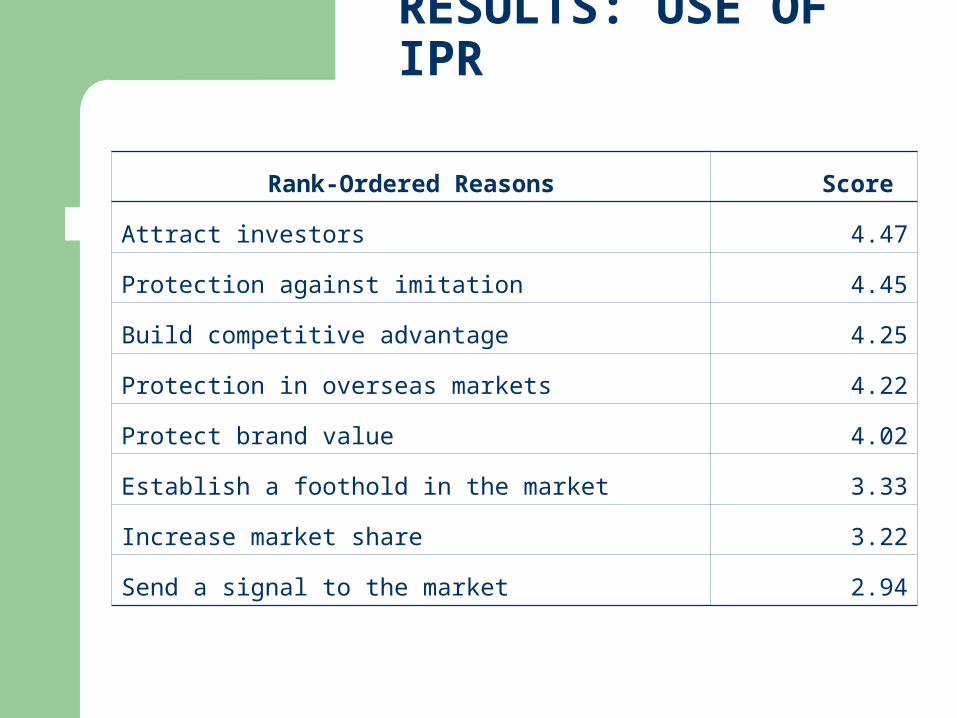
RESULTS: USE OF IPR
Rank-Ordered Reasons Score
Attract investors 4.47
Protection against imitation 4.45
Build competitive advantage 4.25
Protection in overseas markets 4.22
Protect brand value 4.02
Establish a foothold in the market 3.33
Increase market share 3.22
Send a signal to the market 2.94
11
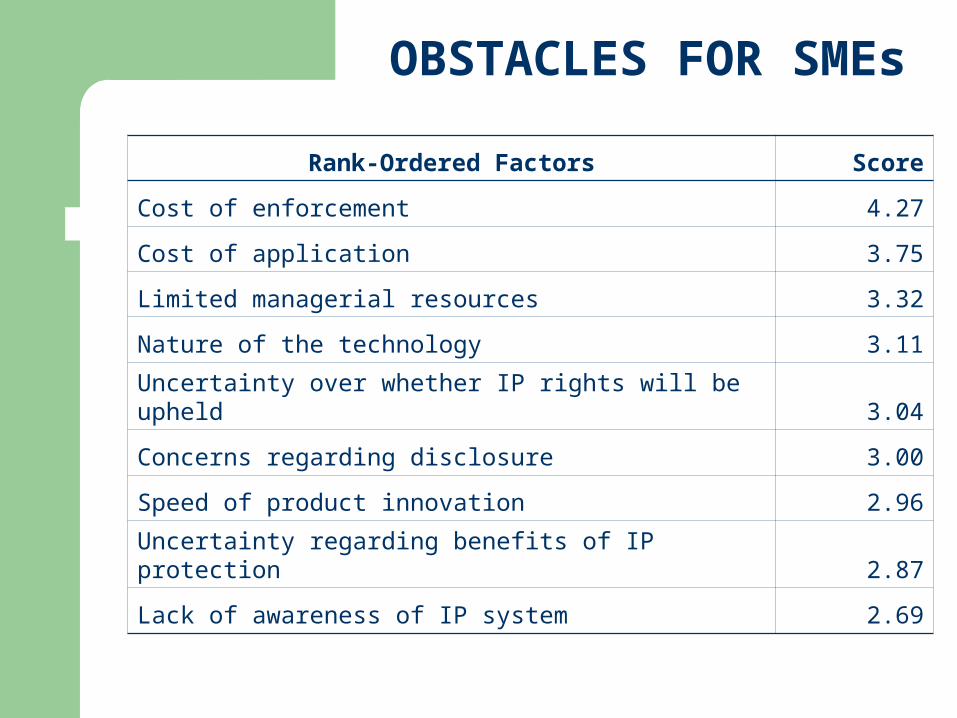
OBSTACLES FOR SMEs
Rank-Ordered Factors Score
Cost of enforcement 4.27
Cost of application 3.75
Limited managerial resources 3.32
Nature of the technology 3.11
Uncertainty over whether IP rights will be upheld 3.04
Concerns regarding disclosure 3.00
Speed of product innovation 2.96
Uncertainty regarding benefits of IP protection 2.87
Lack of awareness of IP system 2.69
12
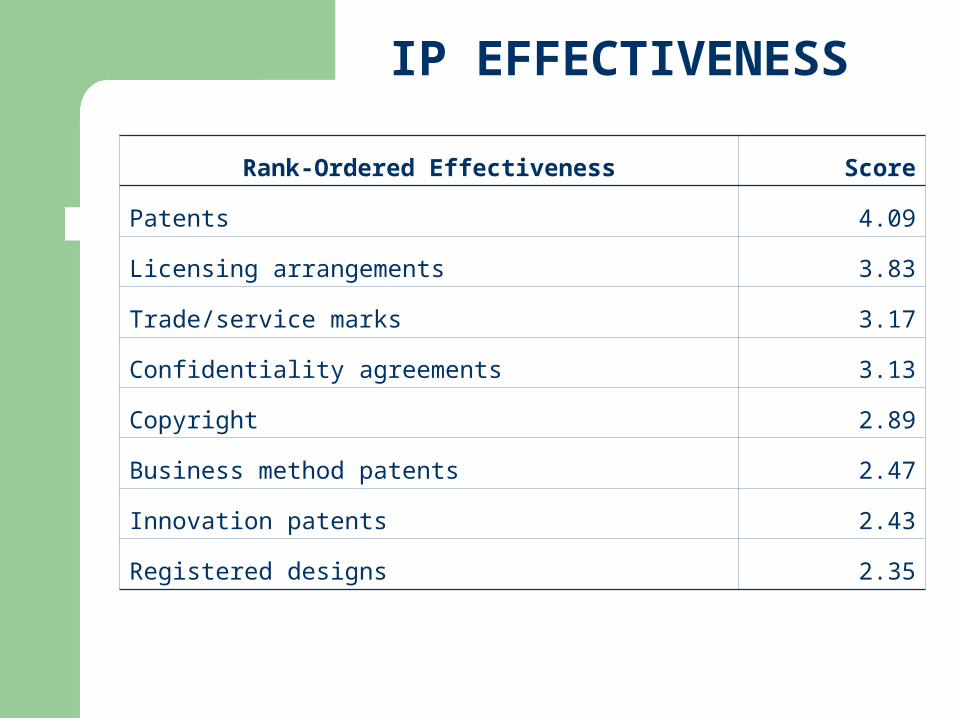
IP EFFECTIVENESS
Rank-Ordered Effectiveness Score
Patents 4.09
Licensing arrangements 3.83
Trade/service marks 3.17
Confidentiality agreements 3.13
Copyright 2.89
Business method patents 2.47
Innovation patents 2.43
Registered designs 2.35
13
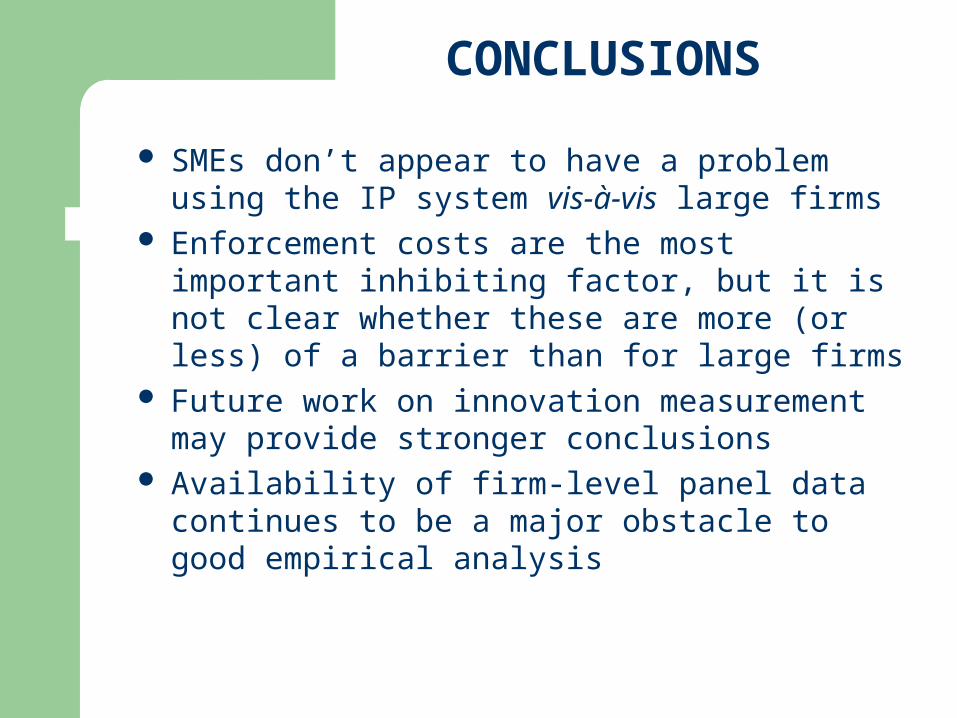
CONCLUSIONS
SMEs don’t appear to have a problem using the IP system vis-à-vis large firms
Enforcement costs are the most important inhibiting factor, but it is not clear whether these are more (or less) of a barrier than for large firms
Future work on innovation measurement may provide stronger conclusions
Availability of firm-level panel data continues to be a major obstacle to good empirical analysis

14
IP, Technological Conditions and New Firm Survival

15
MOTIVATION International empirical evidence suggests that:
– Firm survival has important effects on market structure, productivity growth and technological change
– Innovation, firm size (size-at-birth) and organisational structure are important determinants of firm survival
Problems with existing survival studies:– Selection bias: only “successful” innovation considered– Omitted variable bias: technological conditions matter– Fail to capture industry dynamics
In this paper, we:– Map patterns of entry/exit using data 1997-2003– Link these data with other firm-, industry- and macro-
level data in order to analyse the determinants of survival
16
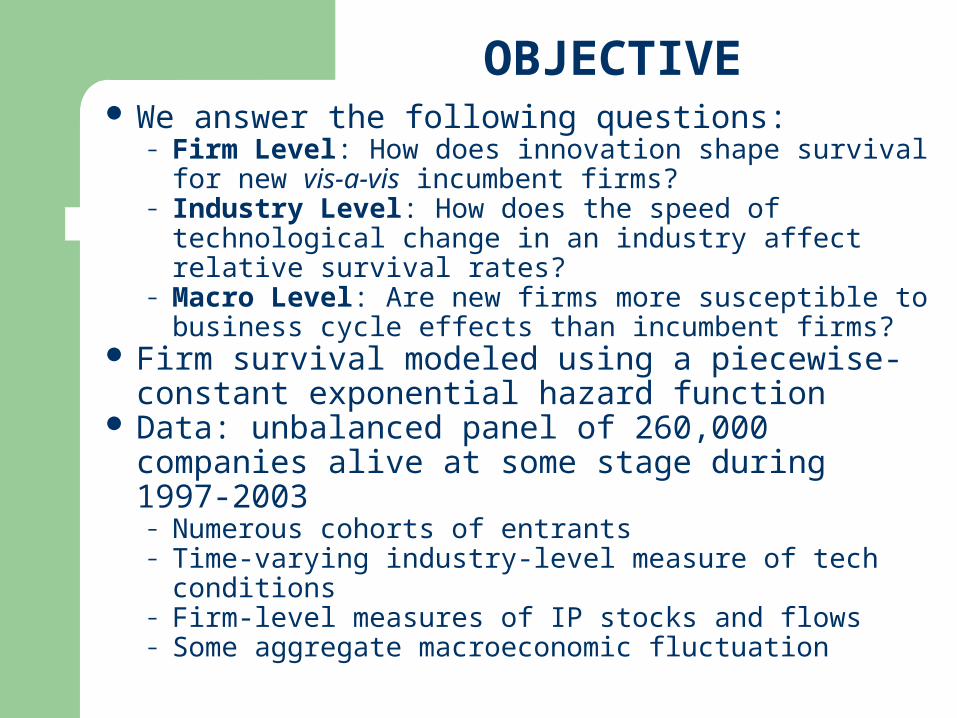
OBJECTIVE We answer the following questions:
– Firm Level: How does innovation shape survival for new vis-a-vis incumbent firms?
– Industry Level: How does the speed of technological change in an industry affect relative survival rates?
– Macro Level: Are new firms more susceptible to business cycle effects than incumbent firms?
Firm survival modeled using a piecewise-constant exponential hazard function
Data: unbalanced panel of 260,000 companies alive at some stage during 1997-2003– Numerous cohorts of entrants– Time-varying industry-level measure of tech
conditions– Firm-level measures of IP stocks and flows– Some aggregate macroeconomic fluctuation
17
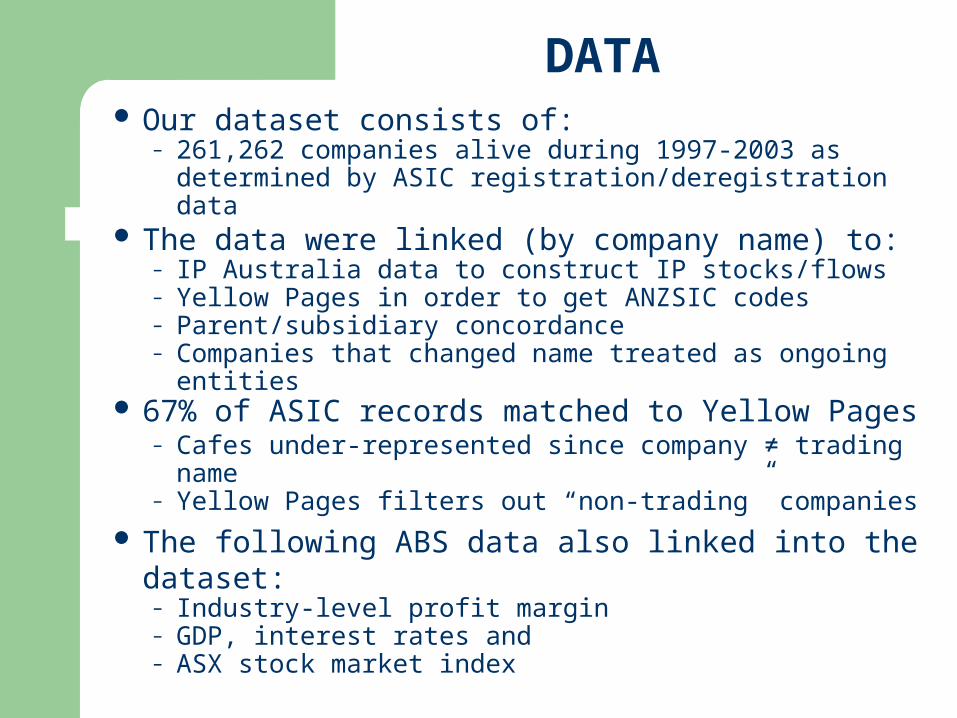
DATA Our dataset consists of:
– 261,262 companies alive during 1997-2003 as determined by ASIC registration/deregistration data
The data were linked (by company name) to: – IP Australia data to construct IP stocks/flows– Yellow Pages in order to get ANZSIC codes– Parent/subsidiary concordance – Companies that changed name treated as ongoing
entities 67% of ASIC records matched to Yellow Pages
– Cafes under-represented since company ≠ trading name
– Yellow Pages filters out “non-trading” companies The following ABS data also linked into the
dataset:– Industry-level profit margin– GDP, interest rates and – ASX stock market index
18
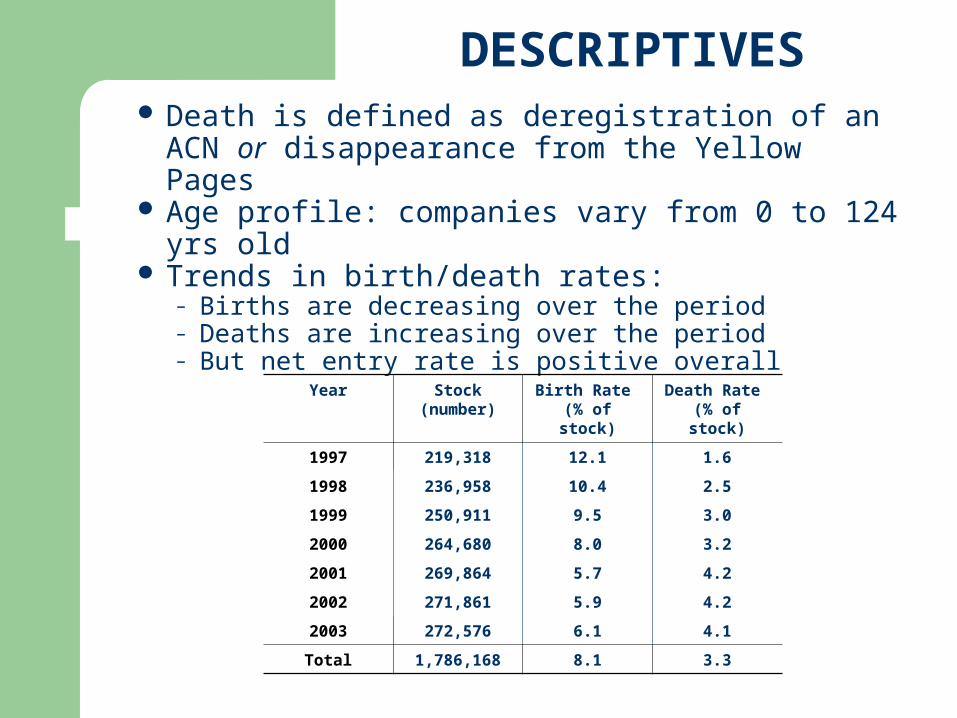
DESCRIPTIVES Death is defined as deregistration of an ACN
or disappearance from the Yellow Pages Age profile: companies vary from 0 to 124 yrs
old Trends in birth/death rates:
– Births are decreasing over the period– Deaths are increasing over the period– But net entry rate is positive overall
Year Stock(number)
Birth Rate (% of stock)
Death Rate (% of stock)
1997 219,318 12.1 1.6
1998 236,958 10.4 2.5
1999 250,911 9.5 3.0
2000 264,680 8.0 3.2
2001 269,864 5.7 4.2
2002 271,861 5.9 4.2
2003 272,576 6.1 4.1
Total 1,786,168 8.1 3.3
19
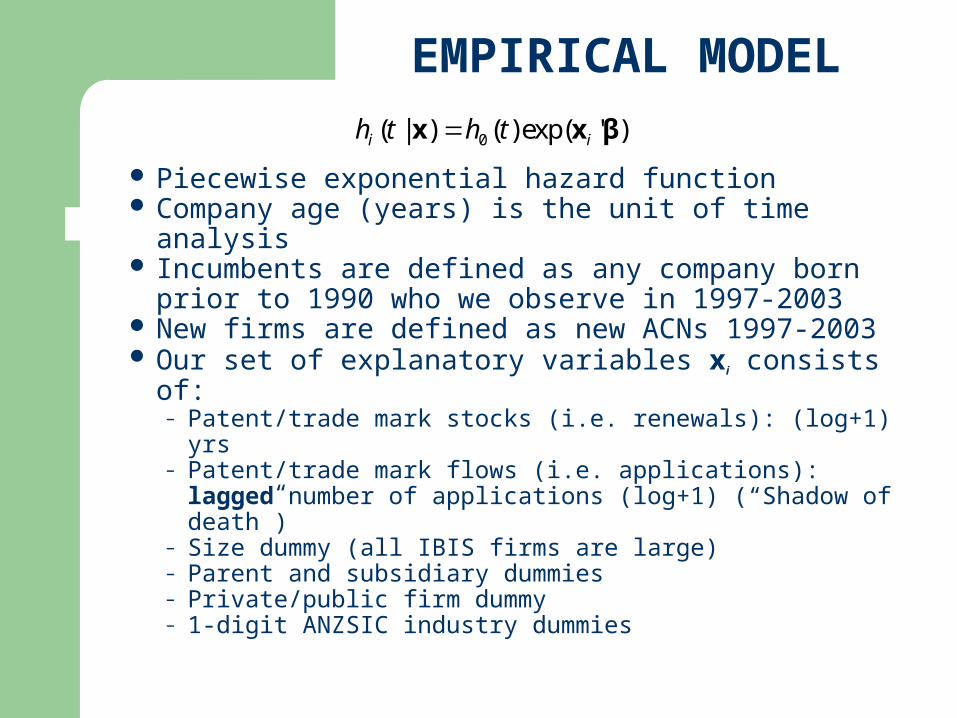
EMPIRICAL MODEL
Piecewise exponential hazard function Company age (years) is the unit of time
analysis Incumbents are defined as any company born
prior to 1990 who we observe in 1997-2003 New firms are defined as new ACNs 1997-2003 Our set of explanatory variables xi consists of:
– Patent/trade mark stocks (i.e. renewals): (log+1) yrs– Patent/trade mark flows (i.e. applications): lagged
number of applications (log+1) (“Shadow of death”)– Size dummy (all IBIS firms are large)– Parent and subsidiary dummies– Private/public firm dummy– 1-digit ANZSIC industry dummies
)'exp()()|( 0 βxx ii thth
20
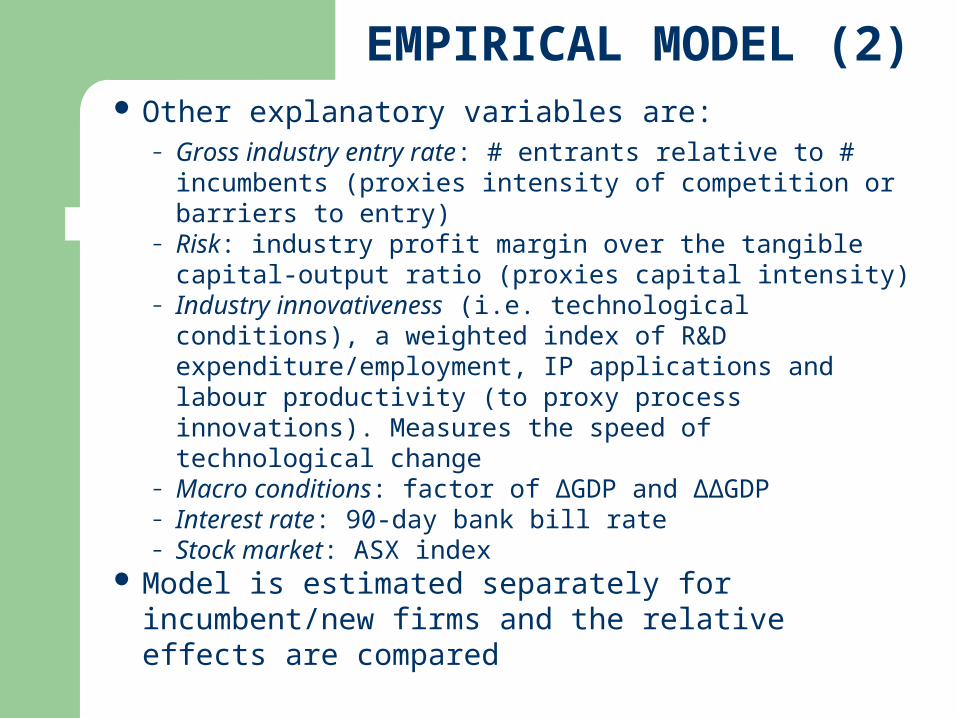
Other explanatory variables are:– Gross industry entry rate: # entrants relative to #
incumbents (proxies intensity of competition or barriers to entry)
– Risk: industry profit margin over the tangible capital-output ratio (proxies capital intensity)
– Industry innovativeness (i.e. technological conditions), a weighted index of R&D expenditure/employment, IP applications and labour productivity (to proxy process innovations). Measures the speed of technological change
– Macro conditions: factor of ∆GDP and ∆∆GDP– Interest rate: 90-day bank bill rate– Stock market: ASX index
Model is estimated separately for incumbent/new firms and the relative effects are compared
EMPIRICAL MODEL (2)
21
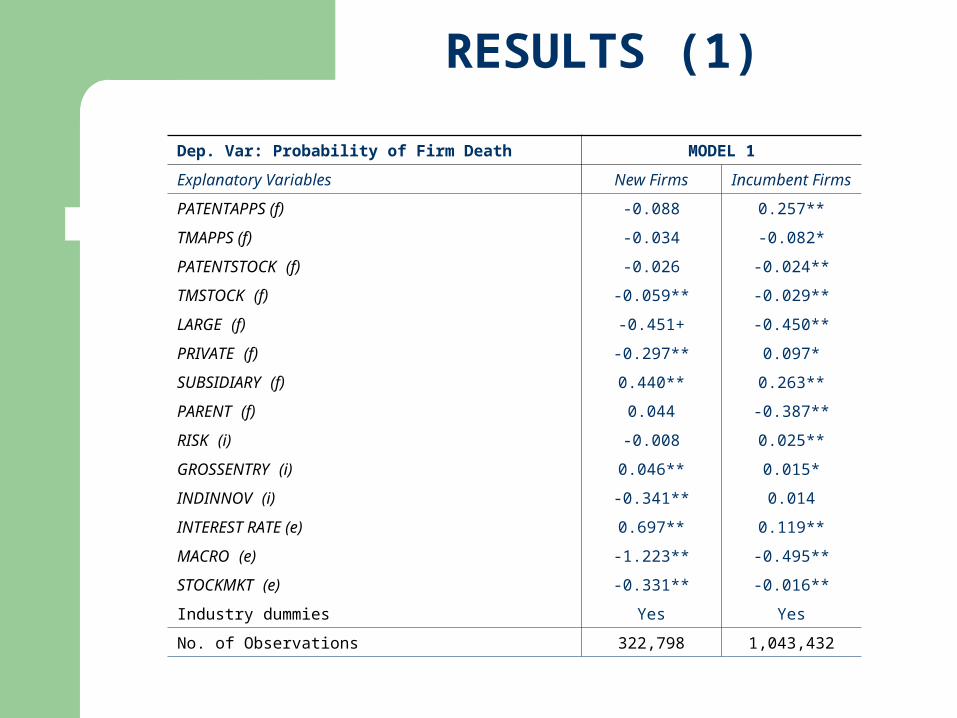
RESULTS (1)
Dep. Var: Probability of Firm Death MODEL 1
Explanatory Variables New Firms Incumbent Firms
PATENTAPPS (f) -0.088 0.257**
TMAPPS (f) -0.034 -0.082*
PATENTSTOCK (f) -0.026 -0.024**
TMSTOCK (f) -0.059** -0.029**
LARGE (f) -0.451+ -0.450**
PRIVATE (f) -0.297** 0.097*
SUBSIDIARY (f) 0.440** 0.263**
PARENT (f) 0.044 -0.387**
RISK (i) -0.008 0.025**
GROSSENTRY (i) 0.046** 0.015*
INDINNOV (i) -0.341** 0.014
INTEREST RATE (e) 0.697** 0.119**
MACRO (e) -1.223** -0.495**
STOCKMKT (e) -0.331** -0.016**
Industry dummies Yes Yes
No. of Observations 322,798 1,043,432
22
RESULTS (2) Firm size (crudely measured) matters: larger
firms are much more likely to survive Entry begets exit, especially for new firms.
Maybe low barriers to entry, but high barriers to survival
BUT: in industries characterised by rapid technological change, new firms are more likely to survive
All macro factors are significant, but the relative effect is greater for new firms:– Increase in interest rates increase hazard rate, but
new firms are more vulnerable– Increase in GDP aids all firms, but provides a
greater boost for new firms– New firms are more susceptible to stock market falls

23
CONCLUSIONS
No simple linear relationship between innovation and performance
Results demonstrate the importance of separating innovation investments (IP flows) from innovation capital (IP stocks)
New firms play an important role in technological change: in fast-moving industries, new firms drive the “gale of creative destruction”
New firms are particularly sensitive to changes in macroeconomic conditions