Embed Size (px)
Citation preview
1
Yageo Corporation
November, 2017
2 2 2
This announcement is not, and is not intended to be, an offer of securities for sale
in the United States. Securities may not be offered or sold in the United States
a b s e n t r e g i s t r a t i o n o r a n e x e m p t i o n f r o m r e g i s t r a t i o n u n d e r
the U.S. Securities Act of 1933. Any public offering of securities to be
made in the United States must be made by means of a prospectus containing
detailed information about the issuer of the securities and its management
as well as financial statements. There is not, and is currently not intended
to be, any public offering of securities by Yageo Corporation in the United States.
Disclaimer
3 3 3
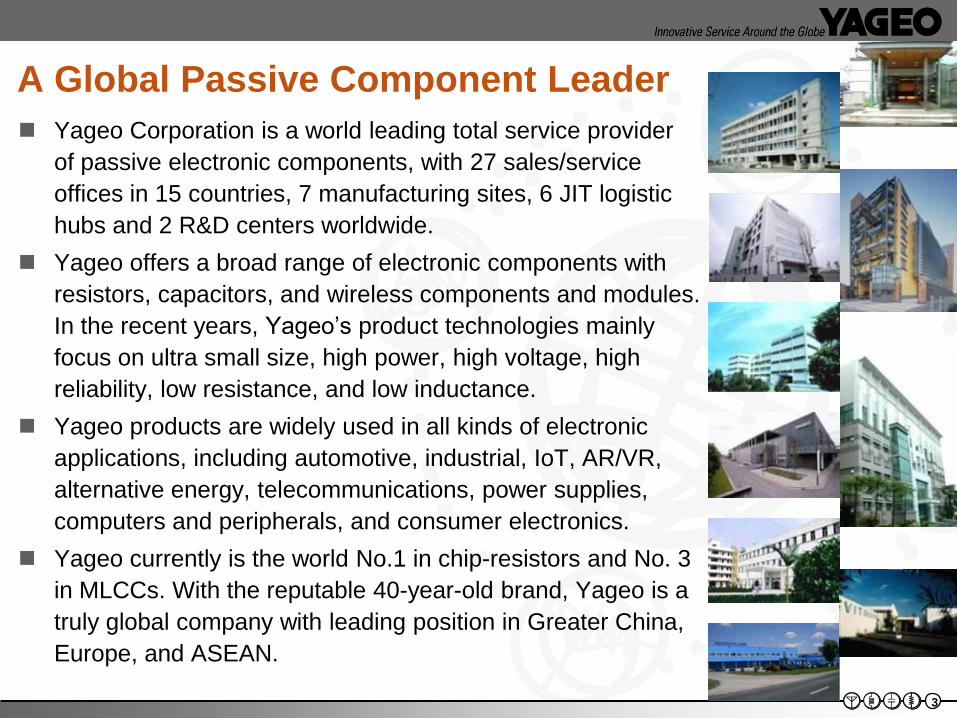
A Global Passive Component Leader
Yageo Corporation is a world leading total service provider
of passive electronic components, with 27 sales/service
offices in 15 countries, 7 manufacturing sites, 6 JIT logistic
hubs and 2 R&D centers worldwide.
Yageo offers a broad range of electronic components with
resistors, capacitors, and wireless components and modules.
In the recent years, Yageo’s product technologies mainly
focus on ultra small size, high power, high voltage, high
reliability, low resistance, and low inductance.
Yageo products are widely used in all kinds of electronic
applications, including automotive, industrial, IoT, AR/VR,
alternative energy, telecommunications, power supplies,
computers and peripherals, and consumer electronics.
Yageo currently is the world No.1 in chip-resistors and No. 3
in MLCCs. With the reputable 40-year-old brand, Yageo is a
truly global company with leading position in Greater China,
Europe, and ASEAN.
4 4 4
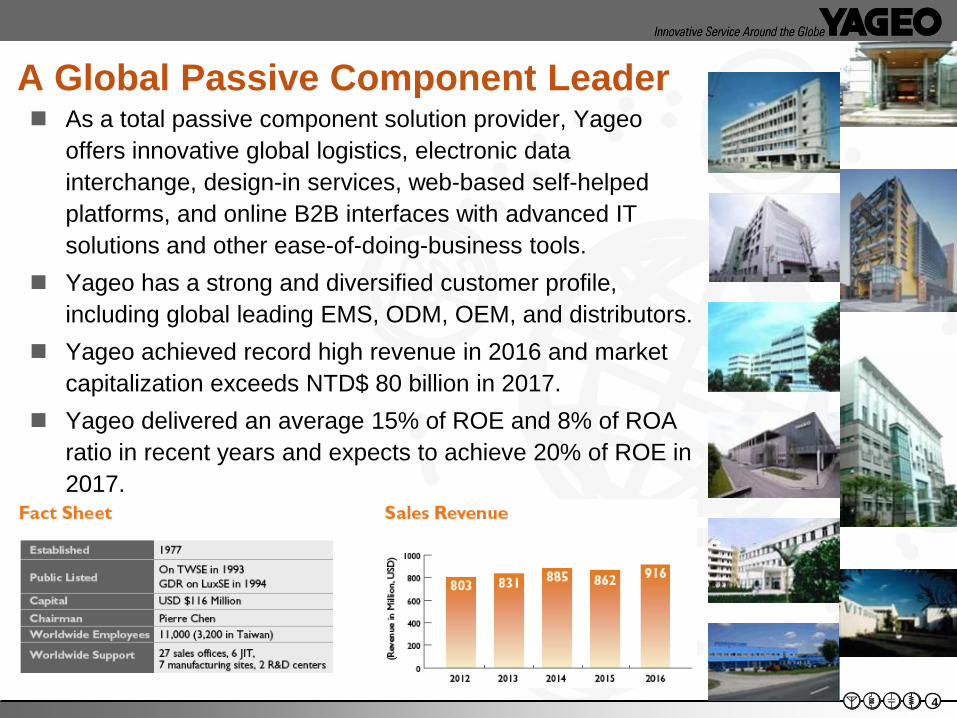
A Global Passive Component Leader As a total passive component solution provider, Yageo
offers innovative global logistics, electronic data
interchange, design-in services, web-based self-helped
platforms, and online B2B interfaces with advanced IT
solutions and other ease-of-doing-business tools.
Yageo has a strong and diversified customer profile,
including global leading EMS, ODM, OEM, and distributors.
Yageo achieved record high revenue in 2016 and market
capitalization exceeds NTD$ 80 billion in 2017.
Yageo delivered an average 15% of ROE and 8% of ROA
ratio in recent years and expects to achieve 20% of ROE in
2017.
5 5 5
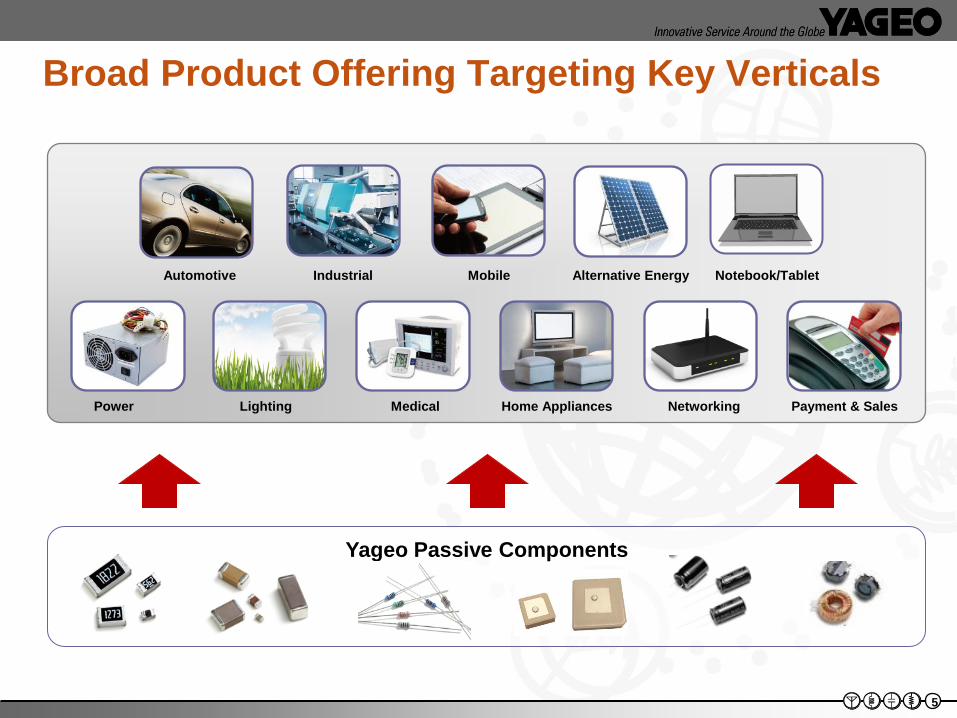
Yageo Passive Components
Automotive Industrial Mobile Alternative Energy Notebook/Tablet
Power Lighting Medical Home Appliances Networking Payment & Sales
Broad Product Offering Targeting Key Verticals
6 6 6
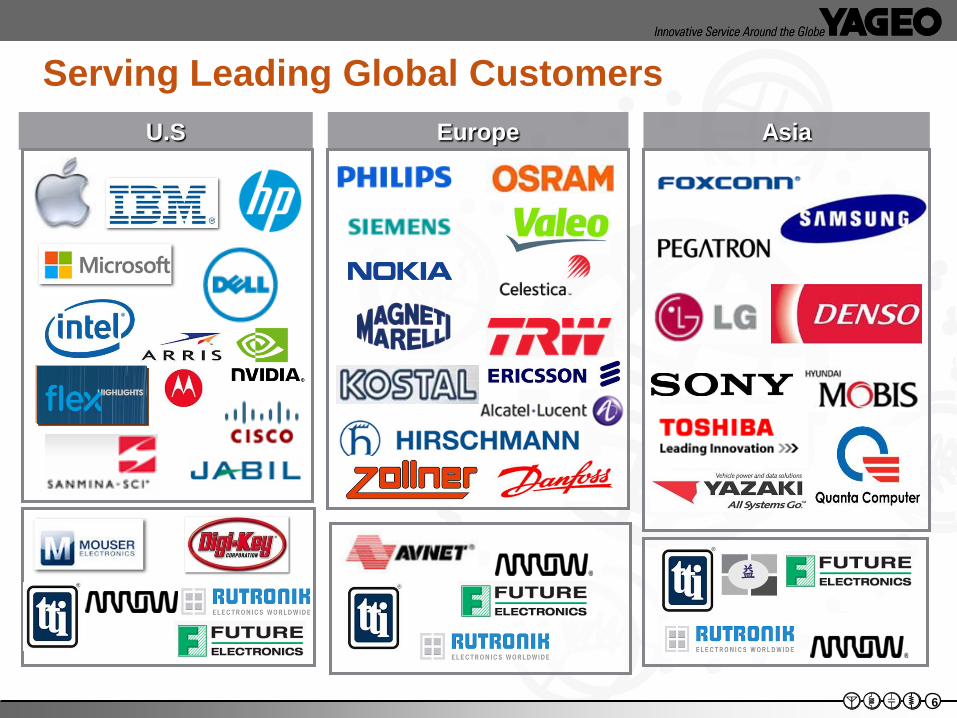
Serving Leading Global Customers
Europe Asia U.S
7 7 7
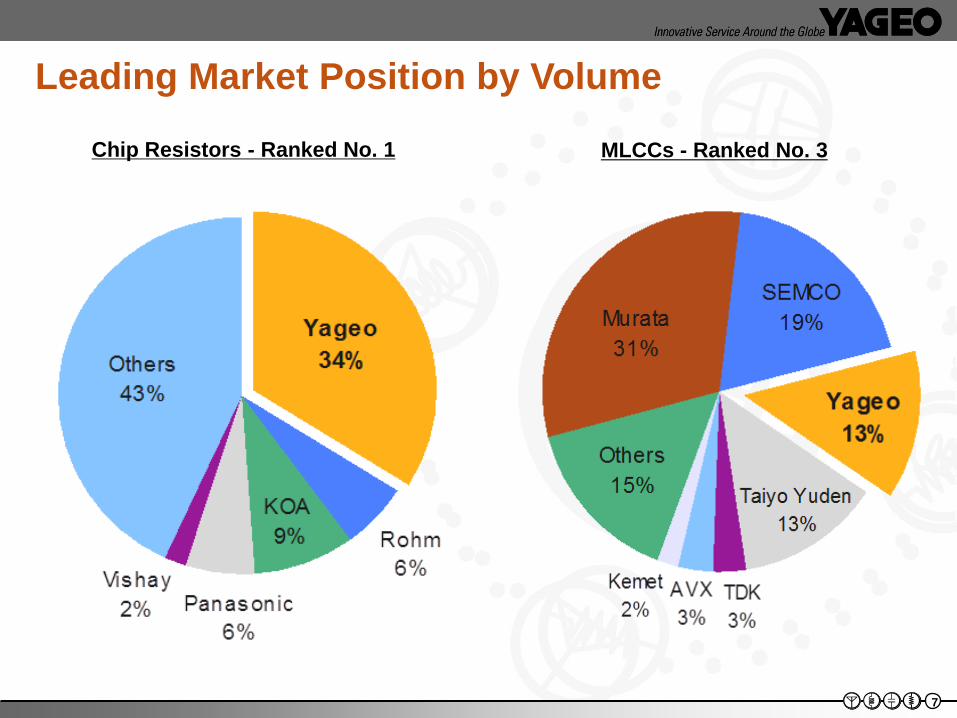
Leading Market Position by Volume
Chip Resistors - Ranked No. 1 MLCCs - Ranked No. 3
8 8 8
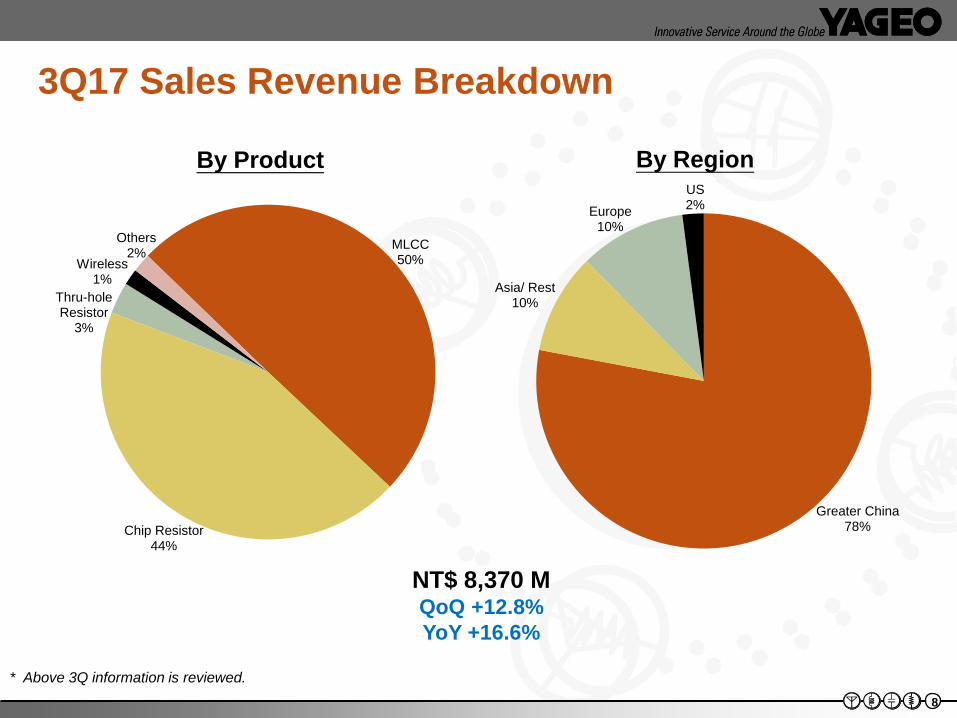
3Q17 Sales Revenue Breakdown
By Product
NT$ 8,370 M QoQ +12.8%
YoY +16.6%
By Region
* Above 3Q information is reviewed.
MLCC 50%
Chip Resistor 44%
Thru-hole Resistor
3%
Wireless 1%
Others 2%
Greater China 78%
Asia/ Rest 10%
Europe 10%
US 2%
9 9 9
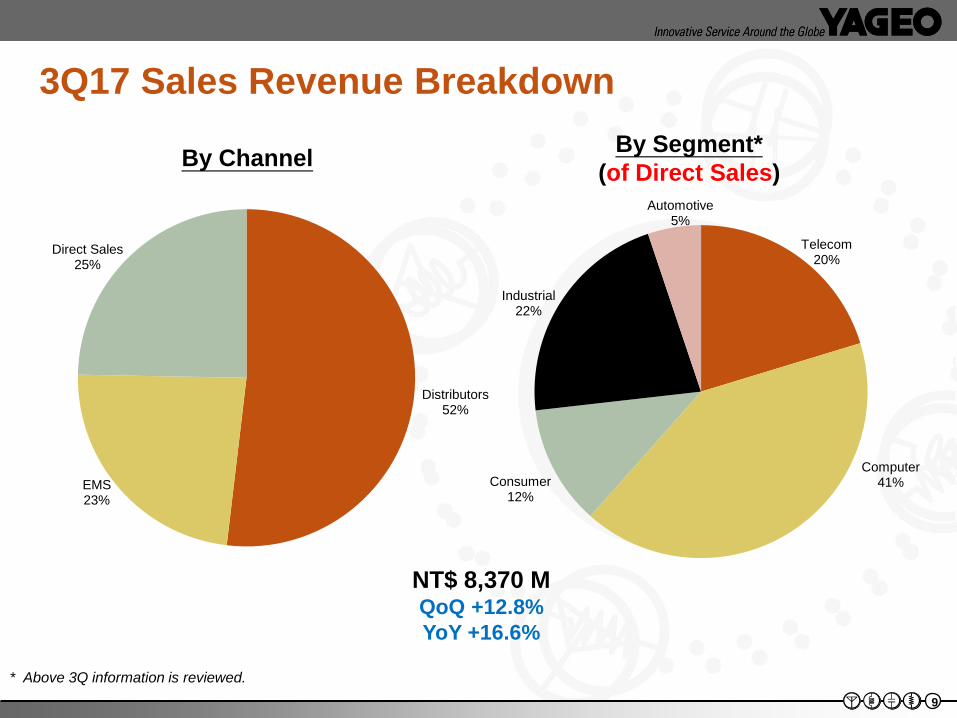
3Q17 Sales Revenue Breakdown
By Segment*
(of Direct Sales)
By Channel
* Above 3Q information is reviewed.
NT$ 8,370 M QoQ +12.8%
YoY +16.6%
Distributors 52%
EMS 23%
Direct Sales 25%
Telecom 20%
Computer 41% Consumer
12%
Industrial 22%
Automotive 5%
10 10 10
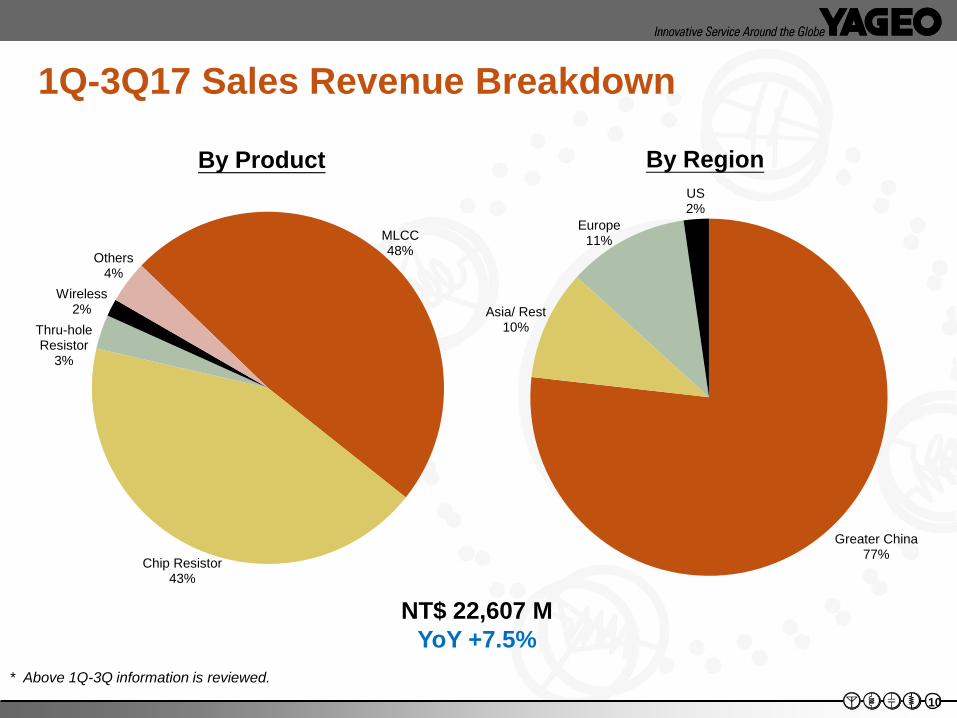
1Q-3Q17 Sales Revenue Breakdown
By Product By Region
* Above 1Q-3Q information is reviewed.
NT$ 22,607 M
YoY +7.5%
MLCC 48%
Chip Resistor 43%
Thru-hole Resistor
3%
Wireless 2%
Others 4%
Greater China 77%
Asia/ Rest 10%
Europe 11%
US 2%
11 11 11
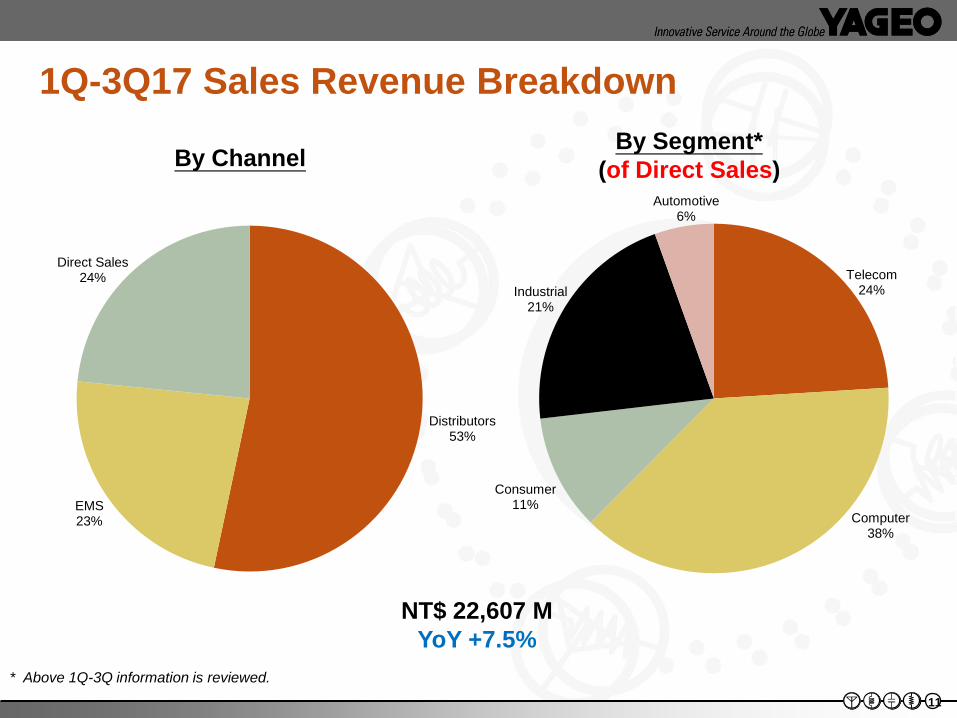
1Q-3Q17 Sales Revenue Breakdown
By Segment*
(of Direct Sales)
By Channel
* Above 1Q-3Q information is reviewed.
NT$ 22,607 M
YoY +7.5%
Distributors 53%
EMS 23%
Direct Sales 24% Telecom
24%
Computer 38%
Consumer 11%
Industrial 21%
Automotive 6%
12 12 12
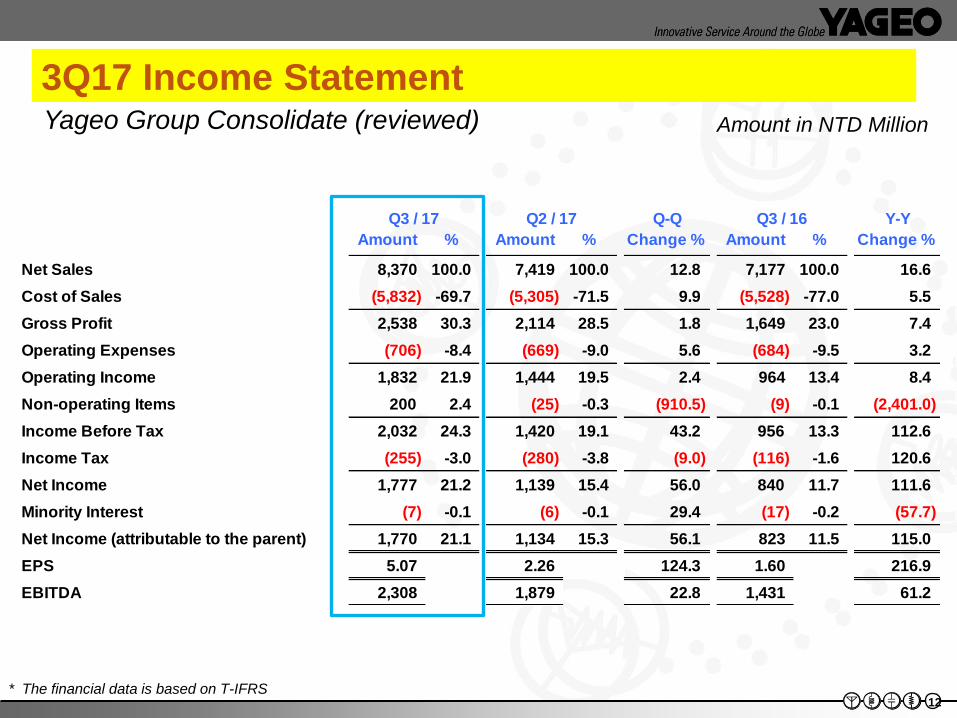
3Q17 Income Statement
Amount in NTD Million Yageo Group Consolidate (reviewed)
* The financial data is based on T-IFRS
Q-Q Y-Y
Amount % Amount % Change % Amount % Change %
Net Sales 8,370 100.0 7,419 100.0 12.8 7,177 100.0 16.6
Cost of Sales (5,832) -69.7 (5,305) -71.5 9.9 (5,528) -77.0 5.5
Gross Profit 2,538 30.3 2,114 28.5 1.8 1,649 23.0 7.4
Operating Expenses (706) -8.4 (669) -9.0 5.6 (684) -9.5 3.2
Operating Income 1,832 21.9 1,444 19.5 2.4 964 13.4 8.4
Non-operating Items 200 2.4 (25) -0.3 (910.5) (9) -0.1 (2,401.0)
Income Before Tax 2,032 24.3 1,420 19.1 43.2 956 13.3 112.6
Income Tax (255) -3.0 (280) -3.8 (9.0) (116) -1.6 120.6
Net Income 1,777 21.2 1,139 15.4 56.0 840 11.7 111.6
Minority Interest (7) -0.1 (6) -0.1 29.4 (17) -0.2 (57.7)
Net Income (attributable to the parent) 1,770 21.1 1,134 15.3 56.1 823 11.5 115.0
EPS 5.07 2.26 124.3 1.60 216.9
EBITDA 2,308 1,879 22.8 1,431 61.2
Q3 / 17 Q3 / 16Q2 / 17
13 13 13
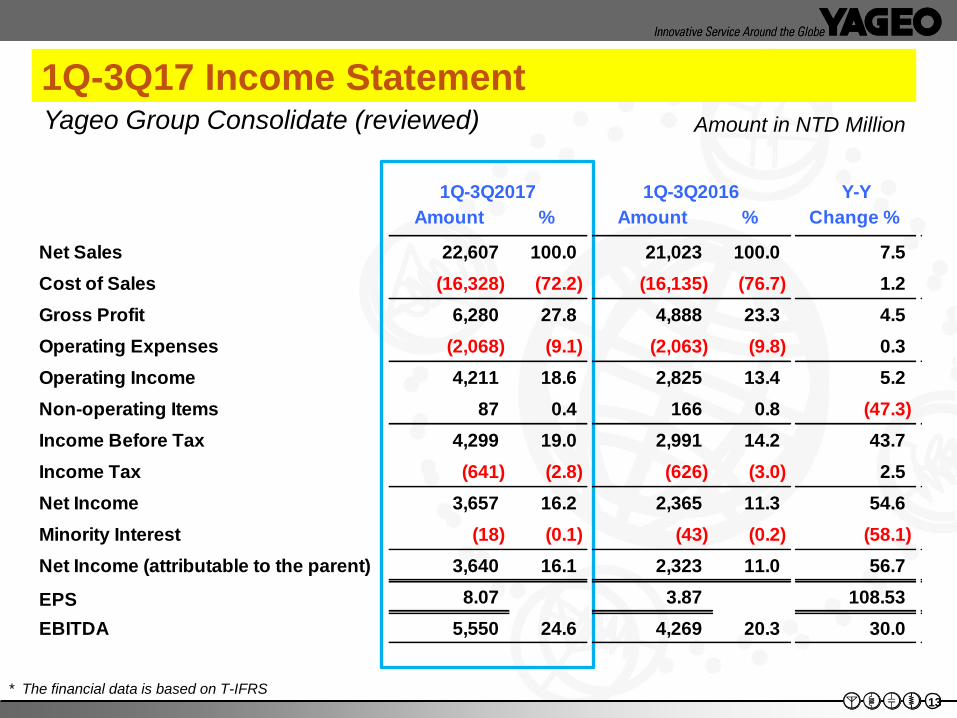
1Q-3Q17 Income Statement
Yageo Group Consolidate (reviewed)
* The financial data is based on T-IFRS
Amount in NTD Million
Y-Y
Amount % Amount % Change %
Net Sales 22,607 100.0 21,023 100.0 7.5
Cost of Sales (16,328) (72.2) (16,135) (76.7) 1.2
Gross Profit 6,280 27.8 4,888 23.3 4.5
Operating Expenses (2,068) (9.1) (2,063) (9.8) 0.3
Operating Income 4,211 18.6 2,825 13.4 5.2
Non-operating Items 87 0.4 166 0.8 (47.3)
Income Before Tax 4,299 19.0 2,991 14.2 43.7
Income Tax (641) (2.8) (626) (3.0) 2.5
Net Income 3,657 16.2 2,365 11.3 54.6
Minority Interest (18) (0.1) (43) (0.2) (58.1)
Net Income (attributable to the parent) 3,640 16.1 2,323 11.0 56.7
EPS 8.07 3.87 108.53
EBITDA 5,550 24.6 4,269 20.3 30.0
1Q-3Q2017 1Q-3Q2016
14 14 14
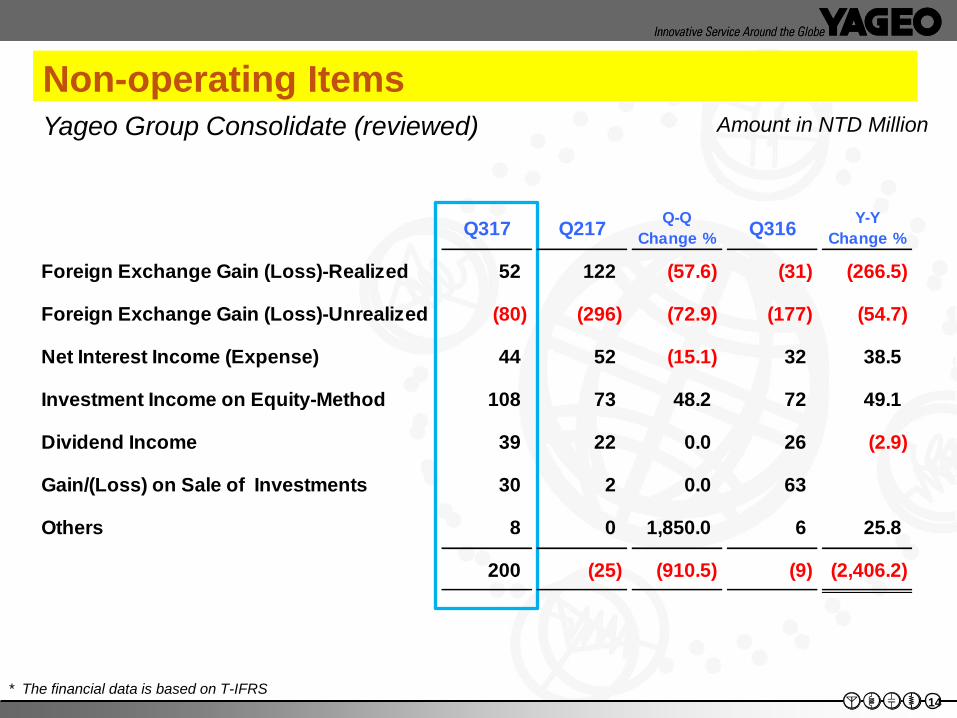
Non-operating Items Yageo Group Consolidate (reviewed)
Amount in NTD Million
* The financial data is based on T-IFRS
Q317 Q217Q-Q
Change %Q316
Y-Y
Change %
Foreign Exchange Gain (Loss)-Realized 52 122 (57.6) (31) (266.5)
Foreign Exchange Gain (Loss)-Unrealized (80) (296) (72.9) (177) (54.7)
Net Interest Income (Expense) 44 52 (15.1) 32 38.5
Investment Income on Equity-Method 108 73 48.2 72 49.1
Dividend Income 39 22 0.0 26 (2.9)
Gain/(Loss) on Sale of Investments 30 2 0.0 63
Others 8 0 1,850.0 6 25.8
200 (25) (910.5) (9) (2,406.2)
15 15 15
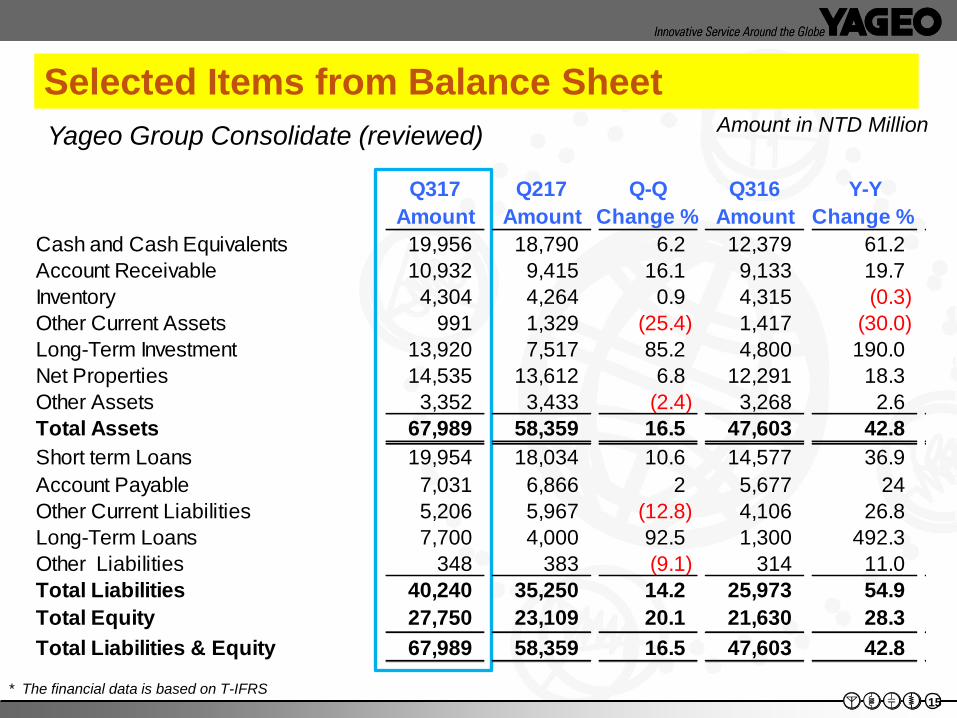
Yageo Group Consolidate (reviewed)
Selected Items from Balance Sheet Amount in NTD Million
* The financial data is based on T-IFRS
Q317 Q217 Q-Q Q316 Y-Y
Amount Amount Change % Amount Change %
Cash and Cash Equivalents 19,956 18,790 6.2 12,379 61.2
Account Receivable 10,932 9,415 16.1 9,133 19.7
Inventory 4,304 4,264 0.9 4,315 (0.3)
Other Current Assets 991 1,329 (25.4) 1,417 (30.0)
Long-Term Investment 13,920 7,517 85.2 4,800 190.0
Net Properties 14,535 13,612 6.8 12,291 18.3
Other Assets 3,352 3,433 (2.4) 3,268 2.6
Total Assets 67,989 58,359 16.5 47,603 42.8
Short term Loans 19,954 18,034 10.6 14,577 36.9
Account Payable 7,031 6,866 2 5,677 24
Other Current Liabilities 5,206 5,967 (12.8) 4,106 26.8
Long-Term Loans 7,700 4,000 92.5 1,300 492.3
Other Liabilities 348 383 (9.1) 314 11.0
Total Liabilities 40,240 35,250 14.2 25,973 54.9
Total Equity 27,750 23,109 20.1 21,630 28.3
Total Liabilities & Equity 67,989 58,359 16.5 47,603 42.8
16 16 16
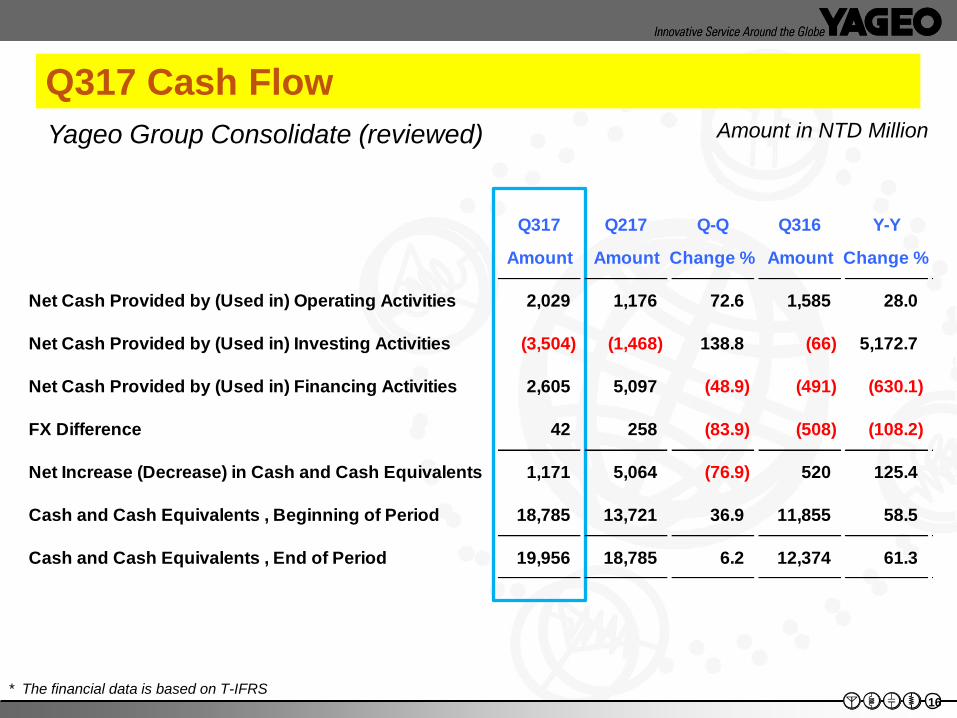
Q317 Cash Flow
Yageo Group Consolidate (reviewed) Amount in NTD Million
* The financial data is based on T-IFRS
Q317 Q217 Q-Q Q316 Y-Y
Amount Amount Change % Amount Change %
Net Cash Provided by (Used in) Operating Activities 2,029 1,176 72.6 1,585 28.0
Net Cash Provided by (Used in) Investing Activities (3,504) (1,468) 138.8 (66) 5,172.7
Net Cash Provided by (Used in) Financing Activities 2,605 5,097 (48.9) (491) (630.1)
FX Difference 42 258 (83.9) (508) (108.2)
Net Increase (Decrease) in Cash and Cash Equivalents 1,171 5,064 (76.9) 520 125.4
Cash and Cash Equivalents , Beginning of Period 18,785 13,721 36.9 11,855 58.5
Cash and Cash Equivalents , End of Period 19,956 18,785 6.2 12,374 61.3
17 17 17
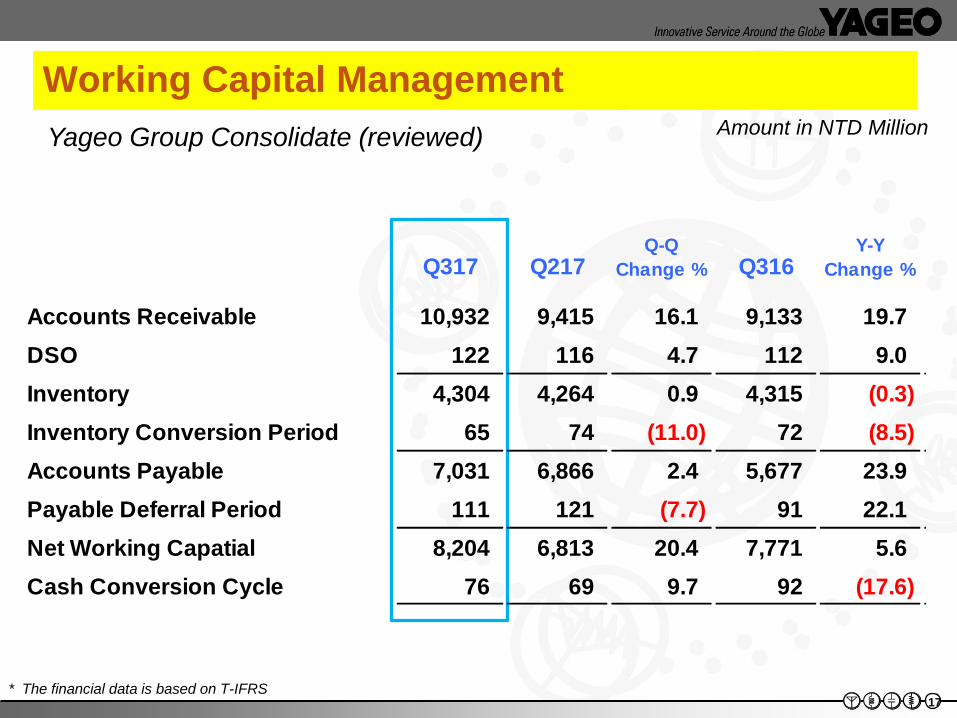
Working Capital Management
Yageo Group Consolidate (reviewed) Amount in NTD Million
* The financial data is based on T-IFRS
Q317 Q217Q-Q
Change % Q316Y-Y
Change %
Accounts Receivable 10,932 9,415 16.1 9,133 19.7
DSO 122 116 4.7 112 9.0
Inventory 4,304 4,264 0.9 4,315 (0.3)
Inventory Conversion Period 65 74 (11.0) 72 (8.5)
Accounts Payable 7,031 6,866 2.4 5,677 23.9
Payable Deferral Period 111 121 (7.7) 91 22.1
Net Working Capatial 8,204 6,813 20.4 7,771 5.6
Cash Conversion Cycle 76 69 9.7 92 (17.6)
Thank you