Embed Size (px)
Citation preview
MOBERG PHARMA AB (PUBL) 556697-7426 INTERIM REPORT 2016
1
Year-end report 2016
Moberg Pharma AB (Publ)
Q1
Q2
Q3
Q4
MOBERG PHARMA AB (PUBL) 556697-7426 YEAR-END REPORT 2016
2
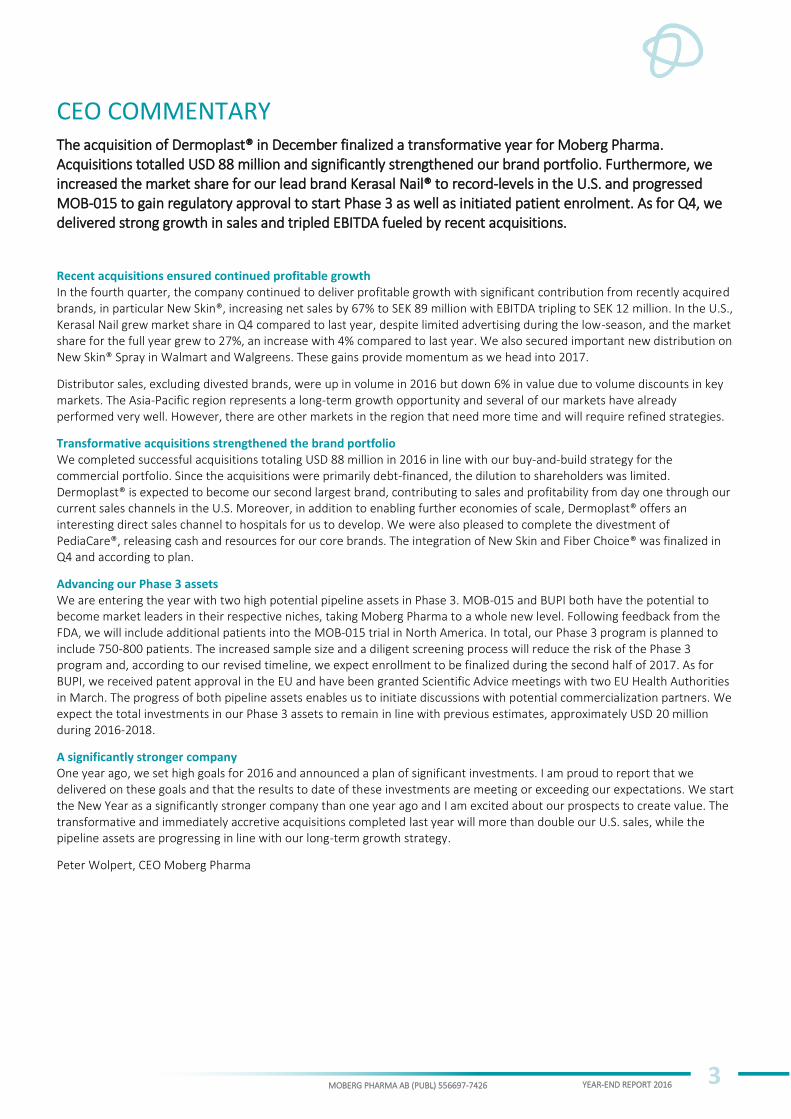
EBITDA TRIPLED IN THE FOURTH QUARTER
“Fueled by recent acquisition, EBITDA tripled in the fourth quarter. The acquisition of Dermoplast® in the end of December rounded off an eventful year of strategic acquisitions, which significantly strengthens the company’s brand portfolio”, said Peter Wolpert, CEO of Moberg Pharma
PERIOD (FULL YEAR 2016) * Net sales SEK 334.3 million (285.6)
EBITDA SEK 77.9 million (46.4)
EBITDA for Commercial Operations SEK 93.5 million (68.5)
Earnings before interest and taxes (EBIT) SEK 62.2 million (35.2)
Net profit after tax SEK 32.7 million (25.5)
Earnings per share SEK 2.25 (1.77)
Operating cash flow per share SEK -1.24 (2.12)
The Board of Directors proposes that no dividend be paid for the 2016 financial year
FOURTH QUARTER (OCT-DEC 2016) Net sales SEK 89.4 million (53.7)
EBITDA SEK 12.0 million (4.0)
EBITDA for Commercial Operations SEK 17.5 million (8.6)
Earnings before interest and taxes (EBIT) SEK 7.1 million (1.1)
Net profit after tax SEK -2.5 million (0.4)**
Loss per share SEK -0.17 (0.03)
Operating cash flow per share SEK 0.36 (0.16)
*The results include a capital gain of SEK 41.1 million in the second quarter from the divestment of the Jointflex®, Fergon® and Vanquish® brands ** Earnings before tax was positive. Additional tax bookings related to transactions resulted in a negative net profit after tax in Q4. However, please note that the company has deferred tax assets and corporate tax paid therefore is insignificant.
SIGNIFICANT EVENTS DURING THE FOURTH QUARTER The acquisition of Dermoplast® from Prestige Brands in the U.S. was completed on December 30, 2016. The purchase price
was USD 47.6 million (SEK 433.2 million), plus inventory value, and the brand is expected to become the company’s second-largest product. The acquisition was financed through directed new share issues worth a total of SEK 148 million, a bond issue of SEK 215 million and available cash and cash equivalents.
Divestment of PediaCare® to Strides Arcolab International Limited, UK for a total consideration of USD 5.6 million, USD 0.6 million of which comprised inventory value.
European patent granted for BUPI. The patent is expected to remain in force until 2031.
Redemptions of stock option schemes increased the number of shares and votes by 279,150, while the new issues implemented in conjunction with the acquisition of Dermoplast® increased the number of shares and votes by 2,843,504, to a total of 17,411,842 shares.
SIGNIFICANT EVENTS AFTER THE END OF THE QUARTER Additional distribution secured for New Skin® Spray through Walmart and Walgreens.
TELEPHONE CONFERENCE
CEO Peter Wolpert will present the report in a conference call at 3 p.m. today, February 14, 2017. Phone +46 (0)8 566 426 95
223259 276 286 282 261
299334
0
100
200
300
400
Q12015
Q22015
Q32015
Q42015
Q12016
Q22016
Q32016
Q42016
Sales revenue, rolling 12 monthsMillion SEK
16% 15%17% 16%
12%
21%23% 23%
0%
5%
10%
15%
20%
25%
Q12015
Q22015
Q32015
Q42015
Q12016
Q22016
Q32016
Q42016
EBITDA margin, rolling 12 months%
MOBERG PHARMA AB (PUBL) 556697-7426 YEAR-END REPORT 2016
3
CEO COMMENTARY The acquisition of Dermoplast® in December finalized a transformative year for Moberg Pharma. Acquisitions totalled USD 88 million and significantly strengthened our brand portfolio. Furthermore, we increased the market share for our lead brand Kerasal Nail® to record-levels in the U.S. and progressed MOB-015 to gain regulatory approval to start Phase 3 as well as initiated patient enrolment. As for Q4, we delivered strong growth in sales and tripled EBITDA fueled by recent acquisitions.
Recent acquisitions ensured continued profitable growth In the fourth quarter, the company continued to deliver profitable growth with significant contribution from recently acquired brands, in particular New Skin®, increasing net sales by 67% to SEK 89 million with EBITDA tripling to SEK 12 million. In the U.S., Kerasal Nail grew market share in Q4 compared to last year, despite limited advertising during the low-season, and the market share for the full year grew to 27%, an increase with 4% compared to last year. We also secured important new distribution on New Skin® Spray in Walmart and Walgreens. These gains provide momentum as we head into 2017.
Distributor sales, excluding divested brands, were up in volume in 2016 but down 6% in value due to volume discounts in key markets. The Asia-Pacific region represents a long-term growth opportunity and several of our markets have already performed very well. However, there are other markets in the region that need more time and will require refined strategies.
Transformative acquisitions strengthened the brand portfolio We completed successful acquisitions totaling USD 88 million in 2016 in line with our buy-and-build strategy for the commercial portfolio. Since the acquisitions were primarily debt-financed, the dilution to shareholders was limited. Dermoplast® is expected to become our second largest brand, contributing to sales and profitability from day one through our current sales channels in the U.S. Moreover, in addition to enabling further economies of scale, Dermoplast® offers an interesting direct sales channel to hospitals for us to develop. We were also pleased to complete the divestment of PediaCare®, releasing cash and resources for our core brands. The integration of New Skin and Fiber Choice® was finalized in Q4 and according to plan.
Advancing our Phase 3 assets We are entering the year with two high potential pipeline assets in Phase 3. MOB-015 and BUPI both have the potential to become market leaders in their respective niches, taking Moberg Pharma to a whole new level. Following feedback from the FDA, we will include additional patients into the MOB-015 trial in North America. In total, our Phase 3 program is planned to include 750-800 patients. The increased sample size and a diligent screening process will reduce the risk of the Phase 3 program and, according to our revised timeline, we expect enrollment to be finalized during the second half of 2017. As for BUPI, we received patent approval in the EU and have been granted Scientific Advice meetings with two EU Health Authorities in March. The progress of both pipeline assets enables us to initiate discussions with potential commercialization partners. We expect the total investments in our Phase 3 assets to remain in line with previous estimates, approximately USD 20 million during 2016-2018.
A significantly stronger company One year ago, we set high goals for 2016 and announced a plan of significant investments. I am proud to report that we delivered on these goals and that the results to date of these investments are meeting or exceeding our expectations. We start the New Year as a significantly stronger company than one year ago and I am excited about our prospects to create value. The transformative and immediately accretive acquisitions completed last year will more than double our U.S. sales, while the pipeline assets are progressing in line with our long-term growth strategy.
Peter Wolpert, CEO Moberg Pharma
MOBERG PHARMA AB (PUBL) 556697-7426 YEAR-END REPORT 2016
4
ABOUT MOBERG PHARMA
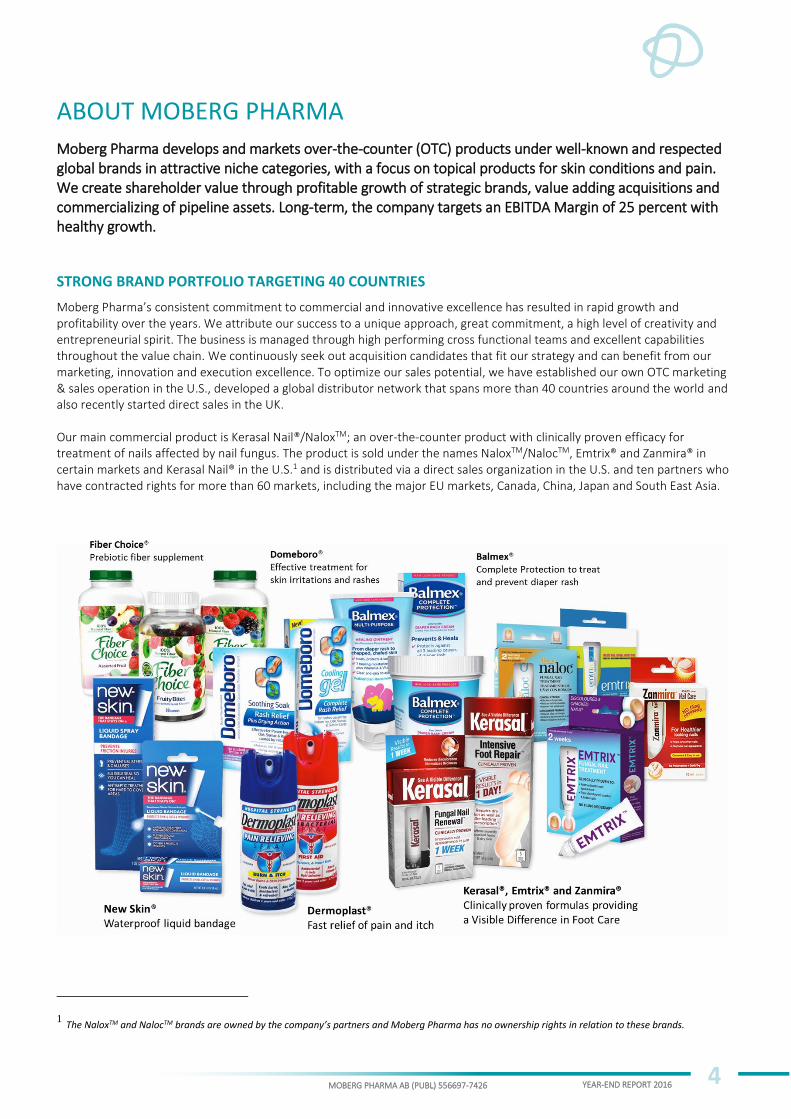
Moberg Pharma develops and markets over-the-counter (OTC) products under well-known and respected global brands in attractive niche categories, with a focus on topical products for skin conditions and pain. We create shareholder value through profitable growth of strategic brands, value adding acquisitions and commercializing of pipeline assets. Long-term, the company targets an EBITDA Margin of 25 percent with healthy growth.
STRONG BRAND PORTFOLIO TARGETING 40 COUNTRIES
Moberg Pharma’s consistent commitment to commercial and innovative excellence has resulted in rapid growth and profitability over the years. We attribute our success to a unique approach, great commitment, a high level of creativity and entrepreneurial spirit. The business is managed through high performing cross functional teams and excellent capabilities throughout the value chain. We continuously seek out acquisition candidates that fit our strategy and can benefit from our marketing, innovation and execution excellence. To optimize our sales potential, we have established our own OTC marketing & sales operation in the U.S., developed a global distributor network that spans more than 40 countries around the world and also recently started direct sales in the UK. Our main commercial product is Kerasal Nail®/NaloxTM; an over-the-counter product with clinically proven efficacy for treatment of nails affected by nail fungus. The product is sold under the names NaloxTM/NalocTM, Emtrix® and Zanmira® in certain markets and Kerasal Nail® in the U.S.1 and is distributed via a direct sales organization in the U.S. and ten partners who have contracted rights for more than 60 markets, including the major EU markets, Canada, China, Japan and South East Asia.
1 The NaloxTM and NalocTM brands are owned by the company’s partners and Moberg Pharma has no ownership rights in relation to these brands.
MOBERG PHARMA AB (PUBL) 556697-7426 YEAR-END REPORT 2016
5
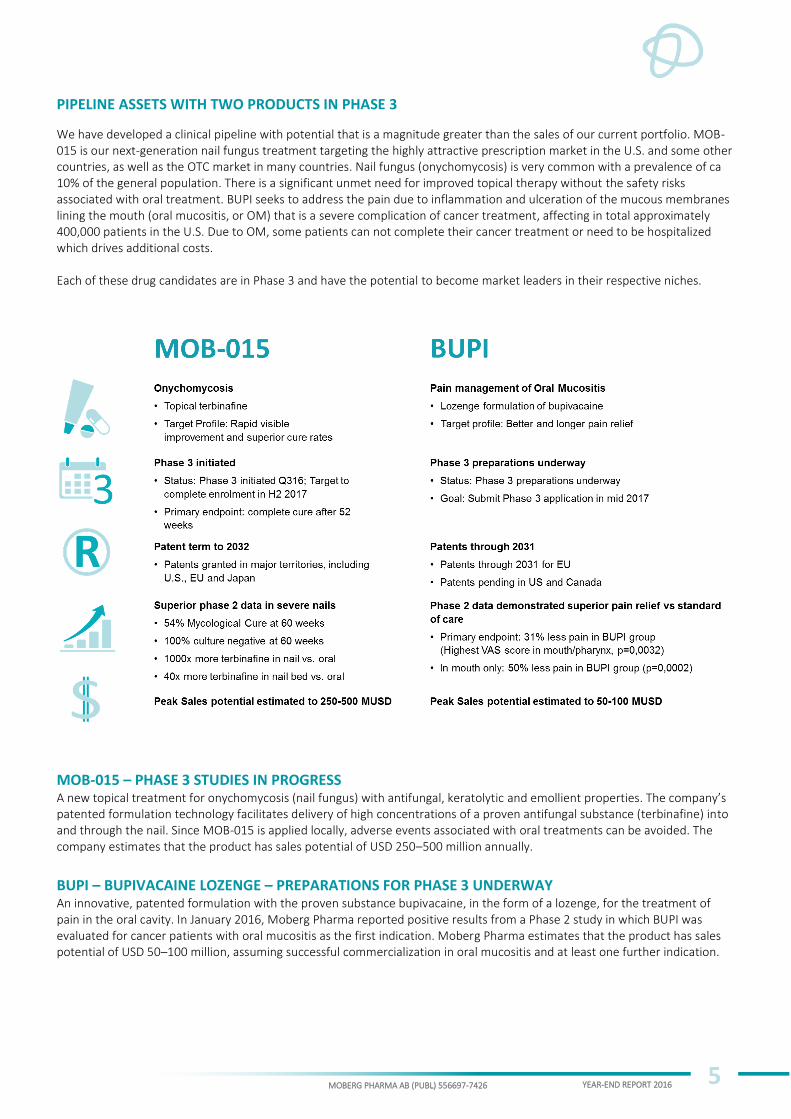
PIPELINE ASSETS WITH TWO PRODUCTS IN PHASE 3
We have developed a clinical pipeline with potential that is a magnitude greater than the sales of our current portfolio. MOB-015 is our next-generation nail fungus treatment targeting the highly attractive prescription market in the U.S. and some other countries, as well as the OTC market in many countries. Nail fungus (onychomycosis) is very common with a prevalence of ca 10% of the general population. There is a significant unmet need for improved topical therapy without the safety risks associated with oral treatment. BUPI seeks to address the pain due to inflammation and ulceration of the mucous membranes lining the mouth (oral mucositis, or OM) that is a severe complication of cancer treatment, affecting in total approximately 400,000 patients in the U.S. Due to OM, some patients can not complete their cancer treatment or need to be hospitalized which drives additional costs. Each of these drug candidates are in Phase 3 and have the potential to become market leaders in their respective niches.
MOB-015 – PHASE 3 STUDIES IN PROGRESS A new topical treatment for onychomycosis (nail fungus) with antifungal, keratolytic and emollient properties. The company’s patented formulation technology facilitates delivery of high concentrations of a proven antifungal substance (terbinafine) into and through the nail. Since MOB-015 is applied locally, adverse events associated with oral treatments can be avoided. The company estimates that the product has sales potential of USD 250–500 million annually.
BUPI – BUPIVACAINE LOZENGE – PREPARATIONS FOR PHASE 3 UNDERWAY An innovative, patented formulation with the proven substance bupivacaine, in the form of a lozenge, for the treatment of pain in the oral cavity. In January 2016, Moberg Pharma reported positive results from a Phase 2 study in which BUPI was evaluated for cancer patients with oral mucositis as the first indication. Moberg Pharma estimates that the product has sales potential of USD 50–100 million, assuming successful commercialization in oral mucositis and at least one further indication.
MOBERG PHARMA AB (PUBL) 556697-7426 YEAR-END REPORT 2016
6
BUSINESS PERFORMANCE IN 2016
We set four goals for 2016: to carry out a major acquisition, to begin Phase 3 studies for MOB-015, to broaden our distribution, and to increase our market share for Kerasal Nail®. As we summarize our performance this year, we can confirm that we achieved all our objectives and more. We completed two exciting acquisitions which we expect to double our US franchise, we advanced our Phase 3 projects, we achieved a record high market share for Kerasal Nail®, and we entered into agreements on new distribution in the U.S. and several other markets. During the year, our sales increased by 17% and EBITDA by 68%. In view of our strong performance in the past year, we look forward to a new year in which we will take on new challenges based on the company’s long-term strategy.
COMMERCIAL OPERATIONS
Direct sales – Growth fueled by acquired brands and new all-time high market share for Kerasal Nail® The re-launch of Kerasal Nail® initiated in the spring was successful and resulted in a 25% market share in Q4, an increase of 3% vs last year, despite limited advertising in the low season. For the full year, Kerasal Nail® grew share to 27%, an increase of 4% vs previous year2.
The integration of the brands acquired in July progressed according to plan and was finalized during Q4. In January 2017, we secured additional distribution for New Skin® Spray at Walmart as well as Walgreens. The product will be sold in 3,900 Walmart stores and in over 1,500 Walgreens stores. Opening orders are expected to ship in mid-March. As of January 1, 2017, Dermoplast® is contributing to the sales and profitability and is expected to become our second largest brand.
During 2016 we entered the UK as our second direct sales market with the launch of Emtrix®. Our stepwise launch is progressing according to plan. We expect near-term revenues and marketing investments in the UK to be limited.
Distributor sales increased in volume but not in value in 2016 In 2016, sales volumes increased driven by the launches in Asia-Pacific, however total distributor revenues declined somewhat due to volume discounts. The Asia-Pacific region represents a long-term growth opportunity and some of our markets have already performed very well. However, there are other markets that need more time and may require refined strategies. We continue to deepen the launch and lifecycle management strategy in close interaction with our partner Menarini APAC. During the year a successful launch was carried out in Taiwan as well as a test launch in Japan; both of which we expect to become key markets going forward.
ACQUISITIONS, DIVESTMENTS AND FINANCING
Acquisitions During the year, Moberg Pharma acquired the three over-the-counter brands New Skin®, Fiber Choice® and PediaCare®, followed by Dermoplast®, from America’s Prestige Brands for a total of USD 87.6 million, which was financed via a directed new share issue of a total of SEK 148 million, a bond issue worth a total of SEK 600 million and existing cash and cash equivalents.
New Skin® is the leading over-the-counter liquid bandage brand in the U.S. while Dermoplast® is a topical spray for alleviating pain and irritation from skin injuries. Dermoplast® is expected to become the company’s second-largest brand and to have an immediate positive impact on earnings and cash flow per share, even after financing costs are taken into account. Both are primarily sold through Moberg’s current sales channels in the U.S, in chain drugstores and mass retailers, which facilitates smooth integration, an improved position overall in US retail, and economies of scale in the existing sales infrastructure. Dermoplast® also gives Moberg access to direct sales to hospitals, adding an interesting channel for the company to develop further. The hospital sales are primarily focused on women, for use on chapped skin and for vaginal injuries and surgery in connection with, or after, childbirth.
Divestments Divestments worth a total of USD 15 million, plus inventory value of USD 1.0 million, were made during the year, releasing financial and personnel resources for the company’s core business. In March, Moberg Pharma sold the brands Jointflex®, Fergon® and Vanquish® to Strides Pharma Inc. for a total consideration of USD 10 million plus inventory value of USD 0.4 million. The divestment resulted in a capital gain of SEK 41.4 million. PediaCare® was sold in December to Strides Arcolab
2 U.S. MULO, last 52 weeks ending December 25 2016, SymphonyIRI
MOBERG PHARMA AB (PUBL) 556697-7426 YEAR-END REPORT 2016
7
International Limited, UK for a total purchase price of USD 5 million plus inventory value of USD 0.6 million. The divestment gave rise to neither a capital gain nor a loss.
PIPELINE ASSETS
MOB-015 – granting of patents in more countries and two Phase 3 studies underway in the U.S. and Europe In July 2016, an IND application was submitted to the FDA for starting Phase 3 for MOB-015. Following approval, the company began preparing the inclusion criteria for the Phase 3 trial in September. The company then received a “60-day letter” from the FDA, with recommendations regarding the study and the IND application in the U.S. Essentially, we have adhered to all the FDA’s recommendations, including an increase in the number of patients for the Phase 3 study in North America. The plan is to include 750–800 patients for the Phase 3 program as a whole (in North America and Europe), and according to our revised timeline, we expect to complete patient enrollment during the second half of 2017. The increase in the total number of patients, as well as a rigorous screening procedure, are important components to ensure quality and reduce the risk of the Phase 3 program. We estimate that the total costs will remain at the previous estimate of USD 20 million, as some other study costs have been lower than expected.
The company also obtained approval of corresponding applications for Phase 3 studies from the authorities in Germany, Poland and Canada, which enabled the company to start enrollment of patients during the fall. MOB-015 is to be evaluated in Phase 3 trials for 52 weeks in two randomized, controlled multi-center studies. The primary endpoint in both studies is the proportion of subjects who achieve complete cure of the designated big toe nail, defined as complete clinical cure and negative mycology (fungal culture and KOH microscopy).
During the year, patents for MOB-015 were granted in additional markets and are expected to remain in force through 2032. The patent comprises new topical formulations of allylamines (including terbinafine), and treatment methods for onychomycosis (nail fungus) using the new formulations. Since February 2015, corresponding patents have been granted in the United States, Australia, Canada, EU, Japan, Mexico, Singapore, South Africa and Russia. Notification of future granting of patent has been issued in Israel. Active applications are underway in several other areas, including Brazil, China, Hong Kong, Indonesia, India and South Korea.
BUPI – Preparing Phase 3, European patent granted In January 2016, the company reported positive results from a phase 2 clinical trial of BUPI for pain relief for oral mucositis in patients with cancer in the head and neck area. The Board of Directors subsequently approved a risk-minimizing strategy for further development and commercialization. Preparations for Phase 3 are underway in collaboration with Moberg’s partner Cadila Pharmaceuticals.
In October, the European Patent Office (EPO) issued Patent No. 2701681 for BUPI, an important milestone which also facilitates discussions with future commercialization partners. At the turn of the year, we requested advisory meetings (Scientific Advice meetings) with medical products agencies in Sweden and Germany. We expect to conduct these meetings in March 2017. The new BUPI patent is expected to be valid through 2031 and it covers lozenges and other formulations containing a local anesthetic, including bupivacaine, for local administration in the mouth or throat. The patent also covers use of the product for oral mucositis in cancer patients. Patents applications are pending in the U.S. and Canada.
MOBERG PHARMA AB (PUBL) 556697-7426 YEAR-END REPORT 2016
8
GROUP REVENUE AND EARNINGS
SALES
Fourth quarter (October-December 2016) In the fourth quarter of 2016, net sales amounted to SEK 89.4 million (53.7), an increase of 67% compared to the fourth quarter of 2015. Nalox™/Kerasal Nail® accounted for SEK 22.4 million (22.8) of product sales, while other products contributed SEK 67.0 million (30.9). Direct sales almost doubled (98%)3 in the fourth quarter. Excluding products acquired and/or divested in 2016, direct sales increased by 5%. Sales via distributors declined by 37%4 in the fourth quarter, compared to the same period in the previous year; excluding divestments the decline was 23%. Note that distributor sales vary between quarters due to seasonality and since orders normally are placed 2-3 times per year for each market.
The company is dependent on the trend in the US dollar and the Euro in relation to the Swedish krona, since the majority of invoicing is in US dollars and Euros. In the fourth quarter of 2016, revenue in US dollars was recognized at an average exchange rate of SEK 9.04, compared to SEK 8.50 in the fourth quarter of 2015. The corresponding figure for the Euro was an average exchange rate of SEK 9.76, compared to SEK 9.30 in the fourth quarter of 2015. Exchange rates therefore had a positive impact on revenue. If exchange rates had been unchanged, turnover would have increased by 57% compared to the fourth quarter of 2015.
Reporting period (full year 2016) In 2016, net sales amounted to SEK 334.3 million (285.6), an increase of 17%. Product sales of Nalox™/Kerasal Nail® accounted for as much as SEK 151.3 million (154.5) of total revenue. The product Balmex® was acquired on April 27, 2015 and Balmex® sales are included in the income statement from that date. The products New Skin®, PediaCare® and Fiber Choice® were acquired on July 7, 2016 and sales of these products are included in the income statement from that date. The product Dermoplast® was acquired on December 30, 2016 and therefore did not contribute to income for 2016. Product sales revenue for the products that were divested on April 1, 2016 (JointFlex®, Vanquish® and Fergon®) amounted to SEK 16.3 million (51.9), while product sales revenue for PediaCare® (acquired July 7, 2016 and divested December 19, 2016) totaled SEK 16.2 million (0), revenue for New Skin® and Fiber Choice® (acquired July 7, 2016) totaled SEK 68.4 million (0), and revenue for other products totaled SEK 82.1 million (76.6).
Total revenue, adjusted for acquisitions and divestments during the year 2016, amounted to SEK 233.3 million (233.7). Corresponding adjusted revenue from direct sales increased by 4% (from SEK 166.7 million in 2015 to SEK 172.8 million in 2016), while adjusted revenue from product sales to distributors fell by 6% (from SEK 64.4 million in 2015 to SEK 60.6 million in 2016). The distributor sales increased in terms of volume, but revenue fell as a result of the introduction of volume discounts. No milestone payments were received in 2016 (SEK 2.6 million received in 2015). All brands that are included in adjusted direct sales reported growth during the year, apart from Kerasal® Ointment. The direct sales activities also benefited from the strengthening US dollar exchange rate in 2016, which rose by an average of 1.5% against the Swedish krona compared to 2015.
Other operating income primarily comprised a capital gain of SEK 41.1 million in connection with the sale of the JointFlex®, Fergon® and Vanquish® brands, but also included exchange rate fluctuations on operating receivables and a research grant from Eurostars of SEK 2.1 million (0.8).
Sales amounted to SEK 19.4 million (32.2) in Europe, SEK 274.8 million (211.3) in America, and SEK 40.1 million (42.0) in the rest of the world. Adjusted for products acquired and/or disposed of in 2016, sales in Europe amounted to SEK 19.4 million (31.7) in a decrease of 39%, in America to SEK 180.4 million (171.4), an increase of 5%, and in the rest of the world to SEK 33.5 million (30.5), an increase of 10%.
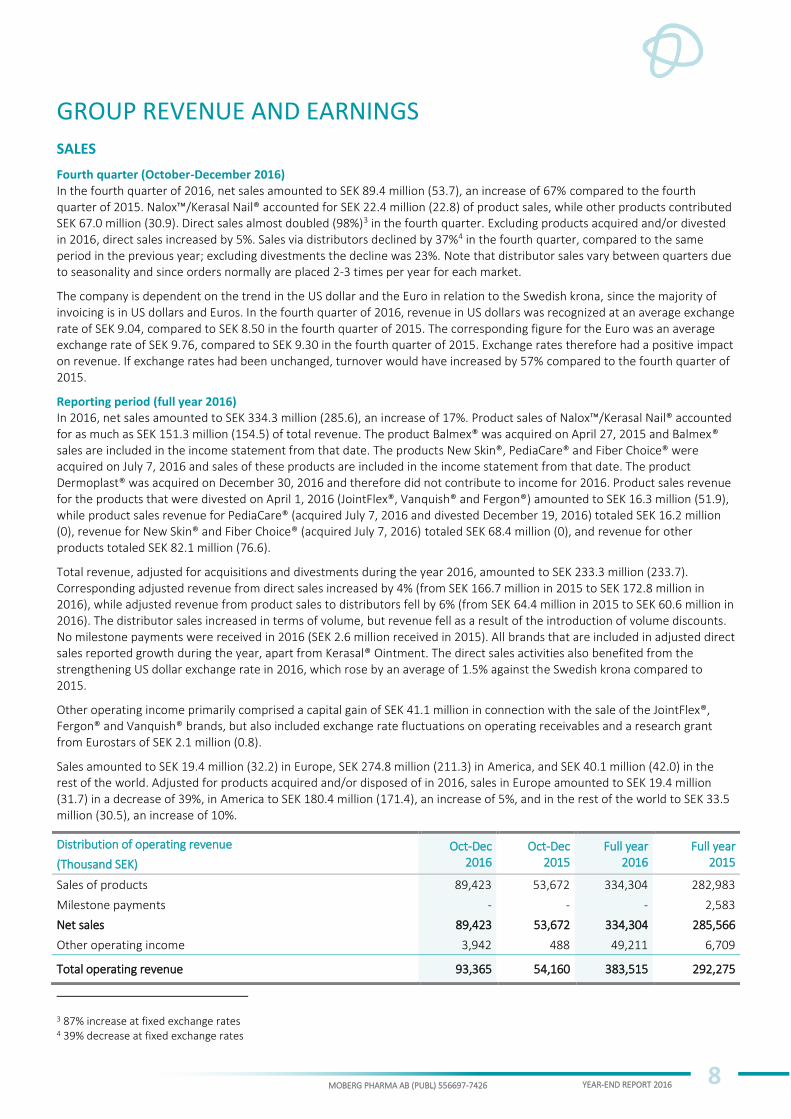
Distribution of operating revenue Oct-Dec Oct-Dec Full year Full year
(Thousand SEK) 2016 2015 2016 2015
Sales of products 89,423 53,672 334,304 282,983
Milestone payments - - - 2,583
Net sales 89,423 53,672 334,304 285,566
Other operating income 3,942 488 49,211 6,709
Total operating revenue 93,365 54,160 383,515 292,275
3 87% increase at fixed exchange rates 4 39% decrease at fixed exchange rates
MOBERG PHARMA AB (PUBL) 556697-7426 YEAR-END REPORT 2016
9
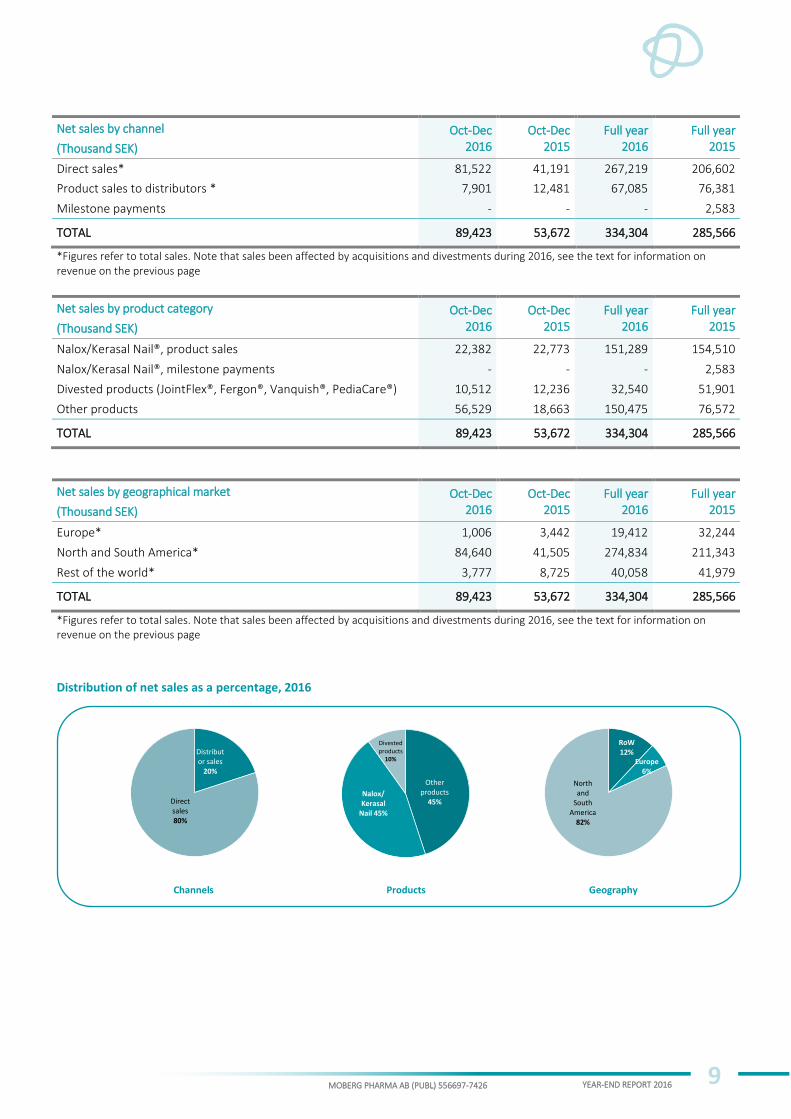
Net sales by channel Oct-Dec Oct-Dec Full year Full year
(Thousand SEK) 2016 2015 2016 2015
Direct sales* 81,522 41,191 267,219 206,602
Product sales to distributors * 7,901 12,481 67,085 76,381
Milestone payments - - - 2,583
TOTAL 89,423 53,672 334,304 285,566
*Figures refer to total sales. Note that sales been affected by acquisitions and divestments during 2016, see the text for information on revenue on the previous page
Net sales by product category Oct-Dec Oct-Dec Full year Full year
(Thousand SEK) 2016 2015 2016 2015
Nalox/Kerasal Nail®, product sales 22,382 22,773 151,289 154,510
Nalox/Kerasal Nail®, milestone payments - - - 2,583
Divested products (JointFlex®, Fergon®, Vanquish®, PediaCare®) 10,512 12,236 32,540 51,901
Other products 56,529 18,663 150,475 76,572
TOTAL 89,423 53,672 334,304 285,566
Net sales by geographical market Oct-Dec Oct-Dec Full year Full year
(Thousand SEK) 2016 2015 2016 2015
Europe* 1,006 3,442 19,412 32,244
North and South America* 84,640 41,505 274,834 211,343
Rest of the world* 3,777 8,725 40,058 41,979
TOTAL 89,423 53,672 334,304 285,566
*Figures refer to total sales. Note that sales been affected by acquisitions and divestments during 2016, see the text for information on revenue on the previous page
Distribution of net sales as a percentage, 2016
Channels Products Geography
RoW12%
Europe 6%
North and
South America
82%
Distributor sales
20%
Direct sales80%
Other products
45%
Divested products
10%
Nalox/ Kerasal
Nail 45%
MOBERG PHARMA AB (PUBL) 556697-7426 YEAR-END REPORT 2016
10
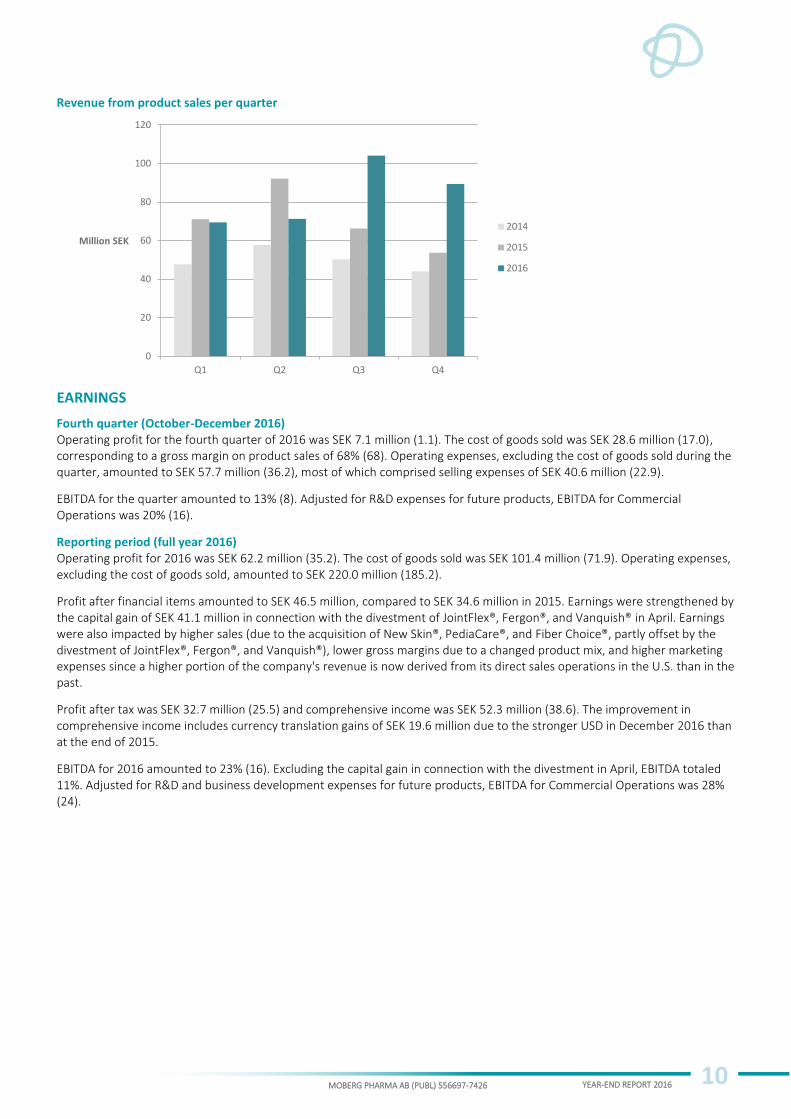
Revenue from product sales per quarter
EARNINGS
Fourth quarter (October-December 2016) Operating profit for the fourth quarter of 2016 was SEK 7.1 million (1.1). The cost of goods sold was SEK 28.6 million (17.0), corresponding to a gross margin on product sales of 68% (68). Operating expenses, excluding the cost of goods sold during the quarter, amounted to SEK 57.7 million (36.2), most of which comprised selling expenses of SEK 40.6 million (22.9).
EBITDA for the quarter amounted to 13% (8). Adjusted for R&D expenses for future products, EBITDA for Commercial Operations was 20% (16).
Reporting period (full year 2016) Operating profit for 2016 was SEK 62.2 million (35.2). The cost of goods sold was SEK 101.4 million (71.9). Operating expenses, excluding the cost of goods sold, amounted to SEK 220.0 million (185.2).
Profit after financial items amounted to SEK 46.5 million, compared to SEK 34.6 million in 2015. Earnings were strengthened by the capital gain of SEK 41.1 million in connection with the divestment of JointFlex®, Fergon®, and Vanquish® in April. Earnings were also impacted by higher sales (due to the acquisition of New Skin®, PediaCare®, and Fiber Choice®, partly offset by the divestment of JointFlex®, Fergon®, and Vanquish®), lower gross margins due to a changed product mix, and higher marketing expenses since a higher portion of the company's revenue is now derived from its direct sales operations in the U.S. than in the past.
Profit after tax was SEK 32.7 million (25.5) and comprehensive income was SEK 52.3 million (38.6). The improvement in comprehensive income includes currency translation gains of SEK 19.6 million due to the stronger USD in December 2016 than at the end of 2015.
EBITDA for 2016 amounted to 23% (16). Excluding the capital gain in connection with the divestment in April, EBITDA totaled 11%. Adjusted for R&D and business development expenses for future products, EBITDA for Commercial Operations was 28% (24).
0
20
40
60
80
100
120
Q1 Q2 Q3 Q4
Million SEK
2014
2015
2016
MOBERG PHARMA AB (PUBL) 556697-7426 YEAR-END REPORT 2016
11
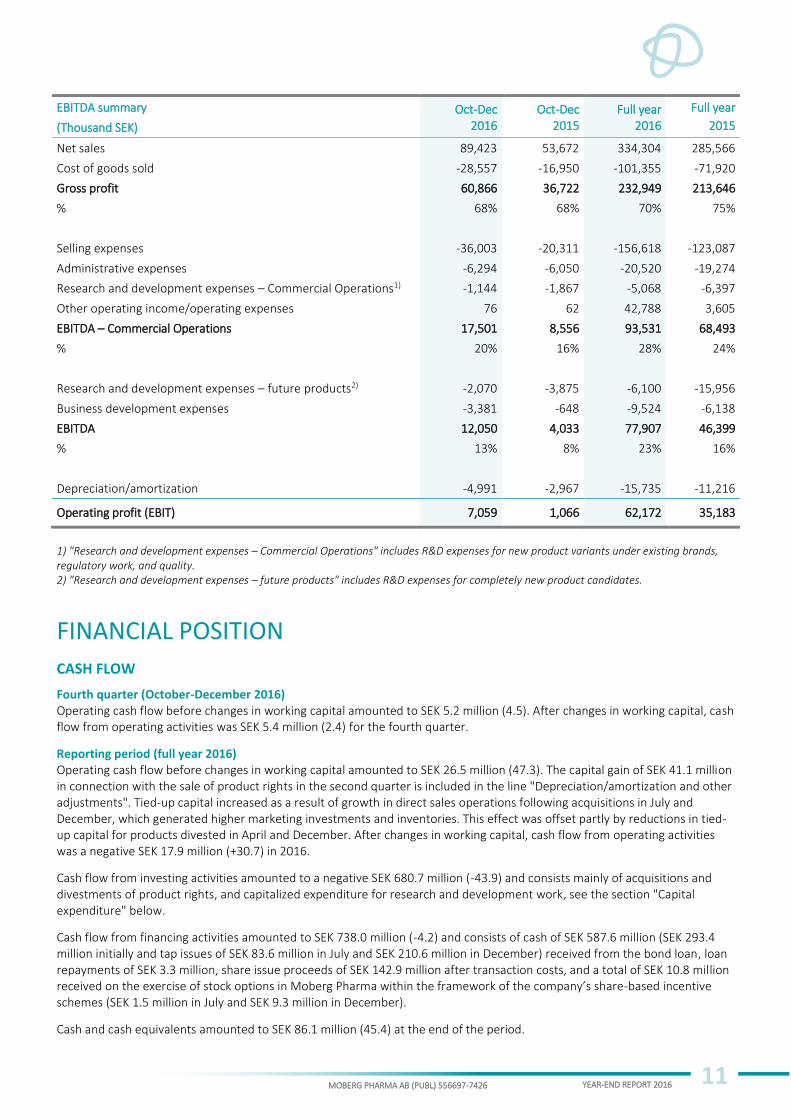
EBITDA summary Oct-Dec Oct-Dec Full year Full year
(Thousand SEK) 2016 2015 2016 2015
Net sales 89,423 53,672 334,304 285,566
Cost of goods sold -28,557 -16,950 -101,355 -71,920
Gross profit 60,866 36,722 232,949 213,646
% 68% 68% 70% 75%
Selling expenses -36,003 -20,311 -156,618 -123,087
Administrative expenses -6,294 -6,050 -20,520 -19,274
Research and development expenses – Commercial Operations1) -1,144 -1,867 -5,068 -6,397
Other operating income/operating expenses 76 62 42,788 3,605
EBITDA – Commercial Operations 17,501 8,556 93,531 68,493
% 20% 16% 28% 24%
Research and development expenses – future products2) -2,070 -3,875 -6,100 -15,956
Business development expenses -3,381 -648 -9,524 -6,138
EBITDA 12,050 4,033 77,907 46,399
% 13% 8% 23% 16%
Depreciation/amortization -4,991 -2,967 -15,735 -11,216
Operating profit (EBIT) 7,059 1,066 62,172 35,183
1) "Research and development expenses – Commercial Operations" includes R&D expenses for new product variants under existing brands, regulatory work, and quality. 2) "Research and development expenses – future products" includes R&D expenses for completely new product candidates.
FINANCIAL POSITION
CASH FLOW
Fourth quarter (October-December 2016) Operating cash flow before changes in working capital amounted to SEK 5.2 million (4.5). After changes in working capital, cash flow from operating activities was SEK 5.4 million (2.4) for the fourth quarter.
Reporting period (full year 2016) Operating cash flow before changes in working capital amounted to SEK 26.5 million (47.3). The capital gain of SEK 41.1 million in connection with the sale of product rights in the second quarter is included in the line "Depreciation/amortization and other adjustments". Tied-up capital increased as a result of growth in direct sales operations following acquisitions in July and December, which generated higher marketing investments and inventories. This effect was offset partly by reductions in tied-up capital for products divested in April and December. After changes in working capital, cash flow from operating activities was a negative SEK 17.9 million (+30.7) in 2016.
Cash flow from investing activities amounted to a negative SEK 680.7 million (-43.9) and consists mainly of acquisitions and divestments of product rights, and capitalized expenditure for research and development work, see the section "Capital expenditure" below.
Cash flow from financing activities amounted to SEK 738.0 million (-4.2) and consists of cash of SEK 587.6 million (SEK 293.4 million initially and tap issues of SEK 83.6 million in July and SEK 210.6 million in December) received from the bond loan, loan repayments of SEK 3.3 million, share issue proceeds of SEK 142.9 million after transaction costs, and a total of SEK 10.8 million received on the exercise of stock options in Moberg Pharma within the framework of the company’s share-based incentive schemes (SEK 1.5 million in July and SEK 9.3 million in December).
Cash and cash equivalents amounted to SEK 86.1 million (45.4) at the end of the period.
MOBERG PHARMA AB (PUBL) 556697-7426 YEAR-END REPORT 2016
12
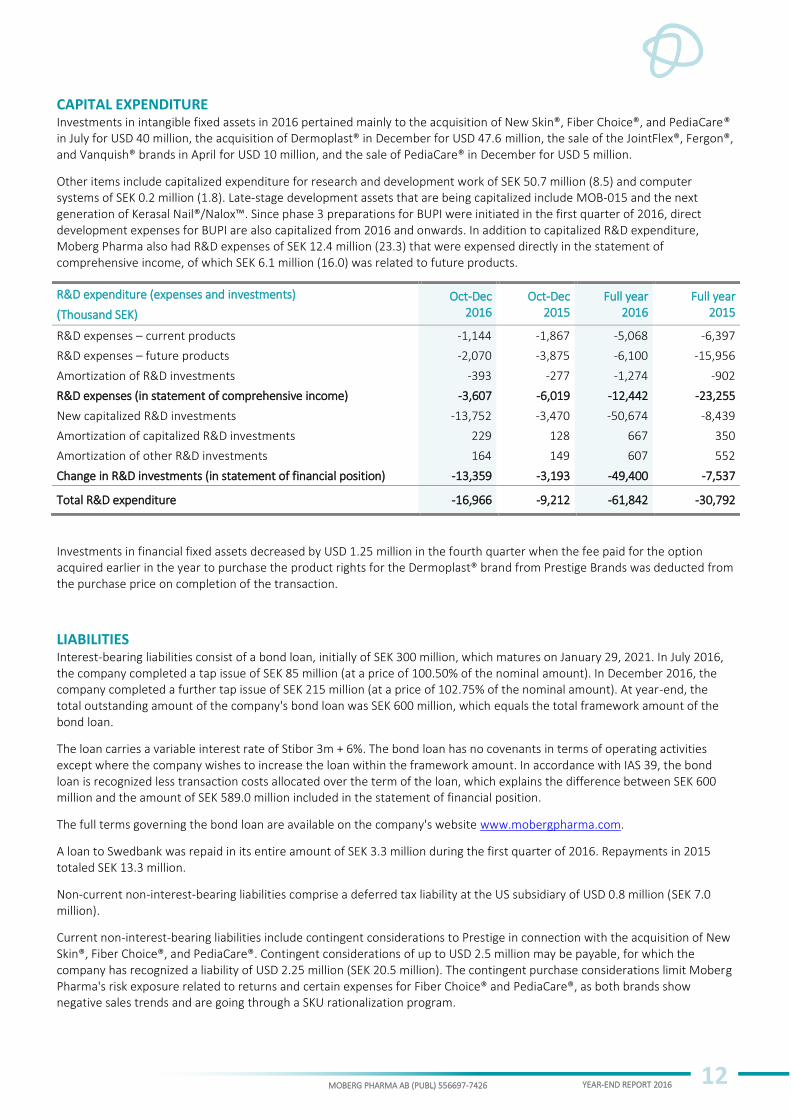
CAPITAL EXPENDITURE Investments in intangible fixed assets in 2016 pertained mainly to the acquisition of New Skin®, Fiber Choice®, and PediaCare® in July for USD 40 million, the acquisition of Dermoplast® in December for USD 47.6 million, the sale of the JointFlex®, Fergon®, and Vanquish® brands in April for USD 10 million, and the sale of PediaCare® in December for USD 5 million.
Other items include capitalized expenditure for research and development work of SEK 50.7 million (8.5) and computer systems of SEK 0.2 million (1.8). Late-stage development assets that are being capitalized include MOB-015 and the next generation of Kerasal Nail®/Nalox™. Since phase 3 preparations for BUPI were initiated in the first quarter of 2016, direct development expenses for BUPI are also capitalized from 2016 and onwards. In addition to capitalized R&D expenditure, Moberg Pharma also had R&D expenses of SEK 12.4 million (23.3) that were expensed directly in the statement of comprehensive income, of which SEK 6.1 million (16.0) was related to future products.
R&D expenditure (expenses and investments) Oct-Dec Oct-Dec Full year Full year
(Thousand SEK) 2016 2015 2016 2015
R&D expenses – current products -1,144 -1,867 -5,068 -6,397
R&D expenses – future products -2,070 -3,875 -6,100 -15,956
Amortization of R&D investments -393 -277 -1,274 -902
R&D expenses (in statement of comprehensive income) -3,607 -6,019 -12,442 -23,255
New capitalized R&D investments -13,752 -3,470 -50,674 -8,439
Amortization of capitalized R&D investments 229 128 667 350
Amortization of other R&D investments 164 149 607 552
Change in R&D investments (in statement of financial position) -13,359 -3,193 -49,400 -7,537
Total R&D expenditure -16,966 -9,212 -61,842 -30,792
Investments in financial fixed assets decreased by USD 1.25 million in the fourth quarter when the fee paid for the option acquired earlier in the year to purchase the product rights for the Dermoplast® brand from Prestige Brands was deducted from the purchase price on completion of the transaction.
LIABILITIES Interest-bearing liabilities consist of a bond loan, initially of SEK 300 million, which matures on January 29, 2021. In July 2016, the company completed a tap issue of SEK 85 million (at a price of 100.50% of the nominal amount). In December 2016, the company completed a further tap issue of SEK 215 million (at a price of 102.75% of the nominal amount). At year-end, the total outstanding amount of the company's bond loan was SEK 600 million, which equals the total framework amount of the bond loan.
The loan carries a variable interest rate of Stibor 3m + 6%. The bond loan has no covenants in terms of operating activities except where the company wishes to increase the loan within the framework amount. In accordance with IAS 39, the bond loan is recognized less transaction costs allocated over the term of the loan, which explains the difference between SEK 600 million and the amount of SEK 589.0 million included in the statement of financial position.
The full terms governing the bond loan are available on the company's website www.mobergpharma.com.
A loan to Swedbank was repaid in its entire amount of SEK 3.3 million during the first quarter of 2016. Repayments in 2015 totaled SEK 13.3 million.
Non-current non-interest-bearing liabilities comprise a deferred tax liability at the US subsidiary of USD 0.8 million (SEK 7.0 million).
Current non-interest-bearing liabilities include contingent considerations to Prestige in connection with the acquisition of New Skin®, Fiber Choice®, and PediaCare®. Contingent considerations of up to USD 2.5 million may be payable, for which the company has recognized a liability of USD 2.25 million (SEK 20.5 million). The contingent purchase considerations limit Moberg Pharma's risk exposure related to returns and certain expenses for Fiber Choice® and PediaCare®, as both brands show negative sales trends and are going through a SKU rationalization program.
MOBERG PHARMA AB (PUBL) 556697-7426 YEAR-END REPORT 2016
13
PLEDGED ASSETS AND CONTINGENT LIABILITIES Moberg Pharma has no contingent liabilities. The chattel mortgages totaling SEK 20 million and shares pledged in the subsidiary Moberg Pharma North America LLC at the beginning of the year expired in connection with the final settlement of the loan from Swedbank. Pledged assets therefore consist only of blocked bank funds totaling SEK 0.7 million.
CHANGES IN EQUITY
SHARES The number of shares and voting rights rose 71,666 to 14,289,188 in June 2016. The change was due to warrants in Moberg Pharma being exercised within the framework of the company's share-based incentive schemes.
The number of shares and voting rights rose a further 3,122,654 to 17,411,842 in December. This was due partly to the private placement of a total of 2,843,504 shares that Moberg Pharma AB (publ) announced on December 7, 2016, and partly to 279,150 new shares from the exercise of warrants within the framework of the company's share-based incentive schemes.
At the end of 2016, share capital amounted to SEK 1,741,184.20 (1,421,752.20), and the total number of shares outstanding was 17,411,842 (14,217,522) ordinary shares with a nominal value of SEK 0.10.
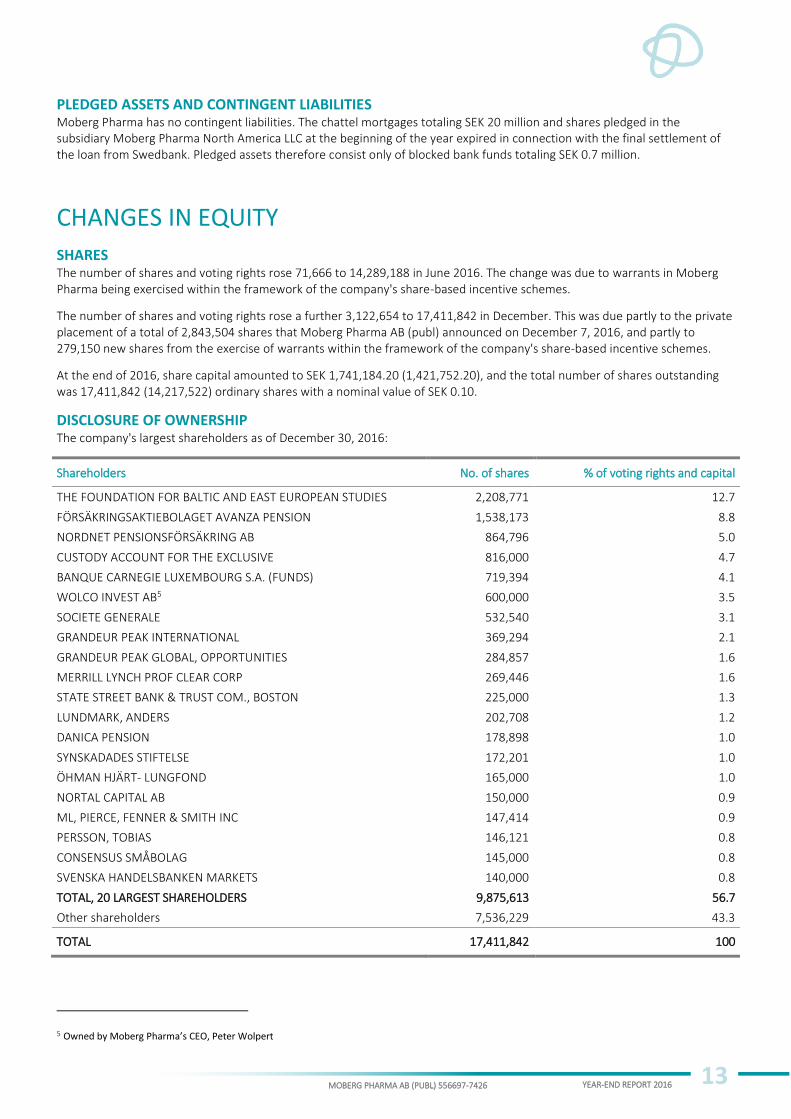
DISCLOSURE OF OWNERSHIP The company's largest shareholders as of December 30, 2016:
Shareholders No. of shares % of voting rights and capital
THE FOUNDATION FOR BALTIC AND EAST EUROPEAN STUDIES 2,208,771 12.7
FÖRSÄKRINGSAKTIEBOLAGET AVANZA PENSION 1,538,173 8.8
NORDNET PENSIONSFÖRSÄKRING AB 864,796 5.0
CUSTODY ACCOUNT FOR THE EXCLUSIVE 816,000 4.7
BANQUE CARNEGIE LUXEMBOURG S.A. (FUNDS) 719,394 4.1
WOLCO INVEST AB5 600,000 3.5
SOCIETE GENERALE 532,540 3.1
GRANDEUR PEAK INTERNATIONAL 369,294 2.1
GRANDEUR PEAK GLOBAL, OPPORTUNITIES 284,857 1.6
MERRILL LYNCH PROF CLEAR CORP 269,446 1.6
STATE STREET BANK & TRUST COM., BOSTON 225,000 1.3
LUNDMARK, ANDERS 202,708 1.2
DANICA PENSION 178,898 1.0
SYNSKADADES STIFTELSE 172,201 1.0
ÖHMAN HJÄRT- LUNGFOND 165,000 1.0
NORTAL CAPITAL AB 150,000 0.9
ML, PIERCE, FENNER & SMITH INC 147,414 0.9
PERSSON, TOBIAS 146,121 0.8
CONSENSUS SMÅBOLAG 145,000 0.8
SVENSKA HANDELSBANKEN MARKETS 140,000 0.8
TOTAL, 20 LARGEST SHAREHOLDERS 9,875,613 56.7
Other shareholders 7,536,229 43.3
TOTAL 17,411,842 100
5 Owned by Moberg Pharma’s CEO, Peter Wolpert
MOBERG PHARMA AB (PUBL) 556697-7426 YEAR-END REPORT 2016
14
OPTIONS On May 18, 2016, the Annual General Meeting of Moberg Pharma AB decided to implement a directed issue of 428,000 warrants (equal to 428,000 shares) with the company’s wholly owned subsidiary Moberg Derma Incentives AB and to introduce the employee stock option scheme 2016:1. As part of this employee stock option scheme, 428,000 stock options were allotted. The terms and conditions of the employee stock option scheme are the same as for the employee stock option scheme 2015:1 with the following exceptions: options in the 2016:1 scheme vest on June 30, 2019 at the earliest, the exercise price is SEK 42.97 per option, and the last day for subscription is December 31, 2020. A description of the terms and conditions of the employee stock option scheme 2015:1 can be found in the 2015 Annual Report on page 43.
In February 2016, 305,643 warrants previously reserved to cover costs for future social security contributions were canceled, along with options issued to employees who left before the options were vested.
As of December 31, 2016, there were a total of 851,960 warrants outstanding. If all warrants were exercised for shares, the number of shares would increase by 866,420, from 17,411,842 shares at the end of the period to 18,278,262.
ORGANIZATION As of December 31, 2016, the Moberg Pharma Group had 37 employees, of whom 68% were women. Of these, 27 were employed in the Parent Company, of whom 70% were women.
PARENT COMPANY Moberg Pharma AB (Publ), Corp. Reg. No. 556697-7426, is the Parent Company of the Group. Group operations are conducted primarily in the Parent Company (in addition to the sales organization in the US) and comprise research and development, sales and marketing, and administrative functions. Parent Company revenue in 2016 was SEK 103.3 million (106.5). Operating expenses, excluding the cost of goods sold, amounted to SEK 64.3 million (61.9), while profit after financial items was SEK 18.1 million (20.1). Cash and cash equivalents totaled SEK 72.4 million (21.5) at the end of the period.
RISK FACTORS Commercialization and development of pharmaceuticals are capital-intensive activities exposed to significant risks. Risk factors considered of particular significance for Moberg Pharma’s future development are linked to competitors and pricing, production, partners' and distributors' performance, the results of clinical trials, regulatory actions, product liability and insurance, patents and trademarks, key personnel, sensitivity to economic fluctuations, future capital requirements, and financial risk factors. A description of these risks can be found in the company's 2015 Annual Report on page 18.
Over the next 12 months, the most significant risk factors are deemed to be associated with market developments, the development of established partnerships, integration of acquisitions, and the results of clinical trials.
OUTLOOK Moberg Pharma aims to create value and generate a solid return to shareholders through profitable growth, with a long-term EBITDA margin of at least 25%. The company’s growth strategy includes organic sales growth, acquisitions/in-licensing of new products, and commercialization of development projects.
During 2017, focus will be placed on integrating acquired brands, advancing the company’s Phase 3 development programs, and supporting the company’s distributors and retailers. To enable future growth, Moberg Pharma will during the year utilize its operative cash surplus to invest mainly in the ongoing Phase 3 studies for MOB-015. The company will also further refine the commercialization plans for its pipeline assets, including deepening relations with potential commercialization partners in multiple territories.
MOBERG PHARMA AB (PUBL) 556697-7426 YEAR-END REPORT 2016
15
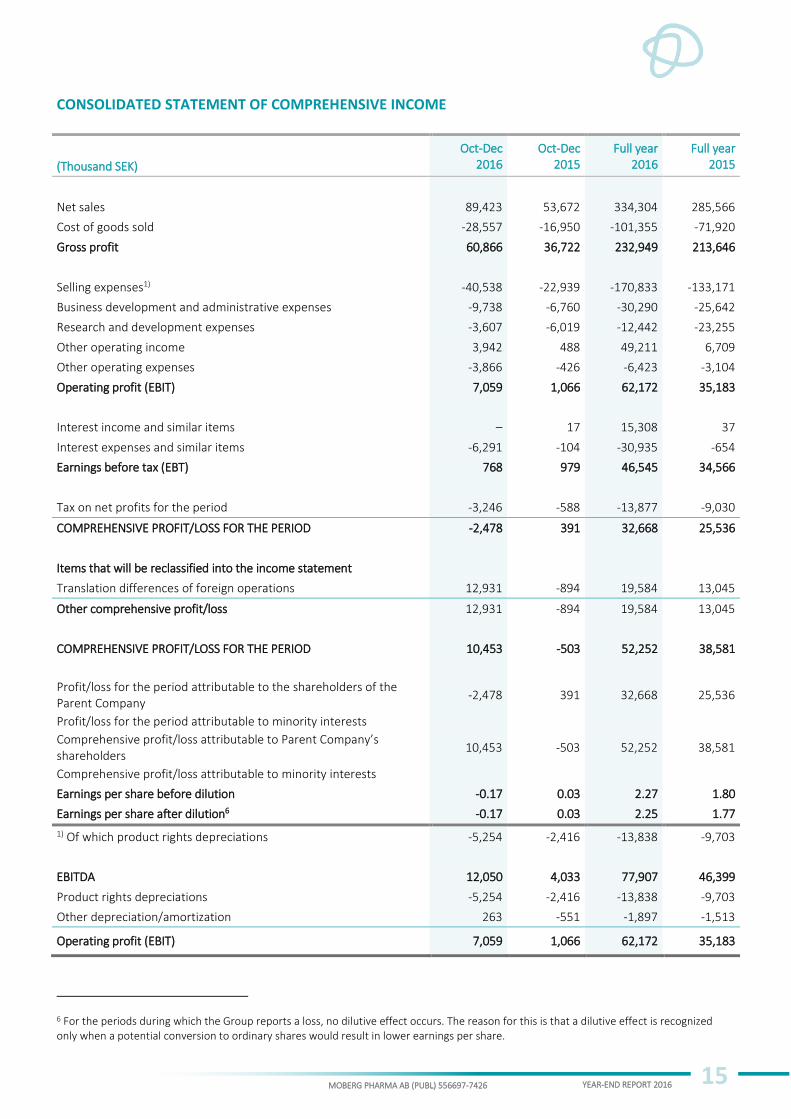
CONSOLIDATED STATEMENT OF COMPREHENSIVE INCOME
Oct-Dec Oct-Dec Full year Full year
(Thousand SEK) 2016 2015 2016 2015
Net sales 89,423 53,672 334,304 285,566
Cost of goods sold -28,557 -16,950 -101,355 -71,920
Gross profit 60,866 36,722 232,949 213,646
Selling expenses1) -40,538 -22,939 -170,833 -133,171
Business development and administrative expenses -9,738 -6,760 -30,290 -25,642
Research and development expenses -3,607 -6,019 -12,442 -23,255
Other operating income 3,942 488 49,211 6,709
Other operating expenses -3,866 -426 -6,423 -3,104
Operating profit (EBIT) 7,059 1,066 62,172 35,183
Interest income and similar items – 17 15,308 37
Interest expenses and similar items -6,291 -104 -30,935 -654
Earnings before tax (EBT) 768 979 46,545 34,566
Tax on net profits for the period -3,246 -588 -13,877 -9,030
COMPREHENSIVE PROFIT/LOSS FOR THE PERIOD -2,478 391 32,668 25,536
Items that will be reclassified into the income statement
Translation differences of foreign operations 12,931 -894 19,584 13,045
Other comprehensive profit/loss 12,931 -894 19,584 13,045
COMPREHENSIVE PROFIT/LOSS FOR THE PERIOD 10,453 -503 52,252 38,581
Profit/loss for the period attributable to the shareholders of the Parent Company
-2,478 391 32,668 25,536
Profit/loss for the period attributable to minority interests
Comprehensive profit/loss attributable to Parent Company’s shareholders
10,453 -503 52,252 38,581
Comprehensive profit/loss attributable to minority interests
Earnings per share before dilution -0.17 0.03 2.27 1.80
Earnings per share after dilution6 -0.17 0.03 2.25 1.77
1) Of which product rights depreciations -5,254 -2,416 -13,838 -9,703
EBITDA 12,050 4,033 77,907 46,399
Product rights depreciations -5,254 -2,416 -13,838 -9,703
Other depreciation/amortization 263 -551 -1,897 -1,513
Operating profit (EBIT) 7,059 1,066 62,172 35,183
6 For the periods during which the Group reports a loss, no dilutive effect occurs. The reason for this is that a dilutive effect is recognized only when a potential conversion to ordinary shares would result in lower earnings per share.
MOBERG PHARMA AB (PUBL) 556697-7426 YEAR-END REPORT 2016
16
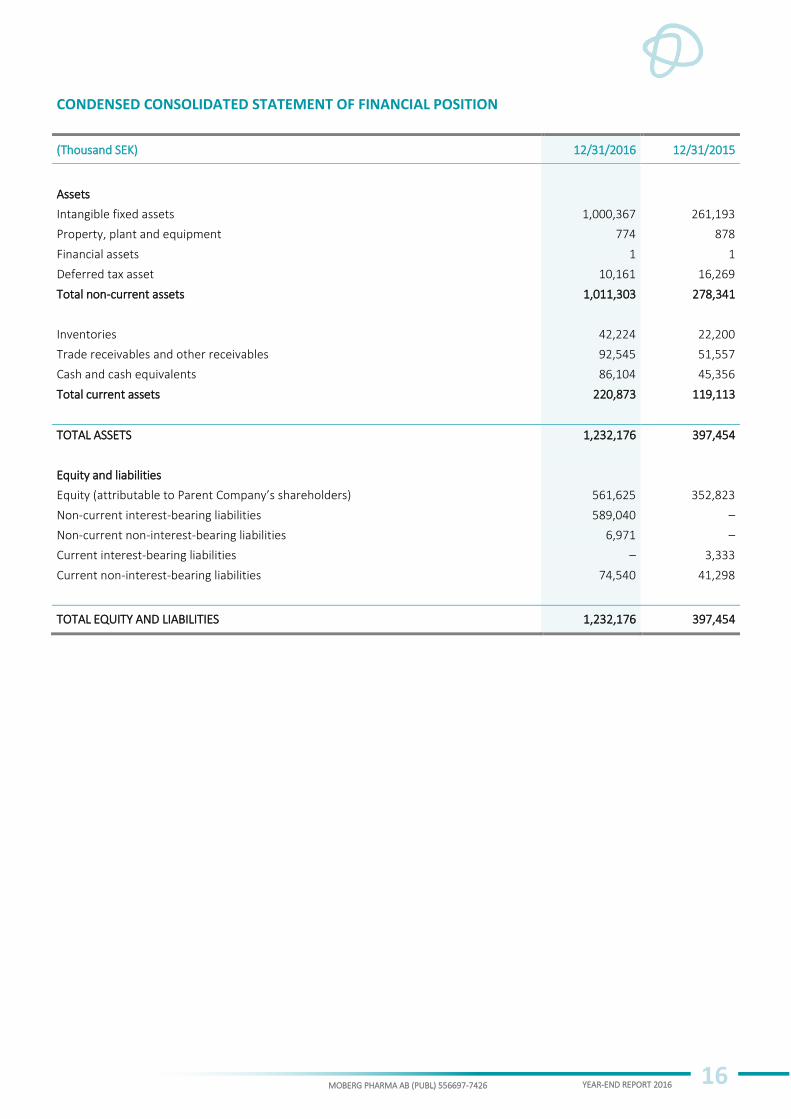
CONDENSED CONSOLIDATED STATEMENT OF FINANCIAL POSITION
(Thousand SEK) 12/31/2016 12/31/2015
Assets
Intangible fixed assets 1,000,367 261,193
Property, plant and equipment 774 878
Financial assets 1 1
Deferred tax asset 10,161 16,269
Total non-current assets 1,011,303 278,341
Inventories 42,224 22,200
Trade receivables and other receivables 92,545 51,557
Cash and cash equivalents 86,104 45,356
Total current assets 220,873 119,113
TOTAL ASSETS 1,232,176 397,454
Equity and liabilities
Equity (attributable to Parent Company’s shareholders) 561,625 352,823
Non-current interest-bearing liabilities 589,040 –
Non-current non-interest-bearing liabilities 6,971 –
Current interest-bearing liabilities – 3,333
Current non-interest-bearing liabilities 74,540 41,298
TOTAL EQUITY AND LIABILITIES 1,232,176 397,454
MOBERG PHARMA AB (PUBL) 556697-7426 YEAR-END REPORT 2016
17
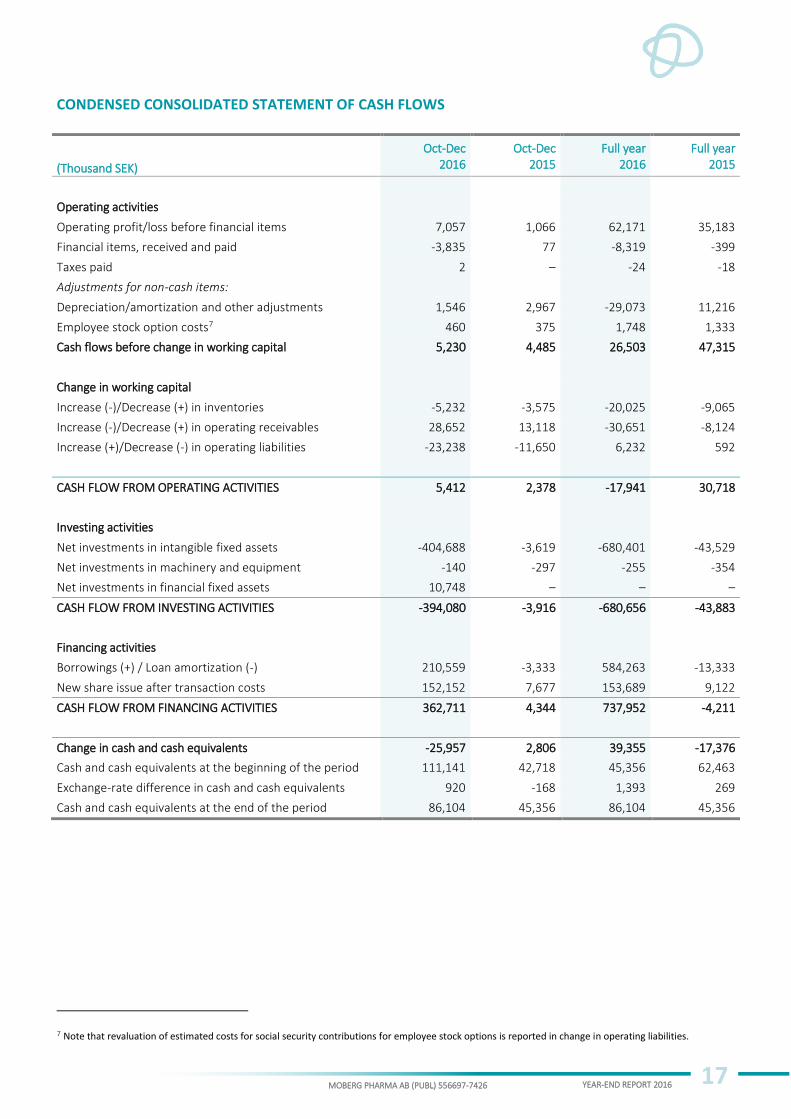
CONDENSED CONSOLIDATED STATEMENT OF CASH FLOWS
Oct-Dec Oct-Dec Full year Full year
(Thousand SEK) 2016 2015 2016 2015
Operating activities
Operating profit/loss before financial items 7,057 1,066 62,171 35,183
Financial items, received and paid -3,835 77 -8,319 -399
Taxes paid 2 – -24 -18
Adjustments for non-cash items:
Depreciation/amortization and other adjustments 1,546 2,967 -29,073 11,216
Employee stock option costs7 460 375 1,748 1,333
Cash flows before change in working capital 5,230 4,485 26,503 47,315
Change in working capital
Increase (-)/Decrease (+) in inventories -5,232 -3,575 -20,025 -9,065
Increase (-)/Decrease (+) in operating receivables 28,652 13,118 -30,651 -8,124
Increase (+)/Decrease (-) in operating liabilities -23,238 -11,650 6,232 592
CASH FLOW FROM OPERATING ACTIVITIES 5,412 2,378 -17,941 30,718
Investing activities
Net investments in intangible fixed assets -404,688 -3,619 -680,401 -43,529
Net investments in machinery and equipment -140 -297 -255 -354
Net investments in financial fixed assets 10,748 – – –
CASH FLOW FROM INVESTING ACTIVITIES -394,080 -3,916 -680,656 -43,883
Financing activities
Borrowings (+) / Loan amortization (-) 210,559 -3,333 584,263 -13,333
New share issue after transaction costs 152,152 7,677 153,689 9,122
CASH FLOW FROM FINANCING ACTIVITIES 362,711 4,344 737,952 -4,211
Change in cash and cash equivalents -25,957 2,806 39,355 -17,376
Cash and cash equivalents at the beginning of the period 111,141 42,718 45,356 62,463
Exchange-rate difference in cash and cash equivalents 920 -168 1,393 269
Cash and cash equivalents at the end of the period 86,104 45,356 86,104 45,356
7 Note that revaluation of estimated costs for social security contributions for employee stock options is reported in change in operating liabilities.
MOBERG PHARMA AB (PUBL) 556697-7426 YEAR-END REPORT 2016
18
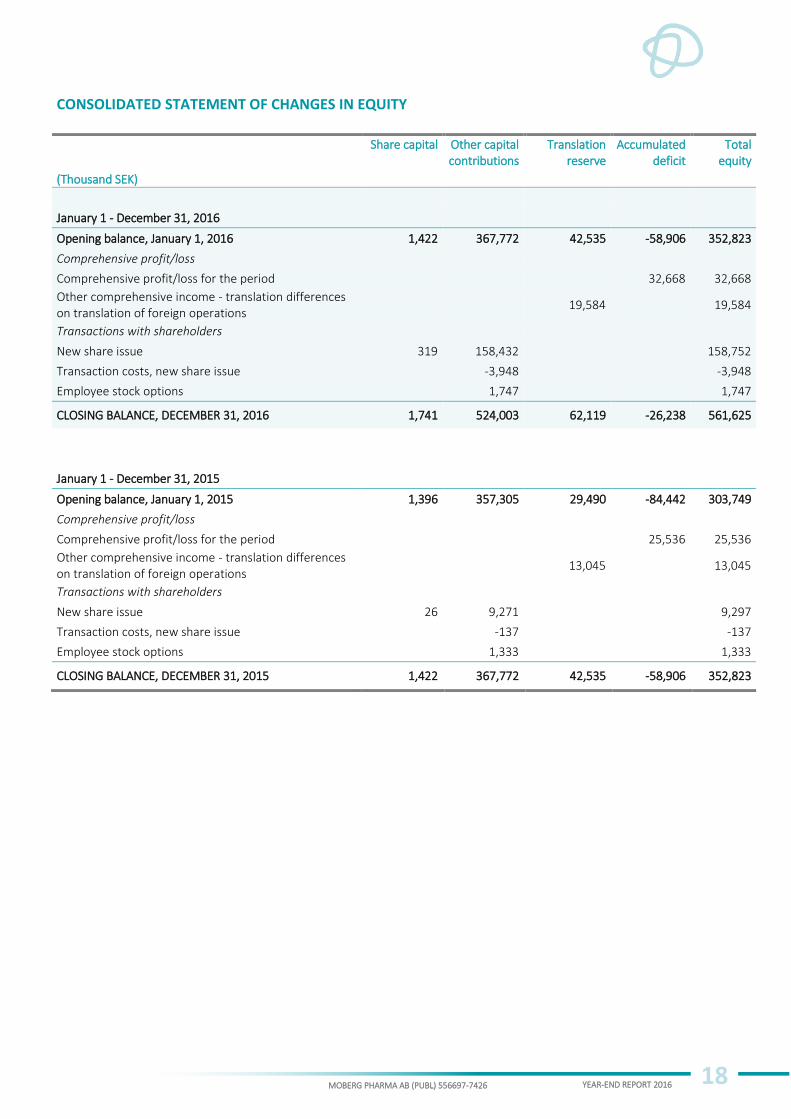
CONSOLIDATED STATEMENT OF CHANGES IN EQUITY
(Thousand SEK)
Share capital Other capital contributions
Translation reserve
Accumulated deficit
Total equity
January 1 - December 31, 2016
Opening balance, January 1, 2016 1,422 367,772 42,535 -58,906 352,823
Comprehensive profit/loss
Comprehensive profit/loss for the period 32,668 32,668
Other comprehensive income - translation differences on translation of foreign operations
19,584 19,584
Transactions with shareholders
New share issue 319 158,432 158,752
Transaction costs, new share issue -3,948 -3,948
Employee stock options 1,747 1,747
CLOSING BALANCE, DECEMBER 31, 2016 1,741 524,003 62,119 -26,238 561,625
January 1 - December 31, 2015
Opening balance, January 1, 2015 1,396 357,305 29,490 -84,442 303,749
Comprehensive profit/loss
Comprehensive profit/loss for the period 25,536 25,536
Other comprehensive income - translation differences on translation of foreign operations
13,045 13,045
Transactions with shareholders
New share issue 26 9,271 9,297
Transaction costs, new share issue -137 -137
Employee stock options 1,333 1,333
CLOSING BALANCE, DECEMBER 31, 2015 1,422 367,772 42,535 -58,906 352,823
MOBERG PHARMA AB (PUBL) 556697-7426 YEAR-END REPORT 2016
19
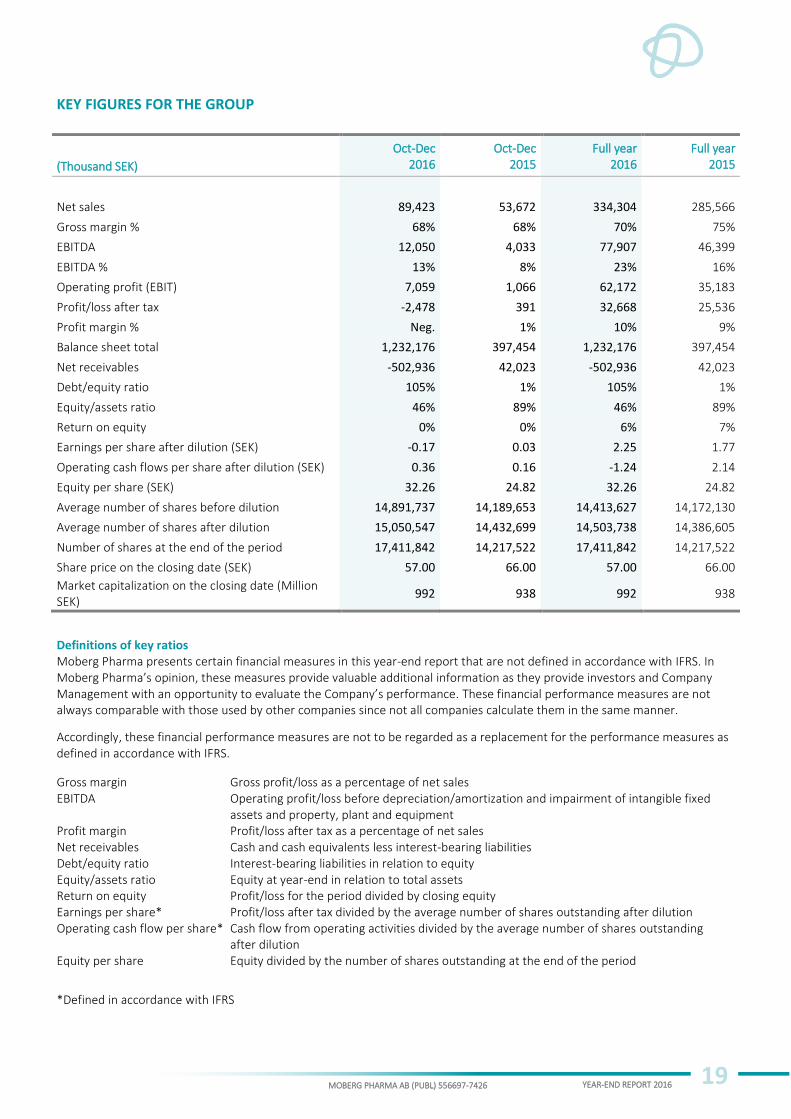
KEY FIGURES FOR THE GROUP
Oct-Dec Oct-Dec Full year Full year
(Thousand SEK) 2016 2015 2016 2015
Net sales 89,423 53,672 334,304 285,566
Gross margin % 68% 68% 70% 75%
EBITDA 12,050 4,033 77,907 46,399
EBITDA % 13% 8% 23% 16%
Operating profit (EBIT) 7,059 1,066 62,172 35,183
Profit/loss after tax -2,478 391 32,668 25,536
Profit margin % Neg. 1% 10% 9%
Balance sheet total 1,232,176 397,454 1,232,176 397,454
Net receivables -502,936 42,023 -502,936 42,023
Debt/equity ratio 105% 1% 105% 1%
Equity/assets ratio 46% 89% 46% 89%
Return on equity 0% 0% 6% 7%
Earnings per share after dilution (SEK) -0.17 0.03 2.25 1.77
Operating cash flows per share after dilution (SEK) 0.36 0.16 -1.24 2.14
Equity per share (SEK) 32.26 24.82 32.26 24.82
Average number of shares before dilution 14,891,737 14,189,653 14,413,627 14,172,130
Average number of shares after dilution 15,050,547 14,432,699 14,503,738 14,386,605
Number of shares at the end of the period 17,411,842 14,217,522 17,411,842 14,217,522
Share price on the closing date (SEK) 57.00 66.00 57.00 66.00
Market capitalization on the closing date (Million SEK)
992 938 992 938
Definitions of key ratios Moberg Pharma presents certain financial measures in this year-end report that are not defined in accordance with IFRS. In Moberg Pharma’s opinion, these measures provide valuable additional information as they provide investors and Company Management with an opportunity to evaluate the Company’s performance. These financial performance measures are not always comparable with those used by other companies since not all companies calculate them in the same manner.
Accordingly, these financial performance measures are not to be regarded as a replacement for the performance measures as defined in accordance with IFRS.
Gross margin Gross profit/loss as a percentage of net sales EBITDA Operating profit/loss before depreciation/amortization and impairment of intangible fixed assets and property, plant and equipment Profit margin Profit/loss after tax as a percentage of net sales Net receivables Cash and cash equivalents less interest-bearing liabilities Debt/equity ratio Interest-bearing liabilities in relation to equity Equity/assets ratio Equity at year-end in relation to total assets Return on equity Profit/loss for the period divided by closing equity Earnings per share* Profit/loss after tax divided by the average number of shares outstanding after dilution Operating cash flow per share* Cash flow from operating activities divided by the average number of shares outstanding after dilution Equity per share Equity divided by the number of shares outstanding at the end of the period
*Defined in accordance with IFRS
MOBERG PHARMA AB (PUBL) 556697-7426 YEAR-END REPORT 2016
20
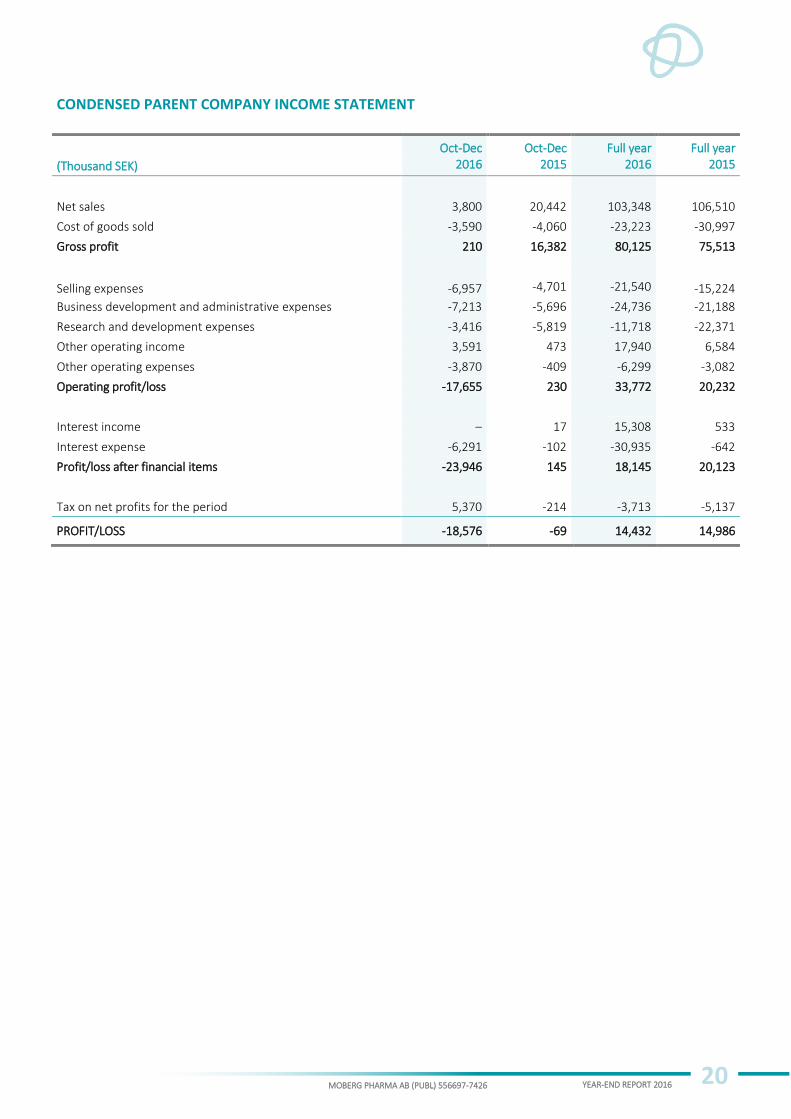
CONDENSED PARENT COMPANY INCOME STATEMENT
Oct-Dec Oct-Dec Full year Full year
(Thousand SEK) 2016 2015 2016 2015
Net sales 3,800 20,442 103,348 106,510
Cost of goods sold -3,590 -4,060 -23,223 -30,997
Gross profit 210 16,382 80,125 75,513
Selling expenses -6,957 -4,701 -21,540 -15,224
Business development and administrative expenses -7,213 -5,696 -24,736 -21,188
Research and development expenses -3,416 -5,819 -11,718 -22,371
Other operating income 3,591 473 17,940 6,584
Other operating expenses -3,870 -409 -6,299 -3,082
Operating profit/loss -17,655 230 33,772 20,232
Interest income – 17 15,308 533
Interest expense -6,291 -102 -30,935 -642
Profit/loss after financial items -23,946 145 18,145 20,123
Tax on net profits for the period 5,370 -214 -3,713 -5,137
PROFIT/LOSS -18,576 -69 14,432 14,986
MOBERG PHARMA AB (PUBL) 556697-7426 YEAR-END REPORT 2016
21
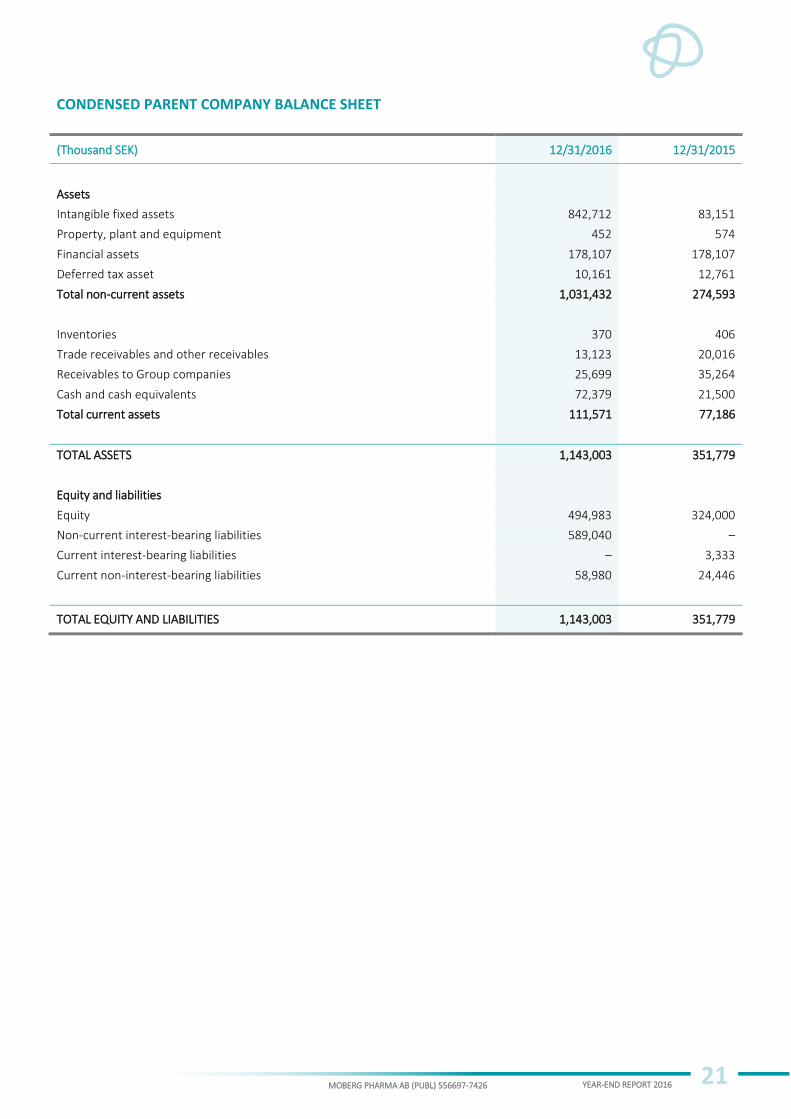
CONDENSED PARENT COMPANY BALANCE SHEET
(Thousand SEK) 12/31/2016 12/31/2015
Assets
Intangible fixed assets 842,712 83,151
Property, plant and equipment 452 574
Financial assets 178,107 178,107
Deferred tax asset 10,161 12,761
Total non-current assets 1,031,432 274,593
Inventories 370 406
Trade receivables and other receivables 13,123 20,016
Receivables to Group companies 25,699 35,264
Cash and cash equivalents 72,379 21,500
Total current assets 111,571 77,186
TOTAL ASSETS 1,143,003 351,779
Equity and liabilities
Equity 494,983 324,000
Non-current interest-bearing liabilities 589,040 –
Current interest-bearing liabilities – 3,333
Current non-interest-bearing liabilities 58,980 24,446
TOTAL EQUITY AND LIABILITIES 1,143,003 351,779
MOBERG PHARMA AB (PUBL) 556697-7426 YEAR-END REPORT 2016
22
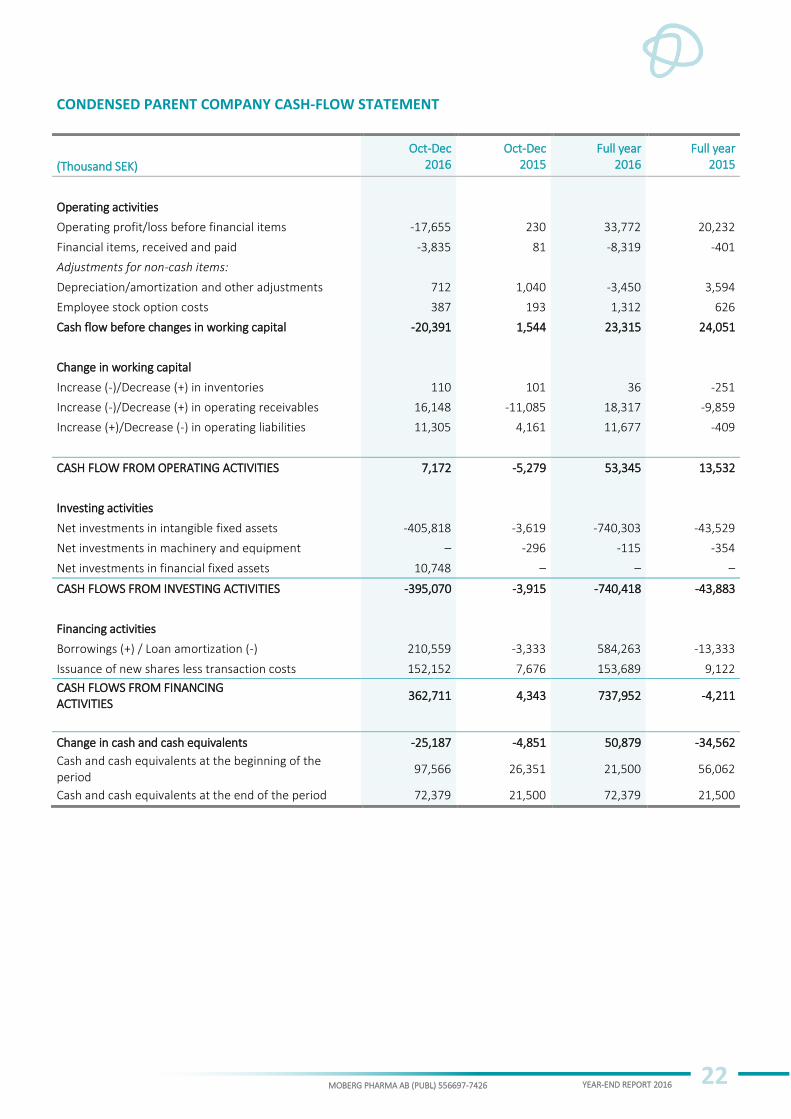
CONDENSED PARENT COMPANY CASH-FLOW STATEMENT
Oct-Dec Oct-Dec Full year Full year
(Thousand SEK) 2016 2015 2016 2015
Operating activities
Operating profit/loss before financial items -17,655 230 33,772 20,232
Financial items, received and paid -3,835 81 -8,319 -401
Adjustments for non-cash items:
Depreciation/amortization and other adjustments 712 1,040 -3,450 3,594
Employee stock option costs 387 193 1,312 626
Cash flow before changes in working capital -20,391 1,544 23,315 24,051
Change in working capital
Increase (-)/Decrease (+) in inventories 110 101 36 -251
Increase (-)/Decrease (+) in operating receivables 16,148 -11,085 18,317 -9,859
Increase (+)/Decrease (-) in operating liabilities 11,305 4,161 11,677 -409
CASH FLOW FROM OPERATING ACTIVITIES 7,172 -5,279 53,345 13,532
Investing activities
Net investments in intangible fixed assets -405,818 -3,619 -740,303 -43,529
Net investments in machinery and equipment – -296 -115 -354
Net investments in financial fixed assets 10,748 – – –
CASH FLOWS FROM INVESTING ACTIVITIES -395,070 -3,915 -740,418 -43,883
Financing activities
Borrowings (+) / Loan amortization (-) 210,559 -3,333 584,263 -13,333
Issuance of new shares less transaction costs 152,152 7,676 153,689 9,122
CASH FLOWS FROM FINANCING ACTIVITIES
362,711 4,343 737,952 -4,211
Change in cash and cash equivalents -25,187 -4,851 50,879 -34,562
Cash and cash equivalents at the beginning of the period
97,566 26,351 21,500 56,062
Cash and cash equivalents at the end of the period 72,379 21,500 72,379 21,500
MOBERG PHARMA AB (PUBL) 556697-7426 YEAR-END REPORT 2016
23
ACCOUNTING AND VALUATION PRINCIPLES The year-end report was prepared in accordance with IAS 34 and the Swedish Annual Accounts Act. The consolidated financial statements were, like the annual accounts for 2015, prepared in accordance with the International Financial Reporting Standards (IFRS) as adopted by the EU and the Swedish Annual Accounts Act. . The Parent Company accounts have been prepared in accordance with Swedish Annual Accounts Act and the Recommendation RFR 2 of the Swedish Financial Reporting Board, Financial Statements for Legal Entities.
The Group applies the same accounting policies and valuation methods as described in the 2015 Annual Report. A number of new or revised standards, interpretations and improvements have been adopted by the EU and will be adopted effective January 1, 2016. These changes have not had any material effect on the Group.
Amounts are presented in Swedish kronor and rounded to the nearest thousand unless otherwise stated. Rounding to the nearest thousand may mean that certain amounts do not match when added up. MSEK stands for million Swedish kronor. Amounts and figures in parentheses are comparative figures from the preceding year.
SEGMENT REPORTING Moberg Pharma’s operations comprise only one area of operation, which is the development and commercialization of medical products. The consolidated statements of comprehensive income and statement of financial position as a whole comprise one operating segment.
RELATED PARTY TRANSACTIONS No material changes have occurred in relations and transactions with related parties.
FINANCIAL INSTRUMENTS With the exception of bonds, the fair value of financial instruments approximates to their carrying amount as of December 31, 2016. The fair value of bonds, according to Level 2 of the fair value hierarchy, totaled approx. SEK 626 million (based on their liquid trading price) as of December 31, 2016. Purchase considerations are valued according to Level 3 of the fair value hierarchy and totaled approx. SEK 20 million as of December 31, 2016.
MOBERG PHARMA AB (PUBL) 556697-7426 YEAR-END REPORT 2016
24
FINANCIAL CALENDAR
Interim report for January – March 2017 May 9, 2017
Interim report for January – June 2017 August 8, 2017
Interim report for January – September 2017 November 13, 2017
The Annual General Meeting for Moberg Pharma will be held on May 16, 2017 at 5:00 PM at the Company’s premises. The deadline for stockholders to request to have agenda items transacted at the Annual Stockholders’ Meeting is March 28, 2017. The Annual Report will be made available no later than April 17 at the Company’s website www.mobergpharma.com.
FOR FURTHER DETAILS, PLEASE CONTACT: Peter Wolpert, CEO, Tel. 08-522 307 00, [email protected] Anna Ljung, CFO, Tel. 08-522 307 01, [email protected] For more information about Moberg Pharma's activities, please refer to the Company’s website, www.mobergpharma.com. The year-end report has not been reviewed by the Company’s auditors.
DECLARATION The undersigned hereby declare that the year-end report provides a true and fair overview of the operations, financial position and results of the Parent Company and Group, as well as a fair description of significant risks and uncertainties faced by the Parent Company and Group companies.
Bromma, Sweden, February 13, 2017
Thomas Eklund Wenche Rolfsen Torbjörn Koivisto Chairman Board Member Board Member Thomas Thomsen Geert Cauwenbergh Mattias Klintemar Board Member Board Member Board Member Peter Wolpert CEO