Embed Size (px)
Citation preview
Indiana’s Global ExportsYear-End Report for 2005
Produced by the Kelley School of Businessat Indiana University
March 2006
A Report for the IndIana EconoMIc dEvElopMEnt corporatIon
iiIndiana’s Global Exports: Year-End Report for 2005
Table of ConTenTs . . . . . . . . . . . . . . . . . . . . . . . . . . . . . . . . . . . . . . . . . . . . . . . ii
exeCuTive summary . . . . . . . . . . . . . . . . . . . . . . . . . . . . . . . . . . . . . . . . . . . . . . 1
Trade ouTlook for 2006 . . . . . . . . . . . . . . . . . . . . . . . . . . . . . . . . . . . . . . . . . . 2GDP Growth . . . . . . . . . . . . . . . . . . . . . . . . . . . . . . . . . . . . . . . . . . . . . . . . . . . . . . . . . . . . . . . . 2Exchange Rates . . . . . . . . . . . . . . . . . . . . . . . . . . . . . . . . . . . . . . . . . . . . . . . . . . . . . . . . . . . . . . . 2Momentum and Shocks . . . . . . . . . . . . . . . . . . . . . . . . . . . . . . . . . . . . . . . . . . . . . . . . . . . . . . . . 3
indiana’s exporTs in 2005 . . . . . . . . . . . . . . . . . . . . . . . . . . . . . . . . . . . . . . . . . 4Midwest Comparison . . . . . . . . . . . . . . . . . . . . . . . . . . . . . . . . . . . . . . . . . . . . . . . . . . . . . . . . . . 5Indiana’s Export Destinations . . . . . . . . . . . . . . . . . . . . . . . . . . . . . . . . . . . . . . . . . . . . . . . . . . . . 8
indiana’s exporT indusTries . . . . . . . . . . . . . . . . . . . . . . . . . . . . . . . . . . . . . . . 14Vehicles . . . . . . . . . . . . . . . . . . . . . . . . . . . . . . . . . . . . . . . . . . . . . . . . . . . . . . . . . . . . . . . . . . . . 16Machinery . . . . . . . . . . . . . . . . . . . . . . . . . . . . . . . . . . . . . . . . . . . . . . . . . . . . . . . . . . . . . . . . . . 16Electrical Machinery . . . . . . . . . . . . . . . . . . . . . . . . . . . . . . . . . . . . . . . . . . . . . . . . . . . . . . . . . . 16Organic Chemicals . . . . . . . . . . . . . . . . . . . . . . . . . . . . . . . . . . . . . . . . . . . . . . . . . . . . . . . . . . 17Pharmaceutical Products . . . . . . . . . . . . . . . . . . . . . . . . . . . . . . . . . . . . . . . . . . . . . . . . . . . . . . 17Optic/Medical/Surgical Instruments . . . . . . . . . . . . . . . . . . . . . . . . . . . . . . . . . . . . . . . . . . . . . . 18Plastics . . . . . . . . . . . . . . . . . . . . . . . . . . . . . . . . . . . . . . . . . . . . . . . . . . . . . . . . . . . . . . . . . . . . 18Miscellaneous Chemicals . . . . . . . . . . . . . . . . . . . . . . . . . . . . . . . . . . . . . . . . . . . . . . . . . . . . . . 18Iron and Steel . . . . . . . . . . . . . . . . . . . . . . . . . . . . . . . . . . . . . . . . . . . . . . . . . . . . . . . . . . . . . . . 19Iron and Steel Products . . . . . . . . . . . . . . . . . . . . . . . . . . . . . . . . . . . . . . . . . . . . . . . . . . . . . . . 19
appendix . . . . . . . . . . . . . . . . . . . . . . . . . . . . . . . . . . . . . . . . . . . . . . . . . . . . . . 20
Table of ConTenTs
Indiana Business Research Center
Indiana’s Global Exports: Year-End Report for 2005
Prepared by the Indiana Business Research Center and Kelley School of Business at Indiana University, with support from the Indiana Economic Development Corporation and CIBER. All the data used in this report, unless specified otherwise, were published by the U.S. Census Bureau and distributed by Global Trade Information Services via the World Trade Atlas, U.S. State Export Edition. Direct questions to the Indiana Business Research Center: [email protected] or 317-274-2979.
Prepared by
Dr. Larry Davidson, Project Director, Professor of Business Economics & Public Policy
Dr. Jerry Conover, IBRC Director
Amber Kostelac, IBRC Analyst
Carol O. Rogers, IBRC Associate Director
Joan Ketcham, IBRC Database Technician
Rachel Justis, IBRC Analyst
Support comes from NIndiana Economic Development Corporation
NIndiana University Center for International Business Education and Research
�Indiana’s Global Exports: Year-End Report for 2005
Indiana exports reached $5.5 billion in the fourth quarter of 2005 pushing the annual total to a record high $21.5 billion. The 19 .8 percent
annualized increase over the third quarter led to a year in which Indiana exports increased by 12 .4 percent—much higher than the approximately 7 .7 percent annual average achieved since 1996 . The United States’ exports increased by 10 .6 percent in 2005 . Indiana’s rank improved in 2005, and the state went from being the 13th largest exporter in 2004 to the 11th largest in 2005 .
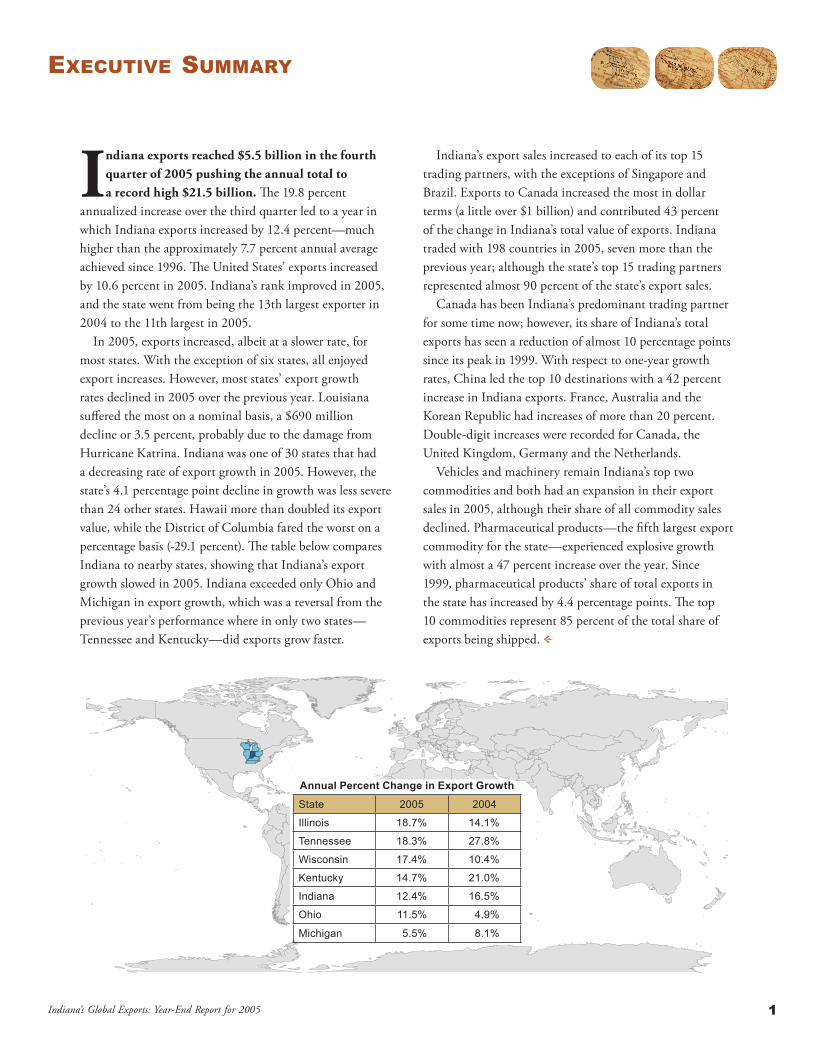
In 2005, exports increased, albeit at a slower rate, for most states . With the exception of six states, all enjoyed export increases . However, most states’ export growth rates declined in 2005 over the previous year . Louisiana suffered the most on a nominal basis, a $690 million decline or 3 .5 percent, probably due to the damage from Hurricane Katrina . Indiana was one of 30 states that had a decreasing rate of export growth in 2005 . However, the state’s 4 .1 percentage point decline in growth was less severe than 24 other states . Hawaii more than doubled its export value, while the District of Columbia fared the worst on a percentage basis (-29 .1 percent) . The table below compares Indiana to nearby states, showing that Indiana’s export growth slowed in 2005 . Indiana exceeded only Ohio and Michigan in export growth, which was a reversal from the previous year’s performance where in only two states—Tennessee and Kentucky—did exports grow faster .
Indiana’s export sales increased to each of its top 15 trading partners, with the exceptions of Singapore and Brazil . Exports to Canada increased the most in dollar terms (a little over $1 billion) and contributed 43 percent of the change in Indiana’s total value of exports . Indiana traded with 198 countries in 2005, seven more than the previous year; although the state’s top 15 trading partners represented almost 90 percent of the state’s export sales .
Canada has been Indiana’s predominant trading partner for some time now; however, its share of Indiana’s total exports has seen a reduction of almost 10 percentage points since its peak in 1999 . With respect to one-year growth rates, China led the top 10 destinations with a 42 percent increase in Indiana exports . France, Australia and the Korean Republic had increases of more than 20 percent . Double-digit increases were recorded for Canada, the United Kingdom, Germany and the Netherlands .
Vehicles and machinery remain Indiana’s top two commodities and both had an expansion in their export sales in 2005, although their share of all commodity sales declined . Pharmaceutical products—the fifth largest export commodity for the state—experienced explosive growth with almost a 47 percent increase over the year . Since 1999, pharmaceutical products’ share of total exports in the state has increased by 4 .4 percentage points . The top 10 commodities represent 85 percent of the total share of exports being shipped .
exeCuTive summary
Annual Percent Change in Export Growth
State 2005 2004
Illinois 18.7% 14.1%
Tennessee 18.3% 27.8%
Wisconsin 17.4% 10.4%
Kentucky 14.7% 21.0%
Indiana 12.4% 16.5%
Ohio 11.5% 4.9%
Michigan 5.5% 8.1%
2Indiana’s Global Exports: Year-End Report for 2005
As the world economic growth cycle picked up in 2005, so did Indiana exports. We expect another excellent year for world growth in 2006 and
Indiana stands to benefit . It is clearly reasonable to believe that Indiana exports could increase by another $2 billion or more in 2006 .
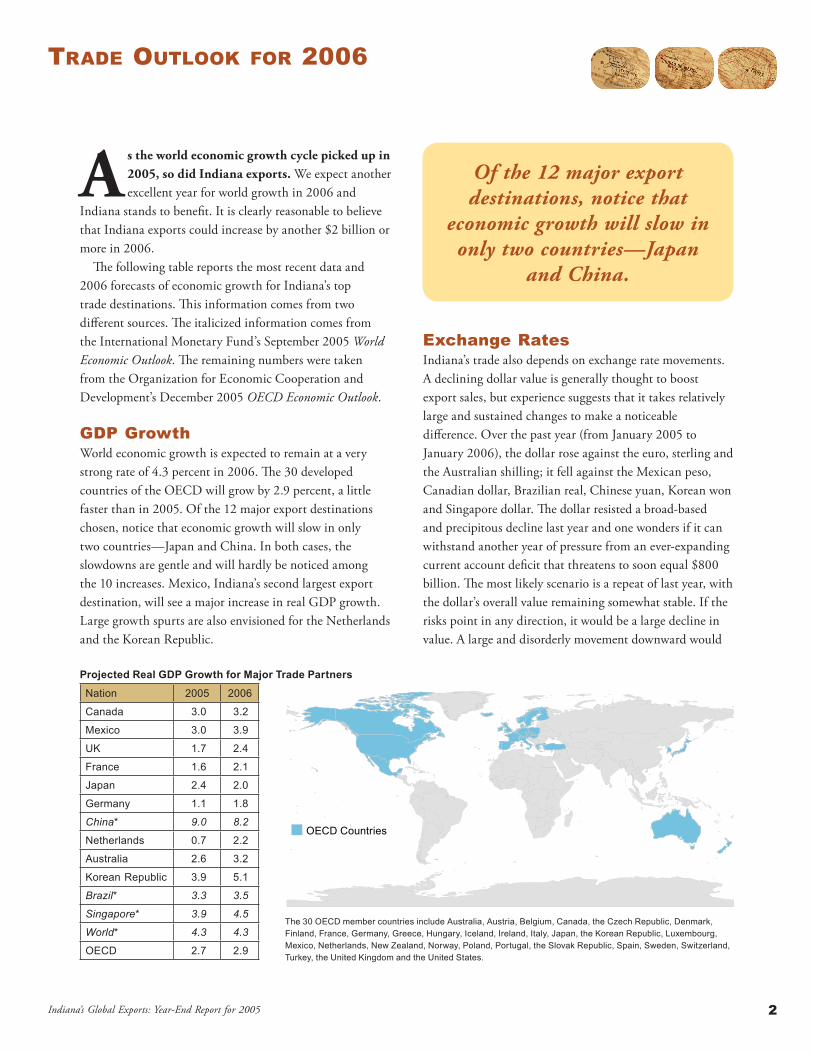
The following table reports the most recent data and 2006 forecasts of economic growth for Indiana’s top trade destinations . This information comes from two different sources . The italicized information comes from the International Monetary Fund’s September 2005 World Economic Outlook . The remaining numbers were taken from the Organization for Economic Cooperation and Development’s December 2005 OECD Economic Outlook .
GDP GrowthWorld economic growth is expected to remain at a very strong rate of 4 .3 percent in 2006 . The 30 developed countries of the OECD will grow by 2 .9 percent, a little faster than in 2005 . Of the 12 major export destinations chosen, notice that economic growth will slow in only two countries—Japan and China . In both cases, the slowdowns are gentle and will hardly be noticed among the 10 increases . Mexico, Indiana’s second largest export destination, will see a major increase in real GDP growth . Large growth spurts are also envisioned for the Netherlands and the Korean Republic .
Exchange RatesIndiana’s trade also depends on exchange rate movements . A declining dollar value is generally thought to boost export sales, but experience suggests that it takes relatively large and sustained changes to make a noticeable difference . Over the past year (from January 2005 to January 2006), the dollar rose against the euro, sterling and the Australian shilling; it fell against the Mexican peso, Canadian dollar, Brazilian real, Chinese yuan, Korean won and Singapore dollar . The dollar resisted a broad-based and precipitous decline last year and one wonders if it can withstand another year of pressure from an ever-expanding current account deficit that threatens to soon equal $800 billion . The most likely scenario is a repeat of last year, with the dollar’s overall value remaining somewhat stable . If the risks point in any direction, it would be a large decline in value . A large and disorderly movement downward would
Trade ouTlook for 2006
Projected Real GDP Growth for Major Trade Partners
Nation 2005 2006
Canada 3.0 3.2
Mexico 3.0 3.9
UK 1.7 2.4
France 1.6 2.1
Japan 2.4 2.0
Germany 1.1 1.8
China* 9.0 8.2
Netherlands 0.7 2.2
Australia 2.6 3.2
Korean Republic 3.9 5.1
Brazil* 3.3 3.5
Singapore* 3.9 4.5
World* 4.3 4.3
OECD 2.7 2.9
Of the 12 major export destinations, notice that
economic growth will slow in only two countries—Japan
and China.
OECD Countries
The 30 OECD member countries include Australia, Austria, Belgium, Canada, the Czech Republic, Denmark, Finland, France, Germany, Greece, Hungary, Iceland, Ireland, Italy, Japan, the Korean Republic, Luxembourg, Mexico, Netherlands, New Zealand, Norway, Poland, Portugal, the Slovak Republic, Spain, Sweden, Switzerland, Turkey, the United Kingdom and the United States.
�Indiana’s Global Exports: Year-End Report for 2005
not, however, necessarily bode well for export industries because it would arise in an environment of global distress .
Momentum and ShocksForecast decisions are often the result of a clash of two forces—momentum and shocks . The momentum of the world economy is clearly toward more growth . Growth has momentum because increases in one year take some time to improve employment, income and expectations of future gains in employment and income . As these improvements take root they create an environment of higher spending and production . But momentum can be overturned by predictable and unforeseeable events .
For example, momentum in the U .S . economy has generated optimism and led to large capital flows that kept the value of the dollar from declining . But should the U .S . economy encounter further trade difficulties or if our trading partners show more economic growth than predicted, capital flows could reverse themselves and push the dollar downward .
Expectations and speculation can create a bandwagon effect that could cause the dollar to plummet .
There are plenty of risks looming in the global environment that could impact world trade in 2006 . Political strains between the United States and Muslim countries could worsen and increase uncertainty . These or other factors might tip the sensitive balance in energy supply and demand, sending the cost of energy even higher . Avian flu and other natural disasters, piled on top of last
year’s global damages, would do nothing to strengthen the world’s economy and trade . Lack of progress in the World Trade Organization’s Doha Round could lead to a general slowdown in the reduction of trade barriers and the possible erection of new ones .
Every year has its own set of risks to offset the predictable implications of momentum . We see a year with strong spillovers of growth in most corners of the world, including the United States . That’s a great environment for trade to flourish .
It is clearly reasonable to believe that Indiana exports could increase by another $2
billion or more in 2006.
�Indiana’s Global Exports: Year-End Report for 2005
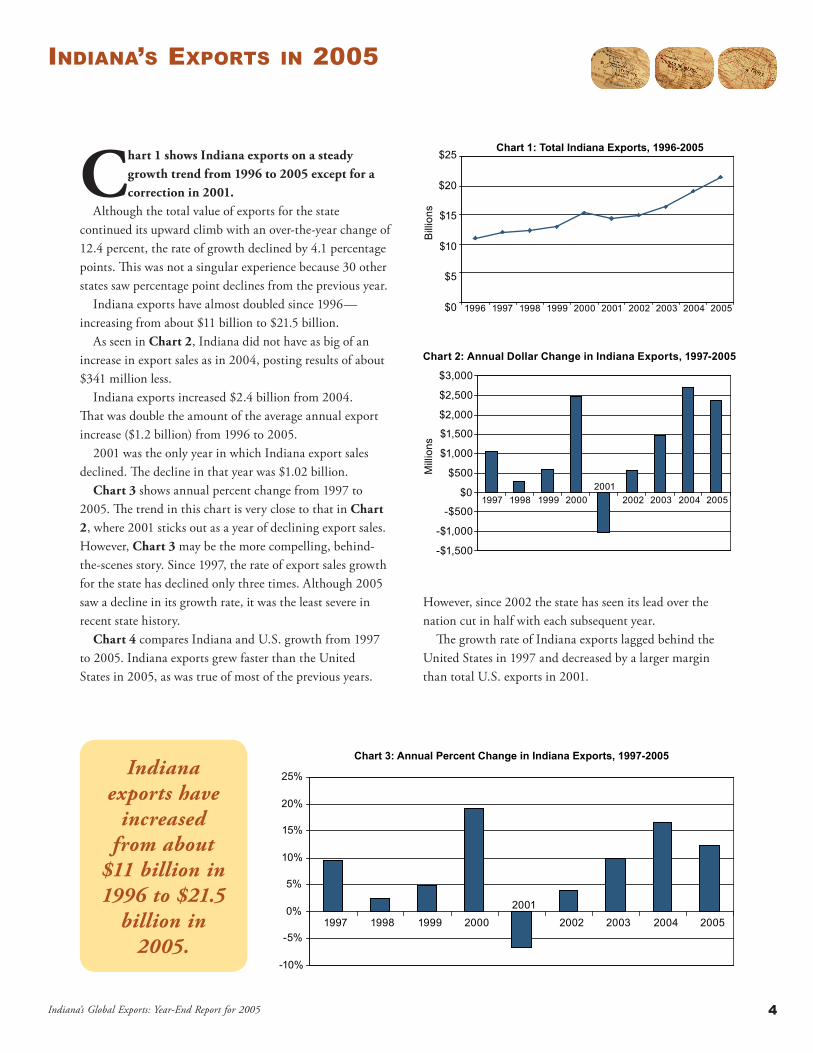
Chart 1 shows Indiana exports on a steady growth trend from 1996 to 2005 except for a correction in 2001.
Although the total value of exports for the state continued its upward climb with an over-the-year change of 12 .4 percent, the rate of growth declined by 4 .1 percentage points . This was not a singular experience because 30 other states saw percentage point declines from the previous year .
Indiana exports have almost doubled since 1996—increasing from about $11 billion to $21 .5 billion .
As seen in Chart 2, Indiana did not have as big of an increase in export sales as in 2004, posting results of about $341 million less .
Indiana exports increased $2 .4 billion from 2004 . That was double the amount of the average annual export increase ($1 .2 billion) from 1996 to 2005 .
2001 was the only year in which Indiana export sales declined . The decline in that year was $1 .02 billion .
Chart 3 shows annual percent change from 1997 to 2005 . The trend in this chart is very close to that in Chart 2, where 2001 sticks out as a year of declining export sales . However, Chart 3 may be the more compelling, behind-the-scenes story . Since 1997, the rate of export sales growth for the state has declined only three times . Although 2005 saw a decline in its growth rate, it was the least severe in recent state history .
Chart 4 compares Indiana and U .S . growth from 1997 to 2005 . Indiana exports grew faster than the United States in 2005, as was true of most of the previous years .
However, since 2002 the state has seen its lead over the nation cut in half with each subsequent year .
The growth rate of Indiana exports lagged behind the United States in 1997 and decreased by a larger margin than total U .S . exports in 2001 .
indiana’s exporTs in 2005
Chart 1: Total Indiana Exports, 1996-2005
$0
$5
$10
$15
$20
$25
1996 1997 1998 1999 2000 2001 2002 2003 2004 2005
Bill
ions
Chart 2: Annual Dollar Change in Indiana Exports, 1997-2005
-$1,500
-$1,000
-$500
$0
$500
$1,000
$1,500
$2,000
$2,500
$3,000
1997 1998 1999 20002001
2002 2003 2004 2005
Mill
ions
Chart 3: Annual Percent Change in Indiana Exports, 1997-2005
-10%
-5%
0%
5%
10%
15%
20%
25%
1997 1998 1999 20002001
2002 2003 2004 2005
Indiana exports have
increased from about
$11 billion in 1996 to $21.5
billion in 2005.
5Indiana’s Global Exports: Year-End Report for 2005
With the exception of 2001, Indiana exports saw positive growth throughout, while total U .S . exports declined in additional two years: 1998 and 2002 .
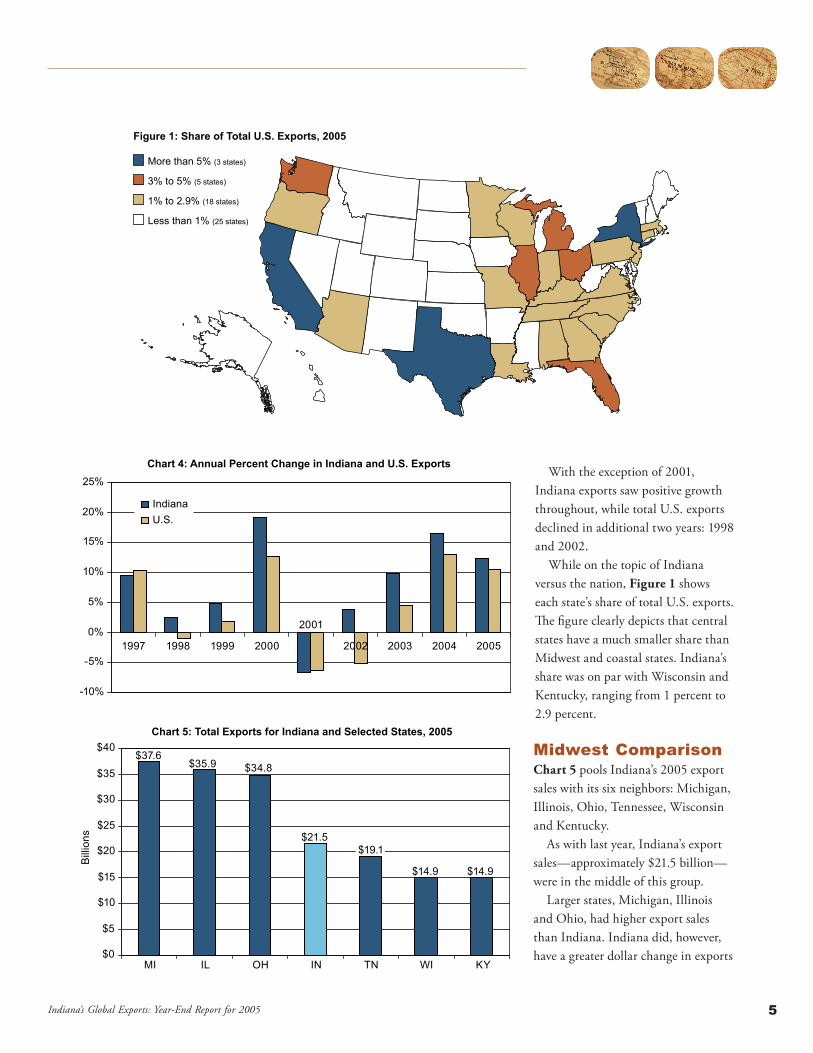
While on the topic of Indiana versus the nation, Figure 1 shows each state’s share of total U .S . exports . The figure clearly depicts that central states have a much smaller share than Midwest and coastal states . Indiana’s share was on par with Wisconsin and Kentucky, ranging from 1 percent to 2 .9 percent .
Midwest ComparisonChart 5 pools Indiana’s 2005 export sales with its six neighbors: Michigan, Illinois, Ohio, Tennessee, Wisconsin and Kentucky .
As with last year, Indiana’s export sales—approximately $21 .5 billion—were in the middle of this group .
Larger states, Michigan, Illinois and Ohio, had higher export sales than Indiana . Indiana did, however, have a greater dollar change in exports
More than 5% (3 states)
3% to 5% (5 states)
1% to 2.9% (18 states)
Less than 1% (25 states)
Figure 1: Share of Total U.S. Exports, 2005
Chart 4: Annual Percent Change in Indiana and U.S. Exports
-10%
-5%
0%
5%
10%
15%
20%
25%
1997 1998 1999 2000
2001
2002 2003 2004 2005
IndianaU.S.
Chart 5: Total Exports for Indiana and Selected States, 2005
$37.6$35.9 $34.8
$21.5$19.1
$14.9 $14.9
$0
$5
$10
$15
$20
$25
$30
$35
$40
MI IL OH IN TN WI KY
Bill
ions
�Indiana’s Global Exports: Year-End Report for 2005
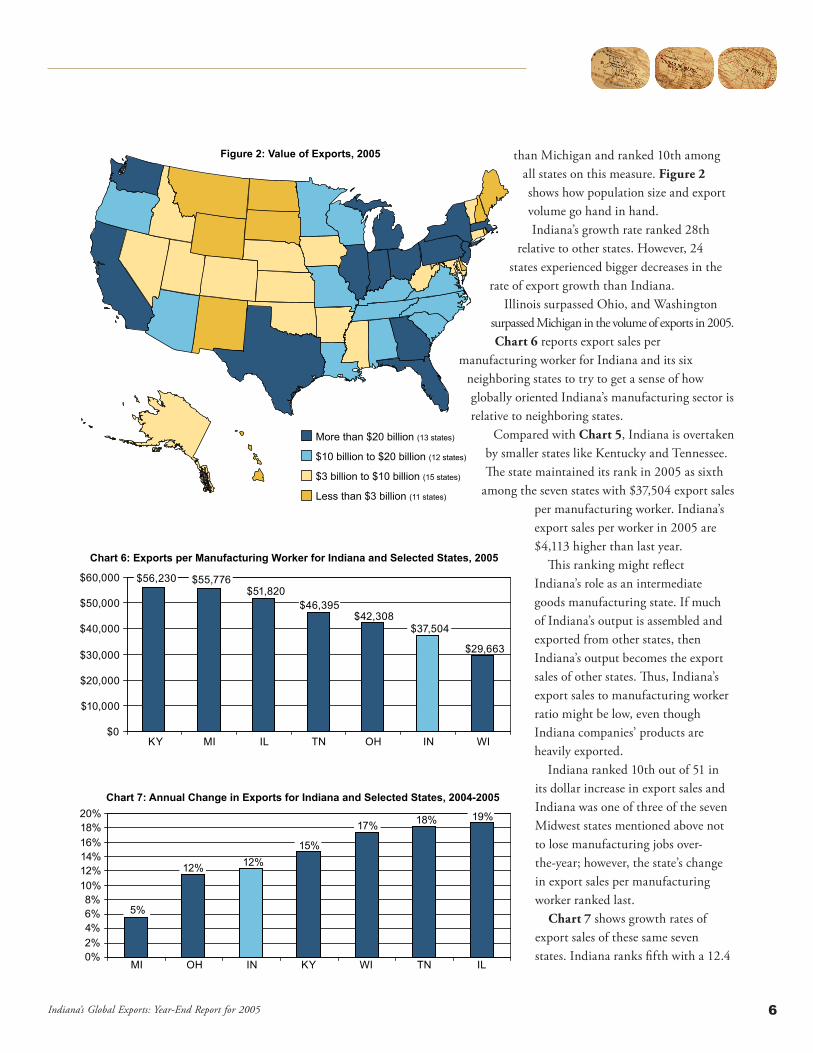
than Michigan and ranked 10th among all states on this measure . Figure 2 shows how population size and export volume go hand in hand .Indiana’s growth rate ranked 28th
relative to other states . However, 24 states experienced bigger decreases in the
rate of export growth than Indiana . Illinois surpassed Ohio, and Washington
surpassed Michigan in the volume of exports in 2005 .Chart 6 reports export sales per
manufacturing worker for Indiana and its six neighboring states to try to get a sense of how globally oriented Indiana’s manufacturing sector is relative to neighboring states .
Compared with Chart 5, Indiana is overtaken by smaller states like Kentucky and Tennessee . The state maintained its rank in 2005 as sixth
among the seven states with $37,504 export sales per manufacturing worker . Indiana’s export sales per worker in 2005 are $4,113 higher than last year .
This ranking might reflect Indiana’s role as an intermediate goods manufacturing state . If much of Indiana’s output is assembled and exported from other states, then Indiana’s output becomes the export sales of other states . Thus, Indiana’s export sales to manufacturing worker ratio might be low, even though Indiana companies’ products are heavily exported .
Indiana ranked 10th out of 51 in its dollar increase in export sales and Indiana was one of three of the seven Midwest states mentioned above not to lose manufacturing jobs over-the-year; however, the state’s change in export sales per manufacturing worker ranked last .
Chart 7 shows growth rates of export sales of these same seven states . Indiana ranks fifth with a 12 .4
Chart 6: Exports per Manufacturing Worker for Indiana and Selected States, 2005
$56,230 $55,776$51,820
$46,395$42,308
$37,504
$29,663
$0
$10,000
$20,000
$30,000
$40,000
$50,000
$60,000
KY MI IL TN OH IN WI
Chart 7: Annual Change in Exports for Indiana and Selected States, 2004-2005
5%
12% 12%15%
17% 18% 19%
0%2%4%6%8%
10%12%14%16%18%20%
MI OH IN KY WI TN IL
Figure 2: Value of Exports, 2005
More than $20 billion (13 states)
$10 billion to $20 billion (12 states)
$3 billion to $10 billion (15 states)
Less than $3 billion (11 states)
�Indiana’s Global Exports: Year-End Report for 2005
percent increase from 2004, having a faster rate of growth than only Ohio (11 .5 percent) and Michigan (5 .5 percent) . None of the seven states were on the decline in 2005 .
The rate of growth in Indiana and three other states, Michigan, Kentucky and Tennessee, slowed over-the-year, while the rate of growth in Wisconsin, Ohio and Illinois accelerated .
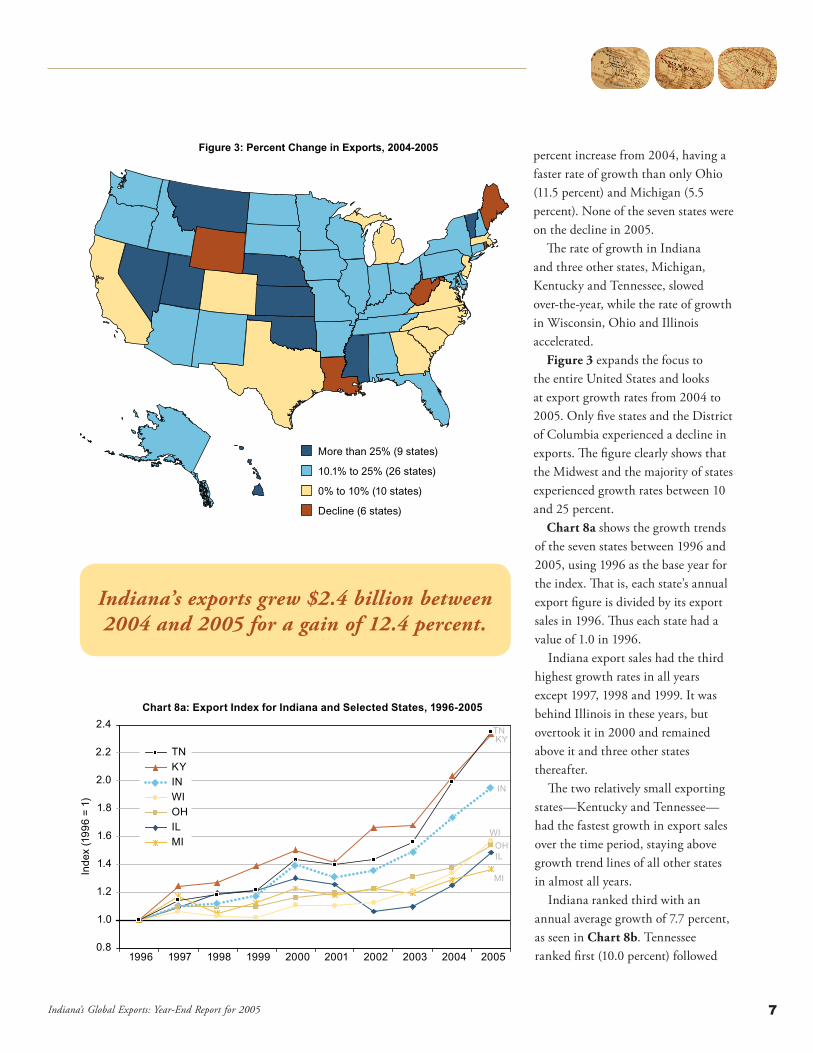
Figure 3 expands the focus to the entire United States and looks at export growth rates from 2004 to 2005 . Only five states and the District of Columbia experienced a decline in exports . The figure clearly shows that the Midwest and the majority of states experienced growth rates between 10 and 25 percent .
Chart 8a shows the growth trends of the seven states between 1996 and 2005, using 1996 as the base year for the index . That is, each state’s annual export figure is divided by its export sales in 1996 . Thus each state had a value of 1 .0 in 1996 .
Indiana export sales had the third highest growth rates in all years except 1997, 1998 and 1999 . It was behind Illinois in these years, but overtook it in 2000 and remained above it and three other states thereafter .
The two relatively small exporting states—Kentucky and Tennessee—had the fastest growth in export sales over the time period, staying above growth trend lines of all other states in almost all years .
Indiana ranked third with an annual average growth of 7 .7 percent, as seen in Chart 8b . Tennessee ranked first (10 .0 percent) followed
More than 25% (9 states)
10.1% to 25% (26 states)
0% to 10% (10 states)
Decline (6 states)
Figure 3: Percent Change in Exports, 2004-2005
Chart 8a: Export Index for Indiana and Selected States, 1996-2005
0.8
1.0
1.2
1.4
1.6
1.8
2.0
2.2
2.4
1996 1997 1998 1999 2000 2001 2002 2003 2004 2005
ILOH
KY
IN
MI
WI
TN
Inde
x (1
996
= 1)
ILOH
KYIN
MI
WI
TN
Indiana’s exports grew $2.4 billion between 2004 and 2005 for a gain of 12.4 percent.
�Indiana’s Global Exports: Year-End Report for 2005
closely by Kentucky at 9 .9 percent . Larger states fared the worst—Wisconsin ranked fourth with an annual average growth rate of 5 .1 percent, and Michigan ranked last at 3 .5 percent .
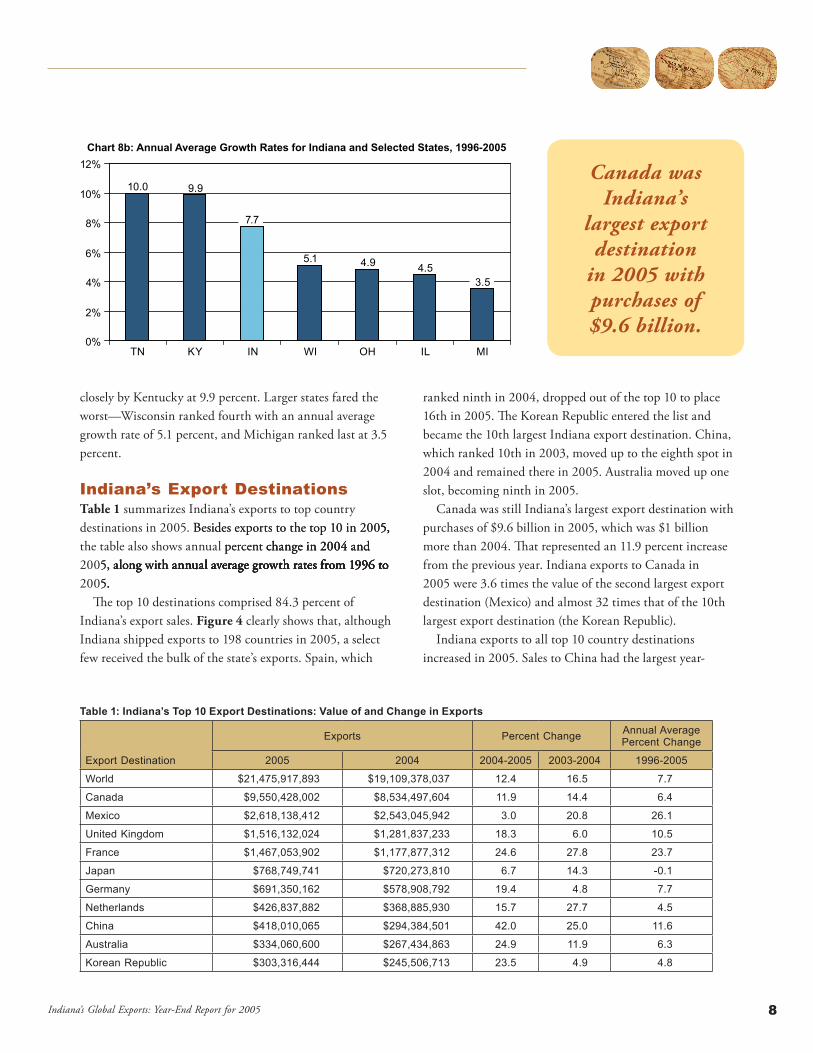
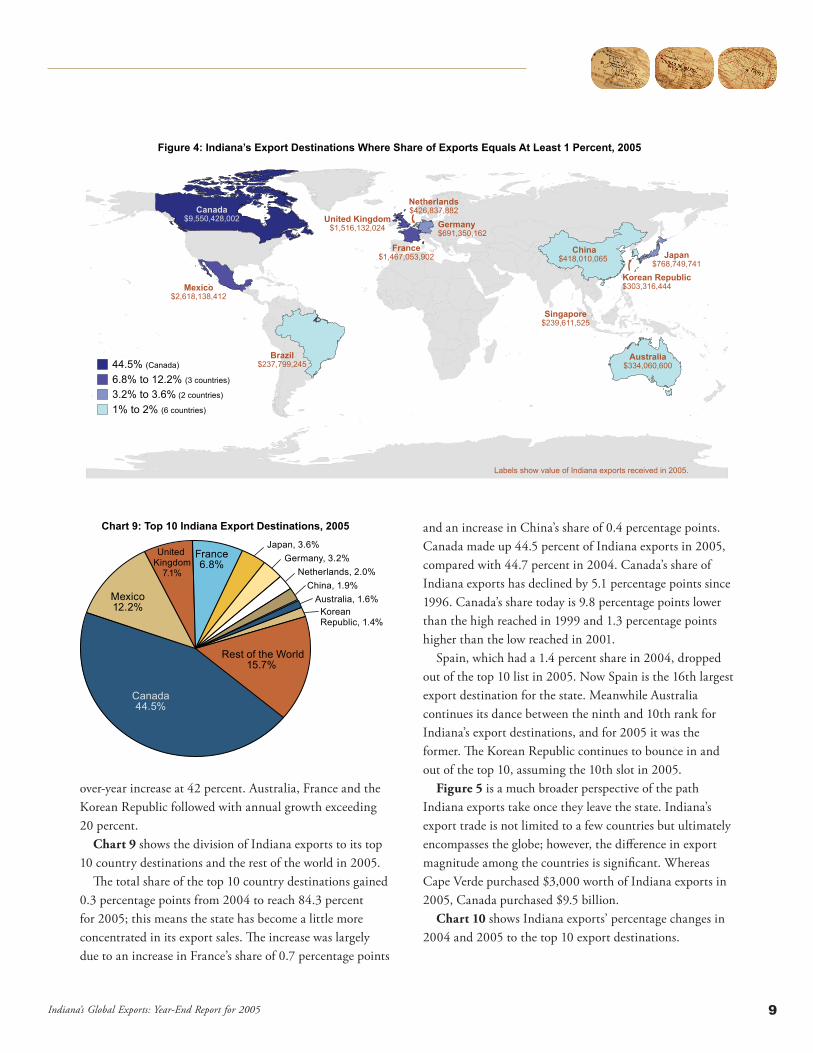
Indiana’s Export DestinationsTable 1 summarizes Indiana’s exports to top country destinations in 2005 . Besides exports to the top 10 in 2005, Besides exports to the top 10 in 2005,5,, the table also shows annual percent change in 2004 and percent change in 2004 and change in 2004 and 2005, along with annual average growth rates from 1996 to5, along with annual average growth rates from 1996 to, along with annual average growth rates from 1996 toalong with annual average growth rates from 1996 to annual average growth rates from 1996 toannual average growth rates from 1996 to from 1996 to 2005 .5 . .
The top 10 destinations comprised 84 .3 percent of Indiana’s export sales . Figure 4 clearly shows that, although Indiana shipped exports to 198 countries in 2005, a select few received the bulk of the state’s exports . Spain, which
ranked ninth in 2004, dropped out of the top 10 to place 16th in 2005 . The Korean Republic entered the list and became the 10th largest Indiana export destination . China, which ranked 10th in 2003, moved up to the eighth spot in 2004 and remained there in 2005 . Australia moved up one slot, becoming ninth in 2005 .
Canada was still Indiana’s largest export destination with purchases of $9 .6 billion in 2005, which was $1 billion more than 2004 . That represented an 11 .9 percent increase from the previous year . Indiana exports to Canada in 2005 were 3 .6 times the value of the second largest export destination (Mexico) and almost 32 times that of the 10th largest export destination (the Korean Republic) .
Indiana exports to all top 10 country destinations increased in 2005 . Sales to China had the largest year-
Table 1: Indiana’s Top 10 Export Destinations: Value of and Change in Exports
Export Destination
Exports Percent Change Annual Average Percent Change
2005 2004 2004-2005 2003-2004 1996-2005
World $21,475,917,893 $19,109,378,037 12.4 16.5 7.7
Canada $9,550,428,002 $8,534,497,604 11.9 14.4 6.4
Mexico $2,618,138,412 $2,543,045,942 3.0 20.8 26.1
United Kingdom $1,516,132,024 $1,281,837,233 18.3 6.0 10.5
France $1,467,053,902 $1,177,877,312 24.6 27.8 23.7
Japan $768,749,741 $720,273,810 6.7 14.3 -0.1
Germany $691,350,162 $578,908,792 19.4 4.8 7.7
Netherlands $426,837,882 $368,885,930 15.7 27.7 4.5
China $418,010,065 $294,384,501 42.0 25.0 11.6
Australia $334,060,600 $267,434,863 24.9 11.9 6.3
Korean Republic $303,316,444 $245,506,713 23.5 4.9 4.8
Chart 8b: Annual Average Growth Rates for Indiana and Selected States, 1996-2005
10.0 9.9
7.7
5.1 4.9 4.53.5
0%
2%
4%
6%
8%
10%
12%
TN KY IN WI OH IL MI
Canada was Indiana’s
largest export destination
in 2005 with purchases of $9.6 billion.
�Indiana’s Global Exports: Year-End Report for 2005
over-year increase at 42 percent . Australia, France and the Korean Republic followed with annual growth exceeding 20 percent .
Chart 9 shows the division of Indiana exports to its top 10 country destinations and the rest of the world in 2005 .
The total share of the top 10 country destinations gained 0 .3 percentage points from 2004 to reach 84 .3 percent for 2005; this means the state has become a little more concentrated in its export sales . The increase was largely due to an increase in France’s share of 0 .7 percentage points
and an increase in China’s share of 0 .4 percentage points . Canada made up 44 .5 percent of Indiana exports in 2005, compared with 44 .7 percent in 2004 . Canada’s share of Indiana exports has declined by 5 .1 percentage points since 1996 . Canada’s share today is 9 .8 percentage points lower than the high reached in 1999 and 1 .3 percentage points higher than the low reached in 2001 .
Spain, which had a 1 .4 percent share in 2004, dropped out of the top 10 list in 2005 . Now Spain is the 16th largest export destination for the state . Meanwhile Australia continues its dance between the ninth and 10th rank for Indiana’s export destinations, and for 2005 it was the former . The Korean Republic continues to bounce in and out of the top 10, assuming the 10th slot in 2005 .
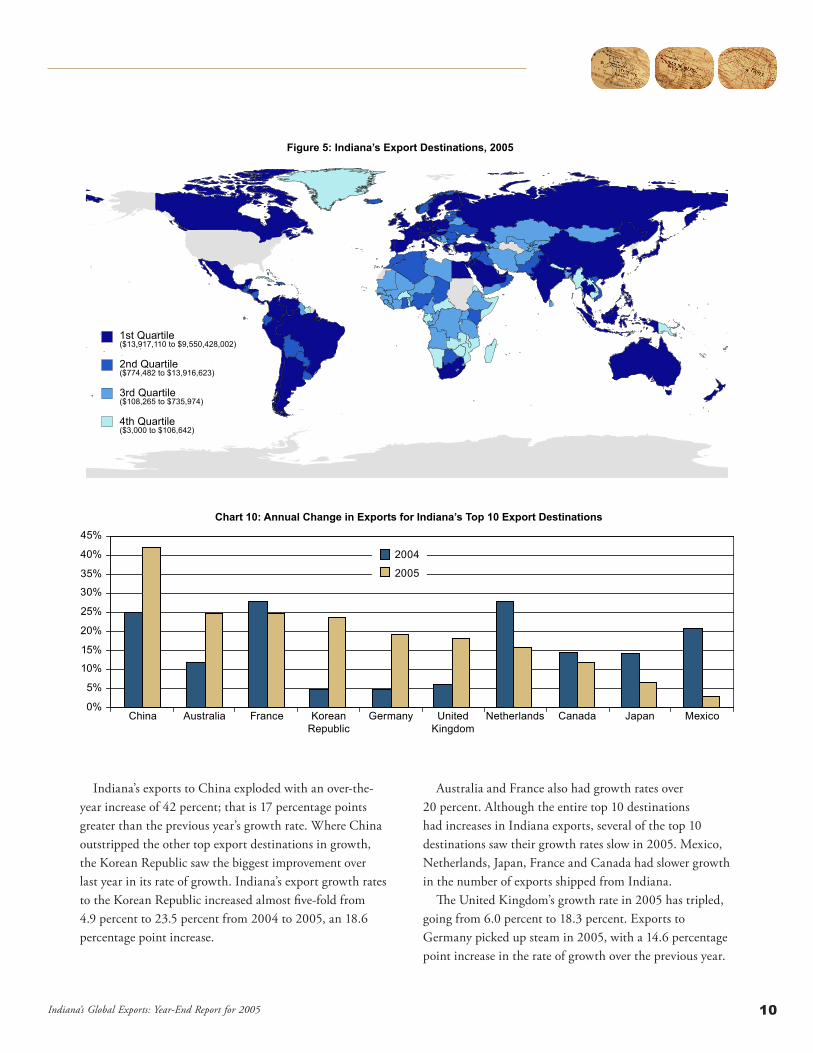
Figure 5 is a much broader perspective of the path Indiana exports take once they leave the state . Indiana’s export trade is not limited to a few countries but ultimately encompasses the globe; however, the difference in export magnitude among the countries is significant . Whereas Cape Verde purchased $3,000 worth of Indiana exports in 2005, Canada purchased $9 .5 billion .
Chart 10 shows Indiana exports’ percentage changes in 2004 and 2005 to the top 10 export destinations .
Canada$9,550,428,002
China$418,010,065
Singapore$239,611,525
Brazil$237,799,245
Australia$334,060,600
Mexico$2,618,138,412
France$1,467,053,902
Germany$691,350,162
United Kingdom$1,516,132,024
Japan$768,749,741
Korean Republic$303,316,444
Netherlands$426,837,882
44.5% (Canada)
6.8% to 12.2% (3 countries)
3.2% to 3.6% (2 countries)
1% to 2% (6 countries)
Figure 4: Indiana’s Export Destinations Where Share of Exports Equals At Least 1 Percent, 2005
Labels show value of Indiana exports received in 2005.
Chart 9: Top 10 Indiana Export Destinations, 2005
Canada44.5%
Mexico12.2%
United Kingdom
7.1%
France6.8%
Japan, 3.6%Germany, 3.2%
Netherlands, 2.0%China, 1.9%
Australia, 1.6%Korean Republic, 1.4%
Rest of the World15.7%
�0Indiana’s Global Exports: Year-End Report for 2005
1st Quartile ($13,917,110 to $9,550,428,002)
2nd Quartile ($774,482 to $13,916,623)
3rd Quartile ($108,265 to $735,974)
4th Quartile ($3,000 to $106,642)
Figure 5: Indiana’s Export Destinations, 2005
Chart 10: Annual Change in Exports for Indiana’s Top 10 Export Destinations
0%
5%
10%
15%
20%
25%
30%
35%
40%
45%
Australia CanadaChina France Germany JapanKoreanRepublic
MexicoNetherlandsUnitedKingdom
2004
2005
Indiana’s exports to China exploded with an over-the-year increase of 42 percent; that is 17 percentage points greater than the previous year’s growth rate . Where China outstripped the other top export destinations in growth, the Korean Republic saw the biggest improvement over last year in its rate of growth . Indiana’s export growth rates to the Korean Republic increased almost five-fold from 4 .9 percent to 23 .5 percent from 2004 to 2005, an 18 .6 percentage point increase .
Australia and France also had growth rates over 20 percent . Although the entire top 10 destinations had increases in Indiana exports, several of the top 10 destinations saw their growth rates slow in 2005 . Mexico, Netherlands, Japan, France and Canada had slower growth in the number of exports shipped from Indiana .
The United Kingdom’s growth rate in 2005 has tripled, going from 6 .0 percent to 18 .3 percent . Exports to Germany picked up steam in 2005, with a 14 .6 percentage point increase in the rate of growth over the previous year .
��Indiana’s Global Exports: Year-End Report for 2005
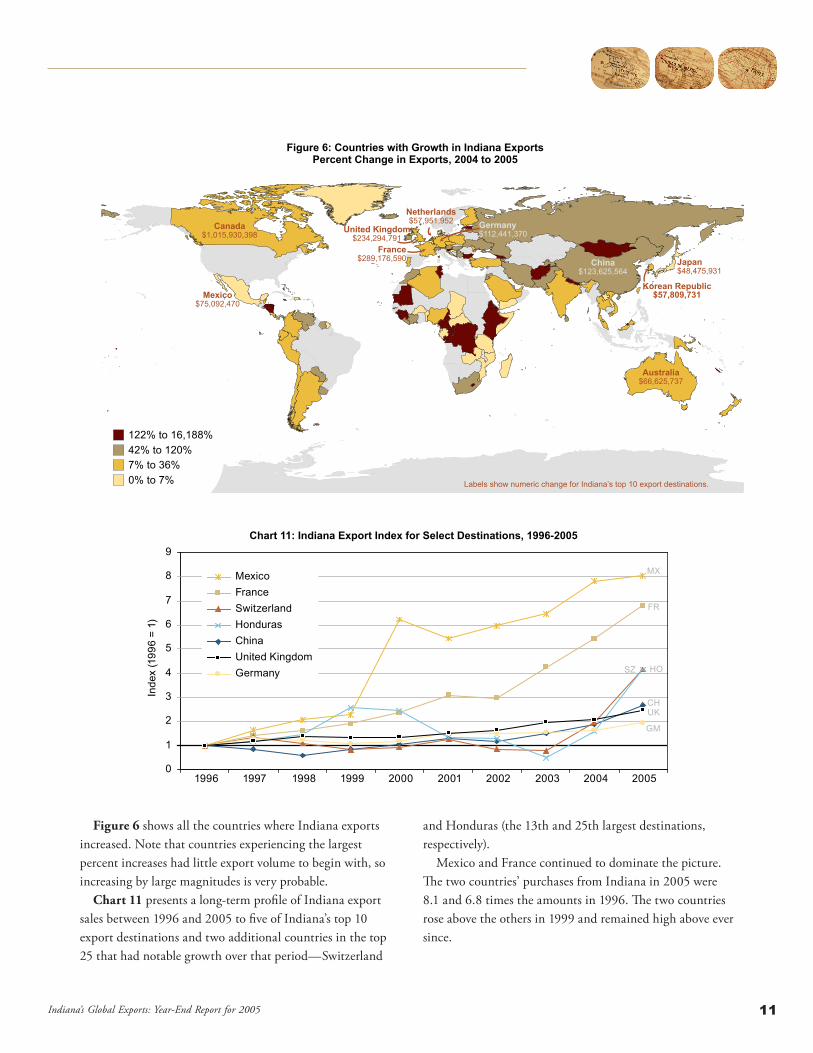
Figure 6 shows all the countries where Indiana exports increased . Note that countries experiencing the largest percent increases had little export volume to begin with, so increasing by large magnitudes is very probable .
Chart 11 presents a long-term profile of Indiana export sales between 1996 and 2005 to five of Indiana’s top 10 export destinations and two additional countries in the top 25 that had notable growth over that period—Switzerland
and Honduras (the 13th and 25th largest destinations, respectively) .
Mexico and France continued to dominate the picture . The two countries’ purchases from Indiana in 2005 were 8 .1 and 6 .8 times the amounts in 1996 . The two countries rose above the others in 1999 and remained high above ever since .
Chart 11: Indiana Export Index for Select Destinations, 1996-2005
0
1
2
3
4
5
6
7
8
9
1996 1997 1998 1999 2000 2001 2002 2003 2004 2005
China
FranceSwitzerlandHonduras
Mexico
GermanyUnited Kingdom
Inde
x (1
996
= 1)
CH
FR
SZ HO
MX
GM
UK
Canada$1,015,930,398
China$123,625,564
Australia$66,625,737
Mexico$75,092,470
France$289,176,590
Germany$112,441,370United Kingdom
$234,294,791
Japan$48,475,931
Korean Republic$57,809,731
Netherlands$57,951,952
122% to 16,188%42% to 120%7% to 36%0% to 7%
Figure 6: Countries with Growth in Indiana ExportsPercent Change in Exports, 2004 to 2005
Labels show numeric change for Indiana’s top 10 export destinations.
�2Indiana’s Global Exports: Year-End Report for 2005
The rest of the countries were in a tangle for the 1996 to 2005 period and experienced 2 .0 to 4 .2 times the purchases made in 1996 . Of the remaining top 10 countries, Japan had a slight decline in export volume ($8 .3 million) and China was 2 .7 times its 1996 amount . Honduras and Switzerland both have small shares of Indiana’s total exports but are clipping along at an impressive rate; their export purchases have quadrupled since 1996 .
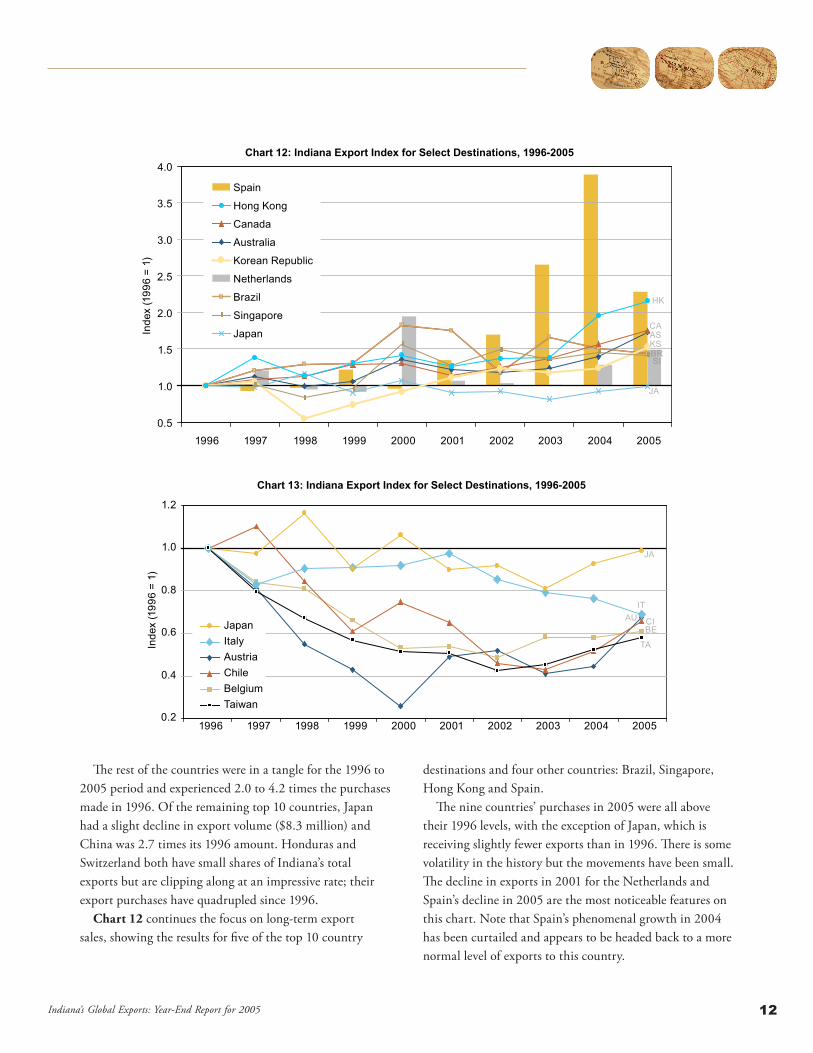
Chart 12 continues the focus on long-term export sales, showing the results for five of the top 10 country
destinations and four other countries: Brazil, Singapore, Hong Kong and Spain .
The nine countries’ purchases in 2005 were all above their 1996 levels, with the exception of Japan, which is receiving slightly fewer exports than in 1996 . There is some volatility in the history but the movements have been small . The decline in exports in 2001 for the Netherlands and Spain’s decline in 2005 are the most noticeable features on this chart . Note that Spain’s phenomenal growth in 2004 has been curtailed and appears to be headed back to a more normal level of exports to this country .
Inde
x (1
996
= 1)
Chart 12: Indiana Export Index for Select Destinations, 1996-2005
0.5
1.0
1.5
2.0
2.5
3.0
3.5
4.0
1996 1997 1998 1999 2000 2001 2002 2003 2004 2005
Spain
Netherlands
Australia
Brazil
Canada
Japan
Korean Republic
Singapore
Hong Kong
AS
BR
CA
JA
KS
HK
SI
Inde
x (1
996
= 1)
Chart 13: Indiana Export Index for Select Destinations, 1996-2005
0.2
0.4
0.6
0.8
1.0
1.2
1996 1997 1998 1999 2000 2001 2002 2003 2004 2005
Austria
BelgiumChile
ItalyJapan
Taiwan
AUBECI
IT
JA
TA
��Indiana’s Global Exports: Year-End Report for 2005
Chart 13 examines a group of six destinations whose exports have generally declined since 1996 and were below their 1996 levels in 2005 . These include Japan, Austria, Italy, Taiwan, Belgium and Chile .
Japan, noted above, wandered around its 1996 level for several years but has remained under it since 2001 . Despite a small increase in 2005, the country’s purchases from Indiana were still below its 1996 level ($8 .3 million) in 2005 .
Austria stood out in the chart hitting a low in 2000 and has made up some lost ground since 1996, although the country’s export consumption of Indiana goods is still $61 .2 million below its 1996 level .
The remaining six countries were under their 1996 levels all along, except for Chile, which was once above the level in 1997 but declined ever since . Belgium has the most ground to recover at the end of 2005 with an export level that is $96 million below its 1996 level .
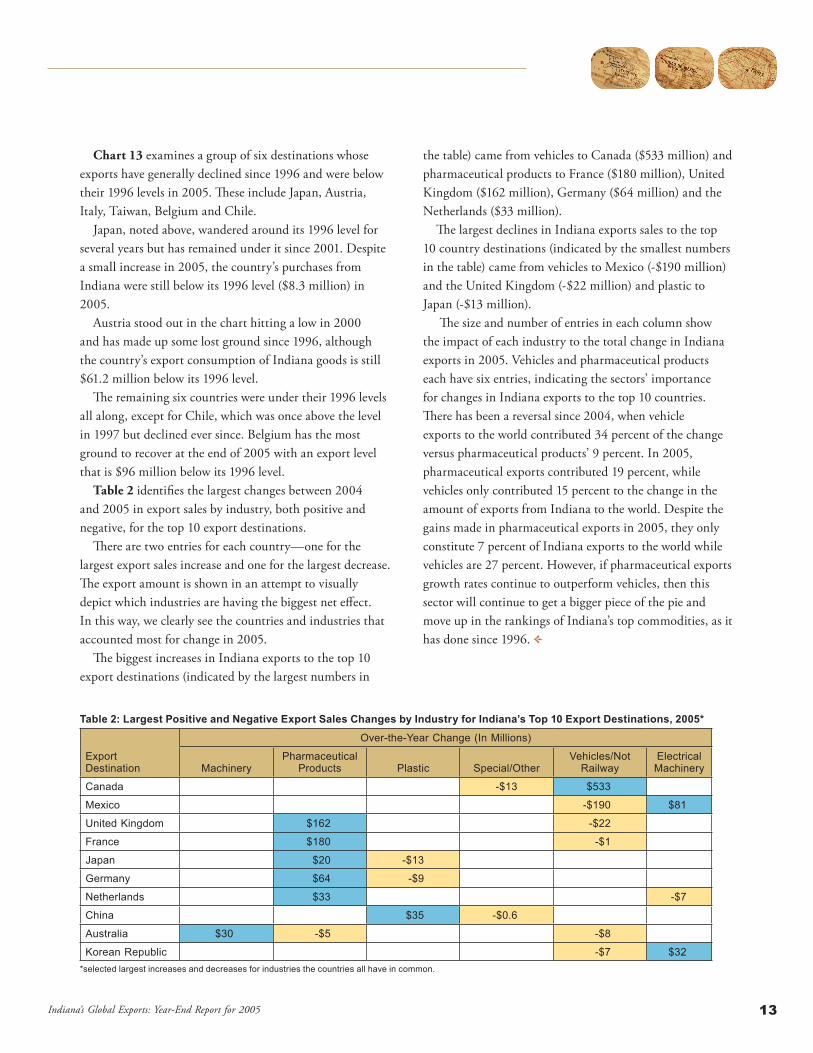
Table 2 identifies the largest changes between 2004 and 2005 in export sales by industry, both positive and negative, for the top 10 export destinations .
There are two entries for each country—one for the largest export sales increase and one for the largest decrease . The export amount is shown in an attempt to visually depict which industries are having the biggest net effect . In this way, we clearly see the countries and industries that accounted most for change in 2005 .
The biggest increases in Indiana exports to the top 10 export destinations (indicated by the largest numbers in
the table) came from vehicles to Canada ($533 million) and pharmaceutical products to France ($180 million), United Kingdom ($162 million), Germany ($64 million) and the Netherlands ($33 million) .
The largest declines in Indiana exports sales to the top 10 country destinations (indicated by the smallest numbers in the table) came from vehicles to Mexico (-$190 million) and the United Kingdom (-$22 million) and plastic to Japan (-$13 million) .
The size and number of entries in each column show the impact of each industry to the total change in Indiana exports in 2005 . Vehicles and pharmaceutical products each have six entries, indicating the sectors’ importance for changes in Indiana exports to the top 10 countries . There has been a reversal since 2004, when vehicle exports to the world contributed 34 percent of the change versus pharmaceutical products’ 9 percent . In 2005, pharmaceutical exports contributed 19 percent, while vehicles only contributed 15 percent to the change in the amount of exports from Indiana to the world . Despite the gains made in pharmaceutical exports in 2005, they only constitute 7 percent of Indiana exports to the world while vehicles are 27 percent . However, if pharmaceutical exports growth rates continue to outperform vehicles, then this sector will continue to get a bigger piece of the pie and move up in the rankings of Indiana’s top commodities, as it has done since 1996 .
Table 2: Largest Positive and Negative Export Sales Changes by Industry for Indiana’s Top 10 Export Destinations, 2005*
Export Destination
Over-the-Year Change (In Millions)
MachineryPharmaceutical
Products Plastic Special/OtherVehicles/Not
RailwayElectrical Machinery
Canada -$13 $533
Mexico -$190 $81
United Kingdom $162 -$22
France $180 -$1
Japan $20 -$13
Germany $64 -$9
Netherlands $33 -$7
China $35 -$0.6
Australia $30 -$5 -$8
Korean Republic -$7 $32*selected largest increases and decreases for industries the countries all have in common.
��Indiana’s Global Exports: Year-End Report for 2005
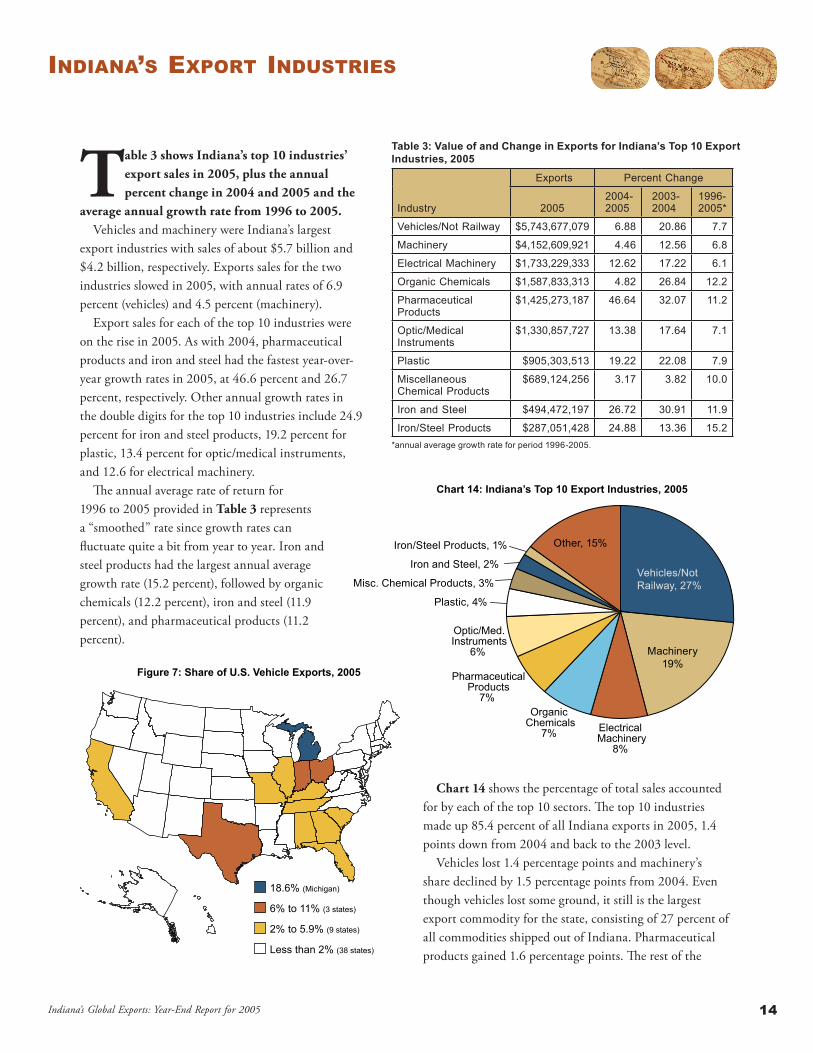
Table 3 shows Indiana’s top 10 industries’ export sales in 2005, plus the annual percent change in 2004 and 2005 and the
average annual growth rate from 1996 to 2005.Vehicles and machinery were Indiana’s largest
export industries with sales of about $5 .7 billion and $4 .2 billion, respectively . Exports sales for the two industries slowed in 2005, with annual rates of 6 .9 percent (vehicles) and 4 .5 percent (machinery) .
Export sales for each of the top 10 industries were on the rise in 2005 . As with 2004, pharmaceutical products and iron and steel had the fastest year-over-year growth rates in 2005, at 46 .6 percent and 26 .7 percent, respectively . Other annual growth rates in the double digits for the top 10 industries include 24 .9 percent for iron and steel products, 19 .2 percent for plastic, 13 .4 percent for optic/medical instruments, and 12 .6 for electrical machinery .
The annual average rate of return for 1996 to 2005 provided in Table 3 represents a “smoothed” rate since growth rates can fluctuate quite a bit from year to year . Iron and steel products had the largest annual average growth rate (15 .2 percent), followed by organic chemicals (12 .2 percent), iron and steel (11 .9 percent), and pharmaceutical products (11 .2 percent) .
Chart 14 shows the percentage of total sales accounted for by each of the top 10 sectors . The top 10 industries made up 85 .4 percent of all Indiana exports in 2005, 1 .4 points down from 2004 and back to the 2003 level .
Vehicles lost 1 .4 percentage points and machinery’s share declined by 1 .5 percentage points from 2004 . Even though vehicles lost some ground, it still is the largest export commodity for the state, consisting of 27 percent of all commodities shipped out of Indiana . Pharmaceutical products gained 1 .6 percentage points . The rest of the
indiana’s exporT indusTries
Chart 14: Indiana’s Top 10 Export Industries, 2005
Vehicles/Not Railway, 27%
Machinery19%
ElectricalMachinery
8%
OrganicChemicals
7%
PharmaceuticalProducts
7%
Optic/Med.Instruments
6%
Plastic, 4%
Misc. Chemical Products, 3%
Iron and Steel, 2%
Iron/Steel Products, 1% Other, 15%
Table 3: Value of and Change in Exports for Indiana’s Top 10 Export Industries, 2005
Industry
Exports Percent Change
20052004-2005
2003-2004
1996-2005*
Vehicles/Not Railway $5,743,677,079 6.88 20.86 7.7
Machinery $4,152,609,921 4.46 12.56 6.8
Electrical Machinery $1,733,229,333 12.62 17.22 6.1
Organic Chemicals $1,587,833,313 4.82 26.84 12.2
Pharmaceutical Products
$1,425,273,187 46.64 32.07 11.2
Optic/Medical Instruments
$1,330,857,727 13.38 17.64 7.1
Plastic $905,303,513 19.22 22.08 7.9
Miscellaneous Chemical Products
$689,124,256 3.17 3.82 10.0
Iron and Steel $494,472,197 26.72 30.91 11.9
Iron/Steel Products $287,051,428 24.88 13.36 15.2*annual average growth rate for period 1996-2005.
18.6% (Michigan)
6% to 11% (3 states)
2% to 5.9% (9 states)
Less than 2% (38 states)
Figure 7: Share of U.S. Vehicle Exports, 2005
�5Indiana’s Global Exports: Year-End Report for 2005
changes in share over-the-year were fairly small . Figure 7 clearly shows the United State’s reliance on Indiana and a few select states for vehicle exports .
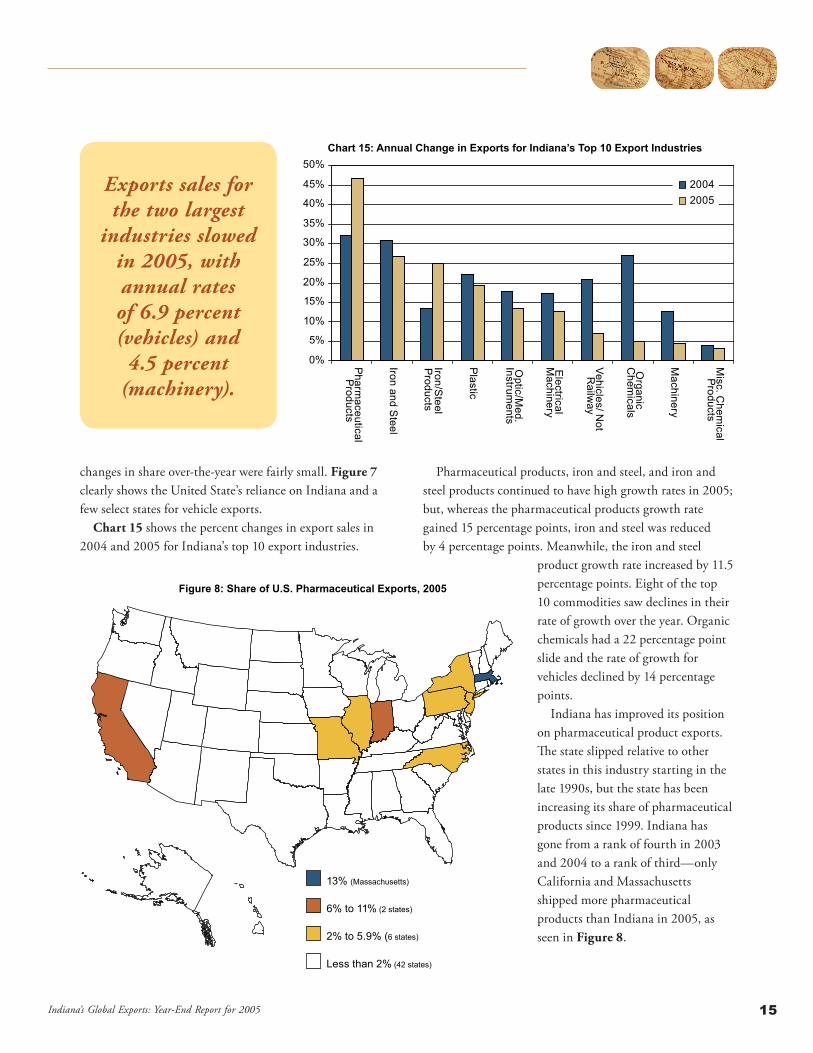
Chart 15 shows the percent changes in export sales in 2004 and 2005 for Indiana’s top 10 export industries .
Pharmaceutical products, iron and steel, and iron and steel products continued to have high growth rates in 2005; but, whereas the pharmaceutical products growth rate gained 15 percentage points, iron and steel was reduced by 4 percentage points . Meanwhile, the iron and steel
product growth rate increased by 11 .5 percentage points . Eight of the top 10 commodities saw declines in their rate of growth over the year . Organic chemicals had a 22 percentage point slide and the rate of growth for vehicles declined by 14 percentage points .
Indiana has improved its position on pharmaceutical product exports . The state slipped relative to other states in this industry starting in the late 1990s, but the state has been increasing its share of pharmaceutical products since 1999 . Indiana has gone from a rank of fourth in 2003 and 2004 to a rank of third—only California and Massachusetts shipped more pharmaceutical products than Indiana in 2005, as seen in Figure 8 .
Chart 15: Annual Change in Exports for Indiana’s Top 10 Export Industries
0%
5%
10%
15%
20%
25%
30%
35%
40%
45%
50%
Vehicles/ Not
Railw
ay
Machinery
Electrical
Machinery
Organic
Chem
icals
Pharm
aceuticalP
roducts
Optic/M
ed.Instrum
ents
Plastic
Misc. C
hemical
Products
Iron and Steel
Iron/Steel
Products
20042005
13% (Massachusetts)
6% to 11% (2 states)
2% to 5.9% (6 states)
Less than 2% (42 states)
Figure 8: Share of U.S. Pharmaceutical Exports, 2005
Exports sales for the two largest
industries slowed in 2005, with annual rates of 6.9 percent (vehicles) and
4.5 percent (machinery).
��Indiana’s Global Exports: Year-End Report for 2005
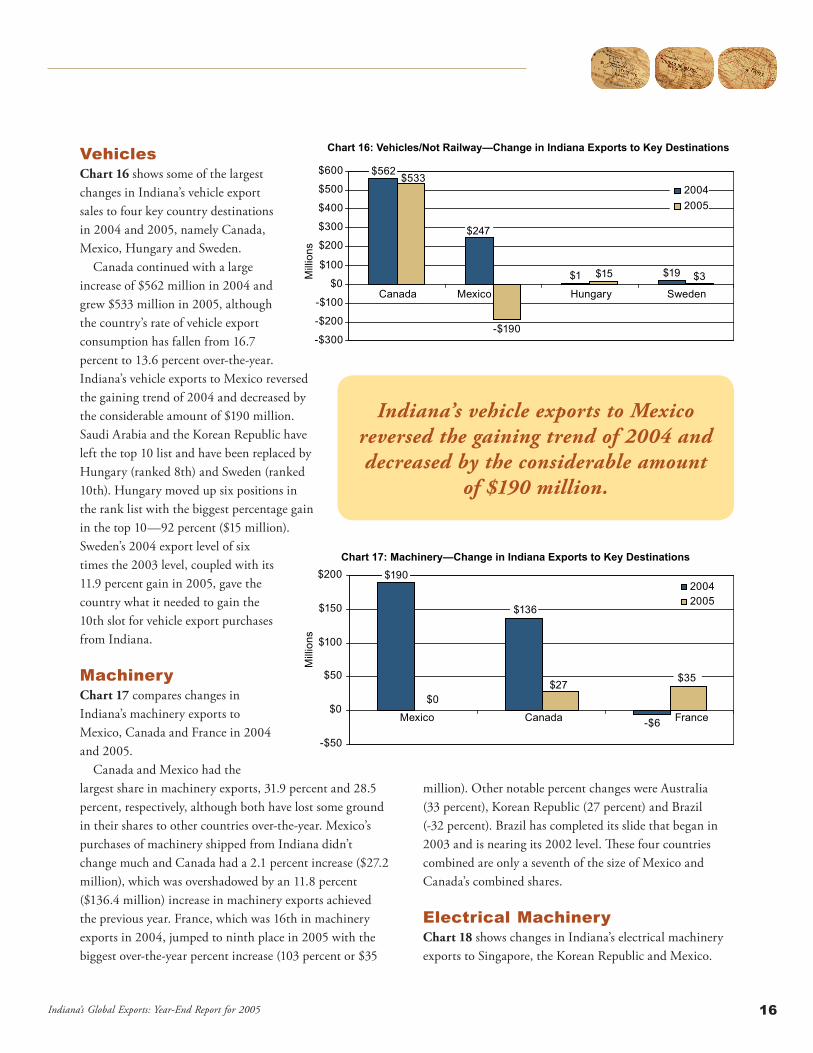
VehiclesChart 16 shows some of the largest changes in Indiana’s vehicle export sales to four key country destinations in 2004 and 2005, namely Canada, Mexico, Hungary and Sweden .
Canada continued with a large increase of $562 million in 2004 and grew $533 million in 2005, although the country’s rate of vehicle export consumption has fallen from 16 .7 percent to 13 .6 percent over-the-year . Indiana’s vehicle exports to Mexico reversed the gaining trend of 2004 and decreased by the considerable amount of $190 million . Saudi Arabia and the Korean Republic have left the top 10 list and have been replaced by Hungary (ranked 8th) and Sweden (ranked 10th) . Hungary moved up six positions in the rank list with the biggest percentage gain in the top 10—92 percent ($15 million) . Sweden’s 2004 export level of six times the 2003 level, coupled with its 11 .9 percent gain in 2005, gave the country what it needed to gain the 10th slot for vehicle export purchases from Indiana .
MachineryChart 17 compares changes in Indiana’s machinery exports to Mexico, Canada and France in 2004 and 2005 .
Canada and Mexico had the largest share in machinery exports, 31 .9 percent and 28 .5 percent, respectively, although both have lost some ground in their shares to other countries over-the-year . Mexico’s purchases of machinery shipped from Indiana didn’t change much and Canada had a 2 .1 percent increase ($27 .2 million), which was overshadowed by an 11 .8 percent ($136 .4 million) increase in machinery exports achieved the previous year . France, which was 16th in machinery exports in 2004, jumped to ninth place in 2005 with the biggest over-the-year percent increase (103 percent or $35
million) . Other notable percent changes were Australia (33 percent), Korean Republic (27 percent) and Brazil (-32 percent) . Brazil has completed its slide that began in 2003 and is nearing its 2002 level . These four countries combined are only a seventh of the size of Mexico and Canada’s combined shares .
Electrical MachineryChart 18 shows changes in Indiana’s electrical machinery exports to Singapore, the Korean Republic and Mexico .
Chart 16: Vehicles/Not Railway—Change in Indiana Exports to Key Destinations
$562
$247
$1 $19
$533
-$190
$15 $3
-$300
-$200
-$100
$0
$100
$200
$300
$400
$500
$600
Canada Mexico Hungary SwedenM
illio
ns
20042005
Chart 17: Machinery—Change in Indiana Exports to Key Destinations$190
$136
-$6
$0$27
$35
-$50
$0
$50
$100
$150
$200
Mexico Canada France
Mill
ions
20042005
Indiana’s vehicle exports to Mexico reversed the gaining trend of 2004 and decreased by the considerable amount
of $190 million.
��Indiana’s Global Exports: Year-End Report for 2005
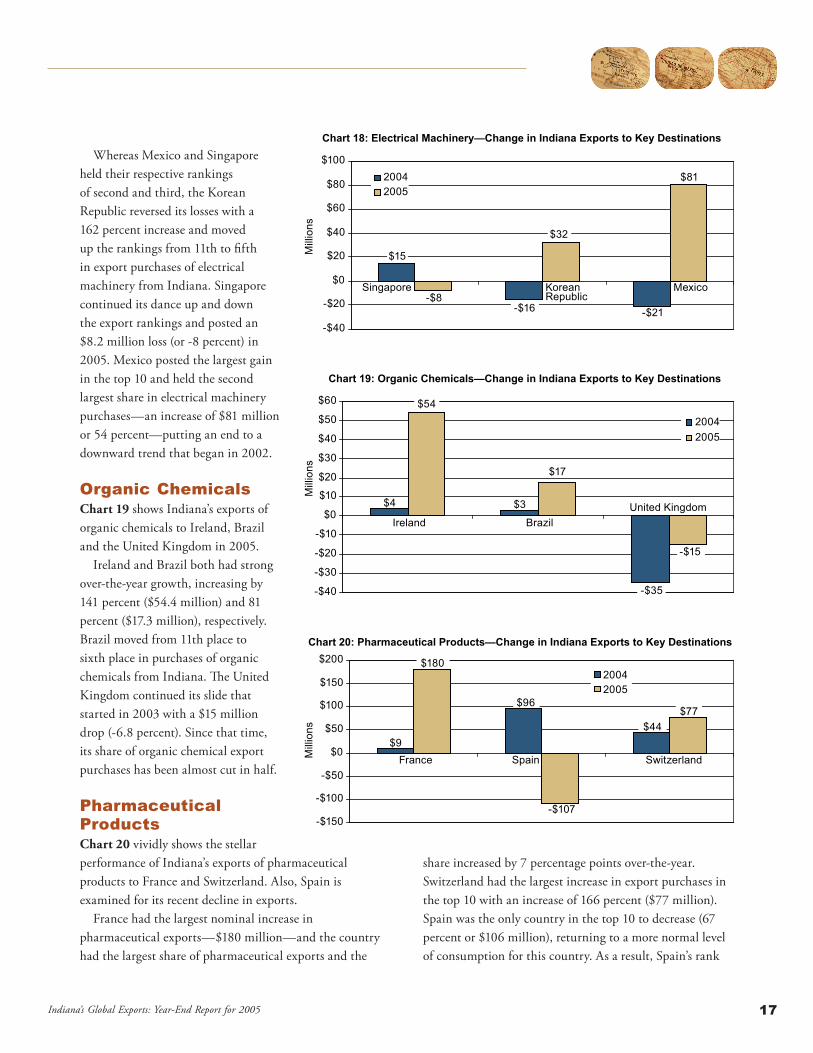
Whereas Mexico and Singapore held their respective rankings of second and third, the Korean Republic reversed its losses with a 162 percent increase and moved up the rankings from 11th to fifth in export purchases of electrical machinery from Indiana . Singapore continued its dance up and down the export rankings and posted an $8 .2 million loss (or -8 percent) in 2005 . Mexico posted the largest gain in the top 10 and held the second largest share in electrical machinery purchases—an increase of $81 million or 54 percent—putting an end to a downward trend that began in 2002 .
Organic Chemicals Chart 19 shows Indiana’s exports of organic chemicals to Ireland, Brazil and the United Kingdom in 2005 .
Ireland and Brazil both had strong over-the-year growth, increasing by 141 percent ($54 .4 million) and 81 percent ($17 .3 million), respectively . Brazil moved from 11th place to sixth place in purchases of organic chemicals from Indiana . The United Kingdom continued its slide that started in 2003 with a $15 million drop (-6 .8 percent) . Since that time, its share of organic chemical export purchases has been almost cut in half .
Pharmaceutical Products Chart 20 vividly shows the stellar performance of Indiana’s exports of pharmaceutical products to France and Switzerland . Also, Spain is examined for its recent decline in exports .
France had the largest nominal increase in pharmaceutical exports—$180 million—and the country had the largest share of pharmaceutical exports and the
share increased by 7 percentage points over-the-year . Switzerland had the largest increase in export purchases in the top 10 with an increase of 166 percent ($77 million) . Spain was the only country in the top 10 to decrease (67 percent or $106 million), returning to a more normal level of consumption for this country . As a result, Spain’s rank
Chart 19: Organic Chemicals—Change in Indiana Exports to Key Destinations
$4 $3
-$35
$54
$17
-$15
-$40
-$30
-$20
-$10
$0
$10
$20
$30
$40
$50
$60
Ireland BrazilUnited Kingdom
Mill
ions
20042005
Chart 20: Pharmaceutical Products—Change in Indiana Exports to Key Destinations
$9
$96
$44
$180
-$107
$77
-$150
-$100
-$50
$0
$50
$100
$150
$200
France Spain SwitzerlandMill
ions
20042005
Chart 18: Electrical Machinery—Change in Indiana Exports to Key Destinations
$15
-$16 -$21-$8
$32
$81
-$40
-$20
$0
$20
$40
$60
$80
$100
Singapore Korean Republic
Mexico
Mill
ions
20042005
��Indiana’s Global Exports: Year-End Report for 2005
fell from second in 2004 to seventh in 2005 .
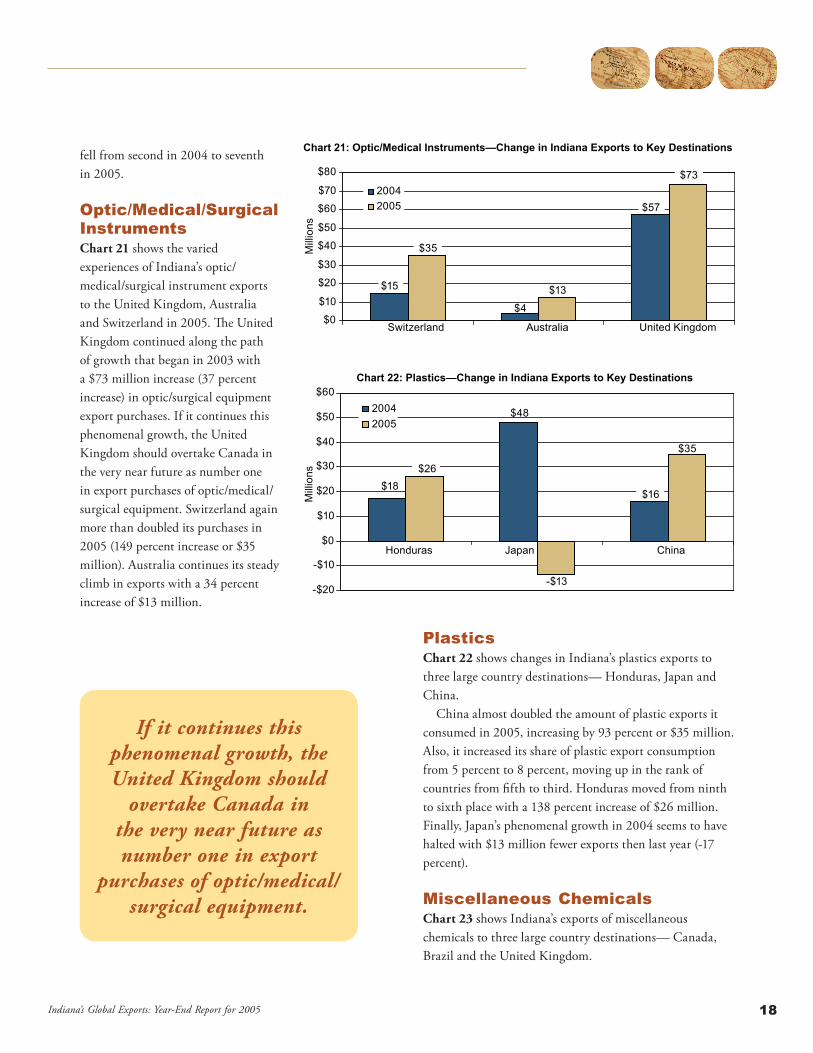
Optic/Medical/Surgical InstrumentsChart 21 shows the varied experiences of Indiana’s optic/medical/surgical instrument exports to the United Kingdom, Australia and Switzerland in 2005 . The United Kingdom continued along the path of growth that began in 2003 with a $73 million increase (37 percent increase) in optic/surgical equipment export purchases . If it continues this phenomenal growth, the United Kingdom should overtake Canada in the very near future as number one in export purchases of optic/medical/surgical equipment . Switzerland again more than doubled its purchases in 2005 (149 percent increase or $35 million) . Australia continues its steady climb in exports with a 34 percent increase of $13 million .
PlasticsChart 22 shows changes in Indiana’s plastics exports to three large country destinations— Honduras, Japan and China .
China almost doubled the amount of plastic exports it consumed in 2005, increasing by 93 percent or $35 million . Also, it increased its share of plastic export consumption from 5 percent to 8 percent, moving up in the rank of countries from fifth to third . Honduras moved from ninth to sixth place with a 138 percent increase of $26 million . Finally, Japan’s phenomenal growth in 2004 seems to have halted with $13 million fewer exports then last year (-17 percent) .
Miscellaneous ChemicalsChart 23 shows Indiana’s exports of miscellaneous chemicals to three large country destinations— Canada, Brazil and the United Kingdom .
Chart 21: Optic/Medical Instruments—Change in Indiana Exports to Key Destinations
$15
$4
$57
$35
$13
$73
$0
$10
$20
$30
$40
$50
$60
$70
$80
Switzerland Australia United Kingdom
Mill
ions
20042005
Chart 22: Plastics—Change in Indiana Exports to Key Destinations
$18
$48
$16
$26
-$13
$35
-$20
-$10
$0
$10
$20
$30
$40
$50
$60
Honduras Japan China
Mill
ions
20042005
If it continues this phenomenal growth, the United Kingdom should
overtake Canada in the very near future as number one in export
purchases of optic/medical/surgical equipment.
��Indiana’s Global Exports: Year-End Report for 2005
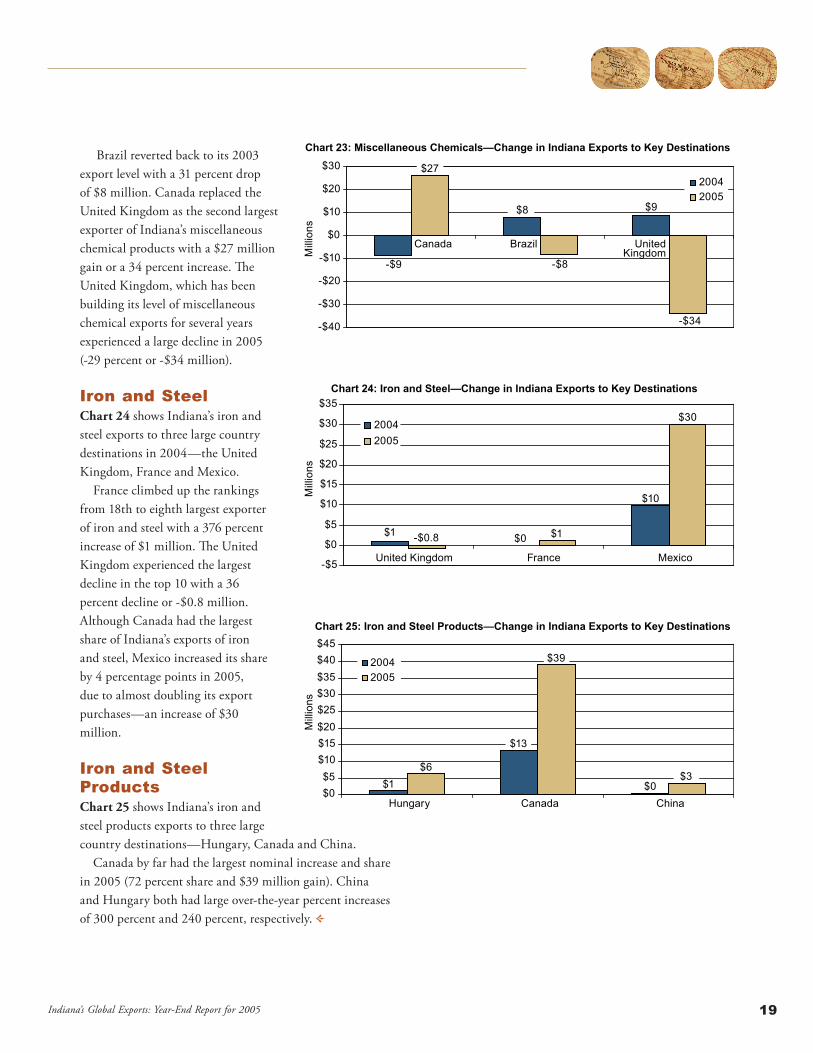
Brazil reverted back to its 2003 export level with a 31 percent drop of $8 million . Canada replaced the United Kingdom as the second largest exporter of Indiana’s miscellaneous chemical products with a $27 million gain or a 34 percent increase . The United Kingdom, which has been building its level of miscellaneous chemical exports for several years experienced a large decline in 2005 (-29 percent or -$34 million) .
Iron and SteelChart 24 shows Indiana’s iron and steel exports to three large country destinations in 2004—the United Kingdom, France and Mexico .
France climbed up the rankings from 18th to eighth largest exporter of iron and steel with a 376 percent increase of $1 million . The United Kingdom experienced the largest decline in the top 10 with a 36 percent decline or -$0 .8 million . Although Canada had the largest share of Indiana’s exports of iron and steel, Mexico increased its share by 4 percentage points in 2005, due to almost doubling its export purchases—an increase of $30 million .
Iron and Steel Products Chart 25 shows Indiana’s iron and steel products exports to three large country destinations—Hungary, Canada and China .
Canada by far had the largest nominal increase and share in 2005 (72 percent share and $39 million gain) . China and Hungary both had large over-the-year percent increases of 300 percent and 240 percent, respectively .
Chart 24: Iron and Steel—Change in Indiana Exports to Key Destinations
$1 $0
$10
-$0.8 $1
$30
-$5
$0
$5
$10
$15
$20
$25
$30
$35
United Kingdom France Mexico
Mill
ions
20042005
Chart 25: Iron and Steel Products—Change in Indiana Exports to Key Destinations
$1
$13
$0
$6
$39
$3$0$5
$10$15$20$25$30$35$40$45
Hungary Canada China
Mill
ions
20042005
Chart 23: Miscellaneous Chemicals—Change in Indiana Exports to Key Destinations
-$9
$8 $9
$27
-$8
-$34-$40
-$30
-$20
-$10
$0
$10
$20
$30
Canada Brazil UnitedKingdomM
illio
ns
20042005
20Indiana’s Global Exports: Year-End Report for 2005
appendix
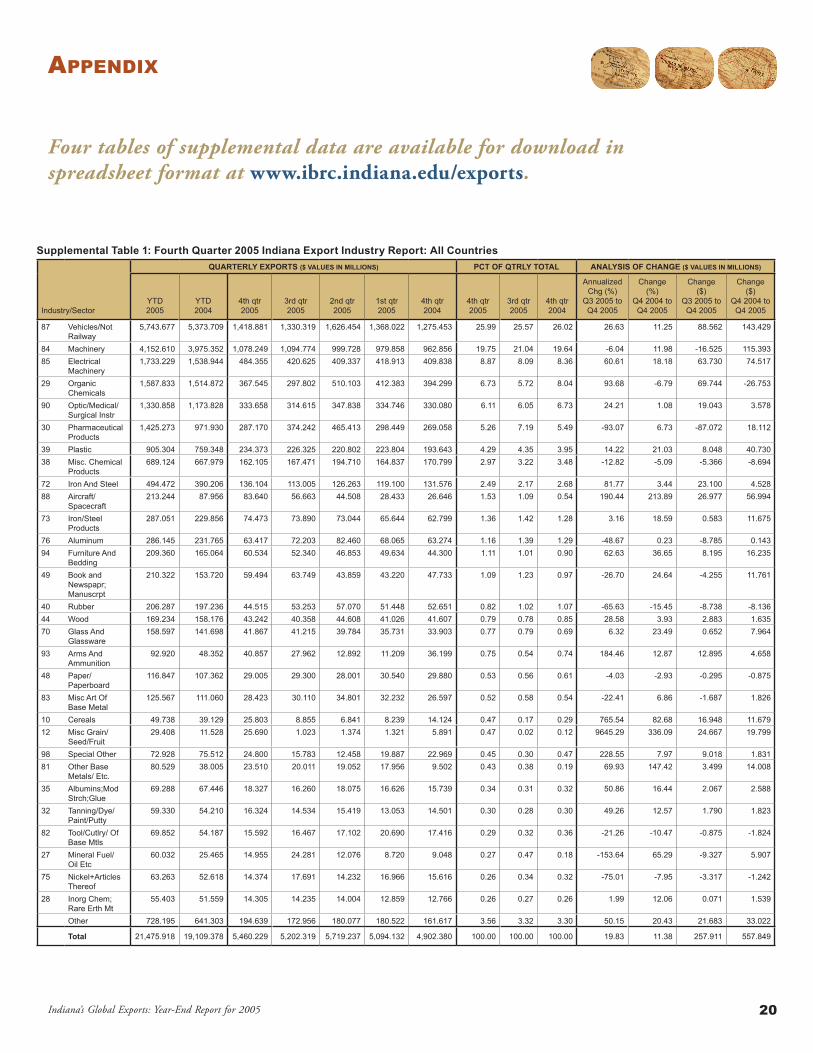
Four tables of supplemental data are available for download in spreadsheet format at www.ibrc.indiana.edu/exports.
Supplemental Table 1: Fourth Quarter 2005 Indiana Export Industry Report: All CountriesQUARTERLY EXPORTS ($ VALUES IN MILLIONS) PCT OF QTRLY TOTAL ANALYSIS OF CHANGE ($ VALUES IN MILLIONS)
Industry/SectorYTD 2005
YTD 2004
4th qtr 2005
3rd qtr 2005
2nd qtr 2005
1st qtr 2005
4th qtr 2004
4th qtr 2005
3rd qtr 2005
4th qtr 2004
Annualized Chg (%)
Q3 2005 to Q4 2005
Change (%)
Q4 2004 to Q4 2005
Change ($)
Q3 2005 to Q4 2005
Change ($)
Q4 2004 to Q4 2005
87 Vehicles/Not Railway
5,743.677 5,373.709 1,418.881 1,330.319 1,626.454 1,368.022 1,275.453 25.99 25.57 26.02 26.63 11.25 88.562 143.429
84 Machinery 4,152.610 3,975.352 1,078.249 1,094.774 999.728 979.858 962.856 19.75 21.04 19.64 -6.04 11.98 -16.525 115.39385 Electrical
Machinery1,733.229 1,538.944 484.355 420.625 409.337 418.913 409.838 8.87 8.09 8.36 60.61 18.18 63.730 74.517
29 Organic Chemicals
1,587.833 1,514.872 367.545 297.802 510.103 412.383 394.299 6.73 5.72 8.04 93.68 -6.79 69.744 -26.753
90 Optic/Medical/Surgical Instr
1,330.858 1,173.828 333.658 314.615 347.838 334.746 330.080 6.11 6.05 6.73 24.21 1.08 19.043 3.578
30 Pharmaceutical Products
1,425.273 971.930 287.170 374.242 465.413 298.449 269.058 5.26 7.19 5.49 -93.07 6.73 -87.072 18.112
39 Plastic 905.304 759.348 234.373 226.325 220.802 223.804 193.643 4.29 4.35 3.95 14.22 21.03 8.048 40.73038 Misc. Chemical
Products689.124 667.979 162.105 167.471 194.710 164.837 170.799 2.97 3.22 3.48 -12.82 -5.09 -5.366 -8.694
72 Iron And Steel 494.472 390.206 136.104 113.005 126.263 119.100 131.576 2.49 2.17 2.68 81.77 3.44 23.100 4.52888 Aircraft/
Spacecraft213.244 87.956 83.640 56.663 44.508 28.433 26.646 1.53 1.09 0.54 190.44 213.89 26.977 56.994
73 Iron/Steel Products
287.051 229.856 74.473 73.890 73.044 65.644 62.799 1.36 1.42 1.28 3.16 18.59 0.583 11.675
76 Aluminum 286.145 231.765 63.417 72.203 82.460 68.065 63.274 1.16 1.39 1.29 -48.67 0.23 -8.785 0.14394 Furniture And
Bedding209.360 165.064 60.534 52.340 46.853 49.634 44.300 1.11 1.01 0.90 62.63 36.65 8.195 16.235
49 Book and Newspapr; Manuscrpt
210.322 153.720 59.494 63.749 43.859 43.220 47.733 1.09 1.23 0.97 -26.70 24.64 -4.255 11.761
40 Rubber 206.287 197.236 44.515 53.253 57.070 51.448 52.651 0.82 1.02 1.07 -65.63 -15.45 -8.738 -8.13644 Wood 169.234 158.176 43.242 40.358 44.608 41.026 41.607 0.79 0.78 0.85 28.58 3.93 2.883 1.63570 Glass And
Glassware158.597 141.698 41.867 41.215 39.784 35.731 33.903 0.77 0.79 0.69 6.32 23.49 0.652 7.964
93 Arms And Ammunition
92.920 48.352 40.857 27.962 12.892 11.209 36.199 0.75 0.54 0.74 184.46 12.87 12.895 4.658
48 Paper/Paperboard
116.847 107.362 29.005 29.300 28.001 30.540 29.880 0.53 0.56 0.61 -4.03 -2.93 -0.295 -0.875
83 Misc Art Of Base Metal
125.567 111.060 28.423 30.110 34.801 32.232 26.597 0.52 0.58 0.54 -22.41 6.86 -1.687 1.826
10 Cereals 49.738 39.129 25.803 8.855 6.841 8.239 14.124 0.47 0.17 0.29 765.54 82.68 16.948 11.67912 Misc Grain/
Seed/Fruit29.408 11.528 25.690 1.023 1.374 1.321 5.891 0.47 0.02 0.12 9645.29 336.09 24.667 19.799
98 Special Other 72.928 75.512 24.800 15.783 12.458 19.887 22.969 0.45 0.30 0.47 228.55 7.97 9.018 1.83181 Other Base
Metals/ Etc.80.529 38.005 23.510 20.011 19.052 17.956 9.502 0.43 0.38 0.19 69.93 147.42 3.499 14.008
35 Albumins;Mod Strch;Glue
69.288 67.446 18.327 16.260 18.075 16.626 15.739 0.34 0.31 0.32 50.86 16.44 2.067 2.588
32 Tanning/Dye/Paint/Putty
59.330 54.210 16.324 14.534 15.419 13.053 14.501 0.30 0.28 0.30 49.26 12.57 1.790 1.823
82 Tool/Cutlry/ Of Base Mtls
69.852 54.187 15.592 16.467 17.102 20.690 17.416 0.29 0.32 0.36 -21.26 -10.47 -0.875 -1.824
27 Mineral Fuel/ Oil Etc
60.032 25.465 14.955 24.281 12.076 8.720 9.048 0.27 0.47 0.18 -153.64 65.29 -9.327 5.907
75 Nickel+Articles Thereof
63.263 52.618 14.374 17.691 14.232 16.966 15.616 0.26 0.34 0.32 -75.01 -7.95 -3.317 -1.242
28 Inorg Chem; Rare Erth Mt
55.403 51.559 14.305 14.235 14.004 12.859 12.766 0.26 0.27 0.26 1.99 12.06 0.071 1.539
Other 728.195 641.303 194.639 172.956 180.077 180.522 161.617 3.56 3.32 3.30 50.15 20.43 21.683 33.022
Total 21,475.918 19,109.378 5,460.229 5,202.319 5,719.237 5,094.132 4,902.380 100.00 100.00 100.00 19.83 11.38 257.911 557.849