Embed Size (px)
Citation preview

1
Year of Enrollment PortfoliosThe Portfolios in the Year of Enrollment Investment Option are designed to
take into account a Beneficiary’s age and your investing time horizon - i.e.,
the number of years before the Beneficiary is expected to attend an Eligible
Educational Institution. In general, for younger Beneficiaries, the Portfolios will
be invested more heavily in Underlying Funds that invest in stocks to capitalize
on the longer investment horizon and to try to maximize returns. As time
passes, assets are moved automatically to more conservative Underlying Funds
in an effort to preserve capital as the time for distribution approaches. There is
no assurance that any Portfolio will be able to reach its goal.
Although the asset allocation of the Year of Enrollment Portfolios is designed
to correspond with your Beneficiary’s expected year of enrollment at an Eligible
Educational Institution, you may choose to invest in a Portfolio other than the
one that corresponds to your Beneficiary’s expected enrollment. There may
be additional investment risks associated with selecting a Year of Enrollment
Portfolio that does not match your Beneficiary’s expected year of enrollment.
Please consult with a financial advisor before making an investment decision.
2
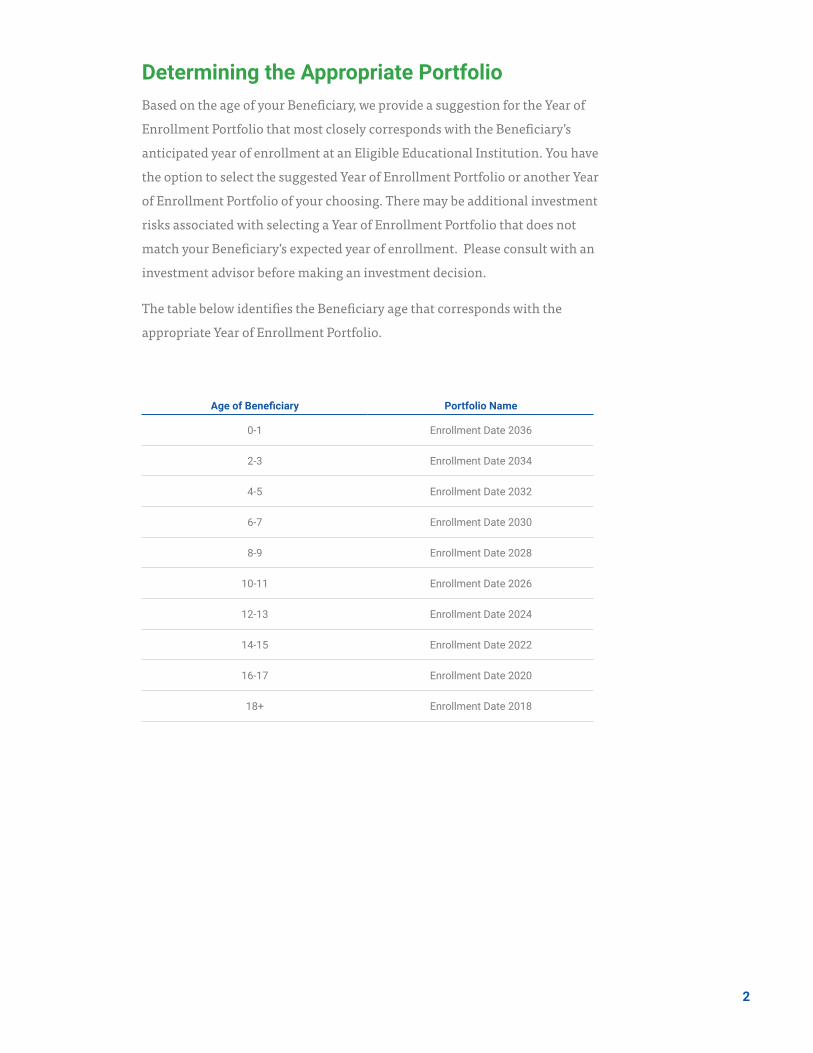
Determining the Appropriate Portfolio Based on the age of your Beneficiary, we provide a suggestion for the Year of
Enrollment Portfolio that most closely corresponds with the Beneficiary’s
anticipated year of enrollment at an Eligible Educational Institution. You have
the option to select the suggested Year of Enrollment Portfolio or another Year
of Enrollment Portfolio of your choosing. There may be additional investment
risks associated with selecting a Year of Enrollment Portfolio that does not
match your Beneficiary’s expected year of enrollment. Please consult with an
investment advisor before making an investment decision.
The table below identifies the Beneficiary age that corresponds with the
appropriate Year of Enrollment Portfolio.
Age of Beneficiary Portfolio Name
0-1 Enrollment Date 2036
2-3 Enrollment Date 2034
4-5 Enrollment Date 2032
6-7 Enrollment Date 2030
8-9 Enrollment Date 2028
10-11 Enrollment Date 2026
12-13 Enrollment Date 2024
14-15 Enrollment Date 2022
16-17 Enrollment Date 2020
18+ Enrollment Date 2018
3
With the exception of the Enrollment Date 2018 Portfolio, Year of Enrollment
Portfolios are designed to evolve over time—to transition from a heavier
allocation to Underlying Funds that invest in equities (stocks) in earlier years to
a more conservative Underlying Funds that invest in fixed income (bonds) and
money market instruments (cash preservation) as the Beneficiary approaches
college age. This change in allocations among Underlying Funds will take place
at least every two years and in some cases on an annual basis. As a result, the
risk profile of the Portfolio typically decreases over time, corresponding to its
decreasing allocations to Underlying Funds invested in equities. This change in
asset allocation over time is known as a “glide path” that helps smooth the shift
from capital accumulation in the earlier years to capital preservation later on:
• Early years (0-9 years old) – In general, when the Beneficiary is younger,
each Year of Enrollment Portfolio will hold Underlying Funds more heavily
invested in equities to capitalize on the longer investment horizon and to
try to maximize returns.
• Middle years (10-17 years old) – As time passes, Year of Enrollment
Portfolio assets are increasingly reallocated to Underlying Funds investing
in conservative investments, such as fixed income and money market
instruments, in an effort to preserve capital as the time for distribution
approaches. Portfolios with more Underlying Funds invested in fixed
income instruments and other investments that seek capital preservation
tend to be less volatile than those with a higher percentage of Underlying
Funds invested in equities.
• College enrollment (18+) – At college age, the Year of Enrollment
Portfolios seek to minimize risk. The asset allocation remains static because
the Portfolio is already at its most conservative phase when Beneficiaries
are currently attending college. There is also a substantial cash component
(Money Market Fund) in the Portfolios to meet college-related distribution
needs.
Portfolios with more Underlying Funds invested in bonds and money market
securities tend to be less volatile than those with higher percentage of
Underlying Funds invested in stocks. Less-volatile Portfolios generally will not
decline as far when stock markets go down, but they also generally will not
appreciate in value as much when stock markets go up.
Here’s How it Works
4
We perform systematic calculations to allocate daily cash flows to the
Underlying Funds in an attempt to bring the Portfolios back to their target asset
allocations. In addition, we will perform quarterly rebalancing to bring the
Portfolios back to their target allocations.
Portfolio Rebalancing
The risks related to each Year of Enrollment Portfolio are weighted in relation
to the percentage of the Portfolio invested in each Underlying Fund. A
discussion of the risk factors relating to each Portfolio and Underlying Funds
can be found in the Descriptions of Principal Risks by Fund Company section
of the DreamAhead Program Details Booklet, starting on page 48.
Risks
5
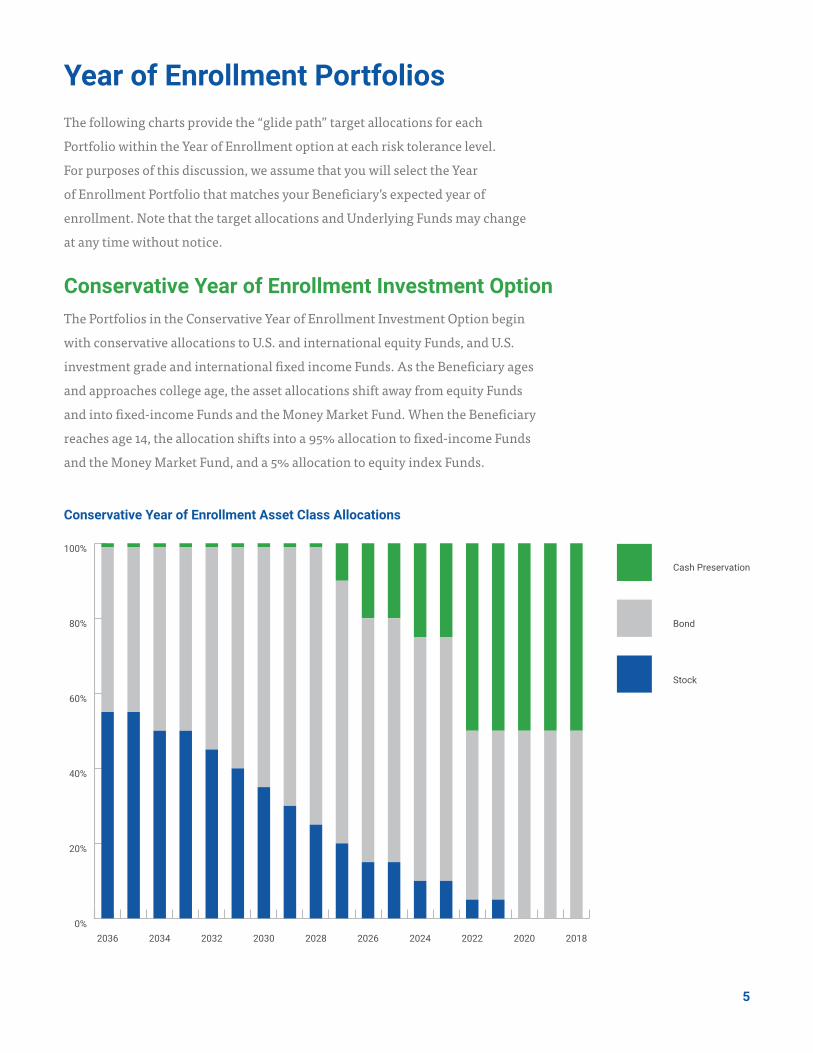
The following charts provide the “glide path” target allocations for each
Portfolio within the Year of Enrollment option at each risk tolerance level.
For purposes of this discussion, we assume that you will select the Year
of Enrollment Portfolio that matches your Beneficiary’s expected year of
enrollment. Note that the target allocations and Underlying Funds may change
at any time without notice.
The Portfolios in the Conservative Year of Enrollment Investment Option begin
with conservative allocations to U.S. and international equity Funds, and U.S.
investment grade and international fixed income Funds. As the Beneficiary ages
and approaches college age, the asset allocations shift away from equity Funds
and into fixed-income Funds and the Money Market Fund. When the Beneficiary
reaches age 14, the allocation shifts into a 95% allocation to fixed-income Funds
and the Money Market Fund, and a 5% allocation to equity index Funds.
Year of Enrollment Portfolios
Conservative Year of Enrollment Investment Option
Conservative Year of Enrollment Asset Class Allocations
0%
20%
40%
60%
80%
100%
Cash Preservation
Bond
Stock
2018202020222024202620282030203220342036
6
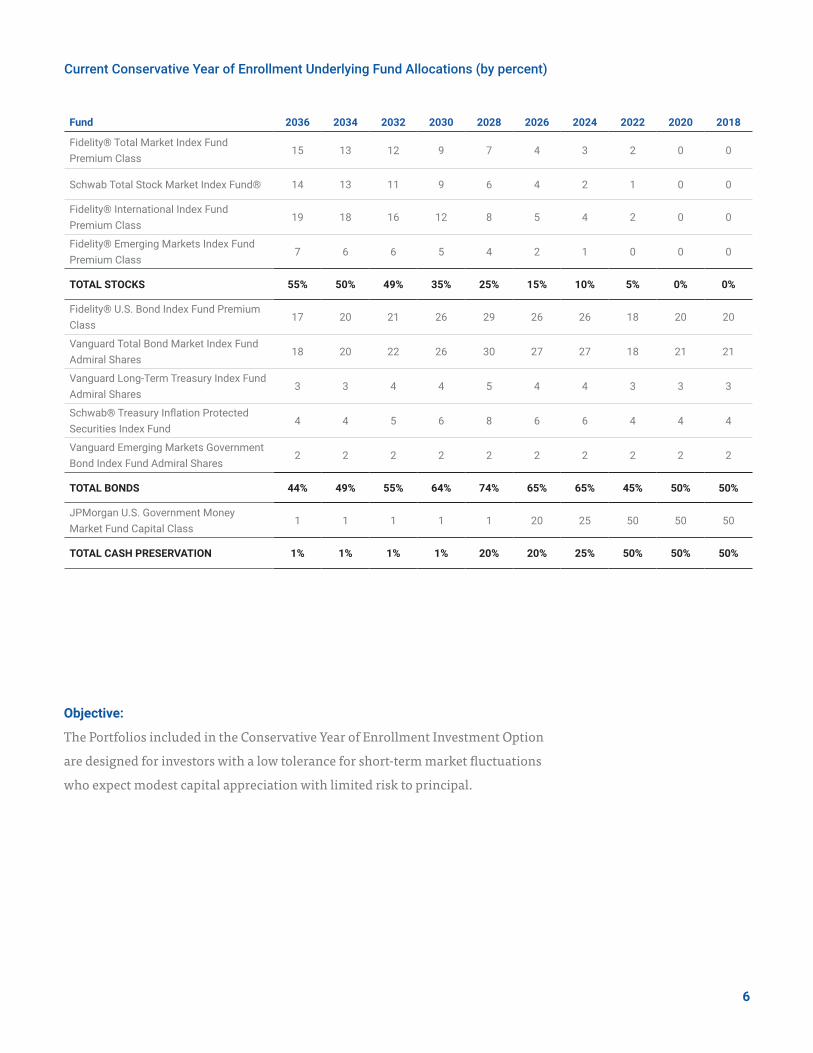
Fund 2036 2034 2032 2030 2028 2026 2024 2022 2020 2018
Fidelity® Total Market Index Fund Premium Class
15 13 12 9 7 4 3 2 0 0
Schwab Total Stock Market Index Fund® 14 13 11 9 6 4 2 1 0 0
Fidelity® International Index Fund Premium Class
19 18 16 12 8 5 4 2 0 0
Fidelity® Emerging Markets Index Fund Premium Class
7 6 6 5 4 2 1 0 0 0
TOTAL STOCKS 55% 50% 49% 35% 25% 15% 10% 5% 0% 0%
Fidelity® U.S. Bond Index Fund Premium Class
17 20 21 26 29 26 26 18 20 20
Vanguard Total Bond Market Index Fund Admiral Shares
18 20 22 26 30 27 27 18 21 21
Vanguard Long-Term Treasury Index Fund Admiral Shares
3 3 4 4 5 4 4 3 3 3
Schwab® Treasury Inflation Protected Securities Index Fund
4 4 5 6 8 6 6 4 4 4
Vanguard Emerging Markets Government Bond Index Fund Admiral Shares
2 2 2 2 2 2 2 2 2 2
TOTAL BONDS 44% 49% 55% 64% 74% 65% 65% 45% 50% 50%
JPMorgan U.S. Government Money Market Fund Capital Class
1 1 1 1 1 20 25 50 50 50
TOTAL CASH PRESERVATION 1% 1% 1% 1% 20% 20% 25% 50% 50% 50%
Current Conservative Year of Enrollment Underlying Fund Allocations (by percent)
Objective:
The Portfolios included in the Conservative Year of Enrollment Investment Option
are designed for investors with a low tolerance for short-term market fluctuations
who expect modest capital appreciation with limited risk to principal.
7
Strategy:
The Conservative Year of Enrollment Portfolios currently invest in the
following Funds: Fidelity® Total Market Index Fund Premium Class, Schwab
Total Stock Market Index Fund®, Fidelity® International Index Fund Premium
Class, Fidelity® Emerging Markets Index Fund Premium Class, Fidelity® U.S.
Bond Index Fund Premium Class, Vanguard Total Bond Market Index Fund
Admiral Shares, Vanguard Long-Term Treasury Index Fund Admiral Shares,
Schwab® Treasury Inflation Protected Securities Index Fund, Vanguard
Emerging Markets Government Bond Index Fund Admiral Shares and
JPMorgan U.S. Government Money Market Fund Capital Class.
The Portfolios’ Underlying Funds include a wide spectrum of public,
investment-grade, taxable, fixed income securities issued in the U.S. to
provide potential income through interest payments. The Money Market
Fund may add stability to the Portfolios by investing in cash equivalents, like
U.S. Treasury bills, certificates of deposit and money market instruments.
Also included in the Portfolios are smaller positions in U.S. Treasury
Inflation Protected Securities (TIPS), U.S. dollar-denominated bonds
issued by governments and government-related issuers in emerging
market countries, and investments in debt issued by the U.S. Treasury (not
including inflation-protected bonds) and U.S. government agencies, as well
as corporate or dollar-denominated foreign debt guaranteed by the U.S.
government, with maturities greater than 10 years.
The stock investments in the Portfolios consist of indirect investments in
mostly large-capitalization U.S. stocks and, to a lesser extent, mid-, small-,
and micro-capitalization U.S. stocks; and international stocks.
The Portfolios typically begin with a 55% allocation to U.S. and international
equity Funds, 44% in the U.S. investment grade and international fixed
income Funds and 1% in the Money Market Fund. As the Beneficiary ages
and approaches college age, the asset allocations typically shift away from
equity Funds and into fixed-income Funds and the Money Market Fund.
During the college years, the Portfolio maintains a 50% allocation to fixed-
income Funds and 50% in the Money Market Fund.
8
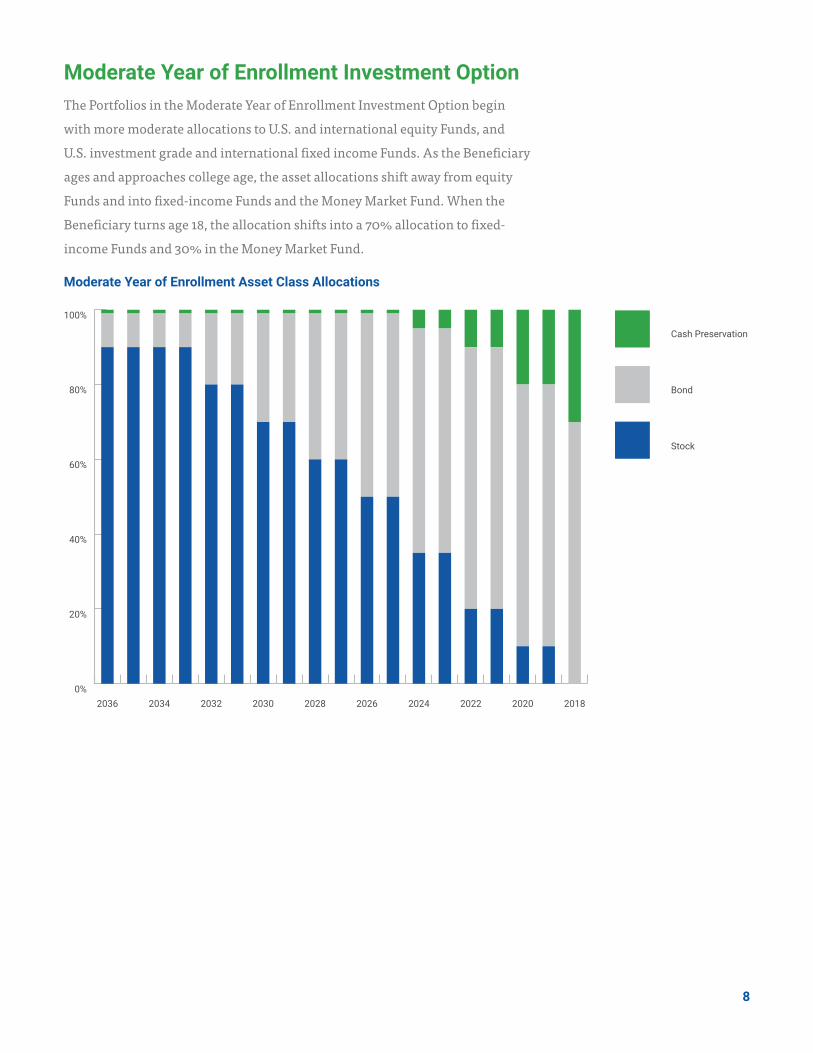
The Portfolios in the Moderate Year of Enrollment Investment Option begin
with more moderate allocations to U.S. and international equity Funds, and
U.S. investment grade and international fixed income Funds. As the Beneficiary
ages and approaches college age, the asset allocations shift away from equity
Funds and into fixed-income Funds and the Money Market Fund. When the
Beneficiary turns age 18, the allocation shifts into a 70% allocation to fixed-
income Funds and 30% in the Money Market Fund.
Moderate Year of Enrollment Asset Class Allocations
Moderate Year of Enrollment Investment Option
0%
20%
40%
60%
80%
100%
Cash Preservation
Bond
Stock
2018202020222024202620282030203220342036
9
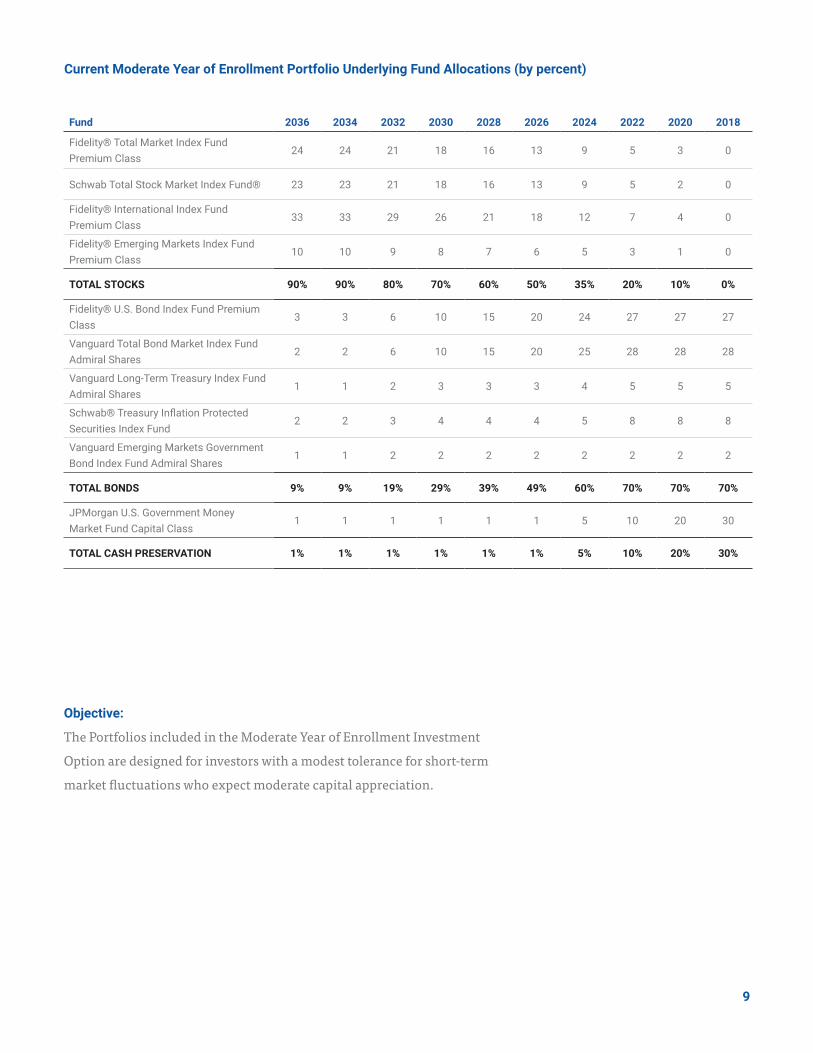
Fund 2036 2034 2032 2030 2028 2026 2024 2022 2020 2018
Fidelity® Total Market Index Fund Premium Class
24 24 21 18 16 13 9 5 3 0
Schwab Total Stock Market Index Fund® 23 23 21 18 16 13 9 5 2 0
Fidelity® International Index Fund Premium Class
33 33 29 26 21 18 12 7 4 0
Fidelity® Emerging Markets Index Fund Premium Class
10 10 9 8 7 6 5 3 1 0
TOTAL STOCKS 90% 90% 80% 70% 60% 50% 35% 20% 10% 0%
Fidelity® U.S. Bond Index Fund Premium Class
3 3 6 10 15 20 24 27 27 27
Vanguard Total Bond Market Index Fund Admiral Shares
2 2 6 10 15 20 25 28 28 28
Vanguard Long-Term Treasury Index Fund Admiral Shares
1 1 2 3 3 3 4 5 5 5
Schwab® Treasury Inflation Protected Securities Index Fund
2 2 3 4 4 4 5 8 8 8
Vanguard Emerging Markets Government Bond Index Fund Admiral Shares
1 1 2 2 2 2 2 2 2 2
TOTAL BONDS 9% 9% 19% 29% 39% 49% 60% 70% 70% 70%
JPMorgan U.S. Government Money Market Fund Capital Class
1 1 1 1 1 1 5 10 20 30
TOTAL CASH PRESERVATION 1% 1% 1% 1% 1% 1% 5% 10% 20% 30%
Current Moderate Year of Enrollment Portfolio Underlying Fund Allocations (by percent)
Objective:
The Portfolios included in the Moderate Year of Enrollment Investment
Option are designed for investors with a modest tolerance for short-term
market fluctuations who expect moderate capital appreciation.
10
Strategy:
The Moderate Year of Enrollment Portfolios currently invest in the following
Funds: Fidelity® Total Market Index Fund Premium Class, Schwab Total Stock
Market Index Fund®, Fidelity® International Index Fund Premium Class,
Fidelity® Emerging Markets Index Fund Premium Class, Fidelity® U.S. Bond
Index Fund Premium Class, Vanguard Total Bond Market Index Fund Admiral
Shares, Vanguard Long-Term Treasury Index Fund Admiral Shares, Schwab®
Treasury Inflation Protected Securities Index Fund, Vanguard Emerging Markets
Government Bond Index Fund Admiral Shares and JPMorgan U.S. Government
Money Market Fund Capital Class.
The Portfolios’ Underlying Funds include stock investments consisting of
indirect investments in mostly large-capitalization U.S. stocks and, to a lesser
extent, mid-, small-, and micro-capitalization U.S. stocks; and international
stocks.
The bond Fund investments include a wide spectrum of public, investment-
grade, taxable, fixed income securities issued in the U.S. to provide potential
income through interest payments. The Money Market Fund may add stability to
the Portfolio by investing in cash equivalents, like U.S. Treasury bills, certificates
of deposit and Money Market instruments. Also included in the Portfolios are
smaller positions in TIPS, U.S. dollar-denominated bonds issued by governments
and government-related issuers in emerging market countries, and investments
in debt issued by the U.S. Treasury (not including inflation-protected bonds) and
U.S. government agencies, as well as corporate or dollar-denominated foreign
debt guaranteed by the U.S. government, with maturities greater than 10 years.
The Portfolios typically begin with a 90% allocation to U.S. and international
equity Funds, 9% to U.S. investment grade and international fixed income Funds
and 1% to the Money Market Fund. As the Beneficiary ages and approaches
college age, the asset allocations typically shift away from equity Funds and into
fixed-income Funds and the Money Market Fund. When the Beneficiary reaches
age 18, the allocation shifts into a 70% allocation to fixed-income Funds and
30% in the Money Market Fund.
11
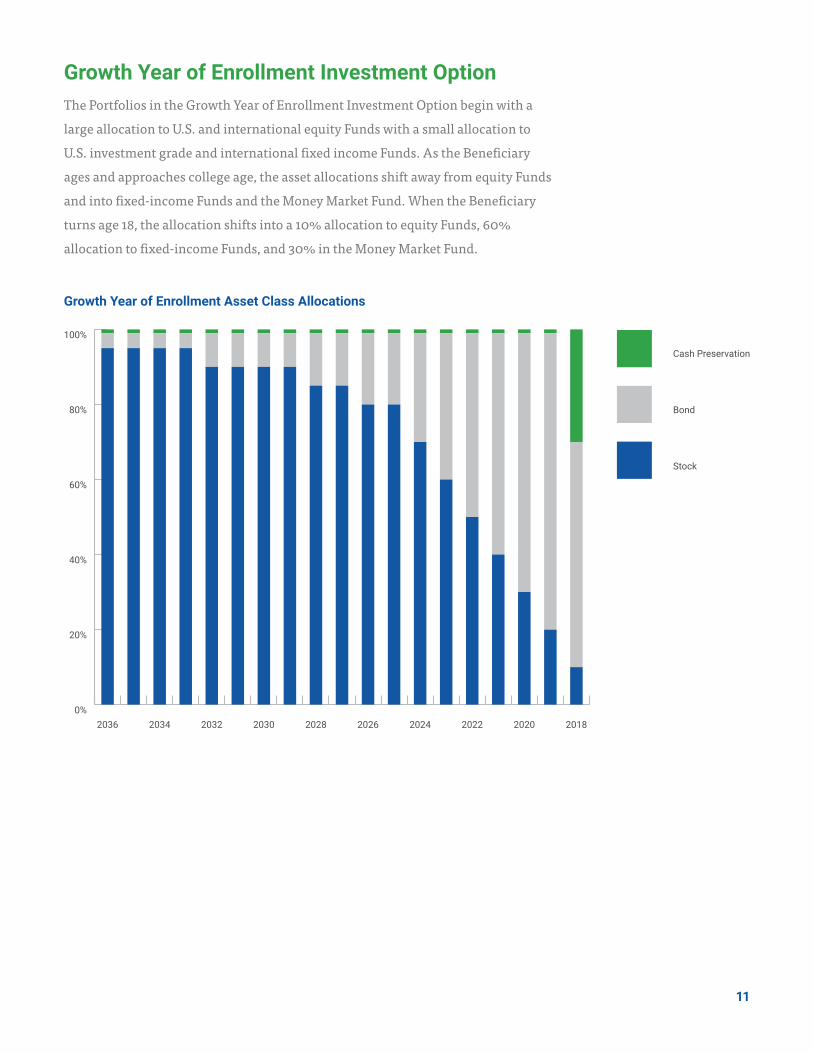
The Portfolios in the Growth Year of Enrollment Investment Option begin with a
large allocation to U.S. and international equity Funds with a small allocation to
U.S. investment grade and international fixed income Funds. As the Beneficiary
ages and approaches college age, the asset allocations shift away from equity Funds
and into fixed-income Funds and the Money Market Fund. When the Beneficiary
turns age 18, the allocation shifts into a 10% allocation to equity Funds, 60%
allocation to fixed-income Funds, and 30% in the Money Market Fund.
Growth Year of Enrollment Investment Option
Growth Year of Enrollment Asset Class Allocations
0%
20%
40%
60%
80%
100%
Cash Preservation
Bond
Stock
2018202020222024202620282030203220342036
12
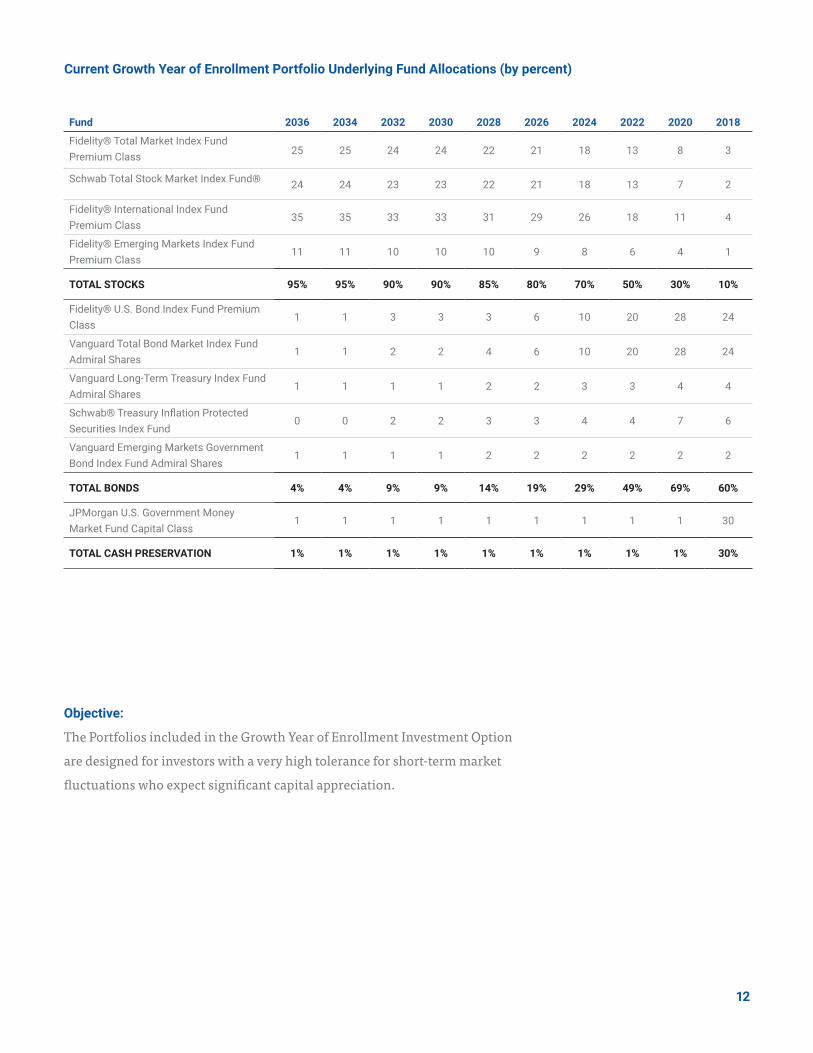
Fund 2036 2034 2032 2030 2028 2026 2024 2022 2020 2018
Fidelity® Total Market Index Fund Premium Class 25 25 24 24 22 21 18 13 8 3
Schwab Total Stock Market Index Fund® 24 24 23 23 22 21 18 13 7 2
Fidelity® International Index Fund Premium Class
35 35 33 33 31 29 26 18 11 4
Fidelity® Emerging Markets Index Fund Premium Class
11 11 10 10 10 9 8 6 4 1
TOTAL STOCKS 95% 95% 90% 90% 85% 80% 70% 50% 30% 10%
Fidelity® U.S. Bond Index Fund Premium Class
1 1 3 3 3 6 10 20 28 24
Vanguard Total Bond Market Index Fund Admiral Shares
1 1 2 2 4 6 10 20 28 24
Vanguard Long-Term Treasury Index Fund Admiral Shares
1 1 1 1 2 2 3 3 4 4
Schwab® Treasury Inflation Protected Securities Index Fund
0 0 2 2 3 3 4 4 7 6
Vanguard Emerging Markets Government Bond Index Fund Admiral Shares
1 1 1 1 2 2 2 2 2 2
TOTAL BONDS 4% 4% 9% 9% 14% 19% 29% 49% 69% 60%
JPMorgan U.S. Government Money Market Fund Capital Class
1 1 1 1 1 1 1 1 1 30
TOTAL CASH PRESERVATION 1% 1% 1% 1% 1% 1% 1% 1% 1% 30%
Current Growth Year of Enrollment Portfolio Underlying Fund Allocations (by percent)
Objective:
The Portfolios included in the Growth Year of Enrollment Investment Option
are designed for investors with a very high tolerance for short-term market
fluctuations who expect significant capital appreciation.
13
Strategy:
The Growth Year of Enrollment Portfolios currently invest in the following
Funds: Fidelity® Total Market Index Fund Premium Class, Schwab Total Stock
Market Index Fund®, Fidelity® International Index Fund Premium Class,
Fidelity® Emerging Markets Index Fund Premium Class, Fidelity® U.S. Bond
Index Fund Premium Class, Vanguard Total Bond Market Index Fund Admiral
Shares, Vanguard Long-Term Treasury Index Fund Admiral Shares, Schwab®
Treasury Inflation Protected Securities Index Fund, Vanguard Emerging
Markets Government Bond Index Fund Admiral Shares and JPMorgan U.S.
Government Money Market Fund Capital Class. Funds used in the Portfolio may
change at any time without notice.
The Portfolios’ Underlying Funds include stock investments consisting of
indirect investments in mostly large-capitalization U.S. stocks and, to a lesser
extent, mid-, small-, and micro-capitalization U.S. stocks; and international
stocks.
The fixed income investments include a wide spectrum of public, investment-
grade, taxable, fixed income securities issued in the U.S. to provide potential
income through interest payments. The Money Market Fund may add stability
to the Portfolios by investing in cash equivalents, like U.S. Treasury bills,
certificates of deposit and money market instruments. Also included in the
Portfolios are smaller positions in TIPS, U.S. dollar-denominated bonds issued
by governments and government-related issuers in emerging market countries,
and investments in debt issued by the U.S. Treasury (not including inflation-
protected bonds) and U.S. government agencies, as well as corporate or dollar-
denominated foreign debt guaranteed by the U.S. government, with maturities
greater than 10 years.
The Portfolios typically begin with a 95% allocation to U.S. and international
equity Funds, 4% to U.S. investment grade and international fixed income
Funds and 1% to the Money Market Fund. As the Beneficiary ages and
approaches college age, the asset allocations typically shift away from equity
Funds and into fixed-income Funds and the Money Market Fund. When the
Beneficiary reaches age 18, the allocation shifts into a 60% allocation to fixed-
income Funds, 30% in the Money Market Fund, and 10% in stock Funds.
14
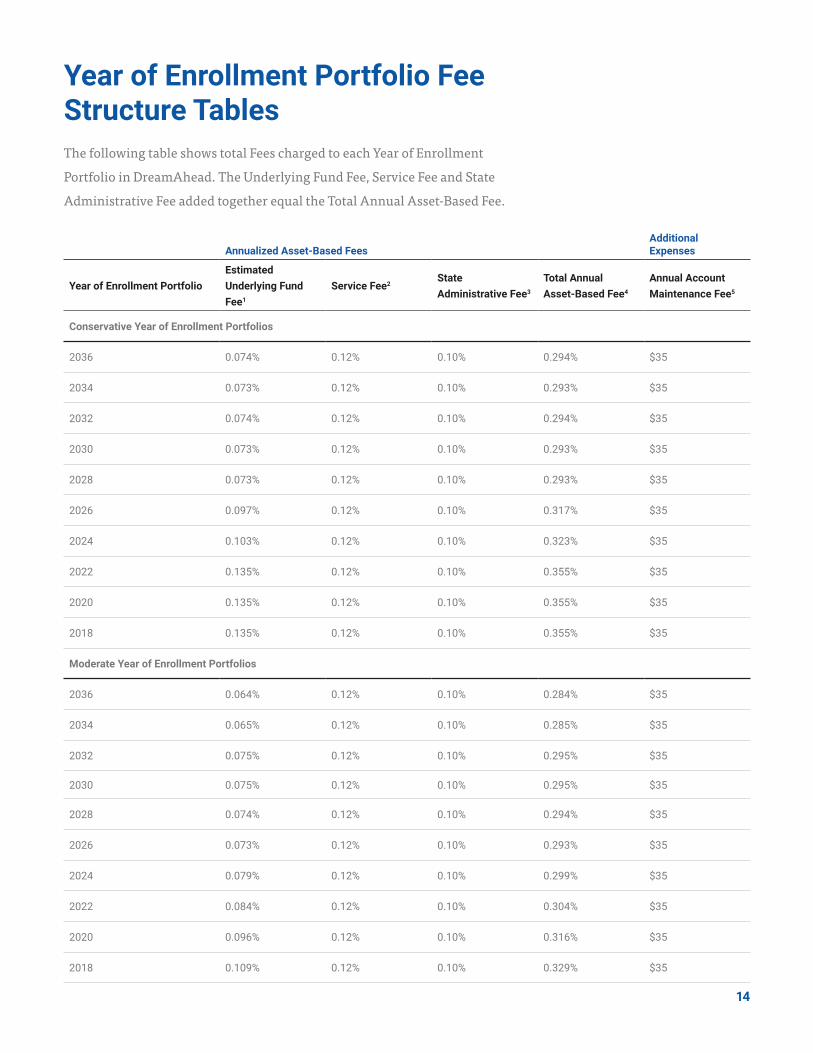
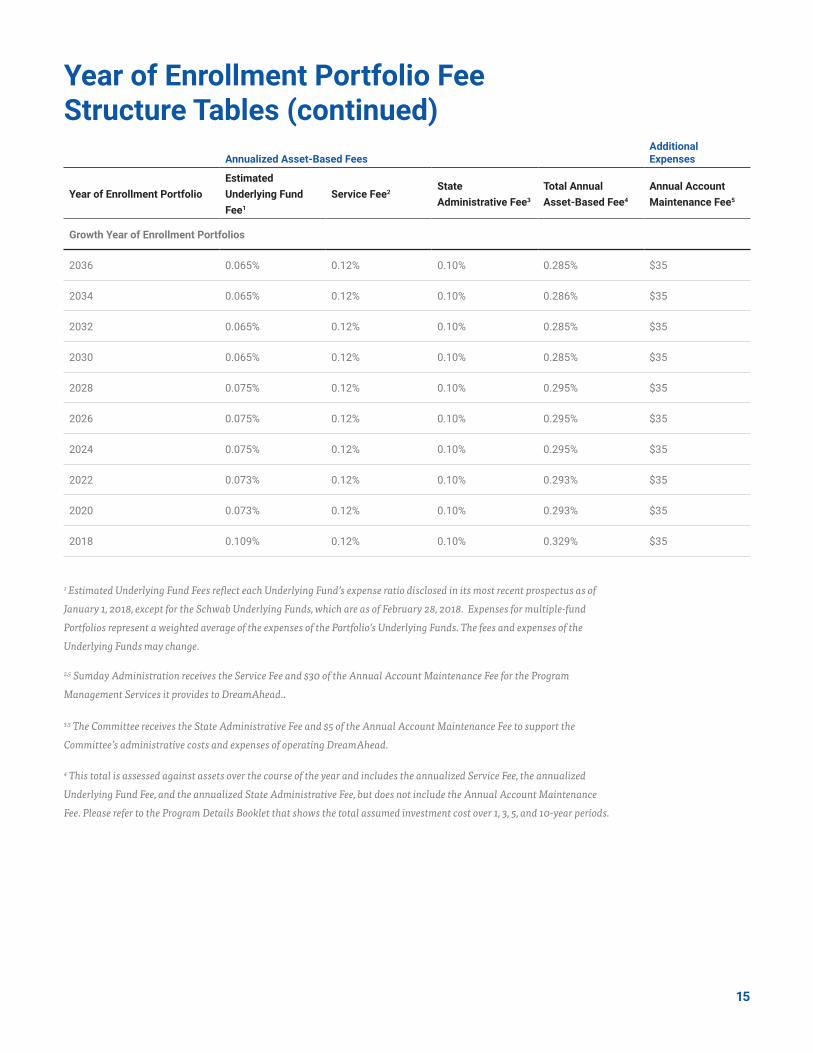
The following table shows total Fees charged to each Year of Enrollment
Portfolio in DreamAhead. The Underlying Fund Fee, Service Fee and State
Administrative Fee added together equal the Total Annual Asset-Based Fee.
Year of Enrollment Portfolio Fee Structure Tables
Annualized Asset-Based FeesAdditional Expenses
Year of Enrollment PortfolioEstimated Underlying Fund Fee1
Service Fee2State Administrative Fee3
Total Annual Asset-Based Fee4
Annual Account Maintenance Fee5
Conservative Year of Enrollment Portfolios
2036 0.074% 0.12% 0.10% 0.294% $35
2034 0.073% 0.12% 0.10% 0.293% $35
2032 0.074% 0.12% 0.10% 0.294% $35
2030 0.073% 0.12% 0.10% 0.293% $35
2028 0.073% 0.12% 0.10% 0.293% $35
2026 0.097% 0.12% 0.10% 0.317% $35
2024 0.103% 0.12% 0.10% 0.323% $35
2022 0.135% 0.12% 0.10% 0.355% $35
2020 0.135% 0.12% 0.10% 0.355% $35
2018 0.135% 0.12% 0.10% 0.355% $35
Moderate Year of Enrollment Portfolios
2036 0.064% 0.12% 0.10% 0.284% $35
2034 0.065% 0.12% 0.10% 0.285% $35
2032 0.075% 0.12% 0.10% 0.295% $35
2030 0.075% 0.12% 0.10% 0.295% $35
2028 0.074% 0.12% 0.10% 0.294% $35
2026 0.073% 0.12% 0.10% 0.293% $35
2024 0.079% 0.12% 0.10% 0.299% $35
2022 0.084% 0.12% 0.10% 0.304% $35
2020 0.096% 0.12% 0.10% 0.316% $35
2018 0.109% 0.12% 0.10% 0.329% $35
15
Annualized Asset-Based FeesAdditional Expenses
Year of Enrollment PortfolioEstimated Underlying Fund Fee1
Service Fee2State Administrative Fee3
Total Annual Asset-Based Fee4
Annual Account Maintenance Fee5
Growth Year of Enrollment Portfolios
2036 0.065% 0.12% 0.10% 0.285% $35
2034 0.065% 0.12% 0.10% 0.286% $35
2032 0.065% 0.12% 0.10% 0.285% $35
2030 0.065% 0.12% 0.10% 0.285% $35
2028 0.075% 0.12% 0.10% 0.295% $35
2026 0.075% 0.12% 0.10% 0.295% $35
2024 0.075% 0.12% 0.10% 0.295% $35
2022 0.073% 0.12% 0.10% 0.293% $35
2020 0.073% 0.12% 0.10% 0.293% $35
2018 0.109% 0.12% 0.10% 0.329% $35
Year of Enrollment Portfolio Fee Structure Tables (continued)
1 Estimated Underlying Fund Fees reflect each Underlying Fund’s expense ratio disclosed in its most recent prospectus as of
January 1, 2018, except for the Schwab Underlying Funds, which are as of February 28, 2018. Expenses for multiple-fund
Portfolios represent a weighted average of the expenses of the Portfolio’s Underlying Funds. The fees and expenses of the
Underlying Funds may change.
2,5 Sumday Administration receives the Service Fee and $30 of the Annual Account Maintenance Fee for the Program
Management Services it provides to DreamAhead..
3,5 The Committee receives the State Administrative Fee and $5 of the Annual Account Maintenance Fee to support the
Committee’s administrative costs and expenses of operating DreamAhead.
4 This total is assessed against assets over the course of the year and includes the annualized Service Fee, the annualized
Underlying Fund Fee, and the annualized State Administrative Fee, but does not include the Annual Account Maintenance
Fee. Please refer to the Program Details Booklet that shows the total assumed investment cost over 1, 3, 5, and 10-year periods.
16
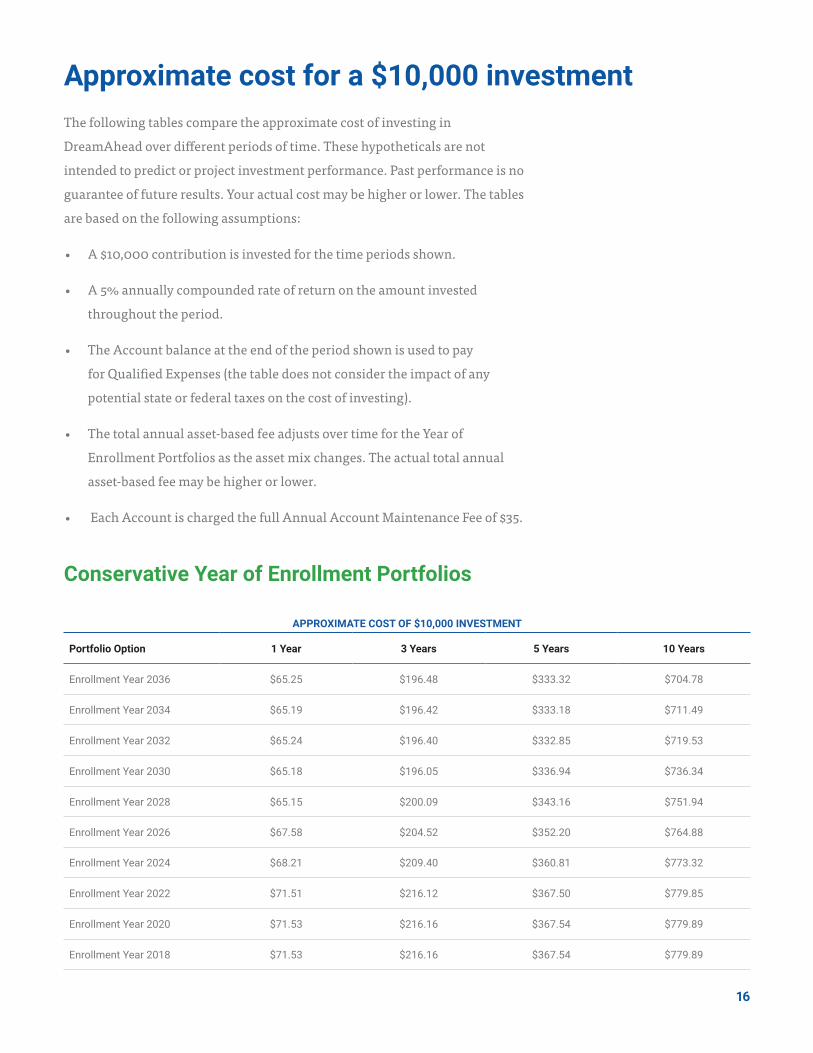
Approximate cost for a $10,000 investmentThe following tables compare the approximate cost of investing in
DreamAhead over different periods of time. These hypotheticals are not
intended to predict or project investment performance. Past performance is no
guarantee of future results. Your actual cost may be higher or lower. The tables
are based on the following assumptions:
• A $10,000 contribution is invested for the time periods shown.
• A 5% annually compounded rate of return on the amount invested
throughout the period.
• The Account balance at the end of the period shown is used to pay
for Qualified Expenses (the table does not consider the impact of any
potential state or federal taxes on the cost of investing).
• The total annual asset-based fee adjusts over time for the Year of
Enrollment Portfolios as the asset mix changes. The actual total annual
asset-based fee may be higher or lower.
• Each Account is charged the full Annual Account Maintenance Fee of $35.
Conservative Year of Enrollment Portfolios
APPROXIMATE COST OF $10,000 INVESTMENT
Portfolio Option 1 Year 3 Years 5 Years 10 Years
Enrollment Year 2036 $65.25 $196.48 $333.32 $704.78
Enrollment Year 2034 $65.19 $196.42 $333.18 $711.49
Enrollment Year 2032 $65.24 $196.40 $332.85 $719.53
Enrollment Year 2030 $65.18 $196.05 $336.94 $736.34
Enrollment Year 2028 $65.15 $200.09 $343.16 $751.94
Enrollment Year 2026 $67.58 $204.52 $352.20 $764.88
Enrollment Year 2024 $68.21 $209.40 $360.81 $773.32
Enrollment Year 2022 $71.51 $216.12 $367.50 $779.85
Enrollment Year 2020 $71.53 $216.16 $367.54 $779.89
Enrollment Year 2018 $71.53 $216.16 $367.54 $779.89
17
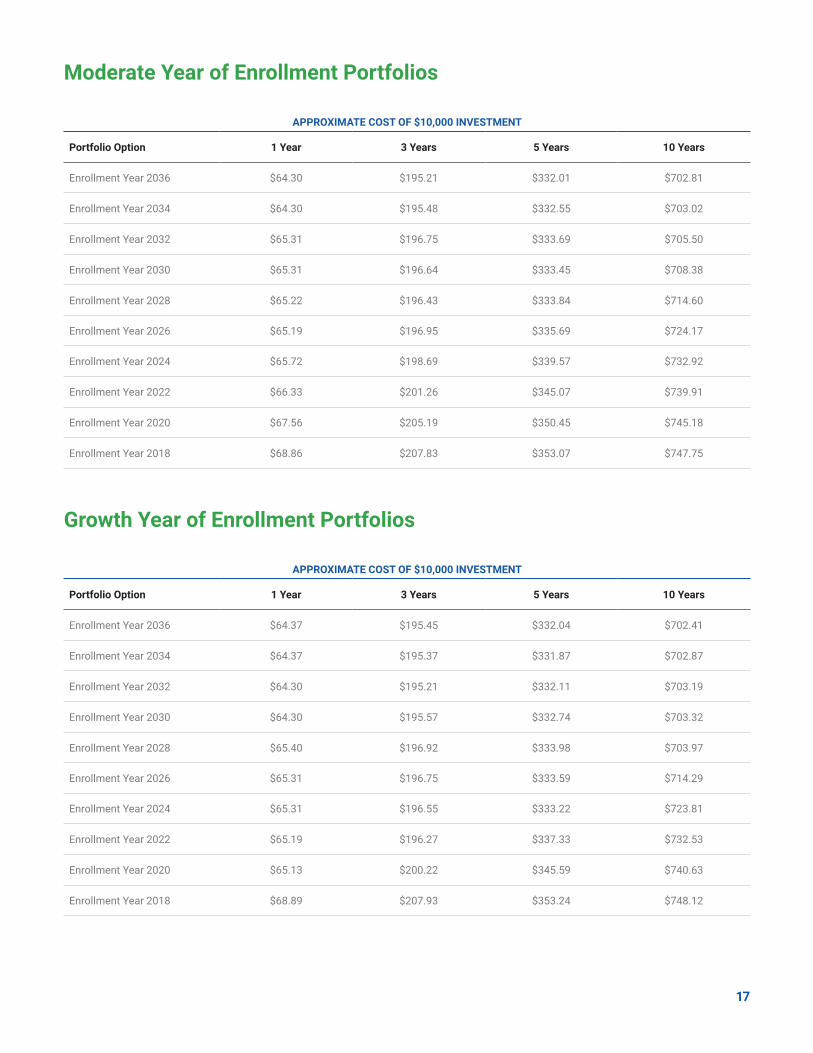
Moderate Year of Enrollment Portfolios
Growth Year of Enrollment Portfolios
APPROXIMATE COST OF $10,000 INVESTMENT
Portfolio Option 1 Year 3 Years 5 Years 10 Years
Enrollment Year 2036 $64.30 $195.21 $332.01 $702.81
Enrollment Year 2034 $64.30 $195.48 $332.55 $703.02
Enrollment Year 2032 $65.31 $196.75 $333.69 $705.50
Enrollment Year 2030 $65.31 $196.64 $333.45 $708.38
Enrollment Year 2028 $65.22 $196.43 $333.84 $714.60
Enrollment Year 2026 $65.19 $196.95 $335.69 $724.17
Enrollment Year 2024 $65.72 $198.69 $339.57 $732.92
Enrollment Year 2022 $66.33 $201.26 $345.07 $739.91
Enrollment Year 2020 $67.56 $205.19 $350.45 $745.18
Enrollment Year 2018 $68.86 $207.83 $353.07 $747.75
APPROXIMATE COST OF $10,000 INVESTMENT
Portfolio Option 1 Year 3 Years 5 Years 10 Years
Enrollment Year 2036 $64.37 $195.45 $332.04 $702.41
Enrollment Year 2034 $64.37 $195.37 $331.87 $702.87
Enrollment Year 2032 $64.30 $195.21 $332.11 $703.19
Enrollment Year 2030 $64.30 $195.57 $332.74 $703.32
Enrollment Year 2028 $65.40 $196.92 $333.98 $703.97
Enrollment Year 2026 $65.31 $196.75 $333.59 $714.29
Enrollment Year 2024 $65.31 $196.55 $333.22 $723.81
Enrollment Year 2022 $65.19 $196.27 $337.33 $732.53
Enrollment Year 2020 $65.13 $200.22 $345.59 $740.63
Enrollment Year 2018 $68.89 $207.93 $353.24 $748.12
18
The following profiles highlight the investment objective, strategy, and a summary of the main
risks of each of the Underlying Funds in which both the Year of Enrollment and the Static
Portfolios invest. The Portfolios in DreamAhead are more likely to meet their goals if each
Underlying Fund in which each Portfolio invests achieves its stated investment objectives.
The information provided in this Program Details Booklet and other information in the links
below has been prepared by or on behalf of the applicable Underlying Fund by its Investment
Manager and has been derived from the applicable Underlying Fund prospectuses. The
Program Administrators assume no responsibility for its accuracy or completeness.
Underlying Funds
Fidelity Underlying Funds
Fidelity Total Market Index Fund - Premium Class
Ticker: FSTVX Website: https://fundresearch.fidelity.com/mutual-funds/summary/315911800
Investment Objective The Fund seeks to provide investment results that correspond to the total return of a broad range of United States stocks.
Principal Investment Strategies
• Normally investing at least 80% of assets in common stocks included in the Dow Jones
U.S. Total Stock Market IndexSM, which represents the performance of a broad range of
U.S. stocks.
• Using statistical sampling techniques based on such factors as capitalization, industry exposures, dividend yield, price/earnings (P/E) ratio, price/book (P/B) ratio, and earnings growth to attempt to replicate the returns of the Dow Jones U.S. Total Stock Market IndexSM using a smaller number of securities.
• Lending securities to earn income for the Fund.
Principal Investment Risks
• Stock Market Volatility; Issuer-Specific Changes; Correlation to Index; and Passive Management Risk
19
Fidelity International Index Fund - Premium Class
Ticker: FSIVX Website: https://fundresearch.fidelity.com/mutual-funds/summary/315911875
Investment Objective The Fund seeks to provide investment results that correspond to the total return of foreign stock markets.
Principal Investment Strategies
• Normally investing at least 80% of assets in common stocks included in the MSCI EAFE Index, which represents the performance of foreign stock markets.
• Using statistical sampling techniques based on such factors as capitalization, industry exposures, dividend yield, price/earnings (P/E) ratio, price/book (P/B) ratio, earnings growth, and country weightings to attempt to replicate the returns of the MSCI EAFE Index.
• Lending securities to earn income for the Fund.
Principal Investment Risks
• Stock Market Volatility; Foreign Exposure; Issuer-Specific Changes; Correlation to Index; and Passive Management Risk
Fidelity Emerging Markets Index Fund – Premium Class
Ticker: FPMAX Website: https://fundresearch.fidelity.com/mutual-funds/summary/316146174
Investment Objective The Fund seeks to provide investment results that correspond to the total return of emerging stock markets.
Principal Investment Strategies
• Normally investing at least 80% of assets in securities included in the MSCI Emerging Markets Index and in depository receipts representing securities included in the index.
• Using statistical sampling techniques based on such factors as capitalization, industry exposures, dividend yield, price/earnings (P/E) ratio, price/book (P/B) ratio, earnings growth, country weightings, and the effect of foreign taxes to attempt to replicate the returns of the MSCI Emerging Markets Index.
• Lending securities to earn income for the Fund.
Principal Investment Risks
• Stock Market Volatility; Foreign and Emerging Market Risk; Issuer-Specific Changes; Correlation to Index; and Passive Management Risk
20
Fidelity U.S. Bond Index Fund - Premium Class
Ticker: FSITX Website: https://fundresearch.fidelity.com/mutual-funds/summary/316146372
Investment Objective The Fund seeks to provide investment results that correspond to the aggregate price and interest performance of the debt securities in the Bloomberg Barclays U.S. Aggregate Bond Index.
Principal Investment Strategies
• Normally investing at least 80% of the Fund’s assets in bonds included in the Bloomberg Barclays U.S. Aggregate Bond Index.
• Using statistical sampling techniques based on duration, maturity, interest rate sensitivity, security structure, and credit quality to attempt to replicate the returns of the Bloomberg Barclays U.S. Aggregate Bond Index using a smaller number of securities.
• Engaging in transactions that have a leveraging effect on the Fund, including investments in derivatives - such as swaps (interest rate, total return, and credit default), options, and futures contracts - and forward-settling securities, to adjust the Fund’s risk exposure.
• Investing in Fidelity’s central funds (specialized investment vehicles used by Fidelity® funds to invest in particular security types or investment disciplines).
Principal Investment Risks
• Interest Rate Changes; Foreign Exposure; Prepayment; Issuer-Specific Changes; Correlation to Index; Passive Management Risk; and Leverage Risk
Vanguard Underlying Funds
Vanguard Emerging Markets Government Bond Index Fund – Admiral Shares
Ticker: VGAVX
Website: https://personal.vanguard.com/us/funds/snapshot?FundId=0520&FundIntExt=INT&funds_disable_redirect=true
Investment Objective The Fund seeks to track the performance of a benchmark index that measures the investment return of U.S. dollar-denominated bonds issued by governments and government-related issuers in emerging market countries.
21
Principal Investment Strategies The Vanguard Emerging Markets Government Bond Index Fund employs an indexing investment approach designed to track the performance of the Bloomberg Barclays USD Emerging Markets Government RIC Capped Index. This index includes U.S. dollar-denominated bonds that have maturities longer than one year and that were issued by emerging market governments and government-related issuers. The index is capped, which means that its exposure to any particular bond issuer is limited to a maximum of 20% and its aggregate exposure to issuers that individually constitute 5% or more of the index is limited to 48%. If the index, as constituted based on market weights, exceeds the 20% or 48% limits, the excess is reallocated to bonds of other issuers represented in the index.
The Fund invests by sampling the index, meaning that it holds a range of securities that, in the aggregate, approximates the full index in terms of key risk factors and other characteristics. All of the Fund’s investments will be selected through the sampling process, and under normal circumstances at least 80% of the Fund’s assets will be invested in bonds included in the index. The Fund maintains a dollar-weighted average maturity consistent with that of the index, which generally ranges between 10 and 15 years and, as of October 31, 2017, was 10.1 years.
Principal Risks
• Country/regional risk; Emerging markets risk; Non-diversification risk; Credit risk; Liquidity risk; Interest rate risk; Income risk; Index sampling risk; Call risk; and Extension risk
A Note on Risk: Many investors invest in bonds and bond funds in an attempt to lower the overall risk of their portfolios. This strategy makes sense when the bonds owned are U.S. bonds because U.S. bond returns typically are not highly correlated with, and are far less volatile than, stock returns. The strategy is less likely to be effective, however, when the bonds owned are emerging market bonds. Returns of emerging market bonds, even dollar-denominated bonds like those owned by the Fund, can be quite volatile and tend to correlate more closely with U.S. and foreign stock returns than with U.S. bond returns. Consequently, if your goal is to lower risk and volatility, this Fund may not be an appropriate investment.
Vanguard Total Bond Market Index Fund – Admiral Shares
Ticker: VBTLX Website: https://personal.vanguard.com/us/funds/snapshot?FundId=0584&FundIntExt=INT&funds_disable_redirect=true
Investment Objective Vanguard Total Bond Market Index Fund seeks to track the performance of a broad, market-weighted bond index.
22
Principal Investment Strategies
The Fund employs an indexing investment approach designed to track the performance of the Bloomberg Barclays U.S. Aggregate Float Adjusted Index. This index represents a wide spectrum of public, investment-grade, taxable, fixed income securities in the United States—including government, corporate, and international dollar-denominated bonds, as well as mortgage-backed and asset-backed securities—all with maturities of more than 1 year.
The Fund invests by sampling the index, meaning that it holds a broadly diversified collection of securities that, in the aggregate, approximates the full index in terms of key risk factors and other characteristics. All of the Fund’s investments will be selected through the sampling process, and at least 80% of the Fund’s assets will be invested in bonds held in the index. The Fund maintains a dollar-weighted average maturity consistent with that of the index, which generally ranges between 5 and 10 years and, as of December 31, 2016, was 8.3 years.
Principal Risks
• Interest rate risk; Income risk; Prepayment risk; Extension risk; Call risk; Credit risk; Index sampling risk; and Liquidity risk
Vanguard Long-Term Treasury Index Fund – Admiral Shares
Ticker: VLGSX Website: https://personal.vanguard.com/us/funds/snapshot?FundId=1944&FundIntExt=INT&funds_disable_redirect=true
Investment Objective Vanguard Long-Term Treasury Index Fund seeks to track the performance of a market-weighted Treasury index with a long-term dollar-weighted average maturity.
Principal Investment Strategies The Fund employs an indexing investment approach designed to track the performance of the Bloomberg Barclays US Long Treasury Bond Index. This index includes fixed income securities issued by the U.S. Treasury (not including inflation- protected bonds), with maturities greater than 10 years.
The Fund invests by sampling the index, meaning that it holds a range of securities that, in the aggregate, approximates the full index in terms of key risk factors and other characteristics. All of the Fund’s investments will be selected through the sampling process, and under normal circumstances, at least 80% of the Fund’s assets will be invested in bonds included in the index. The Fund maintains a dollar- weighted average maturity consistent with that of the index, which was 24.8 years as of August 31, 2017.
Principal Risks
• Interest rate risk; Income risk; Credit risk; and Index sampling risk
23
Schwab Underlying Funds
Schwab Total Stock Market Index Fund
Ticker: SWTSX Website: https://www.schwabfunds.com/public/csim/home/products/mutual_funds/summary.html?symbol=SWTSX
Investment Objective The Fund’s goal is to track the total return of the entire U.S. stock market, as measured by the Dow Jones U.S. Total Stock Market IndexSM.
Principal Investment Strategies To pursue its goal, the Fund generally invests in stocks that are included in the Dow Jones U.S. Total Stock Market Index. It is the Fund’s policy that under normal circumstances it will invest at least 80% of its net assets (including, for this purpose, any borrowings for investment purposes) in these stocks; typically, the actual percentage is considerably higher. The Fund will notify its shareholders at least 60 days before changing this policy.
The Fund generally gives the same weight to a given stock as the index does. However, when the investment adviser believes it is in the best interest of the Fund, such as to avoid purchasing odd-lots (i.e., purchasing less than the usual number of shares traded for a security), for tax considerations, or to address liquidity considerations with respect to a stock, the investment adviser may cause the Fund’s weighting of a stock to be more or less than the index’s weighting of the stock. The Fund may sell securities that are represented in the index in anticipation of their removal from the index or buy securities that are not yet represented in the index in anticipation of their addition to the index.
The Dow Jones U.S. Total Stock Market Index includes all publicly traded stocks of companies headquartered in the United States for which pricing information is readily available – 3,767 stocks as of December 31, 2017. The index is a float-adjusted market capitalization weighted index that reflects the shares of securities actually available to investors in the marketplace.
Because it may not be possible or practical to purchase all of the stocks included in the index, the investment adviser seeks to track the total return of the index by using sampling techniques. These techniques involve investing in a limited number of index securities which, when taken together, are expected to perform similarly to the index as a whole. These techniques are based on a variety of factors, including capitalization, performance attributes, dividend yield, price/earnings ratio, risk factors, industry factors and other characteristics. The Fund generally expects that its portfolio will include the largest 2,000 to 2,800 U.S. stocks (measured by the float-adjusted market capitalization), and that its industry weightings, dividend yield and price/earnings ratio will be similar to those of the index.
Principal Risks
• Market Risk; Equity Risk; Investment Style Risk; Tracking Error Risk; Sampling Index Tracking Risk; Concentration Risk; Market Capitalization Risk; Large-Cap Company Risk; Mid-Cap Company Risk; Small-Cap Company Risk; Derivatives Risk; Liquidity Risk; and Securities Lending Risk
24
Schwab Treasury Inflation Protected Securities Index Fund
Ticker: SWRSX Website: https://www.schwabfunds.com/public/csim/home/products/mutual_funds/summary.html?symbol=SWRSX
Investment Objective The Fund’s goal is to track as closely as possible, before fees and expenses, the price and yield performance of the Bloomberg Barclays U.S. Treasury Inflation Protected Securities (TIPS) Index (Series-L)SM. The Fund’s investment objective is not fundamental and therefore may be changed by the Fund’s board of trustees without shareholder approval.
Principal Investment Strategies To pursue its goal, the Fund generally invests in securities that are included in the index. The index includes all publicly-issued TIPS that have at least one year remaining to maturity, are rated investment grade and have $250 million or more of outstanding face value. The TIPS in the index must be denominated in U.S. dollars and must be fixed-rate and non-convertible.
It is the Fund’s policy that, under normal circumstances, it will invest at least 90% of its net assets (net assets plus borrowings for investment purposes) in securities included in the index.
Principal Risks
• Market Risk; Investment Style Risk; Inflation Protected Security Risk; Interest Rate Risk; Credit Risk; Liquidity Risk; Prepayment and Extension Risk; Sampling Index Tracking Risk; Tracking Error Risk; and Money Market Fund Risk
JP Morgan Underlying Fund
JPMorgan U.S. Government Money Market Fund Capital Class
Ticker: OGVXX Website: https://am.jpmorgan.com/us/en/asset-management/gim/liq/products/d/jpmorgan-u-s-government-money-market-fund-capital-4812c0670#/overview
Investment Objective The Fund seeks high current income with liquidity and stability of principal.
Main Investment Strategy Under normal conditions, the Fund invests its assets exclusively in:
• debt securities issued or guaranteed by the U.S. government, or by U.S. government agencies or instrumentalities or GSEs, and
• repurchase agreements fully collateralized by U.S. Treasury and U.S. government securities.
25
The Fund is a money market fund managed in the following manner:
• The Fund seeks to maintain a net asset value (“NAV”) of $1.00 per share.
• The dollar-weighted average maturity of the Fund will be 60 days or less and the dollar-weighted average life to maturity will be 120 days or less.
• The Fund will only buy securities that have remaining maturities of 397 days or less or securities otherwise permitted to be purchased because of maturity shortening provisions under applicable regulation.
• The Fund invests only in U.S. dollar-denominated securities.
• The Fund seeks to invest in securities that present minimal credit risk.
The Fund may invest significantly in securities with floating or variable rates of interest. Their yields will vary as interest rates change. The Fund will generally hold a portion of its assets in cash, primarily to meet redemptions.
The Fund intends to continue to qualify as a “government money market fund,” as such term is defined in or interpreted under Rule 2a-7 under the Investment Company Act of 1940, as amended (“Investment Company Act”). “Government money market funds” are required to invest at least 99.5% of their assets in (i) cash, (ii) securities issued or guaranteed by the United States or certain U.S. government agencies or instrumentalities and/or (iii) repurchase agreements that are collateralized fully, and are exempt from requirements that permit money market funds to impose a liquidity fee and/or temporary redemption gates. While the Fund’s board of trustees may elect to subject the Fund to liquidity fee and gate requirements in the future, the board has not elected to do so at this time. A government money market fund may also include investments in other government money market funds as an eligible investment for purposes of the 99.5% requirement above.
The Fund may enter into lending agreements under which the Fund would lend money for temporary purposes directly to another J.P. Morgan Fund through a credit facility, subject to meeting the conditions of an SEC exemptive order granted to the Fund permitting such interfund lending.
The Fund may trade securities on a when-issued, delayed settlement or forward commitment basis.
The Fund’s adviser seeks to develop an appropriate portfolio by considering the differences in yields among securities of different maturities, market sectors and issuers.
Principal Risks
• Interest Rate Risk; Credit Risk; General Market Risk; Mortgage Related and Other Asset Backed Securities Risk; Government Securities Risk; Municipal Obligations Risk; When Issued, Delayed Settlement and Forward Commitment Transactions Risk; Transactions Risk; Concentration Risk; Foreign Securities Risk; Industry and Sector Focus Risk; Floating and Variable Rate Securities Risk; Net Asset Value Risk; Repurchase Agreement Risk; Risk Associated with the Fund Holding Cash; Interfund Lending Risk; Prepayment Risk; and Privately Placed Securities Risk