Embed Size (px)
Citation preview
Your Mobility. Your Freedom.Our Signature. >Financial Report as at September 30, 2014

Continental Shares and Bonds Financial Report as at September 30, 2014 Continental AG 1
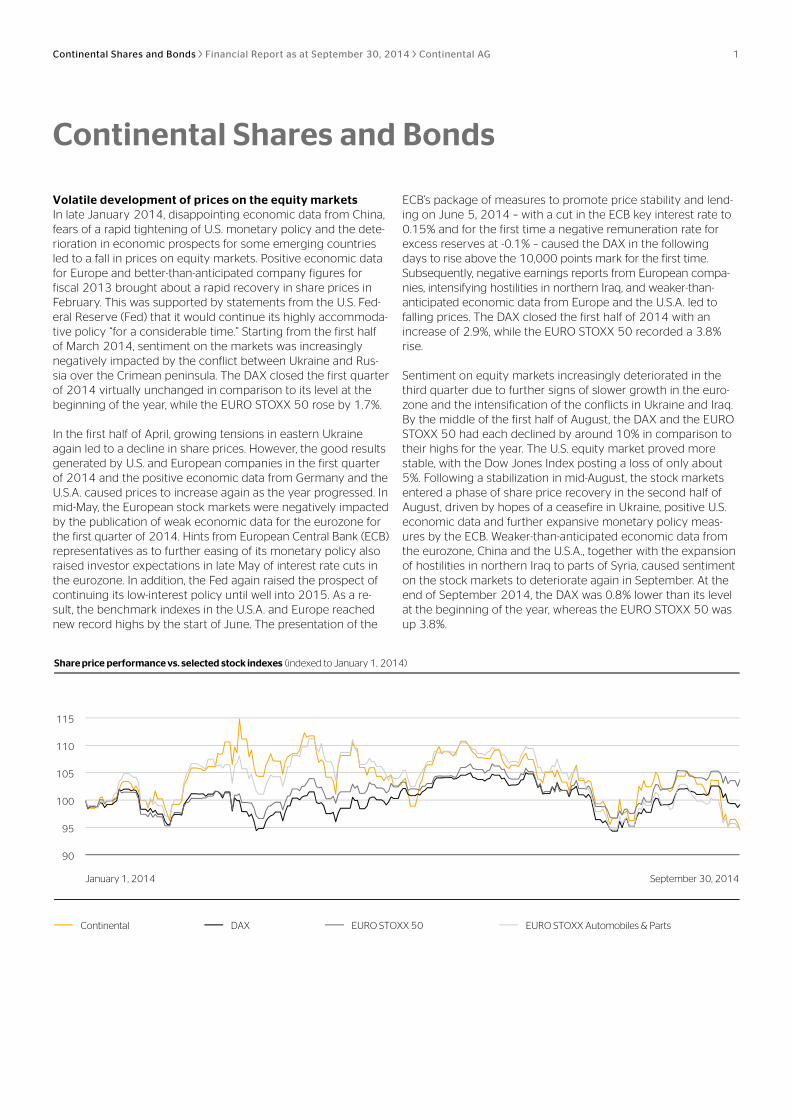
Volatile development of prices on the equity markets In late January 2014, disappointing economic data from China, fears of a rapid tightening of U.S. monetary policy and the dete-rioration in economic prospects for some emerging countries led to a fall in prices on equity markets. Positive economic data for Europe and better-than-anticipated company figures for fiscal 2013 brought about a rapid recovery in share prices in February. This was supported by statements from the U.S. Fed-eral Reserve (Fed) that it would continue its highly accommoda-tive policy “for a considerable time.” Starting from the first half of March 2014, sentiment on the markets was increasingly negatively impacted by the conflict between Ukraine and Rus-sia over the Crimean peninsula. The DAX closed the first quarter of 2014 virtually unchanged in comparison to its level at the beginning of the year, while the EURO STOXX 50 rose by 1.7%.
In the first half of April, growing tensions in eastern Ukraine again led to a decline in share prices. However, the good results generated by U.S. and European companies in the first quarter of 2014 and the positive economic data from Germany and the U.S.A. caused prices to increase again as the year progressed. In mid-May, the European stock markets were negatively impacted by the publication of weak economic data for the eurozone for the first quarter of 2014. Hints from European Central Bank (ECB) representatives as to further easing of its monetary policy also raised investor expectations in late May of interest rate cuts in the eurozone. In addition, the Fed again raised the prospect of continuing its low-interest policy until well into 2015. As a re-sult, the benchmark indexes in the U.S.A. and Europe reached new record highs by the start of June. The presentation of the
ECB’s package of measures to promote price stability and lend-ing on June 5, 2014 – with a cut in the ECB key interest rate to 0.15% and for the first time a negative remuneration rate for excess reserves at -0.1% – caused the DAX in the following days to rise above the 10,000 points mark for the first time. Subsequently, negative earnings reports from European compa-nies, intensifying hostilities in northern Iraq, and weaker-than-anticipated economic data from Europe and the U.S.A. led to falling prices. The DAX closed the first half of 2014 with an increase of 2.9%, while the EURO STOXX 50 recorded a 3.8% rise.
Sentiment on equity markets increasingly deteriorated in the third quarter due to further signs of slower growth in the euro-zone and the intensification of the conflicts in Ukraine and Iraq. By the middle of the first half of August, the DAX and the EURO STOXX 50 had each declined by around 10% in comparison to their highs for the year. The U.S. equity market proved more stable, with the Dow Jones Index posting a loss of only about 5%. Following a stabilization in mid-August, the stock markets entered a phase of share price recovery in the second half of August, driven by hopes of a ceasefire in Ukraine, positive U.S. economic data and further expansive monetary policy meas-ures by the ECB. Weaker-than-anticipated economic data from the eurozone, China and the U.S.A., together with the expansion of hostilities in northern Iraq to parts of Syria, caused sentiment on the stock markets to deteriorate again in September. At the end of September 2014, the DAX was 0.8% lower than its level at the beginning of the year, whereas the EURO STOXX 50 was up 3.8%.
90
95
100
105
110
115
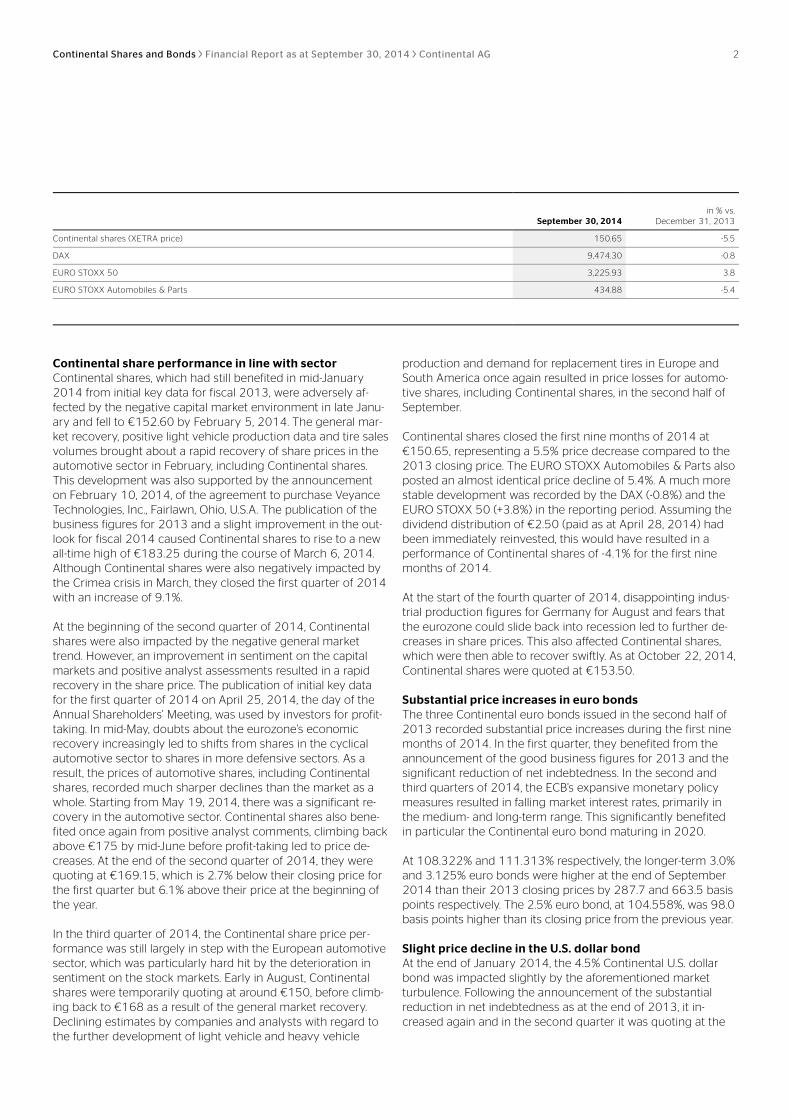
Share price performance vs. selected stock indexes (indexed to January 1, 2014)
ContinentalDAXEURO STOXX 50EURO STOXX Automobiles & PartsContinental DAX EURO STOXX 50 EURO STOXX Automobiles & Parts
January 1, 2014 September 30, 2014
Continental Shares and Bonds
Continental Shares and Bonds Financial Report as at September 30, 2014 Continental AG 2
September 30, 2014 in % vs.
December 31, 2013
Continental shares (XETRA price) 150.65 -5.5
DAX 9,474.30 -0.8
EURO STOXX 50 3,225.93 3.8
EURO STOXX Automobiles & Parts 434.88 -5.4
Continental share performance in line with sector Continental shares, which had still benefited in mid-January 2014 from initial key data for fiscal 2013, were adversely af-fected by the negative capital market environment in late Janu-ary and fell to €152.60 by February 5, 2014. The general mar-ket recovery, positive light vehicle production data and tire sales volumes brought about a rapid recovery of share prices in the automotive sector in February, including Continental shares. This development was also supported by the announcement on February 10, 2014, of the agreement to purchase Veyance Technologies, Inc., Fairlawn, Ohio, U.S.A. The publication of the business figures for 2013 and a slight improvement in the out-look for fiscal 2014 caused Continental shares to rise to a new all-time high of €183.25 during the course of March 6, 2014. Although Continental shares were also negatively impacted by the Crimea crisis in March, they closed the first quarter of 2014 with an increase of 9.1%.
At the beginning of the second quarter of 2014, Continental shares were also impacted by the negative general market trend. However, an improvement in sentiment on the capital markets and positive analyst assessments resulted in a rapid recovery in the share price. The publication of initial key data for the first quarter of 2014 on April 25, 2014, the day of the Annual Shareholders’ Meeting, was used by investors for profit-taking. In mid-May, doubts about the eurozone’s economic recovery increasingly led to shifts from shares in the cyclical automotive sector to shares in more defensive sectors. As a result, the prices of automotive shares, including Continental shares, recorded much sharper declines than the market as a whole. Starting from May 19, 2014, there was a significant re-covery in the automotive sector. Continental shares also bene-fited once again from positive analyst comments, climbing back above €175 by mid-June before profit-taking led to price de-creases. At the end of the second quarter of 2014, they were quoting at €169.15, which is 2.7% below their closing price for the first quarter but 6.1% above their price at the beginning of the year.
In the third quarter of 2014, the Continental share price per-formance was still largely in step with the European automotive sector, which was particularly hard hit by the deterioration in sentiment on the stock markets. Early in August, Continental shares were temporarily quoting at around €150, before climb-ing back to €168 as a result of the general market recovery. Declining estimates by companies and analysts with regard to the further development of light vehicle and heavy vehicle
production and demand for replacement tires in Europe and South America once again resulted in price losses for automo-tive shares, including Continental shares, in the second half of September.
Continental shares closed the first nine months of 2014 at €150.65, representing a 5.5% price decrease compared to the 2013 closing price. The EURO STOXX Automobiles & Parts also posted an almost identical price decline of 5.4%. A much more stable development was recorded by the DAX (-0.8%) and the EURO STOXX 50 (+3.8%) in the reporting period. Assuming the dividend distribution of €2.50 (paid as at April 28, 2014) had been immediately reinvested, this would have resulted in a performance of Continental shares of -4.1% for the first nine months of 2014.
At the start of the fourth quarter of 2014, disappointing indus-trial production figures for Germany for August and fears that the eurozone could slide back into recession led to further de-creases in share prices. This also affected Continental shares, which were then able to recover swiftly. As at October 22, 2014, Continental shares were quoted at €153.50.
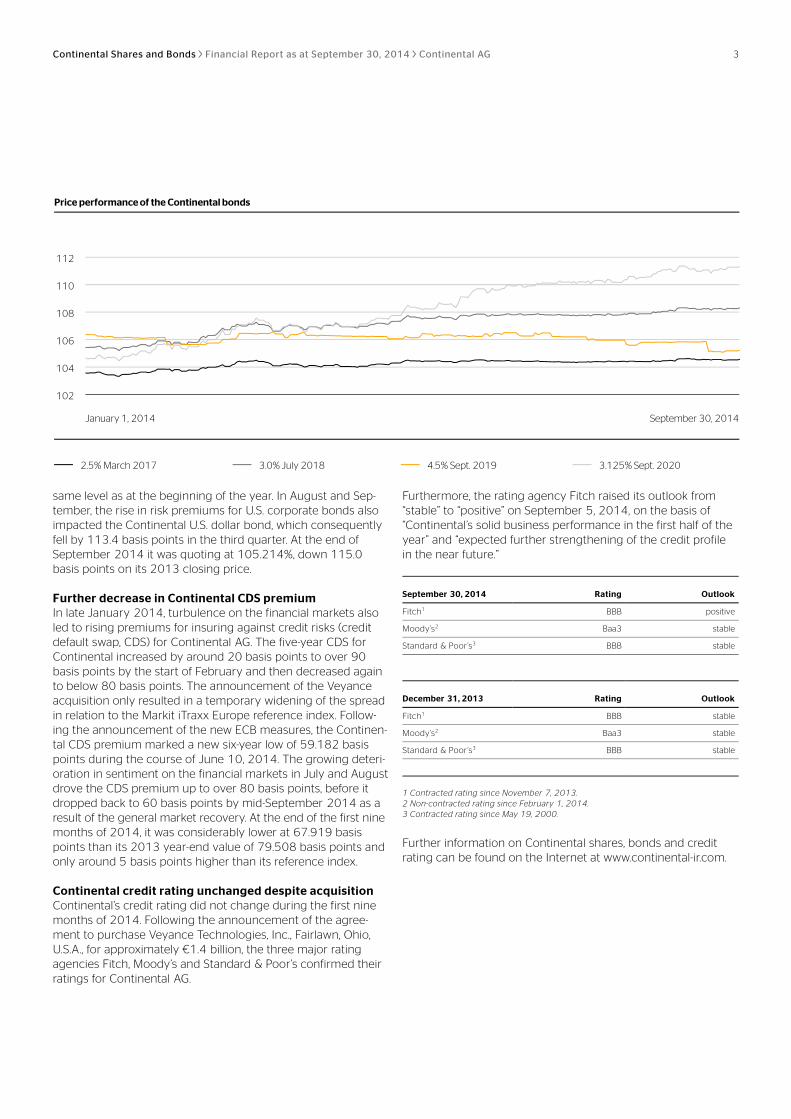
Substantial price increases in euro bonds The three Continental euro bonds issued in the second half of 2013 recorded substantial price increases during the first nine months of 2014. In the first quarter, they benefited from the announcement of the good business figures for 2013 and the significant reduction of net indebtedness. In the second and third quarters of 2014, the ECB’s expansive monetary policy measures resulted in falling market interest rates, primarily in the medium- and long-term range. This significantly benefited in particular the Continental euro bond maturing in 2020.
At 108.322% and 111.313% respectively, the longer-term 3.0% and 3.125% euro bonds were higher at the end of September 2014 than their 2013 closing prices by 287.7 and 663.5 basis points respectively. The 2.5% euro bond, at 104.558%, was 98.0 basis points higher than its closing price from the previous year.
Slight price decline in the U.S. dollar bond At the end of January 2014, the 4.5% Continental U.S. dollar bond was impacted slightly by the aforementioned market turbulence. Following the announcement of the substantial reduction in net indebtedness as at the end of 2013, it in-creased again and in the second quarter it was quoting at the
Continental Shares and Bonds Financial Report as at September 30, 2014 Continental AG 3
same level as at the beginning of the year. In August and Sep-tember, the rise in risk premiums for U.S. corporate bonds also impacted the Continental U.S. dollar bond, which consequently fell by 113.4 basis points in the third quarter. At the end of September 2014 it was quoting at 105.214%, down 115.0 basis points on its 2013 closing price.
Further decrease in Continental CDS premium In late January 2014, turbulence on the financial markets also led to rising premiums for insuring against credit risks (credit default swap, CDS) for Continental AG. The five-year CDS for Continental increased by around 20 basis points to over 90 basis points by the start of February and then decreased again to below 80 basis points. The announcement of the Veyance acquisition only resulted in a temporary widening of the spread in relation to the Markit iTraxx Europe reference index. Follow-ing the announcement of the new ECB measures, the Continen-tal CDS premium marked a new six-year low of 59.182 basis points during the course of June 10, 2014. The growing deteri-oration in sentiment on the financial markets in July and August drove the CDS premium up to over 80 basis points, before it dropped back to 60 basis points by mid-September 2014 as a result of the general market recovery. At the end of the first nine months of 2014, it was considerably lower at 67.919 basis points than its 2013 year-end value of 79.508 basis points and only around 5 basis points higher than its reference index.
Continental credit rating unchanged despite acquisition Continental’s credit rating did not change during the first nine months of 2014. Following the announcement of the agree-ment to purchase Veyance Technologies, Inc., Fairlawn, Ohio, U.S.A., for approximately €1.4 billion, the three major rating agencies Fitch, Moody’s and Standard & Poor’s confirmed their ratings for Continental AG.
Furthermore, the rating agency Fitch raised its outlook from “stable” to “positive” on September 5, 2014, on the basis of “Continental’s solid business performance in the first half of the year” and “expected further strengthening of the credit profile in the near future.”
September 30, 2014 Rating Outlook
Fitch1 BBB positive
Moody’s2 Baa3 stable
Standard & Poor’s3 BBB stable
December 31, 2013 Rating Outlook
Fitch1 BBB stable
Moody’s2 Baa3 stable
Standard & Poor’s3 BBB stable
1 Contracted rating since November 7, 2013. 2 Non-contracted rating since February 1, 2014. 3 Contracted rating since May 19, 2000.
Further information on Continental shares, bonds and credit rating can be found on the Internet at www.continental-ir.com.
102
104
106
108
110
112
Price performance of the Continental bonds
2.5% March 20173.0% July 20184.5% Sept. 20193.125% Sept. 20202.5% March 2017 3.0% July 2018 4.5% Sept. 2019 3.125% Sept. 2020
January 1, 2014 September 30, 2014
Key Figures for the Continental Corporation Financial Report as at September 30, 2014 Continental AG 4
January 1 to September 30 Third Quarter
in € millions 2014 2013 2014 2013
Sales 25,587.6 24,923.9 8,669.5 8,349.6
EBITDA 3,809.1 3,801.8 1,203.3 1,322.5
in % of sales 14.9 15.3 13.9 15.8
EBIT 2,447.9 2,516.9 637.8 886.3
in % of sales 9.6 10.1 7.4 10.6
Net income attributable to the shareholders of the parent 1,798.9 1,576.0 495.1 434.1
Earnings per share in € 8.99 7.88 2.47 2.17
Adjusted sales1 25,378.2 24,851.9 8,535.3 8,349.6
Adjusted operating result (adjusted EBIT)2 2,920.3 2,798.2 962.0 1,021.9
in % of adjusted sales 11.5 11.3 11.3 12.2
Free cash flow 941.0 414.2 366.2 502.4
Net indebtedness as at September 30 3,926.2 5,589.7
Gearing ratio in % 36.2 61.6
Number of employees as at September 303 189,361 177,387
1 Before changes in the scope of consolidation. 2 Before amortization of intangible assets from purchase price allocation (PPA), changes in the scope of consolidation, and special effects. 3 Excluding trainees.
Key Figures for the Continental Corporation
Key Figures for the Core Business Areas Financial Report as at September 30, 2014 Continental AG 5
January 1 to September 30 Third Quarter
Automotive Group in € millions 2014 2013 2014 2013
Sales 15,466.9 15,015.7 5,162.1 4,945.0
EBITDA 1,725.8 1,862.7 479.9 621.0
in % of sales 11.2 12.4 9.3 12.6
EBIT 782.5 945.6 61.1 309.0
in % of sales 5.1 6.3 1.2 6.2
Depreciation and amortization1 943.3 917.1 418.8 312.0
– thereof impairment2 158.0 6.7 153.4 5.8
Capital expenditure3 686.6 614.2 297.3 229.9
in % of sales 4.4 4.1 5.8 4.6
Operating assets as at September 30 10,552.2 11,009.0
Number of employees as at September 304 108,997 103,465
Adjusted sales5 15,405.3 14,943.7 5,101.6 4,945.0
Adjusted operating result (adjusted EBIT)6 1,220.7 1,184.2 356.2 403.6
in % of adjusted sales 7.9 7.9 7.0 8.2
January 1 to September 30 Third Quarter
Rubber Group in € millions 2014 2013 2014 2013
Sales 10,151.0 9,939.0 3,517.9 3,415.0
EBITDA 2,162.1 2,016.3 748.1 730.5
in % of sales 21.3 20.3 21.3 21.4
EBIT 1,744.8 1,648.8 601.8 606.4
in % of sales 17.2 16.6 17.1 17.8
Depreciation and amortization1 417.3 367.5 146.3 124.1
– thereof impairment2 — -1.4 — 0.2
Capital expenditure3 618.0 719.9 214.0 237.6
in % of sales 6.1 7.2 6.1 7.0
Operating assets as at September 30 6,734.6 6,166.7
Number of employees as at September 304 80,032 73,617
Adjusted sales5 10,003.2 9,939.0 3,444.2 3,415.0
Adjusted operating result (adjusted EBIT)6 1,779.1 1,693.9 630.9 647.4
in % of adjusted sales 17.8 17.0 18.3 19.0
1 Excluding impairment on financial investments. 2 Impairment also includes necessary reversal of impairment losses. 3 Capital expenditure on property, plant and equipment, and software. 4 Excluding trainees. 5 Before changes in the scope of consolidation. 6 Before amortization of intangible assets from purchase price allocation (PPA), changes in the scope of consolidation, and special effects.
Key Figures for the Core Business Areas
Corporate Management Report Financial Report as at September 30, 2014 Continental AG 6
Changes in Continental’s Executive Board At its meeting on April 25, 2014, the Supervisory Board of Con-tinental AG extended the appointments of Executive Board mem-bers Wolfgang Schäfer (Finance, Controlling, Compliance, Law and IT) and José A. Avila (Powertrain division) by another five years until the end of December 2019. The mandate of Elke Strathmann, Executive Board member for Human Resources (HR) and Director of Labor Relations, was terminated by mutual agreement with immediate effect. At the same meeting, the Supervisory Board resolved to appoint Dr. Ariane Reinhart as her successor. She assumed this mandate on October 1, 2014.
Changes in Continental’s Supervisory Board The newly formed Supervisory Board of Continental AG com-menced its work on April 25, 2014. The Board now counts four women among its members. Prior to this, the shareholders had elected the ten shareholder representatives at the Annual Share-holders’ Meeting. The ten employee representatives had been elected in March 2014. The term of office of the previous Su-pervisory Board members had ended at the end of the Annual Shareholders’ Meeting on April 25, 2014. The new term of office will last until the end of the 2019 Annual Shareholders’ Meeting.
Agreement with The Carlyle Group for the purchase of Veyance Technologies On February 10, 2014, we announced that we had concluded an agreement with The Carlyle Group, Washington D.C., U.S.A., for the purchase of Veyance Technologies, Inc., Fairlawn, Ohio, U.S.A. Veyance operates globally in the field of rubber and plas-tics technology. With around 9,000 employees, it posted sales in 2013 of approximately €1.5 billion, 90% of which was gen-erated in the industrial business. As soon as the respective antitrust authorities have given their approval, we shall have moved a step closer to our strategic goal of further increasing the share of our sales derived from industrial clients and the aftermarket. Veyance Technologies provides reinforcement for the ContiTech division in markets in which ContiTech has little or no presence – primarily in the U.S.A. and South America. Locations in Mexico, Canada, China, Australia, and South Africa offer additional opportunities.
Acquisition of remaining 50% of shares in Emitec Effective July 31, 2014, we acquired all of the shares in Emitec Gesellschaft für Emissionstechnologie mbH that were previous-ly held by our co-shareholder GKN Driveline International GmbH. This business was integrated into the Powertrain divi-sion, with the Fuel Supply unit being renamed Fuel & Exhaust Management. Based in Lohmar, near Bonn, Germany, Emitec is a leading supplier of emissions technologies and was founded in 1986. Its product portfolio includes metal catalytic convert-ers, particulate filter components, and dosing modules for se-lective catalytic reduction (SCR). SCR, which reduces nitric oxide in emissions by injecting a urea-water solution into the exhaust system, is set to become increasingly important in the future. Ever more stringent emissions limits in the years ahead will make it necessary for virtually all diesel vehicles to be equipped with an SCR system.
Tire sales in France strengthened Effective June 27, 2014, Continental Holding France SAS, Sarreguemines, France, acquired 100% of the shares in both MPI SAS, Mandelieu, France, and REPARATION PNEUMATIQUES DU SUD EST (REPNEU) SAS, Grasse, France. The group of com-panies has just under 1,000 employees working at its 114 sites. With this, the network of outlets we are associated with on the French tire market has grown to include more than 400.
New Intelligent Transportation Systems (ITS) business unit In August 2014, we began assembling an international team from the IT and automotive industry in Silicon Valley, California, U.S.A. The team is to work intensively on the future-oriented field of intelligent transportation systems. To this end, a new company named “Continental Intelligent Transportation Sys-tems, LLC” was founded and the new Intelligent Transportation Systems business unit was established in the Interior division. ITS stands for systems for the intelligent networking of modes of transport and traffic facilities. In taking this step, we are pur-suing the key objectives of eliminating road accidents, minimiz-ing fuel consumption, maximizing comfort and usability of ve-hicles, and enabling them to exchange information with each other in real-time. ITS and the connected car are considered key systems and technologies for future transportation.
Continental winter tires take the lead in tire tests In various tire tests, Continental winter tires performed impres-sively with very good safety characteristics and balance at the highest level. The ContiWinterContact TS 850 has passed the joint winter tire test by the automotive clubs ADAC (Germany), ÖAMTC (Austria) and TCS (Switzerland) and the consumer or-ganization Stiftung Warentest with flying colors as the best win-ter tire in both test dimensions, 175/65 R 14 and 195/65 R 15, with the rating “good” and “highly recommended,” respectively. In the trade publication “auto motor und sport,” the tire in the size 205/55 R 16 H was the test winner, and in the “AutoBild” test, the size 225/50 R 17 was rated “exemplary.” In the “AutoBild sportscars” test, the new WinterContact TS 850 P in the size 235/35 R 19 achieved the highest ranking “exemplary.”
ABS for motor scooters and motorcycles reduces risk of accidents To improve the active safety of motorcycles, we have expanded our range of electronic braking systems – based on our proven ABS technology for passenger cars – by introducing a one-channel ABS for smaller motorcycles and scooters. The safety system went into production for the first time worldwide in 2014 in the Vespa Primavera and the Vespa Sprint from the Italian Piaggio Group. At the “Dinner for Winner,” where each year prizes are awarded for innovative technologies in a total of three categories, the mini-ABS came in second in the Safe cate-gory. The prizes are presented by the trade publication “Automobil Produktion,” the German Association of the Automotive Indus-try (Verband der Automobilindustrie – VDA) and the European Association of Automotive Suppliers (CLEPA).
Corporate Management Report as at September 30, 2014
Corporate Management Report Financial Report as at September 30, 2014 Continental AG 7
Economic Report Macroeconomic development The German economy was not able to maintain the good ex-pansion rate of the first quarter of 2014 (growth of 0.8% com-pared to the fourth quarter of 2013). Gross domestic product (GDP) fell by 0.2% in the second quarter of 2014 compared to the first quarter. After a sharp downturn in incoming orders and a decline in industrial production in August, both of which were due in part to the late start of summer vacation in several Ger-man states, further expansion in the third quarter is also unlike-ly. In addition, various sentiment indicators point to a slowdown in economic development in Germany. In its October 2014 World Economic Outlook, the International Monetary Fund (IMF) reduced its forecast for German GDP growth by 0.5 percentage points to 1.4% for the current year. In July 2014, the IMF had anticipated growth of 1.9%.
In the first three months of 2014, the eurozone posted GDP growth of 0.2% compared to the fourth quarter of 2013, pri-marily due to the expansion of the German and Spanish econ-omies. Owing to the weakening economic development in Germany, France and Italy in the second quarter of 2014, the eurozone’s GDP in the period from April to June remained at the same level as in the first quarter. This stagnation is also likely to persist in the third quarter due to continued high un-employment in the eurozone, modest demand among private households, and the anticipated decline in Russian business. The expansive monetary policy measures resolved by the Euro-pean Central Bank (ECB) in early June 2014 have since resulted in a significant decrease in the euro exchange rate in relation to the U.S. dollar and other currencies. While this is likely to have a positive influence on export volumes, a sustained increase in lending in the eurozone has yet to materialize. In view of this development, in October the IMF lowered its economic growth forecast for the eurozone to 0.8%, which it had still forecast at 1.1% in July.
After the winter-related decline in U.S. GDP of an annualized 2.9% in the first quarter of 2014, the U.S. economy grew sub-stantially by an annualized 4.6% in the second quarter. Recently published data from the manufacturing industry and the real-estate market and the further rise in employment also mean that this growth can be expected to continue in the third quar-ter. The U.S. economy is supported by the expansive monetary policy of its central bank the U.S. Federal Reserve (Fed), which kept its interest rate corridor at 0% to 0.25% and also raised the prospect of continuing its low-interest policy until well into 2015. Owing to the good economic situation, the Fed gradually re-duced its asset purchasing program during the reporting period and is expected to terminate it in October 2014. Based on the positive data, the IMF raised its forecast for U.S. GDP growth in 2014 from 1.7% to 2.2% in October 2014.
The Japanese economy posted growth of 1.6% in the first quar-ter of 2014 compared to the fourth quarter of 2013. Japan’s export-oriented economy benefited from the depreciation of the yen, which is a result of the Bank of Japan’s highly expansive
monetary policy. In addition, pre-buy effects due to the increase in excise duties as at April 1, 2014, had a substantial positive impact on consumption in the first quarter. The downside of this was reflected in the sharper than expected decrease in Japanese GDP of 1.8% in the second quarter of 2014. Various indicators point to a stabilization of economic development in the third quarter. However, the effect of the expiring economic stimulus programs and of currency depreciation is expected to continue to decrease. Based on the weak second quarter, in October 2014 the IMF lowered its July 2014 estimate for Japan’s GDP growth in the current year from 1.6% to 0.9%.
For emerging and developing economies, the IMF lowered its growth forecast for the current year again to 4.4% in its Octo-ber study. In July, it still forecast an increase of 4.5%. China and India are still the main drivers of economic growth. For China, which announced growth of 7.3% for the third quarter of 2014, the IMF continues to anticipate GDP growth of 7.4% for the year as a whole. For India, the IMF has now raised its forecast for GDP growth in 2014 by 0.2 percentage points to 5.6%. Following the parliamentary elections here, there are initial signs of a stronger upturn in the economy, which is due to improved consumer sentiment in the country. By contrast, owing to the lower eco-nomic momentum in Russia, the IMF still anticipates GDP growth of just 0.2% in the current year. In view of the recent substantial downward trend in the price of oil, it is likely that the Russian economy will slip into recession. For Brazil, which record-ed a downturn in the economy in the first and second quarter of 2014, the IMF anticipates stabilization over the remainder of the year. At the same time, the IMF lowered its GDP forecast for Brazil from 1.3% to 0.3% for the current year due to the eco-nomic development in the first half of the year and the recent early indicators, which continue to be disappointing.
In its October 2014 World Economic Outlook, the IMF reduced its growth forecast for the global economy again slightly by 0.1 percentage points to 3.3% for the current year. The only ad-vanced economies for which the IMF revised its forecast posi-tively were the U.S.A. and Canada. The IMF believes that there are considerable short-term risks in the current geopolitical crises and possible turbulence on the financial markets as a result of the highly expansive monetary policy. In addition, the IMF sees a medium-term risk of continuing stagnation in ad-vanced economies and slower growth in emerging and devel-oping economies. To stimulate growth, the IMF recommends continued use of expansive monetary policy measures, in-creased investment in public infrastructure, and extensive structural reforms.
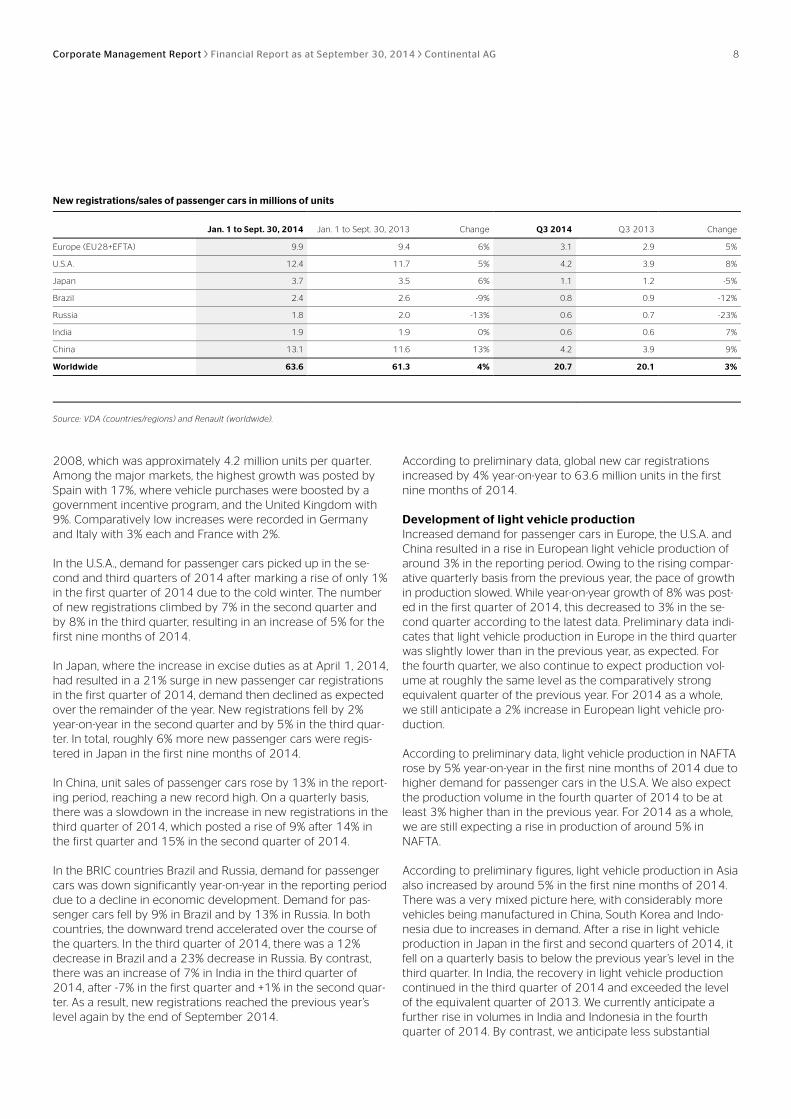
Development of new car registrations On the basis of preliminary data from the German Association of the Automotive Industry (Verband der Automobilindustrie – VDA), the number of new passenger car registrations in Europe (EU28+EFTA) rose by 6% in the reporting period. In the third quarter of 2014 the growth rate was only around 5%. New registrations in these three quarters thus remained considera-bly lower than the average for the pre-crisis years 2006 to
Corporate Management Report Financial Report as at September 30, 2014 Continental AG 8
New registrations/sales of passenger cars in millions of units
Jan. 1 to Sept. 30, 2014 Jan. 1 to Sept. 30, 2013 Change Q3 2014 Q3 2013 Change
Europe (EU28+EFTA) 9.9 9.4 6% 3.1 2.9 5%
U.S.A. 12.4 11.7 5% 4.2 3.9 8%
Japan 3.7 3.5 6% 1.1 1.2 -5%
Brazil 2.4 2.6 -9% 0.8 0.9 -12%
Russia 1.8 2.0 -13% 0.6 0.7 -23%
India 1.9 1.9 0% 0.6 0.6 7%
China 13.1 11.6 13% 4.2 3.9 9%
Worldwide 63.6 61.3 4% 20.7 20.1 3%
Source: VDA (countries/regions) and Renault (worldwide).
2008, which was approximately 4.2 million units per quarter. Among the major markets, the highest growth was posted by Spain with 17%, where vehicle purchases were boosted by a government incentive program, and the United Kingdom with 9%. Comparatively low increases were recorded in Germany and Italy with 3% each and France with 2%.
In the U.S.A., demand for passenger cars picked up in the se-cond and third quarters of 2014 after marking a rise of only 1% in the first quarter of 2014 due to the cold winter. The number of new registrations climbed by 7% in the second quarter and by 8% in the third quarter, resulting in an increase of 5% for the first nine months of 2014.
In Japan, where the increase in excise duties as at April 1, 2014, had resulted in a 21% surge in new passenger car registrations in the first quarter of 2014, demand then declined as expected over the remainder of the year. New registrations fell by 2% year-on-year in the second quarter and by 5% in the third quar-ter. In total, roughly 6% more new passenger cars were regis-tered in Japan in the first nine months of 2014.
In China, unit sales of passenger cars rose by 13% in the report-ing period, reaching a new record high. On a quarterly basis, there was a slowdown in the increase in new registrations in the third quarter of 2014, which posted a rise of 9% after 14% in the first quarter and 15% in the second quarter of 2014.
In the BRIC countries Brazil and Russia, demand for passenger cars was down significantly year-on-year in the reporting period due to a decline in economic development. Demand for pas-senger cars fell by 9% in Brazil and by 13% in Russia. In both countries, the downward trend accelerated over the course of the quarters. In the third quarter of 2014, there was a 12% decrease in Brazil and a 23% decrease in Russia. By contrast, there was an increase of 7% in India in the third quarter of 2014, after -7% in the first quarter and +1% in the second quar-ter. As a result, new registrations reached the previous year’s level again by the end of September 2014.
According to preliminary data, global new car registrations increased by 4% year-on-year to 63.6 million units in the first nine months of 2014.
Development of light vehicle production Increased demand for passenger cars in Europe, the U.S.A. and China resulted in a rise in European light vehicle production of around 3% in the reporting period. Owing to the rising compar-ative quarterly basis from the previous year, the pace of growth in production slowed. While year-on-year growth of 8% was post-ed in the first quarter of 2014, this decreased to 3% in the se-cond quarter according to the latest data. Preliminary data indi-cates that light vehicle production in Europe in the third quarter was slightly lower than in the previous year, as expected. For the fourth quarter, we also continue to expect production vol-ume at roughly the same level as the comparatively strong equivalent quarter of the previous year. For 2014 as a whole, we still anticipate a 2% increase in European light vehicle pro-duction.
According to preliminary data, light vehicle production in NAFTA rose by 5% year-on-year in the first nine months of 2014 due to higher demand for passenger cars in the U.S.A. We also expect the production volume in the fourth quarter of 2014 to be at least 3% higher than in the previous year. For 2014 as a whole, we are still expecting a rise in production of around 5% in NAFTA.
According to preliminary figures, light vehicle production in Asia also increased by around 5% in the first nine months of 2014. There was a very mixed picture here, with considerably more vehicles being manufactured in China, South Korea and Indo-nesia due to increases in demand. After a rise in light vehicle production in Japan in the first and second quarters of 2014, it fell on a quarterly basis to below the previous year’s level in the third quarter. In India, the recovery in light vehicle production continued in the third quarter of 2014 and exceeded the level of the equivalent quarter of 2013. We currently anticipate a further rise in volumes in India and Indonesia in the fourth quarter of 2014. By contrast, we anticipate less substantial
Corporate Management Report Financial Report as at September 30, 2014 Continental AG 9
growth in China and a decline in production in Japan and South Korea due to the high volumes in the fourth quarter of the pre-vious year. Overall, we are still forecasting a rise in light vehicle production in Asia of 4% in 2014.
In South America, preliminary data indicates that the decreas-ing demand for new vehicles brought about a decline in light vehicle production of 18% in the reporting period. We expect production to stabilize in the fourth quarter of 2014, but it is unlikely to reach the same volume as in the same quarter of 2013. Based on the weak first nine months, we are lowering our forecast for 2014 as a whole from -10% to -14%.
According to preliminary data, global light vehicle production increased year-on-year by around 3% in the reporting period. In the third quarter, the growth rate was only 1%. For 2014 as a whole, we are still expecting a rise in light vehicle production of around 2% to approximately 87 million units in comparison to the prior-year volume of 84.7 million units.
Development of heavy vehicle production Heavy vehicle production in Europe was down significantly year-on-year in the first quarter of 2014, as expected, after the introduction of the EU emission standard Euro 6 as at Janu-ary 1, 2014, had resulted in truck purchases being made early in the fourth quarter of 2013. Production of heavy vehicles normalized in the second quarter, but the stagnation of the European economy resulted in production cuts again in the third quarter. In the fourth quarter, heavy vehicle production is likely to drop significantly below the previous year’s level again due to reduced demand and the high comparative basis. We are thus lowering our forecast for 2014 as a whole from -3% to -7%.
According to preliminary figures, heavy vehicle production in NAFTA rose by around 13% in the reporting period compared to the weak equivalent period of the previous year. We also anticipate an increase in the fourth quarter, although this is likely to be less substantial due to the rising comparative basis. For 2014 as a whole, we are increasing our latest estimate slightly from 11% to 12%.
For Asia, we continue to anticipate growth in heavy vehicle production of 2% in 2014 as a result of weaker economic growth in various Asian countries.
After very weak figures for heavy vehicle production in the first nine months of 2014, we expect production in South America to stabilize in the final quarter of the current year following the presidential elections in Brazil. We are, however, lowering our forecast from -12% to -15%.
We still anticipate an increase of around 1% in global produc-tion of heavy vehicles in 2014.
Development of passenger and light truck tire replacement markets In Europe, Continental’s most important replacement tire mar-ket, preliminary data indicates that demand for replacement
passenger and light truck tires rose by 4% in the reporting period compared to the equivalent period of the previous year. We currently expect sales volumes in the fourth quarter to be roughly on a par with the comparatively high prior-year level. For 2014 as a whole, we are maintaining our growth forecast of 3%.
Demand for replacement passenger and light truck tires in NAFTA climbed by 5% in the first nine months of 2014. We expect to see slower growth there over the remainder of the year due to higher prior-year figures. For the year as a whole, we now anticipate growth of 4% instead of the previously fore-cast 3%.
On the basis of preliminary data for the first nine months of 2014, we continue to expect a 6% rise in the sales volumes of replacement passenger and light truck tires in Asia in 2014 as a whole.
In South America, preliminary data indicates that demand for replacement passenger and light truck tires is proving very robust in the current year despite the weaker economic situa-tion. For 2014 as a whole, we therefore anticipate growth of 4% now rather than 2%.
We are raising our previous forecast for 2014 of global growth in replacement passenger and light truck tire sales volumes from 3% to just under 4%.
Development of commercial vehicle tire replacement markets Following the upturn in sales volumes in the first half of 2014, demand for replacement commercial vehicles tires stagnated in Europe in the third quarter, and preliminary data consequently indicates growth of only 3% in the third quarter. As a result of economic stagnation, the previous year’s high sales volume is unlikely to be reached in the fourth quarter. We are therefore lowering our forecast for 2014 from 5% to 2%.
In NAFTA, our other core market for replacement commercial vehicles tires, demand was up by 9% in the reporting period. We expect sales volumes in the fourth quarter of 2014 to match the level of the strong equivalent quarter of the previous year. For 2014 as a whole, we are raising our forecast from 6% to just under 8% on the basis of the strong figures for the first nine months.
For Asia, we still consider growth of 4% in 2014 to be realistic in view of the preliminary figures.
Based on the available preliminary data for the current year, we are increasing our market forecast for South America slightly from -3% to -2%.
Worldwide, we continue to anticipate an increase in demand for replacement commercial vehicle tires of around 4% in 2014.
Corporate Management Report Financial Report as at September 30, 2014 Continental AG 10
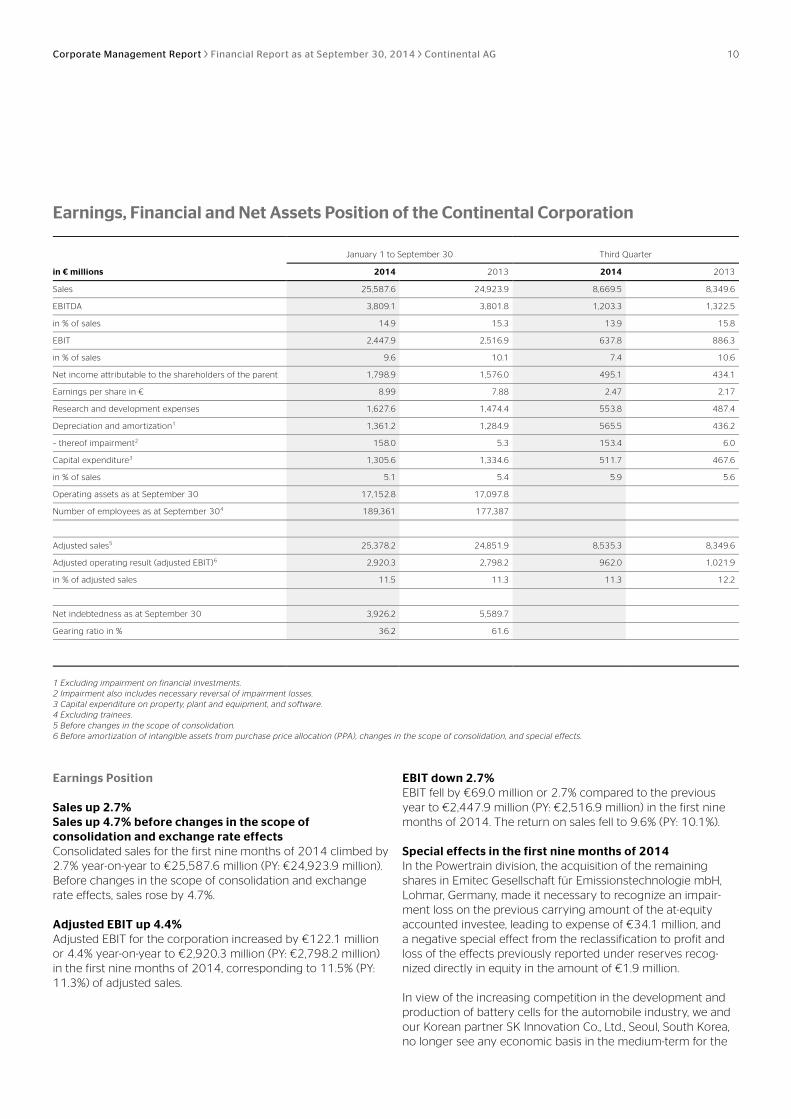
Earnings, Financial and Net Assets Position of the Continental Corporation
January 1 to September 30 Third Quarter
in € millions 2014 2013 2014 2013
Sales 25,587.6 24,923.9 8,669.5 8,349.6
EBITDA 3,809.1 3,801.8 1,203.3 1,322.5
in % of sales 14.9 15.3 13.9 15.8
EBIT 2,447.9 2,516.9 637.8 886.3
in % of sales 9.6 10.1 7.4 10.6
Net income attributable to the shareholders of the parent 1,798.9 1,576.0 495.1 434.1
Earnings per share in € 8.99 7.88 2.47 2.17
Research and development expenses 1,627.6 1,474.4 553.8 487.4
Depreciation and amortization1 1,361.2 1,284.9 565.5 436.2
– thereof impairment2 158.0 5.3 153.4 6.0
Capital expenditure3 1,305.6 1,334.6 511.7 467.6
in % of sales 5.1 5.4 5.9 5.6
Operating assets as at September 30 17,152.8 17,097.8
Number of employees as at September 304 189,361 177,387
Adjusted sales5 25,378.2 24,851.9 8,535.3 8,349.6
Adjusted operating result (adjusted EBIT)6 2,920.3 2,798.2 962.0 1,021.9
in % of adjusted sales 11.5 11.3 11.3 12.2
Net indebtedness as at September 30 3,926.2 5,589.7
Gearing ratio in % 36.2 61.6
1 Excluding impairment on financial investments. 2 Impairment also includes necessary reversal of impairment losses. 3 Capital expenditure on property, plant and equipment, and software. 4 Excluding trainees. 5 Before changes in the scope of consolidation. 6 Before amortization of intangible assets from purchase price allocation (PPA), changes in the scope of consolidation, and special effects.
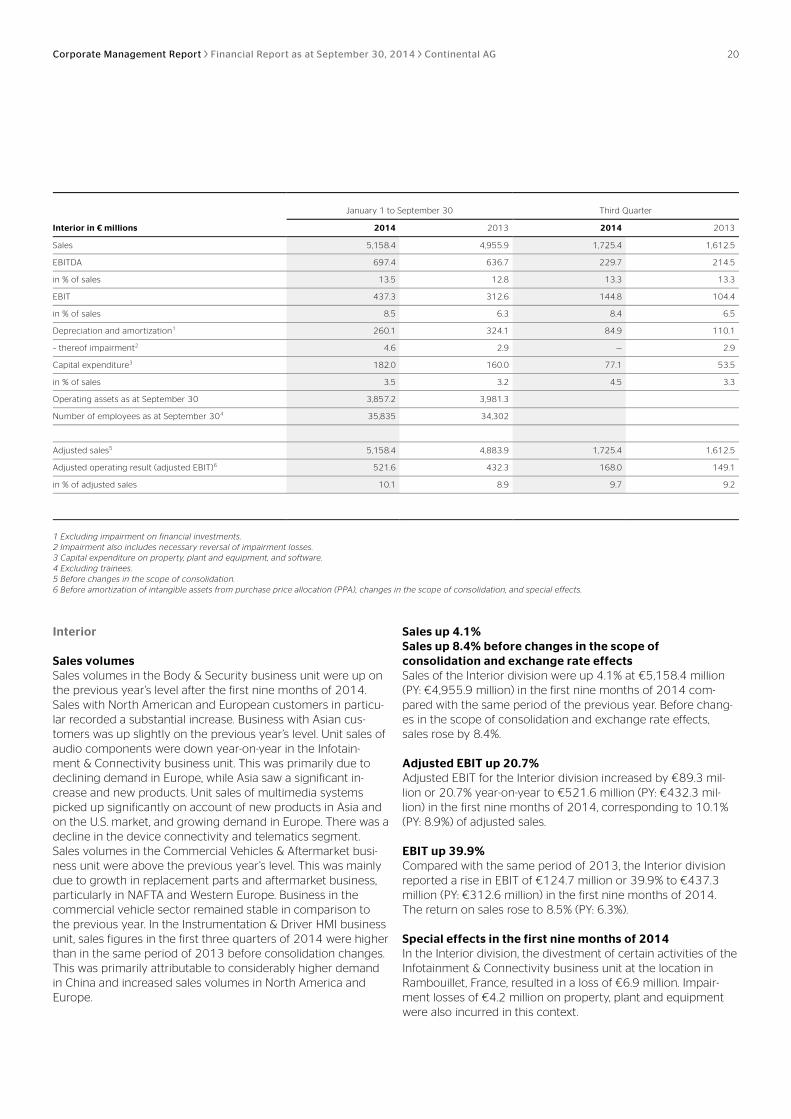
Earnings Position Sales up 2.7% Sales up 4.7% before changes in the scope of consolidation and exchange rate effects Consolidated sales for the first nine months of 2014 climbed by 2.7% year-on-year to €25,587.6 million (PY: €24,923.9 million). Before changes in the scope of consolidation and exchange rate effects, sales rose by 4.7%.
Adjusted EBIT up 4.4% Adjusted EBIT for the corporation increased by €122.1 million or 4.4% year-on-year to €2,920.3 million (PY: €2,798.2 million) in the first nine months of 2014, corresponding to 11.5% (PY: 11.3%) of adjusted sales.
EBIT down 2.7% EBIT fell by €69.0 million or 2.7% compared to the previous year to €2,447.9 million (PY: €2,516.9 million) in the first nine months of 2014. The return on sales fell to 9.6% (PY: 10.1%).
Special effects in the first nine months of 2014 In the Powertrain division, the acquisition of the remaining shares in Emitec Gesellschaft für Emissionstechnologie mbH, Lohmar, Germany, made it necessary to recognize an impair-ment loss on the previous carrying amount of the at-equity accounted investee, leading to expense of €34.1 million, and a negative special effect from the reclassification to profit and loss of the effects previously reported under reserves recog-nized directly in equity in the amount of €1.9 million.
In view of the increasing competition in the development and production of battery cells for the automobile industry, we and our Korean partner SK Innovation Co., Ltd., Seoul, South Korea, no longer see any economic basis in the medium-term for the
Corporate Management Report Financial Report as at September 30, 2014 Continental AG 11
business operations in our joint venture SK Continental E-motion Pte. Ltd., Singapore, Singapore. For this reason, the existing activities and investments have already been reduced consid-erably, which in a further step – due to the lack of profitability prospects – led to an impairment on the at-equity accounted investee in the amount of €77.9 million within the Powertrain division.
Furthermore, we took this new development as a triggering event to adjust the value of property, plant and equipment in the Hybrid Electric Vehicle (HEV) business unit to the current utilization of capacity. This led to additional impairment losses on property, plant and equipment in the amount of €57.8 mil-lion in the Powertrain division.
After an in-depth quality review, we did not launch a diesel injector that was based on technologies from the time before the Siemens VDO acquisition. Impairment losses of €62.0 mil-lion on intangible assets and property, plant and equipment were incurred in the Powertrain division in this context, as well as restructuring expenses of €22.3 million, of which €6.2 mil-lion was attributable to impairment losses on property, plant and equipment.
This situation also prompted us to check pumps based on technologies from the time before the Siemens VDO acquisi-tion, primarily in the diesel sector. This resulted in the necessity to recognize impairment losses on property, plant and equip-ment as part of valuation at the lower of cost or market value. This led to an additional expense of €27.4 million in the Power-train division.
In the Interior division, the divestment of certain activities of the Infotainment & Connectivity business unit at the location in Rambouillet, France, resulted in a loss of €6.9 million. Impair-ment losses of €4.2 million on property, plant and equipment were also incurred in this context.
Further impairment losses on property, plant and equipment resulted in expense of €0.4 million in the Interior division.
The reversal of restructuring provisions no longer required resulted in a positive special effect of €0.4 million in the Interior division.
Effective September 30, 2014, certain activities of the Body & Security business unit were sold to a newly established joint venture. This transaction resulted in a positive special effect totaling €1.7 million in the Interior division.
In connection with the cessation of passenger tire production at the plant in Clairoix, France, a large number of employees at Con-tinental France SNC, Sarreguemines, France, filed claims with the industrial tribunals in Compiègne and Soissons, France, against this subsidiary company and, in some cases, against Continen-tal AG as well. On August 30, 2013, the industrial tribunal in Compiègne ordered Continental France SNC and Continen-tal AG to pay damages for the allegedly unlawful dismissal of
employees. Continental’s appeal against this ruling was rejected by the Court of Appeal, Amiens, France, on September 30, 2014. Continental is reviewing the option of filing an appeal. However, we cannot rule out the possibility that the obligation to pay damages may be upheld in full or in part after the final resolu-tion of the proceedings. For this reason, an additional provision of €23.3 million was recognized in the Tire division.
There was also a positive special effect totaling €0.2 million in the Tire division.
In the ContiTech division, income totaling €1.7 million resulted from bargain purchases from purchase price allocations, of which €0.7 million was attributable to the Fluid Technology business unit and €1.0 million resulted from the final purchase price allocation of a transaction in 2013 in the Conveyor Belt Group business unit.
Total consolidated expense from special effects in the first nine months of 2014 amounted to €314.2 million.
Special effects in the first nine months of 2013 On January 1, 2013, the closing took place for SK Continental E-motion Pte. Ltd., Singapore, Singapore, a company jointly managed by SK Innovation Co., Ltd., Seoul, South Korea, and Continental, after the agreement to form the company was signed in July 2012. The transaction resulted at that time in income of €24.2 million in the Powertrain division.
As at January 29, 2013, Continental sold its shares in S-Y Sys-tems Technologies Europe GmbH, Regensburg, Germany, to Yazaki Europe Ltd., Hemel Hempstead, U.K. The transaction resulted in income of €54.6 million in the Interior division.
On July 10, 2013, the European Commission imposed fines on a number of automotive suppliers for anti-competitive conduct in the field of supplying wire harnesses for automotive applica-tions. These companies included S-Y Systems Technologies Europe GmbH, Regensburg, Germany, and its French subsidiary, which must pay a fine of €11.1 million due to cartel agreements with regard to one automotive manufacturer. Since Continental held a 50% share of S-Y Systems Technologies Europe GmbH, Regensburg, Germany, until January 29, 2013, a provision of €9.0 million was recognized in the Interior division based upon contingent liabilities.
Activities were concluded and restructured in one product seg-ment within the Infotainment & Connectivity business unit in the Interior division. Expenses totaling €24.2 million were in-curred in this context, of which €2.9 million was attributable to impairment of property, plant and equipment. This affected the locations Manaus, Brazil (€8.4 million), Bizerte, Tunisia (€7.5 million), Rambouillet, France (€2.0 million), Nogales, Mexico (€1.9 million), Melbourne, Australia (€1.4 million), Guarulhos, Brazil (€1.2 million), Deer Park, Illinois, U.S.A. (€1.2 million), and Tianjin, China (€0.6 million).
Corporate Management Report Financial Report as at September 30, 2014 Continental AG 12
As part of an asset deal effective July 1, 2013, Continental Automotive Trading France SAS, Rambouillet, France, sold its cockpit activities in the Instrumentation & Driver HMI business unit at the location in Hambach, France, to SAS Automotive France, Voisins le Bretonneux, France. This transaction resulted in a positive special effect in the amount of €0.2 million in the Interior division.
In connection with the cessation of passenger tire production at the plant in Clairoix, France, a large number of employees at Continental France SNC, Sarreguemines, France, filed claims with the industrial tribunals in Compiègne and Soissons, France, against this subsidiary company and, in some cases, against Continental AG as well. On August 30, 2013, the industrial tribunal in Compiègne ordered Continental France SNC and Continental AG to pay damages for the allegedly unlawful dis-missal of employees. Continental considered the plaintiffs’ claims to be unfounded and appealed the tribunal’s ruling. A provision totaling €38.7 million was recognized for this in the Tire division.
The reversal of restructuring provisions no longer required resulted in a total positive special effect of €1.2 million (Chas-sis & Safety €0.3 million; Powertrain €0.9 million).
Impairment losses and reversal of impairment losses on proper-ty, plant and equipment resulted in a negative effect totaling €3.8 million in the Powertrain division and a positive effect totaling €1.4 million in the Tire division.
There was a negative special effect of €0.3 million in total in the ContiTech division.
Owing to the anticipated higher cash outflow for the syndicated loan resulting from rising interest margins, the carrying amount was adjusted as an expense in 2009 and 2010. However, in 2011 the carrying amount was adjusted as income due to signs of decreasing margins and the associated anticipated lower cash outflow for the syndicated loan. These deferrals were amortized over the term of the loan, reducing or increasing expenses ac-cordingly. The amortization of the carrying amount adjustments led to a positive effect totaling €2.4 million in the first nine months of 2013.
Total consolidated income from special effects in the first nine months of 2013 amounted to €8.0 million.
Research and development expenses In the first nine months of 2014, research and development expenses rose by 10.4% compared with the same period of the previous year to €1,627.6 million (PY: €1,474.4 million), repre-senting 6.4% (PY: 5.9%) of sales. €1,400.0 million (PY: €1,258.4 million) of this relates to the Automotive Group, corresponding to 9.1% (PY: 8.4%) of sales, and €227.6 million (PY: €216.0 million) to the Rubber Group, corresponding to 2.2% (PY: 2.2%) of sales.
Net interest expense Net interest expense fell by €414.9 million year-on-year to €215.6 million (PY: €630.5 million) in the first nine months of 2014. In the previous year, this decrease was due in particular to the utilization of the option for the early redemption of the four bonds issued in 2010 and their partial refinancing with considerably lower-interest bonds issued in the second half of 2013.
Interest expense – not including the effects of foreign currency translation, changes in the fair value of derivative instruments and of available-for-sale financial assets – totaled €290.5 million in the first nine months of 2014, which was €230.9 million lower than the figure for the same period of 2013 of €521.4 million. At €177.5 million, interest expense resulting from bank borrow-ings, capital market transactions and other financing instru-ments was €238.9 million lower than the prior year figure of €416.4 million. The major portion related to the expenses from the bonds issued by Continental AG, Conti-Gummi Finance B.V., Maastricht, Netherlands, and Continental Rubber of America, Corp., Wilmington, Delaware, U.S.A., and from the utilization of the syndicated loan.
At €55.7 million (PY: €63.7 million), the interest expense for the syndicated loan remained €8.0 million below the previous year’s level in the first three quarters of 2014, even including a nega-tive special effect attributable to the early redemption of the existing syndicated loan at the end of April 2014 due to its suc-cessful refinancing. The interest expenses for the aforemen-tioned bonds decreased significantly by €223.8 million year-on-year from €299.8 million to €76.0 million. This decrease result-ed in particular from the successful refinancing of the four bonds issued by Conti-Gummi Finance B.V., Maastricht, Netherlands, in 2010 with a total volume of €3.0 billion with new, considerably lower-interest bonds with a total volume of €2.25 billion and from the utilization of cash and cash equivalents in the second half of 2013. The average nominal interest rate of the new bonds is 2.875% p.a., while for the bonds redeemed early in the previ-ous year it was 7.464% p.a. One reason for the higher expenses in the prior-year period was the higher redemption prices to be paid in the event of early redemption in accordance with the terms and conditions of issue, which resulted in a premium totaling €69.4 million for the two bonds redeemed in the third quarter of 2013. Another reason was the carrying amount adjustments for the two bonds redeemed early in November 2013 that had to be recognized due to the planning of the early redemption of these bonds and the anticipated higher cash outflow associated with this. This had a negative impact of €43.1 million in the prior-year period. These carrying amount adjustments were amortized over the expected shorter remain-ing term of the bonds, reducing expenses accordingly. For de-tails of the bonds redeemed early in 2013 and the bonds is-sued in 2013, please refer to the 2013 Annual Report. The interest cost on expected pension obligations as well as on long-term employee benefits resulted in interest expense total-ing €113.0 million (PY: €105.0 million) in the first nine months of 2014.
Corporate Management Report Financial Report as at September 30, 2014 Continental AG 13
Interest income in the first three quarters of 2014 increased by €10.0 million year-on-year to €68.3 million (PY: €58.3 million). Of this, expected income from long-term employee benefits and from pension funds amounted to €48.4 million (PY: €39.0 mil-lion).
In contrast to the previous year, valuation effects from changes in the fair value of derivative instruments and from the devel-opment of exchange rates made a positive overall contribution to earnings of €4.7 million (PY: valuation loss of €170.9 million) in the first nine months of 2014. This included a valuation loss of €4.0 million for the reporting of the early redemption option for the bond issued by Continental Rubber of America, Corp., Wilmington, Delaware, U.S.A. In the prior-year period, there had been a valuation loss of €129.0 million relating to the reporting of early redemption options for all of the bonds issued by Conti-Gummi Finance B.V., Maastricht, Netherlands, in 2010 that were redeemed early in 2013, as well as for the bond issued by Conti-nental Rubber of America, Corp., Wilmington, Delaware, U.S.A. Available-for-sale financial assets gave rise to a positive valua-tion effect of €1.9 million (PY: €3.5 million).
Income tax expense Income tax expense in the first nine months of 2014 amounted to €371.3 million (PY: €237.8 million). The tax rate in the report-ing period was 16.6% after 12.6% for the same period of the previous year. In the period under review, this was due in par-ticular to the recognition of deferred tax assets of €161.2 mil-lion in the U.S.A. and the recognition of deferred tax assets on interest carryforwards in Germany of €98.0 million, both of which are considered likely to be utilized in the future. In the previous year, deferred tax assets of €256.2 million were al-ready recognized due to the consistently positive business performance in the U.S.A.
Net income attributable to the shareholders of the parent Net income attributable to the shareholders of the parent was up 14.1% to €1,798.9 million (PY: €1,576.0 million), with earn-ings per share of €8.99 (PY: €7.88).
Corporate Management Report Financial Report as at September 30, 2014 Continental AG 14
Financial Position Cash flow EBIT decreased by €69.0 million year-on-year to €2,447.9 mil-lion (PY: €2,516.9 million).
Interest payments resulting in particular from the syndicated loan and the bonds declined by €288.3 million to €170.1 mil-lion (PY: €458.4 million).
Income tax payments decreased by €28.8 million to €542.2 million (PY: €571.0 million).
At €1,239.7 million as at September 30, 2014, the net cash outflow arising from the increase in operating working capital was €79.1 million lower than the figure for the previous year of €1,318.8 million.
At €2,349.5 million as at September 30, 2014, the net cash inflow arising from operating activities was €730.6 million higher than the previous year’s figure of €1,618.9 million.
Cash flow arising from investing activities amounted to an out-flow of €1,408.5 million (PY: €1,204.7 million) in the first nine months of 2014. Capital expenditure on property, plant and equipment, and software was down €28.6 million from €1,334.2 million to €1,305.6 million before finance leases and the capital-ization of borrowing costs. Acquisitions and sales of companies and business operations resulted in a total cash outflow of €122.4 million (PY: cash inflow of €131.2 million) in the first three quarters of 2014.
The free cash flow in the first three quarters of 2014 improved by €526.8 million compared with the first nine months of 2013 to €941.0 million (PY: €414.2 million).
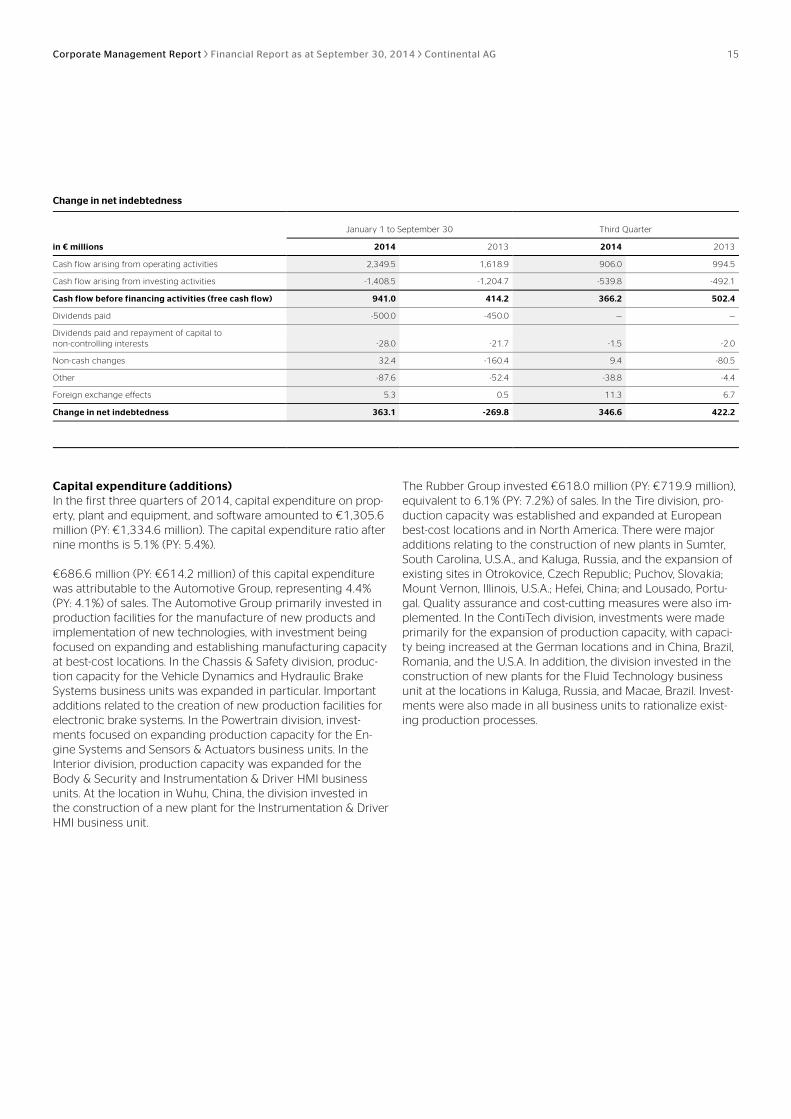
Financing and indebtedness As at September 30, 2014, the corporation’s net indebtedness was down €1,663.5 million year-on-year from €5,589.7 million to €3,926.2 million. Net indebtedness was also down €363.1 million in comparison to December 31, 2013, when it had amounted to €4,289.3 million. The gearing ratio improved to 36.2% (PY: 61.6%) as at the end of September 2014.
Following the successful refinancing of the syndicated loan in January 2013, further steps were implemented in 2013 to improve the financial and maturity structure while at the same time reducing interest costs. Continental had issued three euro bonds with an issue volume totaling €2.25 billion in the third quarter of 2013 under the Debt Issuance Programme (DIP) for the issuance of bonds set up in May 2013 with a maximum volume of €5.0 billion. The issue proceeds were used for the partial refinancing of the four bonds issued in 2010 by Conti-Gummi Finance B.V., Maastricht, Netherlands, with a total vol-ume of €3.0 billion, which were redeemed early in the period from July to November 2013. Cash and cash equivalents were
also used to redeem these bonds. For details of the bonds re-deemed early in 2013 and all of the bonds issued in 2013, please refer to the 2013 Annual Report.
To reflect Continental’s improved operating performance and its improved rating in the financing conditions, the existing syndi-cated loan was replaced by a new syndicated loan at the end of April 2014. The committed volume of the new syndicated loan is still €4.5 billion and consists of a term loan of €1.5 billion and a revolving credit line of €3.0 billion. The term loan has a term of two years, while the revolving credit line has a term of five years. In addition to further simplification of the documentation required, the interest margin, which is now geared towards Conti-nental’s rating again, was also reduced significantly. As at the end of the third quarter of 2014, the syndicated loan had been utilized only by Continental AG in a nominal amount of €1,500.0 million, as in the previous year.
As at September 30, 2014, Continental had liquidity reserves totaling €6,082.9 million (PY: €5,998.6 million), consisting of cash and cash equivalents of €2,013.2 million (PY: €2,207.0 million) and committed, unutilized credit lines totaling €4,069.7 million (PY: €3,791.6 million).
The restrictions that may impact the availability of capital are also understood as comprising all existing restrictions on the cash and cash equivalents. In the Continental Corporation, the aforementioned cash and cash equivalents are restricted with regard to pledged amounts, liquid funds from the contractual trust arrangements (CTAs), and balances in the following coun-tries with foreign exchange restrictions: Argentina, Brazil, Chile, Greece, India, and Serbia. Taxes to be paid on the transfer of cash assets from one country (e.g. China) to another (e.g. Ger-many) are not considered to represent a restriction on cash and cash equivalents. As at September 30, 2014, unrestricted cash and cash equivalents totaled €1,669.6 million.
Corporate Management Report Financial Report as at September 30, 2014 Continental AG 15
Change in net indebtedness
January 1 to September 30 Third Quarter
in € millions 2014 2013 2014 2013
Cash flow arising from operating activities 2,349.5 1,618.9 906.0 994.5
Cash flow arising from investing activities -1,408.5 -1,204.7 -539.8 -492.1
Cash flow before financing activities (free cash flow) 941.0 414.2 366.2 502.4
Dividends paid -500.0 -450.0 — —
Dividends paid and repayment of capital to non-controlling interests -28.0 -21.7 -1.5 -2.0
Non-cash changes 32.4 -160.4 9.4 -80.5
Other -87.6 -52.4 -38.8 -4.4
Foreign exchange effects 5.3 0.5 11.3 6.7
Change in net indebtedness 363.1 -269.8 346.6 422.2
Capital expenditure (additions) In the first three quarters of 2014, capital expenditure on prop-erty, plant and equipment, and software amounted to €1,305.6 million (PY: €1,334.6 million). The capital expenditure ratio after nine months is 5.1% (PY: 5.4%).
€686.6 million (PY: €614.2 million) of this capital expenditure was attributable to the Automotive Group, representing 4.4% (PY: 4.1%) of sales. The Automotive Group primarily invested in production facilities for the manufacture of new products and implementation of new technologies, with investment being focused on expanding and establishing manufacturing capacity at best-cost locations. In the Chassis & Safety division, produc-tion capacity for the Vehicle Dynamics and Hydraulic Brake Systems business units was expanded in particular. Important additions related to the creation of new production facilities for electronic brake systems. In the Powertrain division, invest-ments focused on expanding production capacity for the En-gine Systems and Sensors & Actuators business units. In the Interior division, production capacity was expanded for the Body & Security and Instrumentation & Driver HMI business units. At the location in Wuhu, China, the division invested in the construction of a new plant for the Instrumentation & Driver HMI business unit.
The Rubber Group invested €618.0 million (PY: €719.9 million), equivalent to 6.1% (PY: 7.2%) of sales. In the Tire division, pro-duction capacity was established and expanded at European best-cost locations and in North America. There were major additions relating to the construction of new plants in Sumter, South Carolina, U.S.A., and Kaluga, Russia, and the expansion of existing sites in Otrokovice, Czech Republic; Puchov, Slovakia; Mount Vernon, Illinois, U.S.A.; Hefei, China; and Lousado, Portu-gal. Quality assurance and cost-cutting measures were also im-plemented. In the ContiTech division, investments were made primarily for the expansion of production capacity, with capaci-ty being increased at the German locations and in China, Brazil, Romania, and the U.S.A. In addition, the division invested in the construction of new plants for the Fluid Technology business unit at the locations in Kaluga, Russia, and Macae, Brazil. Invest-ments were also made in all business units to rationalize exist-ing production processes.
Corporate Management Report Financial Report as at September 30, 2014 Continental AG 16
Net Assets Position At €29,668.2 million (PY: €28,204.8 million), total assets as at September 30, 2014, were €1,463.4 million higher than on the same date in 2013. This was primarily due to the €135.2 mil-lion increase in goodwill to €5,742.2 million (PY: €5,607.0 mil-lion) and the €574.7 million rise in property, plant and equip-ment to €8,159.8 million (PY: €7,585.1 million). Deferred tax assets climbed by €517.5 million compared to the same period of the previous year to €1,468.7 million (PY: €951.2 million), influenced in particular by the recognition of deferred tax assets in the U.S.A. and Germany. Inventories rose by €210.4 million to €3,330.3 million (PY: €3,119.9 million). Trade accounts receiva-ble also rose by €454.1 million to €6,569.3 million. This was partially offset by a €179.0 million decline in other intangible assets to €455.2 million (PY: €634.2 million), primarily due to amortization from purchase price allocation (PPA). Investments in at-equity accounted investees declined by €154.5 million to €302.3 million (PY: €456.8 million) as a result of the impair-ment loss on the investment in SK Continental E-motion Pte. Ltd., Singapore, Singapore, and the acquisition of the remaining shares in Emitec Gesellschaft für Emissionstechnologie mbH, Lohmar, Germany. At €2,013.2 million (PY: €2,207.0 million), liquid funds were down €193.8 million.
Equity including non-controlling interests was up €1,779.0 million to €10,852.7 million as compared to €9,073.7 million as at September 30, 2013. This was due primarily to the increase in the retained earnings of €1,640.7 million. Equity was reduced by dividends in the amount of €500.0 million resolved at the Annual Shareholders’ Meeting. Reserves recognized directly in equity changed by €92.7 million to -€1,007.9 million (PY: -€1,100.6 million). The gearing ratio improved from 61.6% to 36.2%. The equity ratio rose to 36.6% (PY: 32.2%).
At €29,668.2 million, total assets were up €2,847.4 million compared with December 31, 2013 (PY: €26,820.8 million). This was primarily attributable to the €540.3 million increase in deferred tax assets to €1,468.7 million (PY: €928.4 million), the €1,253.5 million rise in trade accounts receivable to €6,569.3 million (PY: €5,315.8 million) and the €499.4 million rise in inventories to €3,330.3 million (PY: €2,830.9 million).
Equity including non-controlling interests was up €1,530.5 million to €10,852.7 million as compared to €9,322.2 million at the end of 2013. This was due primarily to the positive net income attributable to the shareholders of the parent of €1,798.9 million. The gearing ratio fell from 46.0% to 36.2%.
Employees As at the end of the third quarter of 2014, the corporation had 189,361 employees, representing a rise of 11,599 in compari-son to the end of 2013. The number of employees in the Auto-motive Group rose by 5,780 as a result of increased volumes, acquisitions by the Chassis & Safety and Powertrain divisions, and expansion of research and development. In the Rubber Group, further expansion of production capacity and sales channels as well as acquisitions by the ContiTech division led to an increase of 5,799 employees. Compared with the reporting date for the previous year, the number of employees in the corporation was up by a total of 11,974.
Corporate Management Report Financial Report as at September 30, 2014 Continental AG 17
Development of the Divisions
January 1 to September 30 Third Quarter
Chassis & Safety in € millions 2014 2013 2014 2013
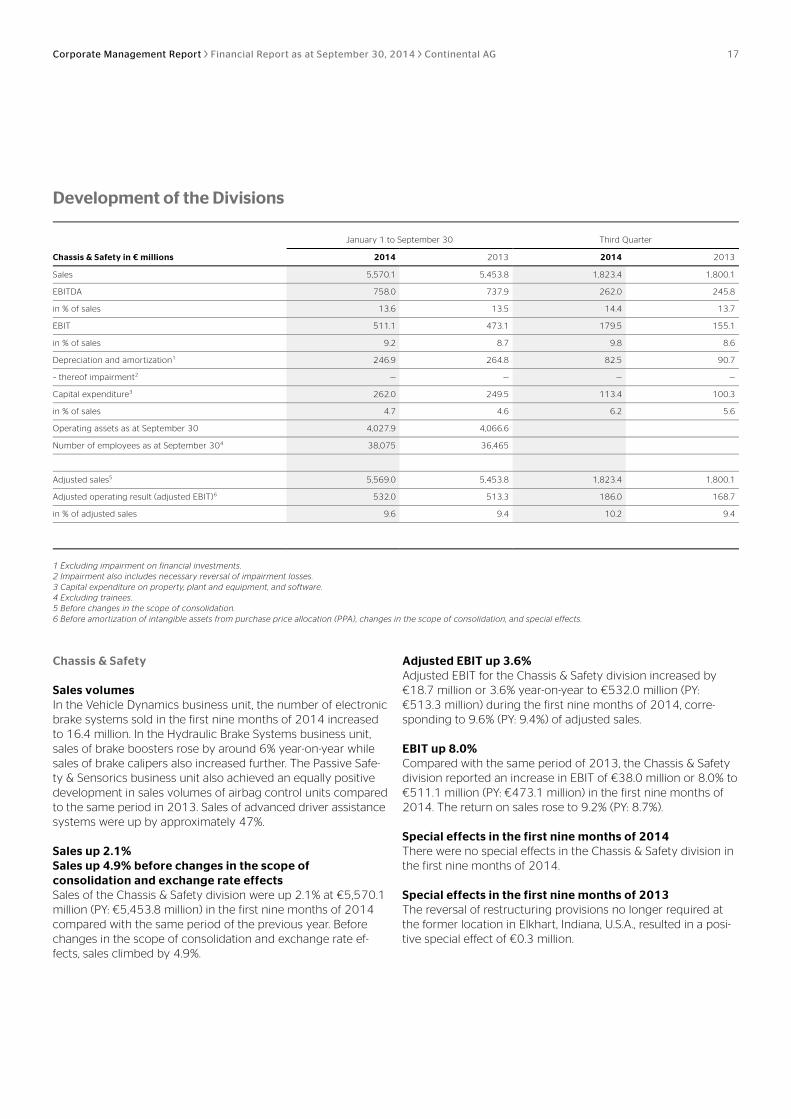
Sales 5,570.1 5,453.8 1,823.4 1,800.1
EBITDA 758.0 737.9 262.0 245.8
in % of sales 13.6 13.5 14.4 13.7
EBIT 511.1 473.1 179.5 155.1
in % of sales 9.2 8.7 9.8 8.6
Depreciation and amortization1 246.9 264.8 82.5 90.7
– thereof impairment2 — — — —
Capital expenditure3 262.0 249.5 113.4 100.3
in % of sales 4.7 4.6 6.2 5.6
Operating assets as at September 30 4,027.9 4,066.6
Number of employees as at September 304 38,075 36,465
Adjusted sales5 5,569.0 5,453.8 1,823.4 1,800.1
Adjusted operating result (adjusted EBIT)6 532.0 513.3 186.0 168.7
in % of adjusted sales 9.6 9.4 10.2 9.4
1 Excluding impairment on financial investments. 2 Impairment also includes necessary reversal of impairment losses. 3 Capital expenditure on property, plant and equipment, and software. 4 Excluding trainees. 5 Before changes in the scope of consolidation. 6 Before amortization of intangible assets from purchase price allocation (PPA), changes in the scope of consolidation, and special effects.
Chassis & Safety Sales volumes In the Vehicle Dynamics business unit, the number of electronic brake systems sold in the first nine months of 2014 increased to 16.4 million. In the Hydraulic Brake Systems business unit, sales of brake boosters rose by around 6% year-on-year while sales of brake calipers also increased further. The Passive Safe-ty & Sensorics business unit also achieved an equally positive development in sales volumes of airbag control units compared to the same period in 2013. Sales of advanced driver assistance systems were up by approximately 47%.
Sales up 2.1% Sales up 4.9% before changes in the scope of consolidation and exchange rate effects Sales of the Chassis & Safety division were up 2.1% at €5,570.1 million (PY: €5,453.8 million) in the first nine months of 2014 compared with the same period of the previous year. Before changes in the scope of consolidation and exchange rate ef-fects, sales climbed by 4.9%.
Adjusted EBIT up 3.6% Adjusted EBIT for the Chassis & Safety division increased by €18.7 million or 3.6% year-on-year to €532.0 million (PY: €513.3 million) during the first nine months of 2014, corre-sponding to 9.6% (PY: 9.4%) of adjusted sales.
EBIT up 8.0% Compared with the same period of 2013, the Chassis & Safety division reported an increase in EBIT of €38.0 million or 8.0% to €511.1 million (PY: €473.1 million) in the first nine months of 2014. The return on sales rose to 9.2% (PY: 8.7%).
Special effects in the first nine months of 2014 There were no special effects in the Chassis & Safety division in the first nine months of 2014.
Special effects in the first nine months of 2013 The reversal of restructuring provisions no longer required at the former location in Elkhart, Indiana, U.S.A., resulted in a posi-tive special effect of €0.3 million.
Corporate Management Report Financial Report as at September 30, 2014 Continental AG 18
January 1 to September 30 Third Quarter
Powertrain in € millions 2014 2013 2014 2013
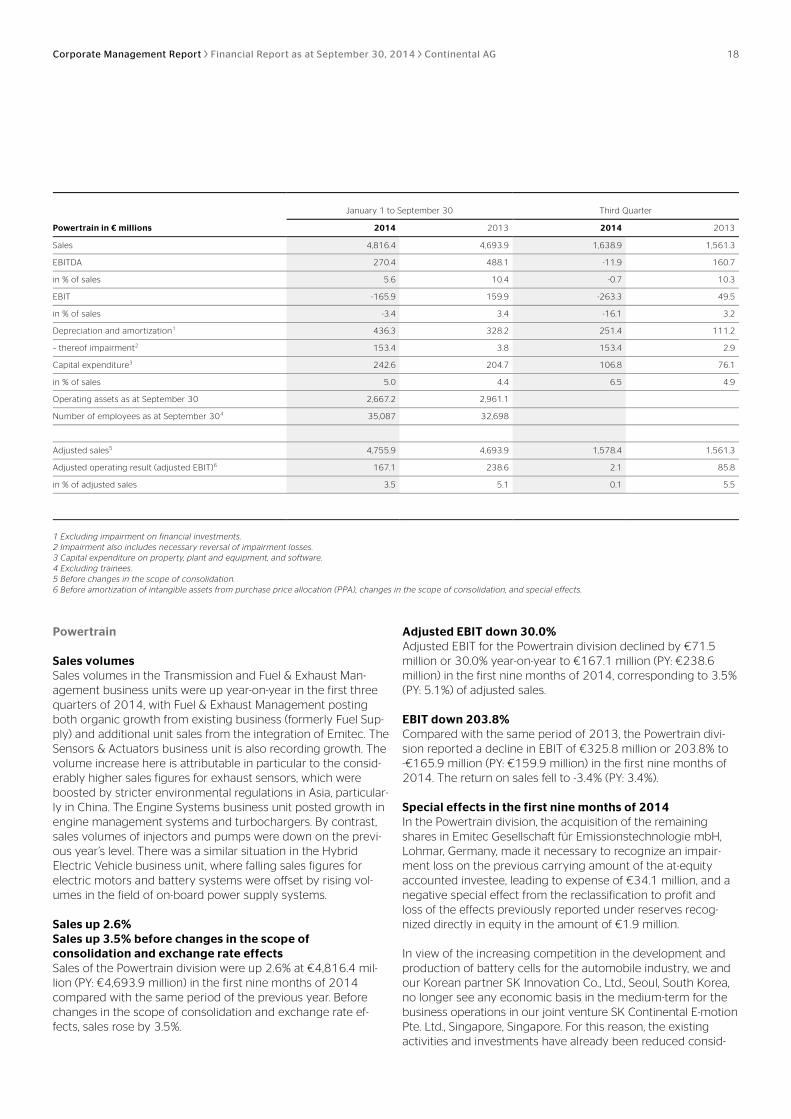
Sales 4,816.4 4,693.9 1,638.9 1,561.3
EBITDA 270.4 488.1 -11.9 160.7
in % of sales 5.6 10.4 -0.7 10.3
EBIT -165.9 159.9 -263.3 49.5
in % of sales -3.4 3.4 -16.1 3.2
Depreciation and amortization1 436.3 328.2 251.4 111.2
– thereof impairment2 153.4 3.8 153.4 2.9
Capital expenditure3 242.6 204.7 106.8 76.1
in % of sales 5.0 4.4 6.5 4.9
Operating assets as at September 30 2,667.2 2,961.1
Number of employees as at September 304 35,087 32,698
Adjusted sales5 4,755.9 4,693.9 1,578.4 1,561.3
Adjusted operating result (adjusted EBIT)6 167.1 238.6 2.1 85.8
in % of adjusted sales 3.5 5.1 0.1 5.5
1 Excluding impairment on financial investments. 2 Impairment also includes necessary reversal of impairment losses. 3 Capital expenditure on property, plant and equipment, and software. 4 Excluding trainees. 5 Before changes in the scope of consolidation. 6 Before amortization of intangible assets from purchase price allocation (PPA), changes in the scope of consolidation, and special effects.
Powertrain Sales volumes Sales volumes in the Transmission and Fuel & Exhaust Man-agement business units were up year-on-year in the first three quarters of 2014, with Fuel & Exhaust Management posting both organic growth from existing business (formerly Fuel Sup-ply) and additional unit sales from the integration of Emitec. The Sensors & Actuators business unit is also recording growth. The volume increase here is attributable in particular to the consid-erably higher sales figures for exhaust sensors, which were boosted by stricter environmental regulations in Asia, particular-ly in China. The Engine Systems business unit posted growth in engine management systems and turbochargers. By contrast, sales volumes of injectors and pumps were down on the previ-ous year’s level. There was a similar situation in the Hybrid Electric Vehicle business unit, where falling sales figures for electric motors and battery systems were offset by rising vol-umes in the field of on-board power supply systems.
Sales up 2.6% Sales up 3.5% before changes in the scope of consolidation and exchange rate effects Sales of the Powertrain division were up 2.6% at €4,816.4 mil-lion (PY: €4,693.9 million) in the first nine months of 2014 compared with the same period of the previous year. Before changes in the scope of consolidation and exchange rate ef-fects, sales rose by 3.5%.
Adjusted EBIT down 30.0% Adjusted EBIT for the Powertrain division declined by €71.5 million or 30.0% year-on-year to €167.1 million (PY: €238.6 million) in the first nine months of 2014, corresponding to 3.5% (PY: 5.1%) of adjusted sales.
EBIT down 203.8% Compared with the same period of 2013, the Powertrain divi-sion reported a decline in EBIT of €325.8 million or 203.8% to -€165.9 million (PY: €159.9 million) in the first nine months of 2014. The return on sales fell to -3.4% (PY: 3.4%).
Special effects in the first nine months of 2014 In the Powertrain division, the acquisition of the remaining shares in Emitec Gesellschaft für Emissionstechnologie mbH, Lohmar, Germany, made it necessary to recognize an impair-ment loss on the previous carrying amount of the at-equity accounted investee, leading to expense of €34.1 million, and a negative special effect from the reclassification to profit and loss of the effects previously reported under reserves recog-nized directly in equity in the amount of €1.9 million.
In view of the increasing competition in the development and production of battery cells for the automobile industry, we and our Korean partner SK Innovation Co., Ltd., Seoul, South Korea, no longer see any economic basis in the medium-term for the business operations in our joint venture SK Continental E-motion Pte. Ltd., Singapore, Singapore. For this reason, the existing activities and investments have already been reduced consid-
Corporate Management Report Financial Report as at September 30, 2014 Continental AG 19
erably, which in a further step – due to the lack of profitability prospects – led to an impairment on the at-equity accounted investee in the amount of €77.9 million within the Powertrain division.
Furthermore, we took this new development as a triggering event to adjust the value of property, plant and equipment in the Hybrid Electric Vehicle (HEV) business unit to the current utilization of capacity. This led to additional impairment losses on property, plant and equipment in the amount of €57.8 mil-lion.
After an in-depth quality review, we did not launch a diesel injector that was based on technologies from the time before the Siemens VDO acquisition. Impairment losses of €62.0 mil-lion on intangible assets and property, plant and equipment were incurred in the Powertrain division in this context, as well as restructuring expenses of €22.3 million, of which €6.2 mil-lion was attributable to impairment losses on property, plant and equipment.
This situation also prompted us to check pumps based on technologies from the time before the Siemens VDO acquisi-tion, primarily in the diesel sector. This resulted in the necessity to recognize impairment losses on property, plant and equip-ment as part of valuation at the lower of cost or market value. This led to an additional expense of €27.4 million in the Power-train division.
For the Powertrain division, the total negative impact from spe-cial effects in the first nine months of 2014 amounted to €283.4 million.
Special effects in the first nine months of 2013 On January 1, 2013, the closing took place for SK Continental E-motion Pte. Ltd., Singapore, Singapore, a company jointly managed by SK Innovation Co., Ltd., Seoul, South Korea, and Continental, after the agreement to form the company was signed in July 2012. The transaction resulted at that time in income of €24.2 million in the Powertrain division.
Impairment losses on property, plant and equipment resulted in a total expense of €3.8 million for the locations in Sibiu, Roma-nia, and Trutnov, Czech Republic.
The reversal of restructuring provisions no longer required resulted in a positive special effect of €0.9 million.
The positive impact from special effects in the Powertrain divi-sion amounted to €21.3 million in the first nine months of 2013.
Corporate Management Report Financial Report as at September 30, 2014 Continental AG 20
January 1 to September 30 Third Quarter
Interior in € millions 2014 2013 2014 2013
Sales 5,158.4 4,955.9 1,725.4 1,612.5
EBITDA 697.4 636.7 229.7 214.5
in % of sales 13.5 12.8 13.3 13.3
EBIT 437.3 312.6 144.8 104.4
in % of sales 8.5 6.3 8.4 6.5
Depreciation and amortization1 260.1 324.1 84.9 110.1
– thereof impairment2 4.6 2.9 — 2.9
Capital expenditure3 182.0 160.0 77.1 53.5
in % of sales 3.5 3.2 4.5 3.3
Operating assets as at September 30 3,857.2 3,981.3
Number of employees as at September 304 35,835 34,302
Adjusted sales5 5,158.4 4,883.9 1,725.4 1,612.5
Adjusted operating result (adjusted EBIT)6 521.6 432.3 168.0 149.1
in % of adjusted sales 10.1 8.9 9.7 9.2
1 Excluding impairment on financial investments. 2 Impairment also includes necessary reversal of impairment losses. 3 Capital expenditure on property, plant and equipment, and software. 4 Excluding trainees. 5 Before changes in the scope of consolidation. 6 Before amortization of intangible assets from purchase price allocation (PPA), changes in the scope of consolidation, and special effects.
Interior Sales volumes Sales volumes in the Body & Security business unit were up on the previous year’s level after the first nine months of 2014. Sales with North American and European customers in particu-lar recorded a substantial increase. Business with Asian cus-tomers was up slightly on the previous year’s level. Unit sales of audio components were down year-on-year in the Infotain-ment & Connectivity business unit. This was primarily due to declining demand in Europe, while Asia saw a significant in-crease and new products. Unit sales of multimedia systems picked up significantly on account of new products in Asia and on the U.S. market, and growing demand in Europe. There was a decline in the device connectivity and telematics segment. Sales volumes in the Commercial Vehicles & Aftermarket busi-ness unit were above the previous year’s level. This was mainly due to growth in replacement parts and aftermarket business, particularly in NAFTA and Western Europe. Business in the commercial vehicle sector remained stable in comparison to the previous year. In the Instrumentation & Driver HMI business unit, sales figures in the first three quarters of 2014 were higher than in the same period of 2013 before consolidation changes. This was primarily attributable to considerably higher demand in China and increased sales volumes in North America and Europe.
Sales up 4.1% Sales up 8.4% before changes in the scope of consolidation and exchange rate effects Sales of the Interior division were up 4.1% at €5,158.4 million (PY: €4,955.9 million) in the first nine months of 2014 com-pared with the same period of the previous year. Before chang-es in the scope of consolidation and exchange rate effects, sales rose by 8.4%.
Adjusted EBIT up 20.7% Adjusted EBIT for the Interior division increased by €89.3 mil-lion or 20.7% year-on-year to €521.6 million (PY: €432.3 mil-lion) in the first nine months of 2014, corresponding to 10.1% (PY: 8.9%) of adjusted sales.
EBIT up 39.9% Compared with the same period of 2013, the Interior division reported a rise in EBIT of €124.7 million or 39.9% to €437.3 million (PY: €312.6 million) in the first nine months of 2014. The return on sales rose to 8.5% (PY: 6.3%).
Special effects in the first nine months of 2014 In the Interior division, the divestment of certain activities of the Infotainment & Connectivity business unit at the location in Rambouillet, France, resulted in a loss of €6.9 million. Impair-ment losses of €4.2 million on property, plant and equipment were also incurred in this context.
Corporate Management Report Financial Report as at September 30, 2014 Continental AG 21
Further impairment losses on property, plant and equipment resulted in expense of €0.4 million in the Interior division.
The reversal of restructuring provisions no longer required resulted in a positive special effect of €0.4 million.
Effective September 30, 2014, certain activities of the Body & Security business unit were sold to a newly established joint venture. This transaction resulted in a positive special effect totaling €1.7 million in the Interior division.
For the Interior division, the total negative impact from special effects in the first nine months of 2014 amounted to €9.4 million.
Special effects in the first nine months of 2013 As at January 29, 2013, Continental sold its shares in S-Y Sys-tems Technologies Europe GmbH, Regensburg, Germany, to Yazaki Europe Ltd., Hemel Hempstead, U.K. The transaction resulted in income of €54.6 million in the Interior division.
On July 10, 2013, the European Commission imposed fines on a number of automotive suppliers for anti-competitive conduct in the field of supplying wire harnesses for automotive applica-tions. These companies included S-Y Systems Technologies Europe GmbH, Regensburg, Germany, and its French subsidiary, which must pay a fine of €11.1 million due to cartel agreements
with regard to one automotive manufacturer. Since Continental held a 50% share of S-Y Systems Technologies Europe GmbH, Regensburg, Germany, until January 29, 2013, a provision of €9.0 million was recognized in the Interior division based upon contingent liabilities.
Activities were concluded and restructured in one product segment within the Infotainment & Connectivity business unit in the Interior division. Expenses totaling €24.2 million were incurred in this context, of which €2.9 million was attributable to impairment of property, plant and equipment. This affected the locations Manaus, Brazil (€8.4 million), Bizerte, Tunisia (€7.5 million), Rambouillet, France (€2.0 million), Nogales, Mexico (€1.9 million), Melbourne, Australia (€1.4 million), Guarulhos, Brazil (€1.2 million), Deer Park, Illinois, U.S.A. (€1.2 million), and Tianjin, China (€0.6 million).
As part of an asset deal effective July 1, 2013, Continental Automotive Trading France SAS, Rambouillet, France, sold its cockpit activities in the Instrumentation & Driver HMI business unit at the location in Hambach, France, to SAS Automotive France, Voisins le Bretonneux, France. This transaction resulted in a positive special effect in the amount of €0.2 million.
The positive impact from special effects in the Interior division amounted to €21.6 million in the first nine months of 2013.
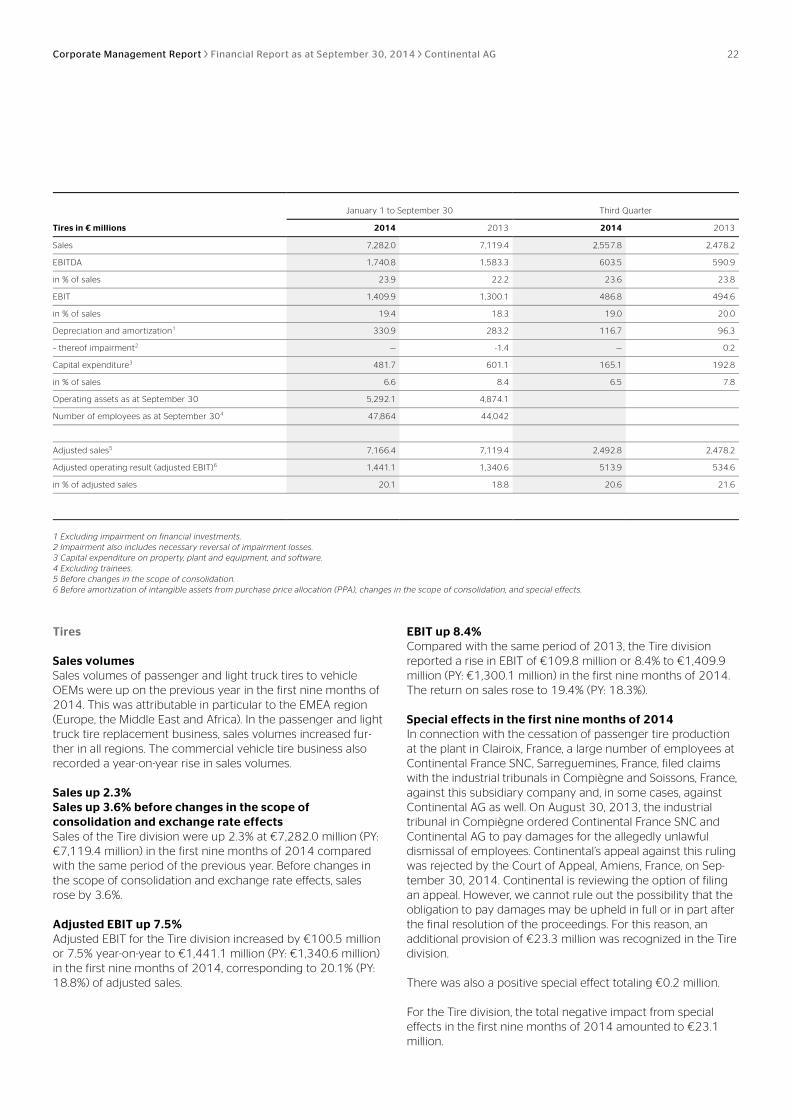
Corporate Management Report Financial Report as at September 30, 2014 Continental AG 22
January 1 to September 30 Third Quarter
Tires in € millions 2014 2013 2014 2013
Sales 7,282.0 7,119.4 2,557.8 2,478.2
EBITDA 1,740.8 1,583.3 603.5 590.9
in % of sales 23.9 22.2 23.6 23.8
EBIT 1,409.9 1,300.1 486.8 494.6
in % of sales 19.4 18.3 19.0 20.0
Depreciation and amortization1 330.9 283.2 116.7 96.3
– thereof impairment2 — -1.4 — 0.2
Capital expenditure3 481.7 601.1 165.1 192.8
in % of sales 6.6 8.4 6.5 7.8
Operating assets as at September 30 5,292.1 4,874.1
Number of employees as at September 304 47,864 44,042
Adjusted sales5 7,166.4 7,119.4 2,492.8 2,478.2
Adjusted operating result (adjusted EBIT)6 1,441.1 1,340.6 513.9 534.6
in % of adjusted sales 20.1 18.8 20.6 21.6
1 Excluding impairment on financial investments. 2 Impairment also includes necessary reversal of impairment losses. 3 Capital expenditure on property, plant and equipment, and software. 4 Excluding trainees. 5 Before changes in the scope of consolidation. 6 Before amortization of intangible assets from purchase price allocation (PPA), changes in the scope of consolidation, and special effects.
Tires Sales volumes Sales volumes of passenger and light truck tires to vehicle OEMs were up on the previous year in the first nine months of 2014. This was attributable in particular to the EMEA region (Europe, the Middle East and Africa). In the passenger and light truck tire replacement business, sales volumes increased fur-ther in all regions. The commercial vehicle tire business also recorded a year-on-year rise in sales volumes.
Sales up 2.3% Sales up 3.6% before changes in the scope of consolidation and exchange rate effects Sales of the Tire division were up 2.3% at €7,282.0 million (PY: €7,119.4 million) in the first nine months of 2014 compared with the same period of the previous year. Before changes in the scope of consolidation and exchange rate effects, sales rose by 3.6%.
Adjusted EBIT up 7.5% Adjusted EBIT for the Tire division increased by €100.5 million or 7.5% year-on-year to €1,441.1 million (PY: €1,340.6 million) in the first nine months of 2014, corresponding to 20.1% (PY: 18.8%) of adjusted sales.
EBIT up 8.4% Compared with the same period of 2013, the Tire division reported a rise in EBIT of €109.8 million or 8.4% to €1,409.9 million (PY: €1,300.1 million) in the first nine months of 2014. The return on sales rose to 19.4% (PY: 18.3%).
Special effects in the first nine months of 2014 In connection with the cessation of passenger tire production at the plant in Clairoix, France, a large number of employees at Continental France SNC, Sarreguemines, France, filed claims with the industrial tribunals in Compiègne and Soissons, France, against this subsidiary company and, in some cases, against Continental AG as well. On August 30, 2013, the industrial tribunal in Compiègne ordered Continental France SNC and Continental AG to pay damages for the allegedly unlawful dismissal of employees. Continental’s appeal against this ruling was rejected by the Court of Appeal, Amiens, France, on Sep-tember 30, 2014. Continental is reviewing the option of filing an appeal. However, we cannot rule out the possibility that the obligation to pay damages may be upheld in full or in part after the final resolution of the proceedings. For this reason, an additional provision of €23.3 million was recognized in the Tire division.
There was also a positive special effect totaling €0.2 million.
For the Tire division, the total negative impact from special effects in the first nine months of 2014 amounted to €23.1 million.
Corporate Management Report Financial Report as at September 30, 2014 Continental AG 23
Special effects in the first nine months of 2013 In connection with the cessation of passenger tire production at the plant in Clairoix, France, a large number of employees at Continental France SNC, Sarreguemines, France, filed claims with the industrial tribunals in Compiègne and Soissons, France, against this subsidiary company and, in some cases, against Continental AG as well. On August 30, 2013, the industrial tribunal in Compiègne ordered Continental France SNC and Continental AG to pay damages for the allegedly unlawful dismissal of employees. Continental considered the plaintiffs’ claims to be unfounded and appealed the tribunal’s ruling. A provision totaling €38.7 million was recognized for this in the Tire division.
Reversal of impairment losses and impairment losses on prop-erty, plant and equipment had a positive effect totaling €1.4 million in the Tire division in the first nine months of 2013.
The total negative impact from special effects in the Tire divi-sion amounted to €37.3 million in the first nine months of 2013.
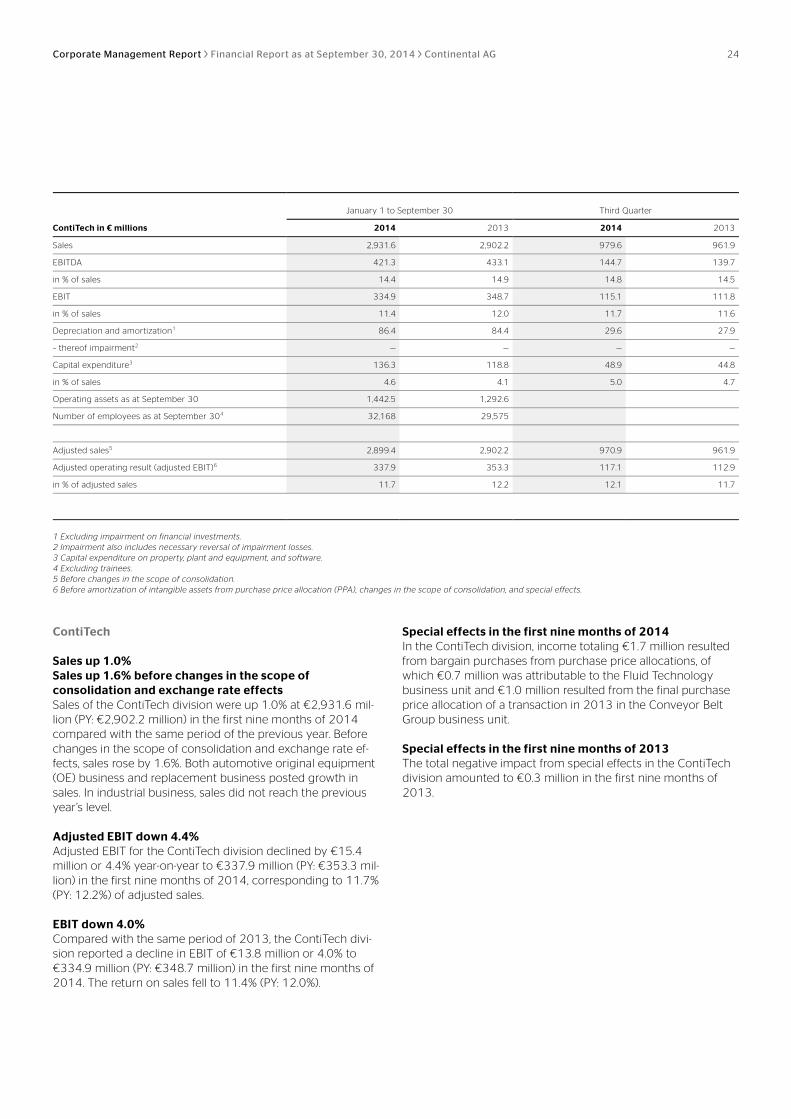
Corporate Management Report Financial Report as at September 30, 2014 Continental AG 24
January 1 to September 30 Third Quarter
ContiTech in € millions 2014 2013 2014 2013
Sales 2,931.6 2,902.2 979.6 961.9
EBITDA 421.3 433.1 144.7 139.7
in % of sales 14.4 14.9 14.8 14.5
EBIT 334.9 348.7 115.1 111.8
in % of sales 11.4 12.0 11.7 11.6
Depreciation and amortization1 86.4 84.4 29.6 27.9
– thereof impairment2 — — — —
Capital expenditure3 136.3 118.8 48.9 44.8
in % of sales 4.6 4.1 5.0 4.7
Operating assets as at September 30 1,442.5 1,292.6
Number of employees as at September 304 32,168 29,575
Adjusted sales5 2,899.4 2,902.2 970.9 961.9
Adjusted operating result (adjusted EBIT)6 337.9 353.3 117.1 112.9
in % of adjusted sales 11.7 12.2 12.1 11.7
1 Excluding impairment on financial investments. 2 Impairment also includes necessary reversal of impairment losses. 3 Capital expenditure on property, plant and equipment, and software. 4 Excluding trainees. 5 Before changes in the scope of consolidation. 6 Before amortization of intangible assets from purchase price allocation (PPA), changes in the scope of consolidation, and special effects.
ContiTech Sales up 1.0% Sales up 1.6% before changes in the scope of consolidation and exchange rate effects Sales of the ContiTech division were up 1.0% at €2,931.6 mil-lion (PY: €2,902.2 million) in the first nine months of 2014 compared with the same period of the previous year. Before changes in the scope of consolidation and exchange rate ef-fects, sales rose by 1.6%. Both automotive original equipment (OE) business and replacement business posted growth in sales. In industrial business, sales did not reach the previous year’s level.
Adjusted EBIT down 4.4% Adjusted EBIT for the ContiTech division declined by €15.4 million or 4.4% year-on-year to €337.9 million (PY: €353.3 mil-lion) in the first nine months of 2014, corresponding to 11.7% (PY: 12.2%) of adjusted sales.
EBIT down 4.0% Compared with the same period of 2013, the ContiTech divi-sion reported a decline in EBIT of €13.8 million or 4.0% to €334.9 million (PY: €348.7 million) in the first nine months of 2014. The return on sales fell to 11.4% (PY: 12.0%).
Special effects in the first nine months of 2014 In the ContiTech division, income totaling €1.7 million resulted from bargain purchases from purchase price allocations, of which €0.7 million was attributable to the Fluid Technology business unit and €1.0 million resulted from the final purchase price allocation of a transaction in 2013 in the Conveyor Belt Group business unit.
Special effects in the first nine months of 2013 The total negative impact from special effects in the ContiTech division amounted to €0.3 million in the first nine months of 2013.
Corporate Management Report Financial Report as at September 30, 2014 Continental AG 25
Report on Risks and Opportunities
There were no material changes in opportunities and risks during the reporting period. For details of the main risks and opportunities, please refer to our comments in the 2013 Annual Report.
Report on Expected Developments and Outlook In the first nine months of 2014, consolidated sales climbed by 2.7% to €25.6 billion. Negative exchange rate effects resulted in a reduction in sales growth of around €650 million. Based on the current exchange rates, this negative exchange rate effect is no longer expected to change significantly by the end of the year. We are therefore confirming our sales target for the cur-rent year of approximately €34.5 billion. The sales target for the Automotive Group remains at €20.8 billion, while for the Rub-ber Group it is €13.8 billion. After the positive development of the adjusted EBIT margin in the first nine months, we can fully confirm our target of achieving an adjusted EBIT margin of around 11% in the current year and even consider it realistic that we may slightly exceed this level at the end of year.
Our forecast for the development of synthetic rubber prices has been confirmed to date. However, prices for natural rubber have also decreased again in comparison to the second quarter, re-sulting in an additional positive effect of only around €20 mil-lion in the current year due to the time lag between purchasing and processing the raw materials. The total positive effect for 2014 thus increases to €180 million. We are lowering our esti-mate for the average price of natural rubber from U.S. $2.10 per kilogram to U.S. $1.86 per kilogram for 2014. On this basis, we now anticipate an adjusted EBIT margin of about 16.5% for the
Rubber Group in the current year. The adjusted EBIT margin for the Automotive Group will amount to just under 8% despite the negative effects in the Powertrain division.
As described in the Corporate Management Report, special effects amounted to €314.2 million as at September 30, 2014. At present, further significant special effects are not to be ex-pected in the current year.
Owing to the substantial reduction in interest expense in the first nine months, we anticipate net interest expense of around €300 million. Due to the recognition of deferred tax assets in the U.S.A. in the amount of €161.2 million and the recognition of deferred tax assets on interest carryforwards in Germany in the amount of €98.0 million, both of which are considered likely to be utilized in the future, the tax rate will be around 20% in the current year.
We still anticipate a capital expenditure ratio before financial investments of around 6% of consolidated sales.
Because the special effects do not have any negative impact on cash flow in the current year, we are raising our forecast for free cash flow before acquisitions for 2014 to more than €1.8 billion. Only a small portion of the aforementioned special effects of €314.2 million will have an impact on cash.
At present, the purchase of Veyance Technologies, Inc., Fair-lawn, Ohio, U.S.A., is expected to be completed in December 2014. The transaction will have a positive impact of around €100 million on consolidated sales. We do not currently antici-pate any negative effects on earnings in 2014. By contrast, the recognition of this acquisition will result in a rise in the corpora-tion’s operating assets of around €1.5 billion and will therefore generally have a negative impact on consolidated ROCE.
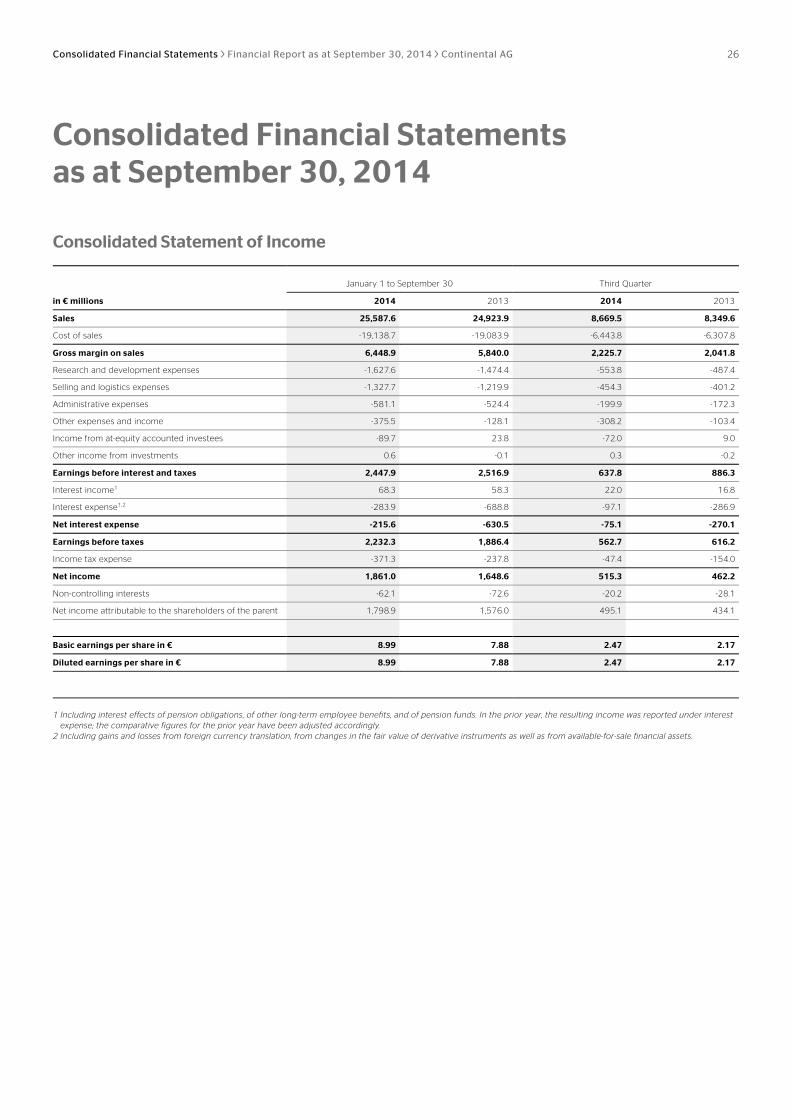
Consolidated Financial Statements Financial Report as at September 30, 2014 Continental AG 26
Consolidated Statement of Income
January 1 to September 30 Third Quarter
in € millions 2014 2013 2014 2013
Sales 25,587.6 24,923.9 8,669.5 8,349.6
Cost of sales -19,138.7 -19,083.9 -6,443.8 -6,307.8
Gross margin on sales 6,448.9 5,840.0 2,225.7 2,041.8
Research and development expenses -1,627.6 -1,474.4 -553.8 -487.4
Selling and logistics expenses -1,327.7 -1,219.9 -454.3 -401.2
Administrative expenses -581.1 -524.4 -199.9 -172.3
Other expenses and income -375.5 -128.1 -308.2 -103.4
Income from at-equity accounted investees -89.7 23.8 -72.0 9.0
Other income from investments 0.6 -0.1 0.3 -0.2
Earnings before interest and taxes 2,447.9 2,516.9 637.8 886.3
Interest income1 68.3 58.3 22.0 16.8
Interest expense1,2 -283.9 -688.8 -97.1 -286.9
Net interest expense -215.6 -630.5 -75.1 -270.1
Earnings before taxes 2,232.3 1,886.4 562.7 616.2
Income tax expense -371.3 -237.8 -47.4 -154.0
Net income 1,861.0 1,648.6 515.3 462.2
Non-controlling interests -62.1 -72.6 -20.2 -28.1
Net income attributable to the shareholders of the parent 1,798.9 1,576.0 495.1 434.1
Basic earnings per share in € 8.99 7.88 2.47 2.17
Diluted earnings per share in € 8.99 7.88 2.47 2.17
1 Including interest effects of pension obligations, of other long-term employee benefits, and of pension funds. In the prior year, the resulting income was reported under interest expense; the comparative figures for the prior year have been adjusted accordingly.
2 Including gains and losses from foreign currency translation, from changes in the fair value of derivative instruments as well as from available-for-sale financial assets.
Consolidated Financial Statements as at September 30, 2014
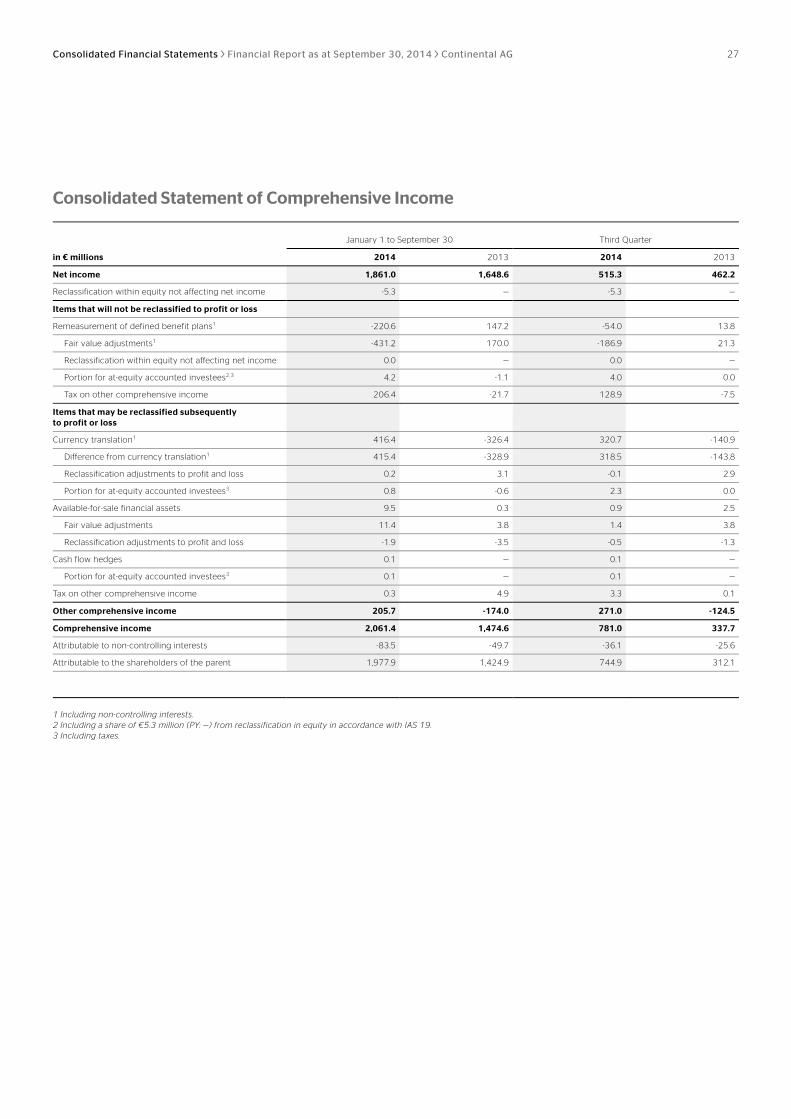
Consolidated Financial Statements Financial Report as at September 30, 2014 Continental AG 27
Consolidated Statement of Comprehensive Income
January 1 to September 30 Third Quarter
in € millions 2014 2013 2014 2013
Net income 1,861.0 1,648.6 515.3 462.2
Reclassification within equity not affecting net income -5.3 — -5.3 —
Items that will not be reclassified to profit or loss
Remeasurement of defined benefit plans1 -220.6 147.2 -54.0 13.8
Fair value adjustments1 -431.2 170.0 -186.9 21.3
Reclassification within equity not affecting net income 0.0 — 0.0 —
Portion for at-equity accounted investees2,3 4.2 -1.1 4.0 0.0
Tax on other comprehensive income 206.4 -21.7 128.9 -7.5
Items that may be reclassified subsequently to profit or loss
Currency translation1 416.4 -326.4 320.7 -140.9
Difference from currency translation1 415.4 -328.9 318.5 -143.8
Reclassification adjustments to profit and loss 0.2 3.1 -0.1 2.9
Portion for at-equity accounted investees3 0.8 -0.6 2.3 0.0
Available-for-sale financial assets 9.5 0.3 0.9 2.5
Fair value adjustments 11.4 3.8 1.4 3.8
Reclassification adjustments to profit and loss -1.9 -3.5 -0.5 -1.3
Cash flow hedges 0.1 — 0.1 —
Portion for at-equity accounted investees3 0.1 — 0.1 —
Tax on other comprehensive income 0.3 4.9 3.3 0.1
Other comprehensive income 205.7 -174.0 271.0 -124.5
Comprehensive income 2,061.4 1,474.6 781.0 337.7
Attributable to non-controlling interests -83.5 -49.7 -36.1 -25.6
Attributable to the shareholders of the parent 1,977.9 1,424.9 744.9 312.1
1 Including non-controlling interests. 2 Including a share of €5.3 million (PY: —) from reclassification in equity in accordance with IAS 19. 3 Including taxes.

Consolidated Financial Statements Financial Report as at September 30, 2014 Continental AG 28
Consolidated Statement of Financial Position
Assets in € millions Sept. 30, 2014 Dec. 31, 2013 Sept. 30, 2013
Goodwill 5,742.2 5,520.9 5,607.0
Other intangible assets 455.2 557.7 634.2
Property, plant and equipment 8,159.8 7,728.0 7,585.1
Investment property 17.9 20.4 19.0
Investments in at-equity accounted investees 302.3 450.0 456.8
Other investments 10.8 7.9 6.9
Deferred tax assets 1,468.7 928.4 951.2
Defined benefit assets 8.6 6.0 2.4
Long-term derivative instruments and interest-bearing investments 269.5 285.1 234.5
Other long-term financial assets 34.2 45.0 20.9
Other long-term assets 21.4 20.1 17.3
Non-current assets 16,490.6 15,569.5 15,535.3
Inventories 3,330.3 2,830.9 3,119.9
Trade accounts receivable 6,569.3 5,315.8 6,115.2
Other short-term financial assets 382.9 336.2 343.3
Other short-term assets 731.6 601.2 667.0
Income tax receivables 92.8 69.3 56.8
Short-term derivative instruments and interest-bearing investments 54.9 18.3 126.1
Cash and cash equivalents 2,013.2 2,044.8 2,207.0
Assets held for sale 2.6 34.8 34.2
Current assets 13,177.6 11,251.3 12,669.5
Total assets 29,668.2 26,820.8 28,204.8
Equity and liabilities in € millions Sept. 30, 2014 Dec. 31, 2013 Sept. 30, 2013
Subscribed capital 512.0 512.0 512.0
Capital reserves 4,155.6 4,155.6 4,155.6
Retained earnings 6,828.9 5,535.3 5,188.2
Other comprehensive income -1,007.9 -1,191.7 -1,100.6
Equity attributable to the shareholders of the parent 10,488.6 9,011.2 8,755.2
Non-controlling interests 364.1 311.0 318.5
Total equity 10,852.7 9,322.2 9,073.7
Provisions for pension liabilities and similar obligations 2,937.3 2,391.1 2,466.3
Deferred tax liabilities 188.9 113.2 144.0
Long-term provisions for other risks and obligations 314.1 266.9 284.5
Long-term portion of indebtedness 5,040.8 5,041.2 4,980.0
Other long-term financial liabilities 51.9 16.2 15.9
Other long-term liabilities 47.5 42.2 54.8
Non-current liabilities 8,580.5 7,870.8 7,945.5
Trade accounts payable 4,882.0 4,596.3 4,341.8
Income tax payables 667.5 588.2 620.4
Short-term provisions for other risks and obligations 687.4 631.1 599.5
Indebtedness 1,223.0 1,596.3 3,177.3
Other short-term financial liabilities 1,627.5 1,448.0 1,468.9
Other short-term liabilities 1,147.5 767.9 977.7
Liabilities held for sale 0.1 — —
Current liabilities 10,235.0 9,627.8 11,185.6
Total equity and liabilities 29,668.2 26,820.8 28,204.8
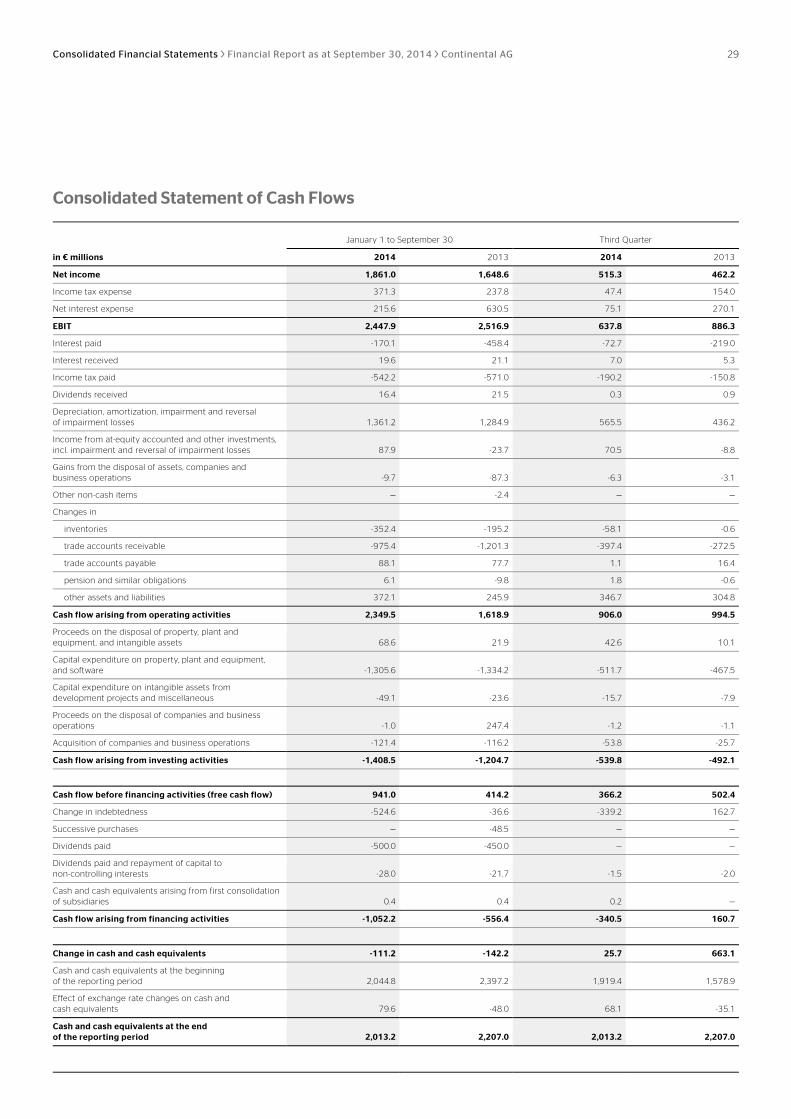
Consolidated Financial Statements Financial Report as at September 30, 2014 Continental AG 29
Consolidated Statement of Cash Flows
January 1 to September 30 Third Quarter
in € millions 2014 2013 2014 2013
Net income 1,861.0 1,648.6 515.3 462.2
Income tax expense 371.3 237.8 47.4 154.0
Net interest expense 215.6 630.5 75.1 270.1
EBIT 2,447.9 2,516.9 637.8 886.3
Interest paid -170.1 -458.4 -72.7 -219.0
Interest received 19.6 21.1 7.0 5.3
Income tax paid -542.2 -571.0 -190.2 -150.8
Dividends received 16.4 21.5 0.3 0.9
Depreciation, amortization, impairment and reversal of impairment losses 1,361.2 1,284.9 565.5 436.2
Income from at-equity accounted and other investments, incl. impairment and reversal of impairment losses 87.9 -23.7 70.5 -8.8
Gains from the disposal of assets, companies and business operations -9.7 -87.3 -6.3 -3.1
Other non-cash items — -2.4 — —
Changes in
inventories -352.4 -195.2 -58.1 -0.6
trade accounts receivable -975.4 -1,201.3 -397.4 -272.5
trade accounts payable 88.1 77.7 1.1 16.4
pension and similar obligations 6.1 -9.8 1.8 -0.6
other assets and liabilities 372.1 245.9 346.7 304.8
Cash flow arising from operating activities 2,349.5 1,618.9 906.0 994.5
Proceeds on the disposal of property, plant and equipment, and intangible assets 68.6 21.9 42.6 10.1
Capital expenditure on property, plant and equipment, and software -1,305.6 -1,334.2 -511.7 -467.5
Capital expenditure on intangible assets from development projects and miscellaneous -49.1 -23.6 -15.7 -7.9
Proceeds on the disposal of companies and business operations -1.0 247.4 -1.2 -1.1
Acquisition of companies and business operations -121.4 -116.2 -53.8 -25.7
Cash flow arising from investing activities -1,408.5 -1,204.7 -539.8 -492.1
Cash flow before financing activities (free cash flow) 941.0 414.2 366.2 502.4
Change in indebtedness -524.6 -36.6 -339.2 162.7
Successive purchases — -48.5 — —
Dividends paid -500.0 -450.0 — —
Dividends paid and repayment of capital to non-controlling interests -28.0 -21.7 -1.5 -2.0
Cash and cash equivalents arising from first consolidation of subsidiaries 0.4 0.4 0.2 —
Cash flow arising from financing activities -1,052.2 -556.4 -340.5 160.7
Change in cash and cash equivalents -111.2 -142.2 25.7 663.1
Cash and cash equivalents at the beginning of the reporting period 2,044.8 2,397.2 1,919.4 1,578.9
Effect of exchange rate changes on cash and cash equivalents 79.6 -48.0 68.1 -35.1
Cash and cash equivalents at the end of the reporting period 2,013.2 2,207.0 2,013.2 2,207.0
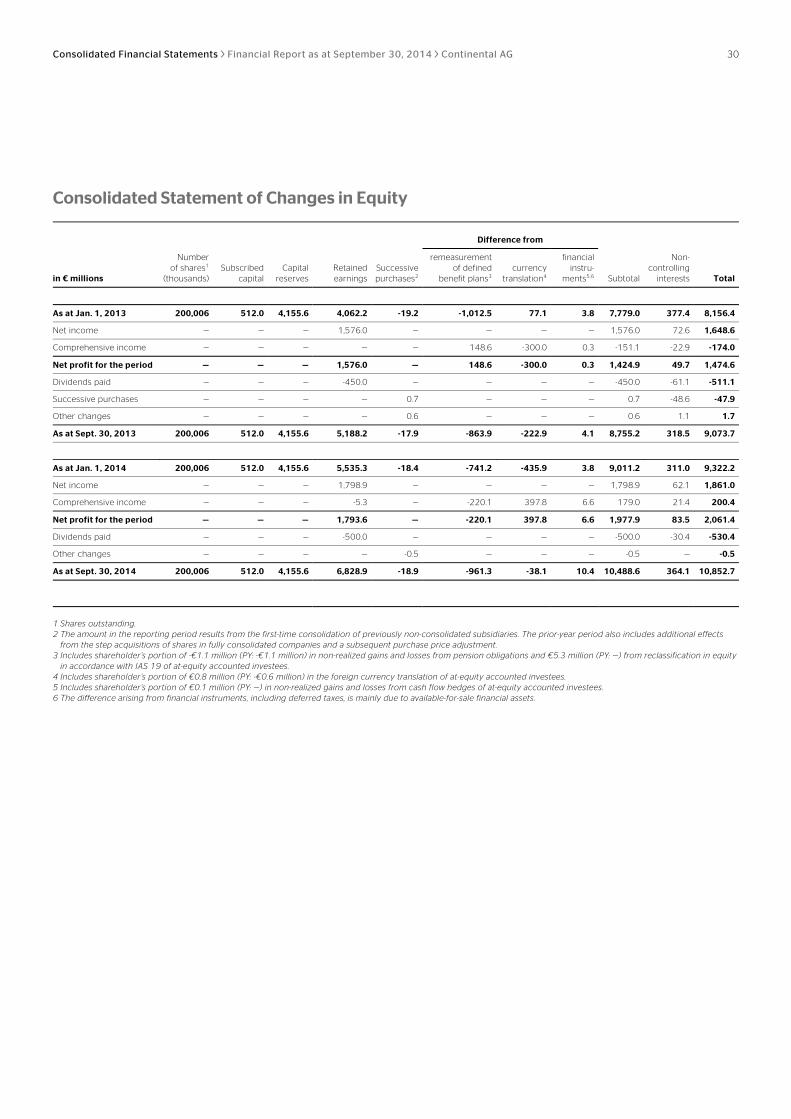
Consolidated Financial Statements Financial Report as at September 30, 2014 Continental AG 30
Consolidated Statement of Changes in Equity
Difference from
in € millions
Number of shares1
(thousands) Subscribed
capital Capital
reserves Retainedearnings
Successive purchases2
remeasurement of defined
benefit plans3
currencytranslation4
financial instru-
ments5,6 Subtotal
Non-controlling
interests Total
As at Jan. 1, 2013 200,006 512.0 4,155.6 4,062.2 -19.2 -1,012.5 77.1 3.8 7,779.0 377.4 8,156.4
Net income — — — 1,576.0 — — — — 1,576.0 72.6 1,648.6
Comprehensive income — — — — — 148.6 -300.0 0.3 -151.1 -22.9 -174.0
Net profit for the period — — — 1,576.0 — 148.6 -300.0 0.3 1,424.9 49.7 1,474.6
Dividends paid — — — -450.0 — — — — -450.0 -61.1 -511.1
Successive purchases — — — — 0.7 — — — 0.7 -48.6 -47.9
Other changes — — — — 0.6 — — — 0.6 1.1 1.7
As at Sept. 30, 2013 200,006 512.0 4,155.6 5,188.2 -17.9 -863.9 -222.9 4.1 8,755.2 318.5 9,073.7
As at Jan. 1, 2014 200,006 512.0 4,155.6 5,535.3 -18.4 -741.2 -435.9 3.8 9,011.2 311.0 9,322.2
Net income — — — 1,798.9 — — — — 1,798.9 62.1 1,861.0
Comprehensive income — — — -5.3 — -220.1 397.8 6.6 179.0 21.4 200.4
Net profit for the period — — — 1,793.6 — -220.1 397.8 6.6 1,977.9 83.5 2,061.4
Dividends paid — — — -500.0 — — — — -500.0 -30.4 -530.4
Other changes — — — — -0.5 — — — -0.5 — -0.5
As at Sept. 30, 2014 200,006 512.0 4,155.6 6,828.9 -18.9 -961.3 -38.1 10.4 10,488.6 364.1 10,852.7
1 Shares outstanding. 2 The amount in the reporting period results from the first-time consolidation of previously non-consolidated subsidiaries. The prior-year period also includes additional effects
from the step acquisitions of shares in fully consolidated companies and a subsequent purchase price adjustment. 3 Includes shareholder’s portion of -€1.1 million (PY: -€1.1 million) in non-realized gains and losses from pension obligations and €5.3 million (PY: —) from reclassification in equity
in accordance with IAS 19 of at-equity accounted investees. 4 Includes shareholder’s portion of €0.8 million (PY: -€0.6 million) in the foreign currency translation of at-equity accounted investees. 5 Includes shareholder’s portion of €0.1 million (PY: —) in non-realized gains and losses from cash flow hedges of at-equity accounted investees. 6 The difference arising from financial instruments, including deferred taxes, is mainly due to available-for-sale financial assets.
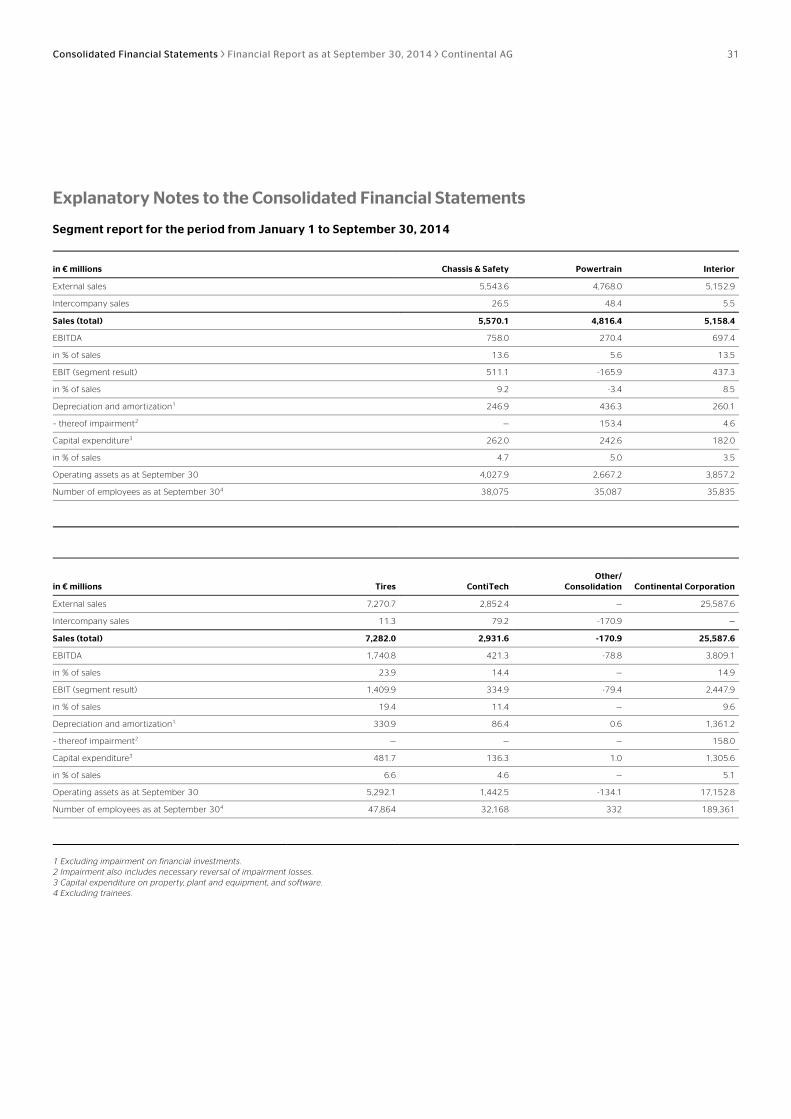
Consolidated Financial Statements Financial Report as at September 30, 2014 Continental AG 31
Explanatory Notes to the Consolidated Financial Statements
Segment report for the period from January 1 to September 30, 2014
in € millions Chassis & Safety Powertrain Interior
External sales 5,543.6 4,768.0 5,152.9
Intercompany sales 26.5 48.4 5.5
Sales (total) 5,570.1 4,816.4 5,158.4
EBITDA 758.0 270.4 697.4
in % of sales 13.6 5.6 13.5
EBIT (segment result) 511.1 -165.9 437.3
in % of sales 9.2 -3.4 8.5
Depreciation and amortization1 246.9 436.3 260.1
– thereof impairment2 — 153.4 4.6
Capital expenditure3 262.0 242.6 182.0
in % of sales 4.7 5.0 3.5
Operating assets as at September 30 4,027.9 2,667.2 3,857.2
Number of employees as at September 304 38,075 35,087 35,835
in € millions Tires ContiTechOther/
Consolidation Continental Corporation
External sales 7,270.7 2,852.4 — 25,587.6
Intercompany sales 11.3 79.2 -170.9 —
Sales (total) 7,282.0 2,931.6 -170.9 25,587.6
EBITDA 1,740.8 421.3 -78.8 3,809.1
in % of sales 23.9 14.4 — 14.9
EBIT (segment result) 1,409.9 334.9 -79.4 2,447.9
in % of sales 19.4 11.4 — 9.6
Depreciation and amortization1 330.9 86.4 0.6 1,361.2
– thereof impairment2 — — — 158.0
Capital expenditure3 481.7 136.3 1.0 1,305.6
in % of sales 6.6 4.6 — 5.1
Operating assets as at September 30 5,292.1 1,442.5 -134.1 17,152.8
Number of employees as at September 304 47,864 32,168 332 189,361
1 Excluding impairment on financial investments. 2 Impairment also includes necessary reversal of impairment losses. 3 Capital expenditure on property, plant and equipment, and software. 4 Excluding trainees.
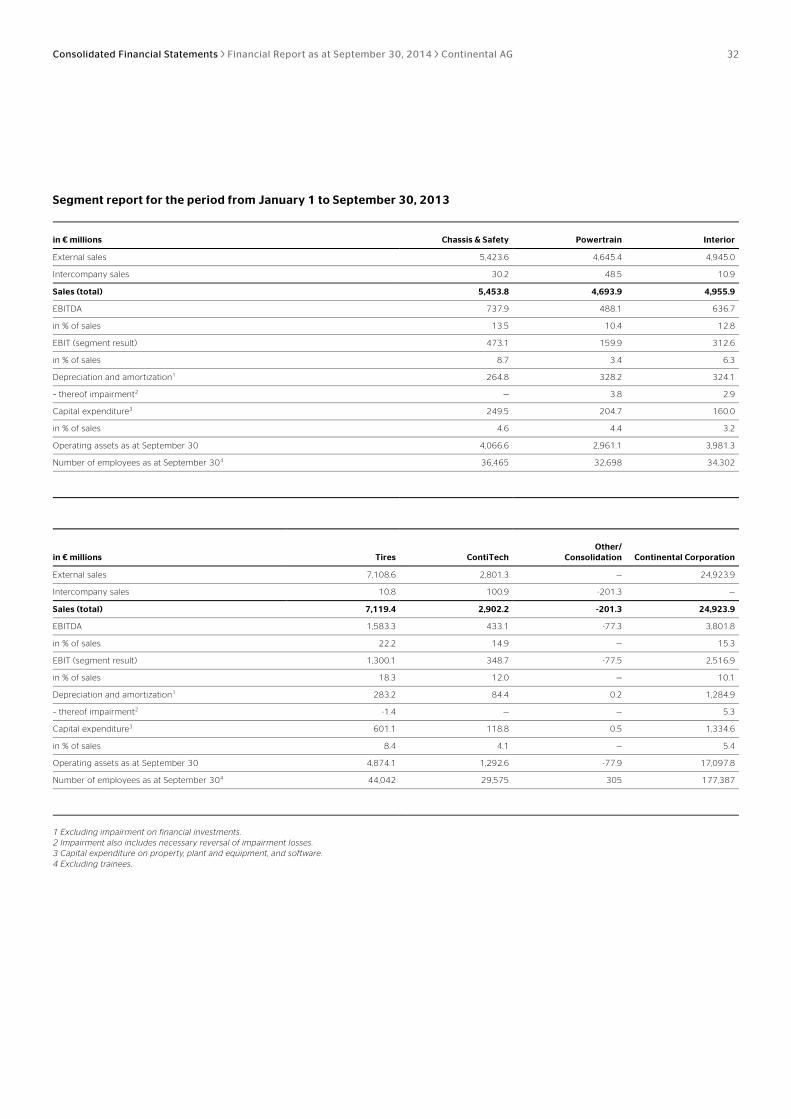
Consolidated Financial Statements Financial Report as at September 30, 2014 Continental AG 32
Segment report for the period from January 1 to September 30, 2013
in € millions Chassis & Safety Powertrain Interior
External sales 5,423.6 4,645.4 4,945.0
Intercompany sales 30.2 48.5 10.9
Sales (total) 5,453.8 4,693.9 4,955.9
EBITDA 737.9 488.1 636.7
in % of sales 13.5 10.4 12.8
EBIT (segment result) 473.1 159.9 312.6
in % of sales 8.7 3.4 6.3
Depreciation and amortization1 264.8 328.2 324.1
– thereof impairment2 — 3.8 2.9
Capital expenditure3 249.5 204.7 160.0
in % of sales 4.6 4.4 3.2
Operating assets as at September 30 4,066.6 2,961.1 3,981.3
Number of employees as at September 304 36,465 32,698 34,302
in € millions Tires ContiTechOther/
Consolidation Continental Corporation
External sales 7,108.6 2,801.3 — 24,923.9
Intercompany sales 10.8 100.9 -201.3 —
Sales (total) 7,119.4 2,902.2 -201.3 24,923.9
EBITDA 1,583.3 433.1 -77.3 3,801.8
in % of sales 22.2 14.9 — 15.3
EBIT (segment result) 1,300.1 348.7 -77.5 2,516.9
in % of sales 18.3 12.0 — 10.1
Depreciation and amortization1 283.2 84.4 0.2 1,284.9
– thereof impairment2 -1.4 — — 5.3
Capital expenditure3 601.1 118.8 0.5 1,334.6
in % of sales 8.4 4.1 — 5.4
Operating assets as at September 30 4,874.1 1,292.6 -77.9 17,097.8
Number of employees as at September 304 44,042 29,575 305 177,387
1 Excluding impairment on financial investments. 2 Impairment also includes necessary reversal of impairment losses. 3 Capital expenditure on property, plant and equipment, and software. 4 Excluding trainees.
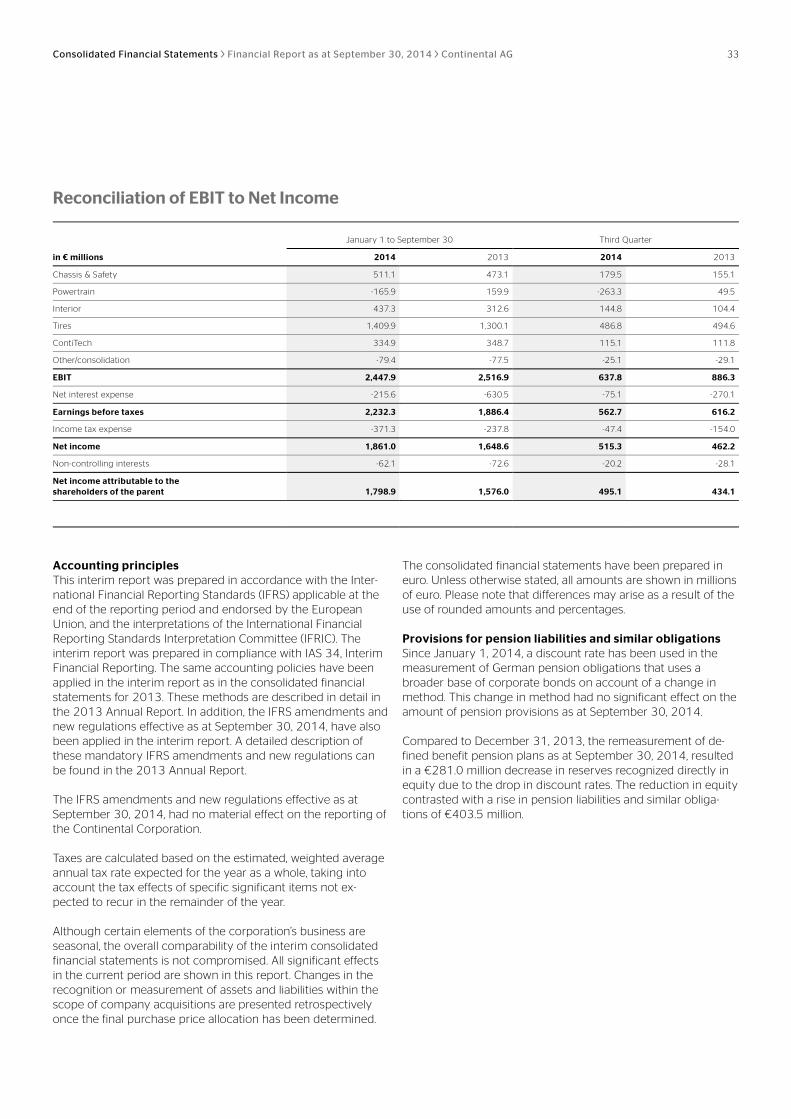
Consolidated Financial Statements Financial Report as at September 30, 2014 Continental AG 33
Reconciliation of EBIT to Net Income
January 1 to September 30 Third Quarter
in € millions 2014 2013 2014 2013
Chassis & Safety 511.1 473.1 179.5 155.1
Powertrain -165.9 159.9 -263.3 49.5
Interior 437.3 312.6 144.8 104.4
Tires 1,409.9 1,300.1 486.8 494.6
ContiTech 334.9 348.7 115.1 111.8
Other/consolidation -79.4 -77.5 -25.1 -29.1
EBIT 2,447.9 2,516.9 637.8 886.3
Net interest expense -215.6 -630.5 -75.1 -270.1
Earnings before taxes 2,232.3 1,886.4 562.7 616.2
Income tax expense -371.3 -237.8 -47.4 -154.0
Net income 1,861.0 1,648.6 515.3 462.2
Non-controlling interests -62.1 -72.6 -20.2 -28.1
Net income attributable to the shareholders of the parent 1,798.9 1,576.0 495.1 434.1
Accounting principles This interim report was prepared in accordance with the Inter-national Financial Reporting Standards (IFRS) applicable at the end of the reporting period and endorsed by the European Union, and the interpretations of the International Financial Reporting Standards Interpretation Committee (IFRIC). The interim report was prepared in compliance with IAS 34, Interim Financial Reporting. The same accounting policies have been applied in the interim report as in the consolidated financial statements for 2013. These methods are described in detail in the 2013 Annual Report. In addition, the IFRS amendments and new regulations effective as at September 30, 2014, have also been applied in the interim report. A detailed description of these mandatory IFRS amendments and new regulations can be found in the 2013 Annual Report.
The IFRS amendments and new regulations effective as at September 30, 2014, had no material effect on the reporting of the Continental Corporation.
Taxes are calculated based on the estimated, weighted average annual tax rate expected for the year as a whole, taking into account the tax effects of specific significant items not ex-pected to recur in the remainder of the year.
Although certain elements of the corporation’s business are seasonal, the overall comparability of the interim consolidated financial statements is not compromised. All significant effects in the current period are shown in this report. Changes in the recognition or measurement of assets and liabilities within the scope of company acquisitions are presented retrospectively once the final purchase price allocation has been determined.
The consolidated financial statements have been prepared in euro. Unless otherwise stated, all amounts are shown in millions of euro. Please note that differences may arise as a result of the use of rounded amounts and percentages.
Provisions for pension liabilities and similar obligations Since January 1, 2014, a discount rate has been used in the measurement of German pension obligations that uses a broader base of corporate bonds on account of a change in method. This change in method had no significant effect on the amount of pension provisions as at September 30, 2014.
Compared to December 31, 2013, the remeasurement of de-fined benefit pension plans as at September 30, 2014, resulted in a €281.0 million decrease in reserves recognized directly in equity due to the drop in discount rates. The reduction in equity contrasted with a rise in pension liabilities and similar obliga-tions of €403.5 million.
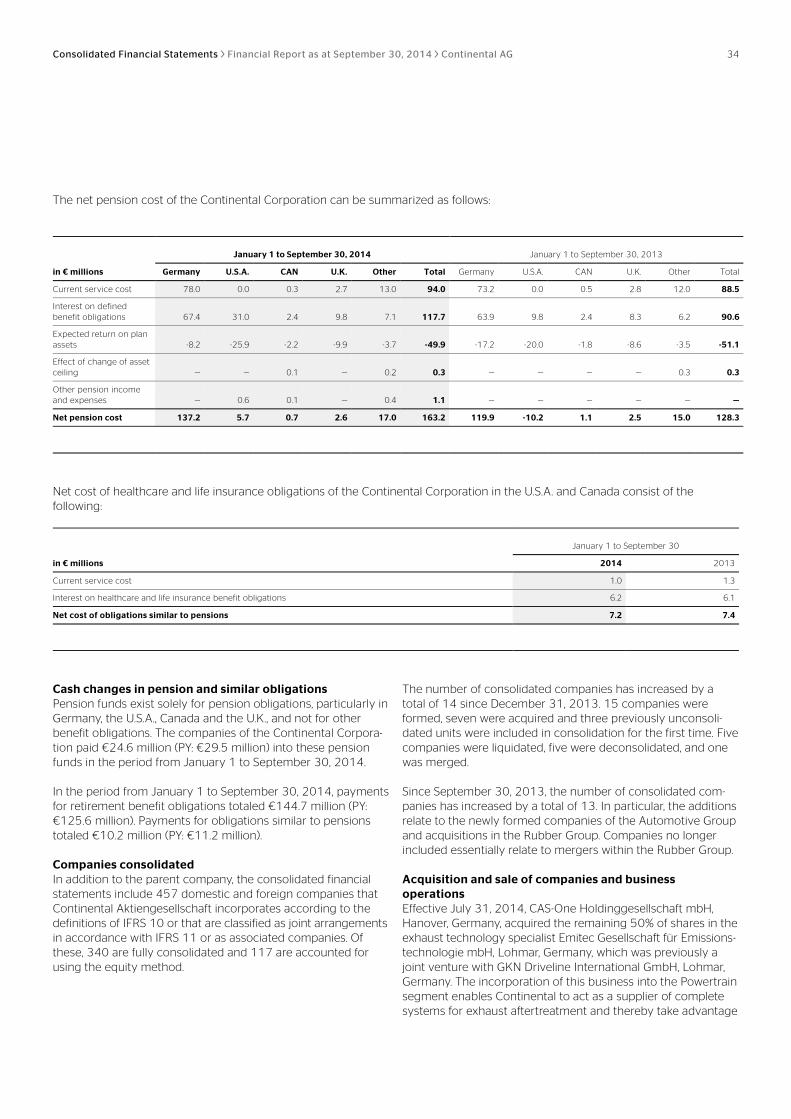
Consolidated Financial Statements Financial Report as at September 30, 2014 Continental AG 34
The net pension cost of the Continental Corporation can be summarized as follows:
January 1 to September 30, 2014 January 1 to September 30, 2013
in € millions Germany U.S.A. CAN U.K. Other Total Germany U.S.A. CAN U.K. Other Total
Current service cost 78.0 0.0 0.3 2.7 13.0 94.0 73.2 0.0 0.5 2.8 12.0 88.5
Interest on defined benefit obligations 67.4 31.0 2.4 9.8 7.1 117.7 63.9 9.8 2.4 8.3 6.2 90.6
Expected return on plan assets -8.2 -25.9 -2.2 -9.9 -3.7 -49.9 -17.2 -20.0 -1.8 -8.6 -3.5 -51.1
Effect of change of asset ceiling — — 0.1 — 0.2 0.3 — — — — 0.3 0.3
Other pension income and expenses — 0.6 0.1 — 0.4 1.1 — — — — — —
Net pension cost 137.2 5.7 0.7 2.6 17.0 163.2 119.9 -10.2 1.1 2.5 15.0 128.3
Net cost of healthcare and life insurance obligations of the Continental Corporation in the U.S.A. and Canada consist of the following:
January 1 to September 30
in € millions 2014 2013
Current service cost 1.0 1.3
Interest on healthcare and life insurance benefit obligations 6.2 6.1
Net cost of obligations similar to pensions 7.2 7.4
Cash changes in pension and similar obligations Pension funds exist solely for pension obligations, particularly in Germany, the U.S.A., Canada and the U.K., and not for other benefit obligations. The companies of the Continental Corpora-tion paid €24.6 million (PY: €29.5 million) into these pension funds in the period from January 1 to September 30, 2014.
In the period from January 1 to September 30, 2014, payments for retirement benefit obligations totaled €144.7 million (PY: €125.6 million). Payments for obligations similar to pensions totaled €10.2 million (PY: €11.2 million).
Companies consolidated In addition to the parent company, the consolidated financial statements include 457 domestic and foreign companies that Continental Aktiengesellschaft incorporates according to the definitions of IFRS 10 or that are classified as joint arrangements in accordance with IFRS 11 or as associated companies. Of these, 340 are fully consolidated and 117 are accounted for using the equity method.
The number of consolidated companies has increased by a total of 14 since December 31, 2013. 15 companies were formed, seven were acquired and three previously unconsoli-dated units were included in consolidation for the first time. Five companies were liquidated, five were deconsolidated, and one was merged.
Since September 30, 2013, the number of consolidated com-panies has increased by a total of 13. In particular, the additions relate to the newly formed companies of the Automotive Group and acquisitions in the Rubber Group. Companies no longer included essentially relate to mergers within the Rubber Group.
Acquisition and sale of companies and business operations Effective July 31, 2014, CAS-One Holdinggesellschaft mbH, Hanover, Germany, acquired the remaining 50% of shares in the exhaust technology specialist Emitec Gesellschaft für Emissions-technologie mbH, Lohmar, Germany, which was previously a joint venture with GKN Driveline International GmbH, Lohmar, Germany. The incorporation of this business into the Powertrain segment enables Continental to act as a supplier of complete systems for exhaust aftertreatment and thereby take advantage
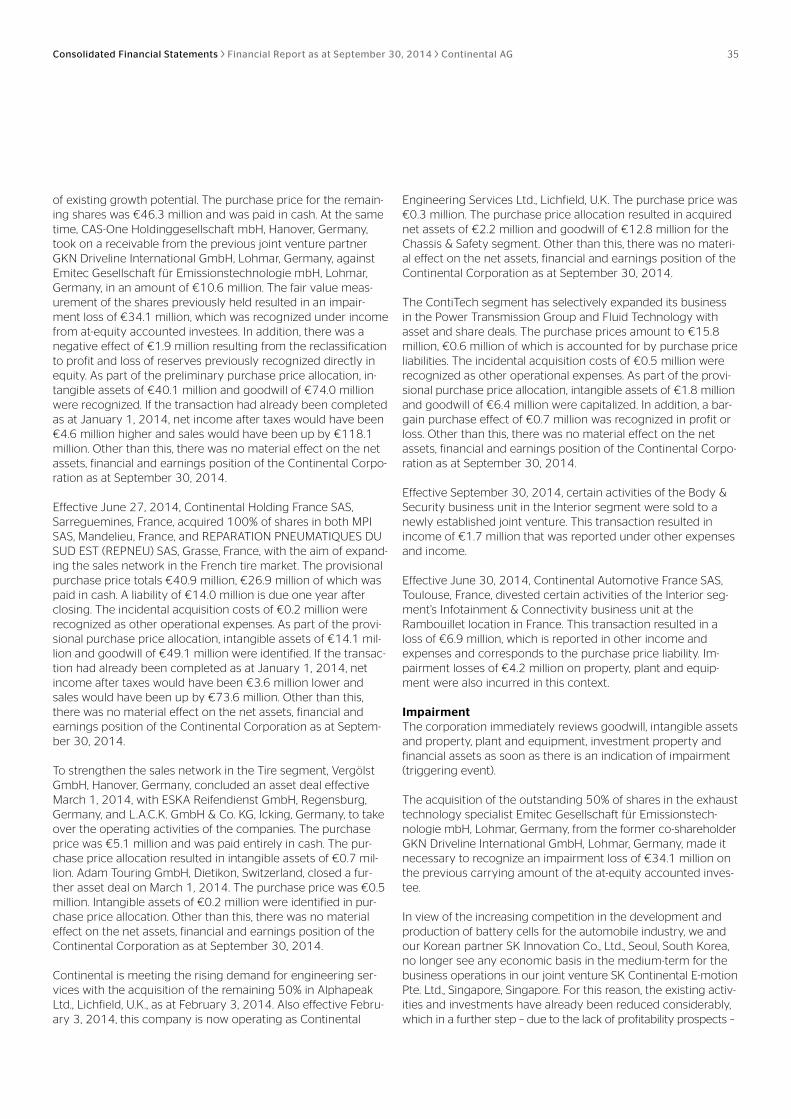
Consolidated Financial Statements Financial Report as at September 30, 2014 Continental AG 35
of existing growth potential. The purchase price for the remain-ing shares was €46.3 million and was paid in cash. At the same time, CAS-One Holdinggesellschaft mbH, Hanover, Germany, took on a receivable from the previous joint venture partner GKN Driveline International GmbH, Lohmar, Germany, against Emitec Gesellschaft für Emissionstechnologie mbH, Lohmar, Germany, in an amount of €10.6 million. The fair value meas-urement of the shares previously held resulted in an impair-ment loss of €34.1 million, which was recognized under income from at-equity accounted investees. In addition, there was a negative effect of €1.9 million resulting from the reclassification to profit and loss of reserves previously recognized directly in equity. As part of the preliminary purchase price allocation, in-tangible assets of €40.1 million and goodwill of €74.0 million were recognized. If the transaction had already been completed as at January 1, 2014, net income after taxes would have been €4.6 million higher and sales would have been up by €118.1 million. Other than this, there was no material effect on the net assets, financial and earnings position of the Continental Corpo-ration as at September 30, 2014.
Effective June 27, 2014, Continental Holding France SAS, Sarreguemines, France, acquired 100% of shares in both MPI SAS, Mandelieu, France, and REPARATION PNEUMATIQUES DU SUD EST (REPNEU) SAS, Grasse, France, with the aim of expand-ing the sales network in the French tire market. The provisional purchase price totals €40.9 million, €26.9 million of which was paid in cash. A liability of €14.0 million is due one year after closing. The incidental acquisition costs of €0.2 million were recognized as other operational expenses. As part of the provi-sional purchase price allocation, intangible assets of €14.1 mil-lion and goodwill of €49.1 million were identified. If the transac-tion had already been completed as at January 1, 2014, net income after taxes would have been €3.6 million lower and sales would have been up by €73.6 million. Other than this, there was no material effect on the net assets, financial and earnings position of the Continental Corporation as at Septem-ber 30, 2014.
To strengthen the sales network in the Tire segment, Vergölst GmbH, Hanover, Germany, concluded an asset deal effective March 1, 2014, with ESKA Reifendienst GmbH, Regensburg, Germany, and L.A.C.K. GmbH & Co. KG, Icking, Germany, to take over the operating activities of the companies. The purchase price was €5.1 million and was paid entirely in cash. The pur-chase price allocation resulted in intangible assets of €0.7 mil-lion. Adam Touring GmbH, Dietikon, Switzerland, closed a fur-ther asset deal on March 1, 2014. The purchase price was €0.5 million. Intangible assets of €0.2 million were identified in pur-chase price allocation. Other than this, there was no material effect on the net assets, financial and earnings position of the Continental Corporation as at September 30, 2014.
Continental is meeting the rising demand for engineering ser-vices with the acquisition of the remaining 50% in Alphapeak Ltd., Lichfield, U.K., as at February 3, 2014. Also effective Febru-ary 3, 2014, this company is now operating as Continental
Engineering Services Ltd., Lichfield, U.K. The purchase price was €0.3 million. The purchase price allocation resulted in acquired net assets of €2.2 million and goodwill of €12.8 million for the Chassis & Safety segment. Other than this, there was no materi-al effect on the net assets, financial and earnings position of the Continental Corporation as at September 30, 2014.
The ContiTech segment has selectively expanded its business in the Power Transmission Group and Fluid Technology with asset and share deals. The purchase prices amount to €15.8 million, €0.6 million of which is accounted for by purchase price liabilities. The incidental acquisition costs of €0.5 million were recognized as other operational expenses. As part of the provi-sional purchase price allocation, intangible assets of €1.8 million and goodwill of €6.4 million were capitalized. In addition, a bar-gain purchase effect of €0.7 million was recognized in profit or loss. Other than this, there was no material effect on the net assets, financial and earnings position of the Continental Corpo-ration as at September 30, 2014.
Effective September 30, 2014, certain activities of the Body & Security business unit in the Interior segment were sold to a newly established joint venture. This transaction resulted in income of €1.7 million that was reported under other expenses and income.
Effective June 30, 2014, Continental Automotive France SAS, Toulouse, France, divested certain activities of the Interior seg-ment’s Infotainment & Connectivity business unit at the Rambouillet location in France. This transaction resulted in a loss of €6.9 million, which is reported in other income and expenses and corresponds to the purchase price liability. Im-pairment losses of €4.2 million on property, plant and equip-ment were also incurred in this context.
Impairment The corporation immediately reviews goodwill, intangible assets and property, plant and equipment, investment property and financial assets as soon as there is an indication of impairment (triggering event).
The acquisition of the outstanding 50% of shares in the exhaust technology specialist Emitec Gesellschaft für Emissionstech-nologie mbH, Lohmar, Germany, from the former co-shareholder GKN Driveline International GmbH, Lohmar, Germany, made it necessary to recognize an impairment loss of €34.1 million on the previous carrying amount of the at-equity accounted inves-tee.
In view of the increasing competition in the development and production of battery cells for the automobile industry, we and our Korean partner SK Innovation Co., Ltd., Seoul, South Korea, no longer see any economic basis in the medium-term for the business operations in our joint venture SK Continental E-motion Pte. Ltd., Singapore, Singapore. For this reason, the existing activ-ities and investments have already been reduced considerably, which in a further step – due to the lack of profitability prospects –
Consolidated Financial Statements Financial Report as at September 30, 2014 Continental AG 36
led to an impairment on the at-equity accounted investee in the amount of €77.9 million within the Powertrain segment.
In the Powertrain segment, impairment losses on property, plant and equipment and intangible assets totaling €153.4 million were recognized due to capacity utilization levels in the Hybrid Electric Vehicle (HEV) and Engine Systems business units as well as valuation at the lower of cost or market value in the Engine Systems business unit.
Appropriation of net income As at December 31, 2013, Continental AG reported net re-tained earnings of €913.4 million (PY: €866.5 million). On April 25, 2014, the Annual Shareholders’ Meeting resolved to distribute a dividend of €2.50 per share to the shareholders of Continental AG for the past fiscal year. With 200,005,983 shares entitled to dividends, the total distribution therefore amounted to €500,014,957.50. The remaining amount was carried forward to new account.
In 2013, a dividend of €2.25 per share was distributed by Con-tinental AG to its shareholders for 2012. With 200,005,983 shares entitled to dividends, the total distribution therefore amounted to €450,013,461.75. The remaining amount was carried forward to new account.
Earnings per share Basic earnings per share increased to €8.99 (PY: €7.88) in the first nine months of 2014 and to €2.47 (PY: €2.17) in the peri-od from July 1 to September 30, 2014. These figures were the same for the diluted earnings per share.
Contingent liabilities and other financial obligations As at September 30, 2014, there were no material changes in the contingent liabilities and other financial obligations as de-scribed in the 2013 Annual Report.
Transactions with related parties In the period under review there were no material changes in transactions with related parties compared to December 31, 2013. For further information, please refer to the comments in the 2013 Annual Report.
German Corporate Governance Code The annual declaration in accordance with Section 161 of the German Stock Corporation Act (Aktiengesetz – AktG) on the German Corporate Governance Code by the Executive Board and Supervisory Board of Continental AG is made permanently available to shareholders on Continental’s website. Earlier decla-rations in accordance with Section 161 AktG can also be found there.
Segment reporting Given the affinity of certain products, these have been com-bined as segments. This can mainly be seen in product re-quirements, market trends, customer groups and distribution channels.
Information on the development of Continental Corporation’s five divisions can be found in the Corporate Management Re-port as at September 30, 2014.
Indebtedness and net income from financial activities To reflect Continental’s improved operating performance and its improved rating in the financing conditions, the existing syndi-cated loan was replaced by a new syndicated loan at the end of April 2014. The committed volume of the new syndicated loan is still €4.5 billion and consists of a term loan of €1.5 billion and a revolving credit line of €3.0 billion. The term loan has a term of two years, while the revolving credit line has a term of five years. In addition to further simplification of the documentation required, the interest margin, which is now geared towards Continental’s rating again, was also reduced significantly.
For more information on indebtedness and net income from financial activities, please refer to the Corporate Management Report as at September 30, 2014.
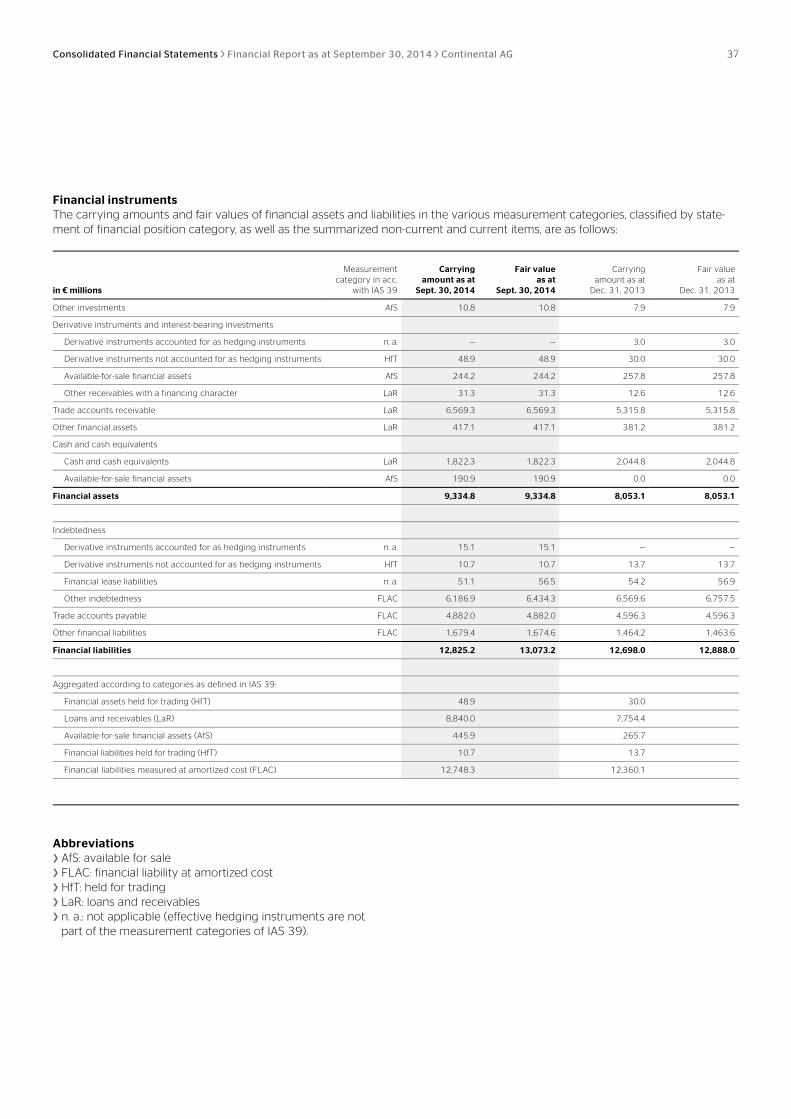
Consolidated Financial Statements Financial Report as at September 30, 2014 Continental AG 37
Financial instruments The carrying amounts and fair values of financial assets and liabilities in the various measurement categories, classified by state-ment of financial position category, as well as the summarized non-current and current items, are as follows:
in € millions
Measurementcategory in acc.
with IAS 39
Carryingamount as at
Sept. 30, 2014
Fair valueas at
Sept. 30, 2014
Carrying amount as at
Dec. 31, 2013
Fair valueas at
Dec. 31, 2013
Other investments AfS 10.8 10.8 7.9 7.9
Derivative instruments and interest-bearing investments
Derivative instruments accounted for as hedging instruments n. a. — — 3.0 3.0
Derivative instruments not accounted for as hedging instruments HfT 48.9 48.9 30.0 30.0
Available-for-sale financial assets AfS 244.2 244.2 257.8 257.8
Other receivables with a financing character LaR 31.3 31.3 12.6 12.6
Trade accounts receivable LaR 6,569.3 6,569.3 5,315.8 5,315.8
Other financial assets LaR 417.1 417.1 381.2 381.2
Cash and cash equivalents
Cash and cash equivalents LaR 1,822.3 1,822.3 2,044.8 2,044.8
Available-for-sale financial assets AfS 190.9 190.9 0.0 0.0
Financial assets 9,334.8 9,334.8 8,053.1 8,053.1
Indebtedness
Derivative instruments accounted for as hedging instruments n. a. 15.1 15.1 — —
Derivative instruments not accounted for as hedging instruments HfT 10.7 10.7 13.7 13.7
Financial lease liabilities n. a. 51.1 56.5 54.2 56.9
Other indebtedness FLAC 6,186.9 6,434.3 6,569.6 6,757.5
Trade accounts payable FLAC 4,882.0 4,882.0 4,596.3 4,596.3
Other financial liabilities FLAC 1,679.4 1,674.6 1,464.2 1,463.6
Financial liabilities 12,825.2 13,073.2 12,698.0 12,888.0
Aggregated according to categories as defined in IAS 39:
Financial assets held for trading (HfT) 48.9 30.0
Loans and receivables (LaR) 8,840.0 7,754.4
Available-for-sale financial assets (AfS) 445.9 265.7
Financial liabilities held for trading (HfT) 10.7 13.7
Financial liabilities measured at amortized cost (FLAC) 12,748.3 12,360.1
Abbreviations › AfS: available for sale › FLAC: financial liability at amortized cost › HfT: held for trading › LaR: loans and receivables › n. a.: not applicable (effective hedging instruments are not
part of the measurement categories of IAS 39).
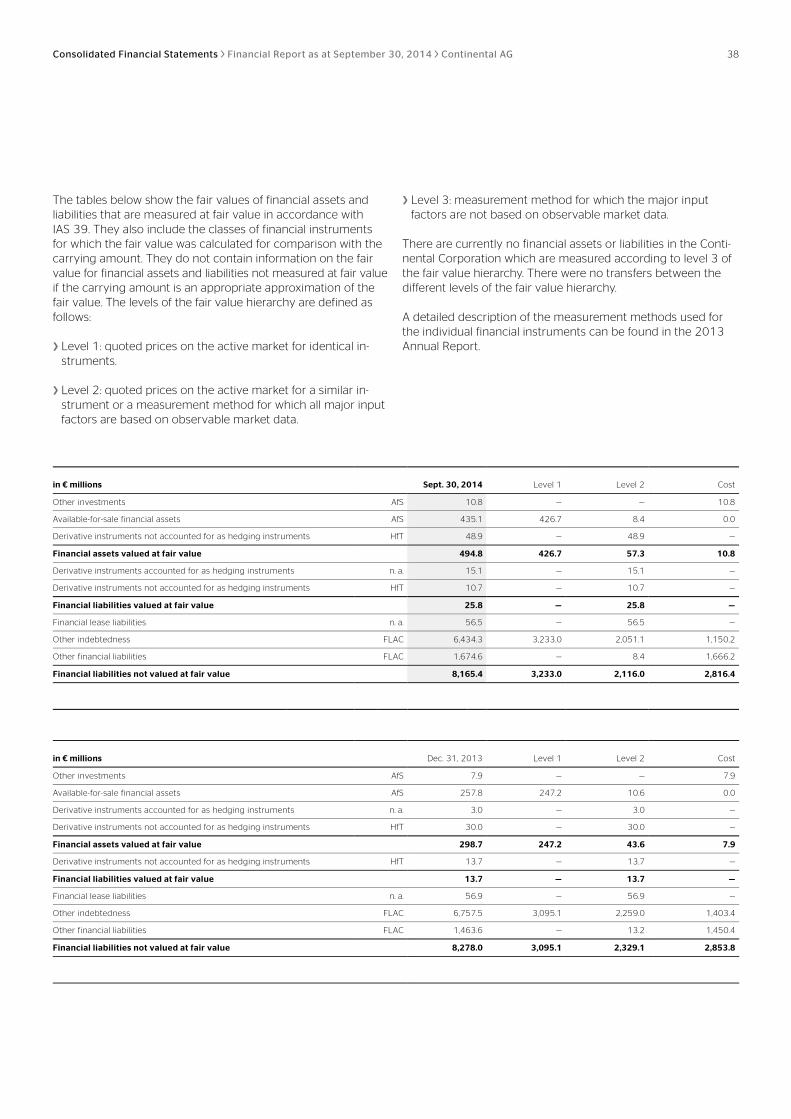
Consolidated Financial Statements Financial Report as at September 30, 2014 Continental AG 38
The tables below show the fair values of financial assets and liabilities that are measured at fair value in accordance with IAS 39. They also include the classes of financial instruments for which the fair value was calculated for comparison with the carrying amount. They do not contain information on the fair value for financial assets and liabilities not measured at fair value if the carrying amount is an appropriate approximation of the fair value. The levels of the fair value hierarchy are defined as follows:
› Level 1: quoted prices on the active market for identical in-struments.
› Level 2: quoted prices on the active market for a similar in-strument or a measurement method for which all major input factors are based on observable market data.
› Level 3: measurement method for which the major input factors are not based on observable market data.
There are currently no financial assets or liabilities in the Conti-nental Corporation which are measured according to level 3 of the fair value hierarchy. There were no transfers between the different levels of the fair value hierarchy.
A detailed description of the measurement methods used for the individual financial instruments can be found in the 2013 Annual Report.
in € millions Sept. 30, 2014 Level 1 Level 2 Cost
Other investments AfS 10.8 — — 10.8
Available-for-sale financial assets AfS 435.1 426.7 8.4 0.0
Derivative instruments not accounted for as hedging instruments HfT 48.9 — 48.9 —
Financial assets valued at fair value 494.8 426.7 57.3 10.8
Derivative instruments accounted for as hedging instruments n. a. 15.1 — 15.1 —
Derivative instruments not accounted for as hedging instruments HfT 10.7 — 10.7 —
Financial liabilities valued at fair value 25.8 — 25.8 —
Financial lease liabilities n. a. 56.5 — 56.5 —
Other indebtedness FLAC 6,434.3 3,233.0 2,051.1 1,150.2
Other financial liabilities FLAC 1,674.6 — 8.4 1,666.2
Financial liabilities not valued at fair value 8,165.4 3,233.0 2,116.0 2,816.4
in € millions Dec. 31, 2013 Level 1 Level 2 Cost
Other investments AfS 7.9 — — 7.9
Available-for-sale financial assets AfS 257.8 247.2 10.6 0.0
Derivative instruments accounted for as hedging instruments n. a. 3.0 — 3.0 —
Derivative instruments not accounted for as hedging instruments HfT 30.0 — 30.0 —
Financial assets valued at fair value 298.7 247.2 43.6 7.9
Derivative instruments not accounted for as hedging instruments HfT 13.7 — 13.7 —
Financial liabilities valued at fair value 13.7 — 13.7 —
Financial lease liabilities n. a. 56.9 — 56.9 —
Other indebtedness FLAC 6,757.5 3,095.1 2,259.0 1,403.4
Other financial liabilities FLAC 1,463.6 — 13.2 1,450.4
Financial liabilities not valued at fair value 8,278.0 3,095.1 2,329.1 2,853.8
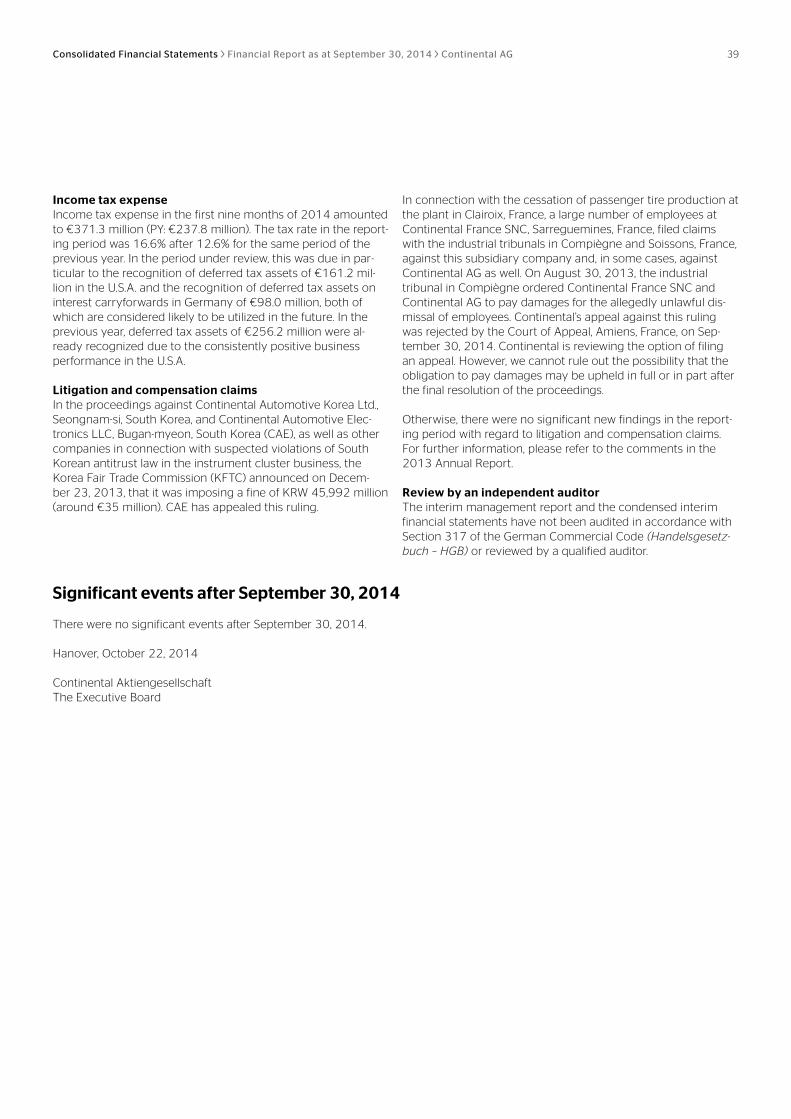
Consolidated Financial Statements Financial Report as at September 30, 2014 Continental AG 39
Income tax expense Income tax expense in the first nine months of 2014 amounted to €371.3 million (PY: €237.8 million). The tax rate in the report-ing period was 16.6% after 12.6% for the same period of the previous year. In the period under review, this was due in par-ticular to the recognition of deferred tax assets of €161.2 mil-lion in the U.S.A. and the recognition of deferred tax assets on interest carryforwards in Germany of €98.0 million, both of which are considered likely to be utilized in the future. In the previous year, deferred tax assets of €256.2 million were al-ready recognized due to the consistently positive business performance in the U.S.A.
Litigation and compensation claims In the proceedings against Continental Automotive Korea Ltd., Seongnam-si, South Korea, and Continental Automotive Elec-tronics LLC, Bugan-myeon, South Korea (CAE), as well as other companies in connection with suspected violations of South Korean antitrust law in the instrument cluster business, the Korea Fair Trade Commission (KFTC) announced on Decem-ber 23, 2013, that it was imposing a fine of KRW 45,992 million (around €35 million). CAE has appealed this ruling.
In connection with the cessation of passenger tire production at the plant in Clairoix, France, a large number of employees at Continental France SNC, Sarreguemines, France, filed claims with the industrial tribunals in Compiègne and Soissons, France, against this subsidiary company and, in some cases, against Continental AG as well. On August 30, 2013, the industrial tribunal in Compiègne ordered Continental France SNC and Continental AG to pay damages for the allegedly unlawful dis-missal of employees. Continental’s appeal against this ruling was rejected by the Court of Appeal, Amiens, France, on Sep-tember 30, 2014. Continental is reviewing the option of filing an appeal. However, we cannot rule out the possibility that the obligation to pay damages may be upheld in full or in part after the final resolution of the proceedings.
Otherwise, there were no significant new findings in the report-ing period with regard to litigation and compensation claims. For further information, please refer to the comments in the 2013 Annual Report.
Review by an independent auditor The interim management report and the condensed interim financial statements have not been audited in accordance with Section 317 of the German Commercial Code (Handelsgesetz-buch – HGB) or reviewed by a qualified auditor.
Significant events after September 30, 2014
There were no significant events after September 30, 2014.
Hanover, October 22, 2014
Continental Aktiengesellschaft The Executive Board
2014
Annual Financial Press Conference March 6
Analyst and Investor Conference Call March 6
Annual Shareholders’ Meeting April 25
Financial Report as at March 31, 2014 May 6
Half-Year Financial Report as at June 30, 2014 July 31
Financial Report as at September 30, 2014 November 4
2015
Annual Financial Press Conference March 5
Analyst and Investor Conference Call March 5
Annual Shareholders’ Meeting April 30
Financial Report as at March 31, 2015 May 7
Half-Year Financial Report as at June 30, 2015 August 4
Financial Report as at September 30, 2015 November 9
Contact Details This Financial Report has also been published in German. The 2013 Annual Report is available in English and German.
If you wish to receive copies of any of these reports, please contact: Continental AG, Corporate Communications P.O. Box 169, 30001 Hanover, Germany Phone: +49 511 938-1146 Fax: +49 511 938-1055 E-mail: [email protected]
The Annual Report and the interim reports are available on the Internet at:
www.continental-corporation.com
Publication Details Published by: Continental Aktiengesellschaft, Hanover, Germany
Financial Calendar
Continental Aktiengesellschaft
P.O. Box 1 69, 30001 Hanover, Germany
Vahrenwalder Strasse 9, 30165 Hanover, Germany
Phone: +49 511 938 - 01, Fax: +49 511 938 - 81770
www.continental-corporation.com