Embed Size (px)
Citation preview

The Lancaster County NebraskaEmployees Retirement Plan
Your Retirement Workbook
Prudential Retirement200 Wood Avenue South
Iselin, NJ 08830
Prudential Retirement, Prudential Financial, PRU, Prudential and the Rock logo are registered service marks of The Prudential Insurance Company of America, Newark, NJ and its affili-ates. Prudential Retirement is a Prudential Financial business.
006371-000001
0179155-00001-00
371001011201
* These projections assume a retirement age of 62, that you will spend 23 years in retirement, and your current paywill grow by 2.5% annually until retirement.
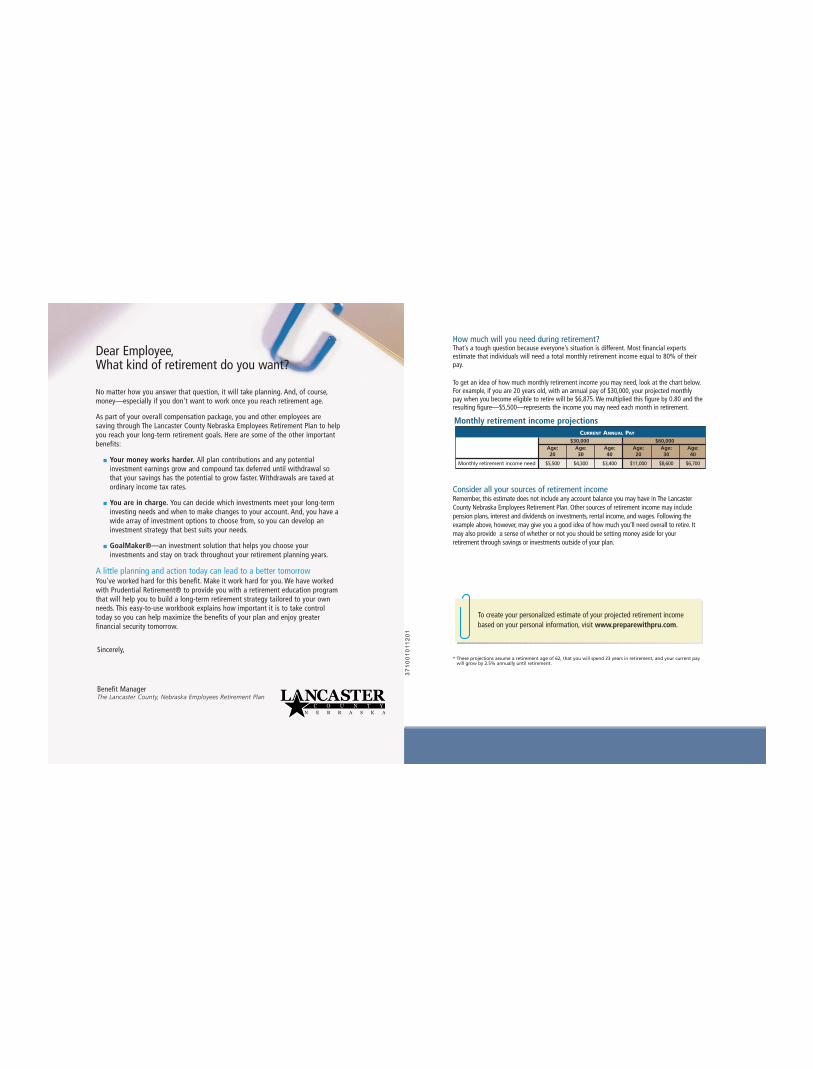
How much will you need during retirement?That’s a tough question because everyone’s situation is different. Most financial expertsestimate that individuals will need a total monthly retirement income equal to 80% of theirpay.
To get an idea of how much monthly retirement income you may need, look at the chart below.For example, if you are 20 years old, with an annual pay of $30,000, your projected monthlypay when you become eligible to retire will be $6,875. We multiplied this figure by 0.80 and theresulting figure—$5,500—represents the income you may need each month in retirement.
Consider all your sources of retirement incomeRemember, this estimate does not include any account balance you may have in The LancasterCounty Nebraska Employees Retirement Plan. Other sources of retirement income may includepension plans, interest and dividends on investments, rental income, and wages. Following theexample above, however, may give you a good idea of how much you’ll need overall to retire. Itmay also provide a sense of whether or not you should be setting money aside for yourretirement through savings or investments outside of your plan.
Dear Employee,What kind of retirement do you want?
No matter how you answer that question, it will take planning. And, of course,money—especially if you don't want to work once you reach retirement age.
As part of your overall compensation package, you and other employees aresaving through The Lancaster County Nebraska Employees Retirement Plan to helpyou reach your long-term retirement goals. Here are some of the other importantbenefits:
n Your money works harder. All plan contributions and any potentialinvestment earnings grow and compound tax deferred until withdrawal sothat your savings has the potential to grow faster. Withdrawals are taxed atordinary income tax rates.
n You are in charge. You can decide which investments meet your long-terminvesting needs and when to make changes to your account. And, you have awide array of investment options to choose from, so you can develop aninvestment strategy that best suits your needs.
n GoalMaker®—an investment solution that helps you choose yourinvestments and stay on track throughout your retirement planning years.
A little planning and action today can lead to a better tomorrow You've worked hard for this benefit. Make it work hard for you. We have workedwith Prudential Retirement® to provide you with a retirement education programthat will help you to build a long-term retirement strategy tailored to your ownneeds. This easy-to-use workbook explains how important it is to take controltoday so you can help maximize the benefits of your plan and enjoy greaterfinancial security tomorrow.
To create your personalized estimate of your projected retirement incomebased on your personal information, visit www.preparewithpru.com.
Sincerely,
Benefit Manager The Lancaster County, Nebraska Employees Retirement Plan
CURRENT ANNUAL PAY
$30,000 $60,000Age: Age: Age: Age: Age: Age:20 30 40 20 30 40
Monthly retirement income need $5,500 $4,300 $3,400 $11,000 $8,600 $6,700
Monthly retirement income projections
371001011201

This workbook is as unique asyou are.
n It demonstrates the value your plan provides. It alsoshows you how you can better manage your accountbased on your individual financial situation andretirement goals.
n It answers common retirement planning questions.You’ll learn why choosing where to invest yourmoney is critical to reaching your retirement goalsand where you can go for more information andassistance.
n It’s easy to use. When you’re ready to make changesto your account, the instructions in Section 3 willshow you how.
1.Why build aninvestmentstrategy?
3.How do youtake action?
2.How do youchoose yourinvestments?
For more information about your plan, call 1-877-778-2100 or visitwww.prudential.com/online/retirement.
1
Important. Be sure to review the ImportantInformation section; it details your plan’sprovisions and investment performance.
37
10
01
011
20
1
You’re working hard today so you’ll have money saved for retirement. That’s a good thing. But it’sjust as important to make sure that your investment decisions match up with your long-termretirement goals. Otherwise, you may end up with a shortfall or you may need to work longer thanyou had intended. By taking control of your investments today, you can help ensure that you areon the right track to a better financial future. This workbook will help you along the way.
Understanding risk versus rewardBefore you build your own investment strategy, it's important to know the different kinds of riskand their relation to an investment's potential “reward.” Most people worry about market riskwhich is the possibility that an investment will lose money due to a market decline or othernegative circumstances. As a result, they tend to invest their money in conservative investmentoptions. However, using just a single investment that is highly conservative can be even more risky.
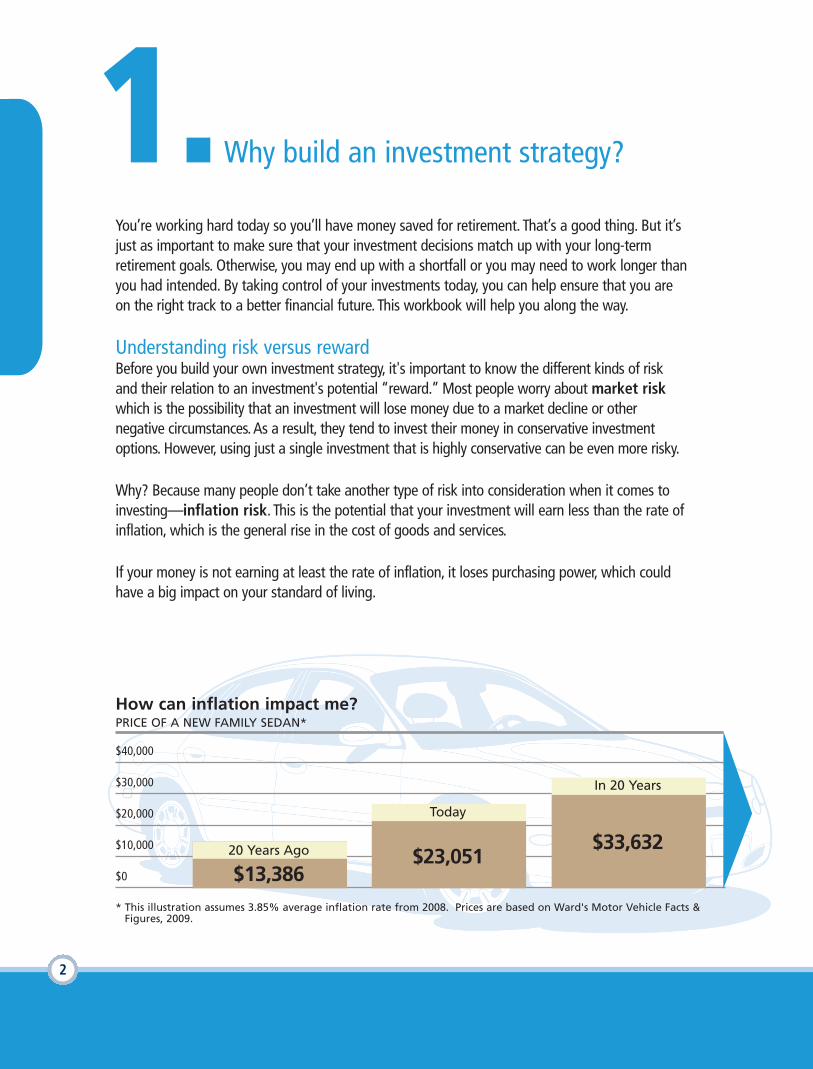
Why? Because many people don’t take another type of risk into consideration when it comes toinvesting—inflation risk. This is the potential that your investment will earn less than the rate ofinflation, which is the general rise in the cost of goods and services.
If your money is not earning at least the rate of inflation, it loses purchasing power, which couldhave a big impact on your standard of living.
2
1.Why build an investment strategy?
$40,000
$30,000
$20,000
$10,000
$0
* This illustration assumes 3.85% average inflation rate from 2008. Prices are based on Ward's Motor Vehicle Facts &Figures, 2009.
How can inflation impact me? PRICE OF A NEW FAMILY SEDAN*
Today
$23,051
In 20 Years
$33,63220 Years Ago
$13,386
When it comes to managing both market risk and inflation risk, the best tool you have may be asset allocation. Assetallocation is the process of investing your money across different kinds of asset classes—and it can help you minimizeyour reliance on any one investment’s performance so your account can better weather rough spots in the market.
What do we mean by assets and asset classes?Asset: Any item of financial value owned by an individual or business. Examples include cash, stocks, investments, ahouse or a car.
Asset Class: All retirement plan investments fall into one type of asset class or category. The types of asset classesdiscussed in this workbook include stable-value, fixed-income, balanced, and stock/equities*. For more details on eachcategory, refer to the Important Information section.*Not all retirement plans offer investments in every category.
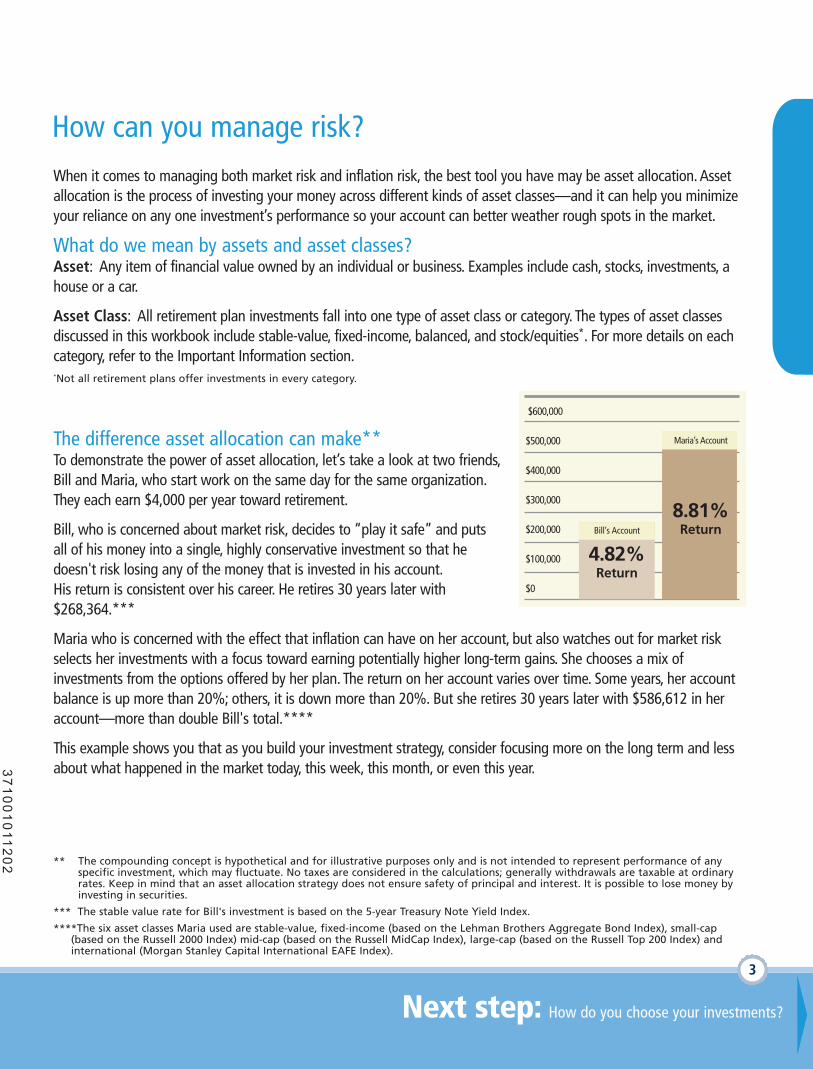
The difference asset allocation can make**To demonstrate the power of asset allocation, let’s take a look at two friends,Bill and Maria, who start work on the same day for the same organization.They each earn $4,000 per year toward retirement.
Bill, who is concerned about market risk, decides to “play it safe” and puts all of his money into a single, highly conservative investment so that he doesn't risk losing any of the money that is invested in his account.His return is consistent over his career. He retires 30 years later with$268,364.***
Maria who is concerned with the effect that inflation can have on her account, but also watches out for market riskselects her investments with a focus toward earning potentially higher long-term gains. She chooses a mix ofinvestments from the options offered by her plan. The return on her account varies over time. Some years, her accountbalance is up more than 20%; others, it is down more than 20%. But she retires 30 years later with $586,612 in heraccount—more than double Bill's total.****
This example shows you that as you build your investment strategy, consider focusing more on the long term and lessabout what happened in the market today, this week, this month, or even this year.
** The compounding concept is hypothetical and for illustrative purposes only and is not intended to represent performance of anyspecific investment, which may fluctuate. No taxes are considered in the calculations; generally withdrawals are taxable at ordinaryrates. Keep in mind that an asset allocation strategy does not ensure safety of principal and interest. It is possible to lose money byinvesting in securities.
*** The stable value rate for Bill's investment is based on the 5-year Treasury Note Yield Index.
****The six asset classes Maria used are stable-value, fixed-income (based on the Lehman Brothers Aggregate Bond Index), small-cap(based on the Russell 2000 Index) mid-cap (based on the Russell MidCap Index), large-cap (based on the Russell Top 200 Index) andinternational (Morgan Stanley Capital International EAFE Index).
3
How can you manage risk?
$600,000
$500,000
$400,000
$300,000
$200,000
$100,000
$0
Bill’s Account
4.82%Return
Maria’s Account
8.81%Return
Next step: How do you choose your investments?
37
10
01
011
20
2
n Build your own portfolio . . . . . . . . . . . . . . determine your Investor Style Code (below)
4
Next step: Find your suggested portfolio option.
2.How do you choose your investments?
My Investor Style Code is:
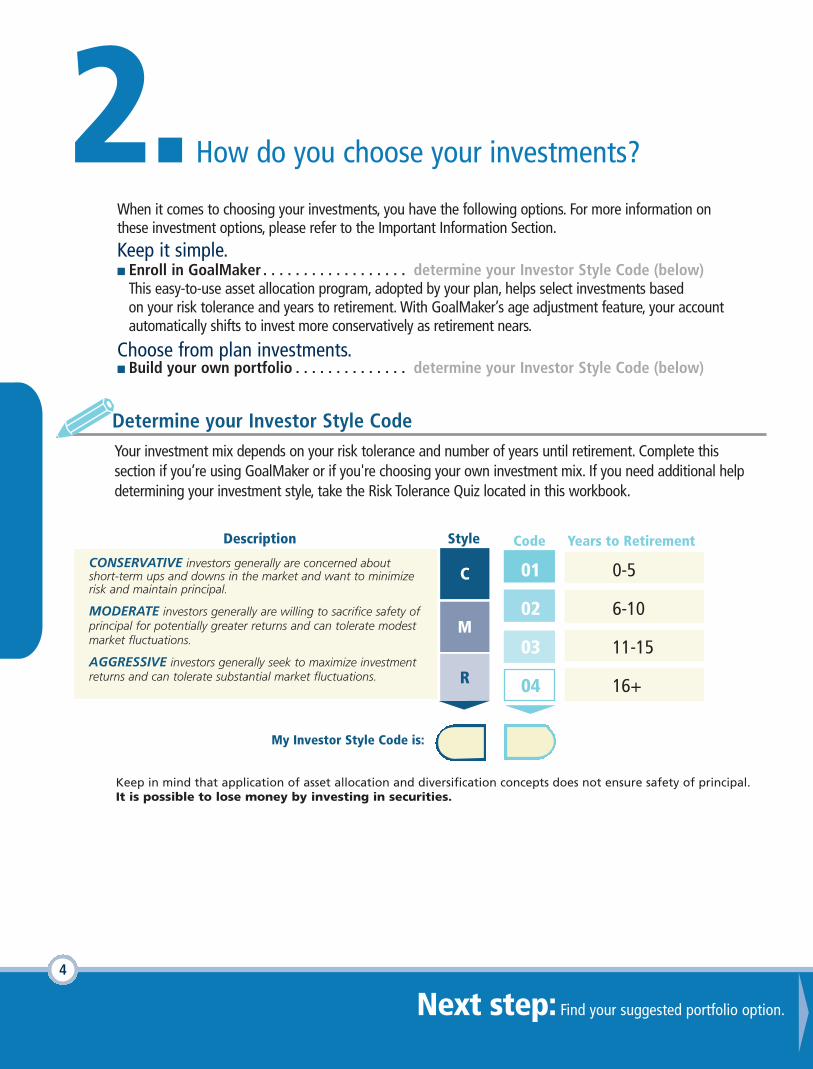
Determine your Investor Style Code
When it comes to choosing your investments, you have the following options. For more information onthese investment options, please refer to the Important Information Section.
Keep it simple.n Enroll in GoalMaker . . . . . . . . . . . . . . . . . . determine your Investor Style Code (below)
This easy-to-use asset allocation program, adopted by your plan, helps select investments based on your risk tolerance and years to retirement. With GoalMaker’s age adjustment feature, your accountautomatically shifts to invest more conservatively as retirement nears.
Choose from plan investments.
Description Style
CONSERVATIVE investors generally are concerned aboutshort-term ups and downs in the market and want to minimizerisk and maintain principal.
MODERATE investors generally are willing to sacrifice safety ofprincipal for potentially greater returns and can tolerate modestmarket fluctuations.
AGGRESSIVE investors generally seek to maximize investmentreturns and can tolerate substantial market fluctuations.
Keep in mind that application of asset allocation and diversification concepts does not ensure safety of principal.It is possible to lose money by investing in securities.
C
M
R
Code Years to Retirement
01 0-5
02 6-10
03 11-15
04 16+
Your investment mix depends on your risk tolerance and number of years until retirement. Complete thissection if you’re using GoalMaker or if you're choosing your own investment mix. If you need additional helpdetermining your investment style, take the Risk Tolerance Quiz located in this workbook.
5
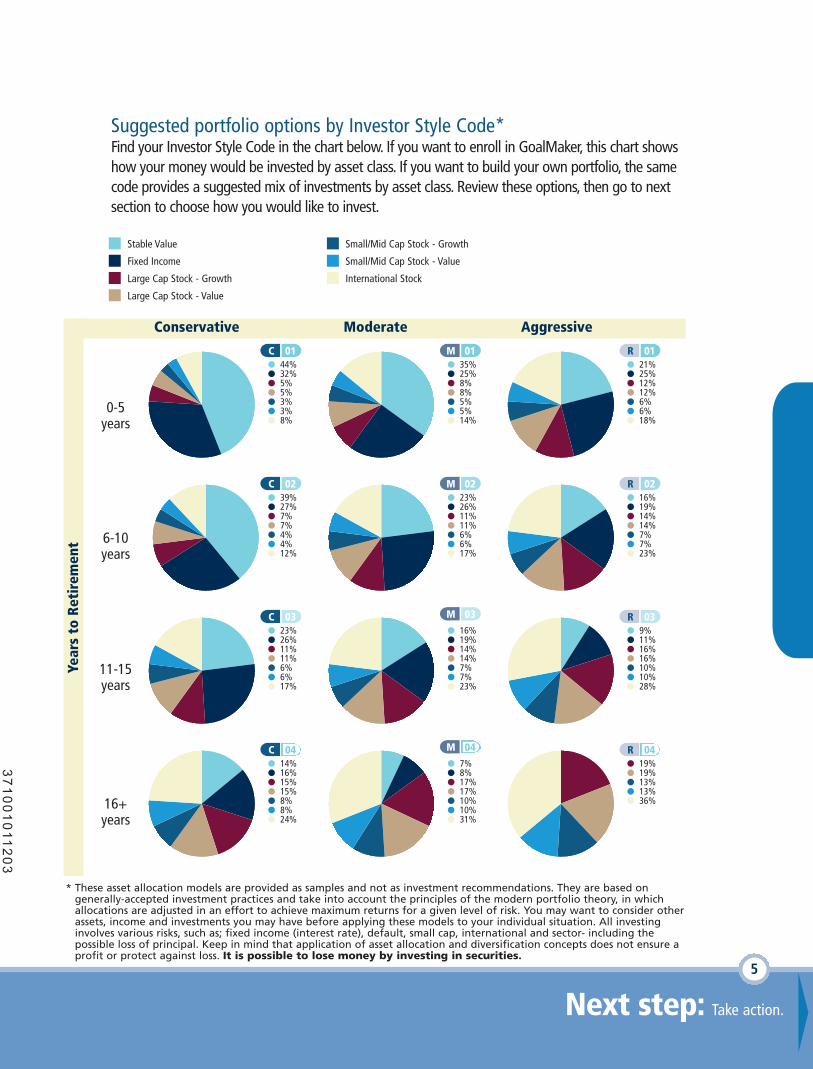
Suggested portfolio options by Investor Style Code*Find your Investor Style Code in the chart below. If you want to enroll in GoalMaker, this chart showshow your money would be invested by asset class. If you want to build your own portfolio, the samecode provides a suggested mix of investments by asset class. Review these options, then go to nextsection to choose how you would like to invest.
Next step: Take action.
* These asset allocation models are provided as samples and not as investment recommendations. They are based ongenerally-accepted investment practices and take into account the principles of the modern portfolio theory, in whichallocations are adjusted in an effort to achieve maximum returns for a given level of risk. You may want to consider otherassets, income and investments you may have before applying these models to your individual situation. All investinginvolves various risks, such as; fixed income (interest rate), default, small cap, international and sector- including thepossible loss of principal. Keep in mind that application of asset allocation and diversification concepts does not ensure aprofit or protect against loss. It is possible to lose money by investing in securities.
Year
s to
Ret
irem
ent
Conservative Moderate Aggressive
0-5years
6-10years
11-15years
16+years
C 02
C 03
C 04
C 01
M 02
M 03
M 04
M 01
R 02
R 03
R 04
R 01
Stable Value
Large Cap Stock - Growth
Fixed Income
Large Cap Stock - Value
Small/Mid Cap Stock - Growth
Small/Mid Cap Stock - Value
International Stock
44%32%5%5%
3%8%
39%27%7%7%4%4%12%
23%26%11%11%6%6%17%
14%16%15%15%8%8%24%
35%25%8%8%5%5%14%
21%25%12%12%6%6%18%
23%26%11%11%6%6%17%
16%19%14%14%7%7%23%
7%8%17%17%10%10%31%
16%19%14%14%7%7%23%
9%11%16%16%10%10%28%
19%19%13%13%36%
3%
37
10
01
011
20
3
You’re on your way toward a more secure financial future by saving through your retirement plan, but likemany of us, you may be asking yourself: Will I have enough savings to support my essential needs? WhileI'm saving, how can I protect my future retirement income from market declines?
These are important questions to consider. The good news is, your plan offers an easy-to-use assetallocation program called GoalMaker, which helps you take steps today to address these risks.GoalMaker takes the complexity out of choosing investments that can help you build your retirementsavings and protect the amount of income you will have when you retire. GoalMaker is optional andavailable at no additional cost.
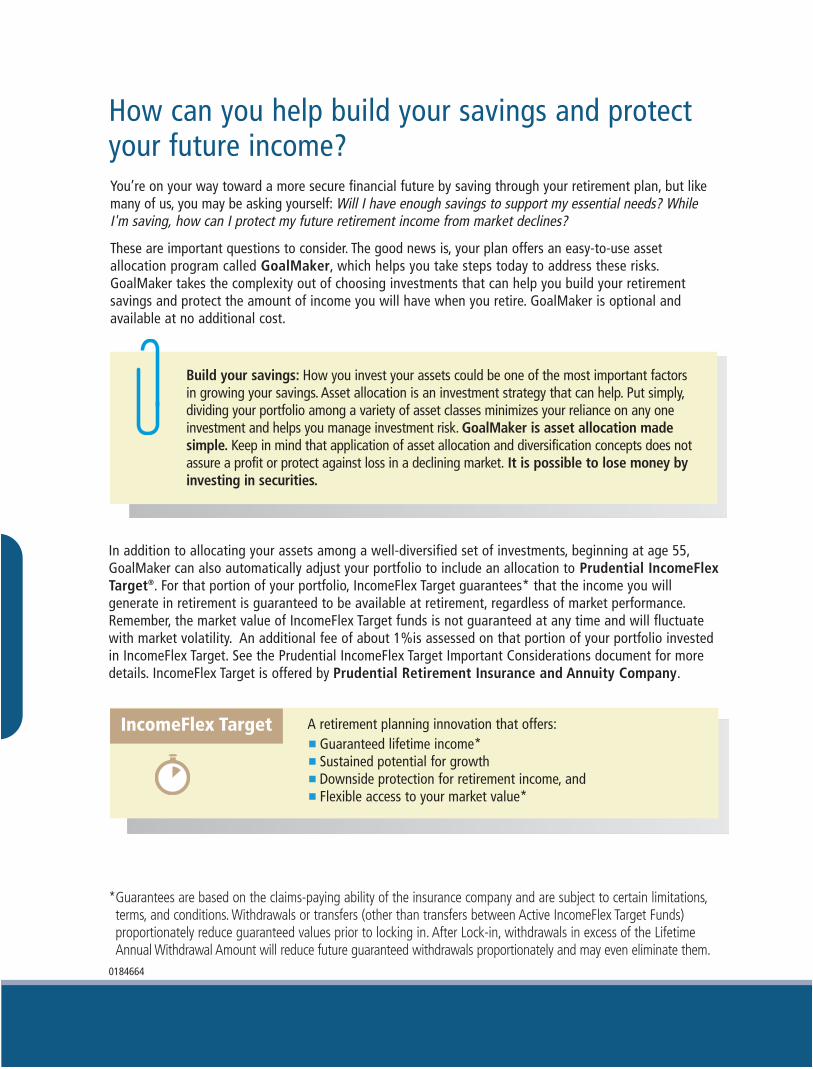
How can you help build your savings and protectyour future income?
Build your savings: How you invest your assets could be one of the most important factorsin growing your savings. Asset allocation is an investment strategy that can help. Put simply,dividing your portfolio among a variety of asset classes minimizes your reliance on any oneinvestment and helps you manage investment risk. GoalMaker is asset allocation madesimple. Keep in mind that application of asset allocation and diversification concepts does notassure a profit or protect against loss in a declining market. It is possible to lose money byinvesting in securities.
In addition to allocating your assets among a well-diversified set of investments, beginning at age 55,GoalMaker can also automatically adjust your portfolio to include an allocation to Prudential IncomeFlexTarget®. For that portion of your portfolio, IncomeFlex Target guarantees* that the income you willgenerate in retirement is guaranteed to be available at retirement, regardless of market performance.Remember, the market value of IncomeFlex Target funds is not guaranteed at any time and will fluctuatewith market volatility. An additional fee of about 1%is assessed on that portion of your portfolio investedin IncomeFlex Target. See the Prudential IncomeFlex Target Important Considerations document for moredetails. IncomeFlex Target is offered by Prudential Retirement Insurance and Annuity Company.
*Guarantees are based on the claims-paying ability of the insurance company and are subject to certain limitations,terms, and conditions. Withdrawals or transfers (other than transfers between Active IncomeFlex Target Funds)proportionately reduce guaranteed values prior to locking in. After Lock-in, withdrawals in excess of the LifetimeAnnual Withdrawal Amount will reduce future guaranteed withdrawals proportionately and may even eliminate them.
IncomeFlex Target A retirement planning innovation that offers:� Guaranteed lifetime income*� Sustained potential for growth� Downside protection for retirement income, and� Flexible access to your market value*
0184664
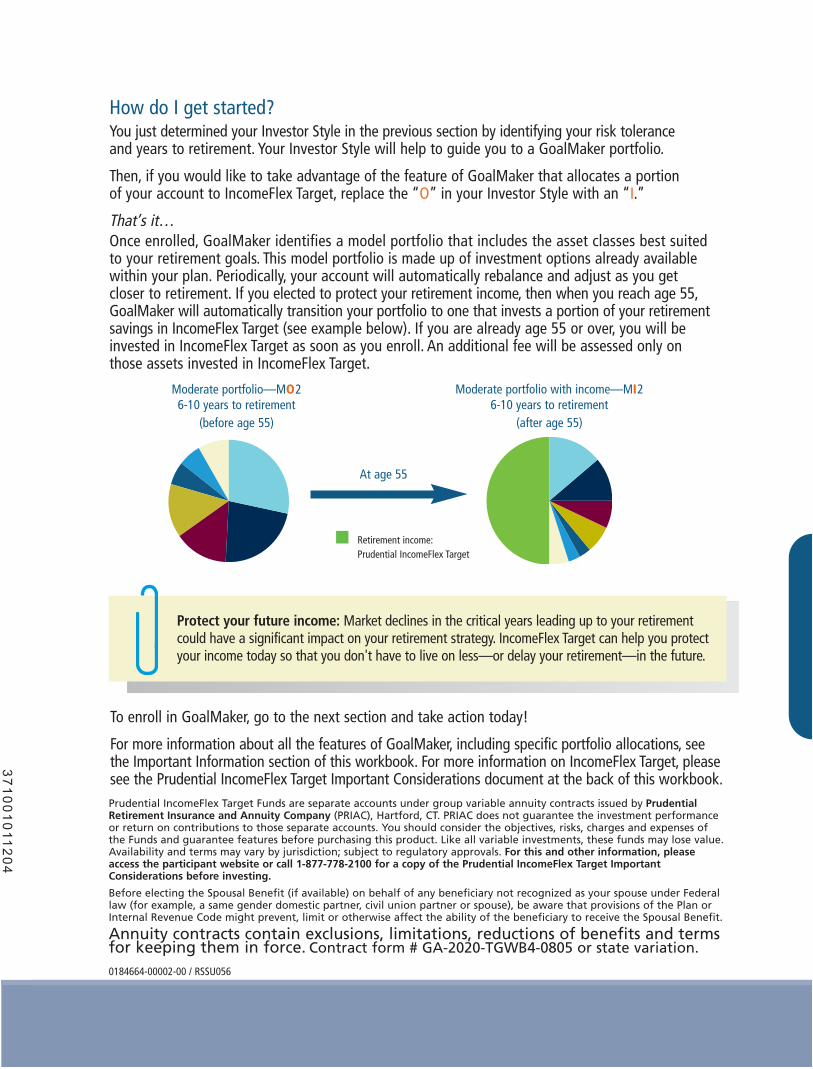
How do I get started?You just determined your Investor Style in the previous section by identifying your risk toleranceand years to retirement. Your Investor Style will help to guide you to a GoalMaker portfolio.
Then, if you would like to take advantage of the feature of GoalMaker that allocates a portion of your account to IncomeFlex Target, replace the “O” in your Investor Style with an “I.”
That’s it…Once enrolled, GoalMaker identifies a model portfolio that includes the asset classes best suitedto your retirement goals. This model portfolio is made up of investment options already availablewithin your plan. Periodically, your account will automatically rebalance and adjust as you getcloser to retirement. If you elected to protect your retirement income, then when you reach age 55,GoalMaker will automatically transition your portfolio to one that invests a portion of your retirementsavings in IncomeFlex Target (see example below). If you are already age 55 or over, you will beinvested in IncomeFlex Target as soon as you enroll. An additional fee will be assessed only onthose assets invested in IncomeFlex Target.
Prudential IncomeFlex Target Funds are separate accounts under group variable annuity contracts issued by PrudentialRetirement Insurance and Annuity Company (PRIAC), Hartford, CT. PRIAC does not guarantee the investment performanceor return on contributions to those separate accounts. You should consider the objectives, risks, charges and expenses of the Funds and guarantee features before purchasing this product. Like all variable investments, these funds may lose value.Availability and terms may vary by jurisdiction; subject to regulatory approvals. For this and other information, pleaseaccess the participant website or call 1-877-778-2100 for a copy of the Prudential IncomeFlex Target ImportantConsiderations before investing.
Before electing the Spousal Benefit (if available) on behalf of any beneficiary not recognized as your spouse under Federallaw (for example, a same gender domestic partner, civil union partner or spouse), be aware that provisions of the Plan orInternal Revenue Code might prevent, limit or otherwise affect the ability of the beneficiary to receive the Spousal Benefit.
Annuity contracts contain exclusions, limitations, reductions of benefits and termsfor keeping them in force. Contract form # GA-2020-TGWB4-0805 or state variation.
Moderate portfolio—MO26-10 years to retirement
(before age 55)
Moderate portfolio with income—MI26-10 years to retirement
(after age 55)
� Retirement income: Prudential IncomeFlex Target
At age 55
To enroll in GoalMaker, go to the next section and take action today!
For more information about all the features of GoalMaker, including specific portfolio allocations, see the Important Information section of this workbook. For more information on IncomeFlex Target, pleasesee the Prudential IncomeFlex Target Important Considerations document at the back of this workbook.
0184664-00002-00 / RSSU056
Protect your future income: Market declines in the critical years leading up to your retirementcould have a significant impact on your retirement strategy. IncomeFlex Target can help you protectyour income today so that you don't have to live on less—or delay your retirement—in the future.
37
10
01
011
20
4

8
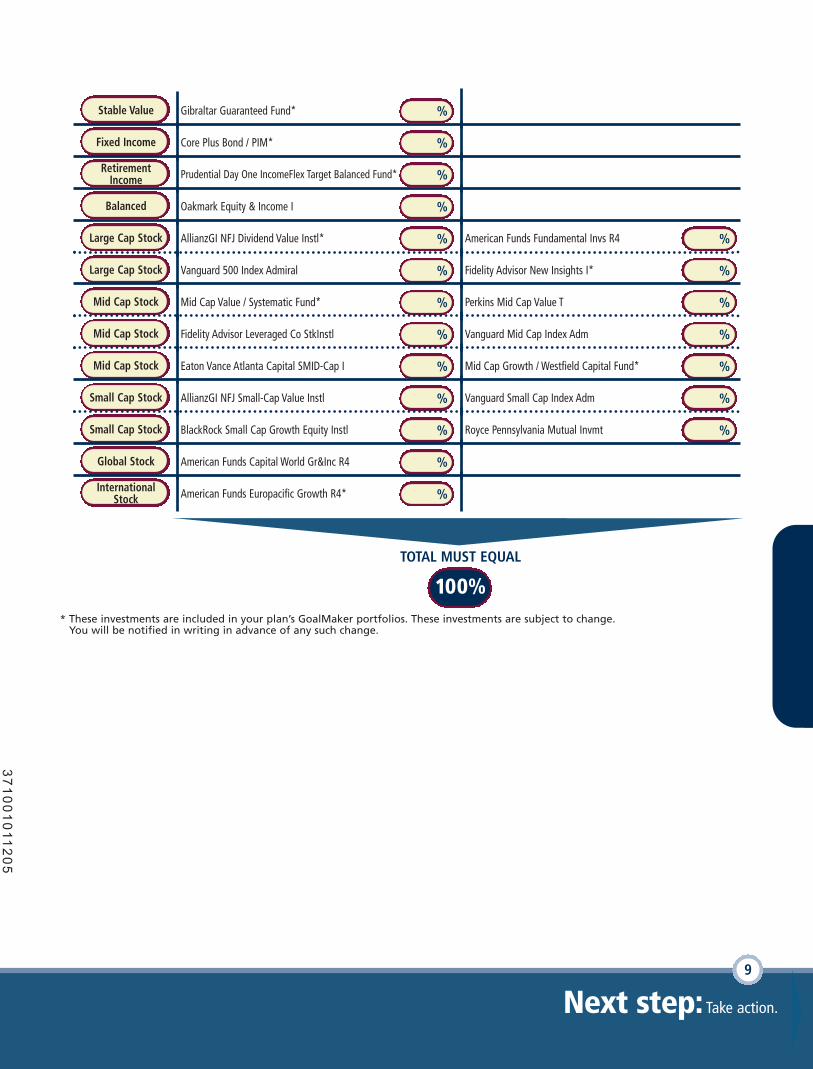
OR...build your own portfolio1: (Total of selected funds equals 100%)
If you decide to choose your own investments, you can refer to the suggested portfolio options on the previous pagefor allocation suggestions. You can then choose from the investment options in the chart on the next page, and write inthe percentage you’d like to invest. Then go directly to Step 2 to update your account.
3.How do you take action?
Choose your investments. Select one option below that best meets yourinvesting style and goals.
Enroll in GoalMakerI wish to enroll in GoalMaker. Enter your Investor Style Code, then go directly to Step 2 to complete enrollment.
My Investor Style Code is: The investments included in your plan's GoalMaker portfolios arenoted with an asterisk in the chart on the next page.
1 Please refer to the Important Information and investment performance sections for additional information.
Step 1:
9
Gibraltar Guaranteed Fund*Stable Value %
Core Plus Bond / PIM*Fixed Income %
Prudential Day One IncomeFlex Target Balanced Fund*RetirementIncome %
Oakmark Equity & Income IBalanced %
AllianzGI NFJ Dividend Value Instl*Large Cap Stock % %American Funds Fundamental Invs R4
Vanguard 500 Index AdmiralLarge Cap Stock % %Fidelity Advisor New Insights I*
Mid Cap Value / Systematic Fund*Mid Cap Stock % %Perkins Mid Cap Value T
Fidelity Advisor Leveraged Co StkInstlMid Cap Stock % %Vanguard Mid Cap Index Adm
Eaton Vance Atlanta Capital SMID-Cap IMid Cap Stock % %Mid Cap Growth / Westfield Capital Fund*
AllianzGI NFJ Small-Cap Value InstlSmall Cap Stock % %Vanguard Small Cap Index Adm
BlackRock Small Cap Growth Equity InstlSmall Cap Stock % %Royce Pennsylvania Mutual Invmt
American Funds Capital World Gr&Inc R4Global Stock %
American Funds Europacific Growth R4*InternationalStock %
TOTAL MUST EQUAL
100%* These investments are included in your plan’s GoalMaker portfolios. These investments are subject to change.
You will be notified in writing in advance of any such change.
Next step: Take action.
37
10
01
011
20
5

10
Step 2: Update your account.Online or by phone:n Visit www.prudential.com/online/retirement and select “First Time Logging In?” option. Or,
call 1-877-778-2100 (hearing impaired, please call 1-877-760-5166).n Follow the prompts to create your PIN (Personal Identification Number) and then complete
your transaction.
Using a form:n Complete the form at the back of this workbook and return it to the contact listed on the
form.
How much income will you need in retirement? It really depends on whattype of lifestyle you wish to maintain and your financial situation. To get an
idea of how much you may need, see the example on the inside back cover of thisworkbook. To create your personalized estimate, use the calculator atwww.preparewithpru.com.
Quick Tip:
Step 3: Designate your beneficiary.n Identifying the person you want to receive your account balance in case of your death is
very important.n You can record the beneficiary for your account by visiting
www.prudential.com/online/retirement, calling 1-877-778-2100 or completing andreturning the Beneficiary Form at the back of this workbook.
Be sure to stay on track.It’s important to keep an eye on your account to help ensure that your financial future is ontrack. Use the following tools to help yourself along the way:n Obtain account information and initiate transactions by visiting
www.prudential.com/online/retirement or calling our toll free number, at n 1-877-778-2100. (Representatives are available to assist you weekdays, from 8 a.m.to 9
p.m., ET.)n Visit the educational website, at www.preparewithpru.com to access a variety of
interactive financial planning tools.n Review your retirement statement detailing your account activity.
Step 4:
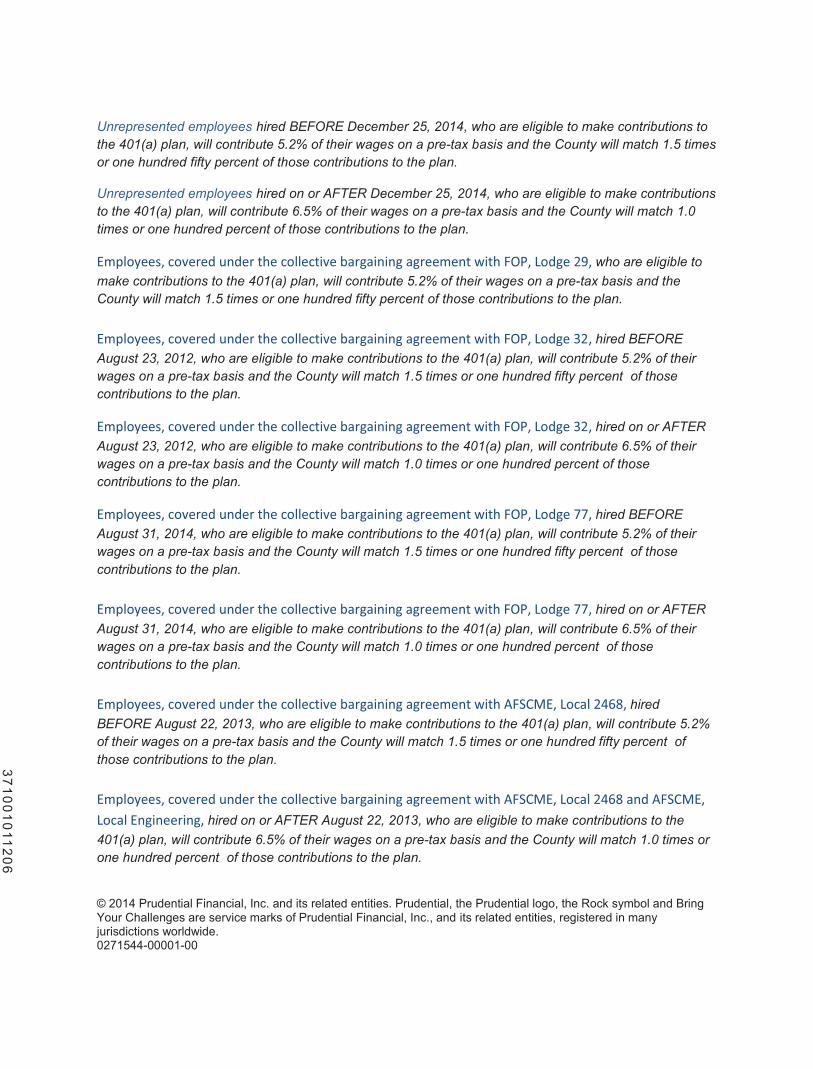
Unrepresented employees hired BEFORE December 25, 2014, who are eligible to make contributions to the 401(a) plan, will contribute 5.2% of their wages on a pre-tax basis and the County will match 1.5 times or one hundred fifty percent of those contributions to the plan.
Unrepresented employees hired on or AFTER December 25, 2014, who are eligible to make contributions to the 401(a) plan, will contribute 6.5% of their wages on a pre-tax basis and the County will match 1.0 times or one hundred percent of those contributions to the plan.
Employees, covered under the collective bargaining agreement with FOP, Lodge 29, who are eligible to make contributions to the 401(a) plan, will contribute 5.2% of their wages on a pre-tax basis and the County will match 1.5 times or one hundred fifty percent of those contributions to the plan. Employees, covered under the collective bargaining agreement with FOP, Lodge 32, hired BEFORE August 23, 2012, who are eligible to make contributions to the 401(a) plan, will contribute 5.2% of their wages on a pre-tax basis and the County will match 1.5 times or one hundred fifty percent of those contributions to the plan.
Employees, covered under the collective bargaining agreement with FOP, Lodge 32, hired on or AFTER August 23, 2012, who are eligible to make contributions to the 401(a) plan, will contribute 6.5% of their wages on a pre-tax basis and the County will match 1.0 times or one hundred percent of those contributions to the plan.
Employees, covered under the collective bargaining agreement with FOP, Lodge 77, hired BEFORE August 31, 2014, who are eligible to make contributions to the 401(a) plan, will contribute 5.2% of their wages on a pre-tax basis and the County will match 1.5 times or one hundred fifty percent of those contributions to the plan. Employees, covered under the collective bargaining agreement with FOP, Lodge 77, hired on or AFTER August 31, 2014, who are eligible to make contributions to the 401(a) plan, will contribute 6.5% of their wages on a pre-tax basis and the County will match 1.0 times or one hundred percent of those contributions to the plan. Employees, covered under the collective bargaining agreement with AFSCME, Local 2468, hired BEFORE August 22, 2013, who are eligible to make contributions to the 401(a) plan, will contribute 5.2% of their wages on a pre-tax basis and the County will match 1.5 times or one hundred fifty percent of those contributions to the plan. Employees, covered under the collective bargaining agreement with AFSCME, Local 2468 and AFSCME, Local Engineering, hired on or AFTER August 22, 2013, who are eligible to make contributions to the 401(a) plan, will contribute 6.5% of their wages on a pre-tax basis and the County will match 1.0 times or one hundred percent of those contributions to the plan.
© 2014 Prudential Financial, Inc. and its related entities. Prudential, the Prudential logo, the Rock symbol and Bring Your Challenges are service marks of Prudential Financial, Inc., and its related entities, registered in many jurisdictions worldwide. 0271544-00001-00
37
10
01
011
20
6

This page left intentionally blank.12
13
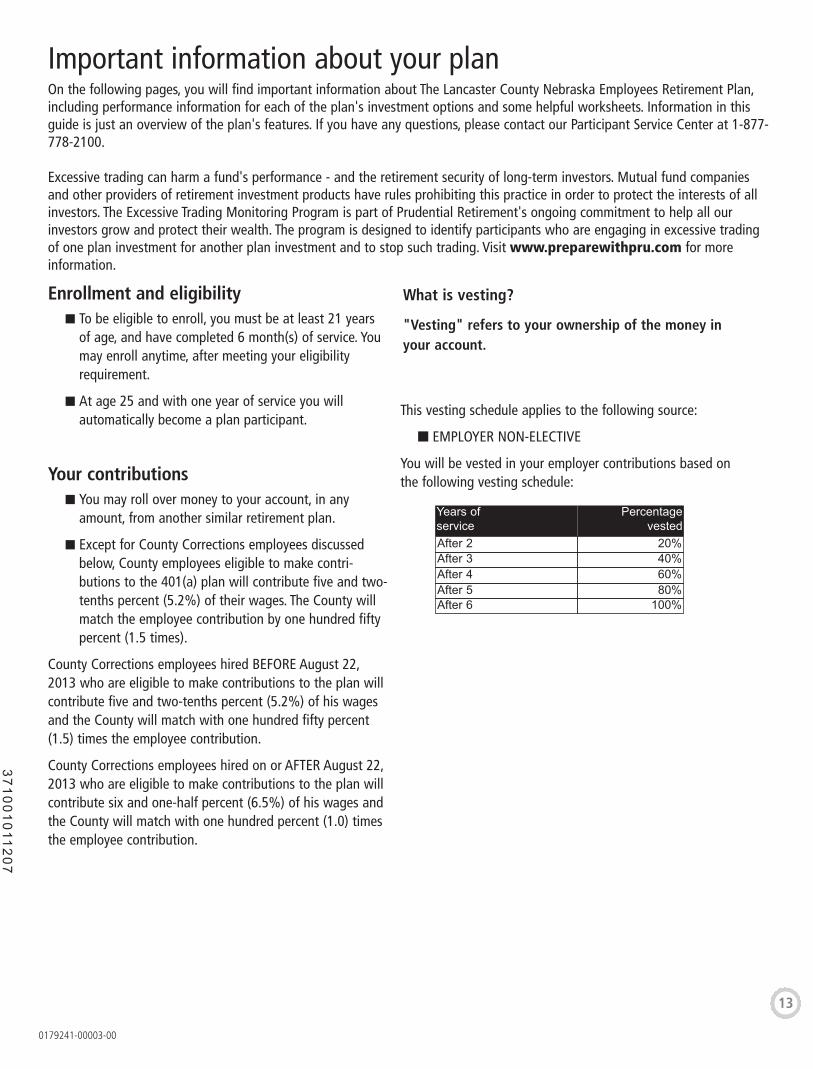
Important information about your planOn the following pages, you will find important information about The Lancaster County Nebraska Employees Retirement Plan,including performance information for each of the plan's investment options and some helpful worksheets. Information in thisguide is just an overview of the plan's features. If you have any questions, please contact our Participant Service Center at 1-877-778-2100.
Excessive trading can harm a fund's performance - and the retirement security of long-term investors. Mutual fund companiesand other providers of retirement investment products have rules prohibiting this practice in order to protect the interests of allinvestors. The Excessive Trading Monitoring Program is part of Prudential Retirement's ongoing commitment to help all ourinvestors grow and protect their wealth. The program is designed to identify participants who are engaging in excessive tradingof one plan investment for another plan investment and to stop such trading. Visit www.preparewithpru.com for moreinformation.
Enrollment and eligibilityn To be eligible to enroll, you must be at least 21 years
of age, and have completed 6 month(s) of service. Youmay enroll anytime, after meeting your eligibilityrequirement.
n At age 25 and with one year of service you willautomatically become a plan participant.
Your contributions n You may roll over money to your account, in any
amount, from another similar retirement plan.
n Except for County Corrections employees discussedbelow, County employees eligible to make contri-butions to the 401(a) plan will contribute five and two-tenths percent (5.2%) of their wages. The County willmatch the employee contribution by one hundred fiftypercent (1.5 times).
County Corrections employees hired BEFORE August 22,2013 who are eligible to make contributions to the plan willcontribute five and two-tenths percent (5.2%) of his wagesand the County will match with one hundred fifty percent(1.5) times the employee contribution.
County Corrections employees hired on or AFTER August 22,2013 who are eligible to make contributions to the plan willcontribute six and one-half percent (6.5%) of his wages andthe County will match with one hundred percent (1.0) timesthe employee contribution.
What is vesting?
"Vesting" refers to your ownership of the money inyour account.
This vesting schedule applies to the following source:
n EMPLOYER NON-ELECTIVE
You will be vested in your employer contributions based onthe following vesting schedule:
Years ofservice
Percentagevested
After 2 20%After 3 40%After 4 60%After 5 80%After 6 100%
0179241-00003-00
37
10
01
011
20
7
14
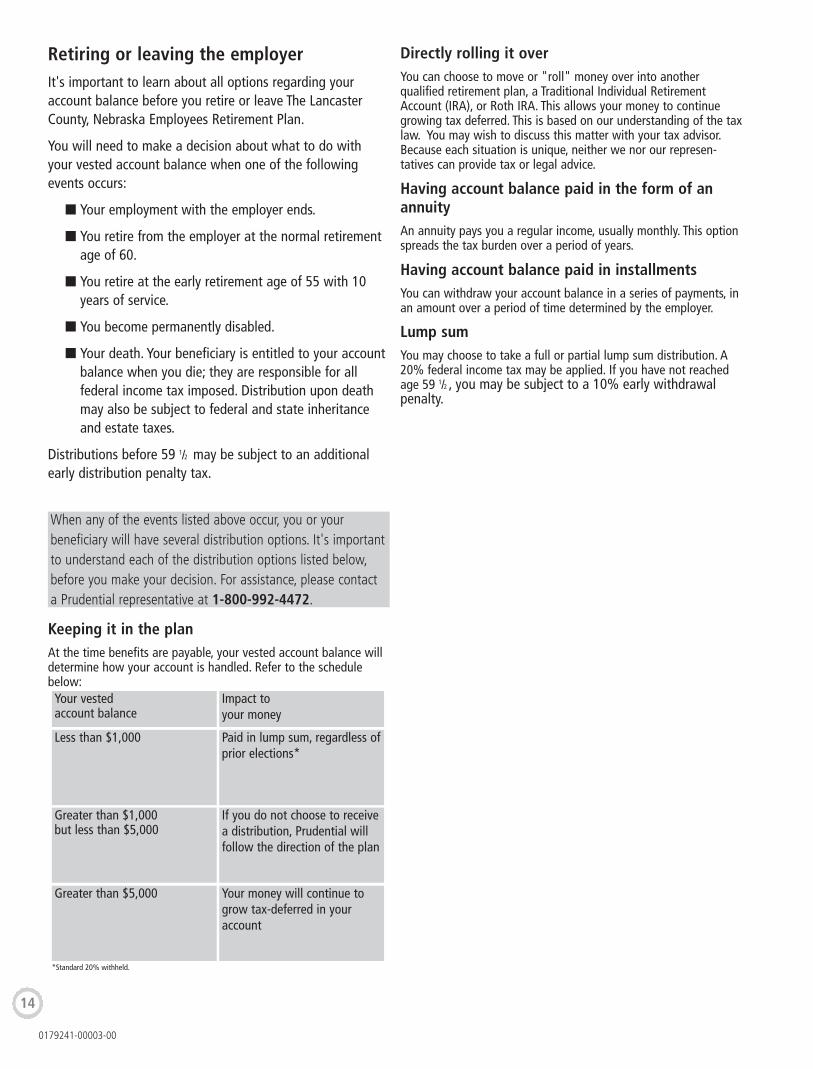
Retiring or leaving the employerIt's important to learn about all options regarding youraccount balance before you retire or leave The LancasterCounty, Nebraska Employees Retirement Plan.
You will need to make a decision about what to do withyour vested account balance when one of the followingevents occurs:
n Your employment with the employer ends.
n You retire from the employer at the normal retirementage of 60.
n You retire at the early retirement age of 55 with 10years of service.
n You become permanently disabled.
n Your death. Your beneficiary is entitled to your accountbalance when you die; they are responsible for allfederal income tax imposed. Distribution upon deathmay also be subject to federal and state inheritanceand estate taxes.
Distributions before 59 1/2 may be subject to an additionalearly distribution penalty tax.
When any of the events listed above occur, you or yourbeneficiary will have several distribution options. It's importantto understand each of the distribution options listed below,before you make your decision. For assistance, please contacta Prudential representative at 1-800-992-4472.
Your vested account balance
Keeping it in the planAt the time benefits are payable, your vested account balance willdetermine how your account is handled. Refer to the schedulebelow:
Impact to your money
Less than $1,000 Paid in lump sum, regardless ofprior elections*
Greater than $1,000but less than $5,000
If you do not choose to receivea distribution, Prudential willfollow the direction of the plan
Greater than $5,000 Your money will continue togrow tax-deferred in youraccount
*Standard 20% withheld.
Directly rolling it overYou can choose to move or "roll" money over into anotherqualified retirement plan, a Traditional Individual RetirementAccount (IRA), or Roth IRA. This allows your money to continuegrowing tax deferred. This is based on our understanding of the taxlaw. You may wish to discuss this matter with your tax advisor.Because each situation is unique, neither we nor our represen-tatives can provide tax or legal advice.
Having account balance paid in the form of anannuityAn annuity pays you a regular income, usually monthly. This optionspreads the tax burden over a period of years.
Having account balance paid in installmentsYou can withdraw your account balance in a series of payments, inan amount over a period of time determined by the employer.
Lump sumYou may choose to take a full or partial lump sum distribution. A20% federal income tax may be applied. If you have not reachedage 59 1/2 , you may be subject to a 10% early withdrawalpenalty.
0179241-00003-00
15
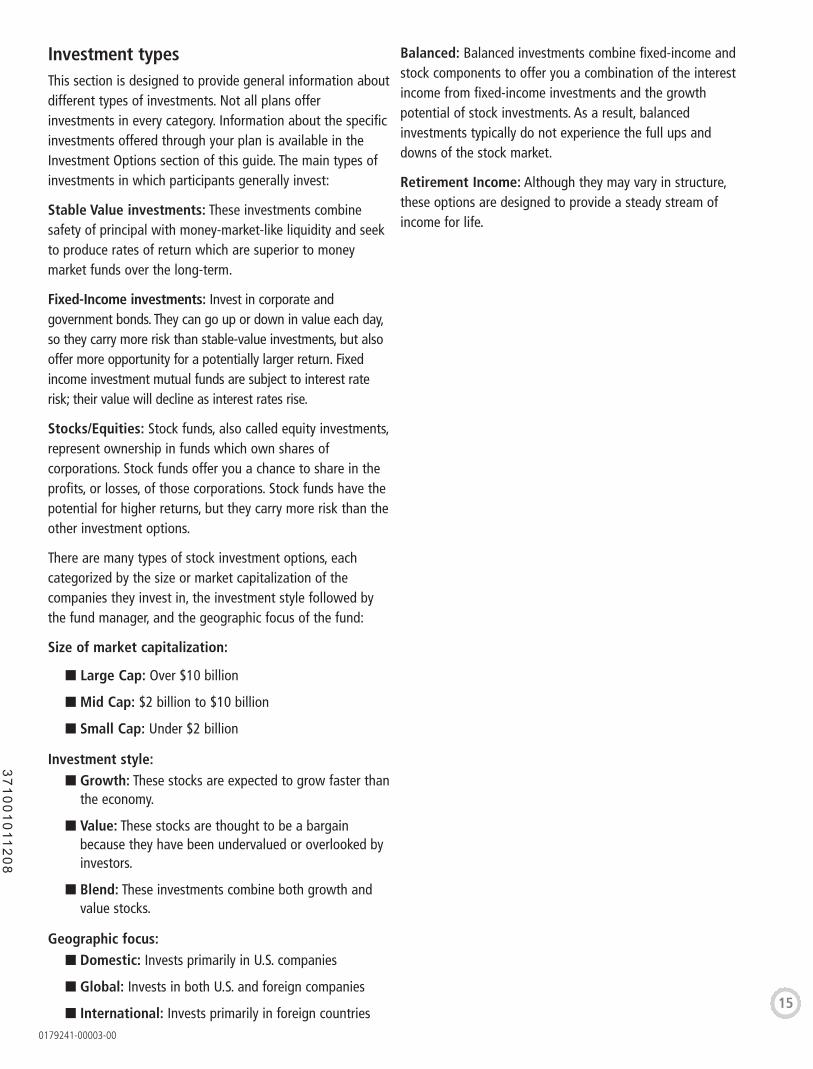
Investment typesThis section is designed to provide general information aboutdifferent types of investments. Not all plans offerinvestments in every category. Information about the specificinvestments offered through your plan is available in theInvestment Options section of this guide. The main types ofinvestments in which participants generally invest:
Stable Value investments: These investments combinesafety of principal with money-market-like liquidity and seekto produce rates of return which are superior to moneymarket funds over the long-term.
Fixed-Income investments: Invest in corporate andgovernment bonds. They can go up or down in value each day,so they carry more risk than stable-value investments, but alsooffer more opportunity for a potentially larger return. Fixedincome investment mutual funds are subject to interest raterisk; their value will decline as interest rates rise.
Stocks/Equities: Stock funds, also called equity investments,represent ownership in funds which own shares ofcorporations. Stock funds offer you a chance to share in theprofits, or losses, of those corporations. Stock funds have thepotential for higher returns, but they carry more risk than theother investment options.
There are many types of stock investment options, eachcategorized by the size or market capitalization of thecompanies they invest in, the investment style followed bythe fund manager, and the geographic focus of the fund:
Size of market capitalization:
n Large Cap: Over $10 billion
n Mid Cap: $2 billion to $10 billion
n Small Cap: Under $2 billion
Investment style:n Growth: These stocks are expected to grow faster than
the economy.
n Value: These stocks are thought to be a bargainbecause they have been undervalued or overlooked byinvestors.
n Blend: These investments combine both growth andvalue stocks.
Geographic focus:n Domestic: Invests primarily in U.S. companies
n Global: Invests in both U.S. and foreign companies
n International: Invests primarily in foreign countries
Balanced: Balanced investments combine fixed-income andstock components to offer you a combination of the interestincome from fixed-income investments and the growthpotential of stock investments. As a result, balancedinvestments typically do not experience the full ups anddowns of the stock market.
Retirement Income: Although they may vary in structure,these options are designed to provide a steady stream ofincome for life.
0179241-00003-00
37
10
01
011
20
8
16
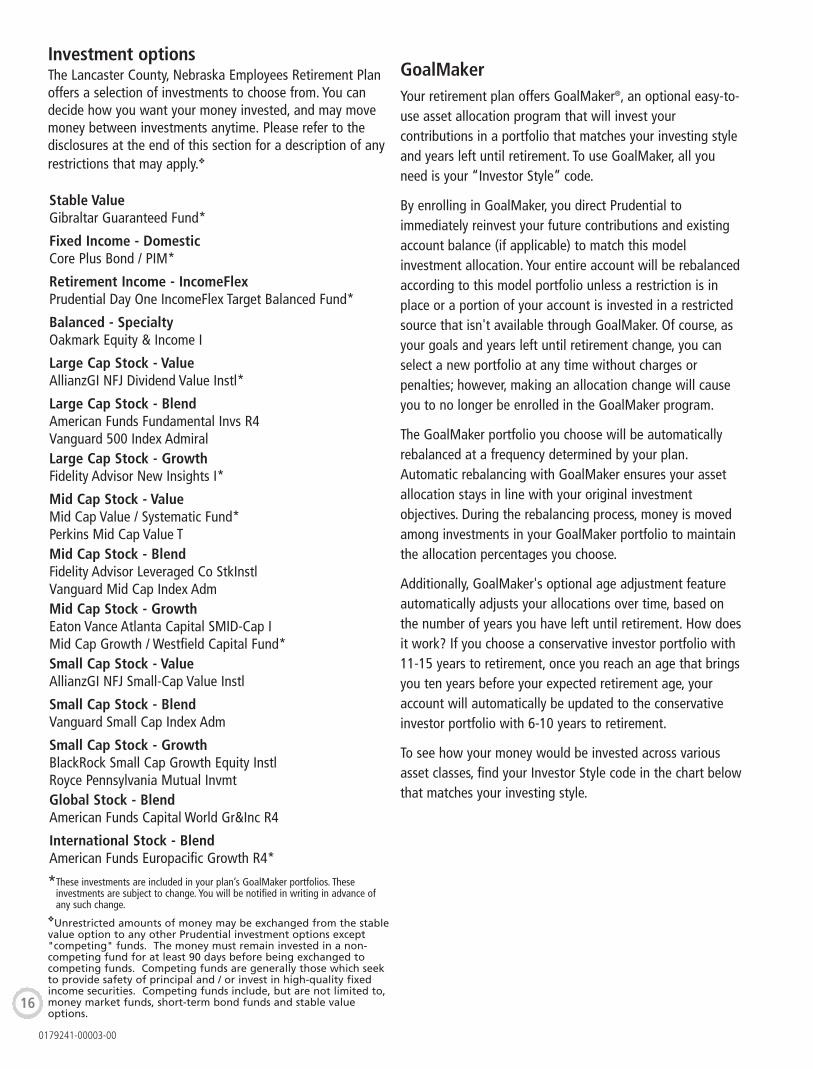
Investment optionsThe Lancaster County, Nebraska Employees Retirement Planoffers a selection of investments to choose from. You candecide how you want your money invested, and may movemoney between investments anytime. Please refer to thedisclosures at the end of this section for a description of anyrestrictions that may apply.v
Stable ValueGibraltar Guaranteed Fund*
Fixed Income - DomesticCore Plus Bond / PIM*
Retirement Income - IncomeFlexPrudential Day One IncomeFlex Target Balanced Fund*
Balanced - SpecialtyOakmark Equity & Income I
Large Cap Stock - ValueAllianzGI NFJ Dividend Value Instl*
Large Cap Stock - BlendAmerican Funds Fundamental Invs R4Vanguard 500 Index AdmiralLarge Cap Stock - GrowthFidelity Advisor New Insights I*
Mid Cap Stock - ValueMid Cap Value / Systematic Fund*Perkins Mid Cap Value TMid Cap Stock - BlendFidelity Advisor Leveraged Co StkInstlVanguard Mid Cap Index AdmMid Cap Stock - GrowthEaton Vance Atlanta Capital SMID-Cap IMid Cap Growth / Westfield Capital Fund*Small Cap Stock - ValueAllianzGI NFJ Small-Cap Value Instl
Small Cap Stock - BlendVanguard Small Cap Index Adm
Small Cap Stock - GrowthBlackRock Small Cap Growth Equity InstlRoyce Pennsylvania Mutual InvmtGlobal Stock - BlendAmerican Funds Capital World Gr&Inc R4
International Stock - BlendAmerican Funds Europacific Growth R4*
*These investments are included in your plan’s GoalMaker portfolios. Theseinvestments are subject to change. You will be notified in writing in advance ofany such change.
vUnrestricted amounts of money may be exchanged from the stablevalue option to any other Prudential investment options except"competing" funds. The money must remain invested in a non-competing fund for at least 90 days before being exchanged tocompeting funds. Competing funds are generally those which seekto provide safety of principal and / or invest in high-quality fixedincome securities. Competing funds include, but are not limited to,money market funds, short-term bond funds and stable valueoptions.
GoalMakerYour retirement plan offers GoalMaker®, an optional easy-to-use asset allocation program that will invest yourcontributions in a portfolio that matches your investing styleand years left until retirement. To use GoalMaker, all youneed is your “Investor Style” code.
By enrolling in GoalMaker, you direct Prudential toimmediately reinvest your future contributions and existingaccount balance (if applicable) to match this modelinvestment allocation. Your entire account will be rebalancedaccording to this model portfolio unless a restriction is inplace or a portion of your account is invested in a restrictedsource that isn't available through GoalMaker. Of course, asyour goals and years left until retirement change, you canselect a new portfolio at any time without charges orpenalties; however, making an allocation change will causeyou to no longer be enrolled in the GoalMaker program.
The GoalMaker portfolio you choose will be automaticallyrebalanced at a frequency determined by your plan.Automatic rebalancing with GoalMaker ensures your assetallocation stays in line with your original investmentobjectives. During the rebalancing process, money is movedamong investments in your GoalMaker portfolio to maintainthe allocation percentages you choose.
Additionally, GoalMaker's optional age adjustment featureautomatically adjusts your allocations over time, based onthe number of years you have left until retirement. How doesit work? If you choose a conservative investor portfolio with11-15 years to retirement, once you reach an age that bringsyou ten years before your expected retirement age, youraccount will automatically be updated to the conservativeinvestor portfolio with 6-10 years to retirement.
To see how your money would be invested across variousasset classes, find your Investor Style code in the chart belowthat matches your investing style.
0179241-00003-00

17
0-5
Year
s
6-10
Yea
rs
11-1
5 Ye
ars
16+
Yea
rs
Investment options
C01 C02 C03 C04
Conservative allocations
Stable ValueGibraltar Guaranteed Fund 14%23%39%44%
Fixed IncomeCore Plus Bond / PIM 16%26%27%32%
Large Cap Stock - GrowthFidelity Advisor New Insights I 15%11%7%5%
Large Cap Stock - ValueAllianzGI NFJ Dividend Value Instl 15%11%7%5%
Small/Mid Cap Stock - GrowthMid Cap Growth / Westfield CapitalFund
8%6%4%3%
Small/Mid Cap Stock - ValueMid Cap Value / Systematic Fund 8%6%4%3%
International StockAmerican Funds EuropacificGrowth R4 24%17%12%8%
0-5
Year
s
6-10
Yea
rs
11-1
5 Ye
ars
16+
Yea
rs
Investment options
M01 M02 M03 M04
Moderate allocations
Stable ValueGibraltar Guaranteed Fund 7%16%23%35%
Fixed IncomeCore Plus Bond / PIM 8%19%26%25%
Large Cap Stock - GrowthFidelity Advisor New Insights I 17%14%11%8%
Large Cap Stock - ValueAllianzGI NFJ Dividend Value Instl 17%14%11%8%
Small/Mid Cap Stock - GrowthMid Cap Growth / Westfield CapitalFund
10%7%6%5%
Small/Mid Cap Stock - ValueMid Cap Value / Systematic Fund 10%7%6%5%
International StockAmerican Funds EuropacificGrowth R4 31%23%17%14%
0-5
Year
s
6-10
Yea
rs
11-1
5 Ye
ars
16+
Yea
rs
Investment options
R01 R02 R03 R04
Aggressive allocations
Stable ValueGibraltar Guaranteed Fund 0%9%16%21%
Fixed IncomeCore Plus Bond / PIM 0%11%19%25%
Large Cap Stock - GrowthFidelity Advisor New Insights I 19%16%14%12%
Large Cap Stock - ValueAllianzGI NFJ Dividend Value Instl 19%16%14%12%
Small/Mid Cap Stock - GrowthMid Cap Growth / Westfield CapitalFund
13%10%7%6%
Small/Mid Cap Stock - ValueMid Cap Value / Systematic Fund 13%10%7%6%
International StockAmerican Funds EuropacificGrowth R4 36%28%23%18%
Please note that in addition to the specific funds used in the GoalMakermodel portfolios, other funds with similar risk and return characteristicsmay be available to you.
0179241-00003-00
37
10
01
011
20
9
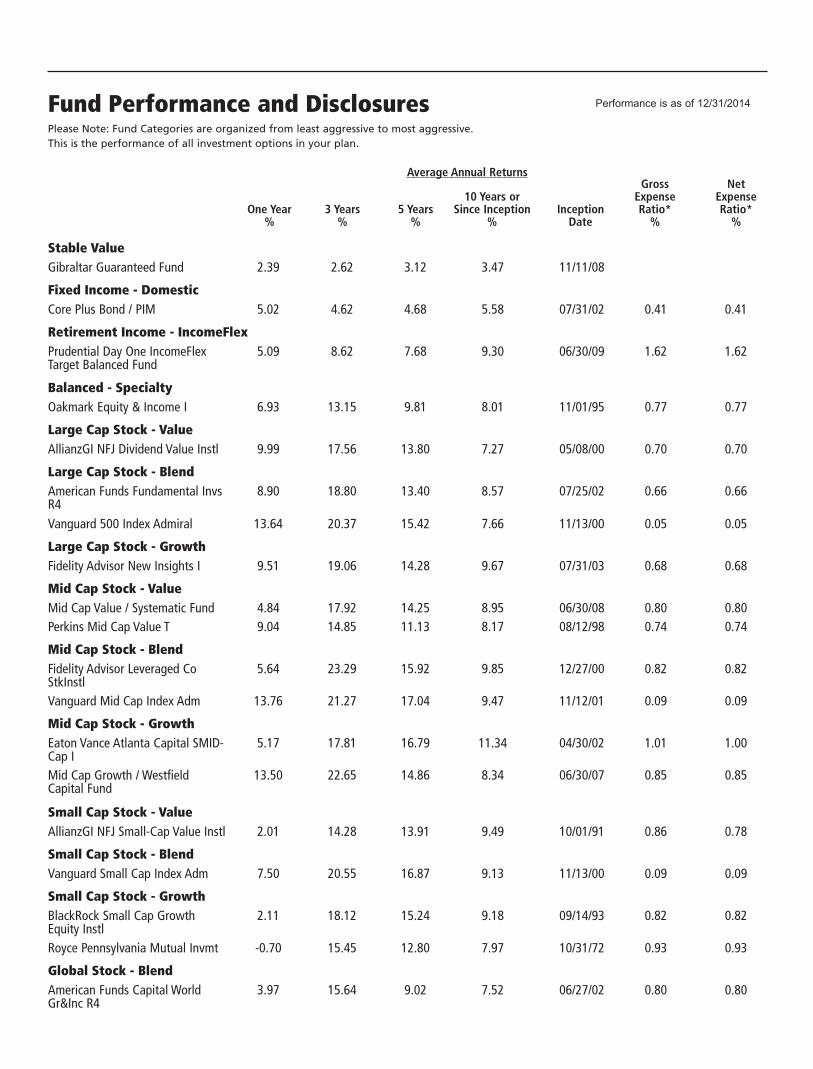
Fund Performance and Disclosures Please Note: Fund Categories are organized from least aggressive to most aggressive.This is the performance of all investment options in your plan.
Average Annual Returns
Performance is as of 12/31/2014
One Year%
3 Years%
5 Years%
10 Years orSince Inception
%Inception
Date
ExpenseRatio*
%
GrossExpenseRatio*
%
Net
Stable ValueGibraltar Guaranteed Fund 2.39 2.62 11/11/083.12 3.47
Fixed Income - DomesticCore Plus Bond / PIM 5.02 4.62 07/31/024.68 0.415.58 0.41
Retirement Income - IncomeFlexPrudential Day One IncomeFlexTarget Balanced Fund
5.09 8.62 06/30/097.68 1.629.30 1.62
Balanced - SpecialtyOakmark Equity & Income I 6.93 13.15 11/01/959.81 0.778.01 0.77
Large Cap Stock - ValueAllianzGI NFJ Dividend Value Instl 9.99 17.56 05/08/0013.80 0.707.27 0.70
Large Cap Stock - BlendAmerican Funds Fundamental InvsR4
8.90 18.80 07/25/0213.40 0.668.57 0.66
Vanguard 500 Index Admiral 13.64 20.37 11/13/0015.42 0.057.66 0.05
Large Cap Stock - GrowthFidelity Advisor New Insights I 9.51 19.06 07/31/0314.28 0.689.67 0.68
Mid Cap Stock - ValueMid Cap Value / Systematic Fund 4.84 17.92 06/30/0814.25 0.808.95 0.80Perkins Mid Cap Value T 9.04 14.85 08/12/9811.13 0.748.17 0.74
Mid Cap Stock - BlendFidelity Advisor Leveraged CoStkInstl
5.64 23.29 12/27/0015.92 0.829.85 0.82
Vanguard Mid Cap Index Adm 13.76 21.27 11/12/0117.04 0.099.47 0.09
Mid Cap Stock - GrowthEaton Vance Atlanta Capital SMID-Cap I
5.17 17.81 04/30/0216.79 1.0111.34 1.00
Mid Cap Growth / WestfieldCapital Fund
13.50 22.65 06/30/0714.86 0.858.34 0.85
Small Cap Stock - ValueAllianzGI NFJ Small-Cap Value Instl 2.01 14.28 10/01/9113.91 0.869.49 0.78
Small Cap Stock - BlendVanguard Small Cap Index Adm 7.50 20.55 11/13/0016.87 0.099.13 0.09
Small Cap Stock - GrowthBlackRock Small Cap GrowthEquity Instl
2.11 18.12 09/14/9315.24 0.829.18 0.82
Royce Pennsylvania Mutual Invmt -0.70 15.45 10/31/7212.80 0.937.97 0.93
Global Stock - BlendAmerican Funds Capital WorldGr&Inc R4
3.97 15.64 06/27/029.02 0.807.52 0.80
Average Annual Returns
One Year%
3 Years%
5 Years%
10 Years orSince Inception
%Inception
Date
ExpenseRatio*
%
GrossExpenseRatio*
%
Net
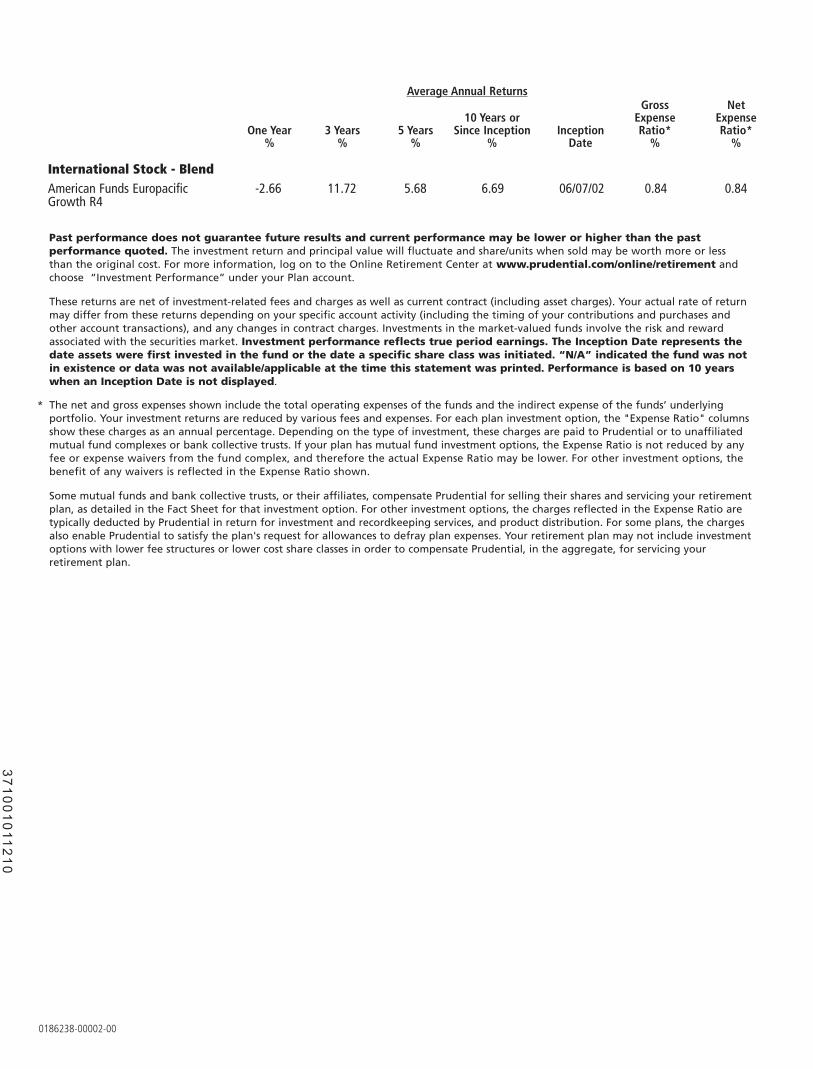
International Stock - BlendAmerican Funds EuropacificGrowth R4
-2.66 11.72 06/07/025.68 0.846.69 0.84
Past performance does not guarantee future results and current performance may be lower or higher than the past performance quoted. The investment return and principal value will fluctuate and share/units when sold may be worth more or less than the original cost. For more information, log on to the Online Retirement Center at www.prudential.com/online/retirement and choose “Investment Performance” under your Plan account.
These returns are net of investment-related fees and charges as well as current contract (including asset charges). Your actual rate of return may differ from these returns depending on your specific account activity (including the timing of your contributions and purchases and other account transactions), and any changes in contract charges. Investments in the market-valued funds involve the risk and reward associated with the securities market. Investment performance reflects true period earnings. The Inception Date represents the date assets were first invested in the fund or the date a specific share class was initiated. “N/A” indicated the fund was not in existence or data was not available/applicable at the time this statement was printed. Performance is based on 10 years when an Inception Date is not displayed.
* The net and gross expenses shown include the total operating expenses of the funds and the indirect expense of the funds’ underlying portfolio. Your investment returns are reduced by various fees and expenses. For each plan investment option, the "Expense Ratio" columns show these charges as an annual percentage. Depending on the type of investment, these charges are paid to Prudential or to unaffiliated mutual fund complexes or bank collective trusts. If your plan has mutual fund investment options, the Expense Ratio is not reduced by any fee or expense waivers from the fund complex, and therefore the actual Expense Ratio may be lower. For other investment options, the benefit of any waivers is reflected in the Expense Ratio shown.
Some mutual funds and bank collective trusts, or their affiliates, compensate Prudential for selling their shares and servicing your retirement plan, as detailed in the Fact Sheet for that investment option. For other investment options, the charges reflected in the Expense Ratio are typically deducted by Prudential in return for investment and recordkeeping services, and product distribution. For some plans, the charges also enable Prudential to satisfy the plan's request for allowances to defray plan expenses. Your retirement plan may not include investmentoptions with lower fee structures or lower cost share classes in order to compensate Prudential, in the aggregate, for servicing your retirement plan.
0186238-00002-00
37
10
01
011
21
0
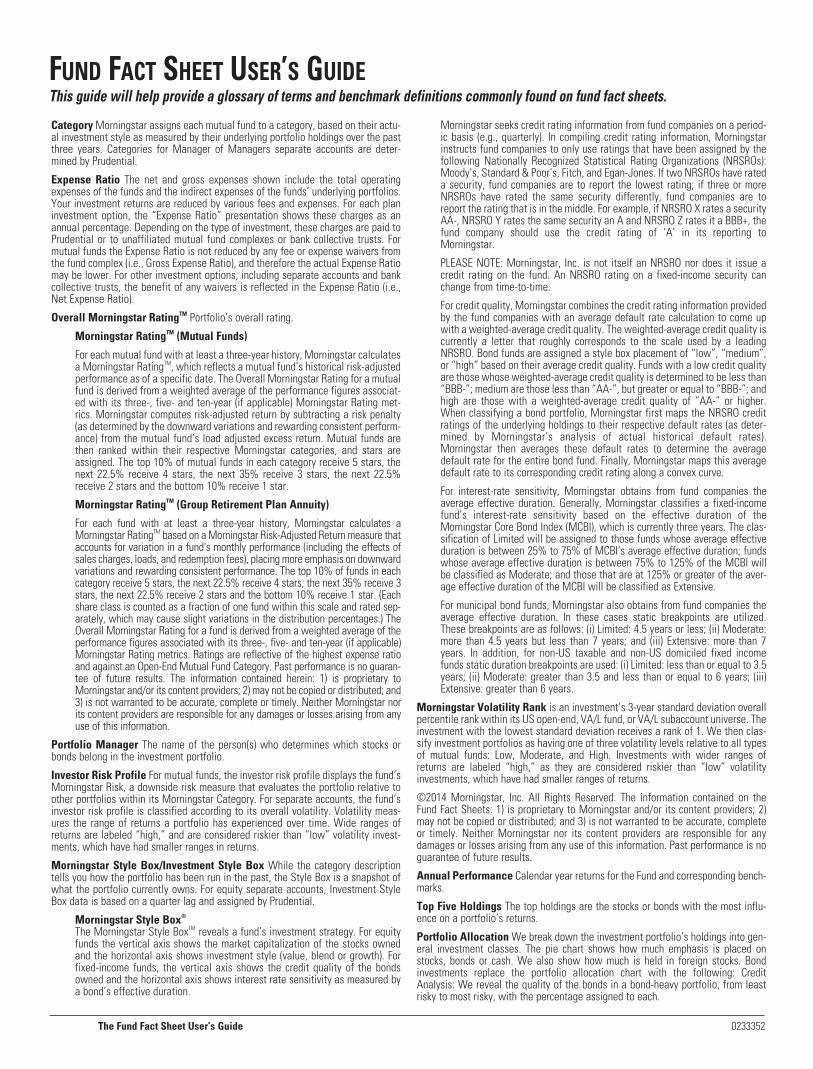
Category Morningstar assigns each mutual fund to a category, based on their actu-al investment style as measured by their underlying portfolio holdings over the pastthree years. Categories for Manager of Managers separate accounts are deter-mined by Prudential.
Expense Ratio The net and gross expenses shown include the total operatingexpenses of the funds and the indirect expenses of the funds’ underlying portfolios.Your investment returns are reduced by various fees and expenses. For each planinvestment option, the “Expense Ratio” presentation shows these charges as anannual percentage. Depending on the type of investment, these charges are paid toPrudential or to unaffiliated mutual fund complexes or bank collective trusts. Formutual funds the Expense Ratio is not reduced by any fee or expense waivers fromthe fund complex (i.e., Gross Expense Ratio), and therefore the actual Expense Ratiomay be lower. For other investment options, including separate accounts and bankcollective trusts, the benefit of any waivers is reflected in the Expense Ratio (i.e.,Net Expense Ratio).
Overall Morningstar RatingTM Portfolio’s overall rating.
Morningstar RatingTM (Mutual Funds)
For each mutual fund with at least a three-year history, Morningstar calculatesa Morningstar RatingTM, which reflects a mutual fund’s historical risk-adjustedperformance as of a specific date. The Overall Morningstar Rating for a mutualfund is derived from a weighted average of the performance figures associat-ed with its three-, five- and ten-year (if applicable) Morningstar Rating met-rics. Morningstar computes risk-adjusted return by subtracting a risk penalty(as determined by the downward variations and rewarding consistent perform-ance) from the mutual fund’s load adjusted excess return. Mutual funds arethen ranked within their respective Morningstar categories, and stars areassigned. The top 10% of mutual funds in each category receive 5 stars, thenext 22.5% receive 4 stars, the next 35% receive 3 stars, the next 22.5%receive 2 stars and the bottom 10% receive 1 star.
Morningstar RatingTM (Group Retirement Plan Annuity)
For each fund with at least a three-year history, Morningstar calculates aMorningstar RatingTM based on a Morningstar Risk-Adjusted Return measure thataccounts for variation in a fund's monthly performance (including the effects ofsales charges, loads, and redemption fees), placing more emphasis on downwardvariations and rewarding consistent performance. The top 10% of funds in eachcategory receive 5 stars, the next 22.5% receive 4 stars, the next 35% receive 3stars, the next 22.5% receive 2 stars and the bottom 10% receive 1 star. (Eachshare class is counted as a fraction of one fund within this scale and rated sep-arately, which may cause slight variations in the distribution percentages.) TheOverall Morningstar Rating for a fund is derived from a weighted average of theperformance figures associated with its three-, five- and ten-year (if applicable)Morningstar Rating metrics. Ratings are reflective of the highest expense ratioand against an Open-End Mutual Fund Category. Past performance is no guaran-tee of future results. The information contained herein: 1) is proprietary toMorningstar and/or its content providers; 2) may not be copied or distributed; and3) is not warranted to be accurate, complete or timely. Neither Morningstar norits content providers are responsible for any damages or losses arising from anyuse of this information.
Portfolio Manager The name of the person(s) who determines which stocks orbonds belong in the investment portfolio.
Investor Risk Profile For mutual funds, the investor risk profile displays the fund’sMorningstar Risk, a downside risk measure that evaluates the portfolio relative toother portfolios within its Morningstar Category. For separate accounts, the fund’sinvestor risk profile is classified according to its overall volatility. Volatility meas-ures the range of returns a portfolio has experienced over time. Wide ranges ofreturns are labeled “high,” and are considered riskier than “low” volatility invest-ments, which have had smaller ranges in returns.
Morningstar Style Box/Investment Style Box While the category descriptiontells you how the portfolio has been run in the past, the Style Box is a snapshot ofwhat the portfolio currently owns. For equity separate accounts, Investment StyleBox data is based on a quarter lag and assigned by Prudential.
Morningstar Style Box®
The Morningstar Style BoxTM reveals a fund’s investment strategy. For equityfunds the vertical axis shows the market capitalization of the stocks ownedand the horizontal axis shows investment style (value, blend or growth). Forfixed-income funds, the vertical axis shows the credit quality of the bondsowned and the horizontal axis shows interest rate sensitivity as measured bya bond’s effective duration.
Morningstar seeks credit rating information from fund companies on a period-ic basis (e.g., quarterly). In compiling credit rating information, Morningstarinstructs fund companies to only use ratings that have been assigned by thefollowing Nationally Recognized Statistical Rating Organizations (NRSROs):Moody’s, Standard & Poor’s, Fitch, and Egan-Jones. If two NRSROs have rateda security, fund companies are to report the lowest rating; if three or moreNRSROs have rated the same security differently, fund companies are toreport the rating that is in the middle. For example, if NRSRO X rates a securityAA-, NRSRO Y rates the same security an A and NRSRO Z rates it a BBB+, thefund company should use the credit rating of ‘A’ in its reporting toMorningstar.
PLEASE NOTE: Morningstar, Inc. is not itself an NRSRO nor does it issue acredit rating on the fund. An NRSRO rating on a fixed-income security canchange from time-to-time.
For credit quality, Morningstar combines the credit rating information providedby the fund companies with an average default rate calculation to come upwith a weighted-average credit quality. The weighted-average credit quality iscurrently a letter that roughly corresponds to the scale used by a leadingNRSRO. Bond funds are assigned a style box placement of “low”, “medium”,or “high” based on their average credit quality. Funds with a low credit qualityare those whose weighted-average credit quality is determined to be less than“BBB-”; medium are those less than “AA-”, but greater or equal to “BBB-”; andhigh are those with a weighted-average credit quality of “AA-” or higher.When classifying a bond portfolio, Morningstar first maps the NRSRO creditratings of the underlying holdings to their respective default rates (as deter-mined by Morningstar’s analysis of actual historical default rates).Morningstar then averages these default rates to determine the averagedefault rate for the entire bond fund. Finally, Morningstar maps this averagedefault rate to its corresponding credit rating along a convex curve.
For interest-rate sensitivity, Morningstar obtains from fund companies theaverage effective duration. Generally, Morningstar classifies a fixed-incomefund’s interest-rate sensitivity based on the effective duration of theMorningstar Core Bond Index (MCBI), which is currently three years. The clas-sification of Limited will be assigned to those funds whose average effectiveduration is between 25% to 75% of MCBI’s average effective duration; fundswhose average effective duration is between 75% to 125% of the MCBI willbe classified as Moderate; and those that are at 125% or greater of the aver-age effective duration of the MCBI will be classified as Extensive.
For municipal bond funds, Morningstar also obtains from fund companies theaverage effective duration. In these cases static breakpoints are utilized.These breakpoints are as follows: (i) Limited: 4.5 years or less; (ii) Moderate:more than 4.5 years but less than 7 years; and (iii) Extensive: more than 7years. In addition, for non-US taxable and non-US domiciled fixed incomefunds static duration breakpoints are used: (i) Limited: less than or equal to 3.5years; (ii) Moderate: greater than 3.5 and less than or equal to 6 years; (iii)Extensive: greater than 6 years.
Morningstar Volatility Rank is an investment’s 3-year standard deviation overallpercentile rank within its US open-end, VA/L fund, or VA/L subaccount universe. Theinvestment with the lowest standard deviation receives a rank of 1. We then clas-sify investment portfolios as having one of three volatility levels relative to all typesof mutual funds: Low, Moderate, and High. Investments with wider ranges ofreturns are labeled “high,” as they are considered riskier than “low” volatilityinvestments, which have had smaller ranges of returns.
©2014 Morningstar, Inc. All Rights Reserved. The information contained on theFund Fact Sheets: 1) is proprietary to Morningstar and/or its content providers; 2)may not be copied or distributed; and 3) is not warranted to be accurate, completeor timely. Neither Morningstar nor its content providers are responsible for anydamages or losses arising from any use of this information. Past performance is noguarantee of future results.
Annual Performance Calendar year returns for the Fund and corresponding bench-marks.
Top Five Holdings The top holdings are the stocks or bonds with the most influ-ence on a portfolio’s returns.
Portfolio Allocation We break down the investment portfolio’s holdings into gen-eral investment classes. The pie chart shows how much emphasis is placed onstocks, bonds or cash. We also show how much is held in foreign stocks. Bondinvestments replace the portfolio allocation chart with the following: CreditAnalysis: We reveal the quality of the bonds in a bond-heavy portfolio, from leastrisky to most risky, with the percentage assigned to each.
The Fund Fact Sheet User’s Guide 0233352
FUND FACT SHEET USER’S GUIDEThis guide will help provide a glossary of terms and benchmark definitions commonly found on fund fact sheets.
The Fund Fact Sheet User’s Guide 0233352
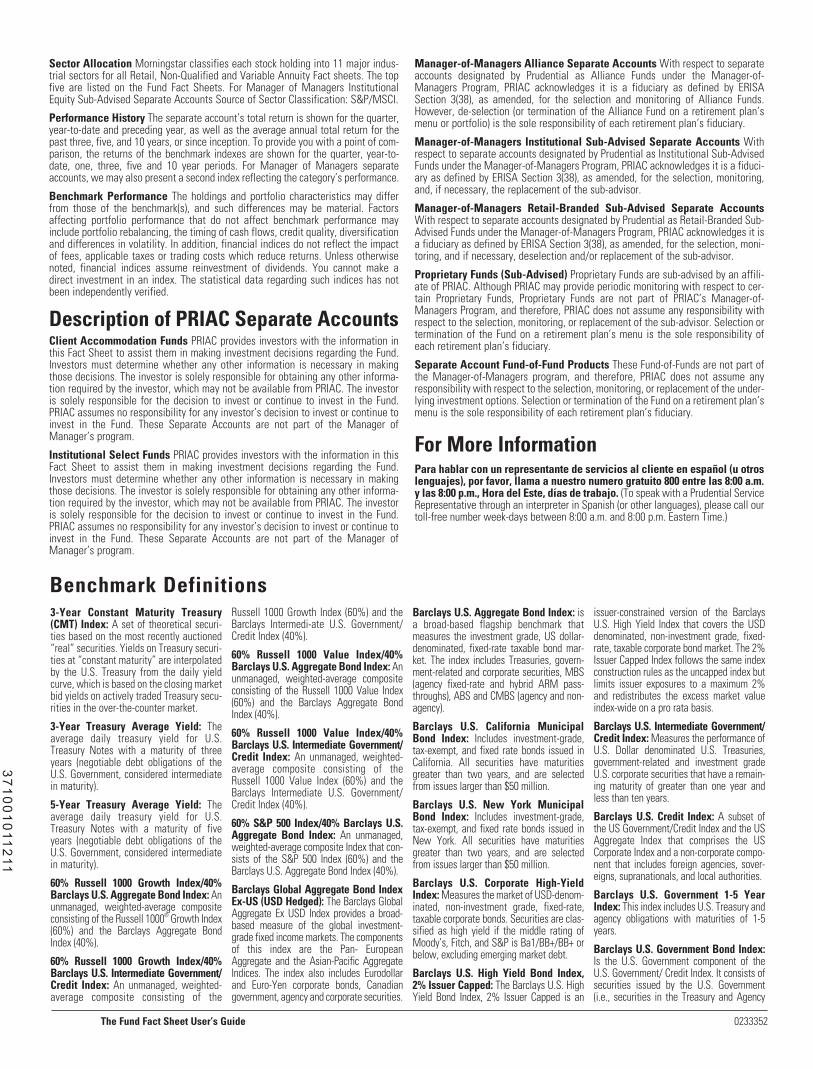
Sector Allocation Morningstar classifies each stock holding into 11 major indus-trial sectors for all Retail, Non-Qualified and Variable Annuity Fact sheets. The topfive are listed on the Fund Fact Sheets. For Manager of Managers InstitutionalEquity Sub-Advised Separate Accounts Source of Sector Classification: S&P/MSCI.
Performance History The separate account’s total return is shown for the quarter,year-to-date and preceding year, as well as the average annual total return for thepast three, five, and 10 years, or since inception. To provide you with a point of com-parison, the returns of the benchmark indexes are shown for the quarter, year-to-date, one, three, five and 10 year periods. For Manager of Managers separateaccounts, we may also present a second index reflecting the category’s performance.
Benchmark Performance The holdings and portfolio characteristics may differfrom those of the benchmark(s), and such differences may be material. Factorsaffecting portfolio performance that do not affect benchmark performance mayinclude portfolio rebalancing, the timing of cash flows, credit quality, diversificationand differences in volatility. In addition, financial indices do not reflect the impactof fees, applicable taxes or trading costs which reduce returns. Unless otherwisenoted, financial indices assume reinvestment of dividends. You cannot make adirect investment in an index. The statistical data regarding such indices has notbeen independently verified.
Description of PRIAC Separate AccountsClient Accommodation Funds PRIAC provides investors with the information inthis Fact Sheet to assist them in making investment decisions regarding the Fund.Investors must determine whether any other information is necessary in makingthose decisions. The investor is solely responsible for obtaining any other informa-tion required by the investor, which may not be available from PRIAC. The investoris solely responsible for the decision to invest or continue to invest in the Fund.PRIAC assumes no responsibility for any investor’s decision to invest or continue toinvest in the Fund. These Separate Accounts are not part of the Manager ofManager’s program.
Institutional Select Funds PRIAC provides investors with the information in thisFact Sheet to assist them in making investment decisions regarding the Fund.Investors must determine whether any other information is necessary in makingthose decisions. The investor is solely responsible for obtaining any other informa-tion required by the investor, which may not be available from PRIAC. The investoris solely responsible for the decision to invest or continue to invest in the Fund.PRIAC assumes no responsibility for any investor’s decision to invest or continue toinvest in the Fund. These Separate Accounts are not part of the Manager ofManager’s program.
Manager-of-Managers Alliance Separate Accounts With respect to separateaccounts designated by Prudential as Alliance Funds under the Manager-of-Managers Program, PRIAC acknowledges it is a fiduciary as defined by ERISASection 3(38), as amended, for the selection and monitoring of Alliance Funds.However, de-selection (or termination of the Alliance Fund on a retirement plan’smenu or portfolio) is the sole responsibility of each retirement plan’s fiduciary.
Manager-of-Managers Institutional Sub-Advised Separate Accounts Withrespect to separate accounts designated by Prudential as Institutional Sub-AdvisedFunds under the Manager-of-Managers Program, PRIAC acknowledges it is a fiduci-ary as defined by ERISA Section 3(38), as amended, for the selection, monitoring,and, if necessary, the replacement of the sub-advisor.
Manager-of-Managers Retail-Branded Sub-Advised Separate AccountsWith respect to separate accounts designated by Prudential as Retail-Branded Sub-Advised Funds under the Manager-of-Managers Program, PRIAC acknowledges it isa fiduciary as defined by ERISA Section 3(38), as amended, for the selection, moni-toring, and if necessary, deselection and/or replacement of the sub-advisor.
Proprietary Funds (Sub-Advised) Proprietary Funds are sub-advised by an affili-ate of PRIAC. Although PRIAC may provide periodic monitoring with respect to cer-tain Proprietary Funds, Proprietary Funds are not part of PRIAC’s Manager-of-Managers Program, and therefore, PRIAC does not assume any responsibility withrespect to the selection, monitoring, or replacement of the sub-advisor. Selection ortermination of the Fund on a retirement plan’s menu is the sole responsibility ofeach retirement plan’s fiduciary.
Separate Account Fund-of-Fund Products These Fund-of-Funds are not part ofthe Manager-of-Managers program, and therefore, PRIAC does not assume anyresponsibility with respect to the selection, monitoring, or replacement of the under-lying investment options. Selection or termination of the Fund on a retirement plan’smenu is the sole responsibility of each retirement plan’s fiduciary.
For More InformationPara hablar con un representante de servicios al cliente en español (u otroslenguajes), por favor, llama a nuestro numero gratuito 800 entre las 8:00 a.m.y las 8:00 p.m., Hora del Este, días de trabajo. (To speak with a Prudential ServiceRepresentative through an interpreter in Spanish (or other languages), please call ourtoll-free number week-days between 8:00 a.m. and 8:00 p.m. Eastern Time.)
3-Year Constant Maturity Treasury(CMT) Index: A set of theoretical securi-ties based on the most recently auctioned“real” securities. Yields on Treasury securi-ties at “constant maturity” are interpolatedby the U.S. Treasury from the daily yieldcurve, which is based on the closing marketbid yields on actively traded Treasury secu-rities in the over-the-counter market.
3-Year Treasury Average Yield: Theaverage daily treasury yield for U.S.Treasury Notes with a maturity of threeyears (negotiable debt obligations of theU.S. Government, considered intermediatein maturity).
5-Year Treasury Average Yield: Theaverage daily treasury yield for U.S.Treasury Notes with a maturity of fiveyears (negotiable debt obligations of theU.S. Government, considered intermediatein maturity).
60% Russell 1000 Growth Index/40%Barclays U.S. Aggregate Bond Index: Anunmanaged, weighted-average compositeconsisting of the Russell 1000® Growth Index(60%) and the Barclays Aggregate BondIndex (40%).
60% Russell 1000 Growth Index/40%Barclays U.S. Intermediate Government/Credit Index: An unmanaged, weighted-average composite consisting of the
Russell 1000 Growth Index (60%) and theBarclays Intermedi-ate U.S. Government/Credit Index (40%).
60% Russell 1000 Value Index/40%Barclays U.S. Aggregate Bond Index: Anunmanaged, weighted-average compositeconsisting of the Russell 1000 Value Index(60%) and the Barclays Aggregate BondIndex (40%).
60% Russell 1000 Value Index/40%Barclays U.S. Intermediate Government/Credit Index: An unmanaged, weighted-average composite consisting of theRussell 1000 Value Index (60%) and theBarclays Intermediate U.S. Government/Credit Index (40%).
60% S&P 500 Index/40% Barclays U.S.Aggregate Bond Index: An unmanaged,weighted-average composite Index that con-sists of the S&P 500 Index (60%) and theBarclays U.S. Aggregate Bond Index (40%).
Barclays Global Aggregate Bond IndexEx-US (USD Hedged): The Barclays GlobalAggregate Ex USD Index provides a broad-based measure of the global investment-grade fixed income markets. The componentsof this index are the Pan- EuropeanAggregate and the Asian-Pacific AggregateIndices. The index also includes Eurodollarand Euro-Yen corporate bonds, Canadiangovernment, agency and corporate securities.
Barclays U.S. Aggregate Bond Index: isa broad-based flagship benchmark thatmeasures the investment grade, US dollar-denominated, fixed-rate taxable bond mar-ket. The index includes Treasuries, govern-ment-related and corporate securities, MBS(agency fixed-rate and hybrid ARM pass-throughs), ABS and CMBS (agency and non-agency).
Barclays U.S. California MunicipalBond Index: Includes investment-grade,tax-exempt, and fixed rate bonds issued inCalifornia. All securities have maturitiesgreater than two years, and are selectedfrom issues larger than $50 million.
Barclays U.S. New York MunicipalBond Index: Includes investment-grade,tax-exempt, and fixed rate bonds issued inNew York. All securities have maturitiesgreater than two years, and are selectedfrom issues larger than $50 million.
Barclays U.S. Corporate High-YieldIndex: Measures the market of USD-denom-inated, non-investment grade, fixed-rate,taxable corporate bonds. Securities are clas-sified as high yield if the middle rating ofMoody’s, Fitch, and S&P is Ba1/BB+/BB+ orbelow, excluding emerging market debt.
Barclays U.S. High Yield Bond Index,2% Issuer Capped: The Barclays U.S. HighYield Bond Index, 2% Issuer Capped is an
issuer-constrained version of the BarclaysU.S. High Yield Index that covers the USDdenominated, non-investment grade, fixed-rate, taxable corporate bond market. The 2%Issuer Capped Index follows the same indexconstruction rules as the uncapped index butlimits issuer exposures to a maximum 2%and redistributes the excess market valueindex-wide on a pro rata basis.
Barclays U.S. Intermediate Government/Credit Index: Measures the performance ofU.S. Dollar denominated U.S. Treasuries,government-related and investment gradeU.S. corporate securities that have a remain-ing maturity of greater than one year andless than ten years.
Barclays U.S. Credit Index: A subset ofthe US Government/Credit Index and the USAggregate Index that comprises the USCorporate Index and a non-corporate compo-nent that includes foreign agencies, sover-eigns, supranationals, and local authorities.
Barclays U.S. Government 1-5 YearIndex: This index includes U.S. Treasury andagency obligations with maturities of 1-5years.
Barclays U.S. Government Bond Index:Is the U.S. Government component of theU.S. Government/ Credit Index. It consists ofsecurities issued by the U.S. Government(i.e., securities in the Treasury and Agency
Benchmark Definitions
37
10
01
011
211

The Fund Fact Sheet User’s Guide 0233352
Indices). This includes public obligations ofthe U.S. Treasury with a remaining maturityof one year or more and publicly issued debtof U.S. Government agencies, quasi-federalcorporations, and corporate or foreign debt.
Barclays U.S. Government/Credit 1-5Year Index: Includes all medium and largerissues of U.S. government, investment-gradecorporate, and investment-grade interna-tional dollar-denominated bonds that havematurities of between 1 and 5 years and arepublicly issued.
Barclays U.S. Government/Credit 5-10Year Index: Includes all medium and largerissues of U.S. government, investment-gradecorporate, and investment-grade interna-tional dollar-denominated bonds that havematurities of between 5 and 10 years andare publicly issued.
Barclays U.S. Government/Credit Index:Is the U.S. Government/Credit component ofthe US Aggregate Index. It is composed of allbonds that are investment grade (rated Baaor higher by Moody’s or BBB or higher byStandard & Poor’s, if unrated by Moody’s).Issues must have at least one year to matu-rity. The index is re-balanced monthly bymarket capitalization. The Government/Credit Index includes securities in theGovernment and Credit Indices.
Barclays U.S. Government Long Index:Includes those funds in the Barclays U.S.Government Index which have a maturity of10 years or more.
Barclays U.S. Long Term Government/Credit Index: Includes bonds in theGovernment and Corporate indices that havematurities of 10 years or longer.
Barclays U.S. Long Term Credit Index:Includes bonds in the Corporate index thathave maturities of 10 years or longer.
Barclays U.S. Mortgage BackedSecurities Index: Covers agency mort-gage-backed pass-through securities (bothfixed-rate and hybrid ARM) issued by GinnieMae (GNMA), Fannie Mae (FNMA), andFreddie Mac (FHLMC).
Barclays U.S. Municipal Index: Coversthe USD-denominated long-term tax exemptbond market. The index has four main sec-tors: state andlocal general obligationbonds, revenue bonds, insured bonds, andprerefunded bonds.
Barclays U.S. Treasury Inflation-Protected Securities (TIPS) Index:Rules based, market value-weighted indexthat tracks inflation-protected securitiesissued by the U.S. Treasury. The U.S. TIPSIndex is a subset of the Global Inflation-Linked Index, with a 38.5% market valueweight in the index.
Barclays U.S. Universal Bond Index:Represents the union of the U.S. AggregateBond Index, U.S. Corporate High-YieldIndex, Investment-Grade 144A Index,Eurodollar Index, U.S. Emerging MarketsIndex, and the non-ERISA eligible portionof the CMBS Index. The index covers USD-denominated, taxable bonds that are ratedeither investment-grade or below invest-ment-grade. Securities are not double-counted in the index.
BofAML 3-Month U.S. Treasury BillIndex: Is comprised of a single issue pur-chased at the beginning of the month andheld for a full month. Each month the indexis rebalanced and the issue selected is theoutstanding Treasury Bill that matures clos-est to, but not beyond 3 months from therebalancing date.
BofAML All Convertibles/All QualitiesIndex: An unmanaged index that measuresthe performance of U.S. dollar-denominatedconvertible securities not currently in bank-ruptcy with a total market value greater than$50 million at issuance.
BofAML High Yield Master II Index: Anunmanaged index that tracks the perform-ance of below-investment-grade, U.S. dollar-denominated corporate bonds publiclyissued in the U.S. domestic market.
Citigroup 3 Month T-Bill Index: An indexwhereby equal dollar amounts of three-month Treasury bills are purchased at thebeginning of each of three consecutivemonths. As each bill matures, all proceedsare rolled over or reinvested in a new three-month bill. The income used to calculate themonthly return is derived by subtracting theoriginal amount invested from the maturityvalue.
Citigroup ESBI-Capped Brady Index:Includes Brady bonds and US dollar-denomi-nated emerging market sovereign debtissued in the global, Yankee, and Eurodollarmarkets excluding loans, and comprises debtin Africa, Asia, Europe, and Latin America.
Citigroup Dollar World Non-U.S.Government Bond Index: A market capi-talization-weighted index, unhedged andstated in U.S. dollar terms. The Index is gen-erally considered to be representative of theworld bond market (ex-U.S.). The minimummaturity for included bonds is one year, andthe minimum credit quality is BBB-/Baa3 byeither S&P or Moody’s.
Custom (Conservative, Moderate,Aggres-sive) Portfolios Benchmarks:These indices are composite benchmarksthat reflect the weighted average of thebenchmarks of the underlying funds in whicheach specific Custom Portfolio invests.
Dow Jones Relative Risk Indices: This isa family of indices, consisting ofConservative, Moderately Conservative,Moderate, Moder-ately Aggressive andAggressive indices. They are designed toallow the evaluation of portfolio returnsbased on the level of risk taken.
Dow Jones Target Date Indices: Anindex family made up of composite indicesrepresenting three major asset classes –stocks, bonds and cash. The indices aredesigned to help investors measure the per-formance of their “lifecycle” portfolios,which tend to start out aggressively to growassets and end with a conservative mix ofinvestments.
Dow Jones-UBS Commodities Index(formerly Dow Jones AIG CommoditiesIndex): This index is composed of futurescontracts on physical commodities traded onU.S. exchanges, with the exception of alu-minum, nickel and zinc, which trade on theLondon Metal Exchange.
Dow Jones U.S. Financials SectorIndex: Measures the performance of thefinancials segment of the U.S. equity market,including banks, insurance, real estate, andfinancial services.
Dow Jones U.S. Healthcare SectorIndex: Measures the performance of thehealthcare sector of the U.S. equity market.The index includes companies in the health-care equipment and services and pharma-ceuticals and biotechnology sectors.
Dow Jones U.S. Select Real EstateInvestment Trust (REIT) Index: A float-adjusted market capitalization weightedindex measures the performance of publicly-traded real estate securities (REITs). Theindex is a sub-set of the Dow JonesAmericas Select RESI and includes onlyREITs and REIT-like securities.
Dow Jones U.S. Select Real EstateSecurities IndexSM (RESI): Representsequity real estate investment trusts (REITs)and real estate operating companies(REOCs) traded in the U.S.
Dow Jones U.S. TelecommunicationsSector Index: Measures the performanceof the telecommunications sector of the U.S.equity market, including fixed line telecom-munications and mobile telecommunica-tions.
Dow Jones U.S. Utilities Sector Index:Measures the performance of the utilitiessector of the U.S. equity market, includingelectricity and gas, water, and multi-utilities.
Dow Jones Wilshire 5000 Total MarketIndex: Represents the broadest index forthe U.S. equity market, measuring the per-formance of all U.S. equity securities withreadily available price data. The indexincludes over 6,000 stocks, and reflects rein-vestment of earnings.
Dow Jones Wilshire REIT Index:Measures the performance of U.S. publiclytraded Real Estate Investment Trusts.
FTSE NAREIT U.S. Real Estate Index: Anunmanaged market capitalization index of alltax-qualified Equity REITS listed on theNYSE, AMEX, and the NASDAQ that have75% or more of their gross invested book ofassets invested directly or indirectly in theequity ownership of real estate. The Fund isnot sponsored, endorsed, sold or promotedby FTSE International Limited (“FTSE”) andFTSE makes no recommendation regardinginvesting in the Fund.
IA SBBI US 30 Day TBill Index: Showsthe growth in value of $100 from 30 day USTreasury bills including gross interest rein-vested.
iMoneyNet Taxable Money FundsIndex: Measures the equally weightedreturns of over 1,600 of the largest taxablemoney market funds.
J.P. Morgan Emerging Markets BondIndex Plus: Tracks total returns for exter-nal-currency-denominated debt instrumentsof the emerging markets: Brady Bonds,loans, Eurobonds. Countries covered areArgentina, Brazil, Bulgaria, Colombia,Ecuador, Egypt, Malaysia, Mexico, Morocco,Nigeria, Panama, Peru, the Philippines,Poland, Russia, South Africa, Turkey,Ukraine, and Venezuela.
JP Morgan GBI Global ex-US Index (USDollar Hedged): Is an index composed ofglobally traded, fixed-rate government bondsof 13 countries. These countries all have liq-uid debt markets, meaning that they are sta-ble, actively traded markets with sufficientscale and regular issuance. Using globallytraded and highly liquid government bondissues, the index provides a measure of mar-ket performance.The Index excludes bondsfrom the US and represents the USD hedgedtotal return index level.
JPM GBI Global Ex US TR Hdg USD:The J.P. Morgan GBI series provides a com-prehensive measure of local currencydenominated fixed rate government debtissued in developed markets. The seriesconsists of five core index products cover-ing developed markets. The broadestseries tracks 27 countries.
Lifetime Funds Custom Benchmarks:These indices are composite benchmarksthat reflect the weighted average of thebenchmarks for the underlying funds inwhich each specific Lifetime Fund invests.
Lipper Balanced Funds Index:Represents the average of the 30 largestqualifying mutual funds (based on year-endtotal net assets) for the investment objective(to conserve principal by maintaining a bal-anced portfolio of stocks and bonds).Typically, the stock/bond ratio ranges around60%/40%.
Lipper Emerging Markets Funds Index:is an equal dollar weighted index of the 30largest qualifying mutual funds in the LipperEmerging Markets universe (based on year-end total net assets).
Lipper Flexible Portfolio Funds Index:Represents the average of the 30 largestqualifying mutual funds in the Lipper FlexiblePortfolio investment objective category(based on year-end total net assets). Themutual funds that comprise the Index allo-cate their investments across various assetclasses, including domestic common stocks,bonds and money market instruments, with afocus on total return.
Lipper Global Funds Index: Representsthe average of the 30 largest qualifyingmutual funds (based on year-end total netassets) for the investment objective (toinvest at least 25% of its portfolio in secu-rities traded outside of the United States).These funds may own U.S. securities aswell.
Lipper High Yield Bond Funds Index:Represents the average of the 30 largestqualifying mutual funds (based on year-endtotal net assets) for the investment objective(to seek a high [relative] current yield fromfixed income securities without regard toquality or maturity restrictions). These fundstend to invest in lower-grade debt issues.
Lipper International Funds Index:Represents the average of the 30 largestqualifying mutual funds (based on year-endtotal net assets) for the investment objec-tive (to invest assets in securities whoseprimary trading markets are outside theUnited States).
Lipper Intermediate Investment GradeIndex: Lipper Intermediate InvestmentGrade Index: Represents the average of the
30 largest qualifying mutual funds (based onyear end total net assets) for the investmentobjective. Funds that invest primarily ininvestment-grade debt issues (rated in thetop four grades) with dollar-weighted aver-age maturities of five to ten years.
Lipper Large-Cap Core Funds Index:Represents the average of the 30 largestqualifying mutual funds (based on year-endtotal net assets) in the Lipper Large-CapUniverse. These funds, by portfolio practice,invest at least 75% of their equity assets incompanies with market capitalizations (on athree-year weighted basis) greater than300% of the dollar-weighted median marketcapitalization of the middle 1,000 securitiesof the S&P SuperComposite 1500 Index.These funds typically have an average price-to-earnings ratio, price-to-book ratio, andthree-year sales-per-share growth value,compared to the S&P 500 Index.
Lipper Large-Cap Growth Funds Index:Represents the average of the 30 largestqualifying mutual funds (based on year-endtotal net assets) in the Lipper Large-CapUniverse. These funds, by portfolio practice,invest at least 75% of their equity assets incompanies with market capitalizations (on athree-year weighted basis) greater than300% of the dollar-weighted median marketcapitalization of the middle 1,000 securitiesof the S&P SuperComposite 1500 Index.These funds typically have an above averageprice-to-earnings ratio, price-to-book ratio,and three-year sales-per-share growthvalue, compared to the S&P 500 Index.
Lipper Large-Cap Value Funds Index:Represents the average of the 30 largestqualifying mutual funds (based on year-endtotal net assets) in the Lipper Large-CapUniverse. These funds, by portfolio practice,invest at least 75% of their equity assets incompanies with market capitalizations (on athree-year weighted basis) greater than300% of the dollar-weighted median marketcapitalization of the middle 1,000 securitiesof the S&P SuperComposite 1500 Index.These funds typically have a below averageprice-to-earnings ratio, price-to-book ratio,and three-year sales-per-share growthvalue, compared to the S&P 500 Index.
Lipper Mid-Cap Core Funds Index:Represents the average of the 30 largestqualifying mutual funds (based on year-endtotal net assets) in the Lipper Mid-CapUniverse. These funds, by portfolio practice,invest at least 75% of their equity assets incompanies with market capitalizations (on athree-year weighted basis) less than 300%of the dollar-weighted median market capi-talization of the middle 1,000 securities ofthe S&P SuperComposite 1500 Index. Thesefunds typically have an average price-to-earnings ratio, price-to-book ratio, and three-year sales-per-share growth value, com-pared to the S&P Midcap 400 Index.
Lipper Mid-Cap Growth Funds Index:Represents the average of the 30 largestqualifying mutual funds (based on year-endtotal net assets) in the Lipper Mid-CapUniverse. These funds, by portfolio practice,invest at least 75% of their equity assets incompanies with market capitalizations (on athree-year weighted basis) less than 300%of the dollar-weighted median market capi-talization of the middle 1,000 securities ofthe S&P SuperComposite 1500 Index. These
funds typically have an above average price-to-earnings ratio, price-to-book ratio, andthree-year sales-per-share growth value,compared to the S&P Midcap 400 Index.
Lipper Mid-Cap Value Funds Index:Represents the average of the 30 largestqualifying mutual funds (based on year-endtotal net assets) in the Lipper Mid-CapUniverse. These funds, by portfolio practice,invest at least 75% of their equity assets incompanies with market capitalizations (on athree-year weighted basis) less than 300%of the dollar-weighted median market capi-talization of the middle 1,000 securities ofthe S&P SuperComposite 1500 Index. Thesefunds typically have a below average price-to-earnings ratio, price-to-book ratio, andthree-year sales-per-share growth value,compared to the S&P Midcap 400 Index.
Lipper Real Estate Funds Index: Anequally weighted index of the 30 largestqualifying mutual funds (based on year-endtotal net assets) in the Lipper Real Estateuniverse. These funds invest at least 65% oftheir portfolios in equity securities of domes-tic and foreign companies engaged in thereal estate industry.
Lipper Science and Technology FundsIndex: Represents the average of the 30largest qualifying mutual funds in the LipperScience and Technology universe (based onyear-end total net assets). These funds, byportfolio practice, invest at least 65% oftheir equity assets in science and technologystocks.
Lipper Small-Cap Core Funds Index:Represents the average of the 30 largestqualifying mutual funds (based on year-endtotal net assets) in the Lipper Small-CapUniverse. These funds, by portfolio practice,invest at least 75% of their equity assets incompanies with market capitalizations (on athree-year weighted basis) less than 250%of the dollar-weighted median of the small-est 500 of the middle 1,000 securities of theS&P SuperComposite 1500 Index. Thesefunds typically have an average price-to-earnings ratio, price-to-book ratio, and three-year sales-per-share growth value, com-pared to the S&P SmallCap 600 Index.
Lipper Small-Cap Growth Funds Index:Represents the average of the 30 largestqualifying mutual funds (based on yearendtotal net assets) in the Lipper Small-CapUniverse. These funds, by portfolio practice,invest at least 75% of their equity assets incompanies with market capitalizations (on athree-year weighted basis) less than 250%of the dollar-weighted median of the small-est 500 of the middle 1,000 securities of theS&P SuperComposite 1500 Index. Thesefunds typically have an above average price-to-earnings ratio, price-to-book ratio, andthree-year sales-per-share growth value,compared to the S&P SmallCap 600 Index.
Lipper Small-Cap Value Funds Index:Represents the average of the 30 largestqualifying mutual funds (based on year-endtotal net assets) in the Lipper Small-CapUniverse. These funds, by portfolio practice,invest at least 75% of their equity assets incompanies with market capitalizations (on athree-year weighted basis) less than 250%of the dollar-weighted median of the small-est 500 of the middle 1,000 securities of theS&P SuperComposite 1500 Index. These
funds typically have a below average price-to-earnings ratio, price-to-book ratio, andthree-year sales-per-share growth value,compared to the S&P SmallCap 600 Index.
Morningstar Technology Sector Index:Tracks the performance of publicly tradedcompanies engaged in the design, develop-ment, and support of computer operatingsystems and applications.
MSCI ACWI Investable Market Index(IMI): Captures large, mid and small caprepresentation across 23 DevelopedMarkets (DM) and 21 Emerging Markets(EM) countries. With 8,498 constituents,the index is comprehensive, coveringapproximately 99% of the global equityinvestment opportunity set.
MSCI All Country Far East Ex. JapanIndex: A free float-adjusted market capi-talization weighted index that is designedto measure the equity market performanceof the Far East, excluding Japan.
MSCI All Country World Ex. U.S. Index:is a free float-adjusted market capitaliza-tion weighted index that is designed tomeasure the equitymarket performance ofdeveloped and emerging markets. As ofDecember 2011 the MSCI ACWI ex-USconsisted of 44 countries comprising 23developed and 21 emerging market countryindices. The developed market countryindices included are: Australia, Austria,Belgium, Canada, Denmark, Finland,France, Germany, Greece, Hong Kong,Ireland, Israel, Italy, Japan, Netherlands,New Zealand, Norway, Portugal,Singapore, Spain, Sweden, Switzerland,the United Kingdom. The emerging marketcountry indices included are: Brazil, Chile,China, Colombia, Czech Republic, Egypt,Hungary, India, Indonesia, Korea,Malaysia, Mexico, Morocco, Peru,Philippines, Poland, Russia, South Africa,Taiwan, Thailand, and Turkey.
MSCI All Country World Ex. U.S.Growth Index: Includes those firms in theMSCI All Country World Ex. U.S. Index withhigher price to book value (P/BV) ratios.
MSCI EAFE Growth Index (net): A mar-ket capitalization-weighted index com-prised of those firms in the MSCI EAFEIndex with higher price/book value (P/BV)ratios relative to their respective MSCIcountry index, and assumes reinvestmentof dividends after withholding tax.
MSCI EAFE Index (net): A market capital-ization-weighted index comprised of com-panies representative of the market struc-ture of 21 developed market countries inEurope, Australia and the Far East. TheMSCI EAFE Index is available both in localcurrency and U.S. dollar terms. The returnsshown in the performance chart are calcu-lated with dividends reinvested and are netof foreign withholding tax.
MSCI EAFE Value Index (net): A marketcapitalization-weighted index comprised ofthose firms in the MSCI EAFE Index withlower price/book value (P/BV) ratios rela-tive to their respective MSCI country index.
MSCI EMF Index (net): A market capital-ization-weighted index comprised of com-panies representative of the market struc-ture of 25 emerging market countries opento foreign investment. The MSCI EMF Index
excludes closed markets and those sharesin otherwise open markets that are notavailable for purchase by foreigners. Thereturns shown in the performance chart arecalculated with dividends reinvested andare net of foreign withholding tax. Theindex is available both in local currencyand U.S. dollar terms.
MSCI EM (Emerging Markets) LatinAmerica Index: Is a free float-adjustedmarket capitalization weighted index thatis designed to measure the equity marketperformance of emerging markets in LatinAmerica.
MSCI Europe Index: Is a free float-adjusted market capitalization weightedindex that is designed to measure the equi-ty market performance of the developedmarkets in Europe (includes 16 countries).
MSCI Japan Index: Measures the per-formance of the Japanese equity market,listed in U.S. dollars, with net dividendsreinvested.
MSCI Metals/Mining Index: Consists ofcompanies conducting business in the alu-minum, diversified metals and mining,gold, precious metals and minerals andsteel industries.
MSCI Pacific Index: A free float-adjust-ed market capitalization-weighted indexthat is designed to measure the equitymarket performance of the developed mar-kets in the Pacific region.
MSCI Pacific Free Index: Same con-stituents as MSCI Pacific Index, the “Free”index captures the history of certain ofthose constituents that were not deemed“developed” in previous years.
MSCI US REIT Index: A free float marketcapitalization weighted index that is com-prised of Equity real estate investmenttrust (REITs) securities that belong to theMSCI US Investable Market 2500 Index.
MSCI World Growth Index (net): A mar-ket capitalization-weighted index com-prised of that half of the MSCI World Indexwith higher price/book value (P/BV) ratiosrelative to their respective MSCI countryindex. The returns shown in the perform-ance chart are calculated with dividendsreinvested and net of foreign withholdingtax.
MSCI World Index: Is a free float-adjust-ed market capitalization weighted indexthat is designed to measure the equitymarket performance of developed markets(includes 24 countries in the NorthAmerica, Europe, and Asia/Pacific region).
MSCI World Ex US Index: Designed toprovide a broad measure of equity perform-ance throughout the world (with the excep-tion of U.S.-based companies) and includesboth developed and emerging markets.
MSCI World Real Estate Index: A sub-index of the MSCI World Index represent-ing only securities in the GICS Real EstateIndustry Group.
MSCI World Small Cap Index: Attemptsto represent the business activities ofsmall cap companies across developedmarkets. MSCI selects the most liquidsecurities relative to their market capital-ization, and targets for index inclusion 40%
The Fund Fact Sheet User’s Guide 0233352
37
10
01
011
21
2

of the full market capitalization of the eligi-ble small cap universe within each industrygroup, within each country.
MSCI World Value Index (net): A marketcapitalization-weighted index comprised ofthat half of the MSCI World Index with lowerprice/book value (P/BV) ratios relative totheir respective MSCI country index.
National Association of Real EstateInvestment Fiduciaries (NCREIF) Open-End Diversified Core Equity Fund Index(NFI-ODCE): This index measures fund per-formance in the private real estate industryby aggregating the performance of a group of14 open-end funds with core investmentstrategies. The component mutual fundsinvest primarily in the major property typeswithin the U.S., with modest leverage.Established in May 2005, the index isreleased on both a gross and net-of-invest-ment- management-fees basis.
NYSE Arca Tech Index: Is comprised of100 listed and over-the-counter securities ofcompanies from different industries that pro-duce or deploy innovative technologies toconduct their business. Industries includecomputer hardware, software, semiconduc-tors, telecommunications, data storage andprocessing, electronics and biotechnology.
PRREF Composite Index: A blendedbenchmark, comprised of the NCREIF Open-End Diversified Core Equity Index (NFI-ODCE), the S&P Developed Property Index,and the Citigroup U.S. Domestic 3-Month T-Bill Total Return Index, weighted to reflectthe investment allocations of the PrudentialRetirement Real Estate Fund.
Prudential/Lazard LifeStyle FundsCustom Benchmarks: Composite bench-marks that reflect the weighted average ofthe benchmarks for the underlying funds inwhich each Prudential/Lazard LifeStyle Fundinvests.
Retirement Goal Custom Benchmarks:These indices are composite benchmarksthat reflect the weighted average of thebenchmarks of the underlying funds in whicheach specific Retirement Goal Fund invests.
Russell 1000® Growth Index: A marketcapitalization-weighted index that measuresthe performance of those Russell 1000 com-panies with higher price-to-book ratios andhigher forecasted growth rates.
Russell 1000® Index: A market capitaliza-tion-weighted index that measures the per-formance of the 1,000 largest companies inthe Russell 3000® Index, which representsapproximately 92% of the total market capi-talization of the Russell 3000 Index.
Russell 1000® Value Index: A market cap-italization-weighted index that measures theperformance of those Russell 1000 compa-nies with lower price-to-book ratios andlower forecasted growth rates.
Russell 2000® Growth Index: A marketcapitalization-weighted index that measuresthe performance of those Russell 2000 com-panies with higher price-to-book ratios andhigher forecasted growth rates.
Russell 2000® Index: A market capitaliza-tion-weighted index that measures the per-formance of the 2,000 smallest companies inthe Russell 3000® Index, which represents
approximately 8% of the total market capi-talization of the Russell 3000 Index.
Russell 2000® Value Index: A market cap-italization-weighted index that measures theperformance of those Russell 2000 compa-nies with lower price-to-book ratios andlower forecasted growth rates.
Russell 2500® Growth Index: A marketcapitalization-weighted index that measuresthe performance of those Russell 2500 com-panies with higher price-to-book ratios andhigher forecasted growth rates.
Russell 2500® Index: A market capitaliza-tion-weighted index that measures the per-formance of the 2,500 smallest companies inthe Russell 3000 Index.
Russell 2500® Value Index: A market cap-italization-weighted index that measures theperformance of those Russell 2500 compa-nies with lower price-to-book ratios andlower forecasted growth rates.
Russell 3000 Growth Index: A market cap-italization-weighted index that measures theperformance of those Russell 3000 compa-nies with higher price-to-book ratios andhigher forecasted growth rates.
Russell 3000 Value Index: A market capi-talization-weighted index that measures theperformance of those Russell 3000 Indexcompanies with lower price-to-book ratiosand lower forecasted growth rates. Thestocks in this index are also members ofeither the Russell 1000 Value or the Russell2000 Value indexes.
Russell 3000® Index: A market capitaliza-tion-weighted index that measures the per-formance of the 3,000 largest U.S. compa-nies based on total market capitalization,which represents approximately 98% of theinvestable U.S. equity market.
Russell Greater China Index: A regionalindex covering both developed and emergingmarkets in China, Hong Kong and Taiwan.
Russell Midcap® Growth Index: A marketcapitalization-weighted index that measuresthe performance of those Russell Midcapcompanies with higher price-to-book ratiosand higher forecasted growth rates. Thestocks are also members of the Russell1000® Growth Index.
Russell Midcap® Index: A market capital-ization-weighted index that measures theperformance of the 800 smallest companiesin the Russell 1000® Index, which representapproximately 30% of the total market capi-talization of the Russell 1000 Index.
Russell Midcap® Value Index: A marketcapitalization-weighted index that measuresthe performance of those Russell Midcapcompanies with lower price-to-book ratiosand lower forecasted growth rates. Thestocks are also members of the Russell1000® Value Index.
S&P 1500 Consumer DiscretionaryIndex: This is an unmanaged capitalization-weighted index comprising companies in theConsumer Discretionary sector as deter-mined by S&P. Total returns for the indexinclude the reinvestment of dividends andcapital gain distributions, but do not reflectthe costs of managing a mutual fund.
S&P 1500 Energy Index: This is an unman-aged capitalization-weighted index compris-ing companies in the Energy sector as deter-mined by S&P. Total returns for the indexinclude the reinvestment of dividends andcapital gain distributions, but do not reflectthe costs of managing a mutual fund.
S&P 1500 Industrials Index: This is anunmanaged capitalization-weighted indexcomprising companies in the Industrials sec-tor as determined by S&P. Total returns forthe index include the reinvestment of divi-dends and capital gain distributions begin-ning on January 1, 2002. Index returns withreinvested dividends and distributions areunavailable prior to that date. Total returnsfor the indices include the reinvestment ofdividends and capital gain distributions, butdo not reflect the costs of managing a mutualfund.
S&P 500® Index: Unmanaged index withover US $5.58 trillion benchmarked (indexassets comprising approximately US $1.31trillion of this total) that includes 500 leadingcompanies in leading industries of the U.S.economy, capturing 75% coverage of U.S.equities.
S&P 500 Technology Index: Standard &Poor’s offers sector indices on the S&P 500based upon the Global Industry ClassificationStandard (GICS®). This standard is jointlyowned by Standard & Poor’s and MSCI. Eachstock is classified into one of 10 sectors, 24industry groups, 64 industries and 139 sub-industries according to their largestsource ofrevenue. Standard & Poor’s and MSCI jointlydetermine all classifications. The 10 sectorsare Consumer Discretionary, ConsumerStaples, Energy, Financials, Health Care,Industrials, Information Technology,Materials, Telecommunication Services andUtilities. These indices are calculated usingthe same guiding principles that apply to allStandard & Poor’s indices.
S&P 500 Value Index: A style index result-ing from the division of the parent index (S&P500), whose stocks are measured using threefactors: book value to price ratio, earnings toprice ratio, and sales to price ratio.
S&P Completion Index: Is a sub-index ofthe S&P Total Market Index, including allstocks eligible for the S&P TMI and exclud-ing all current constituents of the S&P 500®.The index covers approximately 4,000 con-stituents, offering investors broad exposureto mid, small, and micro cap companies.Since it follows the same construction guide-lines and free float methodology as the S&P500, they seamlessly integrate and move insync without overlapping constituents.
S&P Composite 1500® Index: Combiningthe S&P 500®, S&P MidCap 400® and S&PSmallCap 600® indices is an efficient way tocreate a broad market portfolio representingabout 85% of U.S. equities. This combinationaddresses the needs of investors wantingbroader exposure beyond the S&P 500®.
S&P Developed Property Index: Aninvestable index including approximately400 stocks from 22 countries. The Index isa sub-index of the S&P Global PropertyIndex, which defines and measures theinvestable universe of publicly traded prop-erty companies.
S&P MidCap 400 Index: Includes 400 com-panies, and represents about 7% of the U.S.equities market. To be eligible for addition tothe index, companies must have a marketcapitalization between US $1 billion and US$4.4 billion.
S&P North American NaturalResources Sector Index: Modified-capi-talization weighted index which representsUS traded securities across the GICS classi-fication sector for Natural Resources that arecurrent members of the S&P Total MarketIndex or the S&P/TSX Composite Index. Eachstock is capped at 7.5%.
S&P Small Cap 600 Index: Includes 600companies and represents about 3% of theU.S. equities market. To be eligible for addi-tion to the index, companies must have amarket capitalization between US $300 mil-lion and US $1.4 billion.
S&P Total Market Index: Is a combinationof the S&P 500® and the S&P CompletionIndex, and offers broad exposure to large,mid, small, and micro cap companies. S&PTotal Market Index includes all commonequities listed on the NYSE (including NYSEArca), the NYSE Alternext, the NASDAQGlobal Select Market, the NASDAQ GlobalMarket and the NASDAQ Capital Market.
The Morningstar Lifetime ModerateIndices: This series of indices representsportfolios of global equities, bonds and tradi-tional inflation hedges such as commoditiesand TIPS. The portfolios are held in propor-tions appropriate for U.S. investors whoexpect to retire during the indicated year.The Moderate risk profile is for investorswho are comfortable with average exposureto equity market volatility.
The Morningstar Target Risk Index fam-ily: Designed to meet the benchmarkingneeds of target risk investors by offering anobjective yardstick for performance compari-son. The family consists of five indexes cov-ering equity risk preferences ranging fromaggressive to conservative.
U.S. Treasury 6 Month Certificate ofDeposit (CD) Index: The average of thesecondary market interest rates for national-ly traded 6 month certificates of deposit.
U.S. Treasury T-Bill Auction Average 3-Month Index: Value is derived from the pastmonth’s weekly Treasury Bill auction rateaverages.
Vanguard Balanced Composite Index:Made up of two unmanaged benchmarks,weighted 60% Dow Jones Wilshire 5000Index and 40% Barclays U.S. AggregateBond Index through May 31, 2005; 60%MSCI U.S. Broad Market Index and 40%Barclays U.S. Aggregate Bond Index there-after.
Wellington Composite Index: is a combi-nation of unmanaged industry benchmarks:65% S&P 500 Index and 35% Barclays CreditA or Better Index. Prior to March 1, 2000,weighted 65% S&P 500 Index and 35%Barclays Long Credit AA or Better Index.
The Fund Fact Sheet User’s Guide 0233352
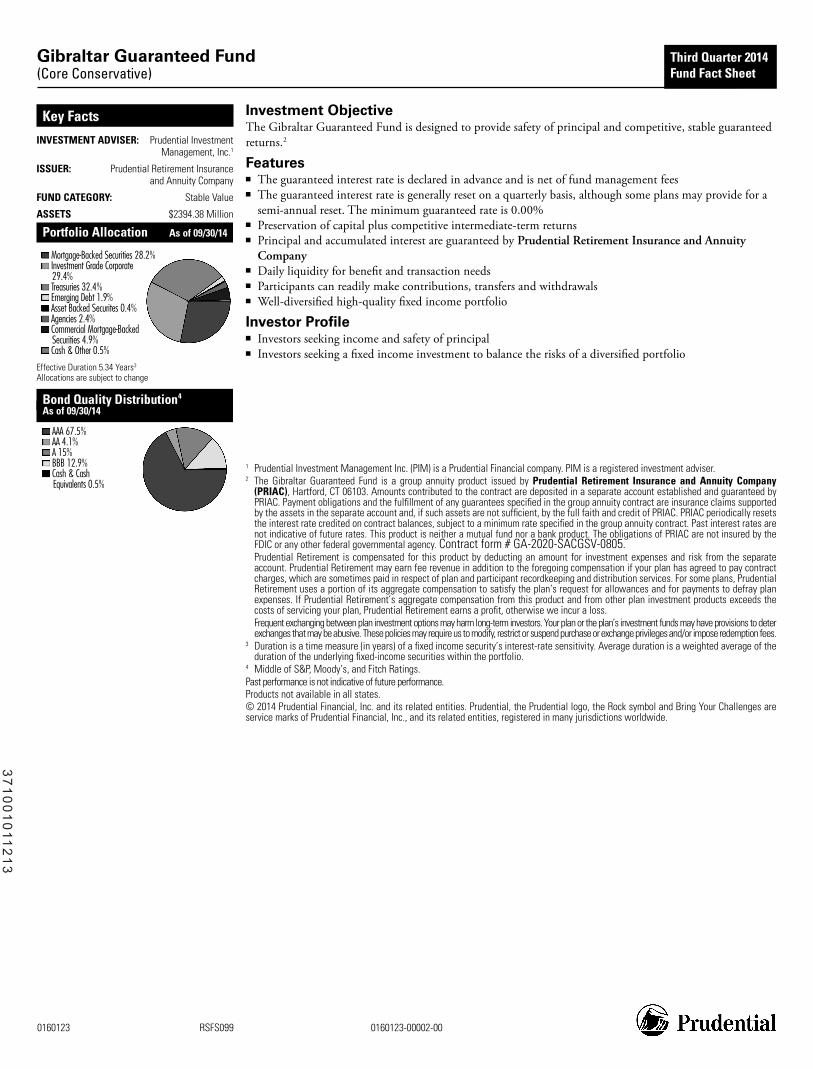
Gibraltar Guaranteed Fund (Core Conservative)
0160123 RSFS099 0160123-00002-00
Third Quarter 2014 Fund Fact Sheet
Investment Objective The Gibraltar Guaranteed Fund is designed to provide safety of principal and competitive, stable guaranteed returns.2
Features ■ The guaranteed interest rate is declared in advance and is net of fund management fees ■ The guaranteed interest rate is generally reset on a quarterly basis, although some plans may provide for a
semi-annual reset. The minimum guaranteed rate is 0.00% ■ Preservation of capital plus competitive intermediate-term returns ■ Principal and accumulated interest are guaranteed by Prudential Retirement Insurance and Annuity
Company ■ Daily liquidity for benefit and transaction needs ■ Participants can readily make contributions, transfers and withdrawals ■ Well-diversified high-quality fixed income portfolio
Investor Profile ■ Investors seeking income and safety of principal ■ Investors seeking a fixed income investment to balance the risks of a diversified portfolio
1 Prudential Investment Management Inc. (PIM) is a Prudential Financial company. PIM is a registered investment adviser. 2 The Gibraltar Guaranteed Fund is a group annuity product issued by Prudential Retirement Insurance and Annuity Company
(PRIAC), Hartford, CT 06103. Amounts contributed to the contract are deposited in a separate account established and guaranteed by PRIAC. Payment obligations and the fulfillment of any guarantees specified in the group annuity contract are insurance claims supported by the assets in the separate account and, if such assets are not sufficient, by the full faith and credit of PRIAC. PRIAC periodically resets the interest rate credited on contract balances, subject to a minimum rate specified in the group annuity contract. Past interest rates are not indicative of future rates. This product is neither a mutual fund nor a bank product. The obligations of PRIAC are not insured by the FDIC or any other federal governmental agency. Contract form # GA-2020-SACGSV-0805.
Prudential Retirement is compensated for this product by deducting an amount for investment expenses and risk from the separate account. Prudential Retirement may earn fee revenue in addition to the foregoing compensation if your plan has agreed to pay contract charges, which are sometimes paid in respect of plan and participant recordkeeping and distribution services. For some plans, Prudential Retirement uses a portion of its aggregate compensation to satisfy the plan’s request for allowances and for payments to defray plan expenses. If Prudential Retirement’s aggregate compensation from this product and from other plan investment products exceeds the costs of servicing your plan, Prudential Retirement earns a profit, otherwise we incur a loss.
Frequent exchanging between plan investment options may harm long-term investors. Your plan or the plan’s investment funds may have provisions to deter exchanges that may be abusive. These policies may require us to modify, restrict or suspend purchase or exchange privileges and/or impose redemption fees.
3 Duration is a time measure (in years) of a fixed income security’s interest-rate sensitivity. Average duration is a weighted average of the duration of the underlying fixed-income securities within the portfolio.
4 Middle of S&P, Moody’s, and Fitch Ratings. Past performance is not indicative of future performance. Products not available in all states. © 2014 Prudential Financial, Inc. and its related entities. Prudential, the Prudential logo, the Rock symbol and Bring Your Challenges are service marks of Prudential Financial, Inc., and its related entities, registered in many jurisdictions worldwide.
Key Facts
INVESTMENT ADVISER: Prudential Investment Management, Inc.1
ISSUER: Prudential Retirement Insurance and Annuity Company
FUND CATEGORY: Stable Value
ASSETS $2394.38 Million
Portfolio Allocation As of 09/30/14
Mortgage-Backed Securities 28.2% Investment Grade Corporate 29.4%
Treasuries 32.4% Emerging Debt 1.9% Asset Backed Securites 0.4% Agencies 2.4% Commercial Mortgage-Backed Securities 4.9%
Cash & Other 0.5%
Effective Duration 5.34 Years3
Allocations are subject to change
Bond Quality Distribution4
As of 09/30/14
AAA 67.5% AA 4.1% A 15% BBB 12.9% Cash & Cash Equivalents 0.5%
37
10
01
011
21
3
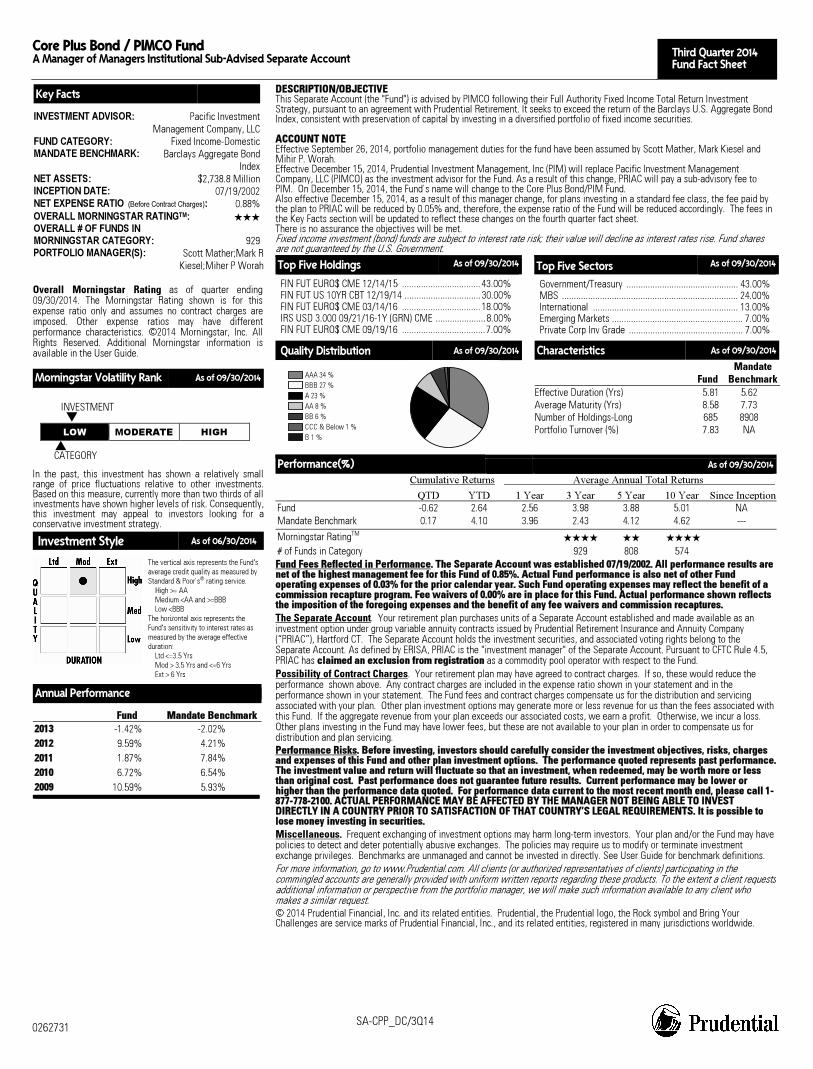
Core Plus Bond / PIMCO Fund A Manager of Managers Institutional Sub-Advised Separate Account Third Quarter 2014
Fund Fact Sheet
0262731 SA-CPP_DC/3Q14
Key Facts
INVESTMENT ADVISOR: Pacific Investment Management Company, LLC
FUND CATEGORY: Fixed Income-DomesticMANDATE BENCHMARK: Barclays Aggregate Bond
IndexNET ASSETS: $2,738.8 MillionINCEPTION DATE: 07/19/2002NET EXPENSE RATIO (Before Contract Charges): 0.88%OVERALL MORNINGSTAR RATINGTM: ��� OVERALL # OF FUNDS IN MORNINGSTAR CATEGORY: 929PORTFOLIO MANAGER(S): Scott Mather;Mark R
Kiesel;Miher P Worah
Overall Morningstar Rating as of quarter ending09/30/2014. The Morningstar Rating shown is for thisexpense ratio only and assumes no contract charges areimposed. Other expense ratios may have differentperformance characteristics. ©2014 Morningstar, Inc. AllRights Reserved. Additional Morningstar information isavailable in the User Guide.
Morningstar Volatility Rank As of 09/30/2014
INVESTMENT �
LOW MODERATE HIGH � CATEGORY
In the past, this investment has shown a relatively small range of price fluctuations relative to other investments.Based on this measure, currently more than two thirds of allinvestments have shown higher levels of risk. Consequently,this investment may appeal to investors looking for aconservative investment strategy.
Investment Style As of 06/30/2014
The vertical axis represents the Fund's average credit quality as measured by Standard & Poor’s® rating service. High >= AA Medium <AA and >=BBB Low <BBB The horizontal axis represents the Fund's sensitivity to interest rates as measured by the average effective duration: Ltd <=3.5 Yrs Mod > 3.5 Yrs and <=6 Yrs Ext > 6 Yrs
Annual Performance
FFuunndd MMaannddaattee BBeenncchhmmaarrkk 22001133 -1.42% -2.02%22001122 9.59% 4.21%22001111 1.87% 7.84%22001100 6.72% 6.54%22000099 10.59% 5.93%
DDEESSCCRRIIPPTTIIOONN//OOBBJJEECCTTIIVVEEThis Separate Account (the "Fund") is advised by PIMCO following their Full Authority Fixed Income Total Return Investment Strategy, pursuant to an agreement with Prudential Retirement. It seeks to exceed the return of the Barclays U.S. Aggregate Bond Index, consistent with preservation of capital by investing in a diversified portfolio of fixed income securities. AACCCCOOUUNNTT NNOOTTEE Effective September 26, 2014, portfolio management duties for the fund have been assumed by Scott Mather, Mark Kiesel and Mihir P. Worah. Effective December 15, 2014, Prudential Investment Management, Inc (PIM) will replace Pacific Investment Management Company, LLC (PIMCO) as the investment advisor for the Fund. As a result of this change, PRIAC will pay a sub-advisory fee to PIM. On December 15, 2014, the Fund’s name will change to the Core Plus Bond/PIM Fund. Also effective December 15, 2014, as a result of this manager change, for plans investing in a standard fee class, the fee paid by the plan to PRIAC will be reduced by 0.05% and, therefore, the expense ratio of the Fund will be reduced accordingly. The fees in the Key Facts section will be updated to reflect these changes on the fourth quarter fact sheet. There is no assurance the objectives will be met. Fixed income investment (bond) funds are subject to interest rate risk; their value will decline as interest rates rise. Fund shares are not guaranteed by the U.S. Government.
Top Five Holdings As of 09/30/2014
FIN FUT EURO$ CME 12/14/15 .................................43.00% FIN FUT US 10YR CBT 12/19/14 ................................30.00% FIN FUT EURO$ CME 03/14/16 .................................18.00% IRS USD 3.000 09/21/16-1Y (GRN) CME .....................8.00% FIN FUT EURO$ CME 09/19/16 ...................................7.00%
Top Five Sectors As of 09/30/2014
Government/Treasury ............................................... 43.00% MBS .......................................................................... 24.00% International ............................................................. 13.00% Emerging Markets ....................................................... 7.00% Private Corp Inv Grade ................................................ 7.00%
Quality Distribution As of 09/30/2014
AAA 34 %BBB 27 %A 23 %AA 8 %BB 6 %CCC & Below 1 %B 1 %
Characteristics As of 09/30/2014
Fund Mandate
BenchmarkEffective Duration (Yrs) 5.81 5.62 Average Maturity (Yrs) 8.58 7.73 Number of Holdings-Long 685 8908 Portfolio Turnover (%) 7.83 NA
Performance(%) As of 09/30/2014
Cumulative Returns Average Annual Total Returns QTD YTD 1 Year 3 Year 5 Year 10 Year Since Inception
Fund -0.62 2.64 2.56 3.98 3.88 5.01 NA Mandate Benchmark 0.17 4.10 3.96 2.43 4.12 4.62 ---
Morningstar RatingTM ���� �� ����
# of Funds in Category 929 808 574
FFuunndd FFeeeess RReefflleecctteedd iinn PPeerrffoorrmmaannccee.. TThhee SSeeppaarraattee AAccccoouunntt wwaass eessttaabblliisshheedd 0077//1199//22000022.. AAllll ppeerrffoorrmmaannccee rreessuullttss aarree nneett ooff tthhee hhiigghheesstt mmaannaaggeemmeenntt ffeeee ffoorr tthhiiss FFuunndd ooff 00..8855%%.. AAccttuuaall FFuunndd ppeerrffoorrmmaannccee iiss aallssoo nneett ooff ootthheerr FFuunndd ooppeerraattiinngg eexxppeennsseess ooff 00..0033%% ffoorr tthhee pprriioorr ccaalleennddaarr yyeeaarr.. SSuucchh FFuunndd ooppeerraattiinngg eexxppeennsseess mmaayy rreefflleecctt tthhee bbeenneeffiitt ooff aa ccoommmmiissssiioonn rreeccaappttuurree pprrooggrraamm.. FFeeee wwaaiivveerrss ooff 00..0000%% aarree iinn ppllaaccee ffoorr tthhiiss FFuunndd.. AAccttuuaall ppeerrffoorrmmaannccee sshhoowwnn rreefflleeccttss tthhee iimmppoossiittiioonn ooff tthhee ffoorreeggooiinngg eexxppeennsseess aanndd tthhee bbeenneeffiitt ooff aannyy ffeeee wwaaiivveerrss aanndd ccoommmmiissssiioonn rreeccaappttuurreess.. The Separate Account. Your retirement plan purchases units of a Separate Account established and made available as an investment option under group variable annuity contracts issued by Prudential Retirement Insurance and Annuity Company (“PRIAC”), Hartford CT. The Separate Account holds the investment securities, and associated voting rights belong to the Separate Account. As defined by ERISA, PRIAC is the "investment manager" of the Separate Account. Pursuant to CFTC Rule 4.5, PRIAC has ccllaaiimmeedd aann eexxcclluussiioonn ffrroomm rreeggiissttrraattiioonn as a commodity pool operator with respect to the Fund. Possibility of Contract Charges. Your retirement plan may have agreed to contract charges. If so, these would reduce the performance shown above. Any contract charges are included in the expense ratio shown in your statement and in the performance shown in your statement. The Fund fees and contract charges compensate us for the distribution and servicing associated with your plan. Other plan investment options may generate more or less revenue for us than the fees associated with this Fund. If the aggregate revenue from your plan exceeds our associated costs, we earn a profit. Otherwise, we incur a loss. Other plans investing in the Fund may have lower fees, but these are not available to your plan in order to compensate us for distribution and plan servicing. PPeerrffoorrmmaannccee RRiisskkss.. BBeeffoorree iinnvveessttiinngg,, iinnvveessttoorrss sshhoouulldd ccaarreeffuullllyy ccoonnssiiddeerr tthhee iinnvveessttmmeenntt oobbjjeeccttiivveess,, rriisskkss,, cchhaarrggeess aanndd eexxppeennsseess ooff tthhiiss FFuunndd aanndd ootthheerr ppllaann iinnvveessttmmeenntt ooppttiioonnss.. TThhee ppeerrffoorrmmaannccee qquuootteedd rreepprreesseennttss ppaasstt ppeerrffoorrmmaannccee.. TThhee iinnvveessttmmeenntt vvaalluuee aanndd rreettuurrnn wwiillll fflluuccttuuaattee ssoo tthhaatt aann iinnvveessttmmeenntt,, wwhheenn rreeddeeeemmeedd,, mmaayy bbee wwoorrtthh mmoorree oorr lleessss tthhaann oorriiggiinnaall ccoosstt.. PPaasstt ppeerrffoorrmmaannccee ddooeess nnoott gguuaarraanntteeee ffuuttuurree rreessuullttss.. CCuurrrreenntt ppeerrffoorrmmaannccee mmaayy bbee lloowweerr oorr hhiigghheerr tthhaann tthhee ppeerrffoorrmmaannccee ddaattaa qquuootteedd.. FFoorr ppeerrffoorrmmaannccee ddaattaa ccuurrrreenntt ttoo tthhee mmoosstt rreecceenntt mmoonntthh eenndd,, pplleeaassee ccaallll 11--887777--777788--22110000.. AACCTTUUAALL PPEERRFFOORRMMAANNCCEE MMAAYY BBEE AAFFFFEECCTTEEDD BBYY TTHHEE MMAANNAAGGEERR NNOOTT BBEEIINNGG AABBLLEE TTOO IINNVVEESSTT DDIIRREECCTTLLYY IINN AA CCOOUUNNTTRRYY PPRRIIOORR TTOO SSAATTIISSFFAACCTTIIOONN OOFF TTHHAATT CCOOUUNNTTRRYY’’SS LLEEGGAALL RREEQQUUIIRREEMMEENNTTSS.. IItt iiss ppoossssiibbllee ttoo lloossee mmoonneeyy iinnvveessttiinngg iinn sseeccuurriittiieess..
Miscellaneous. Frequent exchanging of investment options may harm long-term investors. Your plan and/or the Fund may have policies to detect and deter potentially abusive exchanges. The policies may require us to modify or terminate investment exchange privileges. Benchmarks are unmanaged and cannot be invested in directly. See User Guide for benchmark definitions. For more information, go to www.Prudential.com. All clients (or authorized representatives of clients) participating in the commingled accounts are generally provided with uniform written reports regarding these products. To the extent a client requests additional information or perspective from the portfolio manager, we will make such information available to any client who makes a similar request.© 2014 Prudential Financial, Inc. and its related entities. Prudential, the Prudential logo, the Rock symbol and Bring Your Challenges are service marks of Prudential Financial, Inc., and its related entities, registered in many jurisdictions worldwide.
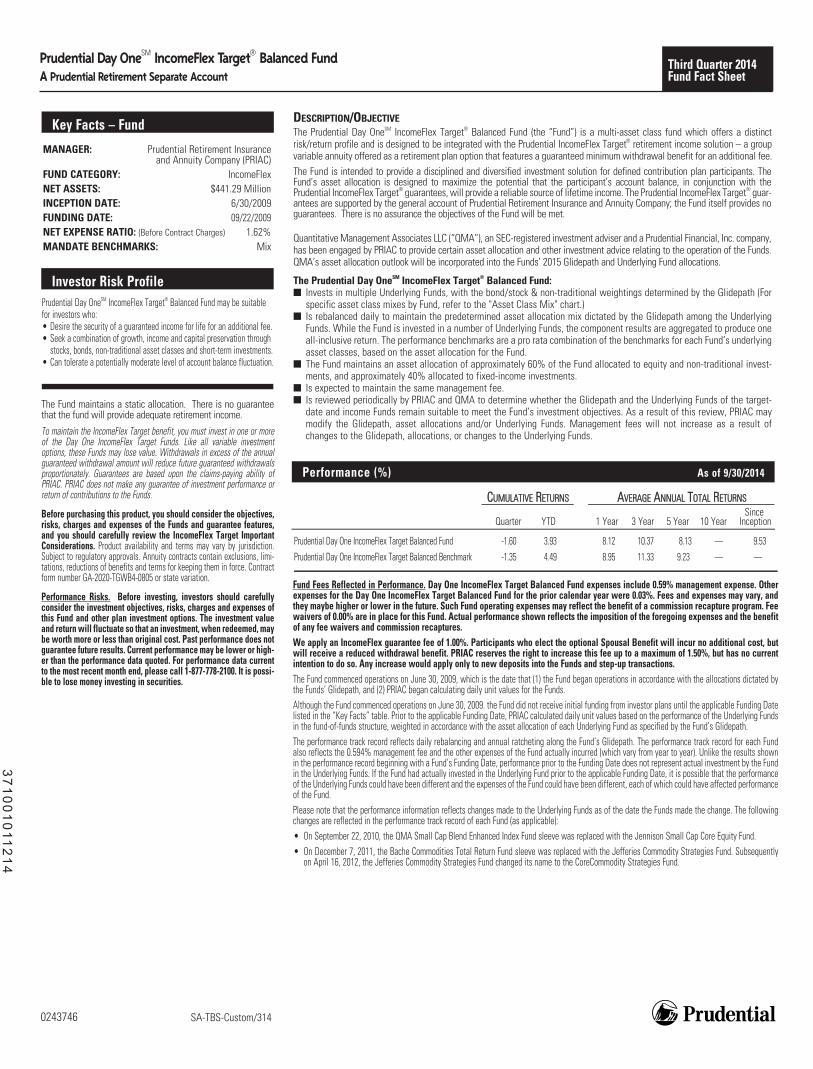
Prudential Day OneSM IncomeFlex Target® Balanced FundA Prudential Retirement Separate Account
Key Facts – Fund
MANAGER: Prudential Retirement Insuranceand Annuity Company (PRIAC)
FUND CATEGORY: IncomeFlexNET ASSETS: $441.29 Million INCEPTION DATE: 6/30/2009FUNDING DATE: 09/22/2009NET EXPENSE RATIO: (Before Contract Charges) 1.62% MANDATE BENCHMARKS: Mix
Third Quarter 2014 Fund Fact Sheet
SA-TBS-Custom/314
DESCRIPTION/OBJECTIVEThe Prudential Day OneSM IncomeFlex Target® Balanced Fund (the “Fund”) is a multi-asset class fund which offers a distinctrisk/return profile and is designed to be integrated with the Prudential IncomeFlex Target® retirement income solution – a groupvariable annuity offered as a retirement plan option that features a guaranteed minimum withdrawal benefit for an additional fee. The Fund is intended to provide a disciplined and diversified investment solution for defined contribution plan participants. TheFund’s asset allocation is designed to maximize the potential that the participant’s account balance, in conjunction with thePrudential IncomeFlex Target® guarantees, will provide a reliable source of lifetime income. The Prudential IncomeFlex Target® guar-antees are supported by the general account of Prudential Retirement Insurance and Annuity Company; the Fund itself provides noguarantees. There is no assurance the objectives of the Fund will be met.
Quantitative Management Associates LLC (“QMA”), an SEC-registered investment adviser and a Prudential Financial, Inc. company,has been engaged by PRIAC to provide certain asset allocation and other investment advice relating to the operation of the Funds.QMA’s asset allocation outlook will be incorporated into the Funds’ 2015 Glidepath and Underlying Fund allocations.
The Prudential Day OneSM IncomeFlex Target® Balanced Fund:� Invests in multiple Underlying Funds, with the bond/stock & non-traditional weightings determined by the Glidepath (For
specific asset class mixes by Fund, refer to the "Asset Class Mix" chart.)� Is rebalanced daily to maintain the predetermined asset allocation mix dictated by the Glidepath among the Underlying
Funds. While the Fund is invested in a number of Underlying Funds, the component results are aggregated to produce oneall-inclusive return. The performance benchmarks are a pro rata combination of the benchmarks for each Fund’s underlyingasset classes, based on the asset allocation for the Fund.
� The Fund maintains an asset allocation of approximately 60% of the Fund allocated to equity and non-traditional invest-ments, and approximately 40% allocated to fixed-income investments.
� Is expected to maintain the same management fee. � Is reviewed periodically by PRIAC and QMA to determine whether the Glidepath and the Underlying Funds of the target-
date and income Funds remain suitable to meet the Fund’s investment objectives. As a result of this review, PRIAC maymodify the Glidepath, asset allocations and/or Underlying Funds. Management fees will not increase as a result ofchanges to the Glidepath, allocations, or changes to the Underlying Funds.
0243746
Investor Risk ProfilePrudential Day OneSM IncomeFlex Target® Balanced Fund may be suitablefor investors who:• Desire the security of a guaranteed income for life for an additional fee.• Seek a combination of growth, income and capital preservation through
stocks, bonds, non-traditional asset classes and short-term investments.• Can tolerate a potentially moderate level of account balance fluctuation.
Fund Fees Reflected in Performance. Day One IncomeFlex Target Balanced Fund expenses include 0.59% management expense. Otherexpenses for the Day One IncomeFlex Target Balanced Fund for the prior calendar year were 0.03%. Fees and expenses may vary, andthey maybe higher or lower in the future. Such Fund operating expenses may reflect the benefit of a commission recapture program. Feewaivers of 0.00% are in place for this Fund. Actual performance shown reflects the imposition of the foregoing expenses and the benefitof any fee waivers and commission recaptures. We apply an IncomeFlex guarantee fee of 1.00%. Participants who elect the optional Spousal Benefit will incur no additional cost, butwill receive a reduced withdrawal benefit. PRIAC reserves the right to increase this fee up to a maximum of 1.50%, but has no currentintention to do so. Any increase would apply only to new deposits into the Funds and step-up transactions.The Fund commenced operations on June 30, 2009, which is the date that (1) the Fund began operations in accordance with the allocations dictated bythe Funds’ Glidepath, and (2) PRIAC began calculating daily unit values for the Funds. Although the Fund commenced operations on June 30, 2009. the Fund did not receive initial funding from investor plans until the applicable Funding Datelisted in the “Key Facts” table. Prior to the applicable Funding Date, PRIAC calculated daily unit values based on the performance of the Underlying Fundsin the fund-of-funds structure, weighted in accordance with the asset allocation of each Underlying Fund as specified by the Fund’s Glidepath. The performance track record reflects daily rebalancing and annual ratcheting along the Fund’s Glidepath. The performance track record for each Fundalso reflects the 0.594% management fee and the other expenses of the Fund actually incurred (which vary from year to year). Unlike the results shownin the performance record beginning with a Fund’s Funding Date, performance prior to the Funding Date does not represent actual investment by the Fundin the Underlying Funds. If the Fund had actually invested in the Underlying Fund prior to the applicable Funding Date, it is possible that the performanceof the Underlying Funds could have been different and the expenses of the Fund could have been different, each of which could have affected performanceof the Fund. Please note that the performance information reflects changes made to the Underlying Funds as of the date the Funds made the change. The followingchanges are reflected in the performance track record of each Fund (as applicable):• On September 22, 2010, the QMA Small Cap Blend Enhanced Index Fund sleeve was replaced with the Jennison Small Cap Core Equity Fund. • On December 7, 2011, the Bache Commodities Total Return Fund sleeve was replaced with the Jefferies Commodity Strategies Fund. Subsequently
on April 16, 2012, the Jefferies Commodity Strategies Fund changed its name to the CoreCommodity Strategies Fund.
The Fund maintains a static allocation. There is no guaranteethat the fund will provide adequate retirement income.
To maintain the IncomeFlex Target benefit, you must invest in one or moreof the Day One IncomeFlex Target Funds. Like all variable investmentoptions, these Funds may lose value. Withdrawals in excess of the annualguaranteed withdrawal amount will reduce future guaranteed withdrawalsproportionately. Guarantees are based upon the claims-paying ability ofPRIAC. PRIAC does not make any guarantee of investment performance orreturn of contributions to the Funds.
Before purchasing this product, you should consider the objectives,risks, charges and expenses of the Funds and guarantee features,and you should carefully review the IncomeFlex Target ImportantConsiderations. Product availability and terms may vary by jurisdiction.Subject to regulatory approvals. Annuity contracts contain exclusions, limi-tations, reductions of benefits and terms for keeping them in force. Contractform number GA-2020-TGWB4-0805 or state variation.
Performance Risks. Before investing, investors should carefullyconsider the investment objectives, risks, charges and expenses ofthis Fund and other plan investment options. The investment valueand return will fluctuate so that an investment, when redeemed, maybe worth more or less than original cost. Past performance does notguarantee future results. Current performance may be lower or high-er than the performance data quoted. For performance data currentto the most recent month end, please call 1-877-778-2100. It is possi-ble to lose money investing in securities.
Performance (%) As of 9/30/2014
CCUUMMUULLAATTIIVVEE RREETTUURRNNSS AAVVEERRAAGGEE AANNNNUUAALL TTOOTTAALL RREETTUURRNNSS Since Quarter YTD 1 Year 3 Year 5 Year 10 Year Inception
Prudential Day One IncomeFlex Target Balanced Fund -1.60 3.93 8.12 10.37 8.13 — 9.53
Prudential Day One IncomeFlex Target Balanced Benchmark -1.35 4.49 8.95 11.33 9.23 — —
37
10
01
011
21
4
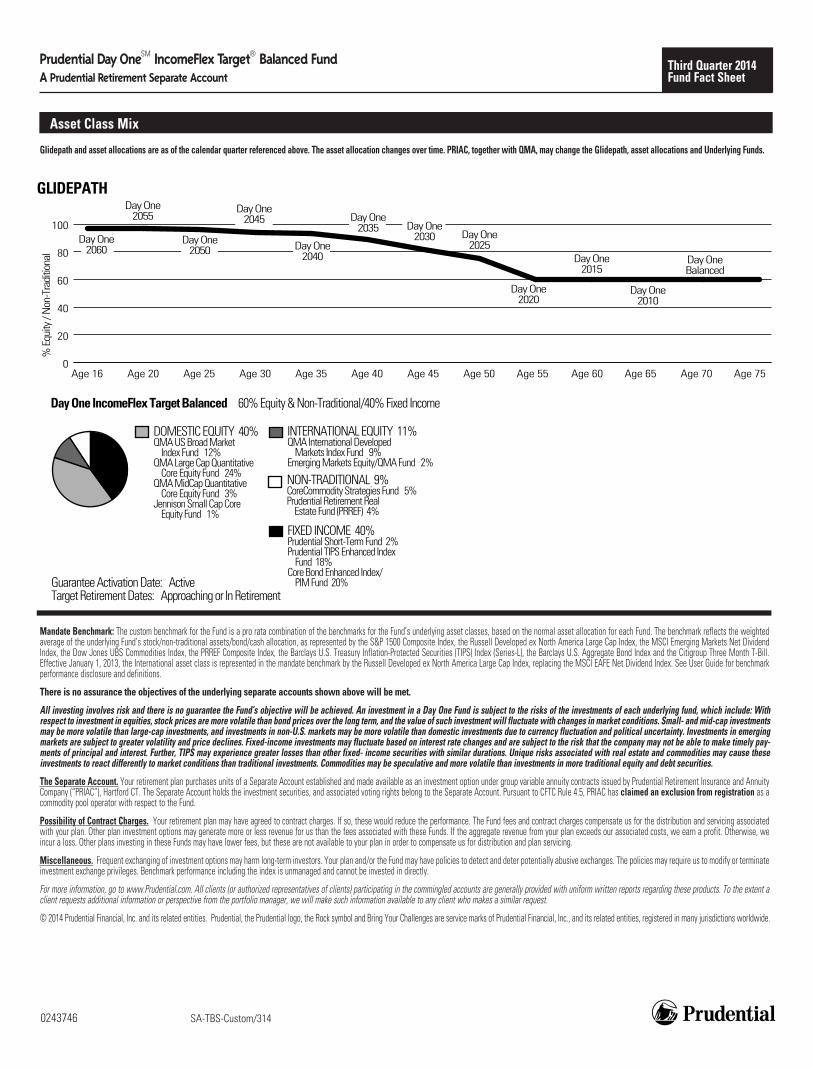
Prudential Day OneSM IncomeFlex Target® Balanced FundA Prudential Retirement Separate Account
Third Quarter 2014 Fund Fact Sheet
SA-TBS-Custom/3140243746
Mandate Benchmark: The custom benchmark for the Fund is a pro rata combination of the benchmarks for the Fund’s underlying asset classes, based on the normal asset allocation for each Fund. The benchmark reflects the weightedaverage of the underlying Fund’s stock/non-traditional assets/bond/cash allocation, as represented by the S&P 1500 Composite Index, the Russell Developed ex North America Large Cap Index, the MSCI Emerging Markets Net DividendIndex, the Dow Jones UBS Commodities Index, the PRREF Composite Index, the Barclays U.S. Treasury Inflation-Protected Securities (TIPS) Index (Series-L), the Barclays U.S. Aggregate Bond Index and the Citigroup Three Month T-Bill.Effective January 1, 2013, the International asset class is represented in the mandate benchmark by the Russell Developed ex North America Large Cap Index, replacing the MSCI EAFE Net Dividend Index. See User Guide for benchmarkperformance disclosure and definitions.
There is no assurance the objectives of the underlying separate accounts shown above will be met.
All investing involves risk and there is no guarantee the Fund’s objective will be achieved. An investment in a Day One Fund is subject to the risks of the investments of each underlying fund, which include: Withrespect to investment in equities, stock prices are more volatile than bond prices over the long term, and the value of such investment will fluctuate with changes in market conditions. Small- and mid-cap investmentsmay be more volatile than large-cap investments, and investments in non-U.S. markets may be more volatile than domestic investments due to currency fluctuation and political uncertainty. Investments in emergingmarkets are subject to greater volatility and price declines. Fixed-income investments may fluctuate based on interest rate changes and are subject to the risk that the company may not be able to make timely pay-ments of principal and interest. Further, TIPS may experience greater losses than other fixed- income securities with similar durations. Unique risks associated with real estate and commodities may cause theseinvestments to react differently to market conditions than traditional investments. Commodities may be speculative and more volatile than investments in more traditional equity and debt securities.
The Separate Account. Your retirement plan purchases units of a Separate Account established and made available as an investment option under group variable annuity contracts issued by Prudential Retirement Insurance and AnnuityCompany (“PRIAC”), Hartford CT. The Separate Account holds the investment securities, and associated voting rights belong to the Separate Account. Pursuant to CFTC Rule 4.5, PRIAC has claimed an exclusion from registration as acommodity pool operator with respect to the Fund.
Possibility of Contract Charges. Your retirement plan may have agreed to contract charges. If so, these would reduce the performance. The Fund fees and contract charges compensate us for the distribution and servicing associatedwith your plan. Other plan investment options may generate more or less revenue for us than the fees associated with these Funds. If the aggregate revenue from your plan exceeds our associated costs, we earn a profit. Otherwise, weincur a loss. Other plans investing in these Funds may have lower fees, but these are not available to your plan in order to compensate us for distribution and plan servicing.
Miscellaneous. Frequent exchanging of investment options may harm long-term investors. Your plan and/or the Fund may have policies to detect and deter potentially abusive exchanges. The policies may require us to modify or terminateinvestment exchange privileges. Benchmark performance including the index is unmanaged and cannot be invested in directly.
For more information, go to www.Prudential.com. All clients (or authorized representatives of clients) participating in the commingled accounts are generally provided with uniform written reports regarding these products. To the extent aclient requests additional information or perspective from the portfolio manager, we will make such information available to any client who makes a similar request.
© 2014 Prudential Financial, Inc. and its related entities. Prudential, the Prudential logo, the Rock symbol and Bring Your Challenges are service marks of Prudential Financial, Inc., and its related entities, registered in many jurisdictions worldwide.
GLIDEPATH
0
20
40
60
80
100
Age 75Age 70Age 65Age 60Age 55Age 50Age 45Age 40Age 35Age 30Age 25Age 20Age 16
Day One2060
Day One2055
Day One2050
Day One2045 Day One
2035Day One
2025
Day One2020
Day One2015
Day One2010
Day OneBalanced
% E
quity
/ N
on-T
radi
tiona
l
Day One2040
Day One2030
Asset Class Mix
Day One IncomeFlex Target Balanced 60% Equity & Non-Traditional/40% Fixed Income
Guarantee Activation Date: ActiveTarget Retirement Dates: Approaching or In Retirement
INTERNATIONAL EQUITY 11%QMA International Developed Markets Index Fund 9%Emerging Markets Equity/QMA Fund 2%
DOMESTIC EQUITY 40%QMA US Broad Market Index Fund 12% QMA Large Cap Quantitative Core Equity Fund 24%QMA MidCap Quantitative Core Equity Fund 3%Jennison Small Cap Core Equity Fund 1%
FIXED INCOME 40%Prudential Short-Term Fund 2%Prudential TIPS Enhanced Index Fund 18%Core Bond Enhanced Index/ PIM Fund 20%
NON-TRADITIONAL 9%CoreCommodity Strategies Fund 5%Prudential Retirement Real Estate Fund (PRREF) 4%
Glidepath and asset allocations are as of the calendar quarter referenced above. The asset allocation changes over time. PRIAC, together with QMA, may change the Glidepath, asset allocations and Underlying Funds.
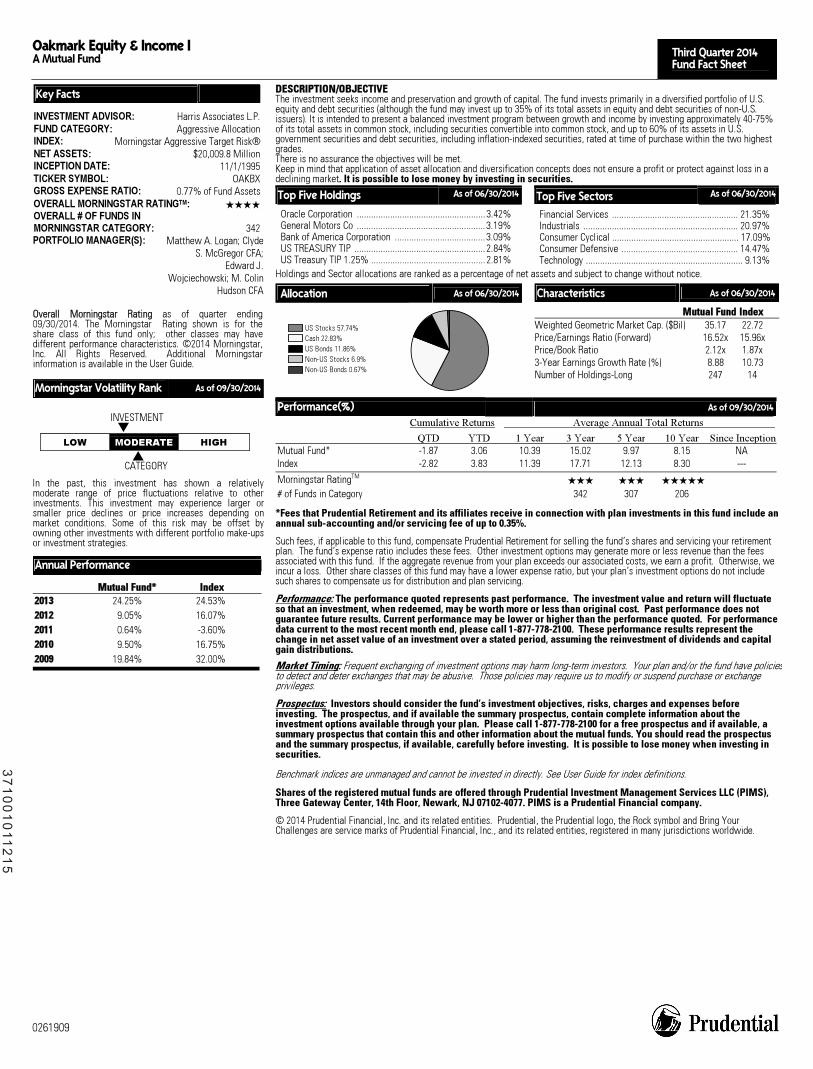
Oakmark Equity & Income I A Mutual Fund Third Quarter 2014
Fund Fact Sheet
0261909
Key Facts INVESTMENT ADVISOR: Harris Associates L.P.FUND CATEGORY: Aggressive AllocationINDEX: Morningstar Aggressive Target Risk®NET ASSETS: $20,009.8 MillionINCEPTION DATE: 11/1/1995TICKER SYMBOL: OAKBXGROSS EXPENSE RATIO: 0.77% of Fund AssetsOVERALL MORNINGSTAR RATINGTM: ���� OVERALL # OF FUNDS IN MORNINGSTAR CATEGORY: 342PORTFOLIO MANAGER(S): Matthew A. Logan; Clyde
S. McGregor CFA; Edward J.
Wojciechowski; M. ColinHudson CFA
OOvveerraallll MMoorrnniinnggssttaarr RRaattiinngg as of quarter ending09/30/2014. The Morningstar Rating shown is for theshare class of this fund only; other classes may havedifferent performance characteristics. ©2014 Morningstar,Inc. All Rights Reserved. Additional Morningstarinformation is available in the User Guide.
Morningstar Volatility Rank As of 09/30/2014
INVESTMENT �
LOW MODERATE HIGH � CATEGORY
In the past, this investment has shown a relativelymoderate range of price fluctuations relative to otherinvestments. This investment may experience larger orsmaller price declines or price increases depending onmarket conditions. Some of this risk may be offset byowning other investments with different portfolio make-ups or investment strategies.
Annual Performance
MMuuttuuaall FFuunndd** IInnddeexx 22001133 24.25% 24.53%22001122 9.05% 16.07%22001111 0.64% -3.60%22001100 9.50% 16.75%22000099 19.84% 32.00%
DDEESSCCRRIIPPTTIIOONN//OOBBJJEECCTTIIVVEEThe investment seeks income and preservation and growth of capital. The fund invests primarily in a diversified portfolio of U.S. equity and debt securities (although the fund may invest up to 35% of its total assets in equity and debt securities of non-U.S. issuers). It is intended to present a balanced investment program between growth and income by investing approximately 40-75% of its total assets in common stock, including securities convertible into common stock, and up to 60% of its assets in U.S. government securities and debt securities, including inflation-indexed securities, rated at time of purchase within the two highest grades. There is no assurance the objectives will be met. Keep in mind that application of asset allocation and diversification concepts does not ensure a profit or protect against loss in a declining market. It is possible to lose money by investing in securities.
Top Five Holdings As of 06/30/2014
Oracle Corporation ......................................................3.42% General Motors Co ......................................................3.19% Bank of America Corporation ......................................3.09% US TREASURY TIP .......................................................2.84% US Treasury TIP 1.25% ................................................2.81%
Top Five Sectors As of 06/30/2014
Financial Services ..................................................... 21.35% Industrials ................................................................. 20.97% Consumer Cyclical ..................................................... 17.09% Consumer Defensive ................................................. 14.47% Technology .................................................................. 9.13%
Holdings and Sector allocations are ranked as a percentage of net assets and subject to change without notice.
Allocation As of 06/30/2014
US Stocks 57.74%Cash 22.83%US Bonds 11.86%Non-US Stocks 6.9%Non-US Bonds 0.67%
Characteristics As of 06/30/2014
MMuuttuuaall FFuunndd IInnddeexx Weighted Geometric Market Cap. ($Bil) 35.17 22.72 Price/Earnings Ratio (Forward) 16.52x 15.96x Price/Book Ratio 2.12x 1.87x 3-Year Earnings Growth Rate (%) 8.88 10.73 Number of Holdings-Long 247 14
Performance(%) As of 09/30/2014
Cumulative Returns Average Annual Total Returns QTD YTD 1 Year 3 Year 5 Year 10 Year Since InceptionMutual Fund* -1.87 3.06 10.39 15.02 9.97 8.15 NA Index -2.82 3.83 11.39 17.71 12.13 8.30 ---
Morningstar RatingTM ��� ��� �����
# of Funds in Category 342 307 206
*Fees that Prudential Retirement and its affiliates receive in connection with plan investments in this fund include an annual sub-accounting and/or servicing fee of up to 0.35%. Such fees, if applicable to this fund, compensate Prudential Retirement for selling the fund’s shares and servicing your retirement plan. The fund’s expense ratio includes these fees. Other investment options may generate more or less revenue than the fees associated with this fund. If the aggregate revenue from your plan exceeds our associated costs, we earn a profit. Otherwise, we incur a loss. Other share classes of this fund may have a lower expense ratio, but your plan’s investment options do not include such shares to compensate us for distribution and plan servicing.
Performance: The performance quoted represents past performance. The investment value and return will fluctuate so that an investment, when redeemed, may be worth more or less than original cost. Past performance does not guarantee future results. Current performance may be lower or higher than the performance quoted. For performance data current to the most recent month end, please call 1-877-778-2100. These performance results represent the change in net asset value of an investment over a stated period, assuming the reinvestment of dividends and capital gain distributions. Market Timing: Frequent exchanging of investment options may harm long-term investors. Your plan and/or the fund have policiesto detect and deter exchanges that may be abusive. Those policies may require us to modify or suspend purchase or exchange privileges.
Prospectus: Investors should consider the fund’s investment objectives, risks, charges and expenses before investing. The prospectus, and if available the summary prospectus, contain complete information about the investment options available through your plan. Please call 1-877-778-2100 for a free prospectus and if available, a summary prospectus that contain this and other information about the mutual funds. You should read the prospectus and the summary prospectus, if available, carefully before investing. It is possible to lose money when investing in securities.
Benchmark indices are unmanaged and cannot be invested in directly. See User Guide for index definitions.
Shares of the registered mutual funds are offered through Prudential Investment Management Services LLC (PIMS), Three Gateway Center, 14th Floor, Newark, NJ 07102-4077. PIMS is a Prudential Financial company. © 2014 Prudential Financial, Inc. and its related entities. Prudential, the Prudential logo, the Rock symbol and Bring Your Challenges are service marks of Prudential Financial, Inc., and its related entities, registered in many jurisdictions worldwide.
37
10
01
011
21
5
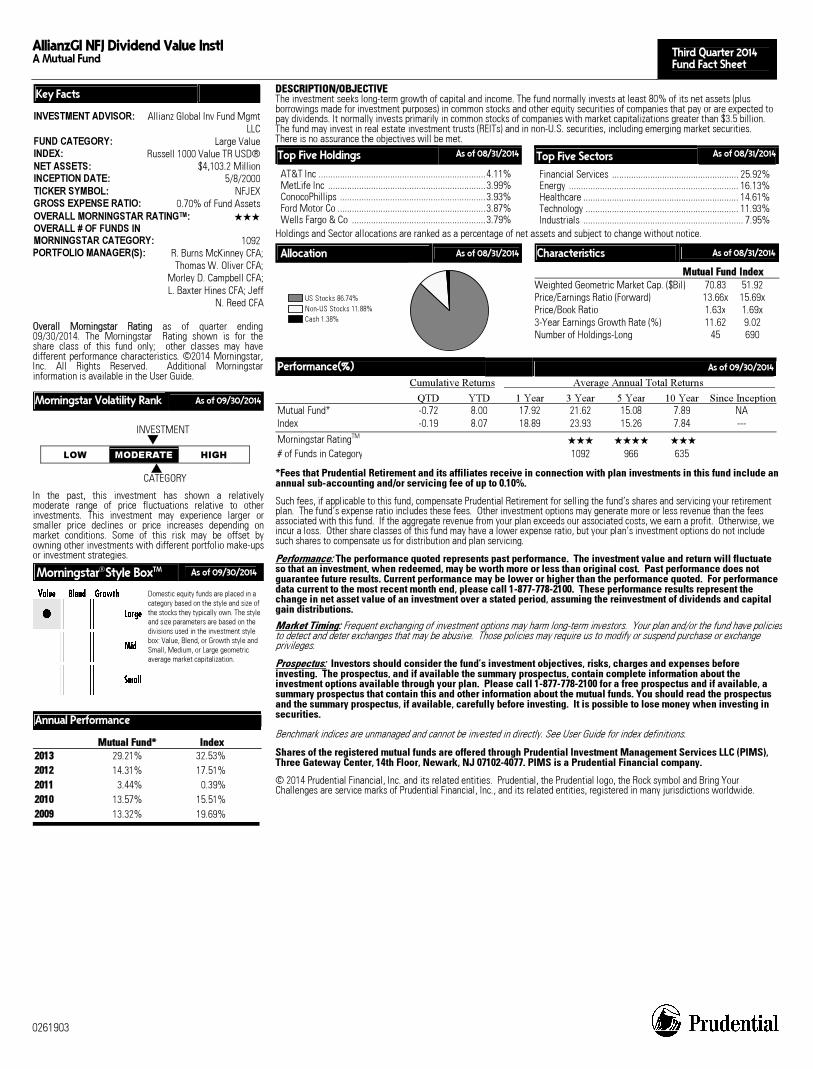
AllianzGI NFJ Dividend Value Instl A Mutual Fund Third Quarter 2014
Fund Fact Sheet
0261903
Key Facts INVESTMENT ADVISOR: Allianz Global Inv Fund Mgmt
LLCFUND CATEGORY: Large ValueINDEX: Russell 1000 Value TR USD®NET ASSETS: $4,103.2 MillionINCEPTION DATE: 5/8/2000TICKER SYMBOL: NFJEXGROSS EXPENSE RATIO: 0.70% of Fund AssetsOVERALL MORNINGSTAR RATINGTM: ��� OVERALL # OF FUNDS IN MORNINGSTAR CATEGORY: 1092PORTFOLIO MANAGER(S): R. Burns McKinney CFA;
Thomas W. Oliver CFA;Morley D. Campbell CFA;L. Baxter Hines CFA; Jeff
N. Reed CFA
OOvveerraallll MMoorrnniinnggssttaarr RRaattiinngg as of quarter ending09/30/2014. The Morningstar Rating shown is for theshare class of this fund only; other classes may have different performance characteristics. ©2014 Morningstar,Inc. All Rights Reserved. Additional Morningstarinformation is available in the User Guide.
Morningstar Volatility Rank As of 09/30/2014
INVESTMENT �
LOW MODERATE HIGH � CATEGORY
In the past, this investment has shown a relativelymoderate range of price fluctuations relative to otherinvestments. This investment may experience larger orsmaller price declines or price increases depending onmarket conditions. Some of this risk may be offset byowning other investments with different portfolio make-ups or investment strategies.
MorningstarStyle BoxTM As of 09/30/2014
Domestic equity funds are placed in a category based on the style and size of the stocks they typically own. The style and size parameters are based on the divisions used in the investment style box: Value, Blend, or Growth style and Small, Medium, or Large geometric average market capitalization.
Annual Performance
MMuuttuuaall FFuunndd** IInnddeexx 22001133 29.21% 32.53% 22001122 14.31% 17.51%22001111 3.44% 0.39%22001100 13.57% 15.51%22000099 13.32% 19.69%
DDEESSCCRRIIPPTTIIOONN//OOBBJJEECCTTIIVVEEThe investment seeks long-term growth of capital and income. The fund normally invests at least 80% of its net assets (plus borrowings made for investment purposes) in common stocks and other equity securities of companies that pay or are expected to pay dividends. It normally invests primarily in common stocks of companies with market capitalizations greater than $3.5 billion. The fund may invest in real estate investment trusts (REITs) and in non-U.S. securities, including emerging market securities. There is no assurance the objectives will be met.
Top Five Holdings As of 08/31/2014
AT&T Inc ......................................................................4.11% MetLife Inc ..................................................................3.99% ConocoPhillips .............................................................3.93% Ford Motor Co ..............................................................3.87% Wells Fargo & Co ........................................................3.79%
Top Five Sectors As of 08/31/2014
Financial Services ..................................................... 25.92% Energy ....................................................................... 16.13% Healthcare ................................................................. 14.61% Technology ................................................................ 11.93% Industrials ................................................................... 7.95%
Holdings and Sector allocations are ranked as a percentage of net assets and subject to change without notice.
Allocation As of 08/31/2014
US Stocks 86.74%Non-US Stocks 11.88%Cash 1.38%
Characteristics As of 08/31/2014
MMuuttuuaall FFuunndd IInnddeexx Weighted Geometric Market Cap. ($Bil) 70.83 51.92Price/Earnings Ratio (Forward) 13.66x 15.69xPrice/Book Ratio 1.63x 1.69x3-Year Earnings Growth Rate (%) 11.62 9.02Number of Holdings-Long 45 690
Performance(%) As of 09/30/2014
Cumulative Returns Average Annual Total Returns QTD YTD 1 Year 3 Year 5 Year 10 Year Since InceptionMutual Fund* -0.72 8.00 17.92 21.62 15.08 7.89 NAIndex -0.19 8.07 18.89 23.93 15.26 7.84 ---
Morningstar RatingTM��� ���� ���
# of Funds in Category 1092 966 635
*Fees that Prudential Retirement and its affiliates receive in connection with plan investments in this fund include an annual sub-accounting and/or servicing fee of up to 0.10%. Such fees, if applicable to this fund, compensate Prudential Retirement for selling the fund’s shares and servicing your retirement plan. The fund’s expense ratio includes these fees. Other investment options may generate more or less revenue than the fees associated with this fund. If the aggregate revenue from your plan exceeds our associated costs, we earn a profit. Otherwise, we incur a loss. Other share classes of this fund may have a lower expense ratio, but your plan’s investment options do not include such shares to compensate us for distribution and plan servicing. Performance: The performance quoted represents past performance. The investment value and return will fluctuate so that an investment, when redeemed, may be worth more or less than original cost. Past performance does not guarantee future results. Current performance may be lower or higher than the performance quoted. For performance data current to the most recent month end, please call 1-877-778-2100. These performance results represent the change in net asset value of an investment over a stated period, assuming the reinvestment of dividends and capital gain distributions. Market Timing: Frequent exchanging of investment options may harm long-term investors. Your plan and/or the fund have policies to detect and deter exchanges that may be abusive. Those policies may require us to modify or suspend purchase or exchange privileges. Prospectus: Investors should consider the fund’s investment objectives, risks, charges and expenses before investing. The prospectus, and if available the summary prospectus, contain complete information about the investment options available through your plan. Please call 1-877-778-2100 for a free prospectus and if available, a summary prospectus that contain this and other information about the mutual funds. You should read the prospectus and the summary prospectus, if available, carefully before investing. It is possible to lose money when investing in securities.
Benchmark indices are unmanaged and cannot be invested in directly. See User Guide for index definitions. Shares of the registered mutual funds are offered through Prudential Investment Management Services LLC (PIMS), Three Gateway Center, 14th Floor, Newark, NJ 07102-4077. PIMS is a Prudential Financial company. © 2014 Prudential Financial, Inc. and its related entities. Prudential, the Prudential logo, the Rock symbol and Bring Your Challenges are service marks of Prudential Financial, Inc., and its related entities, registered in many jurisdictions worldwide.
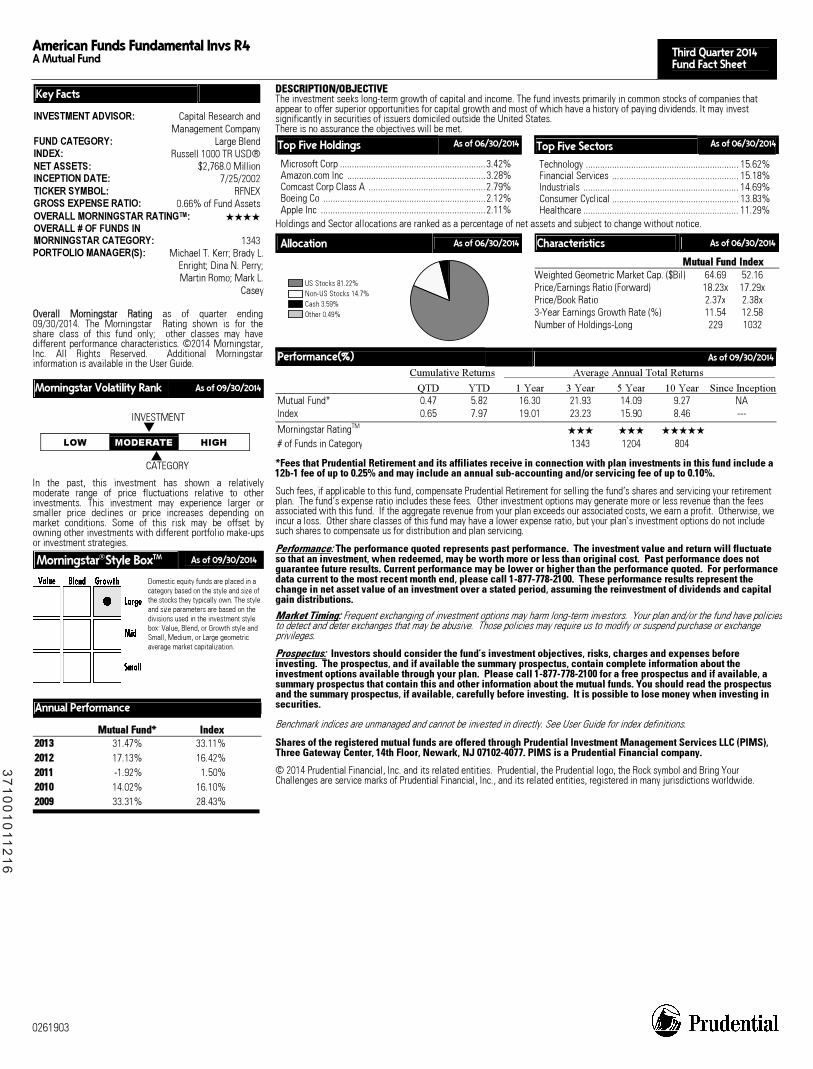
American Funds Fundamental Invs R4 A Mutual Fund Third Quarter 2014
Fund Fact Sheet
0261903
Key Facts INVESTMENT ADVISOR: Capital Research and
Management CompanyFUND CATEGORY: Large BlendINDEX: Russell 1000 TR USD®NET ASSETS: $2,768.0 MillionINCEPTION DATE: 7/25/2002TICKER SYMBOL: RFNEXGROSS EXPENSE RATIO: 0.66% of Fund AssetsOVERALL MORNINGSTAR RATINGTM: ���� OVERALL # OF FUNDS IN MORNINGSTAR CATEGORY: 1343PORTFOLIO MANAGER(S): Michael T. Kerr; Brady L.
Enright; Dina N. Perry;Martin Romo; Mark L.
Casey
OOvveerraallll MMoorrnniinnggssttaarr RRaattiinngg as of quarter ending09/30/2014. The Morningstar Rating shown is for theshare class of this fund only; other classes may havedifferent performance characteristics. ©2014 Morningstar,Inc. All Rights Reserved. Additional Morningstarinformation is available in the User Guide.
Morningstar Volatility Rank As of 09/30/2014
INVESTMENT �
LOW MODERATE HIGH � CATEGORY
In the past, this investment has shown a relativelymoderate range of price fluctuations relative to otherinvestments. This investment may experience larger orsmaller price declines or price increases depending onmarket conditions. Some of this risk may be offset byowning other investments with different portfolio make-ups or investment strategies.
MorningstarStyle BoxTM As of 09/30/2014
Domestic equity funds are placed in a category based on the style and size of the stocks they typically own. The style and size parameters are based on the divisions used in the investment style box: Value, Blend, or Growth style and Small, Medium, or Large geometric average market capitalization.
Annual Performance
MMuuttuuaall FFuunndd** IInnddeexx 22001133 31.47% 33.11% 22001122 17.13% 16.42%22001111 -1.92% 1.50%22001100 14.02% 16.10%22000099 33.31% 28.43%
DDEESSCCRRIIPPTTIIOONN//OOBBJJEECCTTIIVVEEThe investment seeks long-term growth of capital and income. The fund invests primarily in common stocks of companies that appear to offer superior opportunities for capital growth and most of which have a history of paying dividends. It may invest significantly in securities of issuers domiciled outside the United States. There is no assurance the objectives will be met.
Top Five Holdings As of 06/30/2014
Microsoft Corp .............................................................3.42% Amazon.com Inc ..........................................................3.28% Comcast Corp Class A .................................................2.79% Boeing Co ....................................................................2.12% Apple Inc .....................................................................2.11%
Top Five Sectors As of 06/30/2014
Technology ................................................................ 15.62% Financial Services ..................................................... 15.18% Industrials ................................................................. 14.69% Consumer Cyclical ..................................................... 13.83% Healthcare ................................................................. 11.29%
Holdings and Sector allocations are ranked as a percentage of net assets and subject to change without notice.
Allocation As of 06/30/2014
US Stocks 81.22%Non-US Stocks 14.7%Cash 3.59%Other 0.49%
Characteristics As of 06/30/2014
MMuuttuuaall FFuunndd IInnddeexx Weighted Geometric Market Cap. ($Bil) 64.69 52.16Price/Earnings Ratio (Forward) 18.23x 17.29xPrice/Book Ratio 2.37x 2.38x3-Year Earnings Growth Rate (%) 11.54 12.58Number of Holdings-Long 229 1032
Performance(%) As of 09/30/2014
Cumulative Returns Average Annual Total Returns QTD YTD 1 Year 3 Year 5 Year 10 Year Since InceptionMutual Fund* 0.47 5.82 16.30 21.93 14.09 9.27 NAIndex 0.65 7.97 19.01 23.23 15.90 8.46 ---
Morningstar RatingTM��� ��� �����
# of Funds in Category 1343 1204 804
*Fees that Prudential Retirement and its affiliates receive in connection with plan investments in this fund include a 12b-1 fee of up to 0.25% and may include an annual sub-accounting and/or servicing fee of up to 0.10%. Such fees, if applicable to this fund, compensate Prudential Retirement for selling the fund’s shares and servicing your retirement plan. The fund’s expense ratio includes these fees. Other investment options may generate more or less revenue than the fees associated with this fund. If the aggregate revenue from your plan exceeds our associated costs, we earn a profit. Otherwise, we incur a loss. Other share classes of this fund may have a lower expense ratio, but your plan’s investment options do not include such shares to compensate us for distribution and plan servicing. Performance: The performance quoted represents past performance. The investment value and return will fluctuate so that an investment, when redeemed, may be worth more or less than original cost. Past performance does not guarantee future results. Current performance may be lower or higher than the performance quoted. For performance data current to the most recent month end, please call 1-877-778-2100. These performance results represent the change in net asset value of an investment over a stated period, assuming the reinvestment of dividends and capital gain distributions. Market Timing: Frequent exchanging of investment options may harm long-term investors. Your plan and/or the fund have policies to detect and deter exchanges that may be abusive. Those policies may require us to modify or suspend purchase or exchange privileges. Prospectus: Investors should consider the fund’s investment objectives, risks, charges and expenses before investing. The prospectus, and if available the summary prospectus, contain complete information about the investment options available through your plan. Please call 1-877-778-2100 for a free prospectus and if available, a summary prospectus that contain this and other information about the mutual funds. You should read the prospectus and the summary prospectus, if available, carefully before investing. It is possible to lose money when investing in securities.
Benchmark indices are unmanaged and cannot be invested in directly. See User Guide for index definitions. Shares of the registered mutual funds are offered through Prudential Investment Management Services LLC (PIMS), Three Gateway Center, 14th Floor, Newark, NJ 07102-4077. PIMS is a Prudential Financial company. © 2014 Prudential Financial, Inc. and its related entities. Prudential, the Prudential logo, the Rock symbol and Bring Your Challenges are service marks of Prudential Financial, Inc., and its related entities, registered in many jurisdictions worldwide.
3
71
00
10
112
16
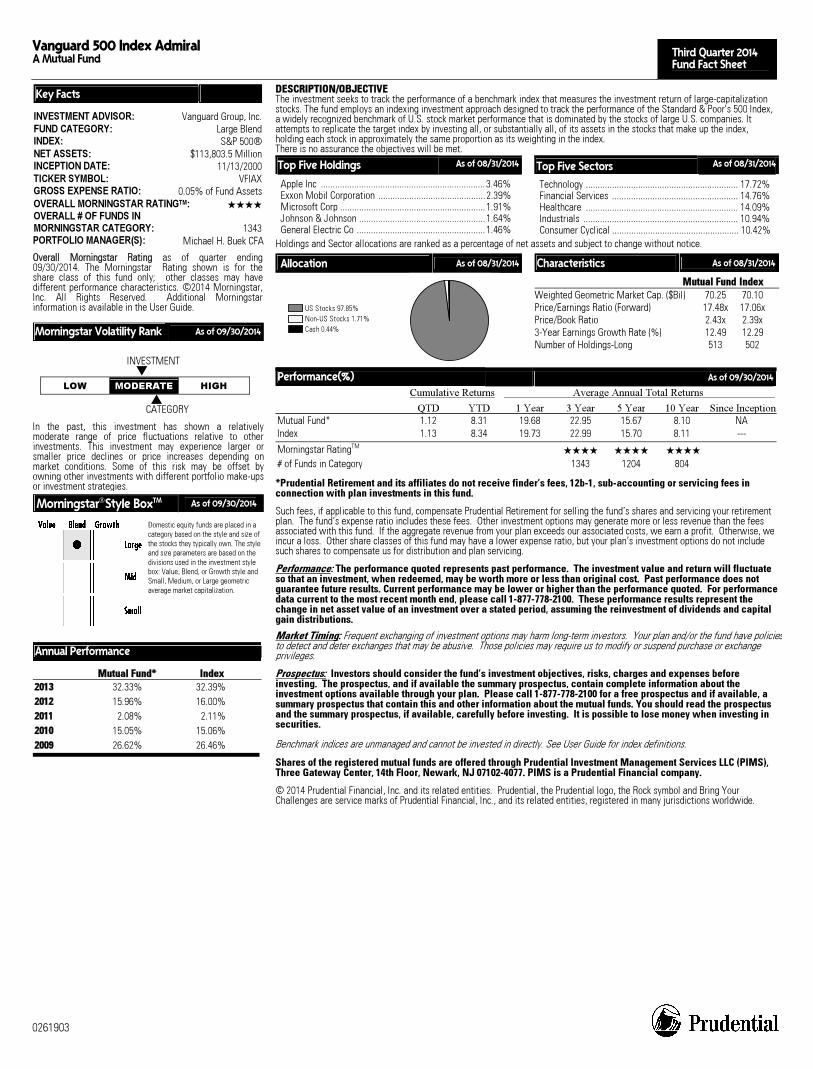
Vanguard 500 Index Admiral A Mutual Fund Third Quarter 2014
Fund Fact Sheet
0261903
Key Facts INVESTMENT ADVISOR: Vanguard Group, Inc.FUND CATEGORY: Large Blend
INDEX: S&P 500®NET ASSETS: $113,803.5 MillionINCEPTION DATE: 11/13/2000TICKER SYMBOL: VFIAXGROSS EXPENSE RATIO: 0.05% of Fund AssetsOVERALL MORNINGSTAR RATINGTM: ���� OVERALL # OF FUNDS IN MORNINGSTAR CATEGORY: 1343 PORTFOLIO MANAGER(S): Michael H. Buek CFA
OOvveerraallll MMoorrnniinnggssttaarr RRaattiinngg as of quarter ending09/30/2014. The Morningstar Rating shown is for theshare class of this fund only; other classes may havedifferent performance characteristics. ©2014 Morningstar,Inc. All Rights Reserved. Additional Morningstarinformation is available in the User Guide.
Morningstar Volatility Rank As of 09/30/2014
INVESTMENT �
LOW MODERATE HIGH � CATEGORY
In the past, this investment has shown a relativelymoderate range of price fluctuations relative to otherinvestments. This investment may experience larger orsmaller price declines or price increases depending onmarket conditions. Some of this risk may be offset by owning other investments with different portfolio make-ups or investment strategies.
MorningstarStyle BoxTM As of 09/30/2014
Domestic equity funds are placed in a category based on the style and size of the stocks they typically own. The style and size parameters are based on the divisions used in the investment style box: Value, Blend, or Growth style and Small, Medium, or Large geometric average market capitalization.
Annual Performance
MMuuttuuaall FFuunndd** IInnddeexx 22001133 32.33% 32.39%22001122 15.96% 16.00%22001111 2.08% 2.11%22001100 15.05% 15.06%22000099 26.62% 26.46%
DDEESSCCRRIIPPTTIIOONN//OOBBJJEECCTTIIVVEEThe investment seeks to track the performance of a benchmark index that measures the investment return of large-capitalization stocks. The fund employs an indexing investment approach designed to track the performance of the Standard & Poor's 500 Index, a widely recognized benchmark of U.S. stock market performance that is dominated by the stocks of large U.S. companies. It attempts to replicate the target index by investing all, or substantially all, of its assets in the stocks that make up the index, holding each stock in approximately the same proportion as its weighting in the index. There is no assurance the objectives will be met.
Top Five Holdings As of 08/31/2014
Apple Inc .....................................................................3.46% Exxon Mobil Corporation .............................................2.39% Microsoft Corp .............................................................1.91% Johnson & Johnson .....................................................1.64% General Electric Co ......................................................1.46%
Top Five Sectors As of 08/31/2014
Technology ................................................................ 17.72% Financial Services ..................................................... 14.76% Healthcare ................................................................ 14.09% Industrials ................................................................. 10.94% Consumer Cyclical ..................................................... 10.42%
Holdings and Sector allocations are ranked as a percentage of net assets and subject to change without notice.
Allocation As of 08/31/2014
US Stocks 97.85%Non-US Stocks 1.71%Cash 0.44%
Characteristics As of 08/31/2014
MMuuttuuaall FFuunndd IInnddeexx Weighted Geometric Market Cap. ($Bil) 70.25 70.10 Price/Earnings Ratio (Forward) 17.48x 17.06x Price/Book Ratio 2.43x 2.39x 3-Year Earnings Growth Rate (%) 12.49 12.29 Number of Holdings-Long 513 502
Performance(%) As of 09/30/2014
Cumulative Returns Average Annual Total Returns QTD YTD 1 Year 3 Year 5 Year 10 Year Since InceptionMutual Fund* 1.12 8.31 19.68 22.95 15.67 8.10 NA Index 1.13 8.34 19.73 22.99 15.70 8.11 ---
Morningstar RatingTM ���� ���� ����
# of Funds in Category 1343 1204 804
*Prudential Retirement and its affiliates do not receive finder’s fees, 12b-1, sub-accounting or servicing fees in connection with plan investments in this fund. Such fees, if applicable to this fund, compensate Prudential Retirement for selling the fund’s shares and servicing your retirement plan. The fund’s expense ratio includes these fees. Other investment options may generate more or less revenue than the fees associated with this fund. If the aggregate revenue from your plan exceeds our associated costs, we earn a profit. Otherwise, we incur a loss. Other share classes of this fund may have a lower expense ratio, but your plan’s investment options do not include such shares to compensate us for distribution and plan servicing.
Performance: The performance quoted represents past performance. The investment value and return will fluctuate so that an investment, when redeemed, may be worth more or less than original cost. Past performance does not guarantee future results. Current performance may be lower or higher than the performance quoted. For performance data current to the most recent month end, please call 1-877-778-2100. These performance results represent the change in net asset value of an investment over a stated period, assuming the reinvestment of dividends and capital gain distributions. Market Timing: Frequent exchanging of investment options may harm long-term investors. Your plan and/or the fund have policiesto detect and deter exchanges that may be abusive. Those policies may require us to modify or suspend purchase or exchange privileges.
Prospectus: Investors should consider the fund’s investment objectives, risks, charges and expenses before investing. The prospectus, and if available the summary prospectus, contain complete information about the investment options available through your plan. Please call 1-877-778-2100 for a free prospectus and if available, a summary prospectus that contain this and other information about the mutual funds. You should read the prospectus and the summary prospectus, if available, carefully before investing. It is possible to lose money when investing in securities.
Benchmark indices are unmanaged and cannot be invested in directly. See User Guide for index definitions.
Shares of the registered mutual funds are offered through Prudential Investment Management Services LLC (PIMS), Three Gateway Center, 14th Floor, Newark, NJ 07102-4077. PIMS is a Prudential Financial company. © 2014 Prudential Financial, Inc. and its related entities. Prudential, the Prudential logo, the Rock symbol and Bring Your Challenges are service marks of Prudential Financial, Inc., and its related entities, registered in many jurisdictions worldwide.
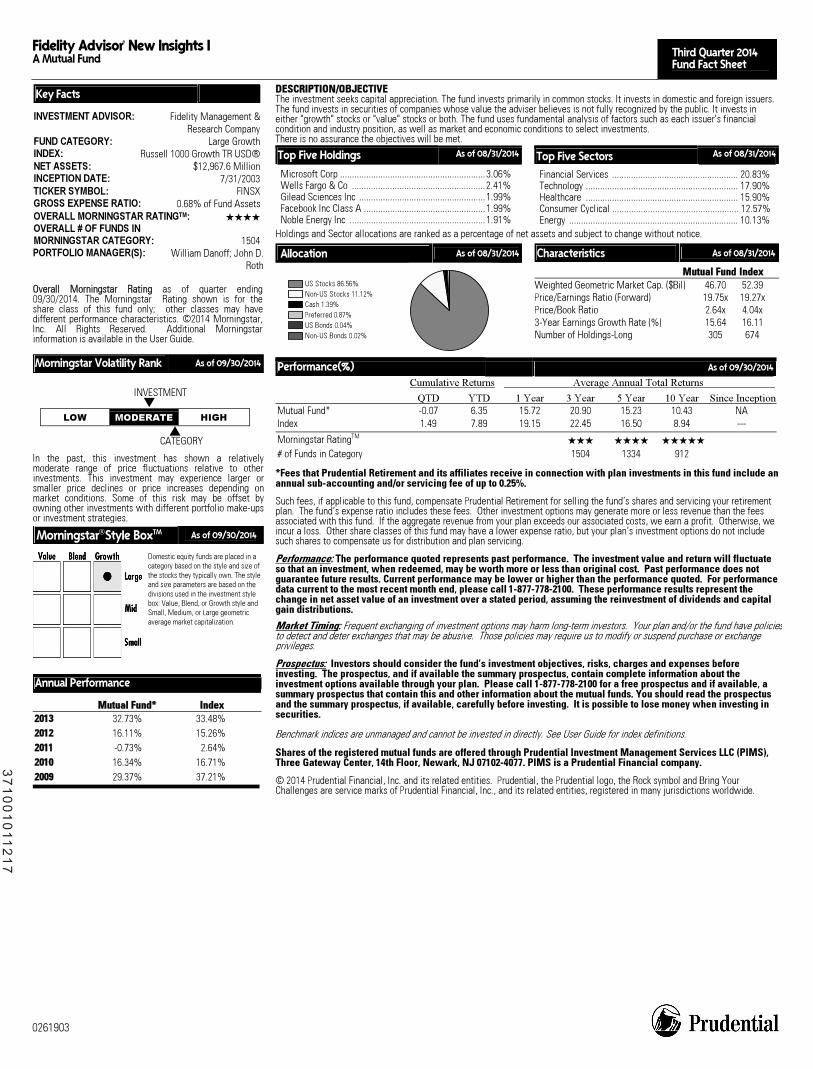
Fidelity Advisor® New Insights I A Mutual Fund Third Quarter 2014
Fund Fact Sheet
0261903
Key Facts INVESTMENT ADVISOR: Fidelity Management &
Research CompanyFUND CATEGORY: Large GrowthINDEX: Russell 1000 Growth TR USD®NET ASSETS: $12,967.6 MillionINCEPTION DATE: 7/31/2003TICKER SYMBOL: FINSXGROSS EXPENSE RATIO: 0.68% of Fund AssetsOVERALL MORNINGSTAR RATINGTM: ���� OVERALL # OF FUNDS IN MORNINGSTAR CATEGORY: 1504PORTFOLIO MANAGER(S): William Danoff; John D.
Roth
OOvveerraallll MMoorrnniinnggssttaarr RRaattiinngg as of quarter ending09/30/2014. The Morningstar Rating shown is for theshare class of this fund only; other classes may havedifferent performance characteristics. ©2014 Morningstar,Inc. All Rights Reserved. Additional Morningstar information is available in the User Guide.
Morningstar Volatility Rank As of 09/30/2014
INVESTMENT �
LOW MODERATE HIGH � CATEGORY
In the past, this investment has shown a relativelymoderate range of price fluctuations relative to otherinvestments. This investment may experience larger orsmaller price declines or price increases depending onmarket conditions. Some of this risk may be offset byowning other investments with different portfolio make-ups or investment strategies.
MorningstarStyle BoxTM As of 09/30/2014
Domestic equity funds are placed in a category based on the style and size of the stocks they typically own. The style and size parameters are based on the divisions used in the investment style box: Value, Blend, or Growth style and Small, Medium, or Large geometric average market capitalization.
Annual Performance
MMuuttuuaall FFuunndd** IInnddeexx 22001133 32.73% 33.48%22001122 16.11% 15.26%22001111 -0.73% 2.64%22001100 16.34% 16.71%22000099 29.37% 37.21%
DDEESSCCRRIIPPTTIIOONN//OOBBJJEECCTTIIVVEEThe investment seeks capital appreciation. The fund invests primarily in common stocks. It invests in domestic and foreign issuers. The fund invests in securities of companies whose value the adviser believes is not fully recognized by the public. It invests in either "growth" stocks or "value" stocks or both. The fund uses fundamental analysis of factors such as each issuer's financial condition and industry position, as well as market and economic conditions to select investments. There is no assurance the objectives will be met.
Top Five Holdings As of 08/31/2014
Microsoft Corp .............................................................3.06% Wells Fargo & Co ........................................................2.41% Gilead Sciences Inc .....................................................1.99% Facebook Inc Class A ...................................................1.99% Noble Energy Inc .........................................................1.91%
Top Five Sectors As of 08/31/2014
Financial Services ..................................................... 20.83% Technology ................................................................ 17.90% Healthcare ................................................................ 15.90% Consumer Cyclical ..................................................... 12.57% Energy ....................................................................... 10.13%
Holdings and Sector allocations are ranked as a percentage of net assets and subject to change without notice.
Allocation As of 08/31/2014
US Stocks 86.56%Non-US Stocks 11.12%Cash 1.39%Preferred 0.87%US Bonds 0.04%Non-US Bonds 0.02%
Characteristics As of 08/31/2014
MMuuttuuaall FFuunndd IInnddeexx Weighted Geometric Market Cap. ($Bil) 46.70 52.39 Price/Earnings Ratio (Forward) 19.75x 19.27x Price/Book Ratio 2.64x 4.04x 3-Year Earnings Growth Rate (%) 15.64 16.11 Number of Holdings-Long 305 674
Performance(%) As of 09/30/2014
Cumulative Returns Average Annual Total Returns QTD YTD 1 Year 3 Year 5 Year 10 Year Since InceptionMutual Fund* -0.07 6.35 15.72 20.90 15.23 10.43 NA Index 1.49 7.89 19.15 22.45 16.50 8.94 ---
Morningstar RatingTM ��� ���� �����
# of Funds in Category 1504 1334 912
*Fees that Prudential Retirement and its affiliates receive in connection with plan investments in this fund include an annual sub-accounting and/or servicing fee of up to 0.25%. Such fees, if applicable to this fund, compensate Prudential Retirement for selling the fund’s shares and servicing your retirement plan. The fund’s expense ratio includes these fees. Other investment options may generate more or less revenue than the fees associated with this fund. If the aggregate revenue from your plan exceeds our associated costs, we earn a profit. Otherwise, we incur a loss. Other share classes of this fund may have a lower expense ratio, but your plan’s investment options do not include such shares to compensate us for distribution and plan servicing.
Performance: The performance quoted represents past performance. The investment value and return will fluctuate so that an investment, when redeemed, may be worth more or less than original cost. Past performance does not guarantee future results. Current performance may be lower or higher than the performance quoted. For performance data current to the most recent month end, please call 1-877-778-2100. These performance results represent the change in net asset value of an investment over a stated period, assuming the reinvestment of dividends and capital gain distributions. Market Timing: Frequent exchanging of investment options may harm long-term investors. Your plan and/or the fund have policiesto detect and deter exchanges that may be abusive. Those policies may require us to modify or suspend purchase or exchange privileges.
Prospectus: Investors should consider the fund’s investment objectives, risks, charges and expenses before investing. The prospectus, and if available the summary prospectus, contain complete information about the investment options available through your plan. Please call 1-877-778-2100 for a free prospectus and if available, a summary prospectus that contain this and other information about the mutual funds. You should read the prospectus and the summary prospectus, if available, carefully before investing. It is possible to lose money when investing in securities.
Benchmark indices are unmanaged and cannot be invested in directly. See User Guide for index definitions.
Shares of the registered mutual funds are offered through Prudential Investment Management Services LLC (PIMS), Three Gateway Center, 14th Floor, Newark, NJ 07102-4077. PIMS is a Prudential Financial company. © 2014 Prudential Financial, Inc. and its related entities. Prudential, the Prudential logo, the Rock symbol and Bring Your Challenges are service marks of Prudential Financial, Inc., and its related entities, registered in many jurisdictions worldwide.
3
71
00
10
112
17
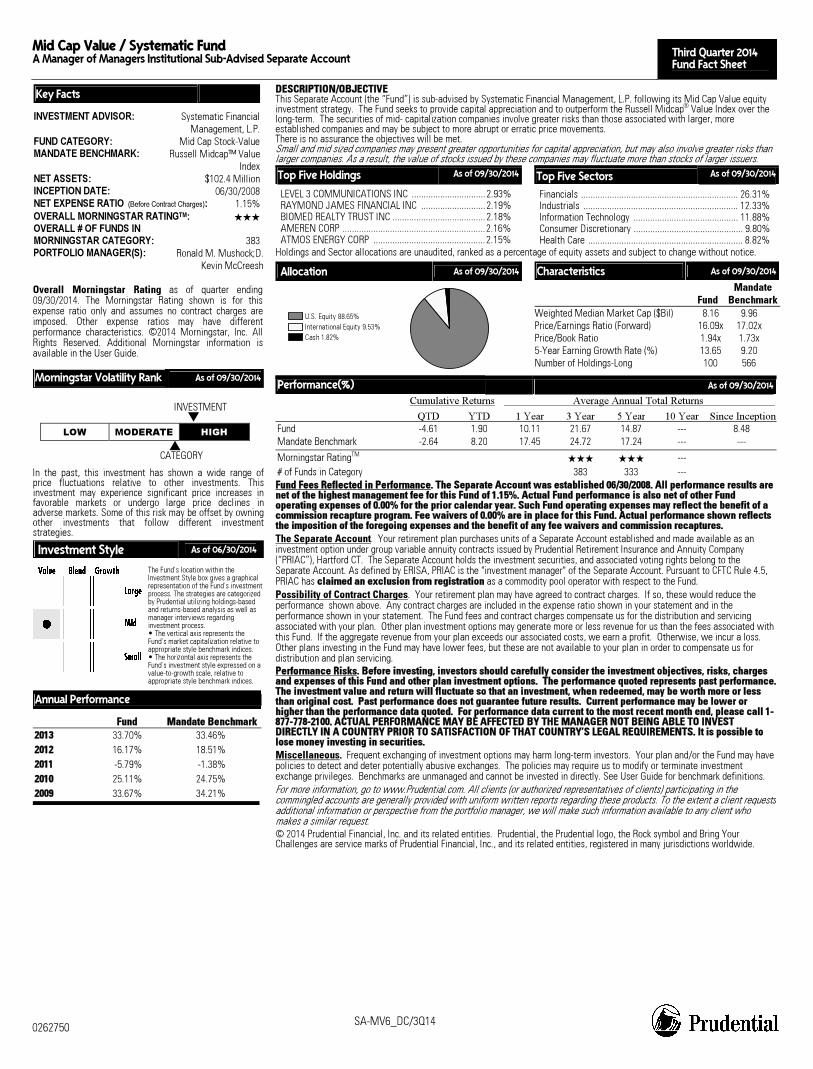
Mid Cap Value / Systematic Fund A Manager of Managers Institutional Sub-Advised Separate Account Third Quarter 2014
Fund Fact Sheet
0262750 SA-MV6_DC/3Q14
Key Facts INVESTMENT ADVISOR: Systematic Financial
Management, L.P.FUND CATEGORY: Mid Cap Stock-ValueMANDATE BENCHMARK: Russell Midcap™ Value
IndexNET ASSETS: $102.4 MillionINCEPTION DATE: 06/30/2008NET EXPENSE RATIO (Before Contract Charges): 1.15%OVERALL MORNINGSTAR RATINGTM: ��� OVERALL # OF FUNDS IN MORNINGSTAR CATEGORY: 383PORTFOLIO MANAGER(S): Ronald M. Mushock;D.
Kevin McCreesh
Overall Morningstar Rating as of quarter ending09/30/2014. The Morningstar Rating shown is for thisexpense ratio only and assumes no contract charges areimposed. Other expense ratios may have differentperformance characteristics. ©2014 Morningstar, Inc. All Rights Reserved. Additional Morningstar information isavailable in the User Guide.
Morningstar Volatility Rank As of 09/30/2014
INVESTMENT �
LOW MODERATE HIGH � CATEGORY
In the past, this investment has shown a wide range ofprice fluctuations relative to other investments. Thisinvestment may experience significant price increases infavorable markets or undergo large price declines inadverse markets. Some of this risk may be offset by owningother investments that follow different investmentstrategies.
Investment Style As of 06/30/2014
The Fund’s location within the Investment Style box gives a graphical representation of the Fund’s investment process. The strategies are categorized by Prudential utilizing holdings-based and returns-based analysis as well as manager interviews regarding investment process. • The vertical axis represents the Fund’s market capitalization relative to appropriate style benchmark indices. • The horizontal axis represents the Fund’s investment style expressed on a value-to-growth scale, relative to appropriate style benchmark indices.
Annual Performance
FFuunndd MMaannddaattee BBeenncchhmmaarrkk 22001133 33.70% 33.46%22001122 16.17% 18.51%22001111 -5.79% -1.38%22001100 25.11% 24.75%22000099 33.67% 34.21%
DDEESSCCRRIIPPTTIIOONN//OOBBJJEECCTTIIVVEEThis Separate Account (the “Fund”) is sub-advised by Systematic Financial Management, L.P. following its Mid Cap Value equity investment strategy. The Fund seeks to provide capital appreciation and to outperform the Russell Midcap® Value Index over the long-term. The securities of mid- capitalization companies involve greater risks than those associated with larger, more established companies and may be subject to more abrupt or erratic price movements. There is no assurance the objectives will be met. Small and mid sized companies may present greater opportunities for capital appreciation, but may also involve greater risks than larger companies. As a result, the value of stocks issued by these companies may fluctuate more than stocks of larger issuers.
Top Five Holdings As of 09/30/2014
LEVEL 3 COMMUNICATIONS INC ...............................2.93% RAYMOND JAMES FINANCIAL INC ...........................2.19% BIOMED REALTY TRUST INC .......................................2.18% AMEREN CORP ............................................................2.16% ATMOS ENERGY CORP ...............................................2.15%
Top Five Sectors As of 09/30/2014
Financials .................................................................. 26.31% Industrials ................................................................. 12.33% Information Technology ............................................ 11.88% Consumer Discretionary .............................................. 9.80% Health Care ................................................................. 8.82%
Holdings and Sector allocations are unaudited, ranked as a percentage of equity assets and subject to change without notice.
Allocation As of 09/30/2014
U.S. Equity 88.65%International Equity 9.53%Cash 1.82%
Characteristics As of 09/30/2014
Fund Mandate
BenchmarkWeighted Median Market Cap ($Bil) 8.16 9.96 Price/Earnings Ratio (Forward) 16.09x 17.02x Price/Book Ratio 1.94x 1.73x 5-Year Earning Growth Rate (%) 13.65 9.20 Number of Holdings-Long 100 566
Performance(%) As of 09/30/2014
Cumulative Returns Average Annual Total Returns QTD YTD 1 Year 3 Year 5 Year 10 Year Since InceptionFund -4.61 1.90 10.11 21.67 14.87 --- 8.48 Mandate Benchmark -2.64 8.20 17.45 24.72 17.24 --- ---
Morningstar RatingTM ��� ��� --- # of Funds in Category 383 333 ---
FFuunndd FFeeeess RReefflleecctteedd iinn PPeerrffoorrmmaannccee.. TThhee SSeeppaarraattee AAccccoouunntt wwaass eessttaabblliisshheedd 0066//3300//22000088.. AAllll ppeerrffoorrmmaannccee rreessuullttss aarree nneett ooff tthhee hhiigghheesstt mmaannaaggeemmeenntt ffeeee ffoorr tthhiiss FFuunndd ooff 11..1155%%.. AAccttuuaall FFuunndd ppeerrffoorrmmaannccee iiss aallssoo nneett ooff ootthheerr FFuunndd ooppeerraattiinngg eexxppeennsseess ooff 00..0000%% ffoorr tthhee pprriioorr ccaalleennddaarr yyeeaarr.. SSuucchh FFuunndd ooppeerraattiinngg eexxppeennsseess mmaayy rreefflleecctt tthhee bbeenneeffiitt ooff aa ccoommmmiissssiioonn rreeccaappttuurree pprrooggrraamm.. FFeeee wwaaiivveerrss ooff 00..0000%% aarree iinn ppllaaccee ffoorr tthhiiss FFuunndd.. AAccttuuaall ppeerrffoorrmmaannccee sshhoowwnn rreefflleeccttss tthhee iimmppoossiittiioonn ooff tthhee ffoorreeggooiinngg eexxppeennsseess aanndd tthhee bbeenneeffiitt ooff aannyy ffeeee wwaaiivveerrss aanndd ccoommmmiissssiioonn rreeccaappttuurreess..
The Separate Account. Your retirement plan purchases units of a Separate Account established and made available as an investment option under group variable annuity contracts issued by Prudential Retirement Insurance and Annuity Company (“PRIAC”), Hartford CT. The Separate Account holds the investment securities, and associated voting rights belong to the Separate Account. As defined by ERISA, PRIAC is the "investment manager" of the Separate Account. Pursuant to CFTC Rule 4.5, PRIAC has ccllaaiimmeedd aann eexxcclluussiioonn ffrroomm rreeggiissttrraattiioonn as a commodity pool operator with respect to the Fund.
Possibility of Contract Charges. Your retirement plan may have agreed to contract charges. If so, these would reduce the performance shown above. Any contract charges are included in the expense ratio shown in your statement and in the performance shown in your statement. The Fund fees and contract charges compensate us for the distribution and servicing associated with your plan. Other plan investment options may generate more or less revenue for us than the fees associated with this Fund. If the aggregate revenue from your plan exceeds our associated costs, we earn a profit. Otherwise, we incur a loss. Other plans investing in the Fund may have lower fees, but these are not available to your plan in order to compensate us for distribution and plan servicing.
PPeerrffoorrmmaannccee RRiisskkss.. BBeeffoorree iinnvveessttiinngg,, iinnvveessttoorrss sshhoouulldd ccaarreeffuullllyy ccoonnssiiddeerr tthhee iinnvveessttmmeenntt oobbjjeeccttiivveess,, rriisskkss,, cchhaarrggeess aanndd eexxppeennsseess ooff tthhiiss FFuunndd aanndd ootthheerr ppllaann iinnvveessttmmeenntt ooppttiioonnss.. TThhee ppeerrffoorrmmaannccee qquuootteedd rreepprreesseennttss ppaasstt ppeerrffoorrmmaannccee.. TThhee iinnvveessttmmeenntt vvaalluuee aanndd rreettuurrnn wwiillll fflluuccttuuaattee ssoo tthhaatt aann iinnvveessttmmeenntt,, wwhheenn rreeddeeeemmeedd,, mmaayy bbee wwoorrtthh mmoorree oorr lleessss tthhaann oorriiggiinnaall ccoosstt.. PPaasstt ppeerrffoorrmmaannccee ddooeess nnoott gguuaarraanntteeee ffuuttuurree rreessuullttss.. CCuurrrreenntt ppeerrffoorrmmaannccee mmaayy bbee lloowweerr oorr hhiigghheerr tthhaann tthhee ppeerrffoorrmmaannccee ddaattaa qquuootteedd.. FFoorr ppeerrffoorrmmaannccee ddaattaa ccuurrrreenntt ttoo tthhee mmoosstt rreecceenntt mmoonntthh eenndd,, pplleeaassee ccaallll 11--887777--777788--22110000.. AACCTTUUAALL PPEERRFFOORRMMAANNCCEE MMAAYY BBEE AAFFFFEECCTTEEDD BBYY TTHHEE MMAANNAAGGEERR NNOOTT BBEEIINNGG AABBLLEE TTOO IINNVVEESSTT DDIIRREECCTTLLYY IINN AA CCOOUUNNTTRRYY PPRRIIOORR TTOO SSAATTIISSFFAACCTTIIOONN OOFF TTHHAATT CCOOUUNNTTRRYY’’SS LLEEGGAALL RREEQQUUIIRREEMMEENNTTSS.. IItt iiss ppoossssiibbllee ttoo lloossee mmoonneeyy iinnvveessttiinngg iinn sseeccuurriittiieess..
Miscellaneous. Frequent exchanging of investment options may harm long-term investors. Your plan and/or the Fund may have policies to detect and deter potentially abusive exchanges. The policies may require us to modify or terminate investment exchange privileges. Benchmarks are unmanaged and cannot be invested in directly. See User Guide for benchmark definitions.
For more information, go to www.Prudential.com. All clients (or authorized representatives of clients) participating in the commingled accounts are generally provided with uniform written reports regarding these products. To the extent a client requests additional information or perspective from the portfolio manager, we will make such information available to any client who makes a similar request.
© 2014 Prudential Financial, Inc. and its related entities. Prudential, the Prudential logo, the Rock symbol and Bring Your Challenges are service marks of Prudential Financial, Inc., and its related entities, registered in many jurisdictions worldwide.
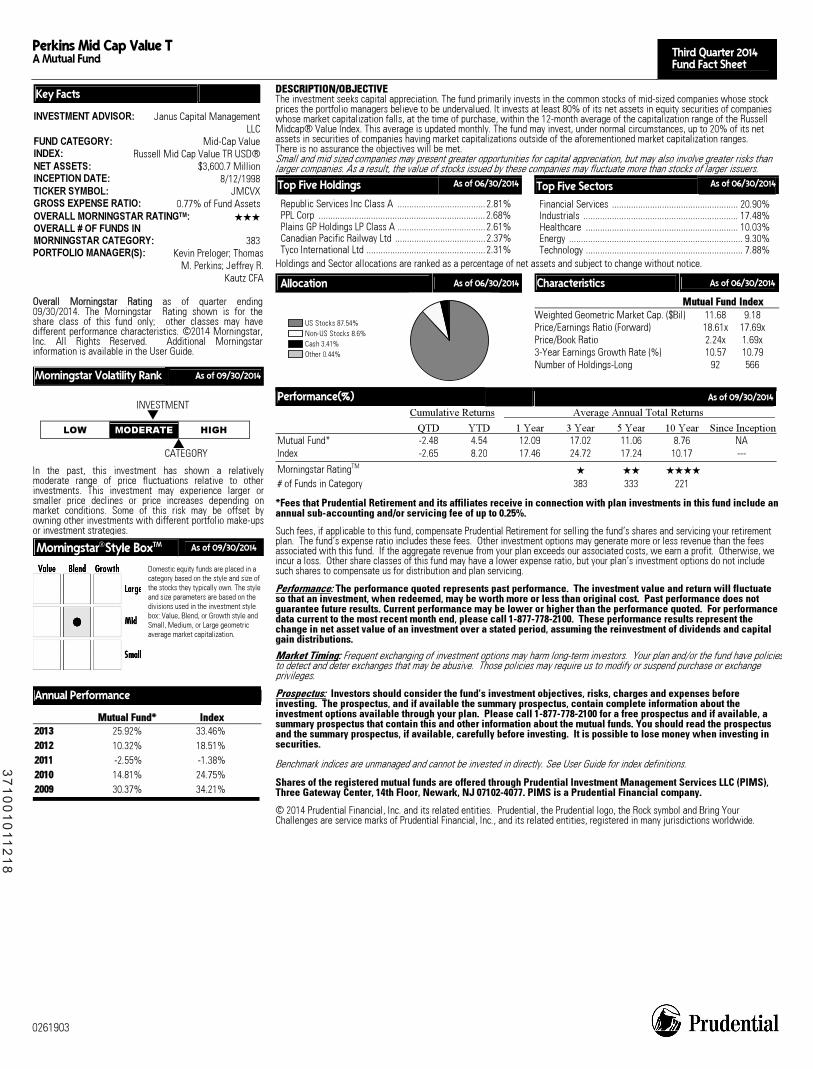
Perkins Mid Cap Value T A Mutual Fund Third Quarter 2014
Fund Fact Sheet
0261903
Key Facts INVESTMENT ADVISOR: Janus Capital Management
LLCFUND CATEGORY: Mid-Cap ValueINDEX: Russell Mid Cap Value TR USD®NET ASSETS: $3,600.7 MillionINCEPTION DATE: 8/12/1998TICKER SYMBOL: JMCVXGROSS EXPENSE RATIO: 0.77% of Fund AssetsOVERALL MORNINGSTAR RATINGTM: ��� OVERALL # OF FUNDS IN MORNINGSTAR CATEGORY: 383PORTFOLIO MANAGER(S): Kevin Preloger; Thomas
M. Perkins; Jeffrey R.Kautz CFA
OOvveerraallll MMoorrnniinnggssttaarr RRaattiinngg as of quarter ending09/30/2014. The Morningstar Rating shown is for theshare class of this fund only; other classes may havedifferent performance characteristics. ©2014 Morningstar,Inc. All Rights Reserved. Additional Morningstar information is available in the User Guide.
Morningstar Volatility Rank As of 09/30/2014
INVESTMENT �
LOW MODERATE HIGH � CATEGORY
In the past, this investment has shown a relativelymoderate range of price fluctuations relative to otherinvestments. This investment may experience larger orsmaller price declines or price increases depending onmarket conditions. Some of this risk may be offset byowning other investments with different portfolio make-ups or investment strategies.
MorningstarStyle BoxTM As of 09/30/2014
Domestic equity funds are placed in a category based on the style and size of the stocks they typically own. The style and size parameters are based on the divisions used in the investment style box: Value, Blend, or Growth style and Small, Medium, or Large geometric average market capitalization.
Annual Performance
MMuuttuuaall FFuunndd** IInnddeexx 22001133 25.92% 33.46%22001122 10.32% 18.51%22001111 -2.55% -1.38%22001100 14.81% 24.75%22000099 30.37% 34.21%
DDEESSCCRRIIPPTTIIOONN//OOBBJJEECCTTIIVVEEThe investment seeks capital appreciation. The fund primarily invests in the common stocks of mid-sized companies whose stock prices the portfolio managers believe to be undervalued. It invests at least 80% of its net assets in equity securities of companies whose market capitalization falls, at the time of purchase, within the 12-month average of the capitalization range of the Russell Midcap® Value Index. This average is updated monthly. The fund may invest, under normal circumstances, up to 20% of its net assets in securities of companies having market capitalizations outside of the aforementioned market capitalization ranges. There is no assurance the objectives will be met. Small and mid sized companies may present greater opportunities for capital appreciation, but may also involve greater risks than larger companies. As a result, the value of stocks issued by these companies may fluctuate more than stocks of larger issuers.
Top Five Holdings As of 06/30/2014
Republic Services Inc Class A .....................................2.81% PPL Corp ......................................................................2.68% Plains GP Holdings LP Class A .....................................2.61% Canadian Pacific Railway Ltd ......................................2.37% Tyco International Ltd ..................................................2.31%
Top Five Sectors As of 06/30/2014
Financial Services ..................................................... 20.90% Industrials ................................................................. 17.48% Healthcare ................................................................ 10.03% Energy ......................................................................... 9.30% Technology .................................................................. 7.88%
Holdings and Sector allocations are ranked as a percentage of net assets and subject to change without notice.
Allocation As of 06/30/2014
US Stocks 87.54%Non-US Stocks 8.6%Cash 3.41%Other 0.44%
Characteristics As of 06/30/2014
MMuuttuuaall FFuunndd IInnddeexx Weighted Geometric Market Cap. ($Bil) 11.68 9.18 Price/Earnings Ratio (Forward) 18.61x 17.69x Price/Book Ratio 2.24x 1.69x 3-Year Earnings Growth Rate (%) 10.57 10.79 Number of Holdings-Long 92 566
Performance(%) As of 09/30/2014
Cumulative Returns Average Annual Total Returns QTD YTD 1 Year 3 Year 5 Year 10 Year Since InceptionMutual Fund* -2.48 4.54 12.09 17.02 11.06 8.76 NA Index -2.65 8.20 17.46 24.72 17.24 10.17 ---
Morningstar RatingTM � �� ����
# of Funds in Category 383 333 221
*Fees that Prudential Retirement and its affiliates receive in connection with plan investments in this fund include an annual sub-accounting and/or servicing fee of up to 0.25%. Such fees, if applicable to this fund, compensate Prudential Retirement for selling the fund’s shares and servicing your retirement plan. The fund’s expense ratio includes these fees. Other investment options may generate more or less revenue than the fees associated with this fund. If the aggregate revenue from your plan exceeds our associated costs, we earn a profit. Otherwise, we incur a loss. Other share classes of this fund may have a lower expense ratio, but your plan’s investment options do not include such shares to compensate us for distribution and plan servicing.
Performance: The performance quoted represents past performance. The investment value and return will fluctuate so that an investment, when redeemed, may be worth more or less than original cost. Past performance does not guarantee future results. Current performance may be lower or higher than the performance quoted. For performance data current to the most recent month end, please call 1-877-778-2100. These performance results represent the change in net asset value of an investment over a stated period, assuming the reinvestment of dividends and capital gain distributions. Market Timing: Frequent exchanging of investment options may harm long-term investors. Your plan and/or the fund have policiesto detect and deter exchanges that may be abusive. Those policies may require us to modify or suspend purchase or exchange privileges.
Prospectus: Investors should consider the fund’s investment objectives, risks, charges and expenses before investing. The prospectus, and if available the summary prospectus, contain complete information about the investment options available through your plan. Please call 1-877-778-2100 for a free prospectus and if available, a summary prospectus that contain this and other information about the mutual funds. You should read the prospectus and the summary prospectus, if available, carefully before investing. It is possible to lose money when investing in securities.
Benchmark indices are unmanaged and cannot be invested in directly. See User Guide for index definitions.
Shares of the registered mutual funds are offered through Prudential Investment Management Services LLC (PIMS), Three Gateway Center, 14th Floor, Newark, NJ 07102-4077. PIMS is a Prudential Financial company. © 2014 Prudential Financial, Inc. and its related entities. Prudential, the Prudential logo, the Rock symbol and Bring Your Challenges are service marks of Prudential Financial, Inc., and its related entities, registered in many jurisdictions worldwide.
37
10
01
011
21
8

Fidelity Advisor® Leveraged Co StkInstl A Mutual Fund Third Quarter 2014
Fund Fact Sheet
0261903
Key Facts INVESTMENT ADVISOR: Fidelity Management &
Research CompanyFUND CATEGORY: Mid-Cap Blend
INDEX: Russell Mid Cap TR USD®NET ASSETS: $1,308.9 MillionINCEPTION DATE: 12/27/2000TICKER SYMBOL: FLVIXGROSS EXPENSE RATIO: 0.82% of Fund AssetsOVERALL MORNINGSTAR RATINGTM: ��� OVERALL # OF FUNDS IN MORNINGSTAR CATEGORY: 326 PORTFOLIO MANAGER(S): Thomas T. Soviero CFA
OOvveerraallll MMoorrnniinnggssttaarr RRaattiinngg as of quarter ending09/30/2014. The Morningstar Rating shown is for theshare class of this fund only; other classes may havedifferent performance characteristics. ©2014 Morningstar,Inc. All Rights Reserved. Additional Morningstarinformation is available in the User Guide.
Morningstar Volatility Rank As of 09/30/2014
INVESTMENT �
LOW MODERATE HIGH � CATEGORY
In the past, this investment has shown a wide range ofprice fluctuations relative to other investments. Thisinvestment may experience significant price increases in favorable markets or undergo large price declines inadverse markets. Some of this risk may be offset by owningother investments that follow different investmentstrategies.
MorningstarStyle BoxTM As of 09/30/2014
Domestic equity funds are placed in a category based on the style and size of the stocks they typically own. The style and size parameters are based on the divisions used in the investment style box: Value, Blend, or Growth style and Small, Medium, or Large geometric average market capitalization.
Annual Performance
MMuuttuuaall FFuunndd** IInnddeexx 22001133 36.81% 34.76%22001122 29.68% 17.28%22001111 -10.44% -1.55%22001100 24.71% 25.48%22000099 60.21% 40.48%
DDEESSCCRRIIPPTTIIOONN//OOBBJJEECCTTIIVVEEThe investment seeks capital appreciation. The fund normally invests at least 80% of assets in stocks. It normally invests primarily in common stocks of leveraged companies (companies that issue lower-quality debt and other companies with leveraged capital structures). The fund may also invest in lower-quality debt securities. It may invest in domestic and foreign issuers. The fund invests in either "growth" stocks or "value" stocks or both. There is no assurance the objectives will be met. Small and mid sized companies may present greater opportunities for capital appreciation, but may also involve greater risks than larger companies. As a result, the value of stocks issued by these companies may fluctuate more than stocks of larger issuers.
Top Five Holdings As of 07/31/2014
LyondellBasell Industries NV .....................................10.17% Service Corp International Inc .....................................3.94% Comcast Corp Class A .................................................3.63% Ford Motor Co ..............................................................2.55% General Motors Co ......................................................2.48%
Top Five Sectors As of 07/31/2014
Consumer Cyclical ..................................................... 22.71% Basic Materials ......................................................... 13.96% Healthcare ................................................................ 11.71% Industrials ................................................................. 11.21% Financial Services ....................................................... 9.91%
Holdings and Sector allocations are ranked as a percentage of net assets and subject to change without notice.
Allocation As of 07/31/2014
US Stocks 90.68%Cash 5.87%Non-US Stocks 2.87%Non-US Bonds 0.25%Preferred 0.21%US Bonds 0.13%
Characteristics As of 07/31/2014
MMuuttuuaall FFuunndd IInnddeexx Weighted Geometric Market Cap. ($Bil) 18.07 10.03 Price/Earnings Ratio (Forward) 15.72x 19.57x Price/Book Ratio 1.96x 2.38x 3-Year Earnings Growth Rate (%) 22.18 13.93 Number of Holdings-Long 127 838
Performance(%) As of 09/30/2014
Cumulative Returns Average Annual Total Returns QTD YTD 1 Year 3 Year 5 Year 10 Year Since InceptionMutual Fund* -1.83 5.00 14.13 28.91 16.88 11.40 NA Index -1.66 6.87 15.83 23.79 17.19 10.34 ---
Morningstar RatingTM ����� ��� ��� # of Funds in Category 326 299 184
*Fees that Prudential Retirement and its affiliates receive in connection with plan investments in this fund include an annual sub-accounting and/or servicing fee of up to 0.25%. Such fees, if applicable to this fund, compensate Prudential Retirement for selling the fund’s shares and servicing your retirement plan. The fund’s expense ratio includes these fees. Other investment options may generate more or less revenue than the fees associated with this fund. If the aggregate revenue from your plan exceeds our associated costs, we earn a profit. Otherwise, we incur a loss. Other share classes of this fund may have a lower expense ratio, but your plan’s investment options do not include such shares to compensate us for distribution and plan servicing.
Performance: The performance quoted represents past performance. The investment value and return will fluctuate so that an investment, when redeemed, may be worth more or less than original cost. Past performance does not guarantee future results. Current performance may be lower or higher than the performance quoted. For performance data current to the most recent month end, please call 1-877-778-2100. These performance results represent the change in net asset value of an investment over a stated period, assuming the reinvestment of dividends and capital gain distributions. Market Timing: Frequent exchanging of investment options may harm long-term investors. Your plan and/or the fund have policiesto detect and deter exchanges that may be abusive. Those policies may require us to modify or suspend purchase or exchange privileges. Prospectus: Investors should consider the fund’s investment objectives, risks, charges and expenses before investing. The prospectus, and if available the summary prospectus, contain complete information about the investment options available through your plan. Please call 1-877-778-2100 for a free prospectus and if available, a summary prospectus that contain this and other information about the mutual funds. You should read the prospectus and the summary prospectus, if available, carefully before investing. It is possible to lose money when investing in securities.
Benchmark indices are unmanaged and cannot be invested in directly. See User Guide for index definitions. Shares of the registered mutual funds are offered through Prudential Investment Management Services LLC (PIMS), Three Gateway Center, 14th Floor, Newark, NJ 07102-4077. PIMS is a Prudential Financial company. © 2014 Prudential Financial, Inc. and its related entities. Prudential, the Prudential logo, the Rock symbol and Bring Your Challenges are service marks of Prudential Financial, Inc., and its related entities, registered in many jurisdictions worldwide.
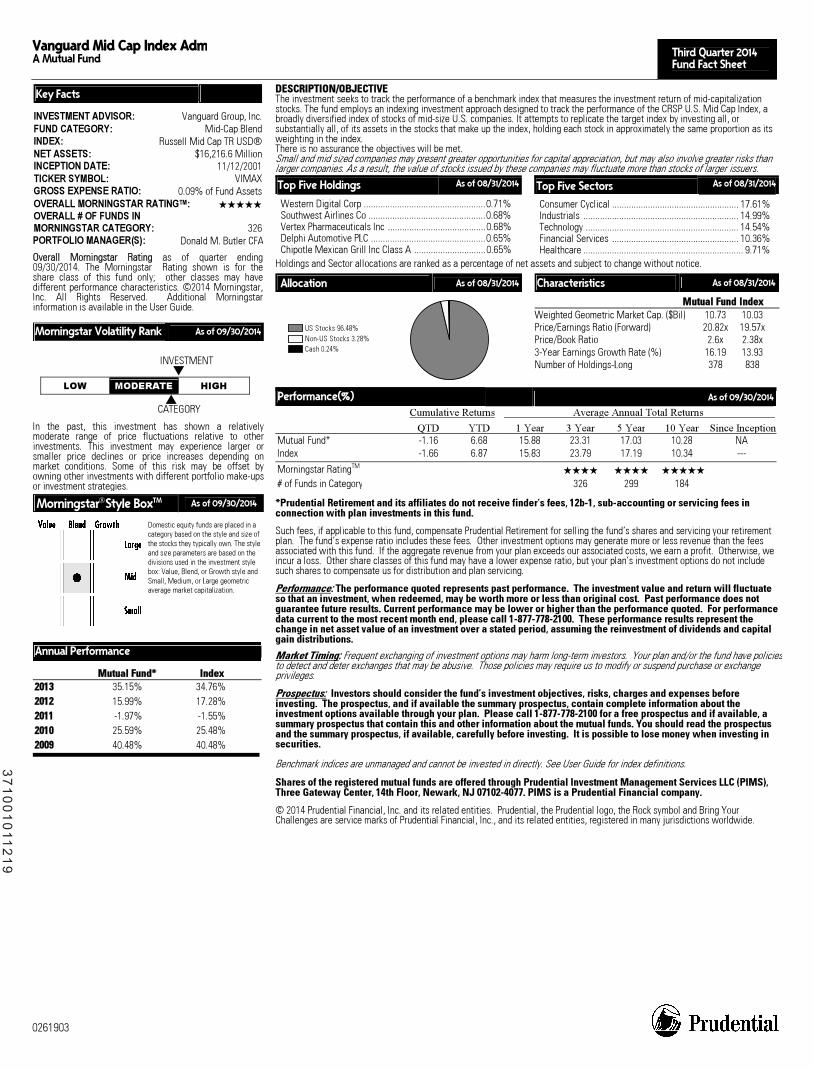
Vanguard Mid Cap Index Adm A Mutual Fund Third Quarter 2014
Fund Fact Sheet
0261903
Key Facts INVESTMENT ADVISOR: Vanguard Group, Inc.FUND CATEGORY: Mid-Cap BlendINDEX: Russell Mid Cap TR USD® NET ASSETS: $16,216.6 MillionINCEPTION DATE: 11/12/2001 TICKER SYMBOL: VIMAXGROSS EXPENSE RATIO: 0.09% of Fund Assets
OVERALL MORNINGSTAR RATINGTM: ����� OVERALL # OF FUNDS IN MORNINGSTAR CATEGORY: 326PORTFOLIO MANAGER(S): Donald M. Butler CFA
OOvveerraallll MMoorrnniinnggssttaarr RRaattiinngg as of quarter ending09/30/2014. The Morningstar Rating shown is for theshare class of this fund only; other classes may havedifferent performance characteristics. ©2014 Morningstar,Inc. All Rights Reserved. Additional Morningstarinformation is available in the User Guide.
Morningstar Volatility Rank As of 09/30/2014
INVESTMENT �
LOW MODERATE HIGH � CATEGORY
In the past, this investment has shown a relativelymoderate range of price fluctuations relative to otherinvestments. This investment may experience larger orsmaller price declines or price increases depending onmarket conditions. Some of this risk may be offset byowning other investments with different portfolio make-ups or investment strategies.
MorningstarStyle BoxTM As of 09/30/2014
Domestic equity funds are placed in a category based on the style and size of the stocks they typically own. The style and size parameters are based on the divisions used in the investment style box: Value, Blend, or Growth style and Small, Medium, or Large geometric average market capitalization.
Annual Performance
MMuuttuuaall FFuunndd** IInnddeexx 22001133 35.15% 34.76% 22001122 15.99% 17.28%22001111 -1.97% -1.55%22001100 25.59% 25.48%22000099 40.48% 40.48%
DDEESSCCRRIIPPTTIIOONN//OOBBJJEECCTTIIVVEEThe investment seeks to track the performance of a benchmark index that measures the investment return of mid-capitalization stocks. The fund employs an indexing investment approach designed to track the performance of the CRSP U.S. Mid Cap Index, a broadly diversified index of stocks of mid-size U.S. companies. It attempts to replicate the target index by investing all, or substantially all, of its assets in the stocks that make up the index, holding each stock in approximately the same proportion as its weighting in the index. There is no assurance the objectives will be met. Small and mid sized companies may present greater opportunities for capital appreciation, but may also involve greater risks than larger companies. As a result, the value of stocks issued by these companies may fluctuate more than stocks of larger issuers.
Top Five Holdings As of 08/31/2014
Western Digital Corp ...................................................0.71% Southwest Airlines Co .................................................0.68% Vertex Pharmaceuticals Inc .........................................0.68% Delphi Automotive PLC ................................................0.65% Chipotle Mexican Grill Inc Class A ..............................0.65%
Top Five Sectors As of 08/31/2014
Consumer Cyclical ..................................................... 17.61% Industrials ................................................................. 14.99% Technology ................................................................ 14.54% Financial Services ..................................................... 10.36% Healthcare ................................................................... 9.71%
Holdings and Sector allocations are ranked as a percentage of net assets and subject to change without notice.
Allocation As of 08/31/2014
US Stocks 96.48%Non-US Stocks 3.28%Cash 0.24%
Characteristics As of 08/31/2014
MMuuttuuaall FFuunndd IInnddeexx Weighted Geometric Market Cap. ($Bil) 10.73 10.03Price/Earnings Ratio (Forward) 20.82x 19.57xPrice/Book Ratio 2.6x 2.38x3-Year Earnings Growth Rate (%) 16.19 13.93Number of Holdings-Long 378 838
Performance(%) As of 09/30/2014
Cumulative Returns Average Annual Total Returns QTD YTD 1 Year 3 Year 5 Year 10 Year Since InceptionMutual Fund* -1.16 6.68 15.88 23.31 17.03 10.28 NAIndex -1.66 6.87 15.83 23.79 17.19 10.34 ---
Morningstar RatingTM���� ���� �����
# of Funds in Category 326 299 184
*Prudential Retirement and its affiliates do not receive finder’s fees, 12b-1, sub-accounting or servicing fees in connection with plan investments in this fund. Such fees, if applicable to this fund, compensate Prudential Retirement for selling the fund’s shares and servicing your retirement plan. The fund’s expense ratio includes these fees. Other investment options may generate more or less revenue than the fees associated with this fund. If the aggregate revenue from your plan exceeds our associated costs, we earn a profit. Otherwise, we incur a loss. Other share classes of this fund may have a lower expense ratio, but your plan’s investment options do not include such shares to compensate us for distribution and plan servicing. Performance: The performance quoted represents past performance. The investment value and return will fluctuate so that an investment, when redeemed, may be worth more or less than original cost. Past performance does not guarantee future results. Current performance may be lower or higher than the performance quoted. For performance data current to the most recent month end, please call 1-877-778-2100. These performance results represent the change in net asset value of an investment over a stated period, assuming the reinvestment of dividends and capital gain distributions. Market Timing: Frequent exchanging of investment options may harm long-term investors. Your plan and/or the fund have policies to detect and deter exchanges that may be abusive. Those policies may require us to modify or suspend purchase or exchange privileges. Prospectus: Investors should consider the fund’s investment objectives, risks, charges and expenses before investing. The prospectus, and if available the summary prospectus, contain complete information about the investment options available through your plan. Please call 1-877-778-2100 for a free prospectus and if available, a summary prospectus that contain this and other information about the mutual funds. You should read the prospectus and the summary prospectus, if available, carefully before investing. It is possible to lose money when investing in securities.
Benchmark indices are unmanaged and cannot be invested in directly. See User Guide for index definitions. Shares of the registered mutual funds are offered through Prudential Investment Management Services LLC (PIMS), Three Gateway Center, 14th Floor, Newark, NJ 07102-4077. PIMS is a Prudential Financial company. © 2014 Prudential Financial, Inc. and its related entities. Prudential, the Prudential logo, the Rock symbol and Bring Your Challenges are service marks of Prudential Financial, Inc., and its related entities, registered in many jurisdictions worldwide.
37
10
01
011
21
9
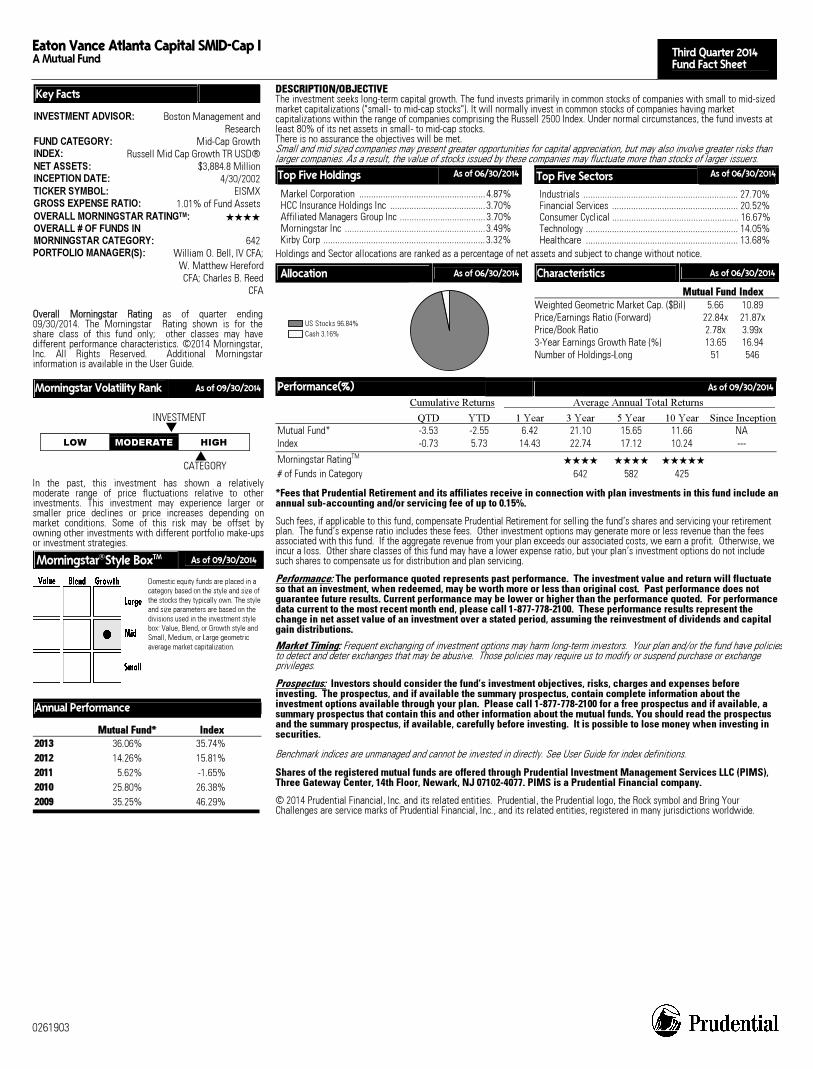
Eaton Vance Atlanta Capital SMID-Cap I A Mutual Fund Third Quarter 2014
Fund Fact Sheet
0261903
Key Facts INVESTMENT ADVISOR: Boston Management and
ResearchFUND CATEGORY: Mid-Cap GrowthINDEX: Russell Mid Cap Growth TR USD®NET ASSETS: $3,884.8 MillionINCEPTION DATE: 4/30/2002TICKER SYMBOL: EISMXGROSS EXPENSE RATIO: 1.01% of Fund AssetsOVERALL MORNINGSTAR RATINGTM: ���� OVERALL # OF FUNDS IN MORNINGSTAR CATEGORY: 642PORTFOLIO MANAGER(S): William O. Bell, IV CFA;
W. Matthew HerefordCFA; Charles B. Reed
CFA
OOvveerraallll MMoorrnniinnggssttaarr RRaattiinngg as of quarter ending09/30/2014. The Morningstar Rating shown is for theshare class of this fund only; other classes may havedifferent performance characteristics. ©2014 Morningstar,Inc. All Rights Reserved. Additional Morningstarinformation is available in the User Guide.
Morningstar Volatility Rank As of 09/30/2014
INVESTMENT �
LOW MODERATE HIGH � CATEGORY
In the past, this investment has shown a relativelymoderate range of price fluctuations relative to otherinvestments. This investment may experience larger orsmaller price declines or price increases depending onmarket conditions. Some of this risk may be offset byowning other investments with different portfolio make-ups or investment strategies.
MorningstarStyle BoxTM As of 09/30/2014
Domestic equity funds are placed in a category based on the style and size of the stocks they typically own. The style and size parameters are based on the divisions used in the investment style box: Value, Blend, or Growth style and Small, Medium, or Large geometric average market capitalization.
Annual Performance
MMuuttuuaall FFuunndd** IInnddeexx 22001133 36.06% 35.74%22001122 14.26% 15.81%22001111 5.62% -1.65%22001100 25.80% 26.38%22000099 35.25% 46.29%
DDEESSCCRRIIPPTTIIOONN//OOBBJJEECCTTIIVVEEThe investment seeks long-term capital growth. The fund invests primarily in common stocks of companies with small to mid-sized market capitalizations ("small- to mid-cap stocks"). It will normally invest in common stocks of companies having market capitalizations within the range of companies comprising the Russell 2500 Index. Under normal circumstances, the fund invests at least 80% of its net assets in small- to mid-cap stocks. There is no assurance the objectives will be met. Small and mid sized companies may present greater opportunities for capital appreciation, but may also involve greater risks than larger companies. As a result, the value of stocks issued by these companies may fluctuate more than stocks of larger issuers.
Top Five Holdings As of 06/30/2014
Markel Corporation .....................................................4.87% HCC Insurance Holdings Inc ........................................3.70% Affiliated Managers Group Inc ....................................3.70% Morningstar Inc ...........................................................3.49% Kirby Corp ....................................................................3.32%
Top Five Sectors As of 06/30/2014
Industrials ................................................................. 27.70% Financial Services ..................................................... 20.52% Consumer Cyclical ..................................................... 16.67% Technology ................................................................ 14.05% Healthcare ................................................................ 13.68%
Holdings and Sector allocations are ranked as a percentage of net assets and subject to change without notice.
Allocation As of 06/30/2014
US Stocks 96.84%Cash 3.16%
Characteristics As of 06/30/2014
MMuuttuuaall FFuunndd IInnddeexx Weighted Geometric Market Cap. ($Bil) 5.66 10.89 Price/Earnings Ratio (Forward) 22.84x 21.87x Price/Book Ratio 2.78x 3.99x 3-Year Earnings Growth Rate (%) 13.65 16.94 Number of Holdings-Long 51 546
Performance(%) As of 09/30/2014
Cumulative Returns Average Annual Total Returns QTD YTD 1 Year 3 Year 5 Year 10 Year Since InceptionMutual Fund* -3.53 -2.55 6.42 21.10 15.65 11.66 NA Index -0.73 5.73 14.43 22.74 17.12 10.24 ---
Morningstar RatingTM ���� ���� �����
# of Funds in Category 642 582 425
*Fees that Prudential Retirement and its affiliates receive in connection with plan investments in this fund include an annual sub-accounting and/or servicing fee of up to 0.15%. Such fees, if applicable to this fund, compensate Prudential Retirement for selling the fund’s shares and servicing your retirement plan. The fund’s expense ratio includes these fees. Other investment options may generate more or less revenue than the fees associated with this fund. If the aggregate revenue from your plan exceeds our associated costs, we earn a profit. Otherwise, we incur a loss. Other share classes of this fund may have a lower expense ratio, but your plan’s investment options do not include such shares to compensate us for distribution and plan servicing.
Performance: The performance quoted represents past performance. The investment value and return will fluctuate so that an investment, when redeemed, may be worth more or less than original cost. Past performance does not guarantee future results. Current performance may be lower or higher than the performance quoted. For performance data current to the most recent month end, please call 1-877-778-2100. These performance results represent the change in net asset value of an investment over a stated period, assuming the reinvestment of dividends and capital gain distributions. Market Timing: Frequent exchanging of investment options may harm long-term investors. Your plan and/or the fund have policiesto detect and deter exchanges that may be abusive. Those policies may require us to modify or suspend purchase or exchange privileges. Prospectus: Investors should consider the fund’s investment objectives, risks, charges and expenses before investing. The prospectus, and if available the summary prospectus, contain complete information about the investment options available through your plan. Please call 1-877-778-2100 for a free prospectus and if available, a summary prospectus that contain this and other information about the mutual funds. You should read the prospectus and the summary prospectus, if available, carefully before investing. It is possible to lose money when investing in securities.
Benchmark indices are unmanaged and cannot be invested in directly. See User Guide for index definitions. Shares of the registered mutual funds are offered through Prudential Investment Management Services LLC (PIMS), Three Gateway Center, 14th Floor, Newark, NJ 07102-4077. PIMS is a Prudential Financial company. © 2014 Prudential Financial, Inc. and its related entities. Prudential, the Prudential logo, the Rock symbol and Bring Your Challenges are service marks of Prudential Financial, Inc., and its related entities, registered in many jurisdictions worldwide.
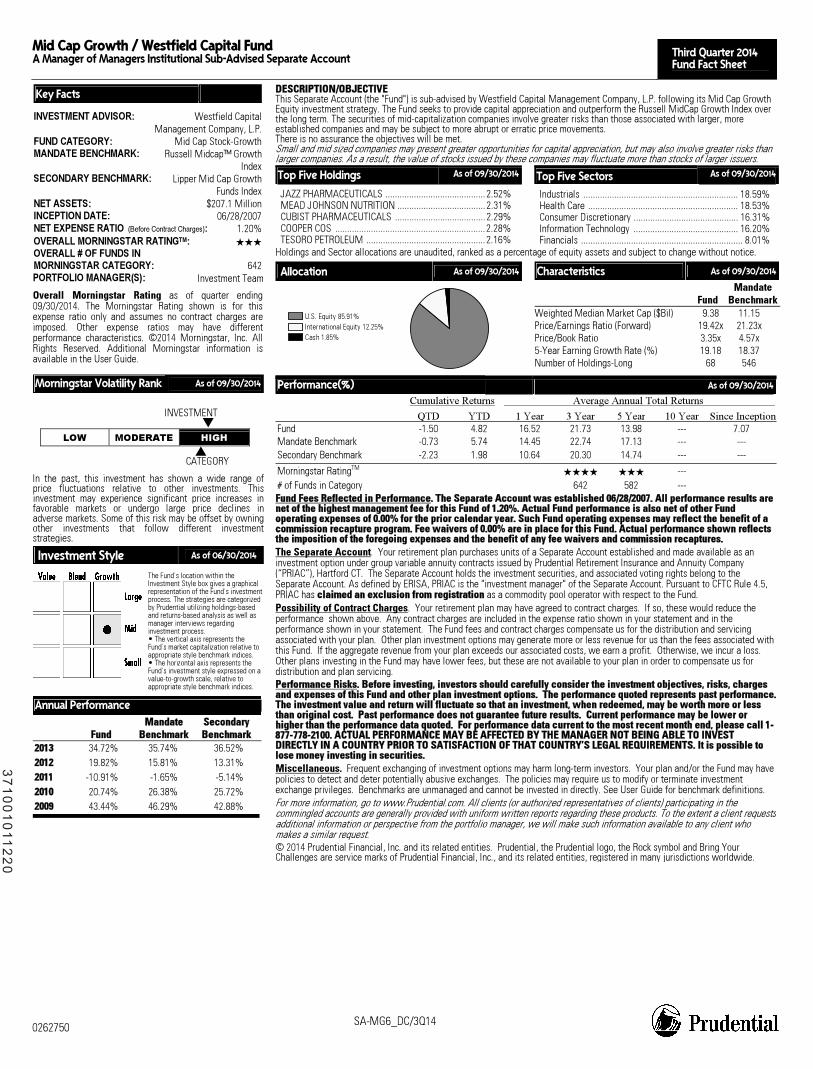
Mid Cap Growth / Westfield Capital Fund A Manager of Managers Institutional Sub-Advised Separate Account Third Quarter 2014
Fund Fact Sheet
0262750 SA-MG6_DC/3Q14
Key Facts INVESTMENT ADVISOR: Westfield Capital
Management Company, L.P.FUND CATEGORY: Mid Cap Stock-GrowthMANDATE BENCHMARK: Russell Midcap™ Growth
IndexSECONDARY BENCHMARK: Lipper Mid Cap Growth
Funds IndexNET ASSETS: $207.1 MillionINCEPTION DATE: 06/28/2007NET EXPENSE RATIO (Before Contract Charges): 1.20%OVERALL MORNINGSTAR RATINGTM: ��� OVERALL # OF FUNDS IN MORNINGSTAR CATEGORY: 642PORTFOLIO MANAGER(S): Investment Team
Overall Morningstar Rating as of quarter ending09/30/2014. The Morningstar Rating shown is for thisexpense ratio only and assumes no contract charges areimposed. Other expense ratios may have differentperformance characteristics. ©2014 Morningstar, Inc. AllRights Reserved. Additional Morningstar information is available in the User Guide.
Morningstar Volatility Rank As of 09/30/2014
INVESTMENT �
LOW MODERATE HIGH � CATEGORY
In the past, this investment has shown a wide range ofprice fluctuations relative to other investments. Thisinvestment may experience significant price increases infavorable markets or undergo large price declines inadverse markets. Some of this risk may be offset by owningother investments that follow different investmentstrategies.
Investment Style As of 06/30/2014
The Fund’s location within the Investment Style box gives a graphical representation of the Fund’s investment process. The strategies are categorized by Prudential utilizing holdings-based and returns-based analysis as well as manager interviews regarding investment process. • The vertical axis represents the Fund’s market capitalization relative to appropriate style benchmark indices. • The horizontal axis represents the Fund’s investment style expressed on a value-to-growth scale, relative to appropriate style benchmark indices.
Annual Performance
FFuunndd MMaannddaattee
BBeenncchhmmaarrkk SSeeccoonnddaarryy BBeenncchhmmaarrkk
22001133 34.72% 35.74% 36.52%22001122 19.82% 15.81% 13.31%22001111 -10.91% -1.65% -5.14%22001100 20.74% 26.38% 25.72%22000099 43.44% 46.29% 42.88%
DDEESSCCRRIIPPTTIIOONN//OOBBJJEECCTTIIVVEEThis Separate Account (the "Fund") is sub-advised by Westfield Capital Management Company, L.P. following its Mid Cap Growth Equity investment strategy. The Fund seeks to provide capital appreciation and outperform the Russell MidCap Growth Index over the long term. The securities of mid-capitalization companies involve greater risks than those associated with larger, more established companies and may be subject to more abrupt or erratic price movements. There is no assurance the objectives will be met. Small and mid sized companies may present greater opportunities for capital appreciation, but may also involve greater risks than larger companies. As a result, the value of stocks issued by these companies may fluctuate more than stocks of larger issuers.
Top Five Holdings As of 09/30/2014
JAZZ PHARMACEUTICALS ..........................................2.52% MEAD JOHNSON NUTRITION .....................................2.31% CUBIST PHARMACEUTICALS ......................................2.29% COOPER COS ...............................................................2.28% TESORO PETROLEUM ..................................................2.16%
Top Five Sectors As of 09/30/2014
Industrials ................................................................. 18.59% Health Care ............................................................... 18.53% Consumer Discretionary ............................................ 16.31% Information Technology ............................................ 16.20% Financials .................................................................... 8.01%
Holdings and Sector allocations are unaudited, ranked as a percentage of equity assets and subject to change without notice.
Allocation As of 09/30/2014
U.S. Equity 85.91%International Equity 12.25%Cash 1.85%
Characteristics As of 09/30/2014
Fund Mandate
BenchmarkWeighted Median Market Cap ($Bil) 9.38 11.15 Price/Earnings Ratio (Forward) 19.42x 21.23x Price/Book Ratio 3.35x 4.57x 5-Year Earning Growth Rate (%) 19.18 18.37 Number of Holdings-Long 68 546
Performance(%) As of 09/30/2014
Cumulative Returns Average Annual Total Returns QTD YTD 1 Year 3 Year 5 Year 10 Year Since InceptionFund -1.50 4.82 16.52 21.73 13.98 --- 7.07 Mandate Benchmark -0.73 5.74 14.45 22.74 17.13 --- --- Secondary Benchmark -2.23 1.98 10.64 20.30 14.74 --- ---
Morningstar RatingTM ���� ��� --- # of Funds in Category 642 582 ---
FFuunndd FFeeeess RReefflleecctteedd iinn PPeerrffoorrmmaannccee.. TThhee SSeeppaarraattee AAccccoouunntt wwaass eessttaabblliisshheedd 0066//2288//22000077.. AAllll ppeerrffoorrmmaannccee rreessuullttss aarree nneett ooff tthhee hhiigghheesstt mmaannaaggeemmeenntt ffeeee ffoorr tthhiiss FFuunndd ooff 11..2200%%.. AAccttuuaall FFuunndd ppeerrffoorrmmaannccee iiss aallssoo nneett ooff ootthheerr FFuunndd ooppeerraattiinngg eexxppeennsseess ooff 00..0000%% ffoorr tthhee pprriioorr ccaalleennddaarr yyeeaarr.. SSuucchh FFuunndd ooppeerraattiinngg eexxppeennsseess mmaayy rreefflleecctt tthhee bbeenneeffiitt ooff aa ccoommmmiissssiioonn rreeccaappttuurree pprrooggrraamm.. FFeeee wwaaiivveerrss ooff 00..0000%% aarree iinn ppllaaccee ffoorr tthhiiss FFuunndd.. AAccttuuaall ppeerrffoorrmmaannccee sshhoowwnn rreefflleeccttss tthhee iimmppoossiittiioonn ooff tthhee ffoorreeggooiinngg eexxppeennsseess aanndd tthhee bbeenneeffiitt ooff aannyy ffeeee wwaaiivveerrss aanndd ccoommmmiissssiioonn rreeccaappttuurreess..
The Separate Account. Your retirement plan purchases units of a Separate Account established and made available as an investment option under group variable annuity contracts issued by Prudential Retirement Insurance and Annuity Company (“PRIAC”), Hartford CT. The Separate Account holds the investment securities, and associated voting rights belong to the Separate Account. As defined by ERISA, PRIAC is the "investment manager" of the Separate Account. Pursuant to CFTC Rule 4.5, PRIAC has ccllaaiimmeedd aann eexxcclluussiioonn ffrroomm rreeggiissttrraattiioonn as a commodity pool operator with respect to the Fund.
Possibility of Contract Charges. Your retirement plan may have agreed to contract charges. If so, these would reduce the performance shown above. Any contract charges are included in the expense ratio shown in your statement and in the performance shown in your statement. The Fund fees and contract charges compensate us for the distribution and servicing associated with your plan. Other plan investment options may generate more or less revenue for us than the fees associated with this Fund. If the aggregate revenue from your plan exceeds our associated costs, we earn a profit. Otherwise, we incur a loss. Other plans investing in the Fund may have lower fees, but these are not available to your plan in order to compensate us for distribution and plan servicing.
PPeerrffoorrmmaannccee RRiisskkss.. BBeeffoorree iinnvveessttiinngg,, iinnvveessttoorrss sshhoouulldd ccaarreeffuullllyy ccoonnssiiddeerr tthhee iinnvveessttmmeenntt oobbjjeeccttiivveess,, rriisskkss,, cchhaarrggeess aanndd eexxppeennsseess ooff tthhiiss FFuunndd aanndd ootthheerr ppllaann iinnvveessttmmeenntt ooppttiioonnss.. TThhee ppeerrffoorrmmaannccee qquuootteedd rreepprreesseennttss ppaasstt ppeerrffoorrmmaannccee.. TThhee iinnvveessttmmeenntt vvaalluuee aanndd rreettuurrnn wwiillll fflluuccttuuaattee ssoo tthhaatt aann iinnvveessttmmeenntt,, wwhheenn rreeddeeeemmeedd,, mmaayy bbee wwoorrtthh mmoorree oorr lleessss tthhaann oorriiggiinnaall ccoosstt.. PPaasstt ppeerrffoorrmmaannccee ddooeess nnoott gguuaarraanntteeee ffuuttuurree rreessuullttss.. CCuurrrreenntt ppeerrffoorrmmaannccee mmaayy bbee lloowweerr oorr hhiigghheerr tthhaann tthhee ppeerrffoorrmmaannccee ddaattaa qquuootteedd.. FFoorr ppeerrffoorrmmaannccee ddaattaa ccuurrrreenntt ttoo tthhee mmoosstt rreecceenntt mmoonntthh eenndd,, pplleeaassee ccaallll 11--887777--777788--22110000.. AACCTTUUAALL PPEERRFFOORRMMAANNCCEE MMAAYY BBEE AAFFFFEECCTTEEDD BBYY TTHHEE MMAANNAAGGEERR NNOOTT BBEEIINNGG AABBLLEE TTOO IINNVVEESSTT DDIIRREECCTTLLYY IINN AA CCOOUUNNTTRRYY PPRRIIOORR TTOO SSAATTIISSFFAACCTTIIOONN OOFF TTHHAATT CCOOUUNNTTRRYY’’SS LLEEGGAALL RREEQQUUIIRREEMMEENNTTSS.. IItt iiss ppoossssiibbllee ttoo lloossee mmoonneeyy iinnvveessttiinngg iinn sseeccuurriittiieess..
Miscellaneous. Frequent exchanging of investment options may harm long-term investors. Your plan and/or the Fund may have policies to detect and deter potentially abusive exchanges. The policies may require us to modify or terminate investment exchange privileges. Benchmarks are unmanaged and cannot be invested in directly. See User Guide for benchmark definitions.
For more information, go to www.Prudential.com. All clients (or authorized representatives of clients) participating in the commingled accounts are generally provided with uniform written reports regarding these products. To the extent a client requests additional information or perspective from the portfolio manager, we will make such information available to any client who makes a similar request.
© 2014 Prudential Financial, Inc. and its related entities. Prudential, the Prudential logo, the Rock symbol and Bring Your Challenges are service marks of Prudential Financial, Inc., and its related entities, registered in many jurisdictions worldwide.
37
10
01
011
22
0
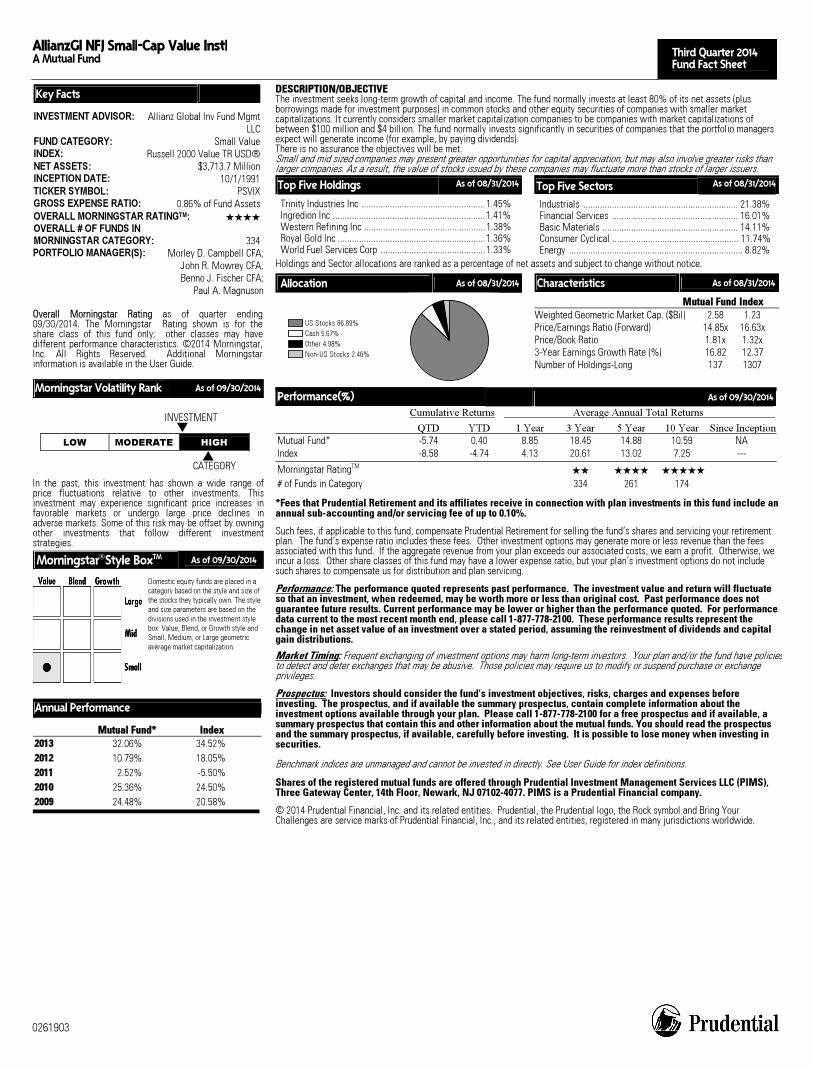
AllianzGI NFJ Small-Cap Value Instl A Mutual Fund Third Quarter 2014
Fund Fact Sheet
0261903
Key Facts INVESTMENT ADVISOR: Allianz Global Inv Fund Mgmt
LLCFUND CATEGORY: Small ValueINDEX: Russell 2000 Value TR USD®NET ASSETS: $3,713.7 MillionINCEPTION DATE: 10/1/1991TICKER SYMBOL: PSVIXGROSS EXPENSE RATIO: 0.86% of Fund AssetsOVERALL MORNINGSTAR RATINGTM: ���� OVERALL # OF FUNDS IN MORNINGSTAR CATEGORY: 334PORTFOLIO MANAGER(S): Morley D. Campbell CFA;
John R. Mowrey CFA;Benno J. Fischer CFA;
Paul A. Magnuson
OOvveerraallll MMoorrnniinnggssttaarr RRaattiinngg as of quarter ending09/30/2014. The Morningstar Rating shown is for theshare class of this fund only; other classes may havedifferent performance characteristics. ©2014 Morningstar,Inc. All Rights Reserved. Additional Morningstarinformation is available in the User Guide.
Morningstar Volatility Rank As of 09/30/2014
INVESTMENT �
LOW MODERATE HIGH � CATEGORY
In the past, this investment has shown a wide range ofprice fluctuations relative to other investments. Thisinvestment may experience significant price increases infavorable markets or undergo large price declines inadverse markets. Some of this risk may be offset by owningother investments that follow different investmentstrategies.
MorningstarStyle BoxTM As of 09/30/2014
Domestic equity funds are placed in a category based on the style and size of the stocks they typically own. The style and size parameters are based on the divisions used in the investment style box: Value, Blend, or Growth style and Small, Medium, or Large geometric average market capitalization.
Annual Performance
MMuuttuuaall FFuunndd** IInnddeexx 22001133 32.06% 34.52%22001122 10.79% 18.05%22001111 2.52% -5.50%22001100 25.36% 24.50%22000099 24.48% 20.58%
DDEESSCCRRIIPPTTIIOONN//OOBBJJEECCTTIIVVEEThe investment seeks long-term growth of capital and income. The fund normally invests at least 80% of its net assets (plus borrowings made for investment purposes) in common stocks and other equity securities of companies with smaller market capitalizations. It currently considers smaller market capitalization companies to be companies with market capitalizations of between $100 million and $4 billion. The fund normally invests significantly in securities of companies that the portfolio managers expect will generate income (for example, by paying dividends). There is no assurance the objectives will be met. Small and mid sized companies may present greater opportunities for capital appreciation, but may also involve greater risks than larger companies. As a result, the value of stocks issued by these companies may fluctuate more than stocks of larger issuers.
Top Five Holdings As of 08/31/2014
Trinity Industries Inc ....................................................1.45% Ingredion Inc ................................................................1.41% Western Refining Inc ...................................................1.38% Royal Gold Inc ..............................................................1.36% World Fuel Services Corp ............................................1.33%
Top Five Sectors As of 08/31/2014
Industrials ................................................................. 21.38% Financial Services ..................................................... 16.01% Basic Materials ......................................................... 14.11% Consumer Cyclical ..................................................... 11.74% Energy ......................................................................... 8.82%
Holdings and Sector allocations are ranked as a percentage of net assets and subject to change without notice.
Allocation As of 08/31/2014
US Stocks 86.89%Cash 5.67%Other 4.98%Non-US Stocks 2.46%
Characteristics As of 08/31/2014
MMuuttuuaall FFuunndd IInnddeexx Weighted Geometric Market Cap. ($Bil) 2.58 1.23 Price/Earnings Ratio (Forward) 14.85x 16.63x Price/Book Ratio 1.81x 1.32x 3-Year Earnings Growth Rate (%) 16.82 12.37 Number of Holdings-Long 137 1307
Performance(%) As of 09/30/2014
Cumulative Returns Average Annual Total Returns QTD YTD 1 Year 3 Year 5 Year 10 Year Since InceptionMutual Fund* -5.74 0.40 8.85 18.45 14.88 10.59 NA Index -8.58 -4.74 4.13 20.61 13.02 7.25 ---
Morningstar RatingTM �� ���� �����
# of Funds in Category 334 261 174
*Fees that Prudential Retirement and its affiliates receive in connection with plan investments in this fund include an annual sub-accounting and/or servicing fee of up to 0.10%. Such fees, if applicable to this fund, compensate Prudential Retirement for selling the fund’s shares and servicing your retirement plan. The fund’s expense ratio includes these fees. Other investment options may generate more or less revenue than the fees associated with this fund. If the aggregate revenue from your plan exceeds our associated costs, we earn a profit. Otherwise, we incur a loss. Other share classes of this fund may have a lower expense ratio, but your plan’s investment options do not include such shares to compensate us for distribution and plan servicing.
Performance: The performance quoted represents past performance. The investment value and return will fluctuate so that an investment, when redeemed, may be worth more or less than original cost. Past performance does not guarantee future results. Current performance may be lower or higher than the performance quoted. For performance data current to the most recent month end, please call 1-877-778-2100. These performance results represent the change in net asset value of an investment over a stated period, assuming the reinvestment of dividends and capital gain distributions. Market Timing: Frequent exchanging of investment options may harm long-term investors. Your plan and/or the fund have policiesto detect and deter exchanges that may be abusive. Those policies may require us to modify or suspend purchase or exchange privileges.
Prospectus: Investors should consider the fund’s investment objectives, risks, charges and expenses before investing. The prospectus, and if available the summary prospectus, contain complete information about the investment options available through your plan. Please call 1-877-778-2100 for a free prospectus and if available, a summary prospectus that contain this and other information about the mutual funds. You should read the prospectus and the summary prospectus, if available, carefully before investing. It is possible to lose money when investing in securities.
Benchmark indices are unmanaged and cannot be invested in directly. See User Guide for index definitions.
Shares of the registered mutual funds are offered through Prudential Investment Management Services LLC (PIMS), Three Gateway Center, 14th Floor, Newark, NJ 07102-4077. PIMS is a Prudential Financial company. © 2014 Prudential Financial, Inc. and its related entities. Prudential, the Prudential logo, the Rock symbol and Bring Your Challenges are service marks of Prudential Financial, Inc., and its related entities, registered in many jurisdictions worldwide.
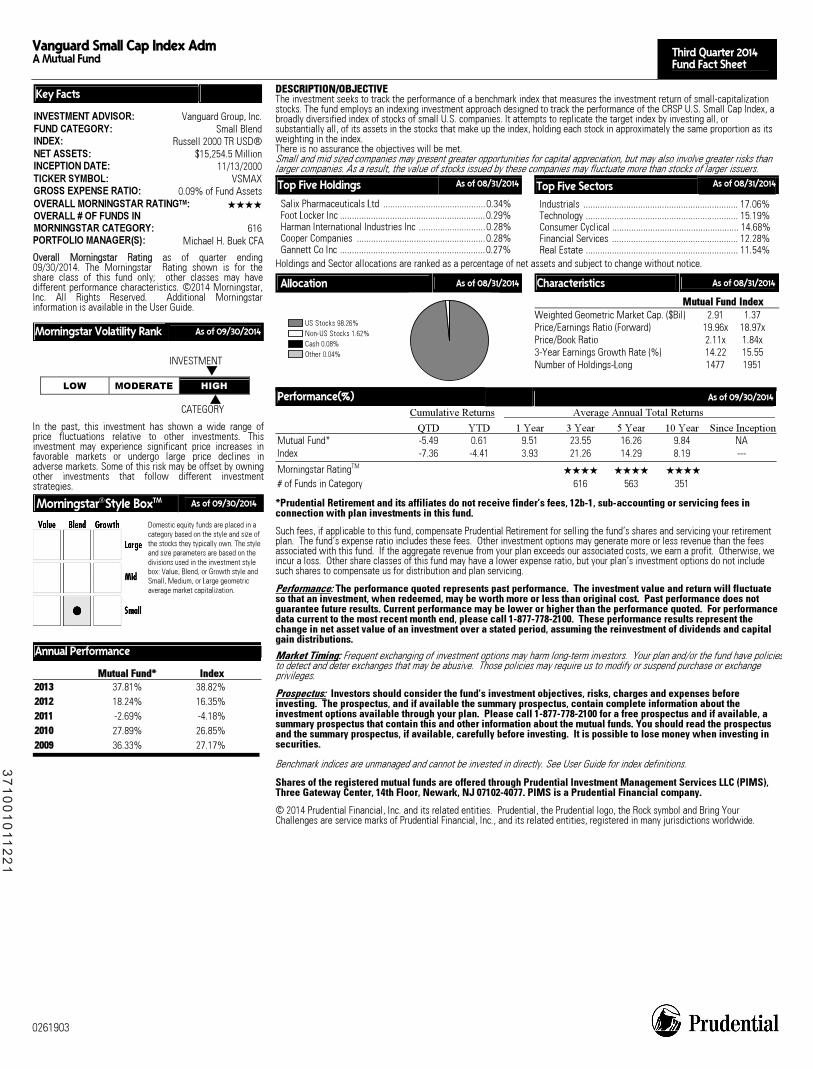
Vanguard Small Cap Index Adm A Mutual Fund Third Quarter 2014
Fund Fact Sheet
0261903
Key Facts INVESTMENT ADVISOR: Vanguard Group, Inc.FUND CATEGORY: Small Blend
INDEX: Russell 2000 TR USD®NET ASSETS: $15,254.5 MillionINCEPTION DATE: 11/13/2000TICKER SYMBOL: VSMAXGROSS EXPENSE RATIO: 0.09% of Fund AssetsOVERALL MORNINGSTAR RATINGTM: ���� OVERALL # OF FUNDS IN MORNINGSTAR CATEGORY: 616 PORTFOLIO MANAGER(S): Michael H. Buek CFA
OOvveerraallll MMoorrnniinnggssttaarr RRaattiinngg as of quarter ending09/30/2014. The Morningstar Rating shown is for theshare class of this fund only; other classes may havedifferent performance characteristics. ©2014 Morningstar,Inc. All Rights Reserved. Additional Morningstarinformation is available in the User Guide.
Morningstar Volatility Rank As of 09/30/2014
INVESTMENT �
LOW MODERATE HIGH � CATEGORY
In the past, this investment has shown a wide range ofprice fluctuations relative to other investments. Thisinvestment may experience significant price increases infavorable markets or undergo large price declines inadverse markets. Some of this risk may be offset by owningother investments that follow different investmentstrategies.
MorningstarStyle BoxTM As of 09/30/2014
Domestic equity funds are placed in a category based on the style and size of the stocks they typically own. The style and size parameters are based on the divisions used in the investment style box: Value, Blend, or Growth style and Small, Medium, or Large geometric average market capitalization.
Annual Performance
MMuuttuuaall FFuunndd** IInnddeexx 22001133 37.81% 38.82%22001122 18.24% 16.35%22001111 -2.69% -4.18%22001100 27.89% 26.85%22000099 36.33% 27.17%
DDEESSCCRRIIPPTTIIOONN//OOBBJJEECCTTIIVVEEThe investment seeks to track the performance of a benchmark index that measures the investment return of small-capitalization stocks. The fund employs an indexing investment approach designed to track the performance of the CRSP U.S. Small Cap Index, a broadly diversified index of stocks of small U.S. companies. It attempts to replicate the target index by investing all, or substantially all, of its assets in the stocks that make up the index, holding each stock in approximately the same proportion as its weighting in the index. There is no assurance the objectives will be met. Small and mid sized companies may present greater opportunities for capital appreciation, but may also involve greater risks than larger companies. As a result, the value of stocks issued by these companies may fluctuate more than stocks of larger issuers.
Top Five Holdings As of 08/31/2014
Salix Pharmaceuticals Ltd ...........................................0.34% Foot Locker Inc .............................................................0.29% Harman International Industries Inc ............................0.28% Cooper Companies ......................................................0.28% Gannett Co Inc .............................................................0.27%
Top Five Sectors As of 08/31/2014
Industrials ................................................................. 17.06% Technology ................................................................ 15.19% Consumer Cyclical ..................................................... 14.68% Financial Services ..................................................... 12.28% Real Estate ................................................................ 11.54%
Holdings and Sector allocations are ranked as a percentage of net assets and subject to change without notice.
Allocation As of 08/31/2014
US Stocks 98.26%Non-US Stocks 1.62%Cash 0.08%Other 0.04%
Characteristics As of 08/31/2014
MMuuttuuaall FFuunndd IInnddeexx Weighted Geometric Market Cap. ($Bil) 2.91 1.37 Price/Earnings Ratio (Forward) 19.96x 18.97x Price/Book Ratio 2.11x 1.84x 3-Year Earnings Growth Rate (%) 14.22 15.55 Number of Holdings-Long 1477 1951
Performance(%) As of 09/30/2014
Cumulative Returns Average Annual Total Returns QTD YTD 1 Year 3 Year 5 Year 10 Year Since InceptionMutual Fund* -5.49 0.61 9.51 23.55 16.26 9.84 NA Index -7.36 -4.41 3.93 21.26 14.29 8.19 ---
Morningstar RatingTM ���� ���� ����
# of Funds in Category 616 563 351
*Prudential Retirement and its affiliates do not receive finder’s fees, 12b-1, sub-accounting or servicing fees in connection with plan investments in this fund. Such fees, if applicable to this fund, compensate Prudential Retirement for selling the fund’s shares and servicing your retirement plan. The fund’s expense ratio includes these fees. Other investment options may generate more or less revenue than the fees associated with this fund. If the aggregate revenue from your plan exceeds our associated costs, we earn a profit. Otherwise, we incur a loss. Other share classes of this fund may have a lower expense ratio, but your plan’s investment options do not include such shares to compensate us for distribution and plan servicing.
Performance: The performance quoted represents past performance. The investment value and return will fluctuate so that an investment, when redeemed, may be worth more or less than original cost. Past performance does not guarantee future results. Current performance may be lower or higher than the performance quoted. For performance data current to the most recent month end, please call 1-877-778-2100. These performance results represent the change in net asset value of an investment over a stated period, assuming the reinvestment of dividends and capital gain distributions. Market Timing: Frequent exchanging of investment options may harm long-term investors. Your plan and/or the fund have policiesto detect and deter exchanges that may be abusive. Those policies may require us to modify or suspend purchase or exchange privileges.
Prospectus: Investors should consider the fund’s investment objectives, risks, charges and expenses before investing. The prospectus, and if available the summary prospectus, contain complete information about the investment options available through your plan. Please call 1-877-778-2100 for a free prospectus and if available, a summary prospectus that contain this and other information about the mutual funds. You should read the prospectus and the summary prospectus, if available, carefully before investing. It is possible to lose money when investing in securities.
Benchmark indices are unmanaged and cannot be invested in directly. See User Guide for index definitions.
Shares of the registered mutual funds are offered through Prudential Investment Management Services LLC (PIMS), Three Gateway Center, 14th Floor, Newark, NJ 07102-4077. PIMS is a Prudential Financial company. © 2014 Prudential Financial, Inc. and its related entities. Prudential, the Prudential logo, the Rock symbol and Bring Your Challenges are service marks of Prudential Financial, Inc., and its related entities, registered in many jurisdictions worldwide.
37
10
01
011
22
1
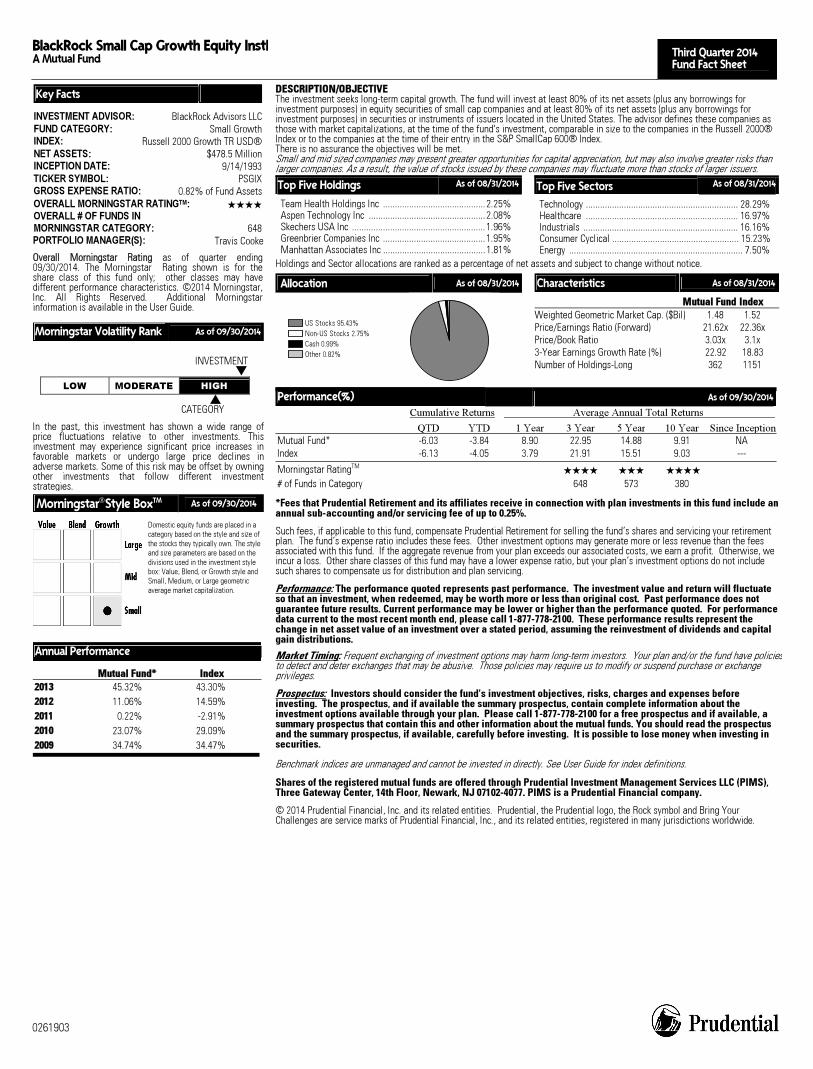
BlackRock Small Cap Growth Equity Instl A Mutual Fund Third Quarter 2014
Fund Fact Sheet
0261903
Key Facts INVESTMENT ADVISOR: BlackRock Advisors LLCFUND CATEGORY: Small Growth
INDEX: Russell 2000 Growth TR USD®NET ASSETS: $478.5 MillionINCEPTION DATE: 9/14/1993TICKER SYMBOL: PSGIXGROSS EXPENSE RATIO: 0.82% of Fund AssetsOVERALL MORNINGSTAR RATINGTM: ���� OVERALL # OF FUNDS IN MORNINGSTAR CATEGORY: 648 PORTFOLIO MANAGER(S): Travis Cooke
OOvveerraallll MMoorrnniinnggssttaarr RRaattiinngg as of quarter ending09/30/2014. The Morningstar Rating shown is for theshare class of this fund only; other classes may havedifferent performance characteristics. ©2014 Morningstar,Inc. All Rights Reserved. Additional Morningstarinformation is available in the User Guide.
Morningstar Volatility Rank As of 09/30/2014
INVESTMENT �
LOW MODERATE HIGH � CATEGORY
In the past, this investment has shown a wide range ofprice fluctuations relative to other investments. Thisinvestment may experience significant price increases infavorable markets or undergo large price declines inadverse markets. Some of this risk may be offset by owningother investments that follow different investmentstrategies.
MorningstarStyle BoxTM As of 09/30/2014
Domestic equity funds are placed in a category based on the style and size of the stocks they typically own. The style and size parameters are based on the divisions used in the investment style box: Value, Blend, or Growth style and Small, Medium, or Large geometric average market capitalization.
Annual Performance
MMuuttuuaall FFuunndd** IInnddeexx 22001133 45.32% 43.30%22001122 11.06% 14.59%22001111 0.22% -2.91%22001100 23.07% 29.09%22000099 34.74% 34.47%
DDEESSCCRRIIPPTTIIOONN//OOBBJJEECCTTIIVVEEThe investment seeks long-term capital growth. The fund will invest at least 80% of its net assets (plus any borrowings for investment purposes) in equity securities of small cap companies and at least 80% of its net assets (plus any borrowings for investment purposes) in securities or instruments of issuers located in the United States. The advisor defines these companies as those with market capitalizations, at the time of the fund's investment, comparable in size to the companies in the Russell 2000® Index or to the companies at the time of their entry in the S&P SmallCap 600® Index. There is no assurance the objectives will be met. Small and mid sized companies may present greater opportunities for capital appreciation, but may also involve greater risks than larger companies. As a result, the value of stocks issued by these companies may fluctuate more than stocks of larger issuers.
Top Five Holdings As of 08/31/2014
Team Health Holdings Inc ...........................................2.25% Aspen Technology Inc .................................................2.08% Skechers USA Inc ........................................................1.96% Greenbrier Companies Inc ...........................................1.95% Manhattan Associates Inc ...........................................1.81%
Top Five Sectors As of 08/31/2014
Technology ................................................................ 28.29% Healthcare ................................................................ 16.97% Industrials ................................................................. 16.16% Consumer Cyclical ..................................................... 15.23% Energy ......................................................................... 7.50%
Holdings and Sector allocations are ranked as a percentage of net assets and subject to change without notice.
Allocation As of 08/31/2014
US Stocks 95.43%Non-US Stocks 2.75%Cash 0.99%Other 0.82%
Characteristics As of 08/31/2014
MMuuttuuaall FFuunndd IInnddeexx Weighted Geometric Market Cap. ($Bil) 1.48 1.52 Price/Earnings Ratio (Forward) 21.62x 22.36x Price/Book Ratio 3.03x 3.1x 3-Year Earnings Growth Rate (%) 22.92 18.83 Number of Holdings-Long 362 1151
Performance(%) As of 09/30/2014
Cumulative Returns Average Annual Total Returns QTD YTD 1 Year 3 Year 5 Year 10 Year Since InceptionMutual Fund* -6.03 -3.84 8.90 22.95 14.88 9.91 NA Index -6.13 -4.05 3.79 21.91 15.51 9.03 ---
Morningstar RatingTM ���� ��� ����
# of Funds in Category 648 573 380
*Fees that Prudential Retirement and its affiliates receive in connection with plan investments in this fund include an annual sub-accounting and/or servicing fee of up to 0.25%. Such fees, if applicable to this fund, compensate Prudential Retirement for selling the fund’s shares and servicing your retirement plan. The fund’s expense ratio includes these fees. Other investment options may generate more or less revenue than the fees associated with this fund. If the aggregate revenue from your plan exceeds our associated costs, we earn a profit. Otherwise, we incur a loss. Other share classes of this fund may have a lower expense ratio, but your plan’s investment options do not include such shares to compensate us for distribution and plan servicing.
Performance: The performance quoted represents past performance. The investment value and return will fluctuate so that an investment, when redeemed, may be worth more or less than original cost. Past performance does not guarantee future results. Current performance may be lower or higher than the performance quoted. For performance data current to the most recent month end, please call 1-877-778-2100. These performance results represent the change in net asset value of an investment over a stated period, assuming the reinvestment of dividends and capital gain distributions. Market Timing: Frequent exchanging of investment options may harm long-term investors. Your plan and/or the fund have policiesto detect and deter exchanges that may be abusive. Those policies may require us to modify or suspend purchase or exchange privileges.
Prospectus: Investors should consider the fund’s investment objectives, risks, charges and expenses before investing. The prospectus, and if available the summary prospectus, contain complete information about the investment options available through your plan. Please call 1-877-778-2100 for a free prospectus and if available, a summary prospectus that contain this and other information about the mutual funds. You should read the prospectus and the summary prospectus, if available, carefully before investing. It is possible to lose money when investing in securities.
Benchmark indices are unmanaged and cannot be invested in directly. See User Guide for index definitions.
Shares of the registered mutual funds are offered through Prudential Investment Management Services LLC (PIMS), Three Gateway Center, 14th Floor, Newark, NJ 07102-4077. PIMS is a Prudential Financial company. © 2014 Prudential Financial, Inc. and its related entities. Prudential, the Prudential logo, the Rock symbol and Bring Your Challenges are service marks of Prudential Financial, Inc., and its related entities, registered in many jurisdictions worldwide.
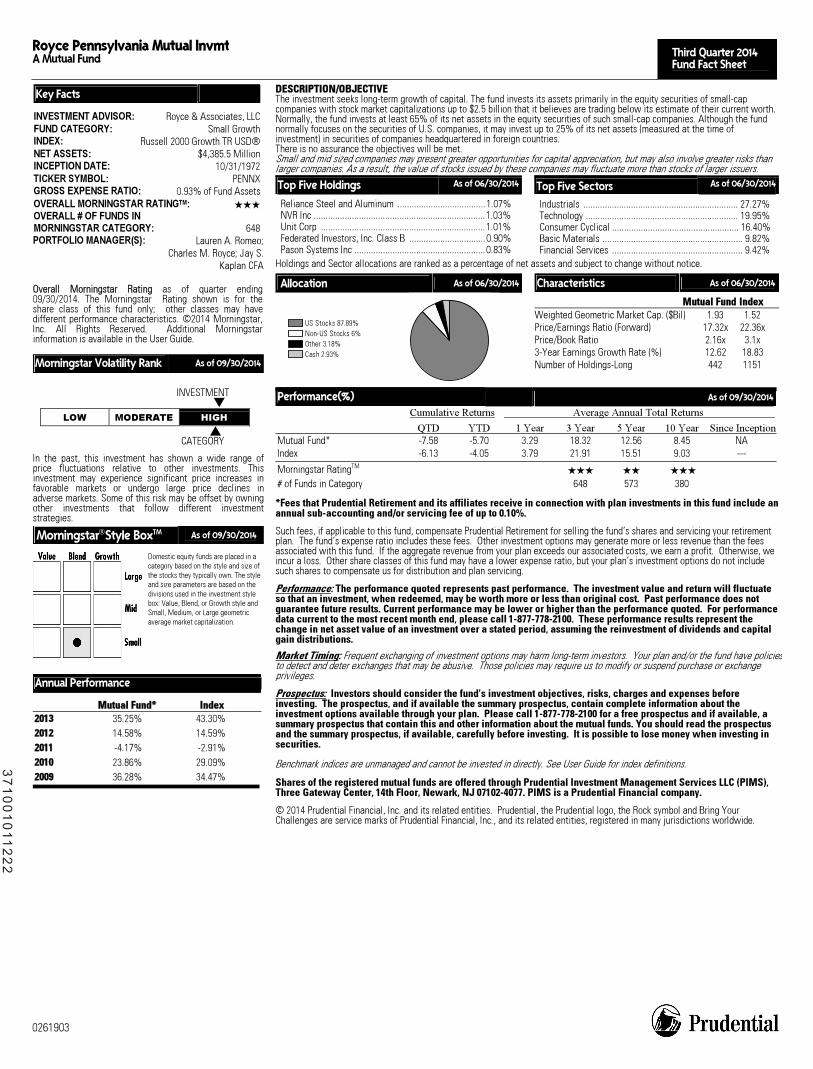
Royce Pennsylvania Mutual Invmt A Mutual Fund Third Quarter 2014
Fund Fact Sheet
0261903
Key Facts INVESTMENT ADVISOR: Royce & Associates, LLCFUND CATEGORY: Small GrowthINDEX: Russell 2000 Growth TR USD®NET ASSETS: $4,385.5 MillionINCEPTION DATE: 10/31/1972TICKER SYMBOL: PENNXGROSS EXPENSE RATIO: 0.93% of Fund AssetsOVERALL MORNINGSTAR RATINGTM: ��� OVERALL # OF FUNDS IN MORNINGSTAR CATEGORY: 648PORTFOLIO MANAGER(S): Lauren A. Romeo;
Charles M. Royce; Jay S.Kaplan CFA
OOvveerraallll MMoorrnniinnggssttaarr RRaattiinngg as of quarter ending09/30/2014. The Morningstar Rating shown is for theshare class of this fund only; other classes may havedifferent performance characteristics. ©2014 Morningstar,Inc. All Rights Reserved. Additional Morningstar information is available in the User Guide.
Morningstar Volatility Rank As of 09/30/2014
INVESTMENT �
LOW MODERATE HIGH � CATEGORY
In the past, this investment has shown a wide range ofprice fluctuations relative to other investments. Thisinvestment may experience significant price increases infavorable markets or undergo large price declines inadverse markets. Some of this risk may be offset by owningother investments that follow different investmentstrategies.
MorningstarStyle BoxTM As of 09/30/2014
Domestic equity funds are placed in a category based on the style and size of the stocks they typically own. The style and size parameters are based on the divisions used in the investment style box: Value, Blend, or Growth style and Small, Medium, or Large geometric average market capitalization.
Annual Performance
MMuuttuuaall FFuunndd** IInnddeexx 22001133 35.25% 43.30%22001122 14.58% 14.59%22001111 -4.17% -2.91%22001100 23.86% 29.09%22000099 36.28% 34.47%
DDEESSCCRRIIPPTTIIOONN//OOBBJJEECCTTIIVVEEThe investment seeks long-term growth of capital. The fund invests its assets primarily in the equity securities of small-cap companies with stock market capitalizations up to $2.5 billion that it believes are trading below its estimate of their current worth. Normally, the fund invests at least 65% of its net assets in the equity securities of such small-cap companies. Although the fund normally focuses on the securities of U.S. companies, it may invest up to 25% of its net assets (measured at the time of investment) in securities of companies headquartered in foreign countries. There is no assurance the objectives will be met. Small and mid sized companies may present greater opportunities for capital appreciation, but may also involve greater risks than larger companies. As a result, the value of stocks issued by these companies may fluctuate more than stocks of larger issuers.
Top Five Holdings As of 06/30/2014
Reliance Steel and Aluminum .....................................1.07% NVR Inc ........................................................................1.03% Unit Corp .....................................................................1.01% Federated Investors, Inc. Class B ................................0.90% Pason Systems Inc .......................................................0.83%
Top Five Sectors As of 06/30/2014
Industrials ................................................................. 27.27% Technology ................................................................ 19.95% Consumer Cyclical ..................................................... 16.40% Basic Materials ........................................................... 9.82% Financial Services ....................................................... 9.42%
Holdings and Sector allocations are ranked as a percentage of net assets and subject to change without notice.
Allocation As of 06/30/2014
US Stocks 87.89%Non-US Stocks 6%Other 3.18%Cash 2.93%
Characteristics As of 06/30/2014
MMuuttuuaall FFuunndd IInnddeexx Weighted Geometric Market Cap. ($Bil) 1.93 1.52 Price/Earnings Ratio (Forward) 17.32x 22.36x Price/Book Ratio 2.16x 3.1x 3-Year Earnings Growth Rate (%) 12.62 18.83 Number of Holdings-Long 442 1151
Performance(%) As of 09/30/2014
Cumulative Returns Average Annual Total Returns QTD YTD 1 Year 3 Year 5 Year 10 Year Since InceptionMutual Fund* -7.58 -5.70 3.29 18.32 12.56 8.45 NA Index -6.13 -4.05 3.79 21.91 15.51 9.03 ---
Morningstar RatingTM ��� �� ��� # of Funds in Category 648 573 380
*Fees that Prudential Retirement and its affiliates receive in connection with plan investments in this fund include an annual sub-accounting and/or servicing fee of up to 0.10%. Such fees, if applicable to this fund, compensate Prudential Retirement for selling the fund’s shares and servicing your retirement plan. The fund’s expense ratio includes these fees. Other investment options may generate more or less revenue than the fees associated with this fund. If the aggregate revenue from your plan exceeds our associated costs, we earn a profit. Otherwise, we incur a loss. Other share classes of this fund may have a lower expense ratio, but your plan’s investment options do not include such shares to compensate us for distribution and plan servicing.
Performance: The performance quoted represents past performance. The investment value and return will fluctuate so that an investment, when redeemed, may be worth more or less than original cost. Past performance does not guarantee future results. Current performance may be lower or higher than the performance quoted. For performance data current to the most recent month end, please call 1-877-778-2100. These performance results represent the change in net asset value of an investment over a stated period, assuming the reinvestment of dividends and capital gain distributions. Market Timing: Frequent exchanging of investment options may harm long-term investors. Your plan and/or the fund have policiesto detect and deter exchanges that may be abusive. Those policies may require us to modify or suspend purchase or exchange privileges.
Prospectus: Investors should consider the fund’s investment objectives, risks, charges and expenses before investing. The prospectus, and if available the summary prospectus, contain complete information about the investment options available through your plan. Please call 1-877-778-2100 for a free prospectus and if available, a summary prospectus that contain this and other information about the mutual funds. You should read the prospectus and the summary prospectus, if available, carefully before investing. It is possible to lose money when investing in securities.
Benchmark indices are unmanaged and cannot be invested in directly. See User Guide for index definitions.
Shares of the registered mutual funds are offered through Prudential Investment Management Services LLC (PIMS), Three Gateway Center, 14th Floor, Newark, NJ 07102-4077. PIMS is a Prudential Financial company. © 2014 Prudential Financial, Inc. and its related entities. Prudential, the Prudential logo, the Rock symbol and Bring Your Challenges are service marks of Prudential Financial, Inc., and its related entities, registered in many jurisdictions worldwide.
37
10
01
011
22
2
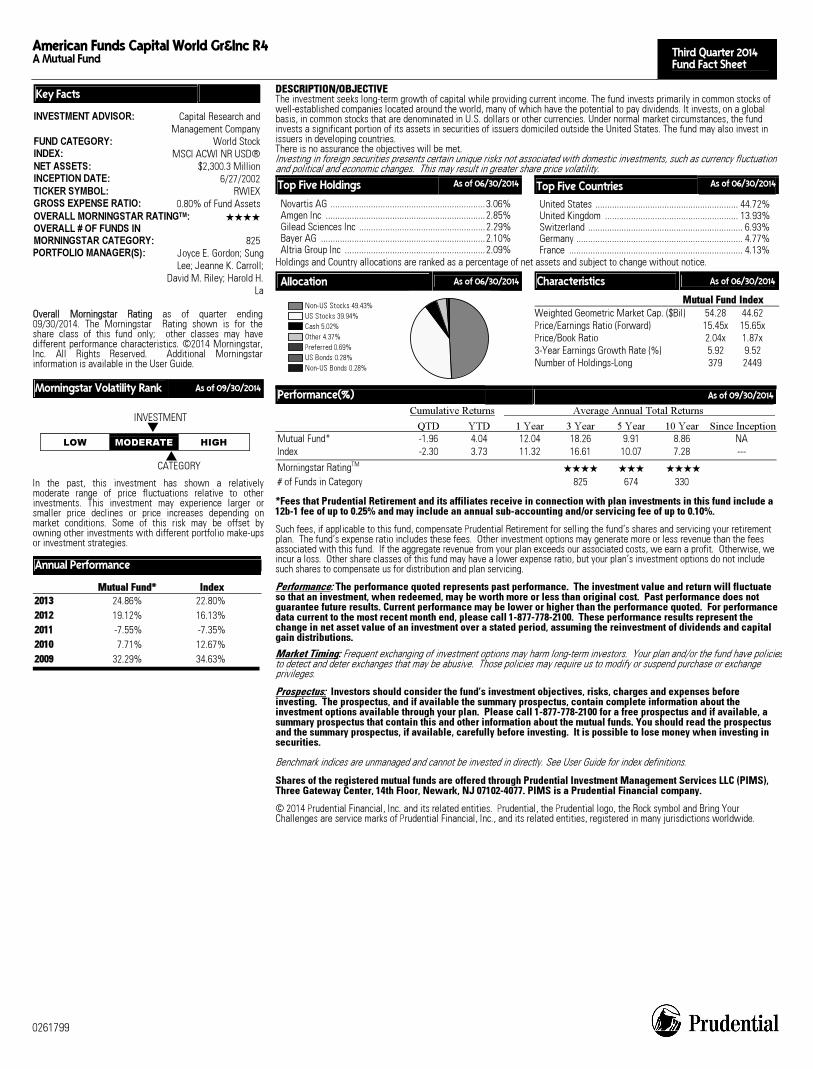
American Funds Capital World Gr&Inc R4 A Mutual Fund Third Quarter 2014
Fund Fact Sheet
0261799
Key Facts INVESTMENT ADVISOR: Capital Research and
Management CompanyFUND CATEGORY: World StockINDEX: MSCI ACWI NR USD®NET ASSETS: $2,300.3 MillionINCEPTION DATE: 6/27/2002TICKER SYMBOL: RWIEXGROSS EXPENSE RATIO: 0.80% of Fund AssetsOVERALL MORNINGSTAR RATINGTM: ���� OVERALL # OF FUNDS IN MORNINGSTAR CATEGORY: 825PORTFOLIO MANAGER(S): Joyce E. Gordon; Sung
Lee; Jeanne K. Carroll;David M. Riley; Harold H.
La
OOvveerraallll MMoorrnniinnggssttaarr RRaattiinngg as of quarter ending09/30/2014. The Morningstar Rating shown is for theshare class of this fund only; other classes may havedifferent performance characteristics. ©2014 Morningstar,Inc. All Rights Reserved. Additional Morningstarinformation is available in the User Guide.
Morningstar Volatility Rank As of 09/30/2014
INVESTMENT �
LOW MODERATE HIGH � CATEGORY
In the past, this investment has shown a relativelymoderate range of price fluctuations relative to otherinvestments. This investment may experience larger orsmaller price declines or price increases depending onmarket conditions. Some of this risk may be offset byowning other investments with different portfolio make-ups or investment strategies.
Annual Performance
MMuuttuuaall FFuunndd** IInnddeexx 22001133 24.86% 22.80%22001122 19.12% 16.13%22001111 -7.55% -7.35%22001100 7.71% 12.67%22000099 32.29% 34.63%
DDEESSCCRRIIPPTTIIOONN//OOBBJJEECCTTIIVVEEThe investment seeks long-term growth of capital while providing current income. The fund invests primarily in common stocks of well-established companies located around the world, many of which have the potential to pay dividends. It invests, on a global basis, in common stocks that are denominated in U.S. dollars or other currencies. Under normal market circumstances, the fund invests a significant portion of its assets in securities of issuers domiciled outside the United States. The fund may also invest in issuers in developing countries. There is no assurance the objectives will be met. Investing in foreign securities presents certain unique risks not associated with domestic investments, such as currency fluctuation and political and economic changes. This may result in greater share price volatility.
Top Five Holdings As of 06/30/2014
Novartis AG .................................................................3.06% Amgen Inc ...................................................................2.85% Gilead Sciences Inc .....................................................2.29% Bayer AG .....................................................................2.10% Altria Group Inc ...........................................................2.09%
Top Five Countries As of 06/30/2014
United States ............................................................ 44.72% United Kingdom ........................................................ 13.93% Switzerland ................................................................. 6.93% Germany ...................................................................... 4.77% France ......................................................................... 4.13%
Holdings and Country allocations are ranked as a percentage of net assets and subject to change without notice.
Allocation As of 06/30/2014
Non-US Stocks 49.43%US Stocks 39.94%Cash 5.02%Other 4.37%Preferred 0.69%US Bonds 0.28%Non-US Bonds 0.28%
Characteristics As of 06/30/2014
MMuuttuuaall FFuunndd IInnddeexx Weighted Geometric Market Cap. ($Bil) 54.28 44.62 Price/Earnings Ratio (Forward) 15.45x 15.65x Price/Book Ratio 2.04x 1.87x 3-Year Earnings Growth Rate (%) 5.92 9.52 Number of Holdings-Long 379 2449
Performance(%) As of 09/30/2014
Cumulative Returns Average Annual Total Returns QTD YTD 1 Year 3 Year 5 Year 10 Year Since InceptionMutual Fund* -1.96 4.04 12.04 18.26 9.91 8.86 NA Index -2.30 3.73 11.32 16.61 10.07 7.28 ---
Morningstar RatingTM ���� ��� ����
# of Funds in Category 825 674 330
*Fees that Prudential Retirement and its affiliates receive in connection with plan investments in this fund include a 12b-1 fee of up to 0.25% and may include an annual sub-accounting and/or servicing fee of up to 0.10%. Such fees, if applicable to this fund, compensate Prudential Retirement for selling the fund’s shares and servicing your retirement plan. The fund’s expense ratio includes these fees. Other investment options may generate more or less revenue than the fees associated with this fund. If the aggregate revenue from your plan exceeds our associated costs, we earn a profit. Otherwise, we incur a loss. Other share classes of this fund may have a lower expense ratio, but your plan’s investment options do not include such shares to compensate us for distribution and plan servicing.
Performance: The performance quoted represents past performance. The investment value and return will fluctuate so that an investment, when redeemed, may be worth more or less than original cost. Past performance does not guarantee future results. Current performance may be lower or higher than the performance quoted. For performance data current to the most recent month end, please call 1-877-778-2100. These performance results represent the change in net asset value of an investment over a stated period, assuming the reinvestment of dividends and capital gain distributions. Market Timing: Frequent exchanging of investment options may harm long-term investors. Your plan and/or the fund have policiesto detect and deter exchanges that may be abusive. Those policies may require us to modify or suspend purchase or exchange privileges.
Prospectus: Investors should consider the fund’s investment objectives, risks, charges and expenses before investing. The prospectus, and if available the summary prospectus, contain complete information about the investment options available through your plan. Please call 1-877-778-2100 for a free prospectus and if available, a summary prospectus that contain this and other information about the mutual funds. You should read the prospectus and the summary prospectus, if available, carefully before investing. It is possible to lose money when investing in securities.
Benchmark indices are unmanaged and cannot be invested in directly. See User Guide for index definitions.
Shares of the registered mutual funds are offered through Prudential Investment Management Services LLC (PIMS), Three Gateway Center, 14th Floor, Newark, NJ 07102-4077. PIMS is a Prudential Financial company. © 2014 Prudential Financial, Inc. and its related entities. Prudential, the Prudential logo, the Rock symbol and Bring Your Challenges are service marks of Prudential Financial, Inc., and its related entities, registered in many jurisdictions worldwide.
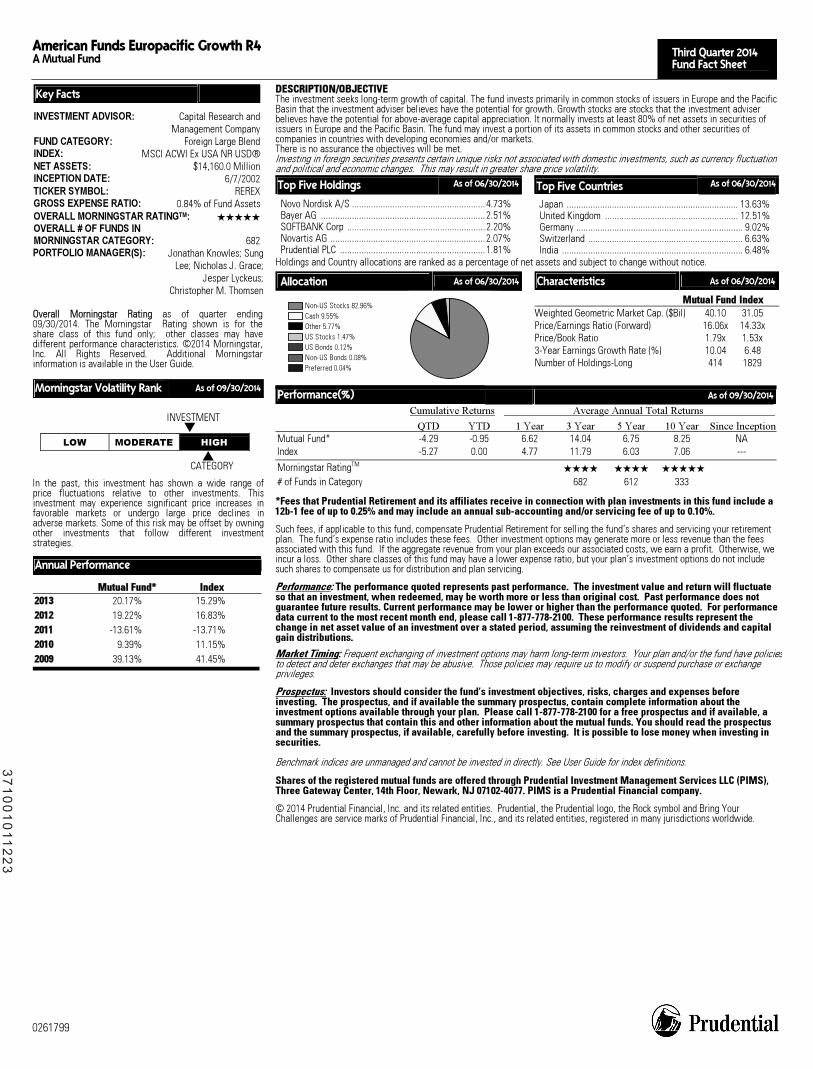
American Funds Europacific Growth R4 A Mutual Fund Third Quarter 2014
Fund Fact Sheet
0261799
Key Facts INVESTMENT ADVISOR: Capital Research and
Management CompanyFUND CATEGORY: Foreign Large BlendINDEX: MSCI ACWI Ex USA NR USD®NET ASSETS: $14,160.0 MillionINCEPTION DATE: 6/7/2002TICKER SYMBOL: REREXGROSS EXPENSE RATIO: 0.84% of Fund AssetsOVERALL MORNINGSTAR RATINGTM: ����� OVERALL # OF FUNDS IN MORNINGSTAR CATEGORY: 682PORTFOLIO MANAGER(S): Jonathan Knowles; Sung
Lee; Nicholas J. Grace;Jesper Lyckeus;
Christopher M. Thomsen
OOvveerraallll MMoorrnniinnggssttaarr RRaattiinngg as of quarter ending09/30/2014. The Morningstar Rating shown is for theshare class of this fund only; other classes may havedifferent performance characteristics. ©2014 Morningstar,Inc. All Rights Reserved. Additional Morningstarinformation is available in the User Guide.
Morningstar Volatility Rank As of 09/30/2014
INVESTMENT �
LOW MODERATE HIGH � CATEGORY
In the past, this investment has shown a wide range ofprice fluctuations relative to other investments. Thisinvestment may experience significant price increases infavorable markets or undergo large price declines inadverse markets. Some of this risk may be offset by owningother investments that follow different investmentstrategies.
Annual Performance
MMuuttuuaall FFuunndd** IInnddeexx 22001133 20.17% 15.29%22001122 19.22% 16.83%22001111 -13.61% -13.71%22001100 9.39% 11.15%22000099 39.13% 41.45%
DDEESSCCRRIIPPTTIIOONN//OOBBJJEECCTTIIVVEEThe investment seeks long-term growth of capital. The fund invests primarily in common stocks of issuers in Europe and the Pacific Basin that the investment adviser believes have the potential for growth. Growth stocks are stocks that the investment adviser believes have the potential for above-average capital appreciation. It normally invests at least 80% of net assets in securities of issuers in Europe and the Pacific Basin. The fund may invest a portion of its assets in common stocks and other securities of companies in countries with developing economies and/or markets. There is no assurance the objectives will be met. Investing in foreign securities presents certain unique risks not associated with domestic investments, such as currency fluctuation and political and economic changes. This may result in greater share price volatility.
Top Five Holdings As of 06/30/2014
Novo Nordisk A/S ........................................................4.73% Bayer AG .....................................................................2.51% SOFTBANK Corp ..........................................................2.20% Novartis AG .................................................................2.07% Prudential PLC .............................................................1.81%
Top Five Countries As of 06/30/2014
Japan ........................................................................ 13.63% United Kingdom ........................................................ 12.51% Germany ...................................................................... 9.02% Switzerland ................................................................. 6.63% India ............................................................................ 6.48%
Holdings and Country allocations are ranked as a percentage of net assets and subject to change without notice.
Allocation As of 06/30/2014
Non-US Stocks 82.96%Cash 9.55%Other 5.77%US Stocks 1.47%US Bonds 0.12%Non-US Bonds 0.08%Preferred 0.04%
Characteristics As of 06/30/2014
MMuuttuuaall FFuunndd IInnddeexx Weighted Geometric Market Cap. ($Bil) 40.10 31.05 Price/Earnings Ratio (Forward) 16.06x 14.33x Price/Book Ratio 1.79x 1.53x 3-Year Earnings Growth Rate (%) 10.04 6.48 Number of Holdings-Long 414 1829
Performance(%) As of 09/30/2014
Cumulative Returns Average Annual Total Returns QTD YTD 1 Year 3 Year 5 Year 10 Year Since InceptionMutual Fund* -4.29 -0.95 6.62 14.04 6.75 8.25 NA Index -5.27 0.00 4.77 11.79 6.03 7.06 ---
Morningstar RatingTM ���� ���� �����
# of Funds in Category 682 612 333
*Fees that Prudential Retirement and its affiliates receive in connection with plan investments in this fund include a 12b-1 fee of up to 0.25% and may include an annual sub-accounting and/or servicing fee of up to 0.10%. Such fees, if applicable to this fund, compensate Prudential Retirement for selling the fund’s shares and servicing your retirement plan. The fund’s expense ratio includes these fees. Other investment options may generate more or less revenue than the fees associated with this fund. If the aggregate revenue from your plan exceeds our associated costs, we earn a profit. Otherwise, we incur a loss. Other share classes of this fund may have a lower expense ratio, but your plan’s investment options do not include such shares to compensate us for distribution and plan servicing.
Performance: The performance quoted represents past performance. The investment value and return will fluctuate so that an investment, when redeemed, may be worth more or less than original cost. Past performance does not guarantee future results. Current performance may be lower or higher than the performance quoted. For performance data current to the most recent month end, please call 1-877-778-2100. These performance results represent the change in net asset value of an investment over a stated period, assuming the reinvestment of dividends and capital gain distributions. Market Timing: Frequent exchanging of investment options may harm long-term investors. Your plan and/or the fund have policiesto detect and deter exchanges that may be abusive. Those policies may require us to modify or suspend purchase or exchange privileges.
Prospectus: Investors should consider the fund’s investment objectives, risks, charges and expenses before investing. The prospectus, and if available the summary prospectus, contain complete information about the investment options available through your plan. Please call 1-877-778-2100 for a free prospectus and if available, a summary prospectus that contain this and other information about the mutual funds. You should read the prospectus and the summary prospectus, if available, carefully before investing. It is possible to lose money when investing in securities.
Benchmark indices are unmanaged and cannot be invested in directly. See User Guide for index definitions.
Shares of the registered mutual funds are offered through Prudential Investment Management Services LLC (PIMS), Three Gateway Center, 14th Floor, Newark, NJ 07102-4077. PIMS is a Prudential Financial company. © 2014 Prudential Financial, Inc. and its related entities. Prudential, the Prudential logo, the Rock symbol and Bring Your Challenges are service marks of Prudential Financial, Inc., and its related entities, registered in many jurisdictions worldwide.
37
10
01
011
22
3

Risk Tolerance Quiz
Still not sure what your risk tolerance is? Answer the following questions to help get a clearer picture.
Your experience with various investments can affect how you feel about the investments in your account. Pleaseanswer the following relative to your investment experience oryour comfort level regarding investments
6) One of the investments in your program has performed very well for a few years. If it suddenlydropped 15 percent in 3 months, what would you do?
Sell immediately 0 Hold it 6 Buy more 8
7) You would describe your experience with stocks or stock funds as:
A great deal of experience 6 A fair amount of experience 4 Very little experience 2 None 1
8) You would describe your experience with bonds or bond funds as:
A great deal of experience 5 A fair amount of experience 3 Very little experience 2 None 1
9) You would describe your comfort level with stocks orstock funds as:
A great deal 12 A fair amount 10Very little 4None 0
10) You would describe your comfort level with bonds orbond funds as:
A great deal 7A fair amount 4Very little 3None 0
Please indicate how concerned you are about the following by circling the score next to your answer:
1) The possibility that I won’t earn enough in my account over the long term:
I am very concerned 10 I am somewhat concerned 7I am not concerned 3
2) The possible loss of “buying power” or “quality of life” from the effects of inflation:
I am very concerned 6 I am somewhat concerned 4 I am not concerned 1
3) The possibility of wide swings in the value of my account over 1–3 months:
I am very concerned 0 I am somewhat concerned 4 I am not concerned 12
4) The possibility of wide swings in the value of my account over 1–2 years:
I am very concerned 2 I am somewhat concerned 6 I am not concerned 12
5) Which of the following causes you the most concern about the investments in your account?
My future ability to get back at least the same amount of money that I put in 2 That my money is not earning enough 6How much I have gained or lost this month 0
To determine your score: Add up the points assigned to all ten of your answers.
Total Score: ________
What Your Score Indicates:If you scored 0 – 40 points, you may be a Conservativeinvestor.If you scored 41 – 60 points, you may be a Moderateinvestor.If you scored 61 or more points, you may be anAggressive investor.

0 0 0 0 0 1
165
Instructions Questions?Call 1-877-778-2100
for assistance.
Please print using blue or black ink. Note: You should use this form if you areenrolling in the plan for the first time. Keep a copy of this form for your records and return theoriginal to your Benefits/Human Resources Office.
Attention: Benefits/Human Resources Office - Please fax or send completed form to Prudential.
AboutYou
area code- - - -
-
0 0 6 3 7 1
Enrollment Form
M F
Date of birth Gender Original date employed
month day year
First name MI Last name
Address
City State ZIP code
Social Security number Daytime telephone number
Plan number Sub plan number
month day year
Married Not married
The Lancaster County Nebraska Employees Retirement Plan
Marital status
InvestmentAllocation
(Please fillout OptionI, Option II,or OptionIII. Do notfill out morethan one option.)
Fill out Option I, Option II or Option III. Please complete only one option.
By completion of Option I or Option II you enroll in GoalMaker, Prudential’s asset allocation program, and you directPrudential to invest your contribution(s) according to a GoalMaker model portfolio that is based on your risk toler-ance and time horizon. You can also direct Prudential to automatically rebalance your account quarterly accordingto the model portfolio chosen. Enrollment in GoalMaker can be canceled at anytime.Please refer to the Retirement Workbook for more information on rebalancing and age adjustment.Option I or Option II must be completed accurately, otherwise your investment allocation will be placed inGoalMaker with age adjustment.Option III must be completed accurately and received by Prudential before assets are accepted; otherwise, contributions will be placed in the default investment option selected by your plan. Upon receipt of your completedenrollment form, all future contributions will be allocated according to your investment selection. You must contactPrudential to transfer any existing funds from the default option.
q If you choose GoalMaker and want to automatically, once eligible, allocate a portion of your retirement accountto the IncomeFlex funds to help you generate guaranteed retirement income, please check this box.
Ed. 01/2015 Important information and signature required on the following page(s)
37
10
01
011
22
4
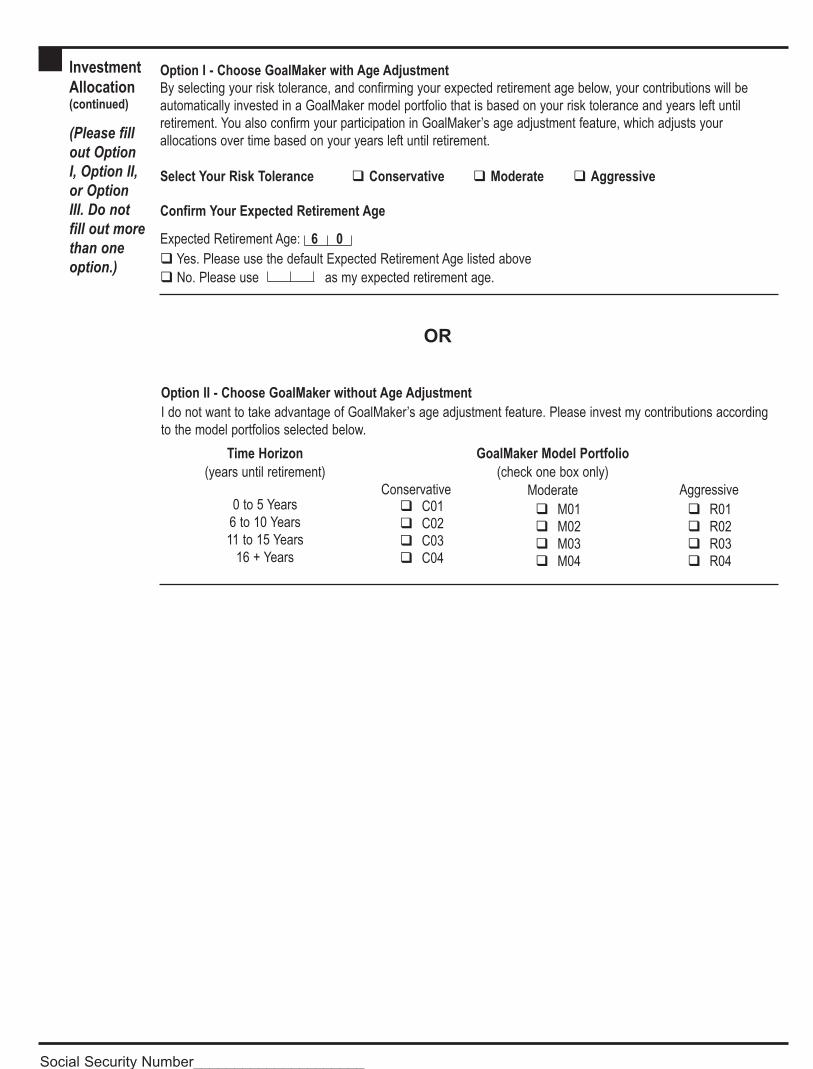
Option I - Choose GoalMaker with Age AdjustmentBy selecting your risk tolerance, and confirming your expected retirement age below, your contributions will be automatically invested in a GoalMaker model portfolio that is based on your risk tolerance and years left until retirement. You also confirm your participation in GoalMaker’s age adjustment feature, which adjusts your allocations over time based on your years left until retirement.
Select Your Risk Tolerance q Conservative q Moderate q Aggressive
Confirm Your Expected Retirement Age
Expected Retirement Age: 6 0q Yes. Please use the default Expected Retirement Age listed aboveq No. Please use as my expected retirement age.
InvestmentAllocation(continued)
(Please fillout OptionI, Option II,or OptionIII. Do notfill out morethan one option.)
Aggressive
GoalMaker Model Portfolio(check one box only)
ModerateConservative
Time Horizon(years until retirement)
0 to 5 Years6 to 10 Years11 to 15 Years
16 + Years
q C01q C02q C03q C04
q M01q M02q M03q M04
q R01q R02q R03q R04
I do not want to take advantage of GoalMaker’s age adjustment feature. Please invest my contributions accordingto the model portfolios selected below.
Option II - Choose GoalMaker without Age Adjustment
OR
Social Security Number_____________________
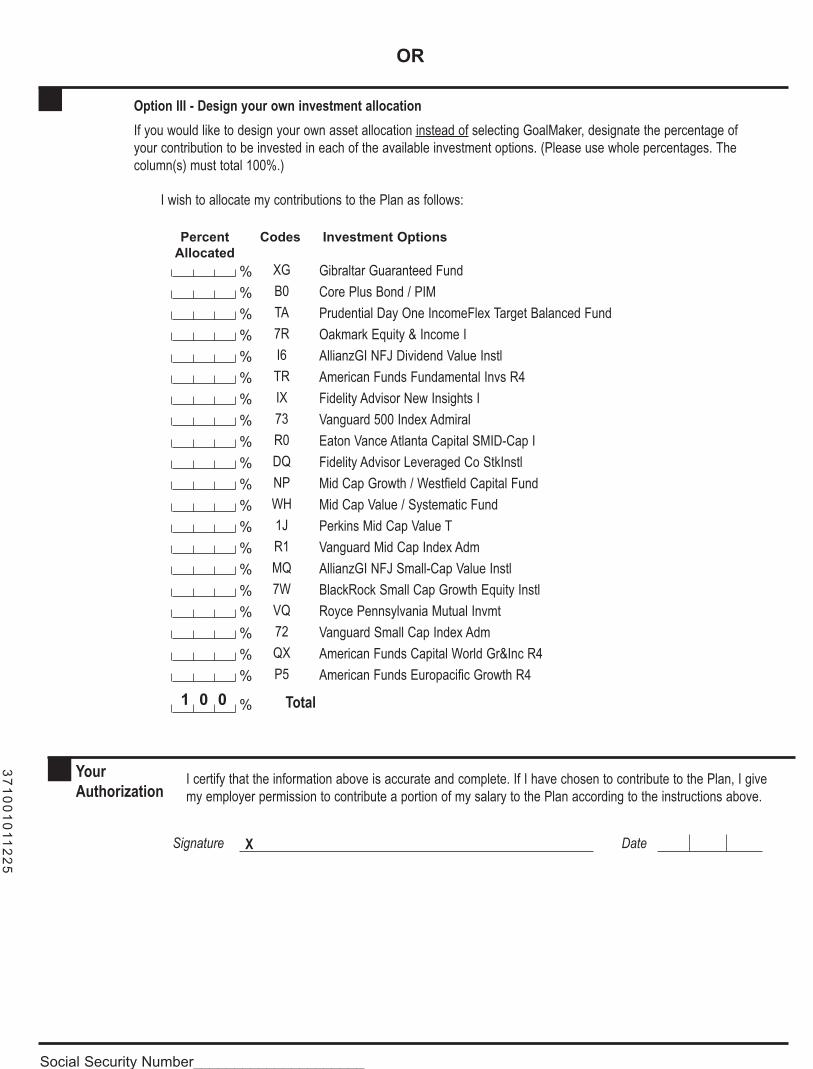
Option III - Design your own investment allocationIf you would like to design your own asset allocation instead of selecting GoalMaker, designate the percentage ofyour contribution to be invested in each of the available investment options. (Please use whole percentages. Thecolumn(s) must total 100%.)
OR
I wish to allocate my contributions to the Plan as follows:
Percent Allocated
Codes Investment Options
XG Gibraltar Guaranteed Fund%B0 Core Plus Bond / PIM%TA Prudential Day One IncomeFlex Target Balanced Fund%7R Oakmark Equity & Income I%I6 AllianzGI NFJ Dividend Value Instl%TR American Funds Fundamental Invs R4%IX Fidelity Advisor New Insights I%73 Vanguard 500 Index Admiral%R0 Eaton Vance Atlanta Capital SMID-Cap I%DQ Fidelity Advisor Leveraged Co StkInstl%NP Mid Cap Growth / Westfield Capital Fund%WH Mid Cap Value / Systematic Fund%1J Perkins Mid Cap Value T%R1 Vanguard Mid Cap Index Adm%MQ AllianzGI NFJ Small-Cap Value Instl%7W BlackRock Small Cap Growth Equity Instl%VQ Royce Pennsylvania Mutual Invmt%72 Vanguard Small Cap Index Adm%QX American Funds Capital World Gr&Inc R4%P5 American Funds Europacific Growth R4%
1 0 0 Total%
YourAuthorization
Signature X Date
I certify that the information above is accurate and complete. If I have chosen to contribute to the Plan, I givemy employer permission to contribute a portion of my salary to the Plan according to the instructions above.
Social Security Number_____________________
37
10
01
011
22
5

ForEmployerUse Only
This section should be completed only if the participant has previously terminated with the employer sponsoringthe plan and has been rehired.
Original date employed
month day year
Date of termination
month day year
Date of rehire
month day year
Social Security Number_____________________
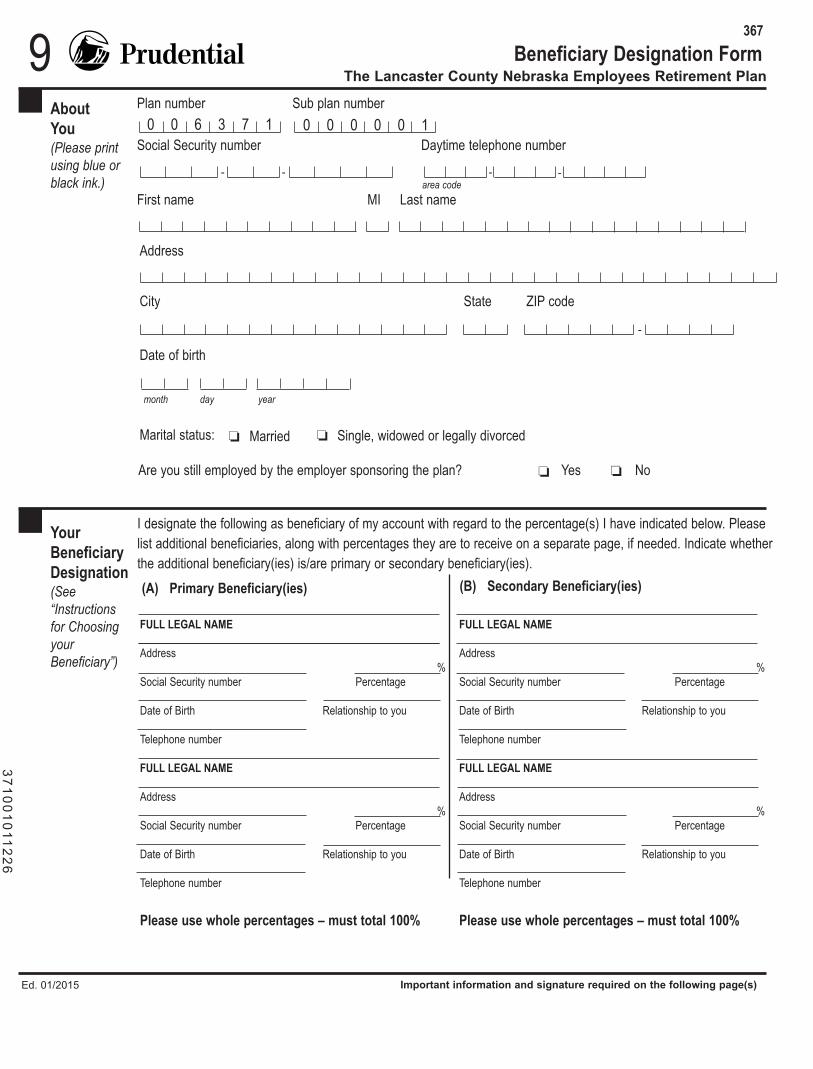
About You(Please printusing blue orblack ink.)
9
area code- - - -
YourBeneficiaryDesignation(See“Instructionsfor ChoosingyourBeneficiary”)
I designate the following as beneficiary of my account with regard to the percentage(s) I have indicated below. Pleaselist additional beneficiaries, along with percentages they are to receive on a separate page, if needed. Indicate whetherthe additional beneficiary(ies) is/are primary or secondary beneficiary(ies).(A) Primary Beneficiary(ies) (B) Secondary Beneficiary(ies)
0 0 6 3 7 1 0 0 0 0 0 1Plan number Sub plan number
Social Security number Daytime telephone number
First name Last nameMI
Beneficiary Designation Form367
The Lancaster County Nebraska Employees Retirement Plan
FULL LEGAL NAME
Address%
Social Security number Percentage
Date of Birth Relationship to you
Telephone number
FULL LEGAL NAME
Address%
Social Security number Percentage
Date of Birth Relationship to you
Telephone number
Please use whole percentages – must total 100%
FULL LEGAL NAME
Address%
Social Security number Percentage
Date of Birth Relationship to you
Telephone number
FULL LEGAL NAME
Address%
Social Security number Percentage
Date of Birth Relationship to you
Telephone number
Please use whole percentages – must total 100%
Address
City State ZIP code
-
Date of birth
month day year
Marital status: o Married o Single, widowed or legally divorced
Are you still employed by the employer sponsoring the plan? o Yes o No
Ed. 01/2015 Important information and signature required on the following page(s)
37
10
01
011
22
6
SpousalConsent
I am the spouse of the participant and, I understand that I am entitled to receive 100% of the account upon the participant’s death.By signing this consent, I will not receive the benefit that would otherwise have been payable to me upon the participant’s death. Ivoluntarily agree to the participant’s designation of the beneficiary(ies) indicated above.
Spouse’s signature - must be witnessed by a notary public OR authorized plan representative. Notary Stamp or SealSubscribed and sworn before me on the ________ day of ____________, the year ______State of _________________________, County of ________________________________My commission expires ___________________
X Date
X Date
YourAuthorization
X DateSignature
authorized plan representativenotary orSignature of o o
DID YOU REMEMBER TO:Sign the form Use whole numbersInitial any changes Have your spouse’s signature notarized
••
••
Social Security Number_____________
Plan ProvisionsFor Married Participants: Upon your death, any benefit will be payable to your spouse unless the Spousal Consent on the reverseside of this form is completed and witnessed. Please be careful in completing the form; be sure that your designation is accurate,clear and understandable.
If you die before you begin to receive benefits, and the Spousal Consent has not been completed, the plan must:1. Automatically pay a spousal death benefit consisting of 100% of your account balance to your surviving spouse (if any) as
beneficiary, 2. Unless your spouse elects otherwise after your death, pay that death benefit in the form of a lump sum.
Generally, if you name your spouse beneficiary for 100% of your account balance you will not be required to obtain spousalconsent for any plan distributions, unless you later elect to receive your benefit in the form of a life annuity.
Note: Even if your current beneficiary is a trust or estate of which your spouse is a beneficiary, spousal consent is necessary.Without such waiver and consent, the spousal death benefit must be paid directly to your spouse.
General Provisions
A. The terms of the plan govern the payment of any benefit.B. Primary beneficiary(ies). If more than one person is named and no percentages are indicated, payment will be made in equal
shares to the Primary beneficiary(ies) who is living at the time the benefit first becomes payable. If a percentage is indicatedand a Primary beneficiary(ies) is not alive at the time the benefit first becomes payable, the percentage of that beneficiary's designated share will be divided equally among the surviving Primary beneficiary(ies).
C. If there is no Primary beneficiary(ies) living at the time of the participant's death, any benefit that becomes payable will be distributed to the surviving Secondary beneficiary(ies) listed, if any.
D. Payment to Secondary beneficiary(ies) will be made according to the rules of succession described under Primarybeneficiary(ies) in provision B above. If no Primary or Secondary beneficiary(ies) is alive when payment is otherwise payable,payment will be made in accordance with the plan.
E. If a Trust is named as beneficiary, any payment to the Trust will be made as if the Trustee is acting in such fiduciary capacityuntil written notice to the contrary is received.
Examples of Beneficiary DesignationsIf you feel that none of the examples below fit the type of beneficiary designation you want, please send a detailed description of whatyou propose to Prudential. Use the term:1. "My Living Children" if you want all your children (born or adopted of any marriage) living at the time of payment to equally
share the benefit. This will also include all such children born or adopted after you completed the form. Do not include the namesof your children if you use this term.
2. "My Living Trust" if you want to designate your Living Trust. You must also give the name(s) of the Trustee(s), name(s) of the successor Trustee(s) (Trustee and Successor Trustee cannot be the participant), the date of the Trust Agreement and theaddress if a bank or trust company is the Trustee.
3. "My Testamentary Trust" if you want to designate the Trust in your Last Will and Testament. Do not name your Trustee.4. "My Estate" if you want the benefit to be paid to your estate.5. "(Name),Per Stirpes" if you want the payment(s) to be paid up to and including the second generation of descendants. For
example, if a beneficiary in such class is not living when a payment is due, such payment will be made in equal shares to anyliving sons and daughters (born or adopted of any marriage), of such beneficiary. If there are no living sons and daughters ofsuch beneficiary when a payment is due, payment will be made to the estate of the last to die of the participant or suchbeneficiary. An example of a correct designation would be Jane Doe, Per Stirpes. 9
367
Please print using blue or black ink. Keep a copy for your records and send the original form to the address above or fax it to1-866-439-8602.
Instructions for Choosing Your Beneficiary30 Scranton Office ParkScranton, PA 18507-1789
37
10
01
011
22
7
1
IncomeFlex Target: The key to securing income for lifeSummary IncomeFlex Target Important Considerations
This summary is intended to serve as an introductory explanation of the bene�ts and features of Prudential IncomeFlex Target®. Before investing, please read the more complete explanation of this product, as well as de�nitions for the terms highlighted in bold, in the Prudential IncomeFlex Important Considerations. You can obtain the document by calling 1-877-778-2100; if you are hearing impaired, please call 1-877-760-5166. Alternatively, you can log on to Prudential Retirement’s website at www.prudential.com/online/retirement.
Prudential IncomeFlex Target®, speci�cally designed for use under the “Retirement Income” allocation of GoalMaker®, helps address many of the uncertainties that exist when it comes to saving for, and living in, retirement. By including IncomeFlex Target in your GoalMaker portfolio you will be invested in an asset mix that helps provide increased stability, growth and income protection.
You maintain �exibility and control over your retirement assets, and you can remove your money at any time. All this is offered by Prudential Retirement Insurance and Annuity Company, a Prudential Financial company. Prudential Financial, with more than 135 years in �nancial services, offers a broad range of �nancial products and services for people and businesses in the U.S. and abroad.
Guarantees are based on the claims-paying ability of the insurance company and are subject to certain limitations, terms and conditions. To maintain the Prudential IncomeFlex Target bene�t, you must invest in one or more of the Prudential IncomeFlex Target Funds. Like all variable investments, these Funds may lose value. Withdrawals in excess of the Guaranteed Lifetime Income Withdrawal Amount will reduce future Guaranteed Withdrawals proportionately.
0195586
For a detailed description of the fund, please refer to the current Fund Fact Sheet (generally available online or by calling 1-877-778-2100). Please review the current Fund Fact Sheet carefully before investing.
2
Typically, how much income you have during retirement will depend on how much you’ve saved by the time you retire. But market downturns may take your retirement savings—and your retirement dreams— down with them. That’s why IncomeFlex was designed to help you keep investing by reducing the risk that losses may impact your income.
The Prudential IncomeFlex Target® Fund is a diversi�ed, professionally managed fund—that uses the fundamentals of asset allocation to create an asset mix best suited for individuals nearing retirement—with a moderate investing style.
The fund includes a feature that guarantees the current IncomeFlex Target Market Value and any future contributions into the Target Fund are used in calculating the amount of guaranteed income that you will be able to withdraw from the Target Fund annually for the rest of your life. This feature also allows you to capture any market gains you may experience annually, on your birthday. See “Your Income Base” for more details.
In addition to the standard investment management fees, a Guarantee Fee is also assessed. For speci�c details on the IncomeFlex Target fees related to your plan, please refer to the “Fees” section of this document.
The IncomeFlex Target Fund works similar to other investments offered in your retirement plan. To invest, all you need to do is transfer some or all of your current balance and/or direct future contributions into the Fund. If your plan permits, you may also roll over the balances from previous employers’ retirement plans.
Your IncomeFlex Target Market ValueYour Market Value is the monetary value of your IncomeFlex Target Fund and starts on the date you make your initial investment into IncomeFlex Target. Similar to other funds offered through your plan, this Market Value will rise and fall based on market performance and will be affected by contributions and withdrawals. This amount is not guaranteed and may lose value at any time.
If you decide to remove all of your money from this fund, you will receive the Market Value as of the effective date of your request, bringing the Market Value to $0, and all IncomeFlex Target guarantees will be cancelled. In the event of your death, the Market Value will be passed on to your bene�ciaries as a death bene�t.
Your Income BaseIn addition to tracking your Market Value, IncomeFlex Target also tracks a value called the Income Base.
The Income Base is guaranteed and is used to determine your Lifetime Annual Withdrawal Amount income bene�t once you begin taking withdrawals from your Active Target Funds. It is not available for withdrawal or transfer. See the Prudential IncomeFlex Target Important Considerations for details on how the Income Base is calculated and tracked while you are saving.
Impact of Contributions and WithdrawalsIn between your birthdays, your Income Base is increased dollar-for-dollar with every contribution you make into the IncomeFlex Target Fund, and is reduced proportionately for every withdrawal or transfer out of the IncomeFlex Target Fund.
I. Your saving years
37
10
01
011
22
8
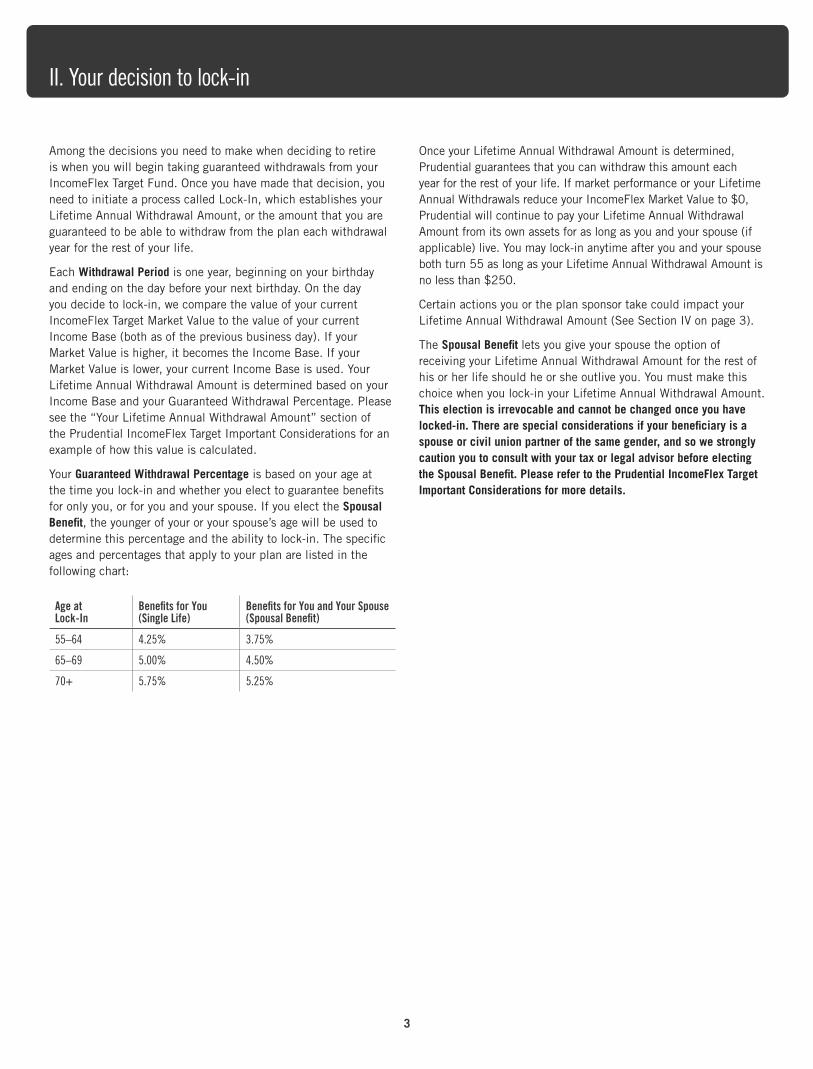
3
II. Your decision to lock-in
Among the decisions you need to make when deciding to retire is when you will begin taking guaranteed withdrawals from your IncomeFlex Target Fund. Once you have made that decision, you need to initiate a process called Lock-In, which establishes your Lifetime Annual Withdrawal Amount, or the amount that you are guaranteed to be able to withdraw from the plan each withdrawal year for the rest of your life.
Each Withdrawal Period is one year, beginning on your birthday and ending on the day before your next birthday. On the day you decide to lock-in, we compare the value of your current IncomeFlex Target Market Value to the value of your current Income Base (both as of the previous business day). If your Market Value is higher, it becomes the Income Base. If your Market Value is lower, your current Income Base is used. Your Lifetime Annual Withdrawal Amount is determined based on your Income Base and your Guaranteed Withdrawal Percentage. Please see the “Your Lifetime Annual Withdrawal Amount” section of the Prudential IncomeFlex Target Important Considerations for an example of how this value is calculated.
Your Guaranteed Withdrawal Percentage is based on your age at the time you lock-in and whether you elect to guarantee bene�ts for only you, or for you and your spouse. If you elect the Spousal Bene�t, the younger of your or your spouse’s age will be used to determine this percentage and the ability to lock-in. The speci�c ages and percentages that apply to your plan are listed in the following chart:
Age at Lock-In
Bene�ts for You (Single Life)
Bene�ts for You and Your Spouse (Spousal Bene�t)
55–64 4.25% 3.75%
65–69 5.00% 4.50%
70+ 5.75% 5.25%
Once your Lifetime Annual Withdrawal Amount is determined, Prudential guarantees that you can withdraw this amount each year for the rest of your life. If market performance or your Lifetime Annual Withdrawals reduce your IncomeFlex Market Value to $0, Prudential will continue to pay your Lifetime Annual Withdrawal Amount from its own assets for as long as you and your spouse (if applicable) live. You may lock-in anytime after you and your spouse both turn 55 as long as your Lifetime Annual Withdrawal Amount is no less than $250.
Certain actions you or the plan sponsor take could impact your Lifetime Annual Withdrawal Amount (See Section IV on page 3).
The Spousal Bene�t lets you give your spouse the option of receiving your Lifetime Annual Withdrawal Amount for the rest of his or her life should he or she outlive you. You must make this choice when you lock-in your Lifetime Annual Withdrawal Amount. This election is irrevocable and cannot be changed once you have locked-in. There are special considerations if your bene�ciary is a spouse or civil union partner of the same gender, and so we strongly caution you to consult with your tax or legal advisor before electing the Spousal Bene�t. Please refer to the Prudential IncomeFlex Target Important Considerations for more details.
4
III. Your income years
Among the decisions you need to make when you decide to begin receiving your Lifetime Annual Withdrawal Amount are the amount and timing of each withdrawal. Outlined below are the components of IncomeFlex Target that will determine how you draw your income.
Taking Your Lifetime Annual Withdrawal AmountAs described previously, IncomeFlex Target guarantees that you can withdraw a de�ned amount of money (the Lifetime Annual Withdrawal Amount) from your IncomeFlex Target Fund each Withdrawal Period for the rest of your life. For a more complete discussion of important points regarding withdrawals, including the process to begin taking your Lifetime Annual Withdrawal Amount, examples showing the effect of withdrawing more than your Lifetime Annual Withdrawal Amount, and withdrawing less than your guaranteed amount, please see the Prudential IncomeFlex Target Important Considerations.
You will need to initiate a change to any systematic withdrawal arrangement you may have in place if you wish to withdraw additional amounts following an increase to your Lifetime Annual Withdrawal Amount.
Increasing Your Lifetime Annual Withdrawal AmountThere are multiple ways your Lifetime Annual Withdrawal Amount may increase after you have locked-in. For more details, please see “Increasing your Lifetime Annual Withdrawal Amount” in the Prudential IncomeFlex Target Important Considerations document.
Decreasing Your Lifetime Annual Withdrawal AmountWithdrawing more than your Lifetime Annual Withdrawal Amount from IncomeFlex Target Funds within a given Withdrawal Period will lower your Lifetime Annual Withdrawal Amount in subsequent Withdrawal Periods. We call these Excess Withdrawals.
If you bring your IncomeFlex Market Value to $0 by taking an Excess Withdrawal, your current IncomeFlex Target Guarantees will expire and will no longer provide a Lifetime Annual Withdrawal bene�t.
You will need to initiate a change to any systematic withdrawal arrangement you may have in place to re�ect a decrease in your Lifetime Annual Withdrawal Amount following an excess withdrawal.
Required Minimum DistributionsYou may be required to withdraw more than your Lifetime Annual Withdrawal Amount to comply with a Required Minimum Distribution. Please see the Prudential IncomeFlex Target Important Considerations for details on how these withdrawals will impact your Lifetime Annual Withdrawal Amount, and for details of the special considerations for same-gender spouses and civil union partners, which may force certain withdrawals taken to satisfy minimum distributions to be considered Excess Withdrawals and thus reduce or potentially terminate the Spousal Bene�t.
IV. Investing in IncomeFlex through GoalMaker
You can also take advantage of IncomeFlex Target by using the optional GoalMaker program offered by your retirement plan. Beginning at age 55, GoalMaker automatically adjusts your portfolio to include an allocation to IncomeFlex Target. The portion of your portfolio invested in IncomeFlex is determined by your chosen investor style. If you are already age 55 or over, if
elected, you will be invested in IncomeFlex Target as soon as you enroll in GoalMaker. Once IncomeFlex Target is included in your portfolio, the additional Guarantee Fee is assessed. To enroll in GoalMaker, please contact us using the information located on the �rst page of this guide.
37
10
01
011
22
9
V. Additional information
Leaving Your Retirement Plan—Transferring Your IncomeFlex Target GuaranteesIf you choose to leave your retirement plan, you may be able to transfer or roll over your IncomeFlex Target Guarantees into a variable annuity contract that is registered with the Securities and Exchange Commission and available under a Prudential SmartSolution IRA. This contract may have substantially different fees, investments and provisions affecting the guarantees.
You should read the materials concerning such contract carefully, including its prospectus, and consider the bene�ts and differences between it and IncomeFlex Target as offered through your retirement plan.
If you roll any portion of your IncomeFlex Target Market Value into anything other than a Prudential-issued variable annuity, all IncomeFlex Target Guarantees for that portion will immediately cease.
If you have more than one retirement plan, your ability to combine guarantees in the SmartSolution IRA may be limited.
IncomeFlex Target—Operating Within Your Retirement Plan
1. Subject to Plan RulesYour participation in IncomeFlex Target is a feature of your retirement plan and is subject to the rules of your retirement plan. If your plan rules differ from IncomeFlex Target’s provisions, your retirement plan’s rules will apply. Refer to your retirement plan’s rules.
2. Plan Sponsor Actions—Fund EliminationThe IncomeFlex Target Fund is like any other investment within your retirement plan. Your plan sponsor, usually your employer, can eliminate the IncomeFlex Target Fund at any time. If this occurs and another IncomeFlex Target Fund is made available under your plan, you can transfer into that IncomeFlex Target Fund and your existing guarantees will continue. However, if your plan does not make any IncomeFlex Target Fund available, your IncomeFlex Target Guarantees will end and the Market Value of your IncomeFlex Target Fund will move as directed by you or your plan sponsor.
3. Prudential Action—Fund ClosingPrudential reserves the right to stop accepting deposits, contributions or transfers into the IncomeFlex Target Fund, and to change or eliminate funds eligible for our guarantees.
These bene�ts are provided through Prudential IncomeFlex Target, which is consistently referred to herein as “IncomeFlex Target”. If elected, certain GoalMaker portfolios also allow an allocation to IncomeFlex Target Funds. To maintain the IncomeFlex Target bene�t, you must invest in an IncomeFlex Target Fund. Like all variable investments, these funds may lose value. Withdrawals in excess of the Lifetime Annual Withdrawal Amount will reduce future guaranteed withdrawals proportionately.
IncomeFlex Target Funds are separate accounts available under group variable annuity contracts issued by Prudential Retirement Insurance and Annuity Company (PRIAC) (CA COA # 08003.), Hartford, CT. PRIAC does not provide any guarantee of the investment performance or return of contributions to those separate accounts. PRIAC’s guarantee of certain withdrawals is supported by PRIAC’s general account and is contingent on its claims-paying ability. You should consider the objectives, risks, charges and expenses of the funds and guarantee features. Before electing the Spousal Bene�t (if available) on behalf of any bene�ciary not recognized as your spouse under Federal law, be aware that provisions of the Plan or Internal Revenue Code might prevent, limit or otherwise affect the ability of the bene�ciary to receive the Spousal Bene�t.
For this and other information, please access the participant website or call 1-877-778-2100 for a copy of the IncomeFlex Target Important Considerations document prior to investing. Product availability and terms may vary by jurisdiction and product version. Subject to regulatory approvals. Annuity contracts contain exclusions, limitations, reductions of bene�ts and terms for keeping them in force. Contract form #GA-2020-TGWB4-0805 or state variations thereof.
Prudential, the Prudential logo and the Rock symbol are service marks of Prudential Financial, Inc. and its related entities, registered in many jurisdictions worldwide.
0195586-00002-00 RSBR770 Prudential IncomeFlex Target investing through GoalMaker Summary
IV. Fees
As mentioned above, you pay a Guarantee Fee for the IncomeFlex Target Guarantees. This Guarantee Fee is an annual fee of 1% and is assessed in addition to the investment management fees and other operating expenses or contract fees applied to the IncomeFlex Target Funds. This fee reduces the investment returns of the fund and this reduction is re�ected in your Market Value.
Prudential may change the Guarantee Fee in the future, up to a maximum of 1.5%. Any change will apply to money added to IncomeFlex Target. However, as detailed in the Prudential IncomeFlex Important Considerations, following a fee increase, you may take action that would have the higher fee to apply to the your entire IncomeFlex Market Value.