Embed Size (px)
Citation preview
Decision Information Resources, Inc.
Youth OpportunityGrant Initiative:
Management Information System
Final Report
March 2007
Revised Final Report Submitted to: Submitted by: Dan Ryan Decision Information Resources, Inc. Employment and Training Administration 2600 Southwest Freeway, Suite 900 The United States Department of Labor Houston, TX 77098 200 Constitution Ave, NW Room N-5637 Author: Washington, D.C. 20210 Ronald D’Amico Social Policy Research Associates
Acknowledgements We would like to thank the many people whose contributions helped make this report possible. To begin with, we wish to acknowledge the hard work and dedication of YO staff members, not only for their caring services to young people, but for their painstaking efforts at systematically documenting youths’ experiences in the program. The data they so carefully recorded in their management information systems constitute the essential foundation for this report. We thank as well YO’s data management contractor, Covansys, for providing us with monthly data reports and quarterly data extracts and kindly answering our queries about various data fields. Connecticut Consulting provided monthly data reports for several additional grantees. We would also like to thank key staff at the U.S. Department of Labor (DOL) for their steady support, including our Project Officers, Daniel Ryan and Kerri Vitalo of DOL’s Division of Research and Evaluation. DOL’s Office of Youth Services (OYS) was chiefly responsible for developing data specifications for YO’s management information system (MIS), and this report rests heavily on its thoughtful and comprehensive approach. In particular, we acknowledge the support and guidance for the MIS provided by OYS’s Lorenzo Harrison, David Lah, Gregg Weltz, and Evan Rosenberg. We thank them as well for their vision, guidance, and ongoing dedication to improving opportunities for all young people. Additionally, Mr. Ryan and Mr. Lah developed careful projections of the size of the YO eligible population (based on baseline survey data provided by the research team), which we have used in this paper.
Decision Information Resources, Inc. i YO Grants—MIS Report
Table of Contents
Acknowledgements ........................................................................................................................ i
Executive Summary..................................................................................................................... iv Program Overview and Study Objectives.................................................................................. iv Evaluation Methods for the MIS Report..................................................................................... v About Enrollees ......................................................................................................................... vi About Participation ................................................................................................................... vii About Outcomes ...................................................................................................................... viii Conclusions................................................................................................................................ ix
Chapter 1. Introduction and Background...................................................................................1 Background................................................................................................................................. 1 A Note about Quality.................................................................................................................. 3
Chapter 2. About Enrollees...........................................................................................................4 Enrollment Rates......................................................................................................................... 4 Penetration Rates among OSY and ISY ..................................................................................... 7 Demographic Attributes of Enrolled Youths ............................................................................ 13
Chapter 3. About Participation ..................................................................................................16 Services That Youths Access.................................................................................................... 16 Characterizing Participation ..................................................................................................... 19
The Intensity of Participation................................................................................................ 21 Differences in Participation Intensity among Grantees ........................................................ 23
Chapter 4. Understanding Outcomes.........................................................................................26 Placements Rates ...................................................................................................................... 27 Types of Placements and Educational Achievements .............................................................. 31 Explaining Placements among YO Youths .............................................................................. 32 Explaining Retention ................................................................................................................ 35
Chapter 5. Summary and Conclusions ......................................................................................38
Appendixes
Appendix A. YO Grantees ..........................................................................................................41
Appendix B. Glossary of Youth-Development Activities (from DOL)....................................42
Appendix C. Means and Standard Deviations of Variables Included in the Placement Logit Equation..................................................................................................................44
Decision Information Resources, Inc. ii YO Grants—MIS Report
Figures
Figure 1. Trend in Enrollments across All 36 Grantees ............................................................. 5 Figure 2. Total Out-of-School and In-School Enrollments by Grantee, June 2005 ................... 6 Figure 3. Trend in Percentage of OSY across All Grantees ....................................................... 7 Figure 4. Eligible Youths by Program Enrollment Status, June 2005........................................ 8 Figure 5. Penetration Rates, by Grantee, June 2005................................................................... 9 Figure 6. YO Grant Amount per Eligible Youth ...................................................................... 11 Figure 7. YO Grant Amount per Enrollee ................................................................................ 12 Figure 8. Expenditures per Enrollee, by Penetration Rate........................................................ 13 Figure 9. Percentage of Youths Participating in YO Activities................................................ 18 Figure 10. Average Hours of Participation—Overall and by Subgroups ................................. 21 Figure 11. Distribution of Hours of Participation..................................................................... 22 Figure 12. Median Hours of Participation ................................................................................ 23 Figure 13. Median Hours of Participation, by Grantee............................................................. 25 Figure 14. Placement Rate among Exiters, by Grantee ............................................................ 30
Tables
Table 1. Characteristics of YO Participants and Others ........................................................... 15 Table 2. Instances, Categories, and Patterns of Participation................................................... 20 Table 3. Placements Rates and Status....................................................................................... 28 Table 4. Types of Long-Term Placements................................................................................ 31 Table 5. Percent Obtaining Degrees, Diplomas, or Equivalent ................................................ 32 Table 6. Logit Models of Attaining a Long-Term Placement .................................................. 33 Table 7. Retention Rates among Youths Who Were Placed .................................................... 35 Table 8. Logit Models of Retention at Follow-up .................................................................... 37
Decision Information Resources, Inc. iii YO Grants—MIS Report
Executive Summary This report presents the results of an analysis of data from the Youth Opportunity (YO) program’s management information system (MIS). The report is part of an evaluation that included an area survey of local youths to measure labor market outcomes in YO grant sites; an ethnographic study to assess community well-being before and after delivery of YO grant services; and a process analysis to document how programs are designed and implemented to meet the employment, training, and educational needs of area youths. DIR is presenting the findings from the evaluation in a series of reports: • this report, which is based on MIS data
• a process evaluation report, which describes the grantees’ administrative and service delivery processes
• an ethnographic report, which examines the communities served by the 36 grantees, including how the community contexts influenced YO implementation and were changed by it in turn
• a synthesis report, which describes impacts of the projects on participants and integrates the findings from the study components to address key study questions about the YO initiative
All reports except the final one have been completed. Program Overview and Study Objectives The U.S. Department of Labor (DOL) funded 36 YO grantees in 2000. These grantees were given the mission of serving both in-school youths (ISY) and out-of-school youths (OSY) by using a model of program services with the following features: • Geographic Saturation. The program was intended to reach out to as many youths in the
targeted empowerment zones, enterprise communities, or high-poverty areas as funds would allow. By targeting all youths and saturating a high-poverty area with a comprehensive mix of services, the program was expected to impact the larger community and create a positive environment for promoting youth development.
• Youth Opportunity Community Centers. Under the YO model, each grantee was required to establish in the target area one or more Youth Opportunity Community Centers that provided a safe and accessible place for youths to meet. These centers were to be staffed with youth development specialists and offer a core set of services.
• Youth Development Framework. In addition to preparing youths for successful employment and improving their educational outcomes, YO programs were expected to provide supportive services (including mentoring, support groups, and follow-up services) and services that develop the potential of youths as citizens and leaders (such as community service, sports and recreation, and life skills training). Each program was also expected to maintain a core staff of youth-development specialists, who serve as case managers and play
Decision Information Resources, Inc. iv YO Grants—MIS Report
a critical role in recruiting youths and assuring that intensive placement, follow-up, and other services are provided.
• Long-Term Engagement. With the increased recognition that youths need to be “engaged” over a long period of time to receive meaningful benefits, YO aimed to establish longer-term relationships with youths and, if they need it, provide them services over many months or even several years. Further, youths were encouraged to continue to access services even after receiving a placement.
• Partnerships and Leveraging. YO strongly emphasized that the grantee was to establish partnerships with public, private, and nonprofit organizations and leverage resources that would enable the services to continue, even after YO funds cease. These partnerships should enable programs to serve youths in a variety of ways and provide a broad range of services.
The evaluation was funded just at the time that the grant awards were being made; it had multifaceted objectives, including to: • Measure the impact of the program on employment, educational enrollment and attainment,
graduation rates, wages, welfare enrollment, and youth involvement in crime in the target areas
• Document and assess the effectiveness of the delivery of YO-funded services and leveraged services in the target areas
• Assess the target areas’ sense of well-being before and after receipt of program services
The MIS report supports these objectives by documenting how many and what types of youths were served, how they were served, and what outcomes were achieved. Further, by describing grantee-to-grantee variation in these documented areas, it supports the analysis and interpretation of program impacts, which will be detailed in a report to come. Evaluation Methods for the MIS Report The primary sources of data for the MIS report come from: • Monthly tabulations of grantee data prepared by DOL’s data-management contractor. These
tabulations present summary statistics for the number of enrollees, their characteristics, their services, and their outcomes and are available for every grantee and each month from June 2001 through June 2005.
• Quarterly tabulations of grantee data prepared by DOL’s data-management contractor. These tabulations present follow-up statistics (primarily retention in employment or training) for youths who had received long-term placement. These data are available for every grantee and for every calendar quarter ending September 2001 through June 2005.
• Data records for individual program participants, covering those served by 34 of the 36 grantees (individual-level data were not available for two grantees).
Decision Information Resources, Inc. v YO Grants—MIS Report
In general, the quality of data from these sources appears adequate for describing YO participants and their services and outcomes. At the same time, some issues concerning data quality are in evidence. For example, some grantees acknowledged that the use of the custom electronic MIS software developed by DOL’s data management contractor took more than a little time to master, that bugs and glitches in the system continued for a while and made accurate data entry difficult, and that definitions of some coding categories were confusing initially. As a consequence, data quality is probably better in YO’s latter years than in its earlier years. Even after the initial period, some grantees admitted that data entry was not a priority for their case managers and that data quality sometimes suffered as a consequence—a problem that appeared to be exacerbated when grantees operated multiple satellite offices or services were provided by many program partners. Also, placements were sometimes difficult for grantees to accurately identify, especially for Native American grantees, because many youths left the YO target area after completing their services; thus, placements may be undercounted. Finally, the service categories overlap somewhat, hours in services were difficult to capture reliably, and different grantees applied different standards regarding what counted as participation in a service, with some playing the “numbers game” (as one grantee described it) more than others. These difficulties suggest some modest unreliability in the numbers in this report and also make comparisons of differences across grantees somewhat imprecise. About Enrollees The trend in the cumulative number of enrollees shows the remarkable ratcheting up of program operations over the approximately five years that YO has been operating. Enrollments reached about 22,000 in June 2001, a little more than one year after grant funds were awarded, and more than doubled to over 50,000 enrollees by the end of YO’s second year. Growing steadily thereafter, total enrollments reached more than 92,000 participants as YO neared its end in June 2005. This number represents a substantial portion of all youths served in DOL-funded youth workforce programs during that year. Furthermore, the number of active enrollees substantially exceeded DOL’s target of 44,000 for the program in two of YO’s final three years, and just missed this target in the final year. Although participants were nearly evenly split between in-school (ISY) and out-of-school (OSY) youths, OSY participants represented a much higher proportion of the eligible youth population in the grantees’ service areas and thus reflected the grantees’ concerted effort to reach and serve OSY, who have traditionally been very difficult to enroll in workforce programs. In fact, YO grantees enrolled about 52 percent of eligible OSY and 26 percent of ISY for a blended penetration rate of just less than 34 percent. Grantees’ ability to achieve a high penetration rate was uneven, however. Although two-thirds of grantees enrolled between 25 percent and 45 percent of eligible youths, some achieved penetration rates much higher than that, even reaching 100 percent in some cases, while others recorded penetration rates that were much lower. Partly, this difference reflected the adequacy of the grantee’s YO allotment per eligible youth, which was much more generous than average for a handful of grantees. But partly, it also reflected a grantee’s decision as to whether it would strive for a higher penetration rate, even if it meant having relatively less to spend per enrollee, or
Decision Information Resources, Inc. vi YO Grants—MIS Report
strive for a lower penetration rate and have relatively more to spend per enrollee. These trade-offs represent an important context in understanding potential program impacts. Grantees also differed greatly in size, with the larger grantees serving more than 4,000 youths and the smaller ones serving several hundred. Again, the amount of each grantee’s allocation, as well as the size of its target area, greatly determined its size, but so, too, did its decision as to how thinly to concentrate its resources. In keeping with the communities that were being targeted, youths of color predominated virtually everywhere. Thus, non-Latino whites made up only about five percent of all enrollees. Enrollees were about evenly divided by gender and according to whether or not they were attending school at the time of enrollment. However, YO was far more likely to serve OSY, particularly high-school dropouts, than nationwide youth programs funded by formula under the Workforce Investment Act. About Participation The YO MIS records whether enrollees participated in any of 15 youth-development activities. Of these activities, job-readiness training and life-skills training were the most common, with about 45 percent of enrollees participating in each at some time during their tenure in the YO program. But sports and recreation, short-term unsubsidized employment, internships, community service, and remediation also showed ample participation with participation rates of at least 25 percent. Further, in keeping with the holistic model that YO was promoting, most youths participated in multiple services during the course of their tenure in the program. In fact, it was common for youths to participate in at least one employment-related activity, at least one educational activity, and at least one other activity designed to support youths and develop their potential. Average hours of participation could also be substantial, reaching an average of about 550 hours per person, which is roughly equivalent to what many other programs that provide comprehensive services to at-risk youths have been able to achieve. At the same time, the intensity of participation was uneven, with the average masking tremendous variability. For example, about one-fifth of youths participated 1,000 hours or more over the course of the grant, but one-quarter participated for fewer than 50 hours. Moreover, many of the activities in which youths participated were low in intensity. For example, job-readiness training, the single activity in which most youths participated, lasted on average only 16 hours among participants, college/SAT preparation lasted 18 hours, community service 20 hours, individual tutoring 24 hours, and reading or math remediation 50 hours. The only activities that could be described as even moderately intensive were internships, at an average of 146 hours, and short-term unsubsidized employment, at 360 hours. Some youths participated at a much higher level of intensity than others; that participation level doubtless reflects the higher need for services that some had and is thus in keeping with DOL’s expectations for the program. While hours of participation varied from one enrollee to the next, average hours of participation varied markedly across grantees, as well. Thus, some grantees reported that their youths participated an average of 1,000 hours or more per person, while others reported that their youths participated an average of less than 100 hours per person. This variation partly reflected the size of the grantee’s target area relative to its grant allocation and the services it chose to emphasize. It also may partly have reflected its ability to garner financial or in-kind contributions from
Decision Information Resources, Inc. vii YO Grants—MIS Report
program partners in the community and its success in engaging youths in multiple program services over time. Finally, some grantees were simply more diligent than others about recording hours of participation. About Outcomes The YO MIS records outcomes as placements in unsubsidized employment, education, or training. About 38 percent of all YO participants, or about 35,000 of them, received a placement of one of these types. Many others (about 21 percent) were not placed but were still receiving program services in June 2005, the last period for which we have data. Others dropped out of the YO program before placement because they moved away from the target area, but many others—about 32 percent—stopped participating before placement for no known reason (or, even though enrolled, might not have actively participated to begin with). Youths could have received a placement of more than one type. Of those with at least one placement: • Just more than half, or about 18,500 young people, entered unsubsidized employment, with
this type of placement somewhat higher among OSY (nearly 60 percent of those placed) than among ISY (about 45 percent).
• About 60 percent of ISY who were placed entered long-term education, such as a community college or 4-year college, and 14 percent entered long-term training, such as vocational school.
• About 40 percent of OSY who were placed entered long-term education—primarily a community college or alternative high school—and 22 percent entered long-term training.
Grantees differed greatly in the placement rates they posted. Some placed more than 90 percent of all those who had stopped receiving program services, while others placed just 20 percent or 30 percent. These differences may reflect features of the grantees’ service areas (for example, how plentiful jobs were) or how successful they were in keeping youths engaged in program services until they were ready for a placement. Certain demographic attributes of youths help explain why some but not others received a placement. For example, older youths were more likely to have been placed than younger youths, and high-school graduates were much more likely to have been placed than dropouts. Engagement with the program also seemed to be important. Youths who participated for a greater number of hours and participated in more varied service activities were more likely to have received a placement. Finally, we looked at the extent to which youths who received a placement were “retained” when contacted at follow-up—that is, were still employed or in education or training (whether or not it was the same employment, education, or training for which they received their initial placement). As of June 2005, about 80 percent of youths in the follow-up pool who were successfully contacted were classified as retained, suggesting the grantees’ ability to make placements that stick. However, about 34 percent of youths in the follow-up pool could not be contacted at
Decision Information Resources, Inc. viii YO Grants—MIS Report
follow-up, either because they had moved from the service area or for some other reason, so the retention status of an appreciable number of youths could not be determined. Conclusions On the bright side, YO’s ability to gear up quickly was impressive, as evidenced by the more than 92,000 youths who were enrolled by the end of YO’s planned five years. Moreover, nearly half of enrollees were OSY, a group that has traditionally been very difficult to reach in youth-workforce programs. Most grantees enrolled about 34 percent of age-eligible youths in the target area; although describing this level of enrollment as saturation may be an overstatement, the program nonetheless succeeded in reaching a substantial proportion of youths in the YO target areas, so community-wide impacts could reasonably be expected. Further, of those enrolled, nearly all received multiple services from among the 15 youth-development activities that were available, and 40 percent participated in at least one activity from each of three major categories—employment activities, educational activities, and other activities designed to build youths’ potential. Finally, about 38 percent of all enrollees were placed in jobs or training that was intended to represent a long-term opportunity, and another 20 percent had not yet been placed but were still actively participating in services in the months before June 2005, the last period for which we have data. These figures suggest that YO’s accomplishments were substantial in reaching large numbers of youths and engaging them in multiple services over an extended period of time, with the goal of eventually preparing them for a long-term placement. On a less positive note, most of the services that youths received were individually not that intensive, and an appreciable number of enrollees participated very little. Although many youths did participate in services for hundreds of hours, this often represented time in subsidized or short-term unsubsidized employment, both of which have been staples of youth programming for decades. Finally, although about 38 percent of enrollees received a placement, nearly as many had not been placed but had ceased participating in services for at least the several months leading up to June 2005. Whether the balance of these factors is sufficient to positively impact youth participants and their communities remains for the research team to establish as the evaluation concludes its investigation of the YO program in the months ahead. Potentially, some of the grantee-to-grantee variation that this report documents—such as the percentage of youths in the target area who were enrolled, whether OSY were more likely to be served than ISY, average hours in services for those who were enrolled, and placement rates—provides clues to where impacts might most likely be found or what form they might take.
Decision Information Resources, Inc. ix YO Grants—MIS Report
Chapter 1. Introduction and Background This paper draws on data from the Youth Opportunity (YO) program’s management information system (MIS) to present a profile of YO, including who was served, with what services, and with what success. It is a companion to a series of reports prepared by the evaluation team that focus on how YO operated and what it achieved: • A process evaluation, Youth Opportunity Grant Initiative: Process Evaluation Final Report,
which examines program strategies and describes administrative and service-delivery processes of the grantees
• An ethnographic evaluation, Youth Opportunity Grant Initiative: Ethnographic Study Final Report, which provides an account of what the YO communities look like, how their community contexts influenced YO’s ability to fully implement the YO service model, and, conversely, how YO affected the communities
The evaluation’s overall final report, which draws findings from these components and reports additional analyses to estimate YO’s net impacts, is currently underway. In the present paper, we first present a brief background of YO and of its data management system and then discuss MIS findings with regard to the characteristics of YO participants, their services, and their outcomes, including employment outcomes and educational achievements. Background The Youth Opportunity Program was authorized by Congress as part of the Workforce Investment Act of 1998. Building on earlier pilot projects, such as the Youth Opportunity Area Demonstration and Youth Fair Chance, the Department of Labor (DOL) awarded 5-year YO grants in February 2000 to 36 organizations around the nation to serve youths ages 14–21 residing in high-poverty communities. Of these 36 grants, 24 were awarded to organizations serving urban areas, 6 to those serving rural areas, and 6 to Native-American organizations serving tribal areas (for a list of the 36 grantees, see Appendix A). Working from an asset-based, youth-development framework, YO grantees were charged with making a comprehensive array of services available to program participants and providing them a long-term and intensive engagement with program activities. The final process-evaluation report documents how grantees accomplished their objectives, including how they recruited and enrolled youths, what services they emphasized, how they delivered the services, and what outcomes the youths attained. The report relies heavily on extensive qualitative data from field observations and interviews carried out during three rounds of site visits to each of the YO grantees, but it also weaves in selected data drawn from the grantees’ MIS to document key points. In contrast, this MIS report delves more deeply into the MIS data to provide a quantitative description of the program that tells a parallel story. The MIS data on which we draw is suitable for this purpose because it provides comprehensive information about enrolled youths and the nature of their participation in YO, and it does so in a way that is largely consistent across all 36 grantees. Moreover, because we were able to access data extracts over the life of the project,
Decision Information Resources, Inc. 1 YO Grants—MIS Report
we can provide moving snapshots of YO and thus can use this data to describe how the program evolved over time. The fact that MIS can be used in this way is directly attributable to the fact that DOL established guidelines for YO grantees at the outset about the types of data elements that should be captured and reported and, further, funded the development of a custom management-information system, which grantees could use at their option, to record and tally the data that they were collecting. As might be expected, given the complexity of the custom MIS that was envisioned, the development and genesis of the MIS were unfortunately not smooth. Although, ideally, the MIS should have been available shortly after YO grants were awarded, in actuality, a working system was delayed. Partly as a consequence, some grantees decided to use their own automated data systems, which they retained through the entirety of the YO program. Other grantees fell back on paper records, causing huge backlogs in data entry. Thereafter, the initial version of the MIS was released for use but had bugs and glitches that required a few more months to resolve and still more time for the backlog in data entry to dissipate. Despite this rocky start, the custom MIS, known as e-Teams, was adopted by 23 of the 36 YO grantees, and many found it convenient to use, particularly when the feature for entering data through Web access was enabled. The 13 grantees not using e-Teams used a management information system of their own. Regardless of which system they were using, grantees were expected to record and report the following items for each individual: • The youths’ demographic characteristics, including age, gender, school status, race and
ethnicity, and educational attainment at enrollment.
• Information about services received, including which months each youth participated in each of 15 youth-development activities and (for those using the e-Teams system only) their hours of participation.1
• Information about outcomes attained, including placements in long-term education, training, or unsubsidized employment.
• Follow-up information for those placed, including whether the individual was still in long-term education, training, or unsubsidized employment at quarterly intervals for up to two years after the initial placement.
We draw on the recorded and reported data for this report. In particular, we use: • aggregate tabulations of participants’ characteristics, services, and outcomes (prepared
monthly by DOL’s data-management contractor for each of the 36 grantees separately) and tabulations of follow-up outcomes (that is, retention) for each grantee prepared quarterly
• individual-level data that was forwarded to us by DOL’s data management contractor for 34 of the 36 YO grantees, covering all of their participants and every month of their service
1 Grantees that didn’t use e-Teams may have been collecting hours of participation for their own purposes but were not asked to forward this information to DOL’s data-management contractor. By contrast, hours of participation was a data item in the e-Teams software. Thus, we have hours of participation for youths served by the latter group of grantees but not the former.
Decision Information Resources, Inc. 2 YO Grants—MIS Report
activity from the program’s start in early 2000 through June 30, 2005, when the YO programs were winding down2
We use this data to describe the YO programs in detail. We also use it to establish an appropriate context for interpreting the impacts that YO programs had on program participants and their communities—a subject for the evaluation’s final report— including why some programs might be found to be more effective than others. A Note about Quality On the basis of interviews that we conducted with grantee staff, including MIS personnel, and of our own review of data-quality issues, we conclude that the data on which this report is based is of acceptable quality for analysis purposes, a conclusion shared by the U.S. General Accounting Office in its recent report on the YO program.3 On the other hand, some quality issues concerning data were evident, which is not surprising in a data system that captures potentially hundreds of data elements for nearly 100,000 individuals. For example, the backlog in data entry that occurred at the outset was never completely remedied by some grantees. Similarly, some grantees acknowledged that the use of e-Teams took more than a little time to master, that bugs and glitches in the system continued for a while and made accurate data entry difficult, and that definitions of some coding categories were confusing at the outset. As a consequence, data quality is probably better in YO’s latter years than it is in its earlier years. Even thereafter, some grantees admitted that data entry was not a priority for their case managers and that data quality sometimes suffered as a consequence, a problem that appeared to be exacerbated when grantees operated multiple satellite offices or services were provided by many program partners. Additionally, placements were sometimes difficult for grantees to identify accurately, especially for Native American grantees, because many youths left the YO target area after completing their services; thus, placements may be undercounted. Finally, the service categories overlap somewhat, hours in services (for e-Teams grantees) were difficult to capture reliably, and different grantees applied different standards to what counted as participation in a service, with some playing the “numbers game” (as one grantee described it) more avidly than others. These difficulties suggest some unreliability in the numbers in this report, particularly in YO’s earlier years and in relation to hours in services. Cross-grantee comparisons should be viewed as only approximations of actual differences because of variance in the diligence that grantees exercised in their data entry and in the procedures that they followed. Despite these shortcomings, these results doubtless provide a reliable guide with respect to orders of magnitude and draw on the richness of the data that are available to tell an important story about YO.
2 While the data that we draw from the monthly and quarterly tabulations is available for all 36 grantees, the individual-level data is available for only 34 of them. The two grantees for which we are lacking individual-level data are the Oglala Sioux Tribe and the Ute Mountain Ute Tribe. Of the 34 grantees, we draw individual-level data from e-Teams for 23 of them and from the grantees’ own MIS for the remaining 11. Equivalent information is available for these 34, except that hours of participation in various services is available only through e-Teams. Appendix A denotes which grantees used e-Teams and which did not. 3 Youth Opportunity Grants: Lessons Can Be Learned from the Program, but Labor Needs to Make Data Available, 2005, U. S. General Accounting Office, GAO-06-53.
Decision Information Resources, Inc. 3 YO Grants—MIS Report
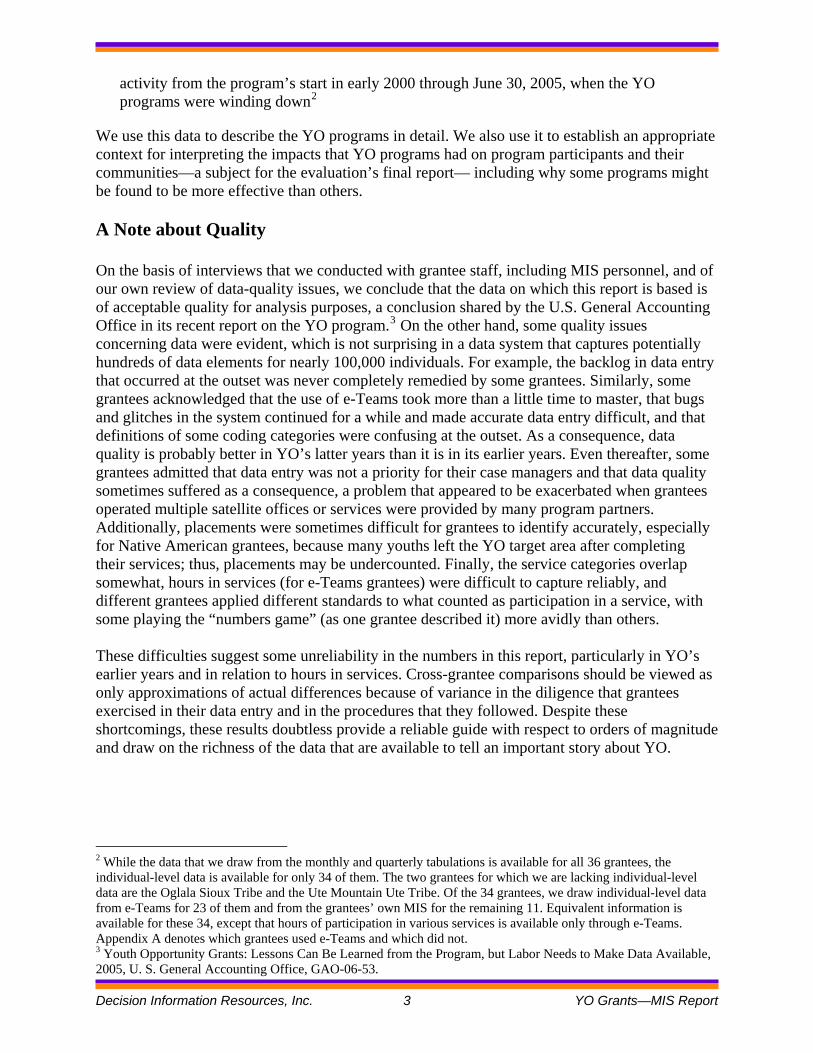
Chapter 2. About Enrollees A first step in describing YO’s accomplishments is documenting whom the programs served. We begin by describing overall enrollment rates and then discuss participants’ demographic characteristics in comparison to youths nationwide and those served by formula-funded youth programs. Enrollment Rates According to the definitions that DOL established, an individual is classified as enrolled in YO when the administrative registration process is completed and the youth receives a first service, which is often an individual assessment or the development of a service plan. As we documented in the Baseline Report, one of the earliest challenges YO programs faced in getting their programs off the ground was recruiting youths to participate—particularly out-of-school youths (OSY), who were described as much harder to reach than in-school youth (ISY)—and enticing them to join YO.4 Nonetheless, grantees made concerted efforts using a variety of innovative recruitment mechanisms—described in detail in the Baseline Report—and ultimately enrolled 92,263 young people. Because DOL established an enrollment target about 57,000 youths, grantees cumulatively exceeded their enrollment target by a considerable margin. Figure 1 displays the cumulative number of enrollments from June 2001 through June 2005, the last month for which we have data. As the chart shows, enrollments exploded during YO’s early years to just less than 22,000 enrollees by June 2001—a little more than one year after grant funds were first awarded and the time when the MIS was first becoming operational—and to more than 52,000 enrollees in June 2002, a remarkable increase of program operations over YO’s first few years. YO added another 23,000 enrollees by June 2003 to a total of just over 75,000 and saw less dramatic but still steady increases in enrollment thereafter, adding another 17,000 over YO’s final two years to a total of 92,263 by June 2005. As further evidence of the ambition of YO’s outreach, DOL set a target of having 44,000 young people actively participate in services for each of YO’s final three program years, PY 2002, 2003, and 2004. YO exceeded this target in the first two of those years and just missed this target in the final year as YO was winding down. Indeed, at YO’s peak, in mid-2004, grantees were listing more than 48,000 youths as actively participating in services (that is, receiving some service some time in the prior 12 months). In any given program year, WIA formula-funded youth programs serve about 350,000 youths nationwide, and Job Corps serves another 60,000.5 Thus, the number of participants in YO at its peak represented about 12 percent of the total number of youths being served by the publicly funded workforce system.6
4 Evaluation of the Youth Opportunity Initiative, Baseline Report: Volume 1—Cross-Cutting Findings of the Process and Ethnographic Studies of the YO Grant Evaluation, Decision Information Resources, October 2001. 5 Section 126 of the Workforce Investment Act (WIA) establishes a national program to provide workforce activities to eligible youths. Funds for this program are distributed by DOL to states and from states to local workforce investment areas by using a funding formula that takes into account the geographic distribution of the number of unemployed and economically disadvantaged youths. Job Corps, authorized by Subtitle C of WIA, is primarily a residential program providing high-intensity, comprehensive services to at-risk youths. 6 Data for the number of participants served by WIA formula-funded youth programs and Job Corps were taken from Workforce System Results: Second Quarter, Program Year 2004.
Decision Information Resources, Inc. 4 YO Grants—MIS Report
Decision Information Resources, Inc. 5 YO Grants—MIS Report
Figure 1. Trend in Enrollments across All 36 Grantees
Exhibit 1: Trend in Enrollments
50,000
60,000
70,000
80,000
90,000
100,000
Aug-04
Oct-04
Dec-04
Feb-05
Apr-05
Jun-0
5
0
10,000
20,000
30,000
40,000
Jun-0
1
Aug-01
Oct-01
Dec-01
Feb-02
Apr-02
Jun-0
2
Aug-02
Oct-02
Dec-02
Feb-03
Apr-03
Jun-0
3
Aug-03
Oct-03
Dec-03
Feb-04
Apr-04
Jun-0
4
ISYOSY
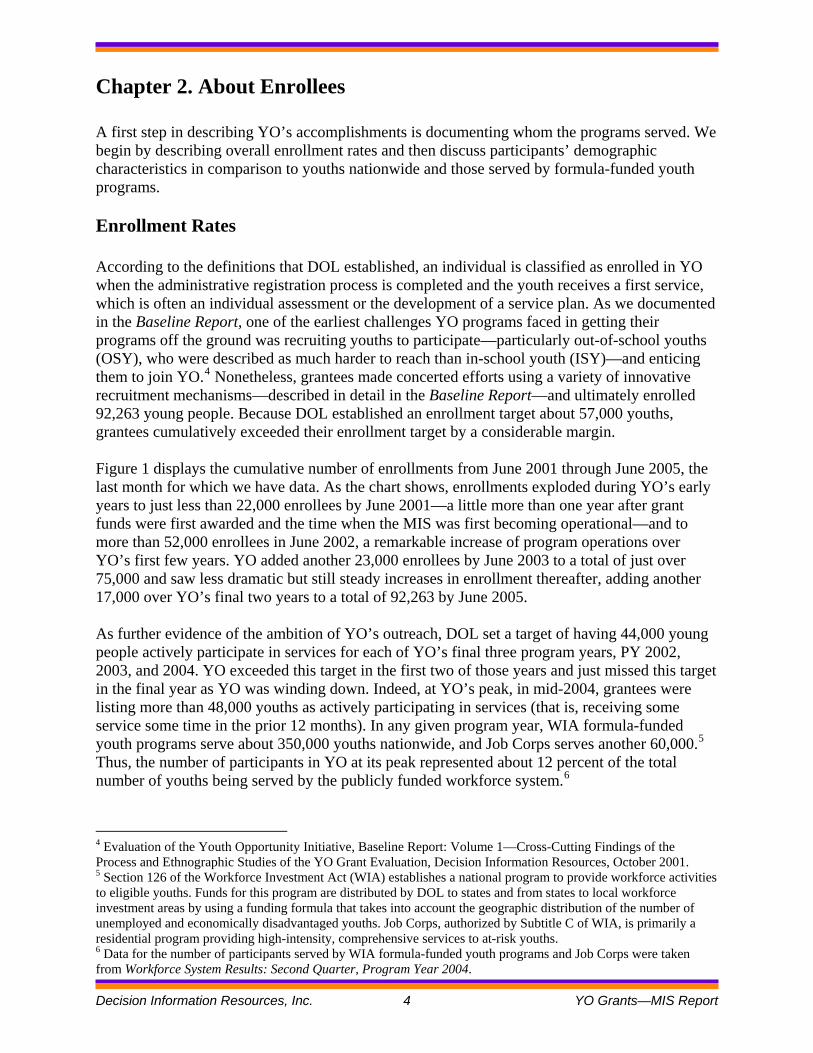
Note: Data was drawn from the monthly grantee reports. YO participants are served by 36 YO grantees that vary greatly in scale. DOL deliberately intended for communities of different types, including those with larger or smaller service areas and in urban and rural communities, to have the chance to compete for YO funds. Other reports for this evaluation amply demonstrate the variability in organizations and communities that received funding.7 But that point is also shown in Figure 2, which reports the number of in-school youths (ISY) and out-of-school youths (OSY) served by each grantee. Some grantees served nearly 4,500 young people, while others served several hundred—just 143, in the case of Grand Traverse. Further, although Figure 1 suggests that the split between ISY and OSY was nearly even, Figure 2 makes clear that grantees differed in the extent to which they focused on one group or the other. For example, OSY made up more than two-thirds of the total number of participants in Baltimore and Cleveland but fewer than about one-third of them in Grand Traverse, CIMC, Ute Mountain, Navajo Nation, and Philadelphia. Clearly, these great differences in scale and focus constitute a critical context in understanding how the programs unfolded and what impacts (for example, on school completion or employment outcomes) they can be expected to have.
7 See the Youth Opportunity Grant Initiative: Process Evaluation Final Report and the Youth Opportunity Grant Initiative: Ethnographic Study Final Report, both submitted to DOL in draft form in December 2005.
Exhibit 2: Out-of-School & In-School Enrollments by Grantee
0 500 1,000 1,500 2,000 2,500 3,000 3,500 4,000 4,500 5,000
Grand TraverseUte Mt
MolokaiImperial
CIMCSeattle
Camilla GABirminghamKansas City
BrocktonMonroe LAMilwaukee
PortlandLumberton NC
Pine Bluff ARTampa
WashingtonSan Francisco
DenverPhiladelphia
ClevelandHartfordTucsonBuffalo
San DiegoOglala Sioux
Cook InletBoston
MemphisNavajoDetroit
HoustonSan Antonio
BaltimoreLos Angeles
Louisville
OSYISY
Figure 2. Total Out-of-School and In-School Enrollments by Grantee, June 2005
Note: Data was drawn from the monthly grantee reports.
Decision Inform
ation Resources, Inc.
6 Y
O G
rants—M
IS R
eport

Penetration Rates among OSY and ISY While Figures 1 and 2 suggest that, on average, the total number of youth participants is made up about equally of ISY and OSY, Figure 3 shows that the percentage of OSY participants rises over time. Although there is some modest fluctuation in this rate, especially in YO’s earlier years, the long-term trend shows the proportion of OSY rising from about 43 percent at the outset to 48 percent as of June 2005. As of the final period, there were 44,371 OSY and 47,892 ISY, yielding the total of 92,263. Figure 3. Trend in Percentage of OSY across All Grantees
50% 48% 46% 44% 42% 40%
Jun-01 Dec-01 Jun-02 Dec-02 Jun-03 Dec-03 Jun-04 Dec-04 Jun-05
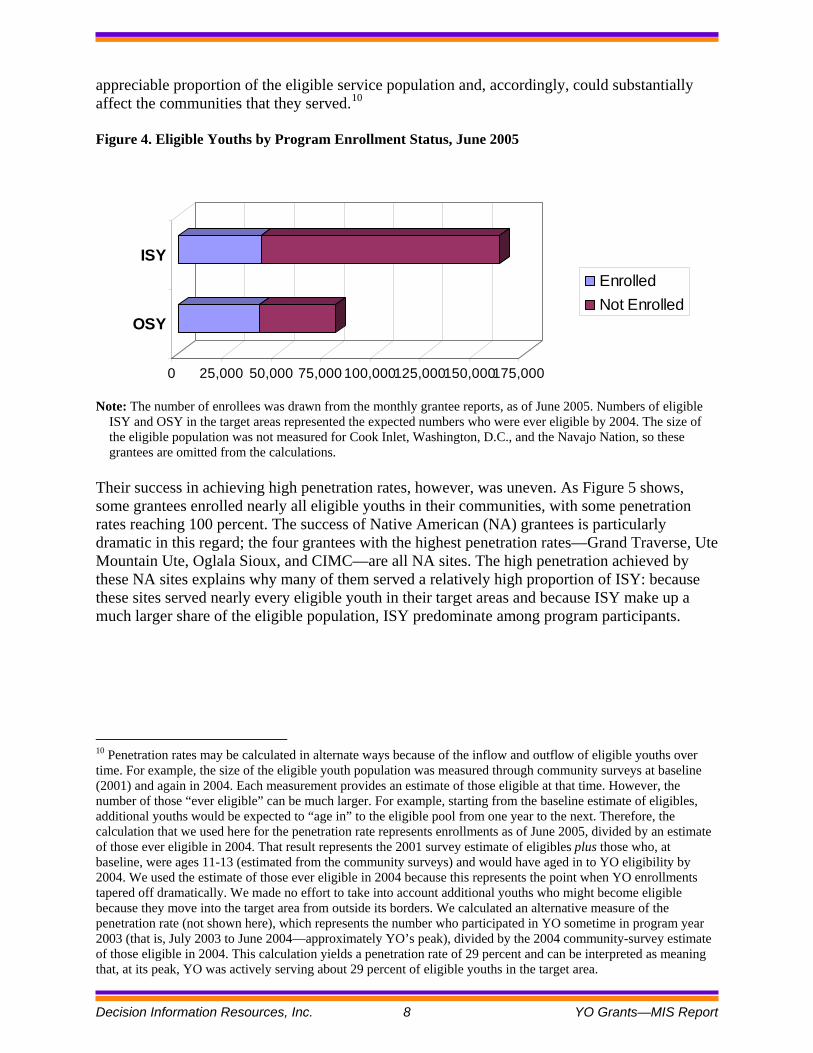
Note: Data was drawn from the monthly grantee reports. DOL’s program guidelines make clear that OSY should be considered the priority, however, and, as Figure 3 shows, OSY have consistently composed less than half of the total pool of participants.8 Still, grantees’ concerted efforts to enroll more OSY caused this percentage to rise at least modestly over time. More importantly, Figure 4 shows that, while nearly equal numbers of OSY and ISY were enrolled, the former represent a much larger share of the eligible youth population than the latter do. Specifically, OSY enrollees represent about 52 percent of all eligible OSY in the target area, while ISY enrollees represent about 26 percent of eligible ISY (note, though, that these estimates are imprecise because the size of the eligible population changes over time because of natural increase and the in-migration and out-migration of youths).9
The evidence thus suggests that grantees had substantial success in recruiting OSY, a group particularly difficult to enroll in workforce programs due to their lack of engagement with traditional community institutions. It also suggests that grantees were quite successful in achieving a high “penetration rate,” an official YO performance statistic representing the percentage of all eligible youths in the target area that the program succeeded in enrolling. The penetration rate of just less than 52 percent among OSY and 26 percent among ISY represents a blended rate of about 34 percent overall. Thus, YO grantees clearly succeeded in reaching an
8 The Solicitation for Grant Applications for the YO program states that the largest share of funds should be used to serve OSY. 9 Persons were eligible for YO if they were between the ages of 14 and 21 at enrollment and lived within the grantee’s designated service area. Numbers of eligible ISY and OSY in the target areas were estimated from community surveys administered by evaluation team members at baseline, shortly after YO grantees were first funded, and then adjusted to take into account additional youths who would be expected to “age-in” to the eligible age range by 2004. The denominator thus represents the number estimated to be “ever eligible” over the several years that YO was operating (though no adjustment is made for the potential in-migration—or out-migration—of youths into the target area over time).
Decision Information Resources, Inc. 7 YO Grants—MIS Report
Decision Information Resources, Inc. 8 YO Grants—MIS Report
appreciable proportion of the eligible service population and, accordingly, could substantially affect the communities that they served.10
Figure 4. Eligible Youths by Program Enrollment Status, June 2005
0 25,000 50,000 75,000 100,000125,000150,000175,000
OSY
ISYEnrolledNot Enrolled
Note: The number of enrollees was drawn from the monthly grantee reports, as of June 2005. Numbers of eligible
ISY and OSY in the target areas represented the expected numbers who were ever eligible by 2004. The size of the eligible population was not measured for Cook Inlet, Washington, D.C., and the Navajo Nation, so these grantees are omitted from the calculations.
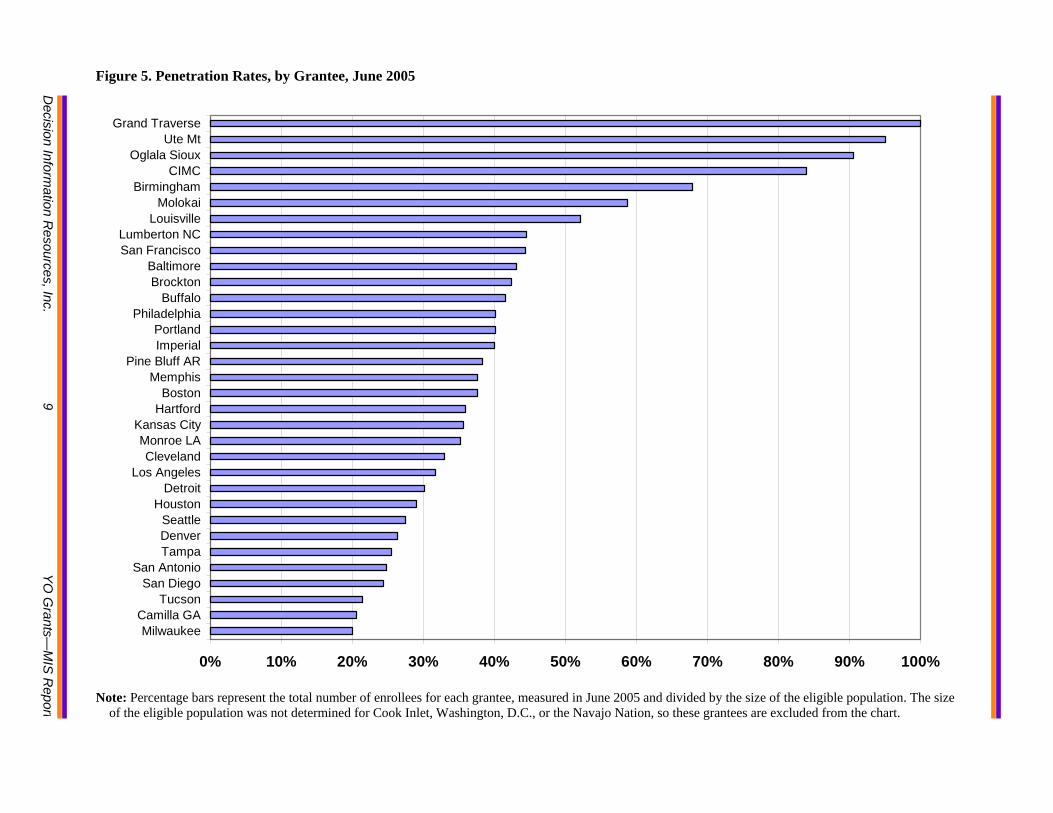
Their success in achieving high penetration rates, however, was uneven. As Figure 5 shows, some grantees enrolled nearly all eligible youths in their communities, with some penetration rates reaching 100 percent. The success of Native American (NA) grantees is particularly dramatic in this regard; the four grantees with the highest penetration rates—Grand Traverse, Ute Mountain Ute, Oglala Sioux, and CIMC—are all NA sites. The high penetration achieved by these NA sites explains why many of them served a relatively high proportion of ISY: because these sites served nearly every eligible youth in their target areas and because ISY make up a much larger share of the eligible population, ISY predominate among program participants.
10 Penetration rates may be calculated in alternate ways because of the inflow and outflow of eligible youths over time. For example, the size of the eligible youth population was measured through community surveys at baseline (2001) and again in 2004. Each measurement provides an estimate of those eligible at that time. However, the number of those “ever eligible” can be much larger. For example, starting from the baseline estimate of eligibles, additional youths would be expected to “age in” to the eligible pool from one year to the next. Therefore, the calculation that we used here for the penetration rate represents enrollments as of June 2005, divided by an estimate of those ever eligible in 2004. That result represents the 2001 survey estimate of eligibles plus those who, at baseline, were ages 11-13 (estimated from the community surveys) and would have aged in to YO eligibility by 2004. We used the estimate of those ever eligible in 2004 because this represents the point when YO enrollments tapered off dramatically. We made no effort to take into account additional youths who might become eligible because they move into the target area from outside its borders. We calculated an alternative measure of the penetration rate (not shown here), which represents the number who participated in YO sometime in program year 2003 (that is, July 2003 to June 2004—approximately YO’s peak), divided by the 2004 community-survey estimate of those eligible in 2004. This calculation yields a penetration rate of 29 percent and can be interpreted as meaning that, at its peak, YO was actively serving about 29 percent of eligible youths in the target area.
0% 10% 20% 30% 40% 50% 60% 70% 80% 90% 100%
MilwaukeeCamilla GA
TucsonSan Diego
San AntonioTampaDenverSeattle
HoustonDetroit
Los AngelesCleveland
Monroe LAKansas City
HartfordBoston
MemphisPine Bluff AR
ImperialPortland
PhiladelphiaBuffalo
BrocktonBaltimore
San FranciscoLumberton NC
LouisvilleMolokai
BirminghamCIMC
Oglala SiouxUte Mt
Grand Traverse
Note: Percentage bars represent the total number of enrollees for each grantee, measured in June 2005 and divided by the size of the eligible population. The size
of the eligible population was not determined for Cook Inlet, Washington, D.C., or the Navajo Nation, so these grantees are excluded from the chart.
Figure 5. Penetration Rates, by Grantee, June 2005
Decision Inform
ation Resources, Inc.
9 Y
O G
rants—M
IS R
eport
Decision Information Resources, Inc. 10 YO Grants—MIS Report
Grantees with exceptionally high penetration rates are anomalous, though. In keeping with the overall penetration rate of 34 percent, nearly two-thirds of the grantees enrolled between 25 percent and 45 percent of their eligibles. Meanwhile, at the low end, about 15 percent of grantees enrolled fewer than 25 percent of their eligible population.11 These differences are potentially important because the ability of YO grantees to change their communities might depend on the percentage of the eligible population that they served. Therefore, the variation in penetration rates shown in Figure 5 might imply comparable variations in YO’s impacts. One reason why some grantees might have recorded higher penetration rates than others is that their grant amounts were larger in relation to the size of their eligible population. Figure 6 shows that, indeed, some grantees had much higher total allotments per eligible youth than other grantees did (calculated as the size of each grantee’s YO grant over all five years divided by the estimated number of ever eligibles as of 2004). In fact, although the average allotment per eligible youth was about $3,300, and almost all grantees were clustered around this amount, a handful obtained allotments that were much more generous—for example, CIMC and Birmingham received more than $8,000 per eligible youth, and Ute Mountain and Grand Traverse received more than $20,000 per eligible. These four are also among the five grantees with the highest penetration rates (see Figure 5). In fact, the correlation between the allotment per eligible youth and the penetration rate is .81, suggesting that the allotment predicts the penetration rate quite well.12 The fact that some grantees had much more money than others per eligible youth suggests that, even at a high penetration rate, they could spend more per person on their enrollees than other grantees could. However, most other grantees—that is, those with closer-to-average allotments per eligible youth, had to make choices, as all administrators of job training programs do when given a fixed sum of money with which to operate. Specifically, they could enroll more eligible youths but spend less per person, or they could enroll fewer but spend more.13
Therefore, because of the differences in grantees’ allotment per eligible youth and the choices grantees made for use of their funds, we would expect allotments per enrollee to vary markedly across YO grantees. Figure 7 shows that this is the case. Although at the median, grantees received an allotment of about $10,000 per enrollee, some grantees could spend much more per person than others. At the highest level, some, such as Ute Mountain and Grand Traverse, received allotments of more than $20,000 per eligible youth (Figure 6), enrolled virtually everyone in their catchment area, had penetration rates of nearly 100 percent (Figure 5), and were therefore able to spend more than $20,000 per person on their enrollees (Figure 7).
11 These calculations use the estimated number of those ever eligible as of 2004. However, we emphasize that the calculations are necessarily imprecise and do not take into account the potential in-migration of youths into the target area. One grantee, in fact, recorded a penetration rate higher than 100 percent (which was rounded to 100). 12 Correlation coefficients range from –1.0, indicating perfect inverse correlation, to +1.0, indicating perfect positive correlation, with 0 indicating no relationship. Therefore, .81 indicates a very strong positive relationship between allotment and penetration rate. 13 We regressed the number of youths whom the grantee enrolled according to the grantee’s allotment and the number of eligible youths in the catchment area and used this model to compute the grantee’s expected number of enrollees. Some grantees enrolled substantially more youths than expected, while others enrolled substantially fewer than expected.
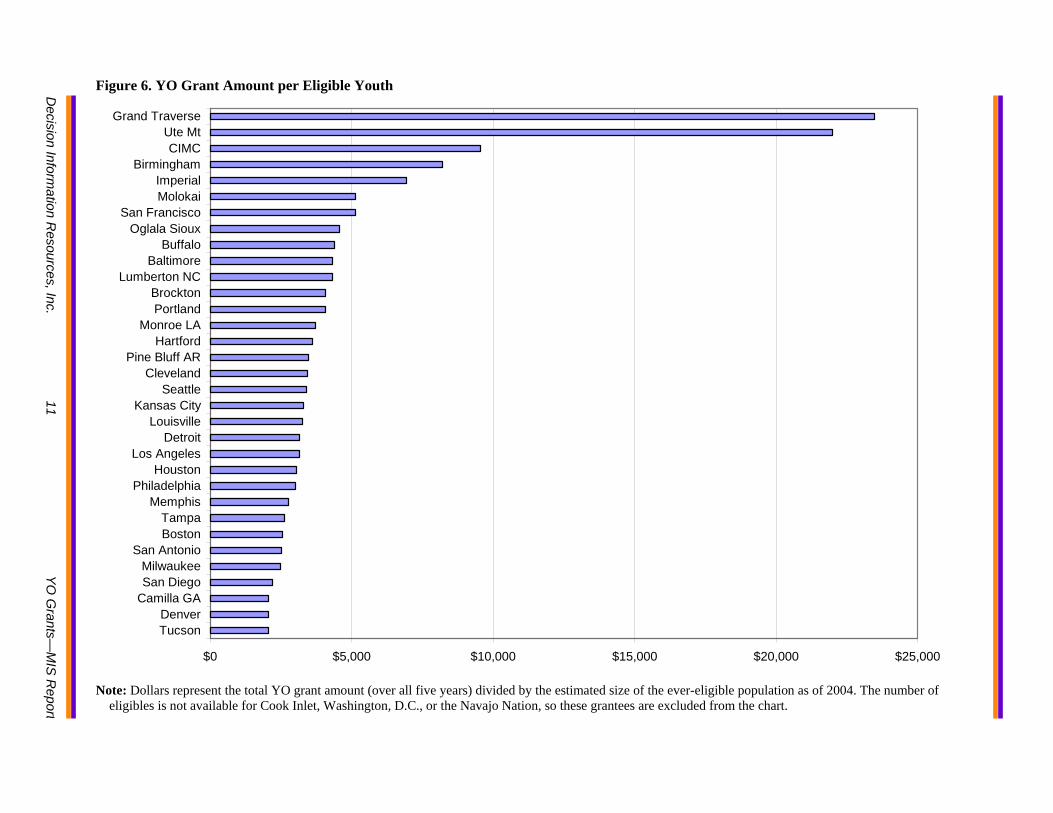
Figure 6. YO Grant Amount per Eligible Youth Decision Inform
ation Resources, Inc.
11 Y
O G
rants—M
IS R
epor
$0 $5,000 $10,000 $15,000 $20,000 $25,000
TucsonDenver
Camilla GASan DiegoMilwaukee
San AntonioBostonTampa
MemphisPhiladelphia
HoustonLos Angeles
DetroitLouisville
Kansas CitySeattle
ClevelandPine Bluff AR
HartfordMonroe LA
PortlandBrockton
Lumberton NCBaltimore
BuffaloOglala Sioux
San FranciscoMolokaiImperial
BirminghamCIMC
Ute MtGrand Traverse
Note: Dollars represent the total YO grant amount (over all five years) divided by the estimated size of the ever-eligible population as of 2004. The number of
eligibles is not available for Cook Inlet, Washington, D.C., or the Navajo Nation, so these grantees are excluded from the chart.
t
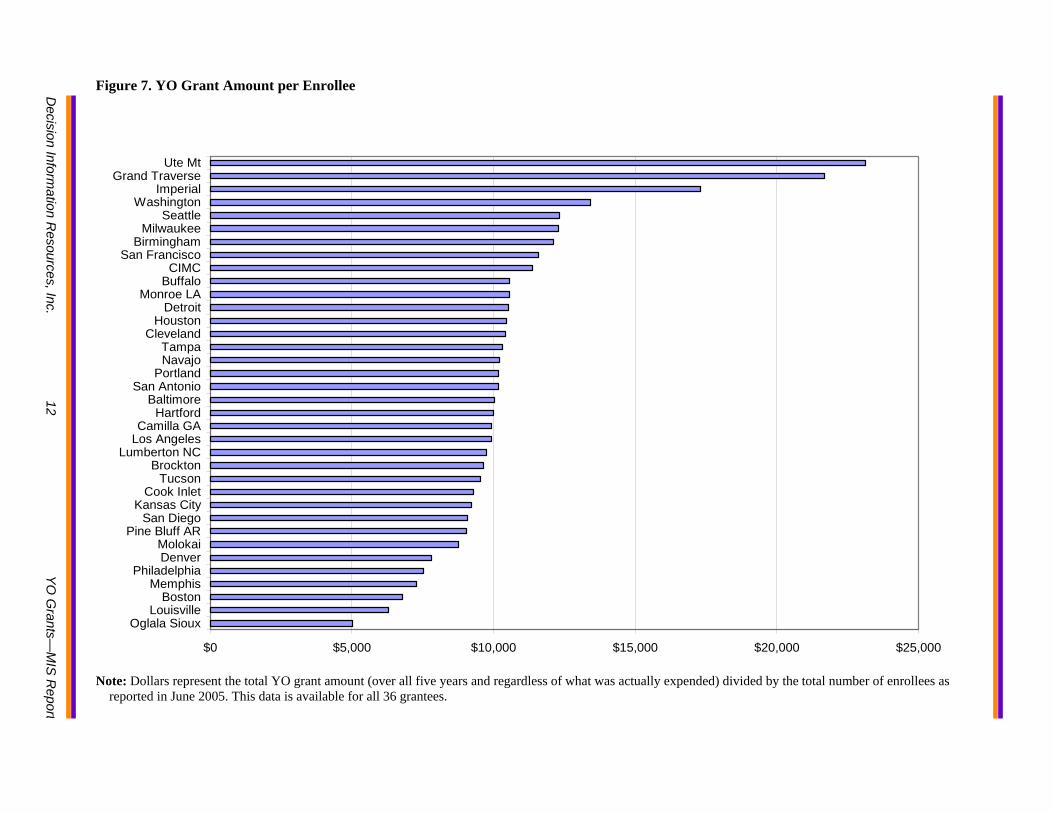
Exhibit 7: Expenditures per Enrollee
$0 $5,000 $10,000 $15,000 $20,000 $25,000
Oglala SiouxLouisville
BostonMemphis
PhiladelphiaDenverMolokai
Pine Bluff ARSan Diego
Kansas CityCook Inlet
TucsonBrockton
Lumberton NCLos AngelesCamilla GA
HartfordBaltimore
San AntonioPortland
NavajoTampa
ClevelandHouston
DetroitMonroe LA
BuffaloCIMC
San FranciscoBirmingham
MilwaukeeSeattle
WashingtonImperial
Grand TraverseUte Mt
Note: Dollars represent the total YO grant amount (over all five years and regardless of what was actually expended) divided by the total number of enrollees as
reported in June 2005. This data is available for all 36 grantees.
Figure 7. YO Grant Amount per Enrollee
Decision Inform
ation Resources, Inc.
12 Y
O G
rants—M
IS R
eport
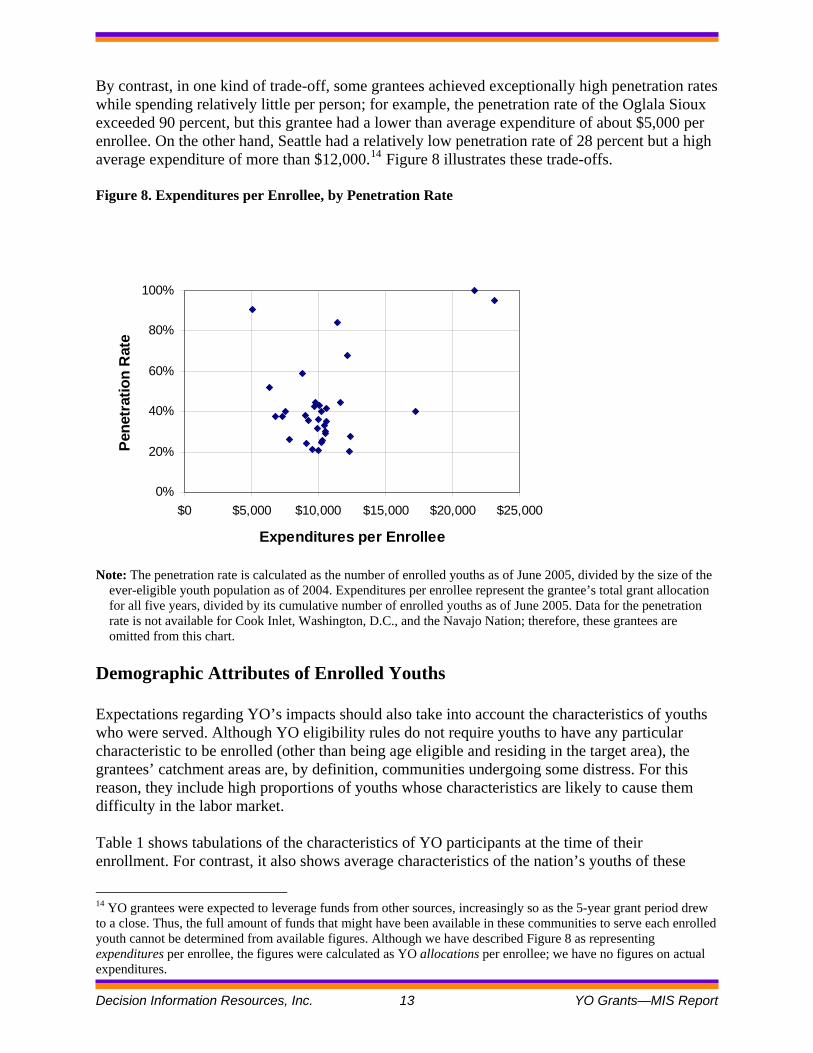
By contrast, in one kind of trade-off, some grantees achieved exceptionally high penetration rates while spending relatively little per person; for example, the penetration rate of the Oglala Sioux exceeded 90 percent, but this grantee had a lower than average expenditure of about $5,000 per enrollee. On the other hand, Seattle had a relatively low penetration rate of 28 percent but a high average expenditure of more than $12,000.14 Figure 8 illustrates these trade-offs. Figure 8. Expenditures per Enrollee, by Penetration Rate
Exhibit 8: Scatterplot of Expenditure per Enrollee by Penetration Rate
0%
20%
40%
60%
80%
100%
$0 $5,000 $10,000 $15,000 $20,000 $25,000
Expenditures per Enrollee
Pene
trat
ion
Rat
e
Note: The penetration rate is calculated as the number of enrolled youths as of June 2005, divided by the size of the
ever-eligible youth population as of 2004. Expenditures per enrollee represent the grantee’s total grant allocation for all five years, divided by its cumulative number of enrolled youths as of June 2005. Data for the penetration rate is not available for Cook Inlet, Washington, D.C., and the Navajo Nation; therefore, these grantees are omitted from this chart.
Demographic Attributes of Enrolled Youths Expectations regarding YO’s impacts should also take into account the characteristics of youths who were served. Although YO eligibility rules do not require youths to have any particular characteristic to be enrolled (other than being age eligible and residing in the target area), the grantees’ catchment areas are, by definition, communities undergoing some distress. For this reason, they include high proportions of youths whose characteristics are likely to cause them difficulty in the labor market. Table 1 shows tabulations of the characteristics of YO participants at the time of their enrollment. For contrast, it also shows average characteristics of the nation’s youths of these
14 YO grantees were expected to leverage funds from other sources, increasingly so as the 5-year grant period drew to a close. Thus, the full amount of funds that might have been available in these communities to serve each enrolled youth cannot be determined from available figures. Although we have described Figure 8 as representing expenditures per enrollee, the figures were calculated as YO allocations per enrollee; we have no figures on actual expenditures.
Decision Information Resources, Inc. 13 YO Grants—MIS Report
ages, the characteristics of youths served by WIA formula-funded youth programs, and the characteristics of eligible youths in the YO catchment areas.15
Note that YO participants, including ISY and OSY, are nearly evenly balanced by gender, although females outnumber males slightly. Accordingly, YO has done about as well as WIA formula-funded youth programs in reaching males, who, despite their preponderance in the population of this age group, are often hard to recruit into youth programs. Compared to both the national and target area distributions, YO programs are somewhat less likely to have enrolled older youths. However, YO is more successful in enrolling older youths than the formula-funded WIA youth programs. The distribution of youths by race and ethnicity reveals that virtually all YO participants are persons of color. Only about 5 percent of YO participants overall are non-Hispanic whites, while 30 percent of WIA formula-funded youths are non-Hispanic whites, and the national average is much larger at 64 percent. In particular, YO youths are disproportionately (compared to the national average) Latino, American Indian, and African American.16 These figures reveal the nature of the targeted communities where YO was funded and suggest barriers that participants are likely to face in achieving labor market success. Table 1 shows the distribution of youths according to their educational status and highest educational attainment.17 Note that YO youths are slightly more likely to be attending school than not, with 54 percent attending at the time of enrollment and 46 not attending. By contrast, WIA formula-funded programs serve a much higher proportion of youths (70 percent) who are attending school at the time of enrollment. Clearly, then, YO grantees have taken seriously their mandate to serve OSY and have done a better job of reaching this hard-to-serve subpopulation than WIA local workforce areas have. There is a strong relationship between the OSY/ISY distinction and youths’ enrollment status. All ISY are attending school, but relatively few OSY are.18 Among YO youths who are attending school, almost all are attending high school rather than postsecondary school (89 percent versus 11 percent). Thus, it is not surprising, as was discussed in this evaluation’s final process report, that school districts were among the YO grantees’ most frequent partners. Table 1 also shows that, among OSY, two-thirds were high-school dropouts and lacked a GED, a higher proportion than for the YO target area.
15 The average characteristics of youths nationally were tabulated from the 2000 Census; race and ethnicity were calculated on the basis of youths ages 15 to 21 because this was the breakout provided by Census Factfinder. Characteristics of youths in WIA formula-funded programs were taken from the PY 03 WIASRD Data Book. The characteristics of eligible youths in target areas were taken from surveys administered by the evaluation team of the grantees’ catchment areas, excluding those in Washington, D.C., and the Navajo Nation. 16 In Table 1, the category listed as American Indian includes Alaskan Natives; the Hawaiian/PI category includes Hawaiian Natives and other Pacific Islanders. Although the YO MIS allows individuals to be identified as belonging to more than one racial group, no one was so designated. 17 Educational and school status is not readily available for these age ranges for youths in the U.S. as a whole. 18 Although it seems counterintuitive, the official distinction in YO between ISY and OSY causes individuals who are attending postsecondary school and are deficient in basic skills to be classified as OSY. This explains the seeming anomaly of having OSY shown here as attending school at the time of enrollment.
Decision Information Resources, Inc. 14 YO Grants—MIS Report
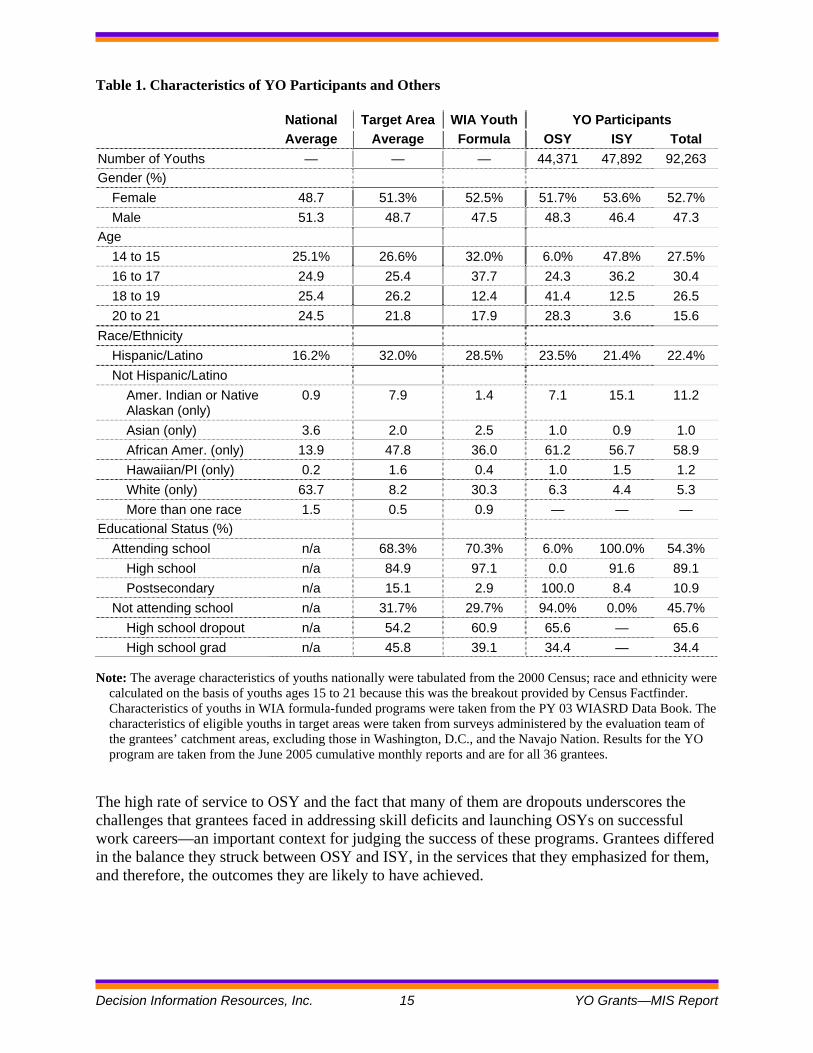
Table 1. Characteristics of YO Participants and Others
National Target Area WIA Youth YO Participants Average Average Formula OSY ISY Total
Number of Youths — — — 44,371 47,892 92,263 Gender (%)
Female 48.7 51.3% 52.5% 51.7% 53.6% 52.7% Male 51.3 48.7 47.5 48.3 46.4 47.3
Age 14 to 15 25.1% 26.6% 32.0% 6.0% 47.8% 27.5% 16 to 17 24.9 25.4 37.7 24.3 36.2 30.4 18 to 19 25.4 26.2 12.4 41.4 12.5 26.5 20 to 21 24.5 21.8 17.9 28.3 3.6 15.6
Race/Ethnicity Hispanic/Latino 16.2% 32.0% 28.5% 23.5% 21.4% 22.4% Not Hispanic/Latino
Amer. Indian or Native Alaskan (only)
0.9 7.9 1.4 7.1 15.1 11.2
Asian (only) 3.6 2.0 2.5 1.0 0.9 1.0 African Amer. (only) 13.9 47.8 36.0 61.2 56.7 58.9 Hawaiian/PI (only) 0.2 1.6 0.4 1.0 1.5 1.2 White (only) 63.7 8.2 30.3 6.3 4.4 5.3 More than one race 1.5 0.5 0.9 — — —
Educational Status (%) Attending school n/a 68.3% 70.3% 6.0% 100.0% 54.3%
High school n/a 84.9 97.1 0.0 91.6 89.1 Postsecondary n/a 15.1 2.9 100.0 8.4 10.9
Not attending school n/a 31.7% 29.7% 94.0% 0.0% 45.7% High school dropout n/a 54.2 60.9 65.6 — 65.6 High school grad n/a 45.8 39.1 34.4 — 34.4
Note: The average characteristics of youths nationally were tabulated from the 2000 Census; race and ethnicity were
calculated on the basis of youths ages 15 to 21 because this was the breakout provided by Census Factfinder. Characteristics of youths in WIA formula-funded programs were taken from the PY 03 WIASRD Data Book. The characteristics of eligible youths in target areas were taken from surveys administered by the evaluation team of the grantees’ catchment areas, excluding those in Washington, D.C., and the Navajo Nation. Results for the YO program are taken from the June 2005 cumulative monthly reports and are for all 36 grantees.
The high rate of service to OSY and the fact that many of them are dropouts underscores the challenges that grantees faced in addressing skill deficits and launching OSYs on successful work careers—an important context for judging the success of these programs. Grantees differed in the balance they struck between OSY and ISY, in the services that they emphasized for them, and therefore, the outcomes they are likely to have achieved.
Decision Information Resources, Inc. 15 YO Grants—MIS Report
Chapter 3. About Participation Grantees can use the MIS to record instances of participation for each youth in any of 15 categories of youth-development activities, which are defined formally in Appendix B. In this chapter, we describe the prevalence and patterns of participation in each of these activities and the intensity and duration of participation. We note that youths could have participated in YO services in ways not captured by these 15 items. For example, meeting with a case manager—receiving assessments, guidance, or encouragement—is not a measurable service, nor is time spent “hanging out” at YO Centers, despite the fact that both these things are important features of the YO design and are critical elements of comprehensive services. Thus, when we refer to instances of participation or the services youths receive, we mean one of the 15 youth-development services captured by the MIS. Services That Youths Access The evaluation’s companion report, Youth Opportunity Demonstration Grants: Process Evaluation Final Report, focused on a subset of 25 grantees and provided information about services that they provided. It suggested that grantees provided job-readiness training, life-skills training, short-term subsidized or unsubsidized job placements, and remediation or GED preparation as core activities. Figure 9 suggests that these same activities are emphasized by all 36 YO grantees.19 Thus, job-readiness training and life-skills training are the most common activities in which youths participate, with about 45 percent of enrollees participating in each of these for at least one month. Nearly as common, at least for in-school youths, are sports and recreational activities. Subsidized or short-term unsubsidized employment follow in prevalence (with a participation rate of about 30 percent overall), followed by support groups (27 percent), community service (26 percent), remediation (24 percent), mentoring (21 percent), and short-term occupational skills training (21 percent). At the other extreme, very few youths (only about 5 percent) participated in alumni groups. That low level of participation can be attributed to the fact that youths who were placed tended not to have the time or interest in continuing that type of engagement with the YO programs, and some moved away from the target area, making their further participation infeasible. Many of the activities that were common among ISY were also common among OSY, with each group showing about equal rates of participation. For example, both groups participated in job-readiness training and life-skills training at similar rates. Although they were much less prevalent overall, support groups, mentoring, and short-term occupational-skills training were also about equally common among ISY and OSY; these activities show a difference in participation rates between the two groups of less than five percentage points, with an overall participation rate of at least 20 percent. On the other hand, other activities appeared to be clearly targeted to one of these groups but not the other. Thus, short-term unsubsidized employment was more commonly used for OSY, while internships and subsidized employment were more commonly used for ISY. Presumably, the 19 Appendix B shows that most activities have a threshold number of hours during which a youth must participate in a given month before it counts as an instance of participation.
Decision Information Resources, Inc. 16 YO Grants—MIS Report
Decision Information Resources, Inc. 17 YO Grants—MIS Report
latter activities appealed strongly to ISY, who used subsidized employment to earn spending money and gain work experience during the summers or part-time during the school year. By contrast, OSY used short-term unsubsidized jobs to support themselves while they were participating in other services or as a way of building their work skills in a practical setting. Also showing considerable disparity in participation rates, GED preparation was much more likely to be used by OSY, while remediation, tutoring, and college preparation were used more often by ISY. The latter activity was not often provided to OSY, demonstrating again that the OSY programs typically served high-school dropouts (see Table 1), for whom college participation was not on the horizon. Finally, sports and recreation and, as one would expect, secondary-school extracurricular activities targeted ISY more and OSY less.
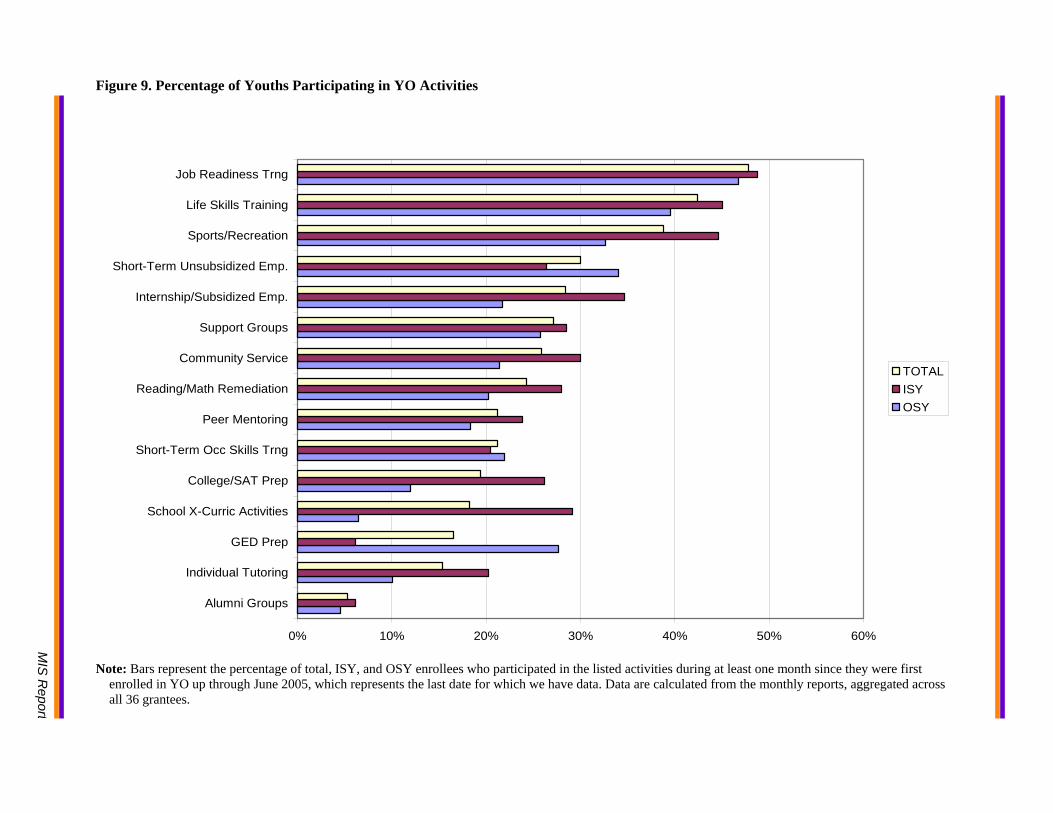
Exhibit 10: Percentage of Youth Participating in Various Activities
0% 10% 20% 30% 40% 50% 60%
Alumni Groups
Individual Tutoring
GED Prep
School X-Curric Activities
College/SAT Prep
Short-Term Occ Skills Trng
Peer Mentoring
Reading/Math Remediation
Community Service
Support Groups
Internship/Subsidized Emp.
Short-Term Unsubsidized Emp.
Sports/Recreation
Life Skills Training
Job Readiness Trng
TOTALISYOSY
Note: Bars represent the percentage of total, ISY, and OSY enrollees who participated in the listed activities during at least one month since they were first enrolled in YO up through June 2005, which represents the last date for which we have data. Data are calculated from the monthly reports, aggregated across all 36 grantees.
Figure 9. Percentage of Youths Participating in YO Activities
Decision Inform
ation Resources, Inc.
18 Y
O G
rants—M
IS R
eport
Characterizing Participation The YO vision is that many youths should participate in an array of services over an extended period of time to improve their employment prospects and develop their potential as members of their communities. In keeping with that vision, their participation in YO should represent a long-term and intensive engagement. While Figure 9 shows the prevalence of youth participation in various activities, it does not fully reflect the extent to which this vision was realized. To get a clearer picture of that realization, we can look at the patterns of activities in which youths participate and over what period of time they do so. To begin, we can simply count the average number (instances) of separate youth-development activities in which youths have participated. As shown in the top panel of Table 2, the average youth participated in 3.8 separate activities, with ISY somewhat above this figure on average and OSY somewhat below. Table 2 also shows that about 87 percent of ISY and OSY participated in at least one youth-development activity. Together, these numbers suggest that a small number of youths—about 13 percent—were enrolled but did not participate in a single one of these 15 activities. However, the vast majority of youths did participate and, on average, each youth participated in nearly four separate activities. It appears, then, that most youths were engaged in YO in multiple ways. Tabulating instances of participation does not fully assess the scope and intensity of youths’ involvement with the YO program, for two reasons. First, some activities overlap in type of service. For example, remediation, GED preparation, and tutoring are among the 15 youth-development services in which a participant could have been engaged. A youth who participates in all these things but nothing more has been engaged in three separate activities but has not been exposed to the broad range of youth-development activities that the YO model envisions. Second, a youth might have participated in some activities for only a very short time. Some activities by their nature—such as job-readiness training—are unlikely to last more than a couple of weeks. So noting the number of activities in which youths participated does not indicate the intensity or duration of their participation. To remedy the overlap in type of service, we separated the activities into three categories, corresponding (approximately) to the framework for youth-development services outlined for WIA youth programs in Training and Employment Guidance Letter (TEGL) 3-99: • Improve educational achievement (SAT preparation, GED preparation, individual tutoring,
and reading or math remediation).
• Prepare youths for succeeding in employment (internship or subsidized employment, job-readiness training, short-term occupational-skills training, and short-term unsubsidized employment).
• Support youths and develop their full potential (alumni groups, community-service activities, life-skills training, peer-to-peer mentoring, secondary-school extracurricular activities, sports and recreational activities, and support groups).20
20 TEGL 3-99 breaks out supporting youth and developing their full potential into two separate categories.
Decision Information Resources, Inc. 19 YO Grants—MIS Report
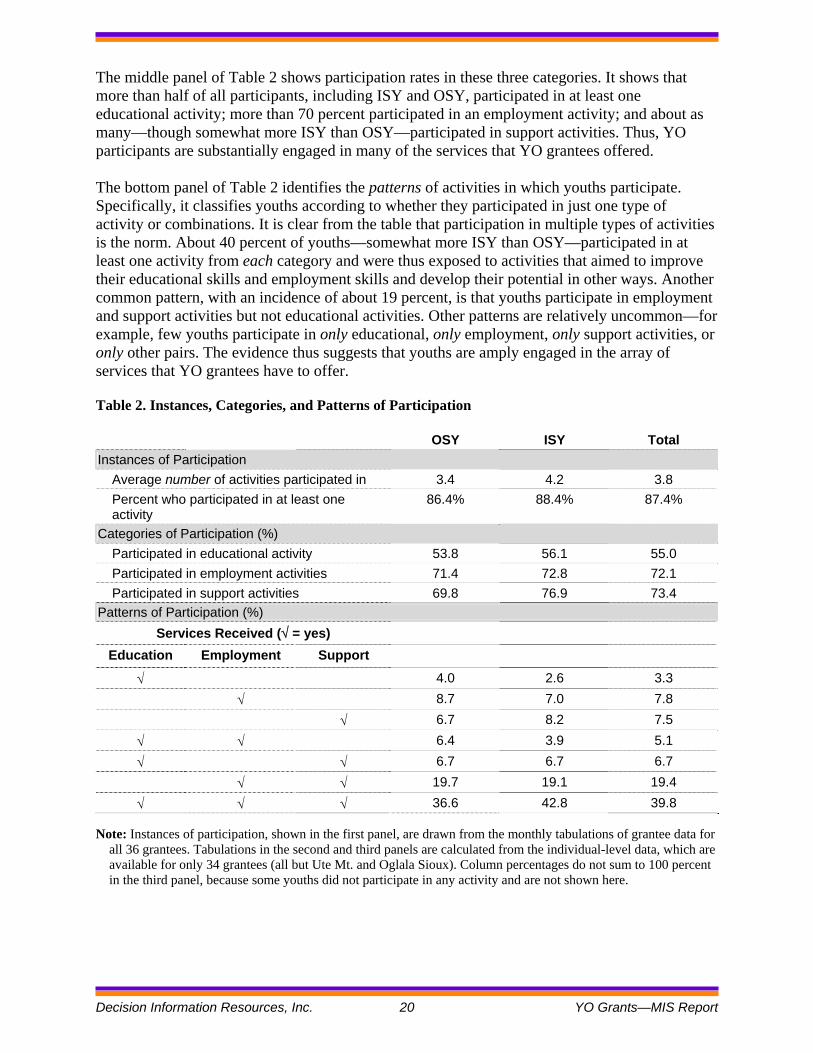
The middle panel of Table 2 shows participation rates in these three categories. It shows that more than half of all participants, including ISY and OSY, participated in at least one educational activity; more than 70 percent participated in an employment activity; and about as many—though somewhat more ISY than OSY—participated in support activities. Thus, YO participants are substantially engaged in many of the services that YO grantees offered. The bottom panel of Table 2 identifies the patterns of activities in which youths participate. Specifically, it classifies youths according to whether they participated in just one type of activity or combinations. It is clear from the table that participation in multiple types of activities is the norm. About 40 percent of youths—somewhat more ISY than OSY—participated in at least one activity from each category and were thus exposed to activities that aimed to improve their educational skills and employment skills and develop their potential in other ways. Another common pattern, with an incidence of about 19 percent, is that youths participate in employment and support activities but not educational activities. Other patterns are relatively uncommon—for example, few youths participate in only educational, only employment, only support activities, or only other pairs. The evidence thus suggests that youths are amply engaged in the array of services that YO grantees have to offer. Table 2. Instances, Categories, and Patterns of Participation
OSY ISY Total Instances of Participation
Average number of activities participated in 3.4 4.2 3.8 Percent who participated in at least one activity
86.4% 88.4% 87.4%
Categories of Participation (%) Participated in educational activity 53.8 56.1 55.0 Participated in employment activities 71.4 72.8 72.1 Participated in support activities 69.8 76.9 73.4
Patterns of Participation (%) Services Received (√ = yes)
Education Employment Support √ 4.0 2.6 3.3 √ 8.7 7.0 7.8 √ 6.7 8.2 7.5 √ √ 6.4 3.9 5.1 √ √ 6.7 6.7 6.7 √ √ 19.7 19.1 19.4 √ √ √ 36.6 42.8 39.8
Note: Instances of participation, shown in the first panel, are drawn from the monthly tabulations of grantee data for
all 36 grantees. Tabulations in the second and third panels are calculated from the individual-level data, which are available for only 34 grantees (all but Ute Mt. and Oglala Sioux). Column percentages do not sum to 100 percent in the third panel, because some youths did not participate in any activity and are not shown here.
Decision Information Resources, Inc. 20 YO Grants—MIS Report
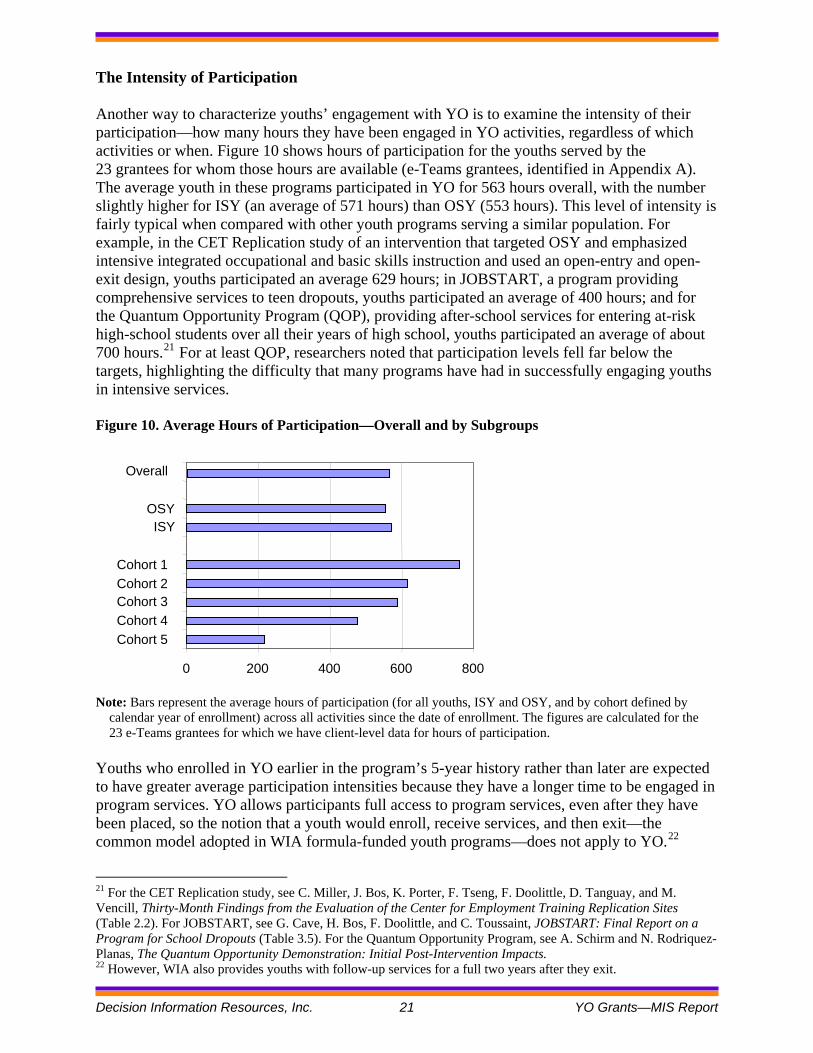
The Intensity of Participation Another way to characterize youths’ engagement with YO is to examine the intensity of their participation—how many hours they have been engaged in YO activities, regardless of which activities or when. Figure 10 shows hours of participation for the youths served by the 23 grantees for whom those hours are available (e-Teams grantees, identified in Appendix A). The average youth in these programs participated in YO for 563 hours overall, with the number slightly higher for ISY (an average of 571 hours) than OSY (553 hours). This level of intensity is fairly typical when compared with other youth programs serving a similar population. For example, in the CET Replication study of an intervention that targeted OSY and emphasized intensive integrated occupational and basic skills instruction and used an open-entry and open-exit design, youths participated an average 629 hours; in JOBSTART, a program providing comprehensive services to teen dropouts, youths participated an average of 400 hours; and for the Quantum Opportunity Program (QOP), providing after-school services for entering at-risk high-school students over all their years of high school, youths participated an average of about 700 hours.21 For at least QOP, researchers noted that participation levels fell far below the targets, highlighting the difficulty that many programs have had in successfully engaging youths in intensive services. Figure 10. Average Hours of Participation—Overall and by Subgroups
0 200 400 600 800
Cohort 5 Cohort 4 Cohort 3 Cohort 2 Cohort 1
ISY OSY
Overall
Note: Bars represent the average hours of participation (for all youths, ISY and OSY, and by cohort defined by
calendar year of enrollment) across all activities since the date of enrollment. The figures are calculated for the 23 e-Teams grantees for which we have client-level data for hours of participation.
Youths who enrolled in YO earlier in the program’s 5-year history rather than later are expected to have greater average participation intensities because they have a longer time to be engaged in program services. YO allows participants full access to program services, even after they have been placed, so the notion that a youth would enroll, receive services, and then exit—the common model adopted in WIA formula-funded youth programs—does not apply to YO.22
21 For the CET Replication study, see C. Miller, J. Bos, K. Porter, F. Tseng, F. Doolittle, D. Tanguay, and M. Vencill, Thirty-Month Findings from the Evaluation of the Center for Employment Training Replication Sites (Table 2.2). For JOBSTART, see G. Cave, H. Bos, F. Doolittle, and C. Toussaint, JOBSTART: Final Report on a Program for School Dropouts (Table 3.5). For the Quantum Opportunity Program, see A. Schirm and N. Rodriquez-Planas, The Quantum Opportunity Demonstration: Initial Post-Intervention Impacts. 22 However, WIA also provides youths with follow-up services for a full two years after they exit.
Decision Information Resources, Inc. 21 YO Grants—MIS Report
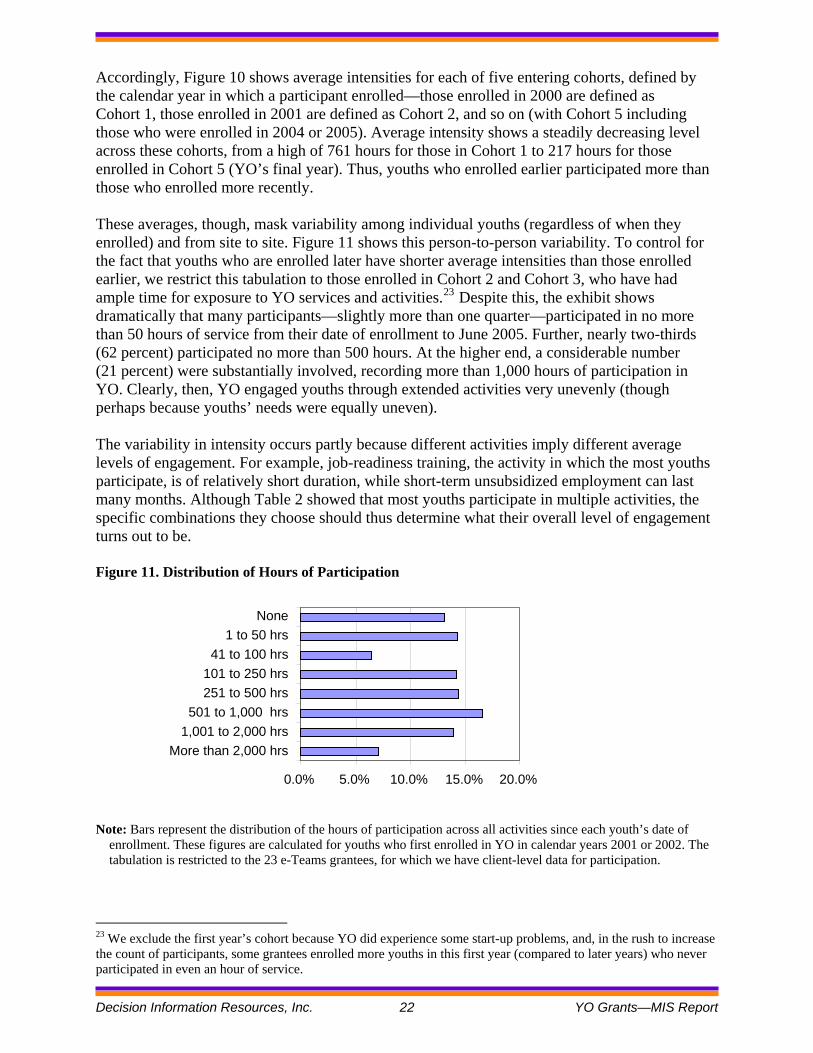
Accordingly, Figure 10 shows average intensities for each of five entering cohorts, defined by the calendar year in which a participant enrolled—those enrolled in 2000 are defined as Cohort 1, those enrolled in 2001 are defined as Cohort 2, and so on (with Cohort 5 including those who were enrolled in 2004 or 2005). Average intensity shows a steadily decreasing level across these cohorts, from a high of 761 hours for those in Cohort 1 to 217 hours for those enrolled in Cohort 5 (YO’s final year). Thus, youths who enrolled earlier participated more than those who enrolled more recently. These averages, though, mask variability among individual youths (regardless of when they enrolled) and from site to site. Figure 11 shows this person-to-person variability. To control for the fact that youths who are enrolled later have shorter average intensities than those enrolled earlier, we restrict this tabulation to those enrolled in Cohort 2 and Cohort 3, who have had ample time for exposure to YO services and activities.23 Despite this, the exhibit shows dramatically that many participants—slightly more than one quarter—participated in no more than 50 hours of service from their date of enrollment to June 2005. Further, nearly two-thirds (62 percent) participated no more than 500 hours. At the higher end, a considerable number (21 percent) were substantially involved, recording more than 1,000 hours of participation in YO. Clearly, then, YO engaged youths through extended activities very unevenly (though perhaps because youths’ needs were equally uneven). The variability in intensity occurs partly because different activities imply different average levels of engagement. For example, job-readiness training, the activity in which the most youths participate, is of relatively short duration, while short-term unsubsidized employment can last many months. Although Table 2 showed that most youths participate in multiple activities, the specific combinations they choose should thus determine what their overall level of engagement turns out to be. Figure 11. Distribution of Hours of Participation
0.0% 5.0% 10.0% 15.0% 20.0%
None1 to 50 hrs
41 to 100 hrs101 to 250 hrs251 to 500 hrs
501 to 1,000 hrs1,001 to 2,000 hrs
More than 2,000 hrs
Note: Bars represent the distribution of the hours of participation across all activities since each youth’s date of
enrollment. These figures are calculated for youths who first enrolled in YO in calendar years 2001 or 2002. The tabulation is restricted to the 23 e-Teams grantees, for which we have client-level data for participation.
23 We exclude the first year’s cohort because YO did experience some start-up problems, and, in the rush to increase the count of participants, some grantees enrolled more youths in this first year (compared to later years) who never participated in even an hour of service.
Decision Information Resources, Inc. 22 YO Grants—MIS Report
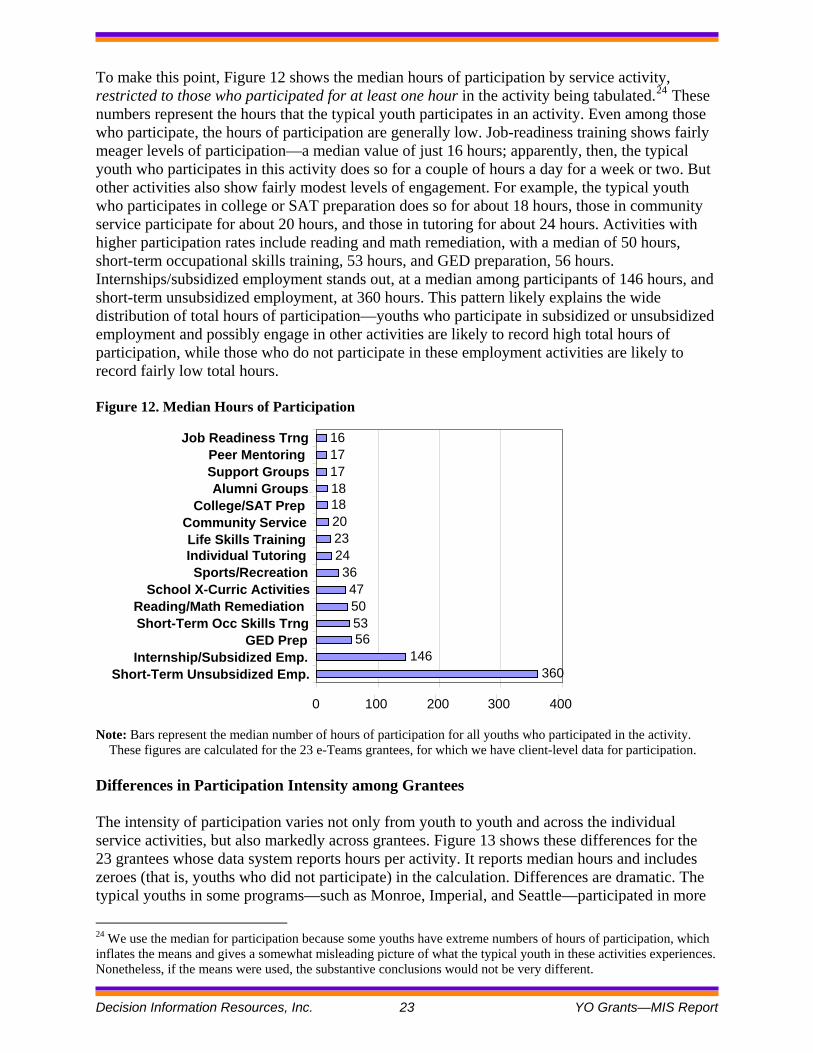
To make this point, Figure 12 shows the median hours of participation by service activity, restricted to those who participated for at least one hour in the activity being tabulated.24 These numbers represent the hours that the typical youth participates in an activity. Even among those who participate, the hours of participation are generally low. Job-readiness training shows fairly meager levels of participation—a median value of just 16 hours; apparently, then, the typical youth who participates in this activity does so for a couple of hours a day for a week or two. But other activities also show fairly modest levels of engagement. For example, the typical youth who participates in college or SAT preparation does so for about 18 hours, those in community service participate for about 20 hours, and those in tutoring for about 24 hours. Activities with higher participation rates include reading and math remediation, with a median of 50 hours, short-term occupational skills training, 53 hours, and GED preparation, 56 hours. Internships/subsidized employment stands out, at a median among participants of 146 hours, and short-term unsubsidized employment, at 360 hours. This pattern likely explains the wide distribution of total hours of participation—youths who participate in subsidized or unsubsidized employment and possibly engage in other activities are likely to record high total hours of participation, while those who do not participate in these employment activities are likely to record fairly low total hours. Figure 12. Median Hours of Participation
360146
56535047
362423201818171716
0 100 200 300 400
Short-Term Unsubsidized Emp. Internship/Subsidized Emp.
GED PrepShort-Term Occ Skills TrngReading/Math Remediation
School X-Curric ActivitiesSports/Recreation
Individual TutoringLife Skills Training
Community ServiceCollege/SAT Prep
Alumni GroupsSupport Groups Peer Mentoring
Job Readiness Trng
Note: Bars represent the median number of hours of participation for all youths who participated in the activity.
These figures are calculated for the 23 e-Teams grantees, for which we have client-level data for participation. Differences in Participation Intensity among Grantees The intensity of participation varies not only from youth to youth and across the individual service activities, but also markedly across grantees. Figure 13 shows these differences for the 23 grantees whose data system reports hours per activity. It reports median hours and includes zeroes (that is, youths who did not participate) in the calculation. Differences are dramatic. The typical youths in some programs—such as Monroe, Imperial, and Seattle—participated in more
24 We use the median for participation because some youths have extreme numbers of hours of participation, which inflates the means and gives a somewhat misleading picture of what the typical youth in these activities experiences. Nonetheless, if the means were used, the substantive conclusions would not be very different.
Decision Information Resources, Inc. 23 YO Grants—MIS Report
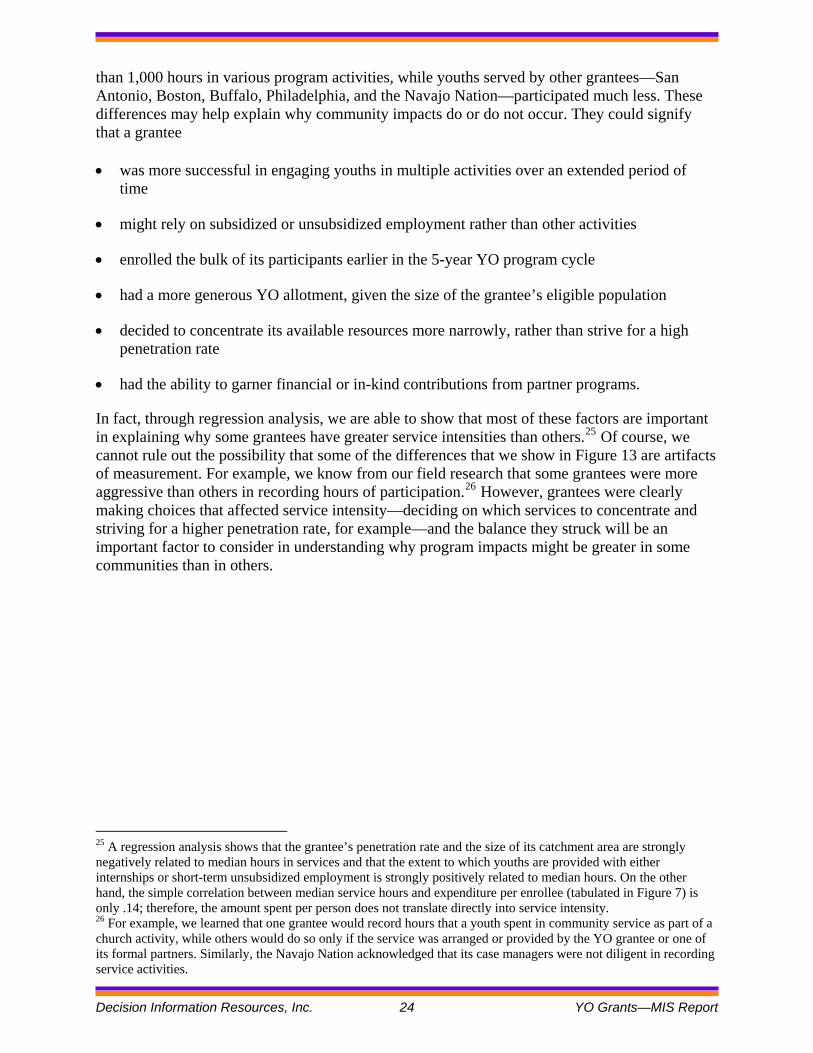
Decision Information Resources, Inc. 24 YO Grants—MIS Report
than 1,000 hours in various program activities, while youths served by other grantees—San Antonio, Boston, Buffalo, Philadelphia, and the Navajo Nation—participated much less. These differences may help explain why community impacts do or do not occur. They could signify that a grantee • was more successful in engaging youths in multiple activities over an extended period of
time
• might rely on subsidized or unsubsidized employment rather than other activities
• enrolled the bulk of its participants earlier in the 5-year YO program cycle
• had a more generous YO allotment, given the size of the grantee’s eligible population
• decided to concentrate its available resources more narrowly, rather than strive for a high penetration rate
• had the ability to garner financial or in-kind contributions from partner programs.
In fact, through regression analysis, we are able to show that most of these factors are important in explaining why some grantees have greater service intensities than others.25 Of course, we cannot rule out the possibility that some of the differences that we show in Figure 13 are artifacts of measurement. For example, we know from our field research that some grantees were more aggressive than others in recording hours of participation.26 However, grantees were clearly making choices that affected service intensity—deciding on which services to concentrate and striving for a higher penetration rate, for example—and the balance they struck will be an important factor to consider in understanding why program impacts might be greater in some communities than in others.
25 A regression analysis shows that the grantee’s penetration rate and the size of its catchment area are strongly negatively related to median hours in services and that the extent to which youths are provided with either internships or short-term unsubsidized employment is strongly positively related to median hours. On the other hand, the simple correlation between median service hours and expenditure per enrollee (tabulated in Figure 7) is only .14; therefore, the amount spent per person does not translate directly into service intensity. 26 For example, we learned that one grantee would record hours that a youth spent in community service as part of a church activity, while others would do so only if the service was arranged or provided by the YO grantee or one of its formal partners. Similarly, the Navajo Nation acknowledged that its case managers were not diligent in recording service activities.
Exhibit 15: Median Hours of Participation, by Grantee
0 200 400 600 800 1,000 1,200
NavajoPhiladelphia
BuffaloBoston
San AntonioGrand Traverse
CIMCSan Diego
WashingtonMemphis
Camilla GACook Inlet
BirminghamHoustonMolokai
Kansas CityTucson
Pine Bluff ARTampa
Lumberton NCSeattle
ImperialMonroe LA
Decision Inform
ation Resources, Inc.
25 Y
O G
rants—M
IS R
eport
Figure 13. Median Hours of Participation, by Grantee
Note: Bars represent the median number of hours of participation for all youths, including those with zero hours of participation. These numbers are calculated
for the 23 e-Teams grantees, for which we have client-level data that records hours of participation.
Chapter 4. Understanding Outcomes By concentrating resources and services in a circumscribed geographic area, YO intends to impact not only the youths who participate but communities as a whole. The verdict as to whether YO did generate such impacts must wait for the results of analyses to be described in the synthesis report. The researchers are using a quasi-experimental design that compares youths’ achievements in YO communities to those in a statistically matched sample of non-YO communities. In the present report, however, we can describe the extent to which the YO program achieved placements or other positive outcomes for the youths they served. As measured by the YO MIS, outcomes are defined as long-term placements and can be recorded in one of the following ways:27
• The youth obtains a long-term unsubsidized job placement. • The youth enters a long-term educational placement, such as:
A senior or junior high school An alternative high school A community college or junior college A 4-year college
• The youth enters a long-term occupational skills training program, such as:
A pre-apprenticeship training program The Job Corps Training provided by a proprietary school or community-based organization (CBO) Vocational or technical school
Educational achievements represent an additional way in which we can examine whether youths appeared to have made favorable progress during the time they were YO participants. Specifically, we can examine the rate at which youths complete a GED or attain a high-school or postsecondary diploma. In this chapter, we tabulate youths’ educational achievements and long-term placements on outcome measures and identify factors that can explain why some achieved success and others did not (or at least not yet).
27 YO makes a distinction between short-term placements, which are considered services, and long-term placements, which are considered outcomes. Short-term unsubsidized employment and short-term vocational skills training are deemed services because, in the judgment of the case manager, they are intended to provide an opportunity for youths to learn valuable job skills or employability skills in the short term in preparation for being placed more favorably (in a job or longer-term skills training) later on. Whether the placement is considered a service (a “short-term” placement) or an outcome (a “long-term” placement) can be decided by case managers and need not be contingent on how long a youth remains on the job or in the training. However, once a youth is classified as having been placed in an outcome category (that is, having received a long-term placement), the young person enters the follow-up pool, and the grantee is held accountable for his or her subsequent status (whether or not in a job or some other favorable activity, such as education or training) on the retention rate, one of YO’s performance statistics.
Decision Information Resources, Inc. 26 YO Grants—MIS Report
Placements Rates The top two rows of Table 3 show that about 35,000 youths (about 38 percent of all participants) received a long-term placement by June 2005—that is, they were recorded as having entered either long-term unsubsidized employment, long-term education, or long-term training. However, OSY are noticeably more likely to have been placed than ISY (43 percent versus 33 percent). Part of the difficulty in interpreting these figures meaningfully is the absence of a suitable yardstick for comparison. For example, WIA formula-funded youth programs have not used a placement rate as a performance outcome for older or younger youths (though this will change as the new performance measures, the “common measures,” are being phased in). Further, dividing placements by the total number of participants arguably gives too harsh an accounting of the program because many participants might still be receiving services and, hence, are not ready to obtain a long-term placement. WIA formula-funded programs handle this difficulty by calculating performance outcomes solely (for the most part) for exiters, defined as those no longer receiving program services (other than follow-up services, for those already placed). However, YO does not use the exiter concept, partly to promote access to the full range of YO services even after a placement has occurred. To address this difficulty, DOL’s Office of Youth Services defined the YO program’s official placement rate as consisting of the number of youths who obtained a long-term placement divided by the number who were placed or had completed all their prescribed service activities. Table 3 shows this figure to be 82 percent for the YO program overall—86 percent for OSY and 77 percent for ISY. Because DOL has established a target rate of 80 percent for this measure, grantees appear to be achieving substantial success according to DOL’s expectations. However, although a placement rate measured this way has substantial precedent,28 that rate, too, is not entirely satisfactory. Many youths might have effectively dropped out of the program without completing their service plan or being placed and would thus not be counted in the denominator of the program’s official placement rate as defined in the preceding paragraph. To the extent this occurs, the 82 percent placement rate just described might be more positive than the program’s success in placing youths warrants. To redress this remaining difficulty, we use the exiter concept from the WIA formula-funded program. Officially, this program defines exit to have occurred when a participant does not receive a service funded by the program or funded by a partner program for 90 consecutive days and is not scheduled for future services, except for follow-up services if the participant has already been placed.29 Thus, we calculate the third placement rate as the number who were placed divided by those who were placed or had not received any service for the three months from April 1, 2005, through June 30, 2005, the last three months for which we have data.30 With 28 For example, Job Corps and YouthBuild have calculated placement rates as a percentage of all program completers, and community colleges commonly report placement rates in this way. 29 See Training and Employment Guidance Letter 17-05, issued February 17, 2006. 30 This specification imprecisely captures the exiter concept in two major ways. First, it ignores unplanned gaps in service of three or more months that occur between periods of participation; individuals with such gaps in WIA are treated as exiters when the gap occurs and then as re-enrollees. In this way, we count fewer youths as exiters than is strictly the case. Second, because data were not available for periods after June 30, 2005, we did not know whether services were planned for after that date, so youths who experience three months without service as of June 2005 are
Decision Information Resources, Inc. 27 YO Grants—MIS Report
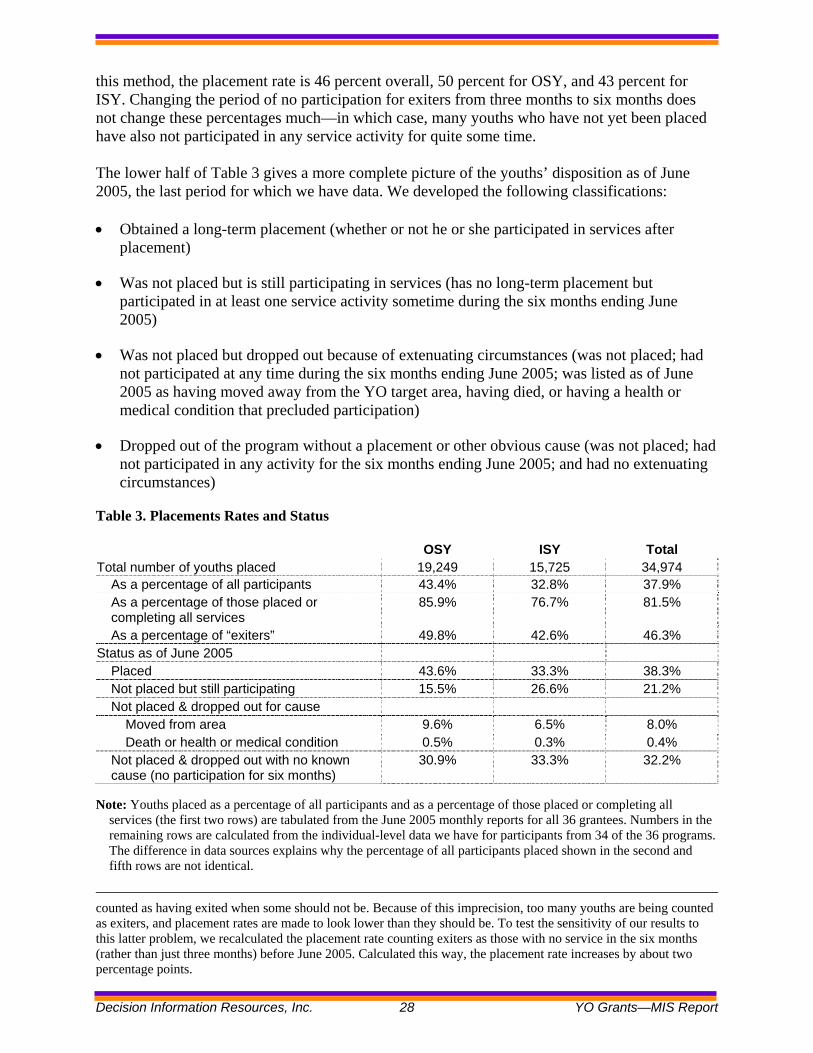
this method, the placement rate is 46 percent overall, 50 percent for OSY, and 43 percent for ISY. Changing the period of no participation for exiters from three months to six months does not change these percentages much—in which case, many youths who have not yet been placed have also not participated in any service activity for quite some time. The lower half of Table 3 gives a more complete picture of the youths’ disposition as of June 2005, the last period for which we have data. We developed the following classifications: • Obtained a long-term placement (whether or not he or she participated in services after
placement)
• Was not placed but is still participating in services (has no long-term placement but participated in at least one service activity sometime during the six months ending June 2005)
• Was not placed but dropped out because of extenuating circumstances (was not placed; had not participated at any time during the six months ending June 2005; was listed as of June 2005 as having moved away from the YO target area, having died, or having a health or medical condition that precluded participation)
• Dropped out of the program without a placement or other obvious cause (was not placed; had not participated in any activity for the six months ending June 2005; and had no extenuating circumstances)
Table 3. Placements Rates and Status
OSY ISY Total Total number of youths placed 19,249 15,725 34,974
As a percentage of all participants 43.4% 32.8% 37.9% As a percentage of those placed or completing all services
85.9% 76.7% 81.5%
As a percentage of “exiters” 49.8% 42.6% 46.3% Status as of June 2005
Placed 43.6% 33.3% 38.3% Not placed but still participating 15.5% 26.6% 21.2% Not placed & dropped out for cause
Moved from area 9.6% 6.5% 8.0% Death or health or medical condition 0.5% 0.3% 0.4%
Not placed & dropped out with no known cause (no participation for six months)
30.9% 33.3% 32.2%
Note: Youths placed as a percentage of all participants and as a percentage of those placed or completing all
services (the first two rows) are tabulated from the June 2005 monthly reports for all 36 grantees. Numbers in the remaining rows are calculated from the individual-level data we have for participants from 34 of the 36 programs. The difference in data sources explains why the percentage of all participants placed shown in the second and fifth rows are not identical.
counted as having exited when some should not be. Because of this imprecision, too many youths are being counted as exiters, and placement rates are made to look lower than they should be. To test the sensitivity of our results to this latter problem, we recalculated the placement rate counting exiters as those with no service in the six months (rather than just three months) before June 2005. Calculated this way, the placement rate increases by about two percentage points.
Decision Information Resources, Inc. 28 YO Grants—MIS Report
Decision Information Resources, Inc. 29 YO Grants—MIS Report
About 38 percent of all participants obtained a placement. In keeping with YO’s strategy of long-term engagement, 21 percent were not placed but are still participating, especially ISY, for whom the figure is 27 percent. Others (about 8 percent) left the YO target area before receiving a placement, and a small number have a health or medical condition that precludes their participation. Finally, about one-third were not placed but stopped participating in YO for at least six months for reasons not captured by the MIS. Overall, the results indicate that YO accomplished a long-term placement for almost 35,000 young people. At the same time, they also suggest that YO grantees (like many other youth programs) have substantial difficulty in keeping participants engaged in a program for the length of time that it takes them to gain the skills that they need to be ready for placement.31 Thus, grantees faced a dual challenge of achieving placements for youths while operating in an economic context that often had a dearth of placement opportunities (especially job opportunities, which most interested youths) and keeping those who were not ready for placement engaged in program services over a long period to redress their skill deficiencies. Using the exiter-based definition of the placement rate (the third of the three options presented in the top panel of Table 3), Figure 14 shows that grantees differed greatly in their ability to meet this challenge.32 Some grantees achieved placement rates (as a percentage of exiters) of more than 80 percent (for example, Molokai and San Antonio), while others recorded rates that were much lower. The differences across grantees shown in Figure 14 do not necessarily reflect how well the grantee performed. Many factors other than performance or effectiveness can explain the variation in results. For example, the Native American grantees, whose placement rates are among the lowest, operate in economic contexts characterized by the virtual absence of job opportunities of any kind. Keeping OSY, especially, engaged in program services indefinitely under such circumstances does not seem like a reasonable expectation. Nonetheless, the numbers shown in Figure 14 give some sense of what grantees were able to achieve within their contexts and suggest where wider-scale community impacts can most likely be found.
31 Similarly, the Quantum Opportunity Program, serving in-school high-school youths, shows that youths participated for less than one-quarter of the time program managers hoped for and that more than a third dropped out entirely before the program concluded (see M. Maxfield, L. Castner, V. Maralini, M. Vencill, The Quantum Opportunity Program Demonstration: Implementation Findings, August 2003). The problems in engaging OSY are also well known (see, for example, J. Henderson, S. Soukamneuth, and A. Wiegand, Services Provided to Out-of-School Youth under WIA: Challenges and Effective Strategies, October 2002). 32 For this tabulation, we are calculating the grantee’s placement rate as the number of its youths who achieved a long-term placement divided by the number who were either placed or who had not received a service during the three months from April to June 2005. We could have calculated the placement rate in other ways. For example, to yield a fairer assessment of the grantee’s performance, we could have subtracted from the base those who left the target area or had a health condition. However, we opted to use the exiter-based definition because it gives a better sense of the grantee’s prospect for affecting wholesale community change, which was a chief objective of the YO initiative.
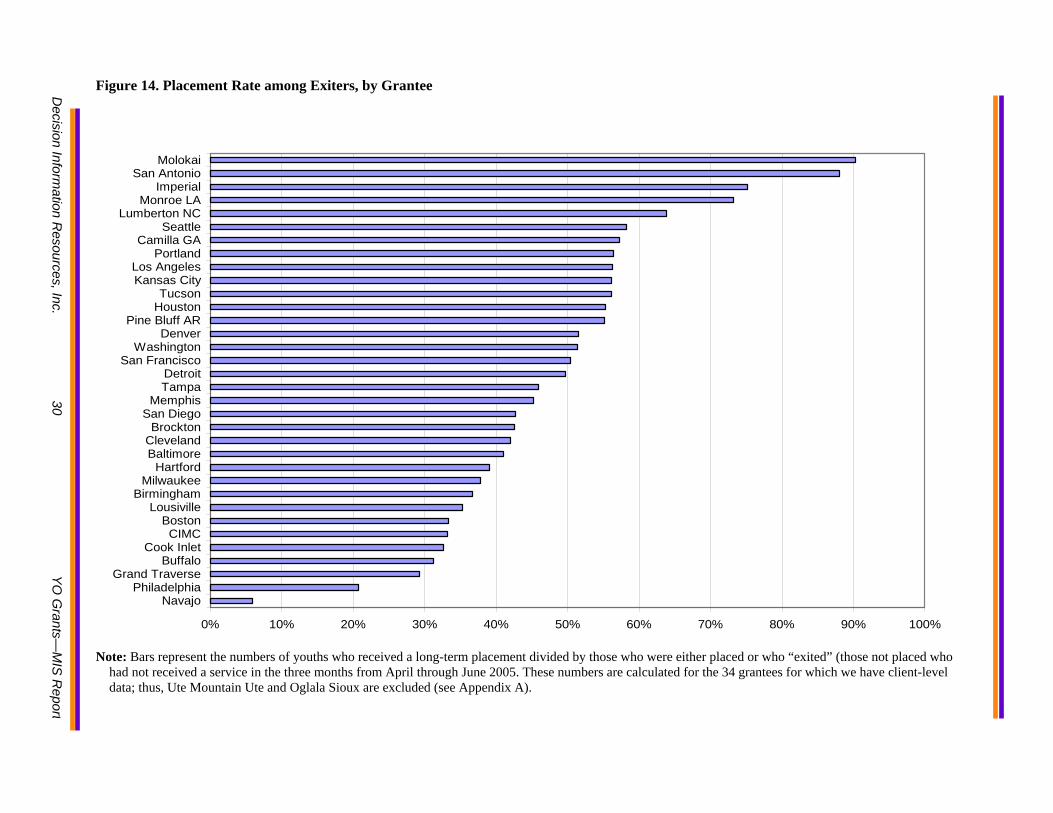
Exhibit 17: Placement Rate among Exiters, by Grantee
0% 10% 20% 30% 40% 50% 60% 70% 80% 90% 100%
NavajoPhiladelphia
Grand TraverseBuffalo
Cook InletCIMC
BostonLousiville
BirminghamMilwaukee
HartfordBaltimoreClevelandBrockton
San DiegoMemphis
TampaDetroit
San FranciscoWashington
DenverPine Bluff AR
HoustonTucson
Kansas CityLos Angeles
PortlandCamilla GA
SeattleLumberton NC
Monroe LAImperial
San AntonioMolokai
Note: Bars represent the numbers of youths who received a long-term placement divided by those who were either placed or who “exited” (those not placed who
had not received a service in the three months from April through June 2005. These numbers are calculated for the 34 grantees for which we have client-level data; thus, Ute Mountain Ute and Oglala Sioux are excluded (see Appendix A).
Figure 14. Placement Rate among Exiters, by Grantee
Decision Inform
ation Resources, Inc.
30 Y
O G
rants—M
IS R
eport
Types of Placements and Educational Achievements Table 4 shows that about 53 percent of the approximately 35,000 youths who were placed entered unsubsidized employment; this rate is appreciably higher among placed OSY (59 percent) than placed ISY (45 percent). This evaluation’s process report shows that OSY strongly preferred to seek employment, while ISY equally wanted to continue their education, so the employment gap between placed OSY and ISY should not be surprising. At the same time, educational and training placements were important for both groups. For example, more than 40 percent of placed OSY received a long-term educational placement, most commonly in an alternative school or a community college, while more than 60 percent of placed ISY received a long-term educational placement, with most entering 2-year or 4-year colleges. Long-term training placements were less common for both groups—22 percent of OSY and 14 percent of ISY.33
Table 4. Types of Long-Term Placements
Type of Placement OSY ISY Total Entered employment (unsubsidized) 59.2% 44.9% 52.8% Entered long-term education
Returned to regular high school 4.2% 4.3% 4.2% Entered alternative high school 14.4% 7.2% 11.1% Entered community or junior college 17.5% 24.6% 20.7% Entered 4-year college 8.5% 28.1% 17.3%
Entered long-term training Entered pre-apprenticeship 2.9% 1.4% 2.3% Entered Job Corps 2.8% 1.8% 2.4% Entered CBO or proprietary training 3.9% 2.2% 3.1% Entered vocational or technical school 12.2% 8.8% 10.6%
Note: These percentages were calculated from the grantee monthly reports, showing cumulative placements as of
June 2005 and thus reflect data for all 36 grantees. The sum of the percentages shown in any column exceeds 100 percent because some youths received a placement of more than one type.
As we have discussed, youths can be successful both by achieving a long-term placement and by remaining steadily engaged in the YO program. They can also reach educational achievements, such as attaining a secondary or postsecondary school diploma, whether or not they have yet been credited with a placement. These achievements are tabulated in Table 5. As Table 5 shows, among those who had no high-school diploma or GED at enrollment, 12 percent of OSY and 26 percent of ISY attained a diploma or GED by June 2005. Among those who had no college degree at enrollment, a small number obtained a 2-year or 4-year college degree. These data do not necessarily reflect the role that YO played in making these achievements possible, but they do suggest that YO youths were making notable accomplishments during the time of their enrollment. Moreover, many others were presumably 33 The percentages of OSY and ISY who received an educational or training placement cannot be calculated simply by summing across the relevant rows in Table 4, because some youths received a placement of more than one type. Instead, percentages were calculated by using individual-level data.
Decision Information Resources, Inc. 31 YO Grants—MIS Report
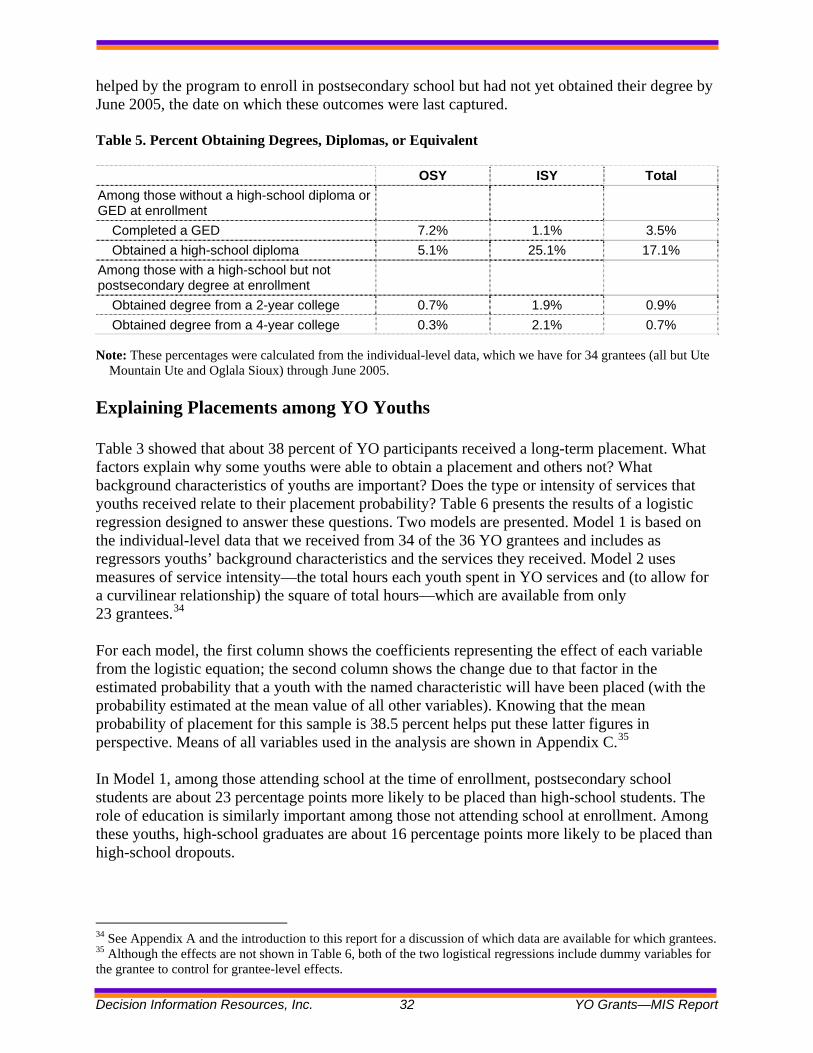
helped by the program to enroll in postsecondary school but had not yet obtained their degree by June 2005, the date on which these outcomes were last captured. Table 5. Percent Obtaining Degrees, Diplomas, or Equivalent
OSY ISY Total Among those without a high-school diploma or GED at enrollment
Completed a GED 7.2% 1.1% 3.5% Obtained a high-school diploma 5.1% 25.1% 17.1%
Among those with a high-school but not postsecondary degree at enrollment
Obtained degree from a 2-year college 0.7% 1.9% 0.9% Obtained degree from a 4-year college 0.3% 2.1% 0.7%
Note: These percentages were calculated from the individual-level data, which we have for 34 grantees (all but Ute
Mountain Ute and Oglala Sioux) through June 2005. Explaining Placements among YO Youths Table 3 showed that about 38 percent of YO participants received a long-term placement. What factors explain why some youths were able to obtain a placement and others not? What background characteristics of youths are important? Does the type or intensity of services that youths received relate to their placement probability? Table 6 presents the results of a logistic regression designed to answer these questions. Two models are presented. Model 1 is based on the individual-level data that we received from 34 of the 36 YO grantees and includes as regressors youths’ background characteristics and the services they received. Model 2 uses measures of service intensity—the total hours each youth spent in YO services and (to allow for a curvilinear relationship) the square of total hours—which are available from only 23 grantees.34
For each model, the first column shows the coefficients representing the effect of each variable from the logistic equation; the second column shows the change due to that factor in the estimated probability that a youth with the named characteristic will have been placed (with the probability estimated at the mean value of all other variables). Knowing that the mean probability of placement for this sample is 38.5 percent helps put these latter figures in perspective. Means of all variables used in the analysis are shown in Appendix C.35
In Model 1, among those attending school at the time of enrollment, postsecondary school students are about 23 percentage points more likely to be placed than high-school students. The role of education is similarly important among those not attending school at enrollment. Among these youths, high-school graduates are about 16 percentage points more likely to be placed than high-school dropouts.
34 See Appendix A and the introduction to this report for a discussion of which data are available for which grantees. 35 Although the effects are not shown in Table 6, both of the two logistical regressions include dummy variables for the grantee to control for grantee-level effects.
Decision Information Resources, Inc. 32 YO Grants—MIS Report
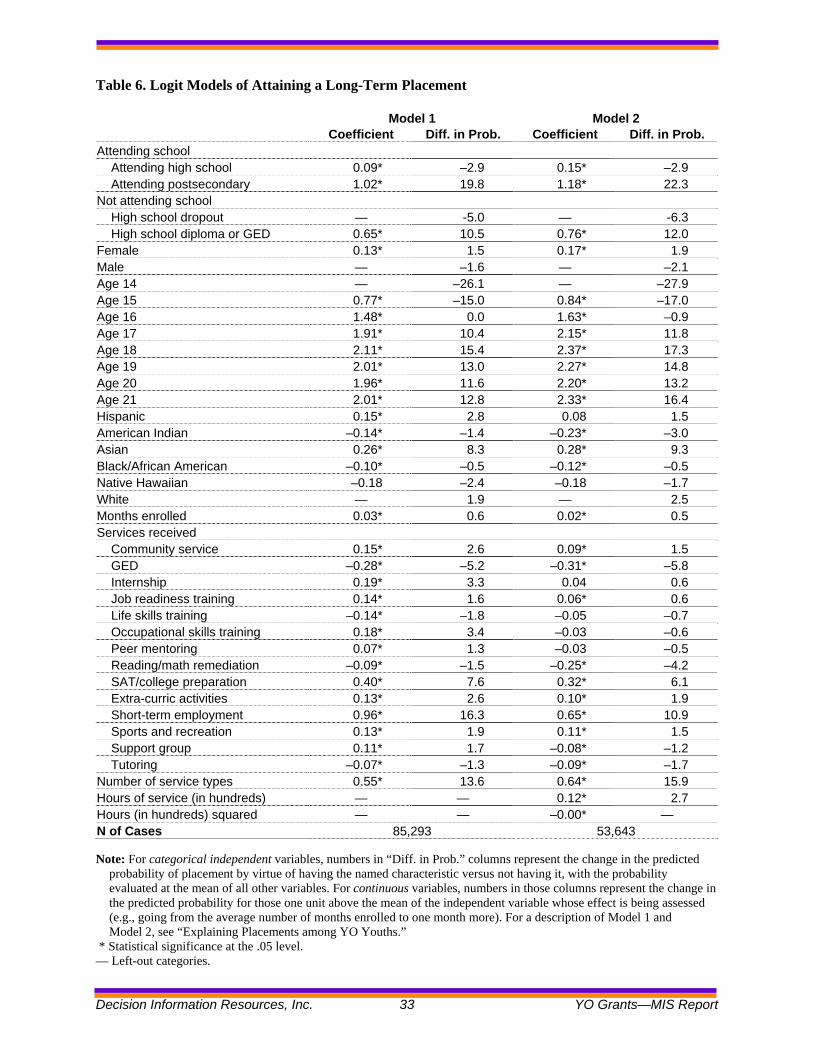
Table 6. Logit Models of Attaining a Long-Term Placement
Model 1 Model 2 Coefficient Diff. in Prob. Coefficient Diff. in Prob.
Attending school Attending high school 0.09* –2.9 0.15* –2.9 Attending postsecondary 1.02* 19.8 1.18* 22.3
Not attending school High school dropout — -5.0 — -6.3 High school diploma or GED 0.65* 10.5 0.76* 12.0
Female 0.13* 1.5 0.17* 1.9 Male — –1.6 — –2.1 Age 14 — –26.1 — –27.9 Age 15 0.77* –15.0 0.84* –17.0 Age 16 1.48* 0.0 1.63* –0.9 Age 17 1.91* 10.4 2.15* 11.8 Age 18 2.11* 15.4 2.37* 17.3 Age 19 2.01* 13.0 2.27* 14.8 Age 20 1.96* 11.6 2.20* 13.2 Age 21 2.01* 12.8 2.33* 16.4 Hispanic 0.15* 2.8 0.08 1.5 American Indian –0.14* –1.4 –0.23* –3.0 Asian 0.26* 8.3 0.28* 9.3 Black/African American –0.10* –0.5 –0.12* –0.5 Native Hawaiian –0.18 –2.4 –0.18 –1.7 White — 1.9 — 2.5 Months enrolled 0.03* 0.6 0.02* 0.5 Services received
Community service 0.15* 2.6 0.09* 1.5 GED –0.28* –5.2 –0.31* –5.8 Internship 0.19* 3.3 0.04 0.6 Job readiness training 0.14* 1.6 0.06* 0.6 Life skills training –0.14* –1.8 –0.05 –0.7 Occupational skills training 0.18* 3.4 –0.03 –0.6 Peer mentoring 0.07* 1.3 –0.03 –0.5 Reading/math remediation –0.09* –1.5 –0.25* –4.2 SAT/college preparation 0.40* 7.6 0.32* 6.1 Extra-curric activities 0.13* 2.6 0.10* 1.9 Short-term employment 0.96* 16.3 0.65* 10.9 Sports and recreation 0.13* 1.9 0.11* 1.5 Support group 0.11* 1.7 –0.08* –1.2 Tutoring –0.07* –1.3 –0.09* –1.7
Number of service types 0.55* 13.6 0.64* 15.9 Hours of service (in hundreds) — — 0.12* 2.7 Hours (in hundreds) squared — — –0.00* — N of Cases 85,293 53,643 Note: For categorical independent variables, numbers in “Diff. in Prob.” columns represent the change in the predicted
probability of placement by virtue of having the named characteristic versus not having it, with the probability evaluated at the mean of all other variables. For continuous variables, numbers in those columns represent the change in the predicted probability for those one unit above the mean of the independent variable whose effect is being assessed (e.g., going from the average number of months enrolled to one month more). For a description of Model 1 and Model 2, see “Explaining Placements among YO Youths.”
* Statistical significance at the .05 level. — Left-out categories.
Decision Information Resources, Inc. 33 YO Grants—MIS Report
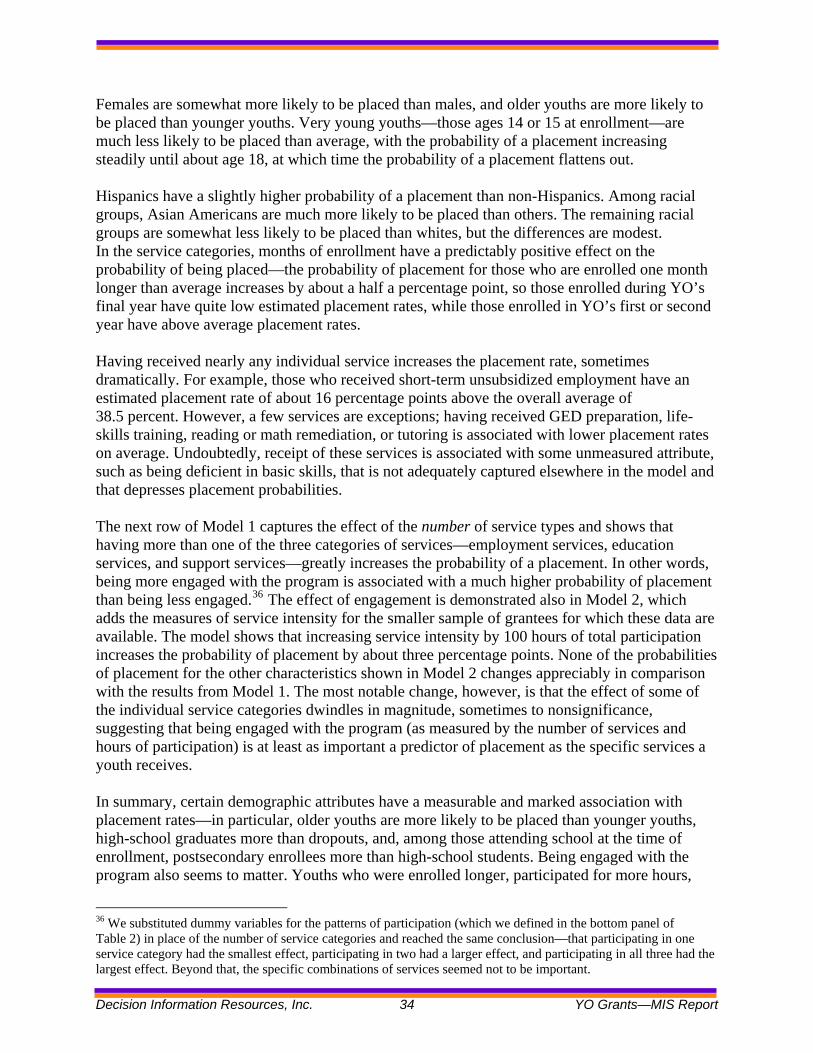
Females are somewhat more likely to be placed than males, and older youths are more likely to be placed than younger youths. Very young youths—those ages 14 or 15 at enrollment—are much less likely to be placed than average, with the probability of a placement increasing steadily until about age 18, at which time the probability of a placement flattens out. Hispanics have a slightly higher probability of a placement than non-Hispanics. Among racial groups, Asian Americans are much more likely to be placed than others. The remaining racial groups are somewhat less likely to be placed than whites, but the differences are modest. In the service categories, months of enrollment have a predictably positive effect on the probability of being placed—the probability of placement for those who are enrolled one month longer than average increases by about a half a percentage point, so those enrolled during YO’s final year have quite low estimated placement rates, while those enrolled in YO’s first or second year have above average placement rates. Having received nearly any individual service increases the placement rate, sometimes dramatically. For example, those who received short-term unsubsidized employment have an estimated placement rate of about 16 percentage points above the overall average of 38.5 percent. However, a few services are exceptions; having received GED preparation, life-skills training, reading or math remediation, or tutoring is associated with lower placement rates on average. Undoubtedly, receipt of these services is associated with some unmeasured attribute, such as being deficient in basic skills, that is not adequately captured elsewhere in the model and that depresses placement probabilities. The next row of Model 1 captures the effect of the number of service types and shows that having more than one of the three categories of services—employment services, education services, and support services—greatly increases the probability of a placement. In other words, being more engaged with the program is associated with a much higher probability of placement than being less engaged.36 The effect of engagement is demonstrated also in Model 2, which adds the measures of service intensity for the smaller sample of grantees for which these data are available. The model shows that increasing service intensity by 100 hours of total participation increases the probability of placement by about three percentage points. None of the probabilities of placement for the other characteristics shown in Model 2 changes appreciably in comparison with the results from Model 1. The most notable change, however, is that the effect of some of the individual service categories dwindles in magnitude, sometimes to nonsignificance, suggesting that being engaged with the program (as measured by the number of services and hours of participation) is at least as important a predictor of placement as the specific services a youth receives. In summary, certain demographic attributes have a measurable and marked association with placement rates—in particular, older youths are more likely to be placed than younger youths, high-school graduates more than dropouts, and, among those attending school at the time of enrollment, postsecondary enrollees more than high-school students. Being engaged with the program also seems to matter. Youths who were enrolled longer, participated for more hours,
36 We substituted dummy variables for the patterns of participation (which we defined in the bottom panel of Table 2) in place of the number of service categories and reached the same conclusion—that participating in one service category had the smallest effect, participating in two had a larger effect, and participating in all three had the largest effect. Beyond that, the specific combinations of services seemed not to be important.
Decision Information Resources, Inc. 34 YO Grants—MIS Report
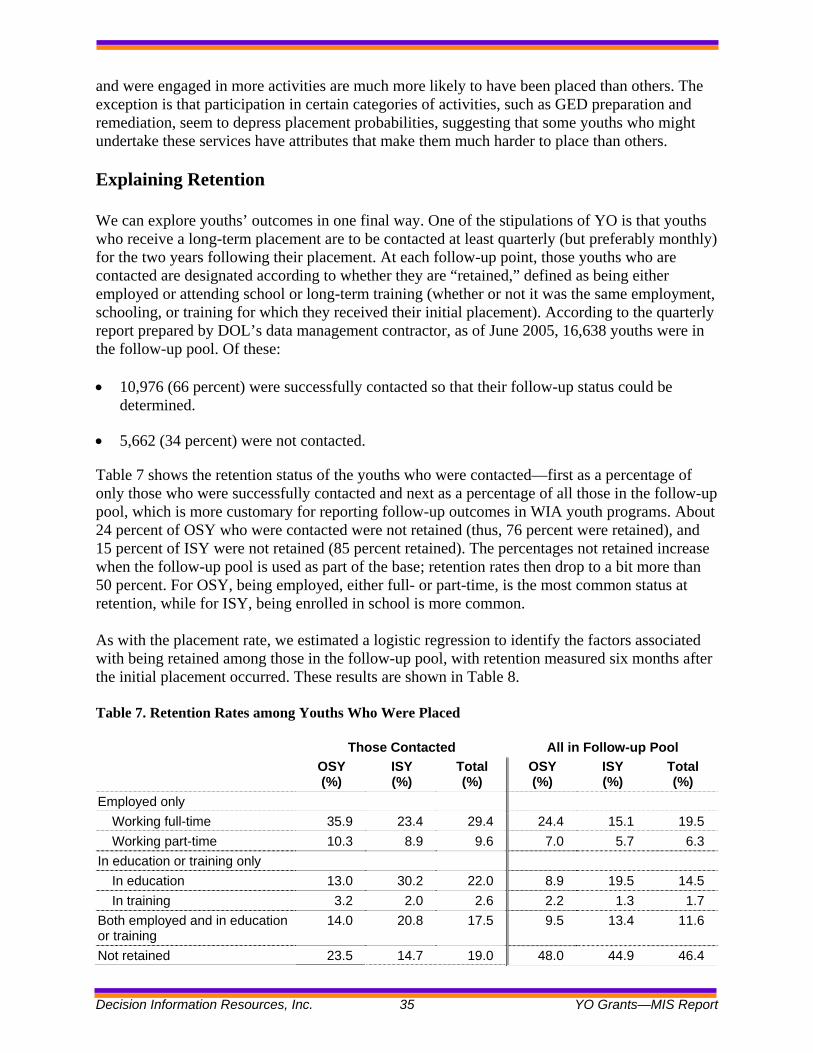
and were engaged in more activities are much more likely to have been placed than others. The exception is that participation in certain categories of activities, such as GED preparation and remediation, seem to depress placement probabilities, suggesting that some youths who might undertake these services have attributes that make them much harder to place than others. Explaining Retention We can explore youths’ outcomes in one final way. One of the stipulations of YO is that youths who receive a long-term placement are to be contacted at least quarterly (but preferably monthly) for the two years following their placement. At each follow-up point, those youths who are contacted are designated according to whether they are “retained,” defined as being either employed or attending school or long-term training (whether or not it was the same employment, schooling, or training for which they received their initial placement). According to the quarterly report prepared by DOL’s data management contractor, as of June 2005, 16,638 youths were in the follow-up pool. Of these: • 10,976 (66 percent) were successfully contacted so that their follow-up status could be
determined.
• 5,662 (34 percent) were not contacted.
Table 7 shows the retention status of the youths who were contacted—first as a percentage of only those who were successfully contacted and next as a percentage of all those in the follow-up pool, which is more customary for reporting follow-up outcomes in WIA youth programs. About 24 percent of OSY who were contacted were not retained (thus, 76 percent were retained), and 15 percent of ISY were not retained (85 percent retained). The percentages not retained increase when the follow-up pool is used as part of the base; retention rates then drop to a bit more than 50 percent. For OSY, being employed, either full- or part-time, is the most common status at retention, while for ISY, being enrolled in school is more common. As with the placement rate, we estimated a logistic regression to identify the factors associated with being retained among those in the follow-up pool, with retention measured six months after the initial placement occurred. These results are shown in Table 8. Table 7. Retention Rates among Youths Who Were Placed
Those Contacted All in Follow-up Pool OSY
(%) ISY (%)
Total (%)
OSY (%)
ISY (%)
Total (%)
Employed only Working full-time 35.9 23.4 29.4 24.4 15.1 19.5 Working part-time 10.3 8.9 9.6 7.0 5.7 6.3
In education or training only In education 13.0 30.2 22.0 8.9 19.5 14.5 In training 3.2 2.0 2.6 2.2 1.3 1.7
Both employed and in education or training
14.0 20.8 17.5 9.5 13.4 11.6
Not retained 23.5 14.7 19.0 48.0 44.9 46.4
Decision Information Resources, Inc. 35 YO Grants—MIS Report
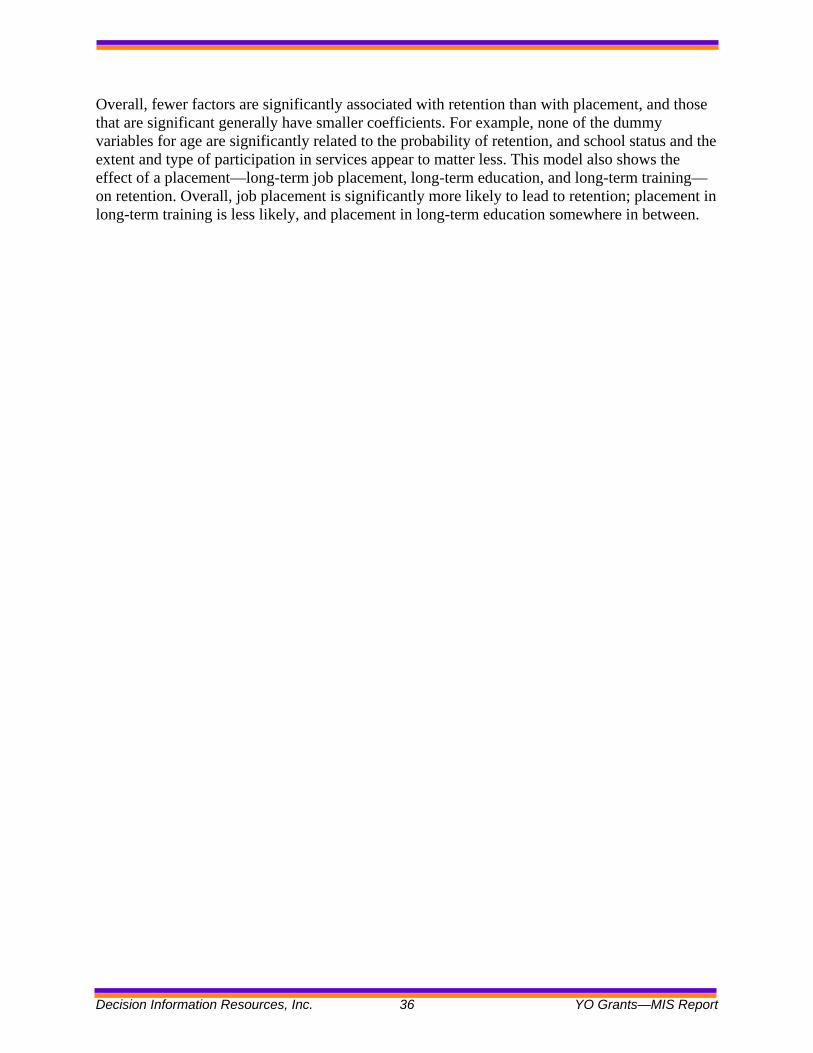
Overall, fewer factors are significantly associated with retention than with placement, and those that are significant generally have smaller coefficients. For example, none of the dummy variables for age are significantly related to the probability of retention, and school status and the extent and type of participation in services appear to matter less. This model also shows the effect of a placement—long-term job placement, long-term education, and long-term training—on retention. Overall, job placement is significantly more likely to lead to retention; placement in long-term training is less likely, and placement in long-term education somewhere in between.
Decision Information Resources, Inc. 36 YO Grants—MIS Report
Table 8. Logit Models of Retention at Follow-up
Model 1 Model 2 Coefficient Probability Coefficient Probability
Attending school Attending high school 0.40* 2.1 0.45* 2.8 Attending postsecondary 0.56* 5.0 0.62* 6.1
Not attending school High school dropout — –6.1 — –7.2 High school diploma or GED 0.33* 0.8 0.31* –0.2
Female 0.06* 0.6 0.09* 0.8 Male — –0.7 — –1.1 Age 14 — 0.8 — 2.6 Age 15 0.14 3.4 0.22* 6.9 Age 16 –0.01 0.6 –0.09 0.8 Age 17 –0.08 –0.8 –0.19* –1.4 Age 18 –0.07 –0.5 –0.16 –0.9 Age 19 –0.08 –0.8 –0.21* –1.9 Age 20 –0.07 –0.6 –0.21* –1.9 Age 21 –0.04 0.0 –0.18 –1.2 Hispanic 0.11 1.5 0.04 0.6 American Indian –0.09 0.9 –0.06 1.0 Asian 0.12 4.9 0.12 4.6 Black/African American –0.24* –2.0 –0.19* –1.9 Native Hawaiian –0.05 1.7 0.02 2.6 White — 2.7 — 2.3 Months enrolled –0.02* –0.4 –0.04* –1.0 Services received
Community service 0.12* 1.6 0.07 0.9 GED –0.12* –1.9 –0.19* –3.4 Internship 0.08* 1.0 –0.06 –0.8 Job readiness training 0.04 0.3 0.05 0.3 Life skills training 0.07 0.7 0.10* 1.0 Occupational skills training 0.10* 1.4 –0.01 –0.1 Peer mentoring 0.01 0.2 –0.03 –0.4 Reading/math remediation 0.11* 1.6 0.03 0.4 SAT/college preparation –0.02 –0.3 –0.08 –1.2 Extra-curric activities 0.26* 3.9 0.27* 4.2 Short-term employment 0.41* 4.0 0.10* 1.1 Sports and recreation 0.05 0.6 0.07 0.7 Support group 0.01 0.1 –0.13* –1.8 Tutoring 0.12* 1.9 0.11* 1.7
Number of service types 0.09* 1.8 0.07 1.4 Long-term job placement 0.25* 2.4 0.19* 2.0 Long-term educ placement 0.13* 1.2 0.04 0.3 Long-term training placement –0.02 –0.3 –0.09 –1.7 Hours of service (in hundreds) — — 0.08* 1.7 Hours (in hundreds) squared — — –0.00* — N of Cases 26,066 19,098 See note for Table 6.
Decision Information Resources, Inc. 37 YO Grants—MIS Report
Chapter 5. Summary and Conclusions This report takes a broad look at YO participants, services, and outcomes, using the aggregated data that we have available for all 36 YO grantees and the individual-level client data that we have for a subset of 34 grantees. We have documented the remarkable ratcheting up of programs over the approximately five years during which YO has been operating. Although grantees had substantial experience operating youth programs generally, most were beginning their YO program operations from virtually a standstill and, from that point, built the infrastructure that they needed to enroll and serve tens of thousands of participants within YO’s first year.37 Enrollments approximately doubled to more than 50,000 enrollees by the end of YO’s second year and reached more than 92,000 participants as YO was nearing its end in mid-2005. This number represents a substantial fraction of all youths served in publicly funded youth workforce programs during that year. Although participants were nearly evenly split between ISY and OSY, OSY enrollees were a much higher proportion of the eligible youths in the grantees’ service areas. The grantees made a concerted effort to reach and serve OSY, who have been traditionally very difficult to enroll in workforce programs. In fact, YO grantees enrolled about 52 percent of eligible OSY and 26 percent of ISY, for a blended rate of about 34 percent. Grantees’ ability to achieve a high “penetration” rate was uneven. Although most grantees enrolled between 25 percent and 45 percent of eligibles, some achieved penetration rates much higher than that, even reaching 100 percent in some cases, while others had much lower penetration rates. This difference partly reflected the adequacy of the grantee’s YO allotment per eligible youth, which was much more generous than average for a handful of grantees. But it also reflected a grantee’s decision about whether to strive for a higher penetration rate and having relatively less to spend per enrollee or achieving a lower penetration rate and having relatively more to spend per enrollee. These trade-offs represented an important context as the evaluation examined program impacts. We profiled the characteristics of youths who were being served. As in the communities that were being targeted, youths of color predominated. Further, although the program reached almost equal numbers of ISY and OSY, YO was far more likely to serve OSY—particularly high-school dropouts—than were WIA formula-funded youth programs nationwide. We showed the range of youth-development services in which youths participated. Job-readiness training and life-skills training were common program activities, but many other services were also well represented, including sports and recreation, short-term unsubsidized employment, internships, community service, remediation, and others. In keeping with the holistic model that YO was promoting, most youths participated in multiple services during the course of their tenure in the program. In fact, it was quite common for youths to participate in at least one employment activity, at least one educational activity, and at least one “other” activity designed to support youths and develop their potential.
37 A small number of grantees were previously funded under the Youth Opportunity Grant Demonstration model (that is, Kulick grants).
Decision Information Resources, Inc. 38 YO Grants—MIS Report
Average hours of participation were substantial, reaching about 550 hours per person, which is roughly equivalent to the average that many other programs providing comprehensive services to at-risk youths have been able to achieve. At the same time, the intensity of participation was uneven, with the average masking tremendous variability. Although about one-fifth of youths participated 1,000 hours or more over the course of the grant, one-quarter participated for fewer than 50 hours, possibly because youths’ need for services similarly varied. Moreover, many of the activities in which youths participated were low in intensity. For example, youths participated in job-readiness training for an average of 16 hours, college/SAT preparation 18 hours, community service 20 hours, individual tutoring 24 hours, and reading or math remediation 50 hours. The only activities that could be described as even moderately intensive were internships, at an average of 146 hours, and short-term unsubsidized employment, at 360 hours. At worst, this data about engaging participants in youth-development activities could suggest that YO’s biggest contribution might have been simply helping to arrange for short-term job opportunities. However, the MIS might not capture other ways in which participants were involved in the YO program and which could have substantial effects on their subsequent development. One such example is the time youths spent “hanging out” with their peers under the watchful eye of supervisors at the YO centers and interacting over the course of their participation with the caring adults that were their case managers. In fact, this evaluation’s process study indicated that youths highly valued the YO centers and the opportunity to engage with caring adults. While service intensity varied across youths, average service intensity varied markedly across grantees as well. Some grantees reported that their youths participated an average of 1,000 hours or more, while others reported much lower averages at less than 100 hours per person. This variation partly related to the size of the grantee’s catchment area relative to its grant allocation and also to whether the grantee relied heavily on unsubsidized employment as a service activity. Curiously, though, the size of the grantee’s YO expenditures per enrollee does not relate well to service intensity. Finally, we looked at the outcomes—primarily placements in unsubsidized employment or in education or training—attained by YO participants. About 38 percent of all YO participants received a placement. Many others (about 21 percent) were not placed but were still receiving program services. Others dropped out of the YO program before placement because they moved away from the target area, but many others stopped participating short of placement for no known reason. Among the factors that determine why some youths are placed but not others, we identified certain demographic attributes. For example, older youths are more likely to have been placed than younger youths, and high-school graduates are much more likely to have been placed than dropouts. Service factors also seemed to be important, including the extent of the youth’s engagement with the program, as measured by their hours of participation and the number of distinct categories of activities in which they participated. Overall, on the positive side, the program clearly succeeded in reaching a substantial proportion of youths in the YO target areas; provided most of the youths with multiple services, which included employment, education, and other youth development activities; and placed appreciable numbers in jobs or training that was intended to represent a long-term opportunity. On a less
Decision Information Resources, Inc. 39 YO Grants—MIS Report
positive note, most of the services that youths received were individually not intensive, and an appreciable number of youths participated very little; others who were enrolled stopped participating without receiving a placement, either because they left the target area or for other reasons. Whether the balance of these factors is sufficient to positively impact youth participants and their communities remains for the research team to establish, as the evaluation concludes its investigation of the YO program.
Decision Information Resources, Inc. 40 YO Grants—MIS Report
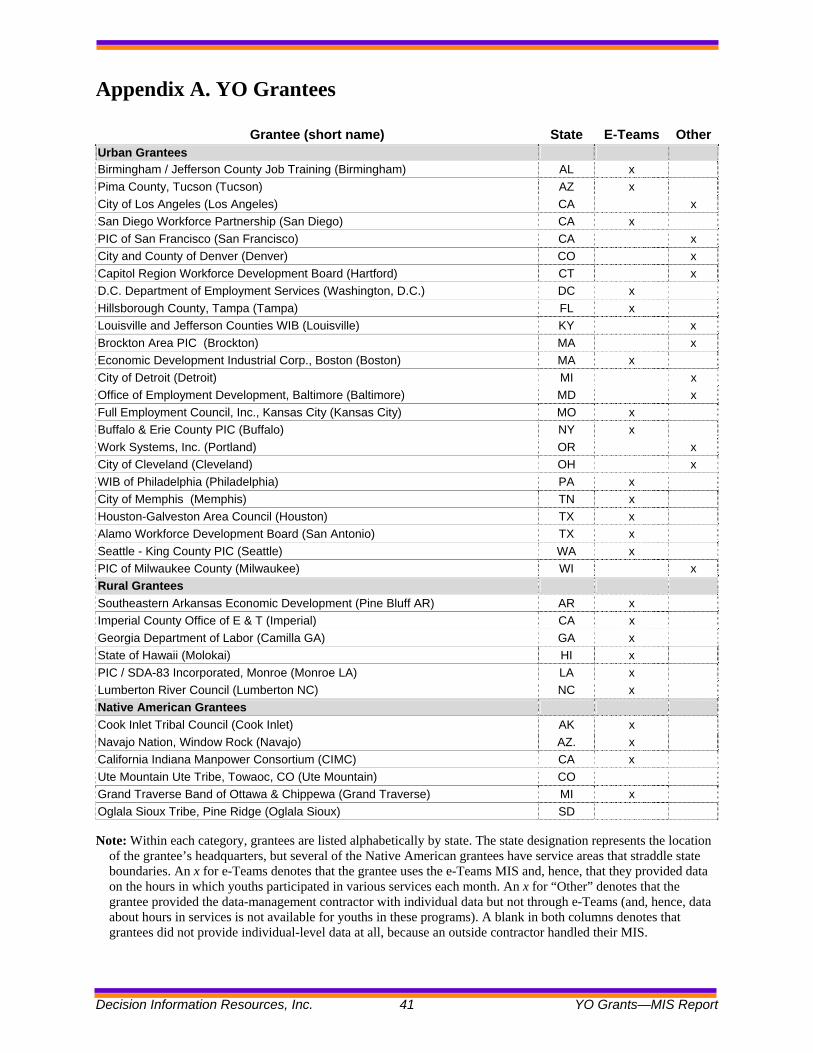
Appendix A. YO Grantees
Grantee (short name) State E-Teams OtherUrban Grantees Birmingham / Jefferson County Job Training (Birmingham) AL x Pima County, Tucson (Tucson) AZ x City of Los Angeles (Los Angeles) CA x San Diego Workforce Partnership (San Diego) CA x PIC of San Francisco (San Francisco) CA x City and County of Denver (Denver) CO x Capitol Region Workforce Development Board (Hartford) CT x D.C. Department of Employment Services (Washington, D.C.) DC x Hillsborough County, Tampa (Tampa) FL x Louisville and Jefferson Counties WIB (Louisville) KY x Brockton Area PIC (Brockton) MA x Economic Development Industrial Corp., Boston (Boston) MA x City of Detroit (Detroit) MI x Office of Employment Development, Baltimore (Baltimore) MD x Full Employment Council, Inc., Kansas City (Kansas City) MO x Buffalo & Erie County PIC (Buffalo) NY x Work Systems, Inc. (Portland) OR x City of Cleveland (Cleveland) OH x WIB of Philadelphia (Philadelphia) PA x City of Memphis (Memphis) TN x Houston-Galveston Area Council (Houston) TX x Alamo Workforce Development Board (San Antonio) TX x Seattle - King County PIC (Seattle) WA x PIC of Milwaukee County (Milwaukee) WI x Rural Grantees Southeastern Arkansas Economic Development (Pine Bluff AR) AR x Imperial County Office of E & T (Imperial) CA x Georgia Department of Labor (Camilla GA) GA x State of Hawaii (Molokai) HI x PIC / SDA-83 Incorporated, Monroe (Monroe LA) LA x Lumberton River Council (Lumberton NC) NC x Native American Grantees Cook Inlet Tribal Council (Cook Inlet) AK x Navajo Nation, Window Rock (Navajo) AZ. x California Indiana Manpower Consortium (CIMC) CA x Ute Mountain Ute Tribe, Towaoc, CO (Ute Mountain) CO Grand Traverse Band of Ottawa & Chippewa (Grand Traverse) MI x Oglala Sioux Tribe, Pine Ridge (Oglala Sioux) SD Note: Within each category, grantees are listed alphabetically by state. The state designation represents the location
of the grantee’s headquarters, but several of the Native American grantees have service areas that straddle state boundaries. An x for e-Teams denotes that the grantee uses the e-Teams MIS and, hence, that they provided data on the hours in which youths participated in various services each month. An x for “Other” denotes that the grantee provided the data-management contractor with individual data but not through e-Teams (and, hence, data about hours in services is not available for youths in these programs). A blank in both columns denotes that grantees did not provide individual-level data at all, because an outside contractor handled their MIS.
Decision Information Resources, Inc. 41 YO Grants—MIS Report
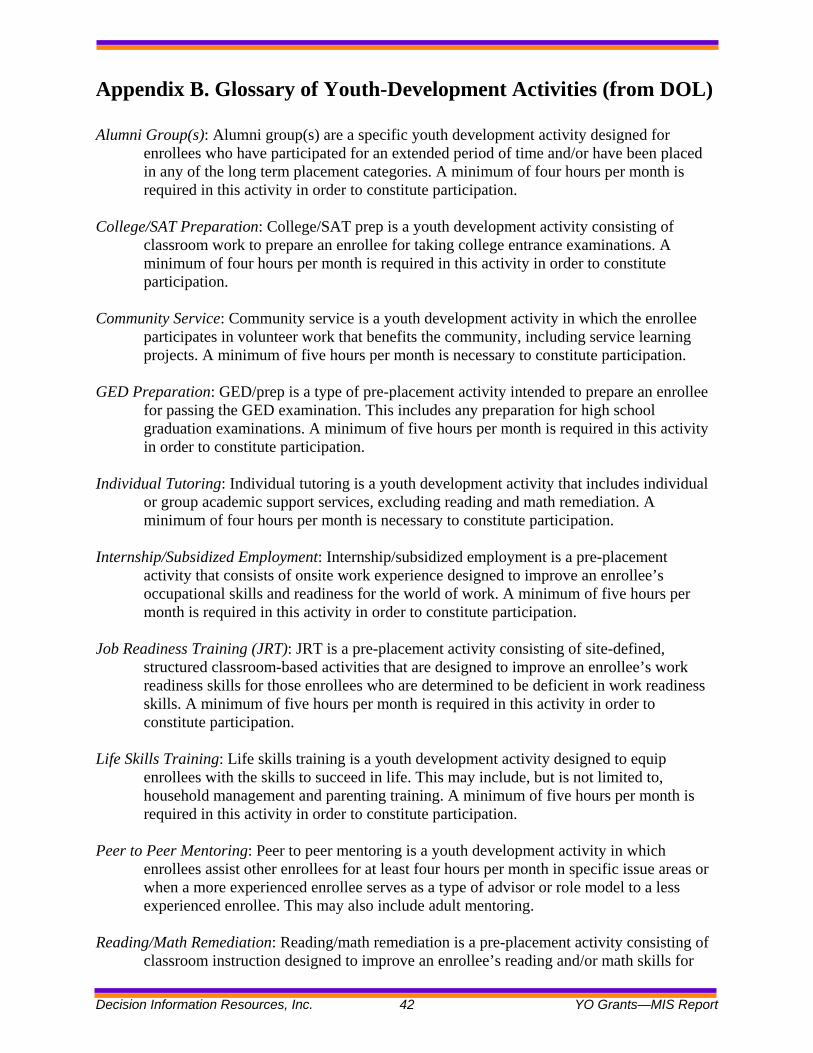
Appendix B. Glossary of Youth-Development Activities (from DOL) Alumni Group(s): Alumni group(s) are a specific youth development activity designed for
enrollees who have participated for an extended period of time and/or have been placed in any of the long term placement categories. A minimum of four hours per month is required in this activity in order to constitute participation.
College/SAT Preparation: College/SAT prep is a youth development activity consisting of
classroom work to prepare an enrollee for taking college entrance examinations. A minimum of four hours per month is required in this activity in order to constitute participation.
Community Service: Community service is a youth development activity in which the enrollee
participates in volunteer work that benefits the community, including service learning projects. A minimum of five hours per month is necessary to constitute participation.
GED Preparation: GED/prep is a type of pre-placement activity intended to prepare an enrollee
for passing the GED examination. This includes any preparation for high school graduation examinations. A minimum of five hours per month is required in this activity in order to constitute participation.
Individual Tutoring: Individual tutoring is a youth development activity that includes individual
or group academic support services, excluding reading and math remediation. A minimum of four hours per month is necessary to constitute participation.
Internship/Subsidized Employment: Internship/subsidized employment is a pre-placement
activity that consists of onsite work experience designed to improve an enrollee’s occupational skills and readiness for the world of work. A minimum of five hours per month is required in this activity in order to constitute participation.
Job Readiness Training (JRT): JRT is a pre-placement activity consisting of site-defined,
structured classroom-based activities that are designed to improve an enrollee’s work readiness skills for those enrollees who are determined to be deficient in work readiness skills. A minimum of five hours per month is required in this activity in order to constitute participation.
Life Skills Training: Life skills training is a youth development activity designed to equip
enrollees with the skills to succeed in life. This may include, but is not limited to, household management and parenting training. A minimum of five hours per month is required in this activity in order to constitute participation.
Peer to Peer Mentoring: Peer to peer mentoring is a youth development activity in which
enrollees assist other enrollees for at least four hours per month in specific issue areas or when a more experienced enrollee serves as a type of advisor or role model to a less experienced enrollee. This may also include adult mentoring.
Reading/Math Remediation: Reading/math remediation is a pre-placement activity consisting of
classroom instruction designed to improve an enrollee’s reading and/or math skills for
Decision Information Resources, Inc. 42 YO Grants—MIS Report
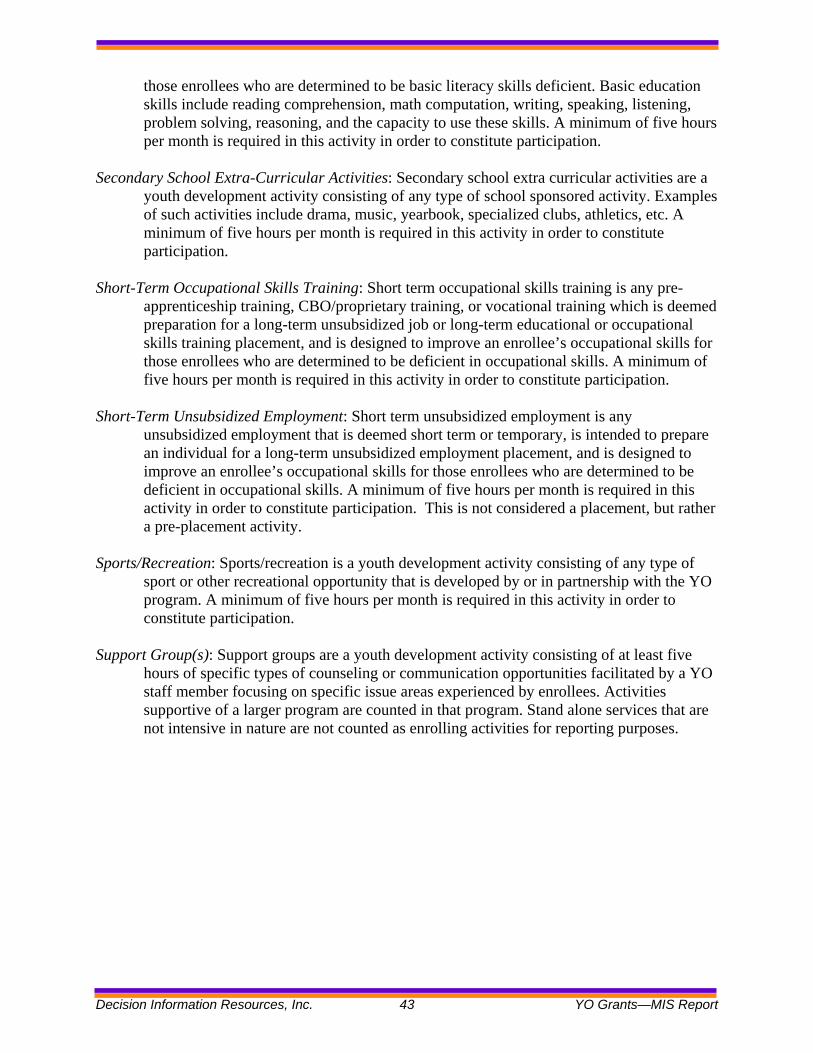
those enrollees who are determined to be basic literacy skills deficient. Basic education skills include reading comprehension, math computation, writing, speaking, listening, problem solving, reasoning, and the capacity to use these skills. A minimum of five hours per month is required in this activity in order to constitute participation.
Secondary School Extra-Curricular Activities: Secondary school extra curricular activities are a
youth development activity consisting of any type of school sponsored activity. Examples of such activities include drama, music, yearbook, specialized clubs, athletics, etc. A minimum of five hours per month is required in this activity in order to constitute participation.
Short-Term Occupational Skills Training: Short term occupational skills training is any pre-
apprenticeship training, CBO/proprietary training, or vocational training which is deemed preparation for a long-term unsubsidized job or long-term educational or occupational skills training placement, and is designed to improve an enrollee’s occupational skills for those enrollees who are determined to be deficient in occupational skills. A minimum of five hours per month is required in this activity in order to constitute participation.
Short-Term Unsubsidized Employment: Short term unsubsidized employment is any
unsubsidized employment that is deemed short term or temporary, is intended to prepare an individual for a long-term unsubsidized employment placement, and is designed to improve an enrollee’s occupational skills for those enrollees who are determined to be deficient in occupational skills. A minimum of five hours per month is required in this activity in order to constitute participation. This is not considered a placement, but rather a pre-placement activity.
Sports/Recreation: Sports/recreation is a youth development activity consisting of any type of
sport or other recreational opportunity that is developed by or in partnership with the YO program. A minimum of five hours per month is required in this activity in order to constitute participation.
Support Group(s): Support groups are a youth development activity consisting of at least five
hours of specific types of counseling or communication opportunities facilitated by a YO staff member focusing on specific issue areas experienced by enrollees. Activities supportive of a larger program are counted in that program. Stand alone services that are not intensive in nature are not counted as enrolling activities for reporting purposes.
Decision Information Resources, Inc. 43 YO Grants—MIS Report
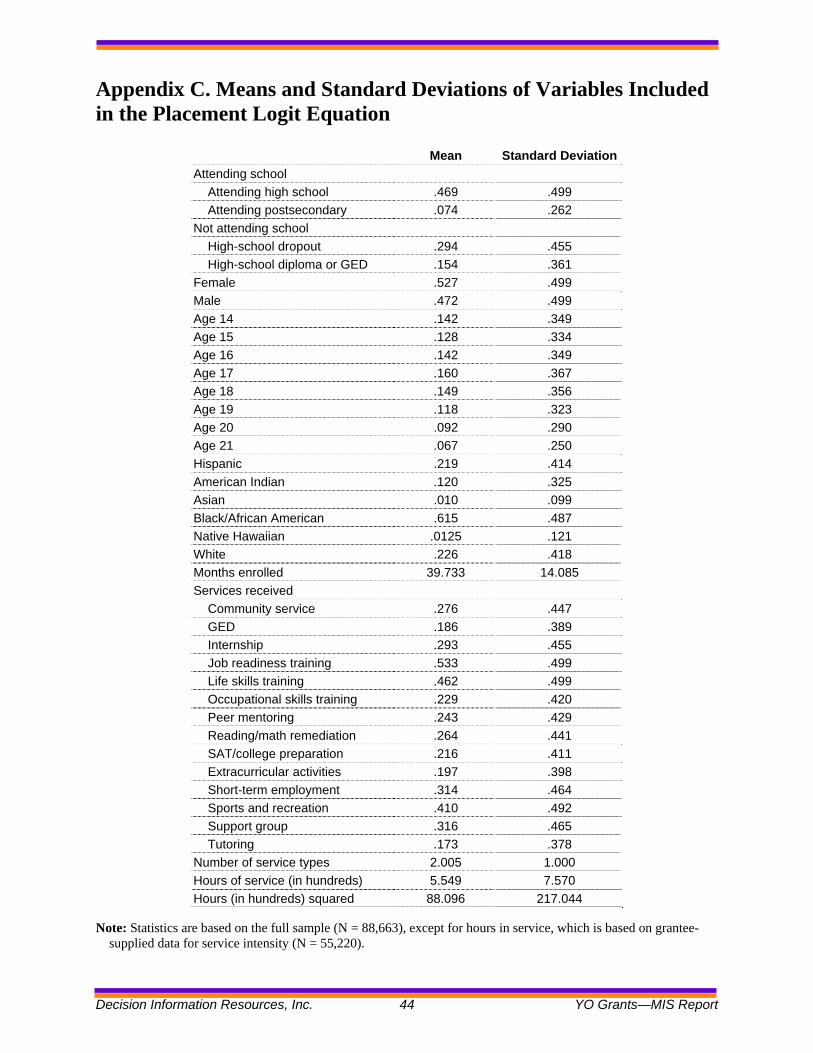
Appendix C. Means and Standard Deviations of Variables Included in the Placement Logit Equation
Mean Standard Deviation Attending school
Attending high school .469 .499 Attending postsecondary .074 .262
Not attending school High-school dropout .294 .455 High-school diploma or GED .154 .361
Female .527 .499 Male .472 .499 Age 14 .142 .349 Age 15 .128 .334 Age 16 .142 .349 Age 17 .160 .367 Age 18 .149 .356 Age 19 .118 .323 Age 20 .092 .290 Age 21 .067 .250 Hispanic .219 .414 American Indian .120 .325 Asian .010 .099 Black/African American .615 .487 Native Hawaiian .0125 .121 White .226 .418 Months enrolled 39.733 14.085 Services received
Community service .276 .447 GED .186 .389 Internship .293 .455 Job readiness training .533 .499 Life skills training .462 .499 Occupational skills training .229 .420 Peer mentoring .243 .429 Reading/math remediation .264 .441 SAT/college preparation .216 .411 Extracurricular activities .197 .398 Short-term employment .314 .464 Sports and recreation .410 .492 Support group .316 .465 Tutoring .173 .378
Number of service types 2.005 1.000 Hours of service (in hundreds) 5.549 7.570 Hours (in hundreds) squared 88.096 217.044
Note: Statistics are based on the full sample (N = 88,663), except for hours in service, which is based on grantee-
supplied data for service intensity (N = 55,220).
Decision Information Resources, Inc. 44 YO Grants—MIS Report