Embed Size (px)
Citation preview
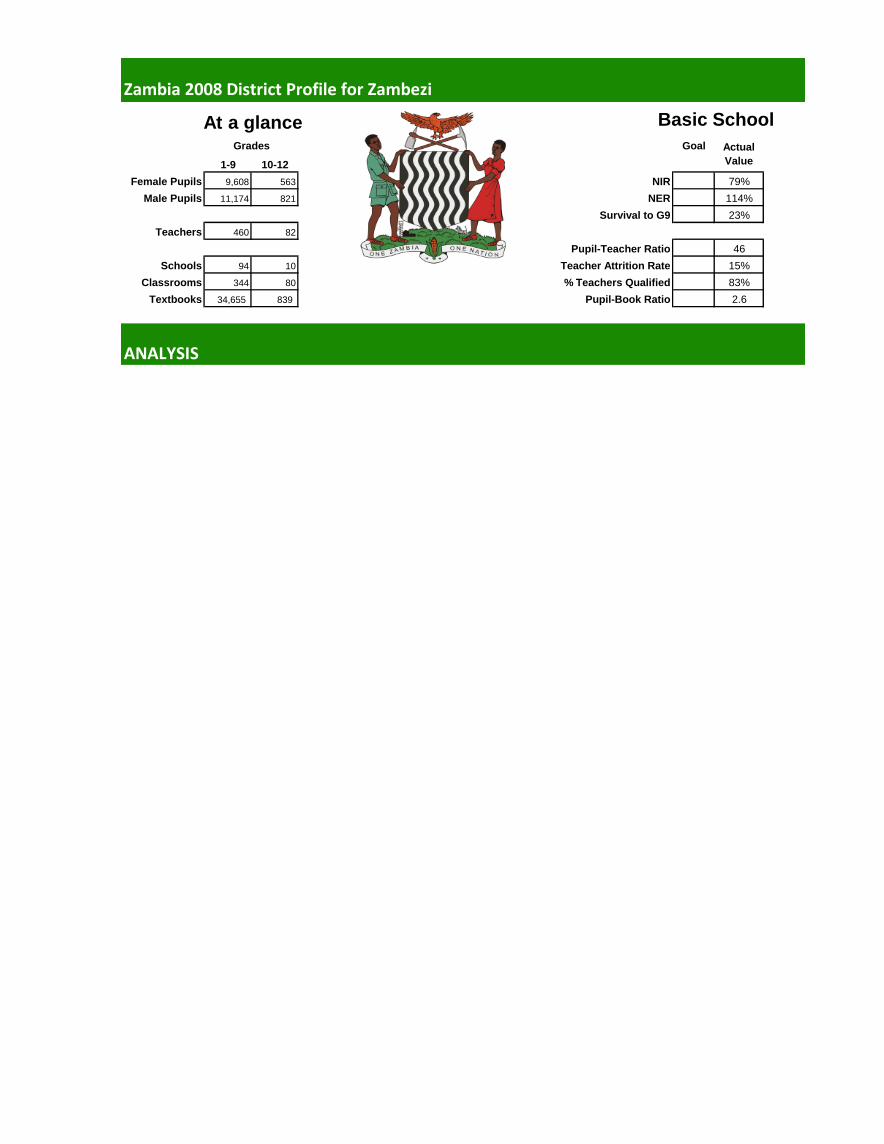
Zambia 2008 District Profile for Zambezi
Goal
1-9 10-12
Female Pupils 9,608 563 NIR 79%
Male Pupils 11,174 821 NER 114%
Survival to G9 23%
Teachers 460 82
Pupil-Teacher Ratio 46
Schools 94 10 Teacher Attrition Rate 15%
Classrooms 344 80 % Teachers Qualified 83%
Textbooks 34,655 839 Pupil-Book Ratio 2.6
ANALYSIS
Grades Actual
Value
Basic School At a glance
Issue #1: Progress in primary school enrolment in Zambezi
Since 2005 in Zambezi:
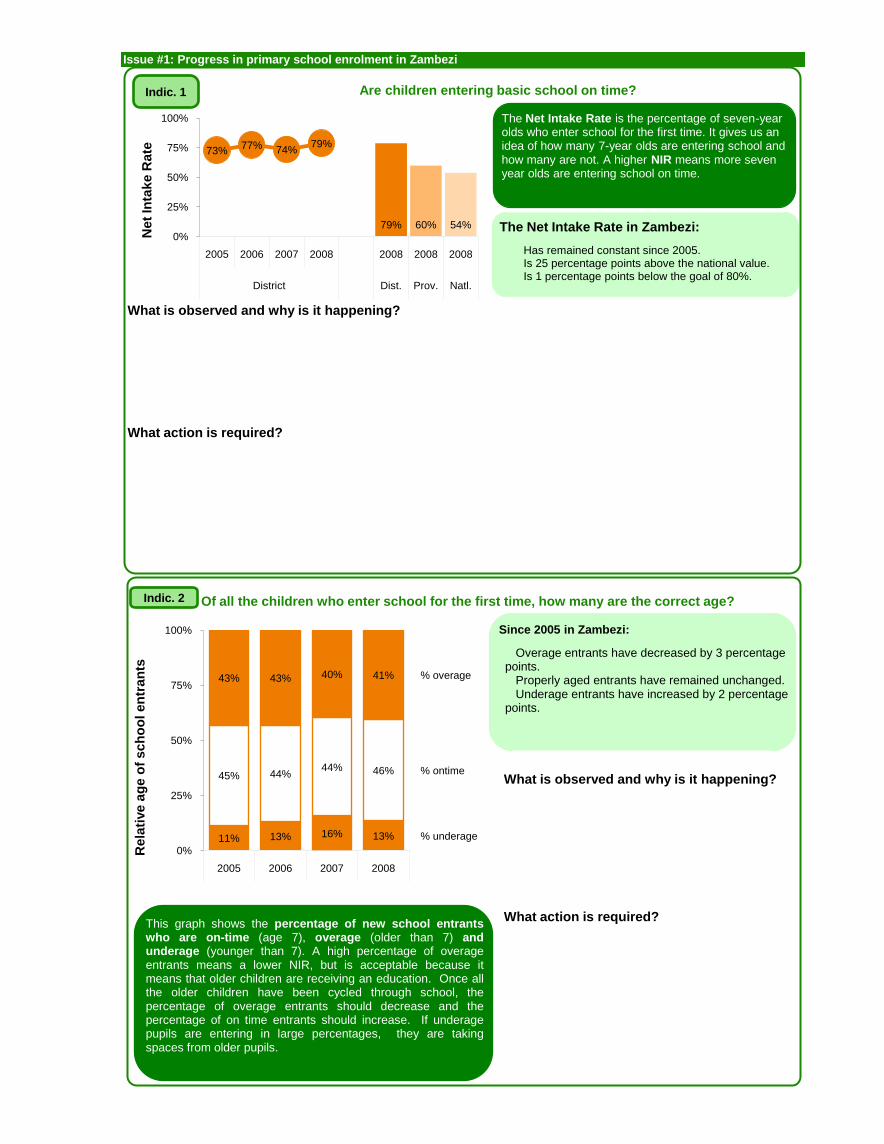
The Net Intake Rate is the percentage of seven-year olds who enter school for the first time. It gives us an idea of how many 7-year olds are entering school and how many are not. A higher NIR means more seven year olds are entering school on time.
What is observed and why is it happening?
What action is required?
Are children entering basic school on time?
Net
Inta
ke R
ate
The Net Intake Rate in Zambezi:
Has remained constant since 2005.Is 25 percentage points above the national value.Is 1 percentage points below the goal of 80%.
79% 60% 54%
73%77% 74%
79%
0%
25%
50%
75%
100%
2005 2006 2007 2008 2008 2008 2008
District Dist. Prov. Natl.
Indic. 1
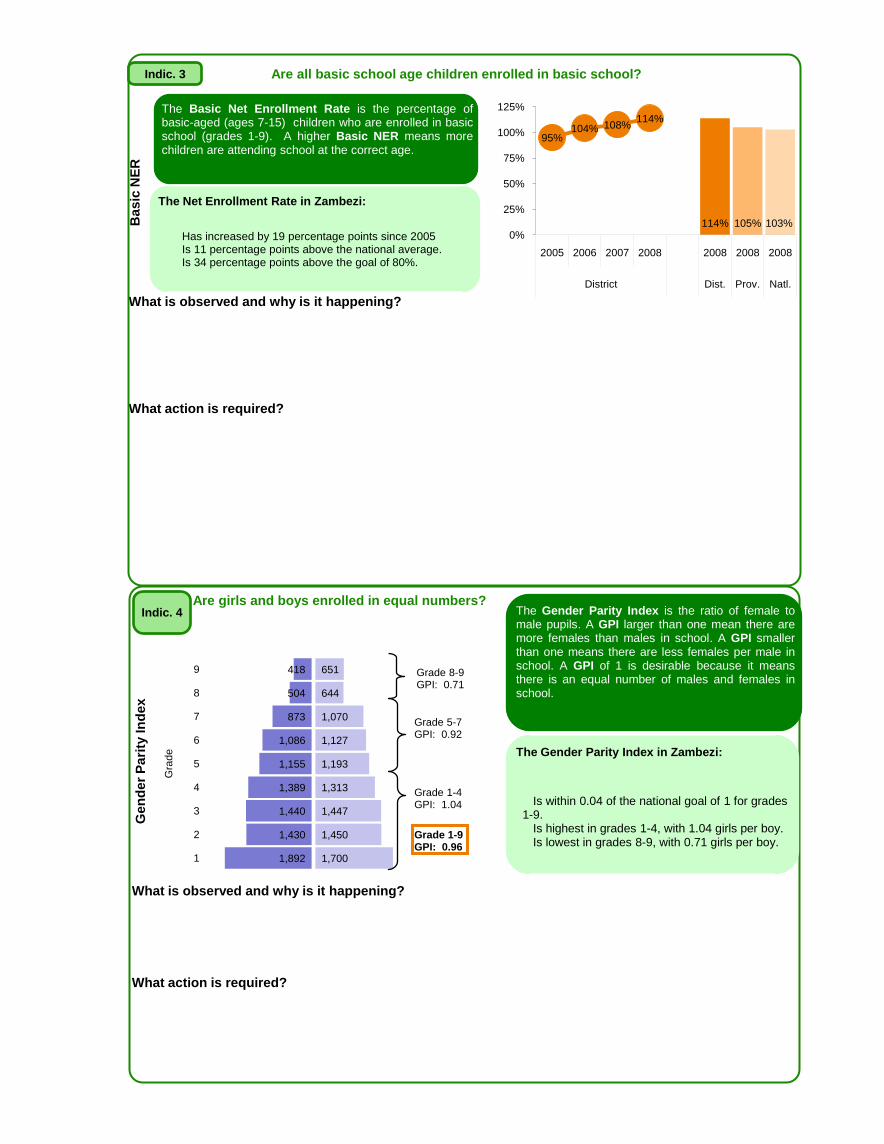
This graph shows the percentage of new school entrantswho are on-time (age 7), overage (older than 7) andunderage (younger than 7). A high percentage of overageentrants means a lower NIR, but is acceptable because itmeans that older children are receiving an education. Once allthe older children have been cycled through school, thepercentage of overage entrants should decrease and thepercentage of on time entrants should increase. If underagepupils are entering in large percentages, they are takingspaces from older pupils.
Of all the children who enter school for the first time, how many are the correct age?Indic. 2
What is observed and why is it happening?
What action is required?
11% 13% 16% 13%
45% 44%44% 46%
43% 43% 40% 41%
% underage
% ontime
% overage
0%
25%
50%
75%
100%
2005 2006 2007 2008
Overage entrants have decreased by 3 percentage points.
Properly aged entrants have remained unchanged.Underage entrants have increased by 2 percentage
points.
Rela
tive a
ge
of
sc
ho
ol en
tra
nts
What is observed and why is it happening?
What action is required?
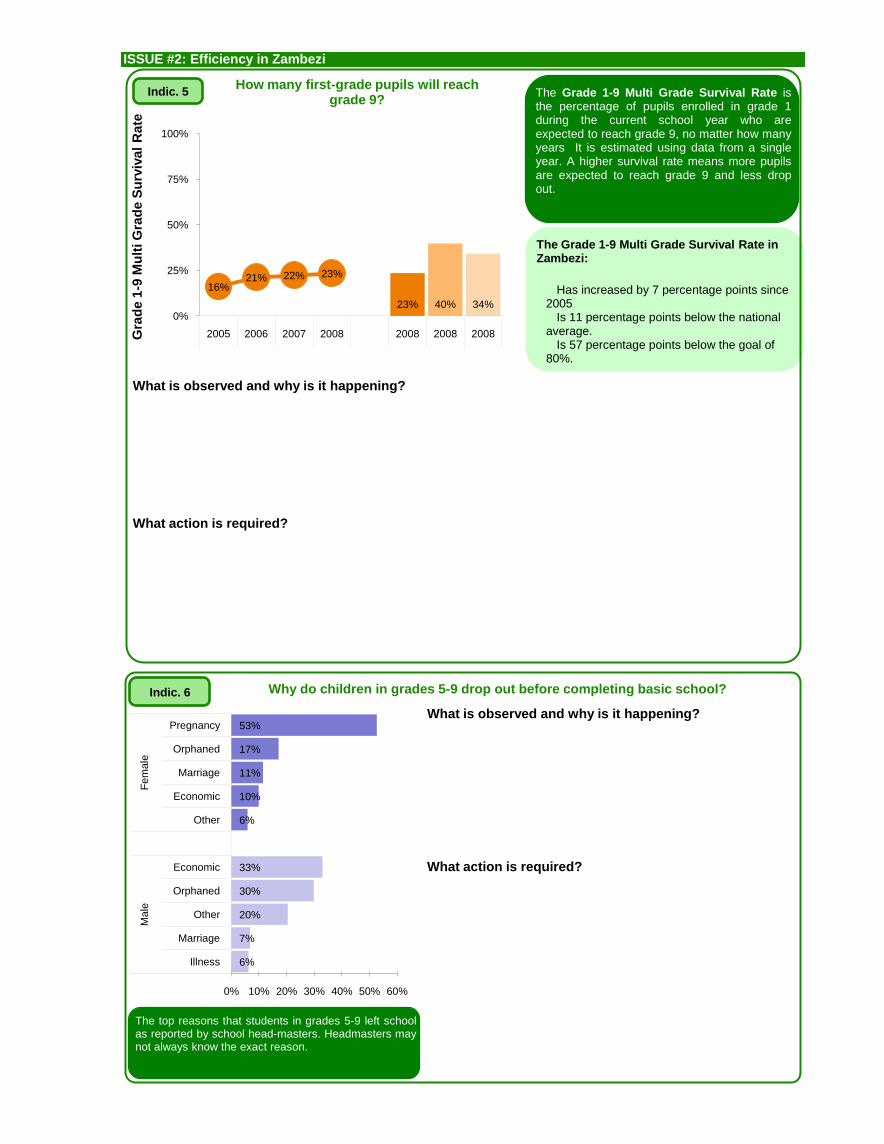
Are all basic school age children enrolled in basic school?
Ba
sic
NE
R
The Net Enrollment Rate in Zambezi:
Has increased by 19 percentage points since 2005Is 11 percentage points above the national average.Is 34 percentage points above the goal of 80%.
114% 105% 103%
95%104% 108%
114%
0%
25%
50%
75%
100%
125%
2005 2006 2007 2008 2008 2008 2008
District Dist. Prov. Natl.
The Basic Net Enrollment Rate is the percentage ofbasic-aged (ages 7-15) children who are enrolled in basicschool (grades 1-9). A higher Basic NER means morechildren are attending school at the correct age.
Indic. 3
1,700
1,450
1,447
1,313
1,193
1,127
1,070
644
651
1,892
1,430
1,440
1,389
1,155
1,086
873
504
418
1
2
3
4
5
6
7
8
9
Gra
de
Are girls and boys enrolled in equal numbers?Indic. 4
The Gender Parity Index in Zambezi:
Is within 0.04 of the national goal of 1 for grades 1-9.
Is highest in grades 1-4, with 1.04 girls per boy.Is lowest in grades 8-9, with 0.71 girls per boy.
The Gender Parity Index is the ratio of female tomale pupils. A GPI larger than one mean there aremore females than males in school. A GPI smallerthan one means there are less females per male inschool. A GPI of 1 is desirable because it meansthere is an equal number of males and females inschool.
What is observed and why is it happening?
What action is required?
Ge
nd
er
Pari
ty In
dex
Grade 1-9GPI: 0.96
Grade 8-9GPI: 0.71
Grade 5-7GPI: 0.92
Grade 1-4GPI: 1.04
ISSUE #2: Efficiency in Zambezi
The Grade 1-9 Multi Grade Survival Rate isthe percentage of pupils enrolled in grade 1during the current school year who areexpected to reach grade 9, no matter how manyyears It is estimated using data from a singleyear. A higher survival rate means more pupilsare expected to reach grade 9 and less dropout.
What is observed and why is it happening?
What action is required?
How many first-grade pupils will reach grade 9?
Gra
de
1-9
Mu
lti G
rad
e S
urv
iva
l R
ate
The top reasons that students in grades 5-9 left schoolas reported by school head-masters. Headmasters maynot always know the exact reason.
What is observed and why is it happening?
What action is required?
Why do children in grades 5-9 drop out before completing basic school?
The Grade 1-9 Multi Grade Survival Rate in Zambezi:
Has increased by 7 percentage points since 2005
Is 11 percentage points below the national average.
Is 57 percentage points below the goal of 80%.
23% 40% 34%
16%21% 22% 23%
0%
25%
50%
75%
100%
2005 2006 2007 2008 2008 2008 2008
Indic. 5
Indic. 6
6%
7%
20%
30%
33%
6%
10%
11%
17%
53%
0% 10% 20% 30% 40% 50% 60%
Illness
Marriage
Other
Orphaned
Economic
Other
Economic
Marriage
Orphaned
Pregnancy
Male
Fem
ale
100%
80%
112%
108%
59%
56%
92%
73%
44%
Urban
100%
82%
79%
68%
58%
48%
40%
23%
23%
Rural
100% 50% 0 50% 100%
Grade 1
Grade 2
Grade 3
Grade 4
Grade 5
Grade 6
Grade 7
Grade 8
Grade 9
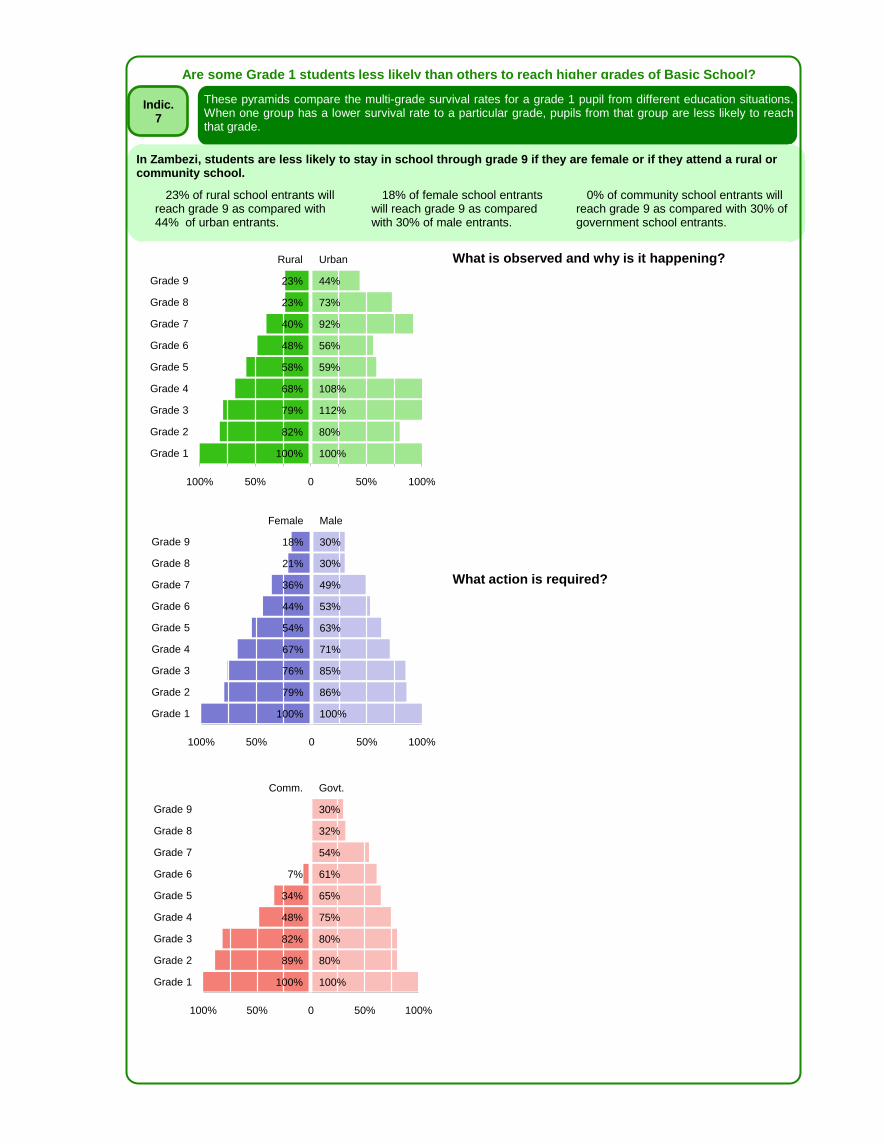
Are some Grade 1 students less likely than others to reach higher grades of Basic School?
These pyramids compare the multi-grade survival rates for a grade 1 pupil from different education situations.When one group has a lower survival rate to a particular grade, pupils from that group are less likely to reachthat grade.
What is observed and why is it happening?
What action is required?
In Zambezi, students are less likely to stay in school through grade 9 if they are female or if they attend a rural or community school.
23% of rural school entrants will reach grade 9 as compared with 44% of urban entrants.
18% of female school entrants will reach grade 9 as compared with 30% of male entrants.
0% of community school entrants will reach grade 9 as compared with 30% of government school entrants.
Indic.7
100%
86%
85%
71%
63%
53%
49%
30%
30%
Male
100%
79%
76%
67%
54%
44%
36%
21%
18%
Female
100% 50% 0 50% 100%
Grade 1
Grade 2
Grade 3
Grade 4
Grade 5
Grade 6
Grade 7
Grade 8
Grade 9
100%
80%
80%
75%
65%
61%
54%
32%
30%
Govt.
100%
89%
82%
48%
34%
7%
Comm.
100% 50% 0 50% 100%
Grade 1
Grade 2
Grade 3
Grade 4
Grade 5
Grade 6
Grade 7
Grade 8
Grade 9
ISSUE #3: Are children learning?
What is observed and why is it happening?
What action is required?
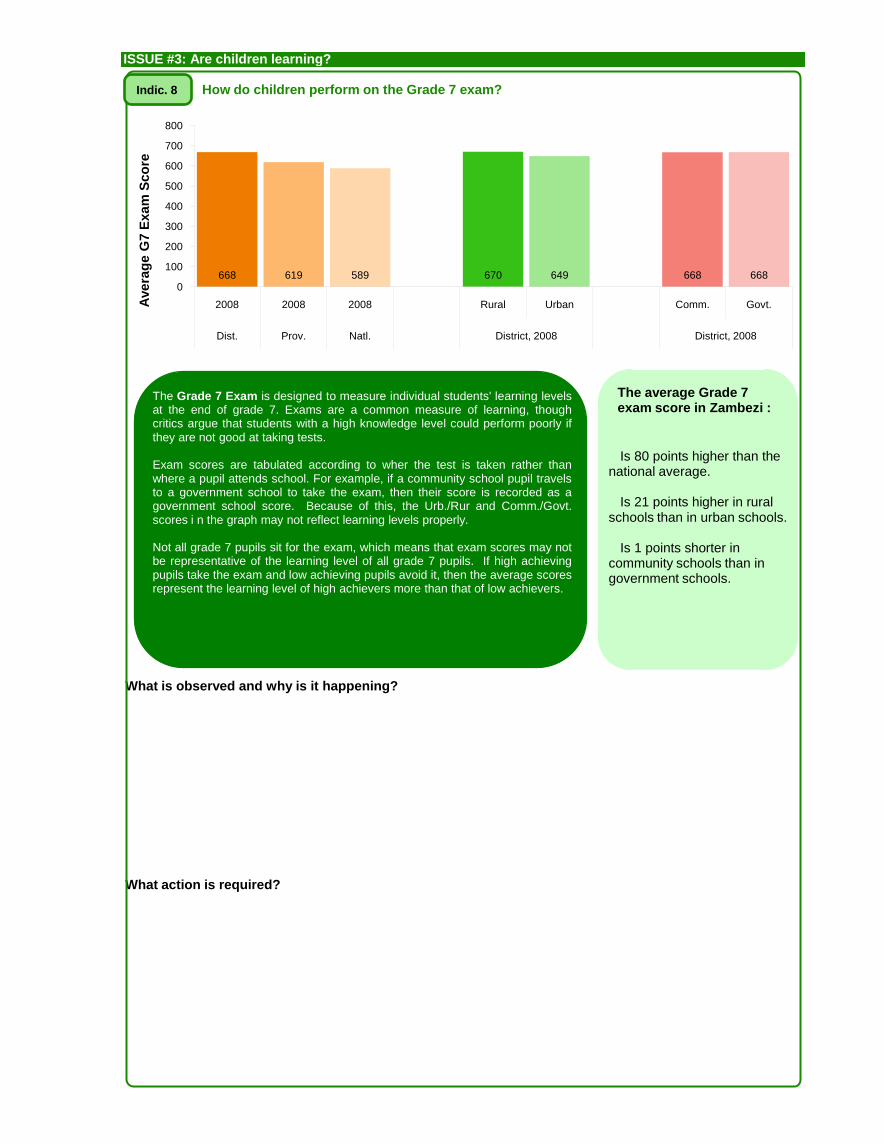
How do children perform on the Grade 7 exam?
The Grade 7 Exam is designed to measure individual students' learning levelsat the end of grade 7. Exams are a common measure of learning, thoughcritics argue that students with a high knowledge level could perform poorly ifthey are not good at taking tests.
Exam scores are tabulated according to wher the test is taken rather thanwhere a pupil attends school. For example, if a community school pupil travelsto a government school to take the exam, then their score is recorded as agovernment school score. Because of this, the Urb./Rur and Comm./Govt.scores i n the graph may not reflect learning levels properly.
Not all grade 7 pupils sit for the exam, which means that exam scores may notbe representative of the learning level of all grade 7 pupils. If high achievingpupils take the exam and low achieving pupils avoid it, then the average scoresrepresent the learning level of high achievers more than that of low achievers.
The average Grade 7 exam score in Zambezi :
Is 80 points higher than the national average.
Is 21 points higher in rural schools than in urban schools.
Is 1 points shorter in community schools than in government schools.
Indic. 8
668 619 589 670 649 668 6680
100
200
300
400
500
600
700
800
2008 2008 2008 Rural Urban Comm. Govt.
Dist. Prov. Natl. District, 2008 District, 2008
Avera
ge
G7
Exa
m S
co
re
Issue #4: How are school resources distributed in Zambezi ?
What is observed and why is it happening?
What action is required?
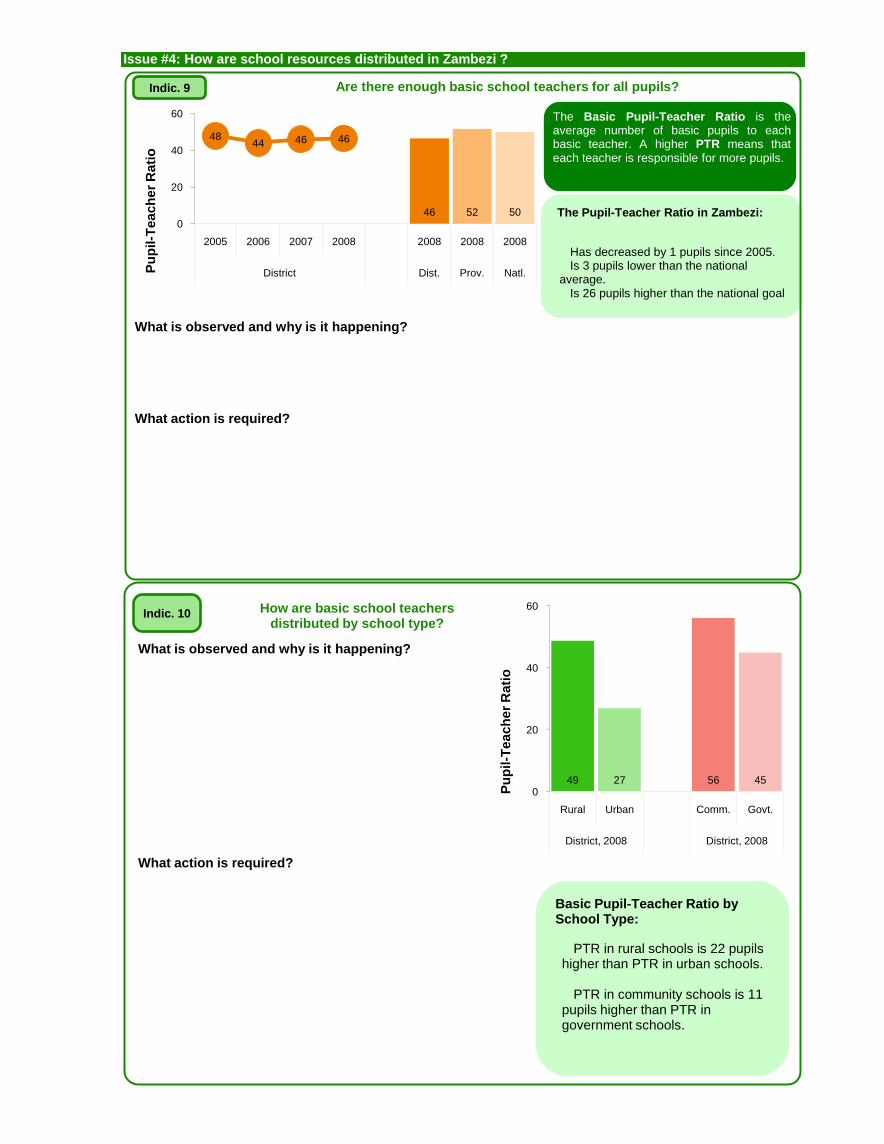
Are there enough basic school teachers for all pupils?
Pu
pil-T
ea
ch
er
Rati
o
How are basic school teachersdistributed by school type?
What is observed and why is it happening?
What action is required?
The Basic Pupil-Teacher Ratio is theaverage number of basic pupils to eachbasic teacher. A higher PTR means thateach teacher is responsible for more pupils.
The Pupil-Teacher Ratio in Zambezi:
Has decreased by 1 pupils since 2005.Is 3 pupils lower than the national
average.Is 26 pupils higher than the national goal
Basic Pupil-Teacher Ratio by School Type:
PTR in rural schools is 22 pupils higher than PTR in urban schools.
PTR in community schools is 11 pupils higher than PTR in government schools.
46 52 50
4844 46 46
0
20
40
60
2005 2006 2007 2008 2008 2008 2008
District Dist. Prov. Natl.
49 27 56 450
20
40
60
Rural Urban Comm. Govt.
District, 2008 District, 2008
Indic. 9
Indic. 10
Pu
pil-T
ea
ch
er
Rati
o
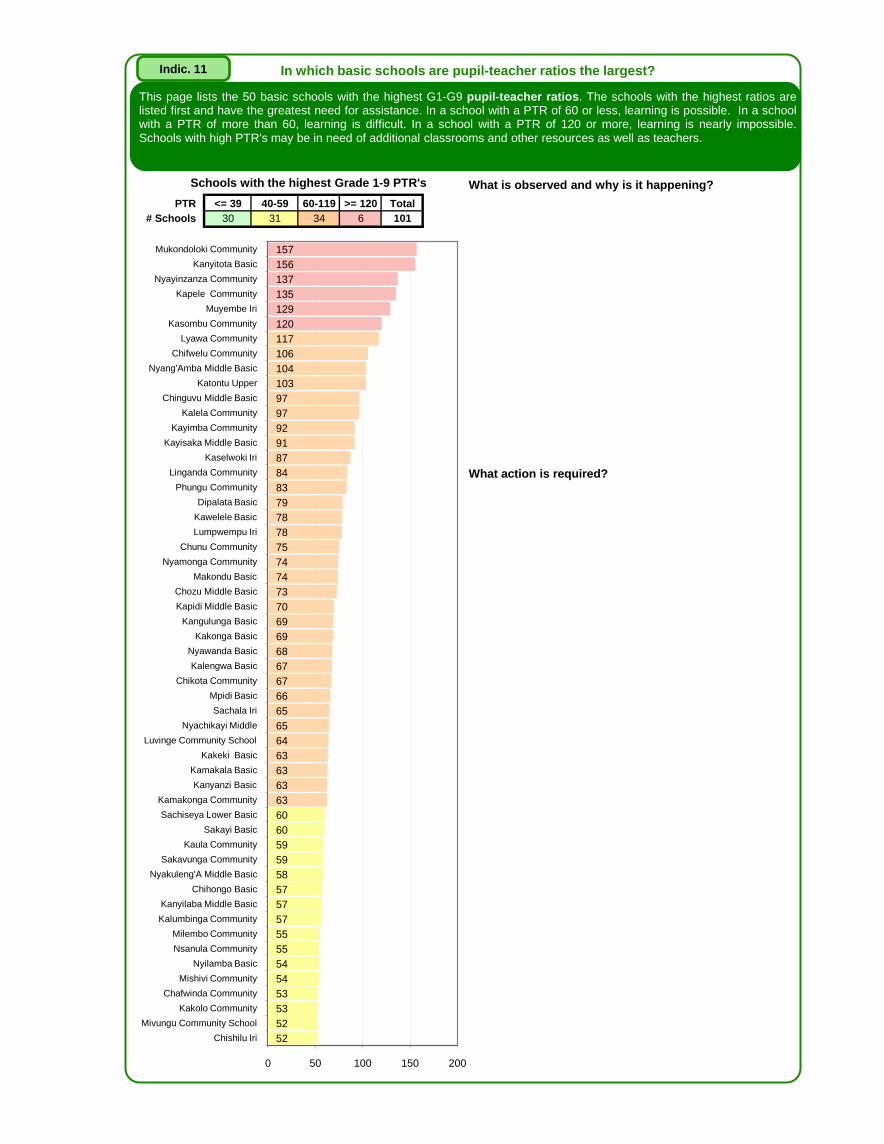
<= 39 40-59 60-119 >= 120 Total
30 31 34 6 101
PTR
# Schools
120
129
135
137
156
157
52
52
53
53
54
54
55
55
57
57
57
58
59
59
60
60
63
63
63
63
64
65
65
66
67
67
68
69
69
70
73
74
74
75
78
78
79
83
84
87
91
92
97
97
103
104
106
117
0 50 100 150 200
Chishilu Iri
Mivungu Community School
Kakolo Community
Chafwinda Community
Mishivi Community
Nyilamba Basic
Nsanula Community
Milembo Community
Kalumbinga Community
Kanyilaba Middle Basic
Chihongo Basic
Nyakuleng'A Middle Basic
Sakavunga Community
Kaula Community
Sakayi Basic
Sachiseya Lower Basic
Kamakonga Community
Kanyanzi Basic
Kamakala Basic
Kakeki Basic
Luvinge Community School
Nyachikayi Middle
Sachala Iri
Mpidi Basic
Chikota Community
Kalengwa Basic
Nyawanda Basic
Kakonga Basic
Kangulunga Basic
Kapidi Middle Basic
Chozu Middle Basic
Makondu Basic
Nyamonga Community
Chunu Community
Lumpwempu Iri
Kawelele Basic
Dipalata Basic
Phungu Community
Linganda Community
Kaselwoki Iri
Kayisaka Middle Basic
Kayimba Community
Kalela Community
Chinguvu Middle Basic
Katontu Upper
Nyang'Amba Middle Basic
Chifwelu Community
Lyawa Community
Kasombu Community
Muyembe Iri
Kapele Community
Nyayinzanza Community
Kanyitota Basic
Mukondoloki Community
Schools with the highest Grade 1-9 PTR's
In which basic schools are pupil-teacher ratios the largest?
What is observed and why is it happening?
What action is required?
Indic. 11
This page lists the 50 basic schools with the highest G1-G9 pupil-teacher ratios. The schools with the highest ratios arelisted first and have the greatest need for assistance. In a school with a PTR of 60 or less, learning is possible. In a schoolwith a PTR of more than 60, learning is difficult. In a school with a PTR of 120 or more, learning is nearly impossible.Schools with high PTR's may be in need of additional classrooms and other resources as well as teachers.
Tea
ch
er
Att
riti
on
Rate
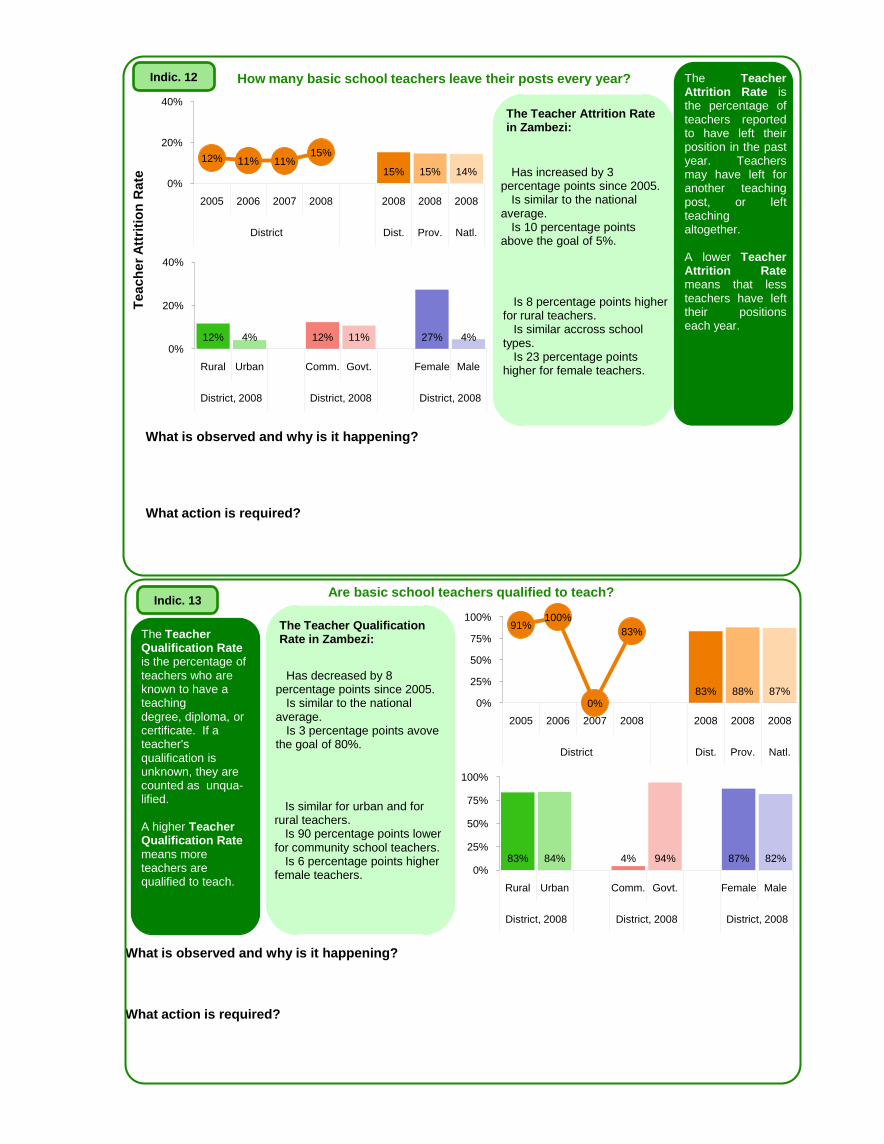
How many basic school teachers leave their posts every year? The TeacherAttrition Rate isthe percentage ofteachers reportedto have left theirposition in the pastyear. Teachersmay have left foranother teachingpost, or leftteachingaltogether.
A lower TeacherAttrition Ratemeans that lessteachers have lefttheir positionseach year.
What is observed and why is it happening?
What action is required?
Are basic school teachers qualified to teach?
The Teacher Qualification Rateis the percentage of teachers who are known to have a teaching degree, diploma, or certificate. If a teacher's qualification is unknown, they are counted as unqua-lified.
A higher Teacher Qualification Rate means more teachers are qualified to teach.
What is observed and why is it happening?
What action is required?
12% 4% 12% 11% 27% 4%0%
20%
40%
Rural Urban Comm. Govt. Female Male
District, 2008 District, 2008 District, 2008
15% 15% 14%
12% 11% 11%15%
0%
20%
40%
2005 2006 2007 2008 2008 2008 2008
District Dist. Prov. Natl.
83% 84% 4% 94% 87% 82%0%
25%
50%
75%
100%
Rural Urban Comm. Govt. Female Male
District, 2008 District, 2008 District, 2008
83% 88% 87%
91%100%
0%
83%
0%
25%
50%
75%
100%
2005 2006 2007 2008 2008 2008 2008
District Dist. Prov. Natl.
The Teacher Attrition Rate in Zambezi:
Has increased by 3 percentage points since 2005.
Is similar to the national average.
Is 10 percentage points above the goal of 5%.
Is 8 percentage points higher for rural teachers.
Is similar accross school types.
Is 23 percentage points higher for female teachers.
The Teacher Qualification Rate in Zambezi:
Has decreased by 8 percentage points since 2005.
Is similar to the national average.
Is 3 percentage points avove the goal of 80%.
Is similar for urban and for rural teachers.
Is 90 percentage points lower for community school teachers.
Is 6 percentage points higher female teachers.
Indic. 12
Indic. 13
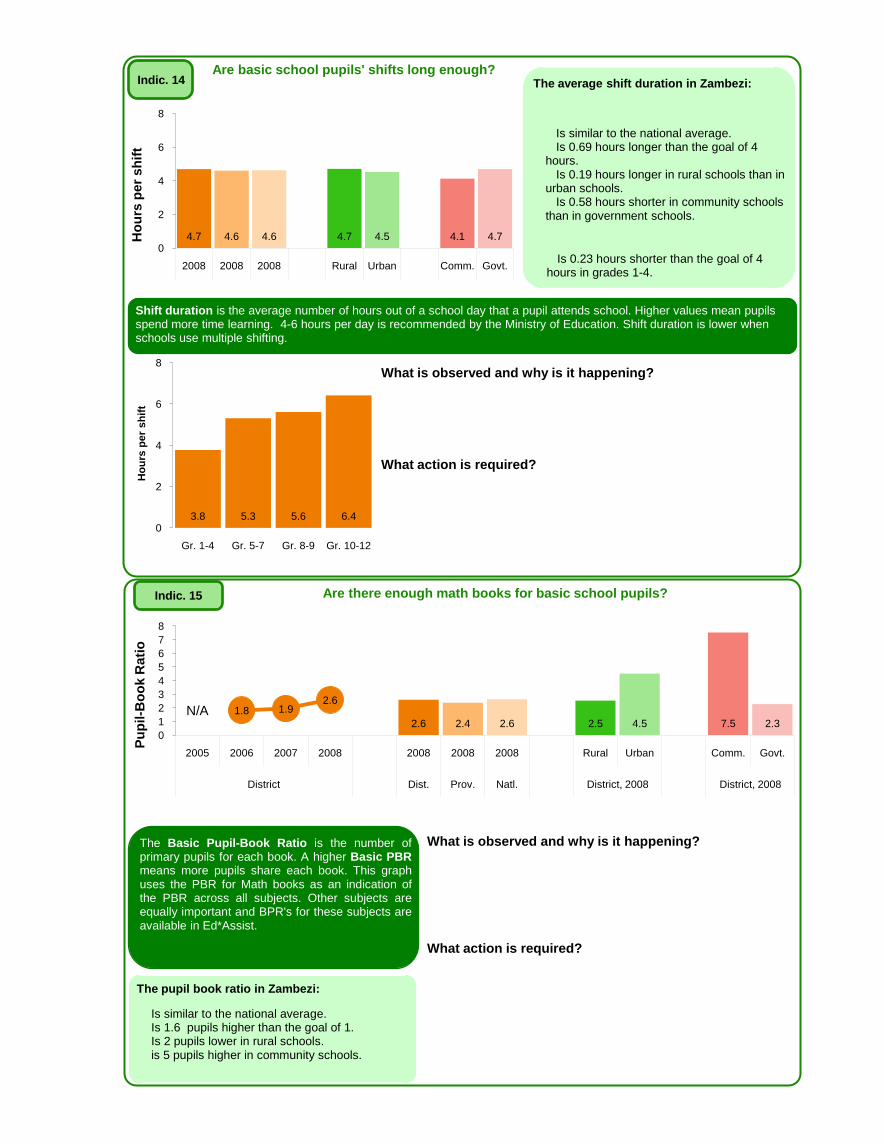
Are there enough math books for basic school pupils?
Pu
pil-B
oo
k R
ati
o
The Basic Pupil-Book Ratio is the number ofprimary pupils for each book. A higher Basic PBRmeans more pupils share each book. This graphuses the PBR for Math books as an indication ofthe PBR across all subjects. Other subjects areequally important and BPR's for these subjects areavailable in Ed*Assist.
What is observed and why is it happening?
What action is required?
The pupil book ratio in Zambezi:
Is similar to the national average.Is 1.6 pupils higher than the goal of 1.Is 2 pupils lower in rural schools.is 5 pupils higher in community schools.
Indic. 15
2.6 2.4 2.6 2.5 4.5 7.5 2.3N/A 1.8 1.9
2.6
0
1
2
3
4
5
6
7
8
2005 2006 2007 2008 2008 2008 2008 Rural Urban Comm. Govt.
District Dist. Prov. Natl. District, 2008 District, 2008
3.8 5.3 5.6 6.40
2
4
6
8
Gr. 1-4 Gr. 5-7 Gr. 8-9 Gr. 10-12
Ho
urs
per
sh
ift
4.7 4.6 4.6 4.7 4.5 4.1 4.70
2
4
6
8
2008 2008 2008 Rural Urban Comm. Govt.
Ho
urs
pe
r s
hif
t
Are basic school pupils' shifts long enough?
Shift duration is the average number of hours out of a school day that a pupil attends school. Higher values mean pupils spend more time learning. 4-6 hours per day is recommended by the Ministry of Education. Shift duration is lower when schools use multiple shifting.
What is observed and why is it happening?
What action is required?
Indic. 14 The average shift duration in Zambezi:
Is similar to the national average.Is 0.69 hours longer than the goal of 4
hours.Is 0.19 hours longer in rural schools than in
urban schools.Is 0.58 hours shorter in community schools
than in government schools.
Is 0.23 hours shorter than the goal of 4 hours in grades 1-4.
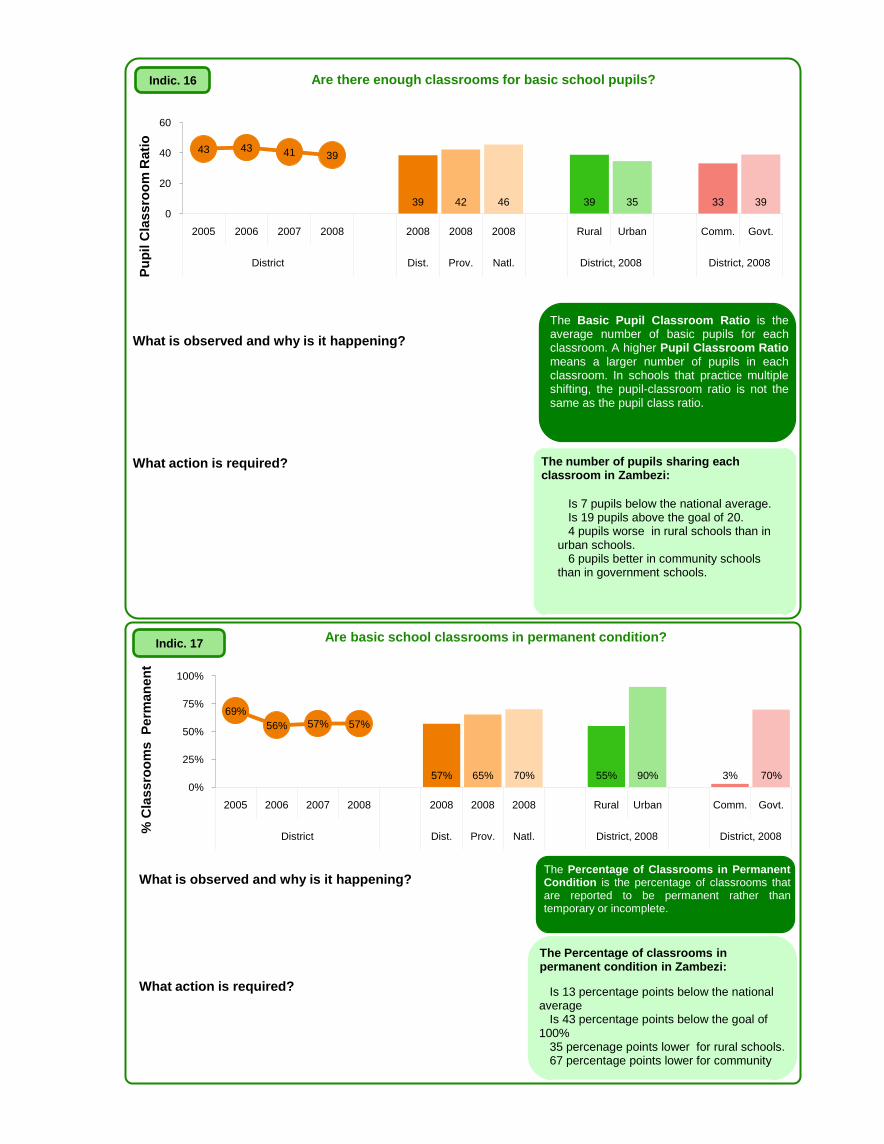
Are there enough classrooms for basic school pupils?
Pu
pil C
las
sro
om
Rati
o
The Basic Pupil Classroom Ratio is theaverage number of basic pupils for eachclassroom. A higher Pupil Classroom Ratiomeans a larger number of pupils in eachclassroom. In schools that practice multipleshifting, the pupil-classroom ratio is not thesame as the pupil class ratio.
What is observed and why is it happening?
What action is required?
Are basic school classrooms in permanent condition?
% C
las
sro
om
s P
erm
an
en
t
The Percentage of Classrooms in PermanentCondition is the percentage of classrooms thatare reported to be permanent rather thantemporary or incomplete.
What is observed and why is it happening?
What action is required?
Indic. 16
Indic. 17
The number of pupils sharing each classroom in Zambezi:
Is 7 pupils below the national average.Is 19 pupils above the goal of 20.4 pupils worse in rural schools than in
urban schools.6 pupils better in community schools
than in government schools.
The Percentage of classrooms in permanent condition in Zambezi:
Is 13 percentage points below the national average
Is 43 percentage points below the goal of 100%
35 percenage points lower for rural schools.67 percentage points lower for community
39 42 46 39 35 33 39
43 43 41 39
0
20
40
60
2005 2006 2007 2008 2008 2008 2008 Rural Urban Comm. Govt.
District Dist. Prov. Natl. District, 2008 District, 2008
57% 65% 70% 55% 90% 3% 70%
69%
56% 57% 57%
0%
25%
50%
75%
100%
2005 2006 2007 2008 2008 2008 2008 Rural Urban Comm. Govt.
District Dist. Prov. Natl. District, 2008 District, 2008
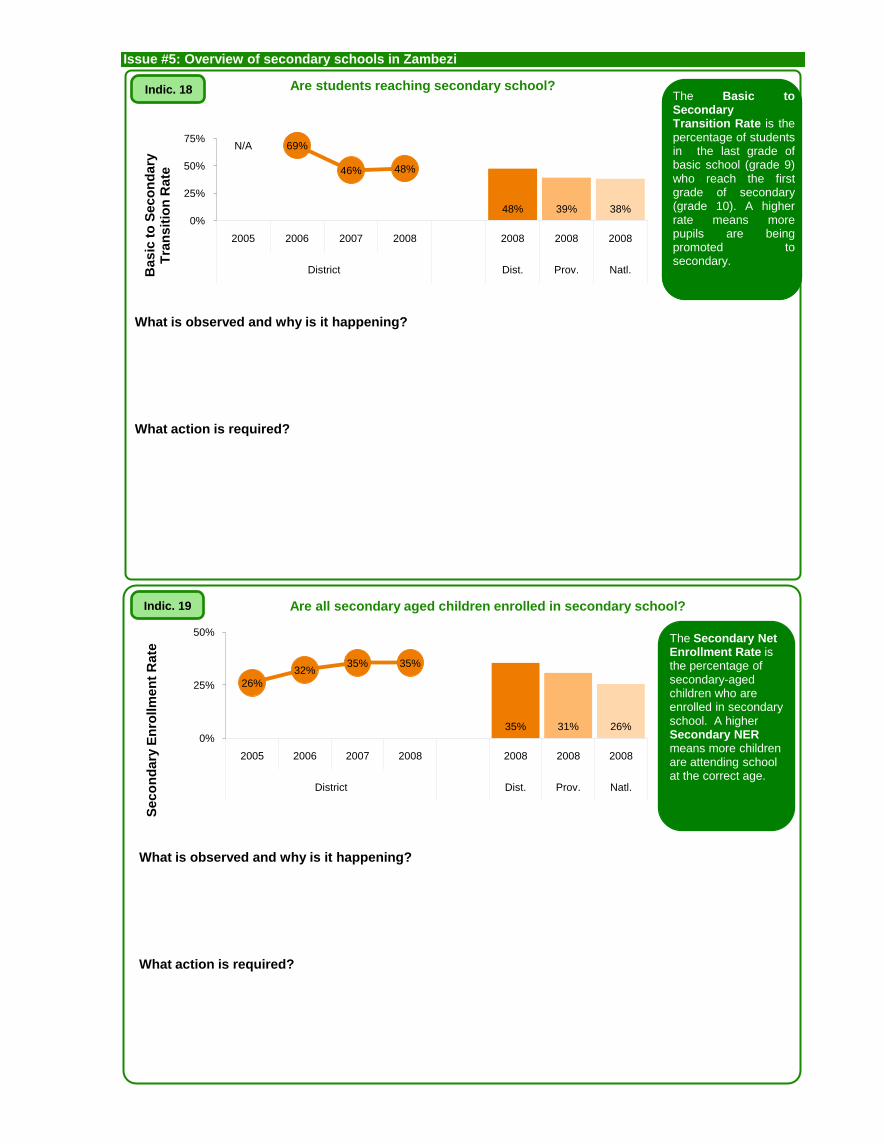
Issue #5: Overview of secondary schools in Zambezi
48% 39% 38%
N/A 69%
46% 48%
0%
25%
50%
75%
2005 2006 2007 2008 2008 2008 2008
District Dist. Prov. Natl.
35% 31% 26%
26%
32%35% 35%
0%
25%
50%
2005 2006 2007 2008 2008 2008 2008
District Dist. Prov. Natl.
Bas
ic t
o S
ec
on
dary
T
ran
sit
ion
Ra
teS
ec
on
dary
En
rollm
en
t R
ate
Indic. 18
Indic. 19
Are students reaching secondary school?
Are all secondary aged children enrolled in secondary school?
The Basic toSecondaryTransition Rate is thepercentage of studentsin the last grade ofbasic school (grade 9)who reach the firstgrade of secondary(grade 10). A higherrate means morepupils are beingpromoted tosecondary.
What is observed and why is it happening?
What action is required?
The Secondary Net Enrollment Rate is the percentage of secondary-aged children who are enrolled in secondary school. A higher Secondary NERmeans more children are attending school at the correct age.
What is observed and why is it happening?
What action is required?
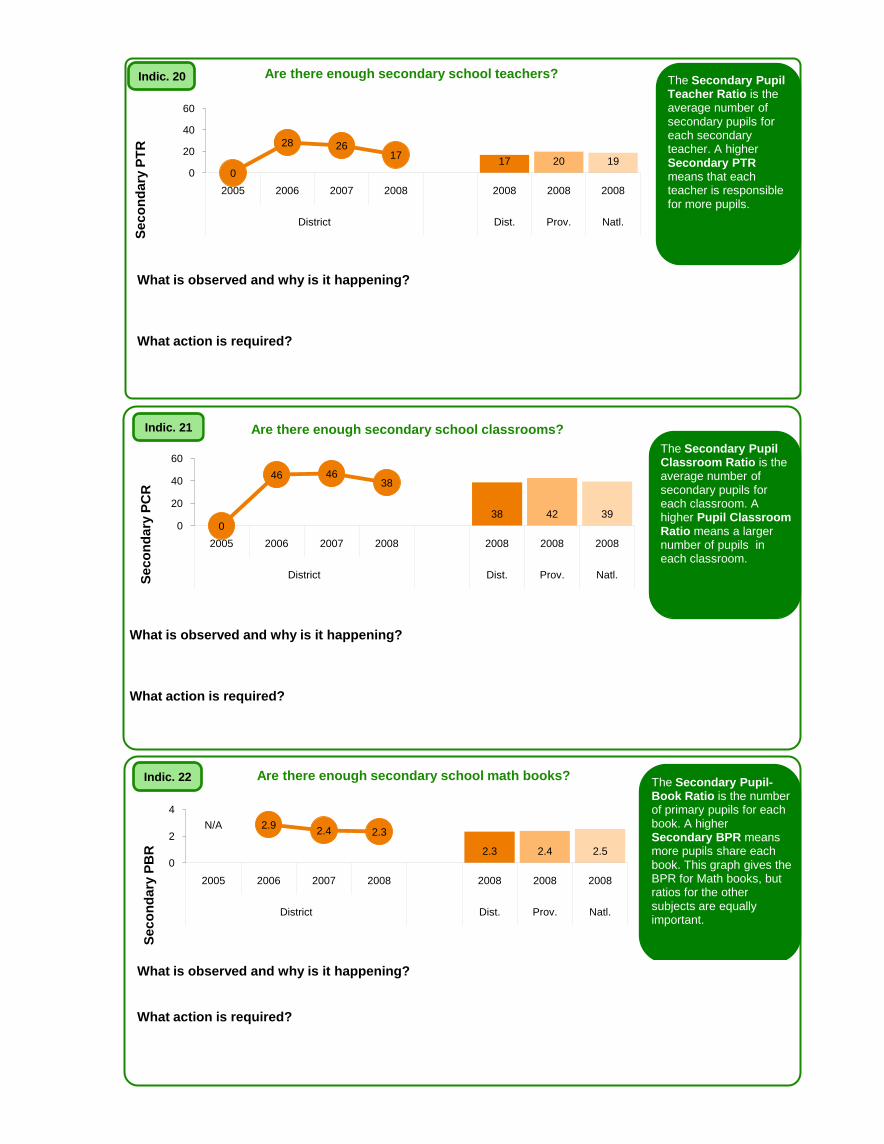
Sec
on
dary
PT
RS
ec
on
da
ry P
CR
Sec
on
dary
PB
R
Indic. 20
Indic. 21
Indic. 22
Are there enough secondary school teachers?
Are there enough secondary school classrooms?
Are there enough secondary school math books?
The Secondary Pupil Teacher Ratio is the average number of secondary pupils for each secondary teacher. A higher Secondary PTR means that each teacher is responsible for more pupils.
The Secondary Pupil-Book Ratio is the number of primary pupils for each book. A higher Secondary BPR means more pupils share each book. This graph gives the BPR for Math books, but ratios for the other subjects are equally important.
The Secondary Pupil Classroom Ratio is the average number of secondary pupils for each classroom. A higher Pupil Classroom Ratio means a larger number of pupils in each classroom.
What is observed and why is it happening?
What action is required?
What is observed and why is it happening?
What action is required?
What is observed and why is it happening?
What action is required?
2.3 2.4 2.5
N/A 2.92.4 2.3
0
2
4
2005 2006 2007 2008 2008 2008 2008
District Dist. Prov. Natl.
17 20 190
28 2617
0
20
40
60
2005 2006 2007 2008 2008 2008 2008
District Dist. Prov. Natl.
38 42 390
46 4638
0
20
40
60
2005 2006 2007 2008 2008 2008 2008
District Dist. Prov. Natl.