Embed Size (px)
Citation preview

Zimmer Biomet Holdings, Inc.4th Quarter 2017 Earnings Call Presentation
January 30, 2018
2
Cautionary Note on Forward-Looking Statements and Non-GAAP Financial Measures
• Our discussions during this presentation will include forward-looking statements concerning, among other things, our anticipated future
operating and financial performance, business plans and prospects, product and service offerings, including new product launches and
potential clinical successes, capital allocation plans and priorities, business development plans and priorities and the benefits expected from
our acquisitions and other business development activities. Such statements are based upon the current beliefs and expectations of
management and are subject to significant risks, uncertainties and changes in circumstances that could cause actual outcomes and results to
differ materially. For a list and description of some of such risks and uncertainties, see our Annual Report on Form 10-K for the year ended
December 31, 2016, including in the section thereof captioned “Risk Factors”, as well as our subsequent reports on Form 8-K and Form 10-
Q, all of which are available at www.sec.gov and www.zimmerbiomet.com. The forward-looking statements in this presentation speak only
as of the original date of this presentation and we undertake no obligation to update or revise any of these statements.
• Also, this presentation refers to certain financial measures that differ from financial measures calculated in accordance with U.S. generally
accepted accounting principles (GAAP). Reconciliations of these non-GAAP financial measures to the most directly comparable GAAP
financial measures can be found in the Appendix to this presentation. Investors and other readers should consider non-GAAP financial
measures only as supplements to, and not as substitutes for or superior to, the measures of financial performance prepared in accordance
with GAAP.
3
Table of Contents
2018 Q1 Guidance & Outlook
2017 Q4 Financial Summary
Company Overview
Appendix
2017 Q4 Financial Summary
5
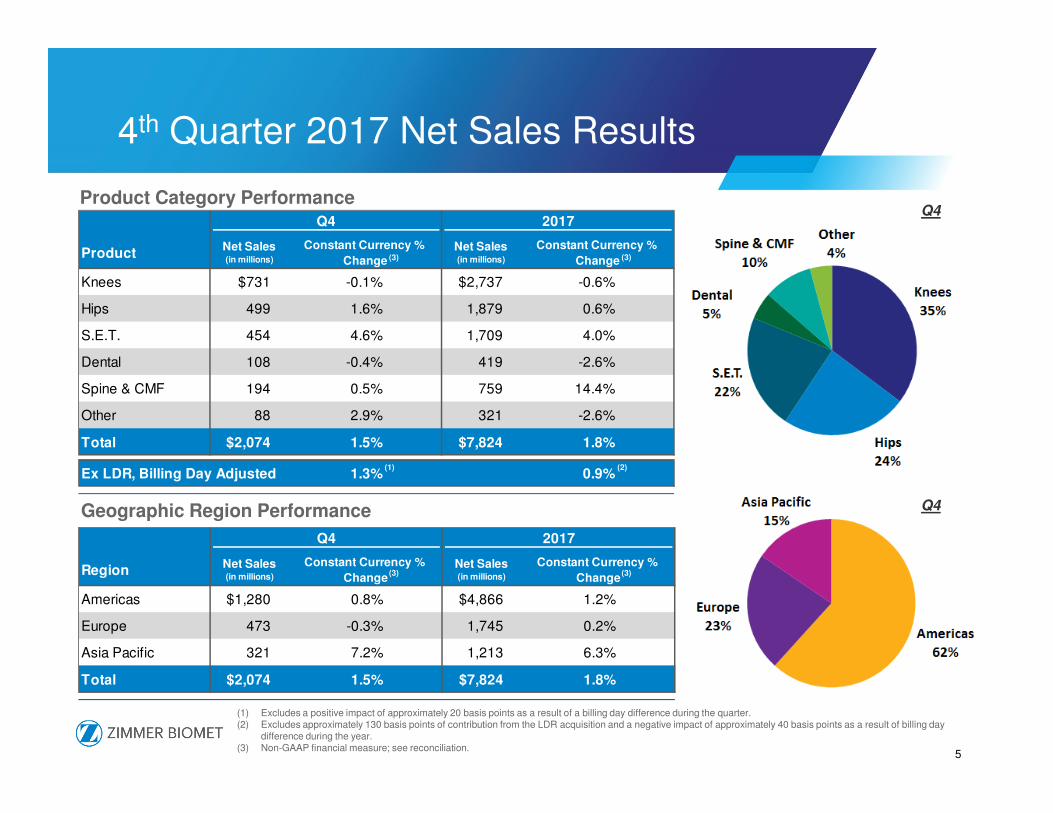
4th Quarter 2017 Net Sales Results
Product Category Performance
Geographic Region Performance
(1) Excludes a positive impact of approximately 20 basis points as a result of a billing day difference during the quarter.(2) Excludes approximately 130 basis points of contribution from the LDR acquisition and a negative impact of approximately 40 basis points as a result of billing day
difference during the year.(3) Non-GAAP financial measure; see reconciliation.
Product
Knees $731 -0.1% $2,737 -0.6%
Hips 499 1.6% 1,879 0.6%
S.E.T. 454 4.6% 1,709 4.0%
Dental 108 -0.4% 419 -2.6%
Spine & CMF 194 0.5% 759 14.4%
Other 88 2.9% 321 -2.6%
Total $2,074 1.5% $7,824 1.8%
Ex LDR, Billing Day Adjusted 1.3% 0.9%
Constant Currency %
Change
Q4 2017
Net Sales (in millions)
Net Sales (in millions)
Constant Currency %
Change
(1)
(3) (3)
(2)
Region
Americas $1,280 0.8% $4,866 1.2%
Europe 473 -0.3% 1,745 0.2%
Asia Pacific 321 7.2% 1,213 6.3%
Total $2,074 1.5% $7,824 1.8%
Constant Currency %
ChangeNet Sales (in millions)
Q4 2017
Net Sales (in millions)
Constant Currency %
Change(3) (3)
Q4
Q4
6
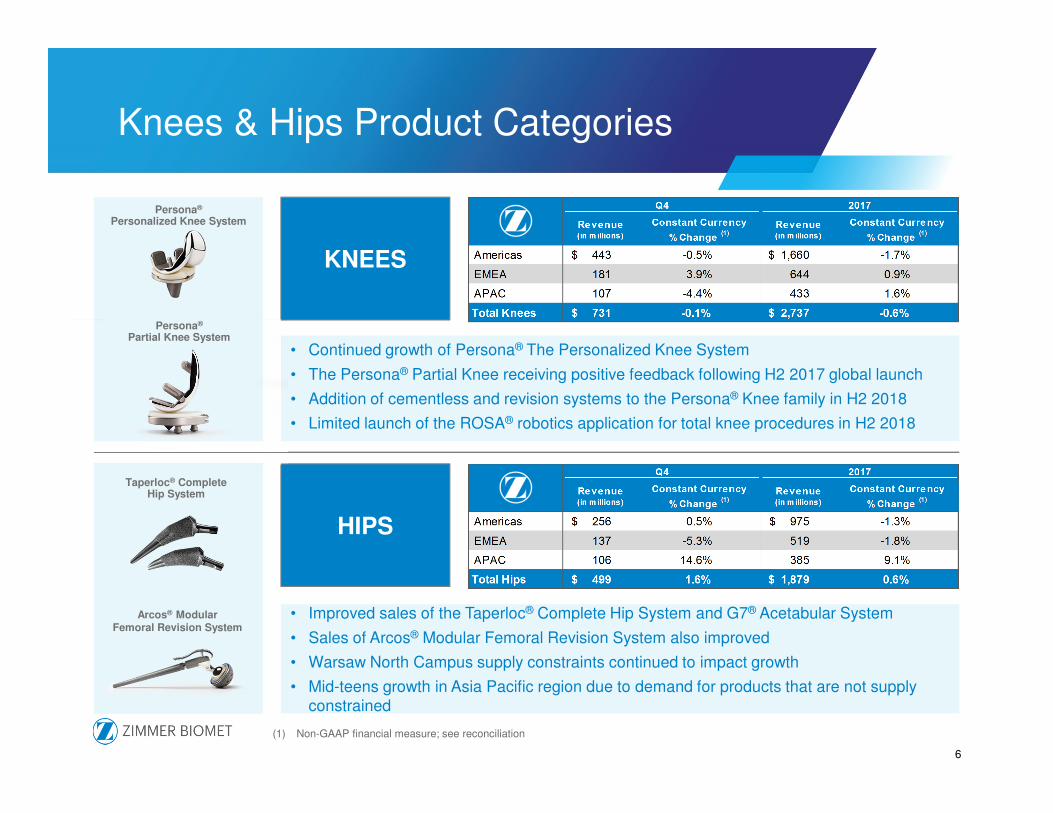
Knees & Hips Product Categories
• Continued growth of Persona® The Personalized Knee System
• The Persona® Partial Knee receiving positive feedback following H2 2017 global launch
• Addition of cementless and revision systems to the Persona® Knee family in H2 2018
• Limited launch of the ROSA® robotics application for total knee procedures in H2 2018
KNEES
• Improved sales of the Taperloc® Complete Hip System and G7® Acetabular System
• Sales of Arcos® Modular Femoral Revision System also improved
• Warsaw North Campus supply constraints continued to impact growth
• Mid-teens growth in Asia Pacific region due to demand for products that are not supply constrained
HIPS
Persona®
Personalized Knee System
Arcos® ModularFemoral Revision System
Taperloc® Complete Hip System
(1) Non-GAAP financial measure; see reconciliation
Persona®
Partial Knee System
7
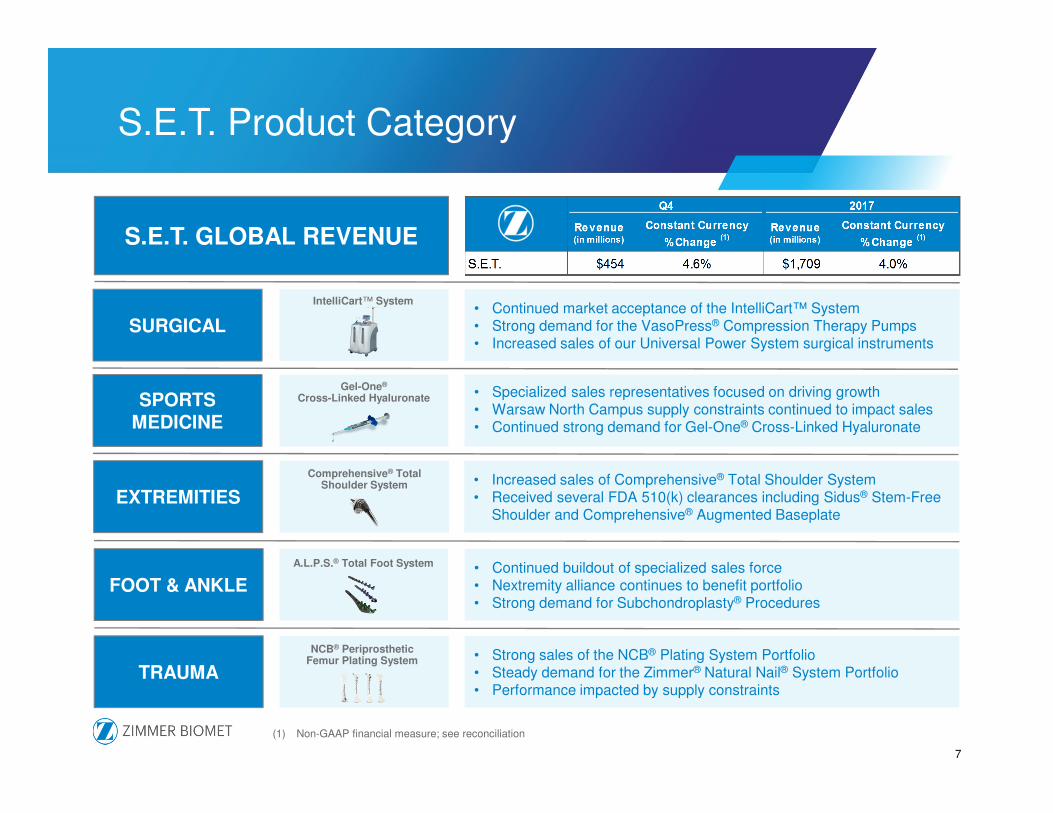
S.E.T. Product Category
• Continued market acceptance of the IntelliCart™ System• Strong demand for the VasoPress® Compression Therapy Pumps• Increased sales of our Universal Power System surgical instruments
SURGICAL
IntelliCart™ System
• Increased sales of Comprehensive® Total Shoulder System• Received several FDA 510(k) clearances including Sidus® Stem-Free
Shoulder and Comprehensive® Augmented BaseplateEXTREMITIES
Comprehensive® Total Shoulder System
• Strong sales of the NCB® Plating System Portfolio• Steady demand for the Zimmer® Natural Nail® System Portfolio• Performance impacted by supply constraints
TRAUMA
NCB® Periprosthetic Femur Plating System
• Specialized sales representatives focused on driving growth• Warsaw North Campus supply constraints continued to impact sales• Continued strong demand for Gel-One® Cross-Linked Hyaluronate
SPORTS MEDICINE
Gel-One®
Cross-Linked Hyaluronate
• Continued buildout of specialized sales force• Nextremity alliance continues to benefit portfolio• Strong demand for Subchondroplasty® Procedures
FOOT & ANKLE
A.L.P.S.® Total Foot System
S.E.T. GLOBAL REVENUE
(1) Non-GAAP financial measure; see reconciliation
8
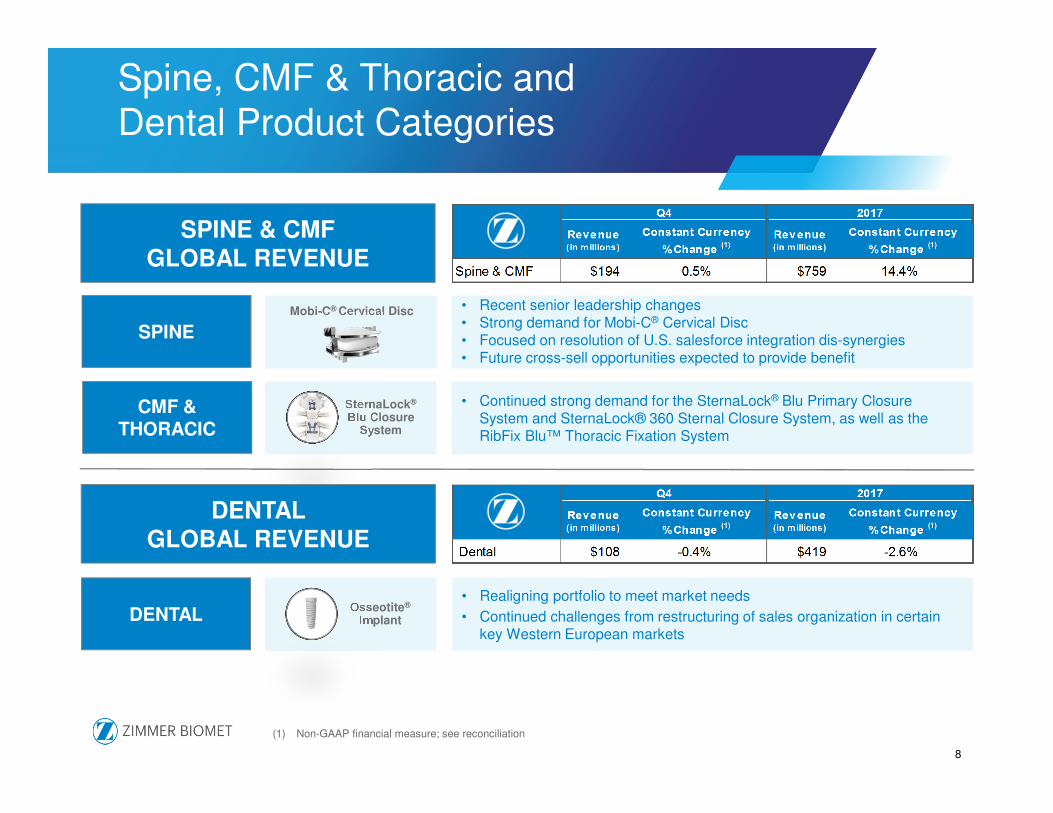
Spine, CMF & Thoracic andDental Product Categories
SPINE & CMF GLOBAL REVENUE
• Recent senior leadership changes• Strong demand for Mobi-C® Cervical Disc• Focused on resolution of U.S. salesforce integration dis-synergies• Future cross-sell opportunities expected to provide benefit
SPINE
Mobi-C® Cervical Disc
• Continued strong demand for the SternaLock® Blu Primary Closure System and SternaLock® 360 Sternal Closure System, as well as the RibFix Blu™ Thoracic Fixation System
CMF & THORACIC
SternaLock®
Blu ClosureSystem
DENTAL GLOBAL REVENUE
• Realigning portfolio to meet market needs
• Continued challenges from restructuring of sales organization in certain key Western European markets
DENTALOsseotite®
Implant
(1) Non-GAAP financial measure; see reconciliation
9
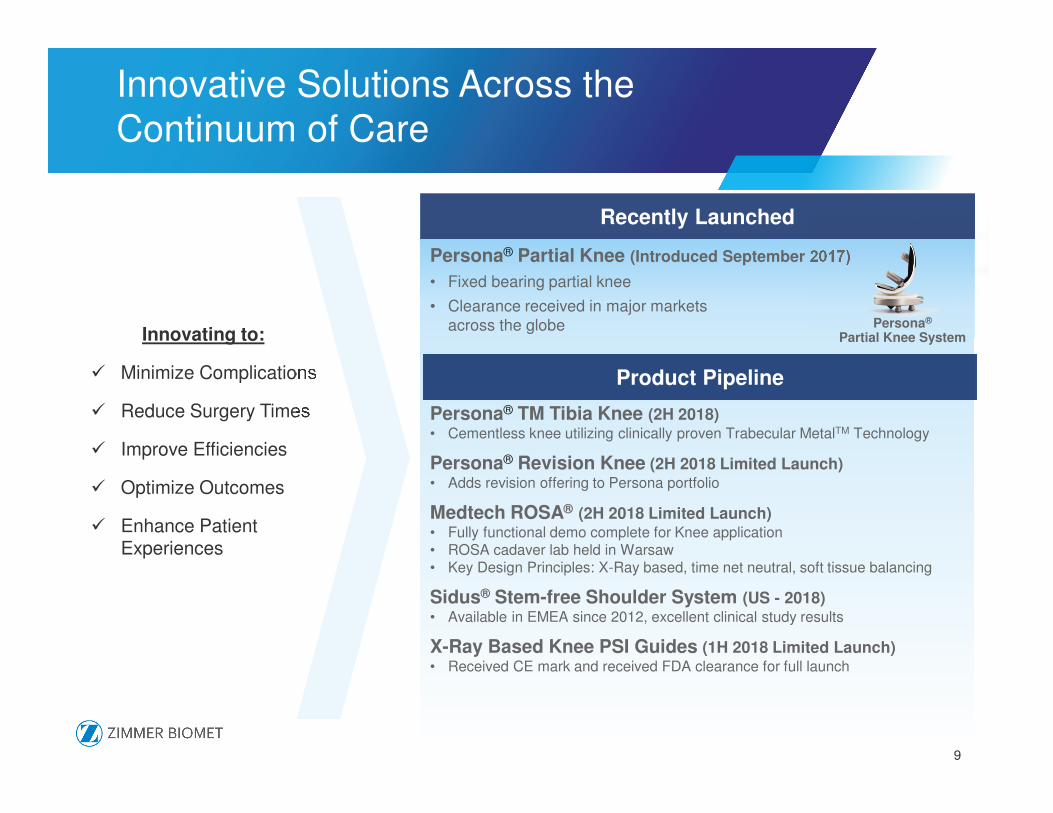
Innovative Solutions Across the Continuum of Care
Persona® Partial Knee (Introduced September 2017)
• Fixed bearing partial knee
• Clearance received in major markets across the globe
Persona® TM Tibia Knee (2H 2018)• Cementless knee utilizing clinically proven Trabecular MetalTM Technology
Persona® Revision Knee (2H 2018 Limited Launch)• Adds revision offering to Persona portfolio
Medtech ROSA® (2H 2018 Limited Launch)• Fully functional demo complete for Knee application• ROSA cadaver lab held in Warsaw• Key Design Principles: X-Ray based, time net neutral, soft tissue balancing
Sidus® Stem-free Shoulder System (US - 2018)• Available in EMEA since 2012, excellent clinical study results
X-Ray Based Knee PSI Guides (1H 2018 Limited Launch)• Received CE mark and received FDA clearance for full launch
Recently Launched
Innovating to:
� Minimize Complications
� Reduce Surgery Times
� Improve Efficiencies
� Optimize Outcomes
� Enhance Patient Experiences
Persona®
Partial Knee System
Product Pipeline
9
10
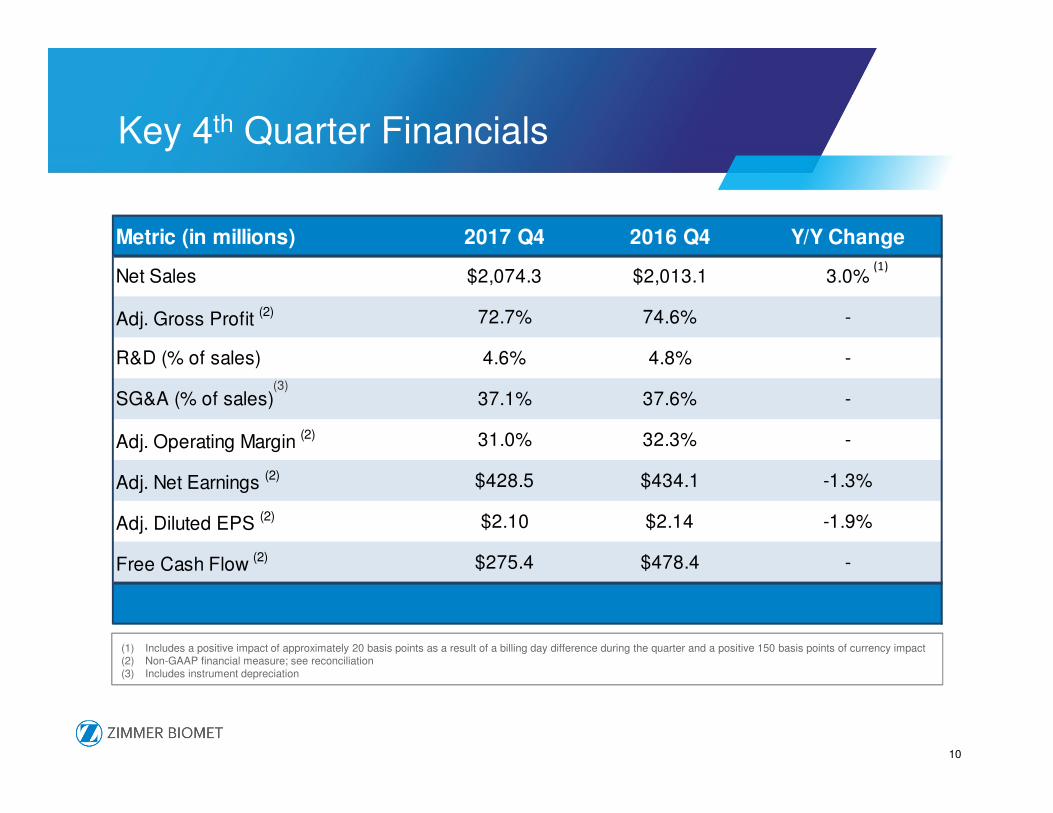
Key 4th Quarter Financials
(1) Includes a positive impact of approximately 20 basis points as a result of a billing day difference during the quarter and a positive 150 basis points of currency impact(2) Non-GAAP financial measure; see reconciliation(3) Includes instrument depreciation
Metric (in millions) 2017 Q4 2016 Q4 Y/Y Change
Net Sales $2,074.3 $2,013.1 3.0%
Adj. Gross Profit (2) 72.7% 74.6% -
R&D (% of sales) 4.6% 4.8% -
SG&A (% of sales) 37.1% 37.6% -
Adj. Operating Margin (2) 31.0% 32.3% -
Adj. Net Earnings (2) $428.5 $434.1 -1.3%
Adj. Diluted EPS (2) $2.10 $2.14 -1.9%
Free Cash Flow (2) $275.4 $478.4 -
(1)
(3)
11
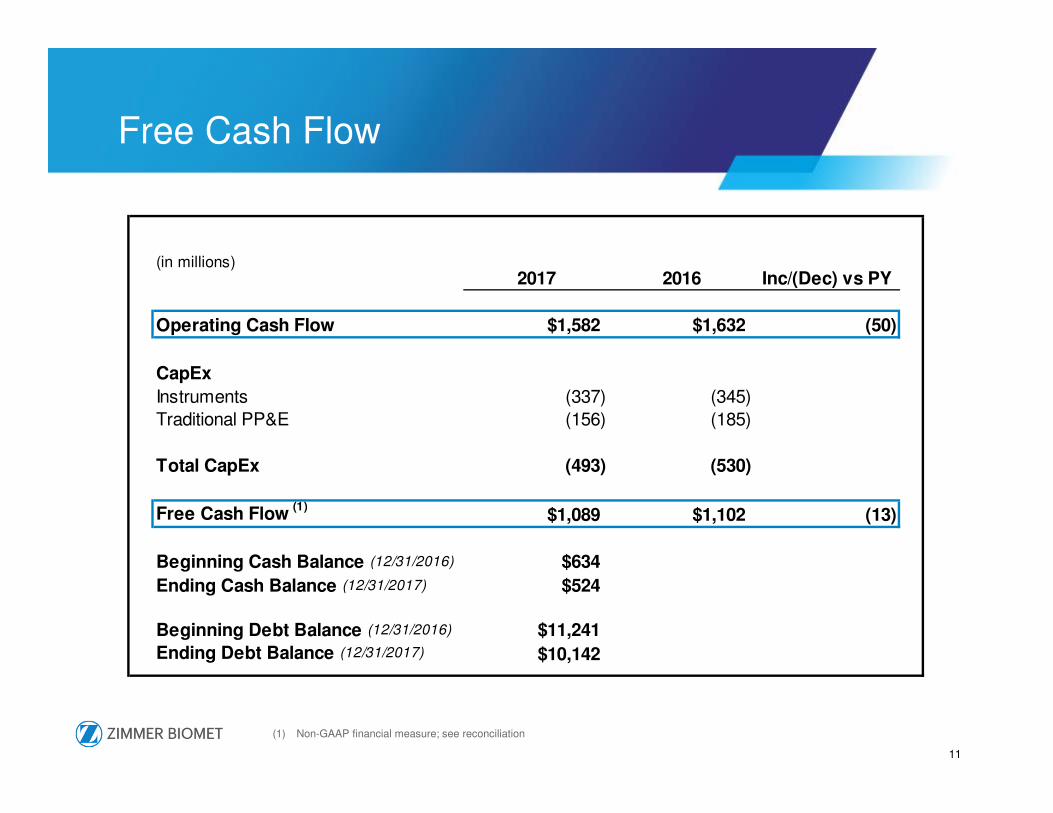
Free Cash Flow
(1) Non-GAAP financial measure; see reconciliation
(in millions)2017 2016 Inc/(Dec) vs PY
Operating Cash Flow $1,582 $1,632 (50)
CapEx
Instruments (337) (345)
Traditional PP&E (156) (185)
Total CapEx (493) (530)
Free Cash Flow (1)
$1,089 $1,102 (13)
Beginning Cash Balance (12/31/2016) $634
Ending Cash Balance (12/31/2017) $524
Beginning Debt Balance (12/31/2016) $11,241
Ending Debt Balance (12/31/2017) $10,142
2018 Q1 Guidance and Outlook
13
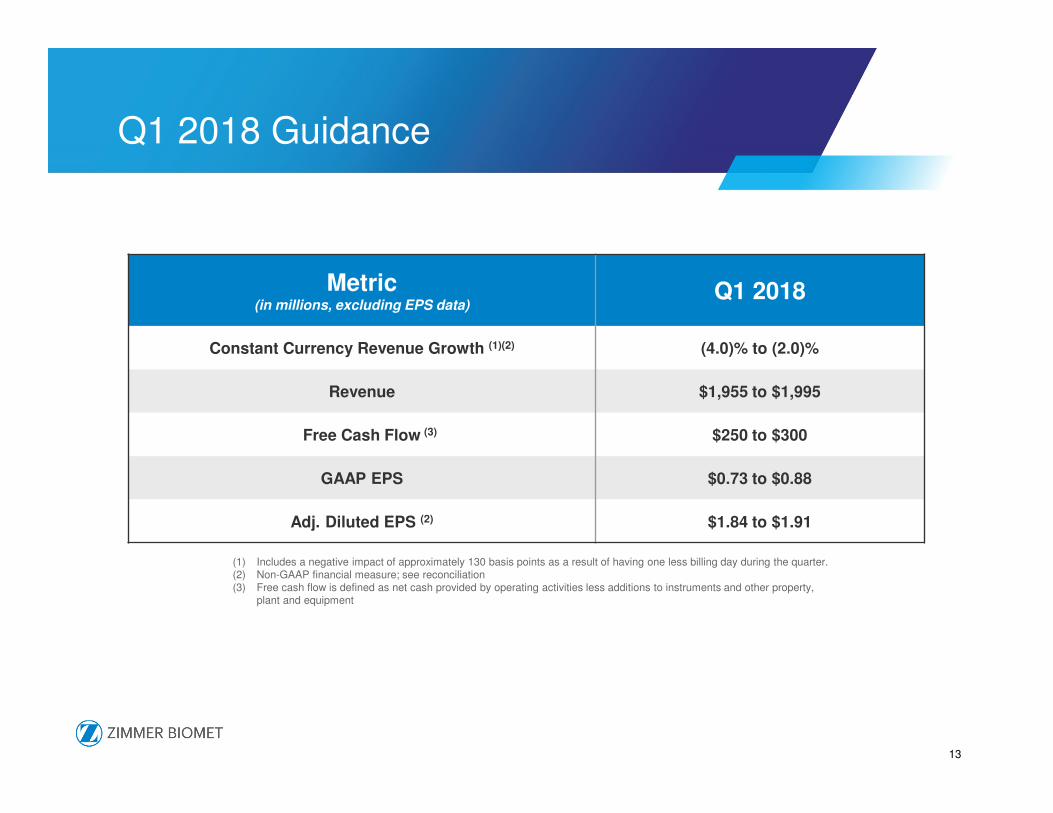
Q1 2018 Guidance
Metric(in millions, excluding EPS data)
Q1 2018
Constant Currency Revenue Growth (1)(2) (4.0)% to (2.0)%
Revenue $1,955 to $1,995
Free Cash Flow $250 to $300
GAAP EPS $0.73 to $0.88
Adj. Diluted EPS (2) $1.84 to $1.91
(1) Includes a negative impact of approximately 130 basis points as a result of having one less billing day during the quarter.(2) Non-GAAP financial measure; see reconciliation(3) Free cash flow is defined as net cash provided by operating activities less additions to instruments and other property,
plant and equipment
(3)
Company Overview
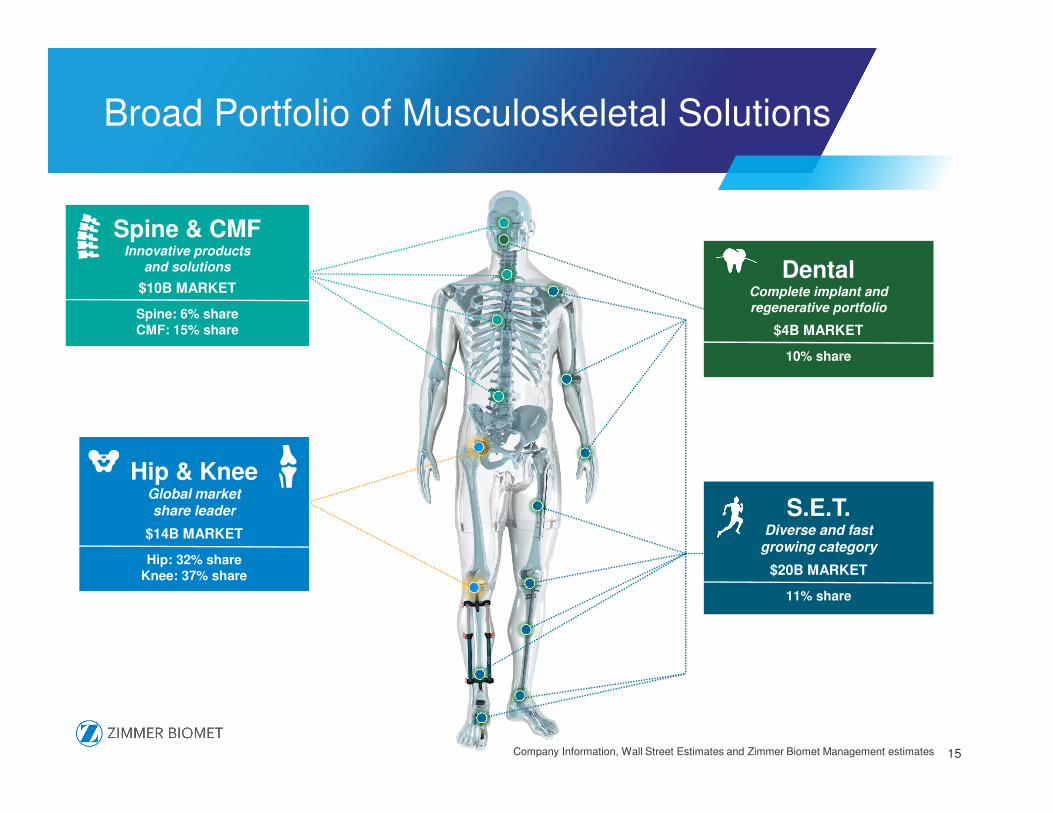
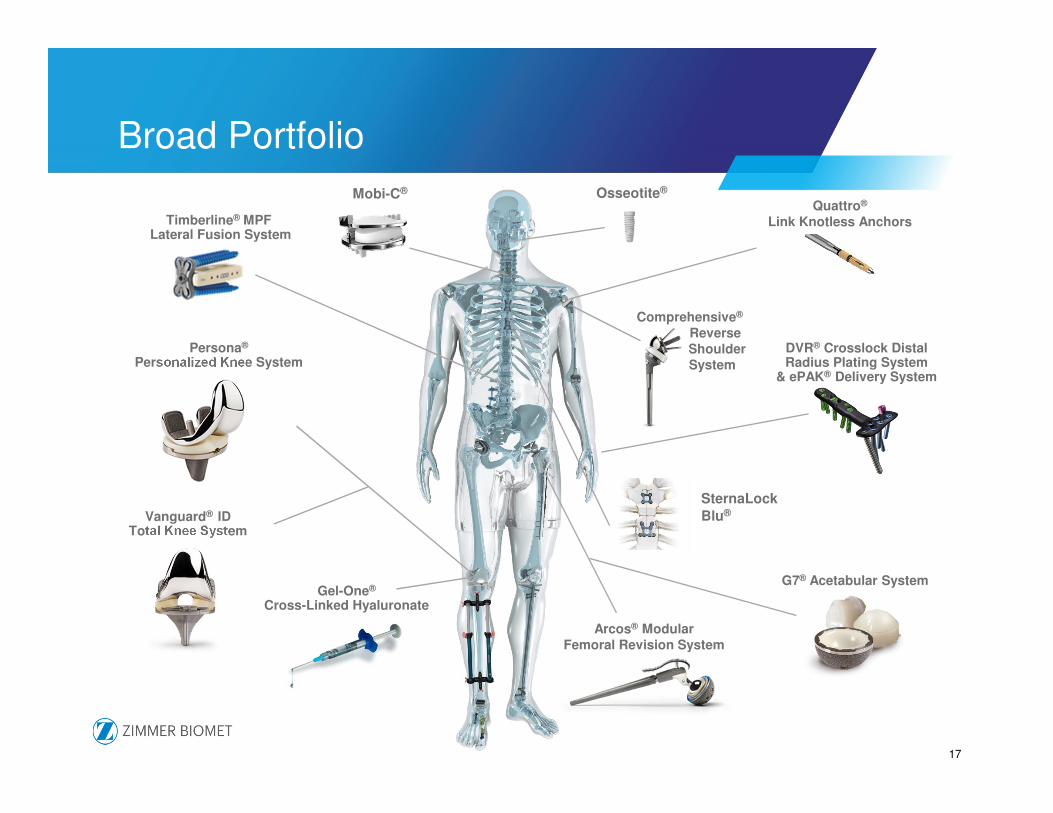
Broad Portfolio of Musculoskeletal Solutions
Knee$7.5B Market
36%-37% Est. Share
Spine & CMFInnovative products
and solutions
$10B MARKET
Spine: 6% shareCMF: 15% share
Hip & KneeGlobal market share leader
$14B MARKET
Hip: 32% shareKnee: 37% share
DentalComplete implant and
regenerative portfolio
$4B MARKET
10% share
S.E.T.Diverse and fast
growing category
$20B MARKET
11% share
15Company Information, Wall Street Estimates and Zimmer Biomet Management estimates
16
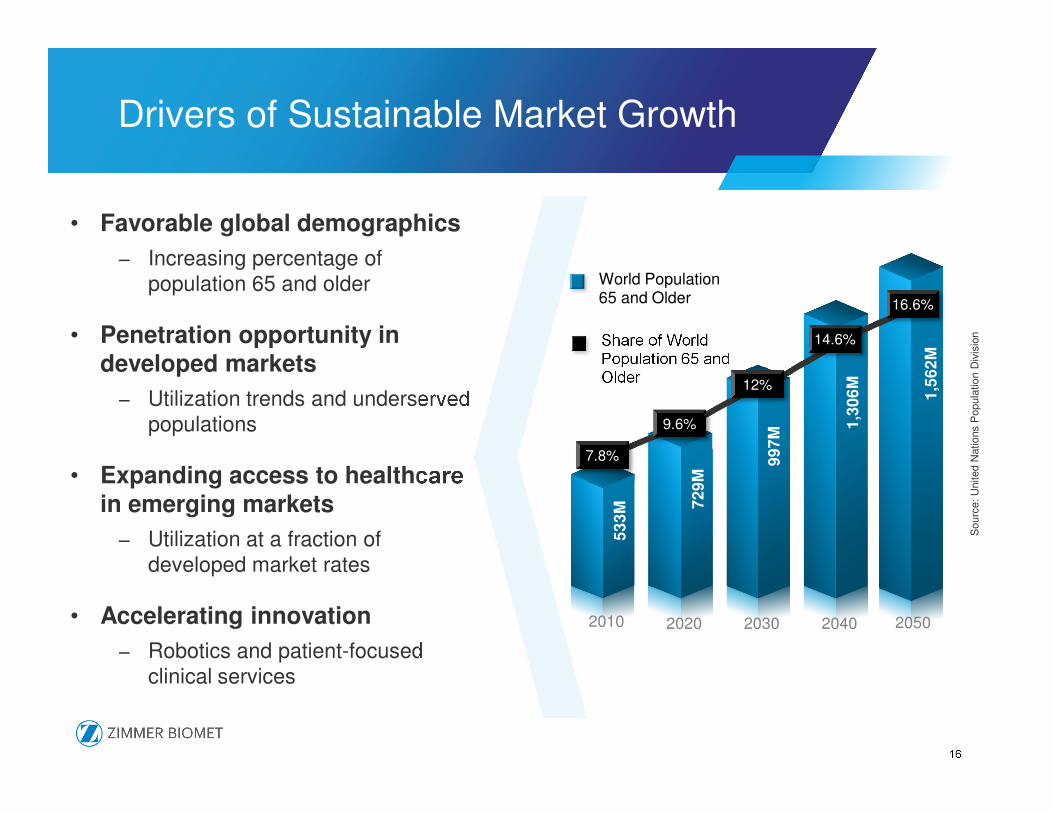
Drivers of Sustainable Market Growth
• Favorable global demographics
− Increasing percentage of population 65 and older
• Penetration opportunity in developed markets
− Utilization trends and underserved populations
• Expanding access to healthcare in emerging markets
− Utilization at a fraction of developed market rates
• Accelerating innovation
− Robotics and patient-focused clinical services
Growing globalmusculoskeletalmarket of ~$50B
Procedure VolumeShare of World Population 65 and Older
World Population65 and Older
Sourc
e:
United N
ations P
opula
tion D
ivis
ion
53
3M 7
29
M
99
7M
1,3
06
M
1,5
62
M
2010 2020 2030 2040 2050
7.8%
9.6%
12%
14.6%
16.6%
17
New
Timberline® MPFLateral Fusion System
Arcos® ModularFemoral Revision System
DVR® Crosslock Distal Radius Plating System
& ePAK® Delivery System
Gel-One®
Cross-Linked Hyaluronate
Persona®
Personalized Knee System
Vanguard® ID Total Knee System
G7® Acetabular System
Broad Portfolio
Quattro®
Link Knotless Anchors
Mobi-C®
Comprehensive®
ReverseShoulderSystem
Osseotite®
SternaLock
Blu®
18
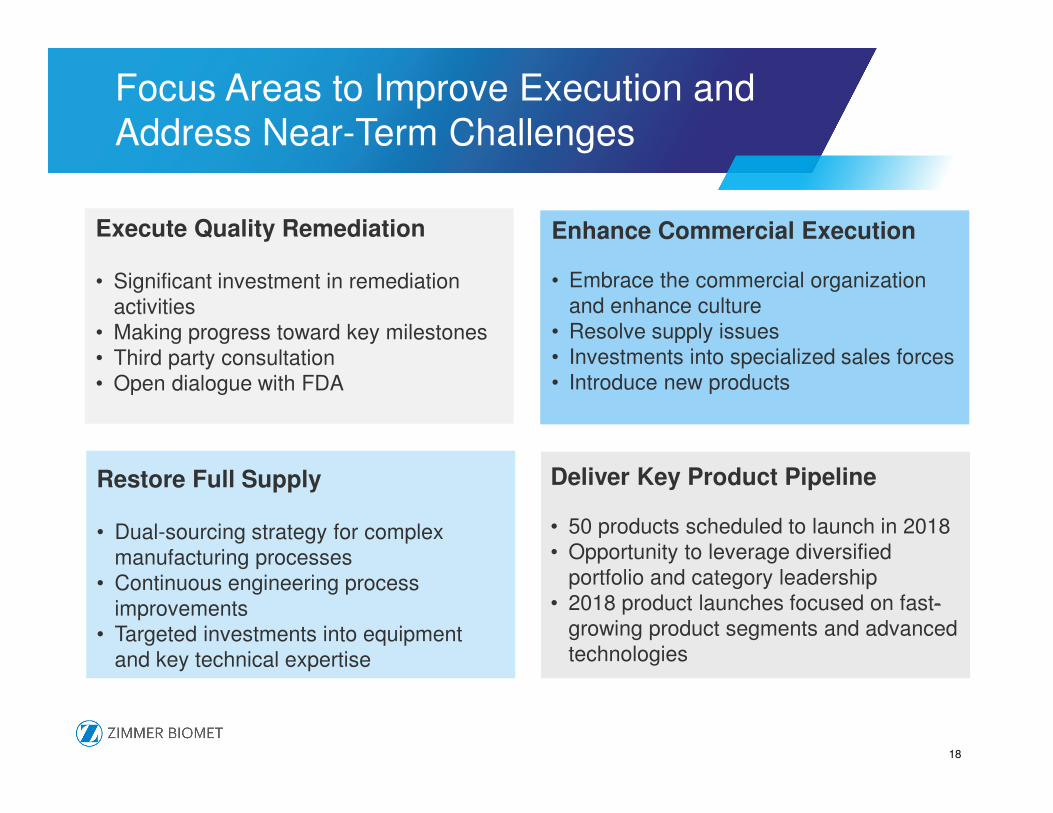
Focus Areas to Improve Execution and Address Near-Term Challenges
Restore Full Supply
• Dual-sourcing strategy for complex manufacturing processes
• Continuous engineering process improvements
• Targeted investments into equipment and key technical expertise
Deliver Key Product Pipeline
• 50 products scheduled to launch in 2018• Opportunity to leverage diversified
portfolio and category leadership• 2018 product launches focused on fast-
growing product segments and advanced technologies
Enhance Commercial Execution
• Embrace the commercial organization and enhance culture
• Resolve supply issues• Investments into specialized sales forces• Introduce new products
Execute Quality Remediation
• Significant investment in remediation activities
• Making progress toward key milestones • Third party consultation• Open dialogue with FDA
19
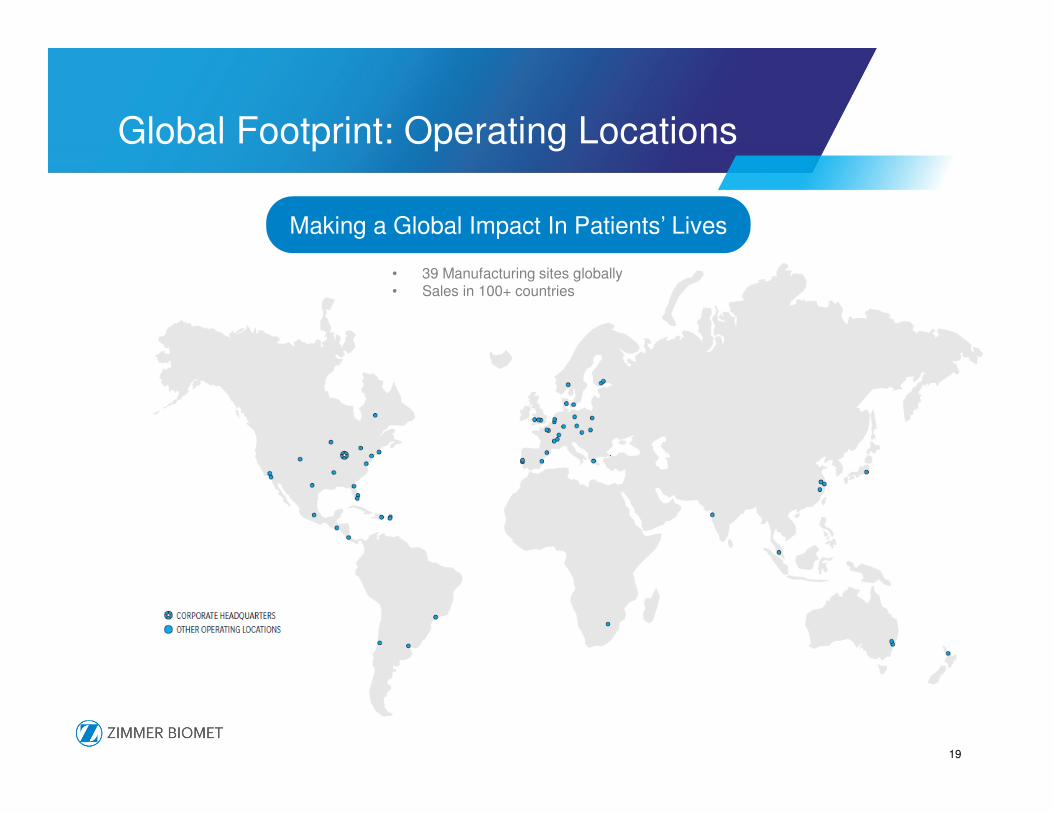
Global Footprint: Operating Locations
Making a Global Impact In Patients’ Lives
• 39 Manufacturing sites globally• Sales in 100+ countries
Appendix
21
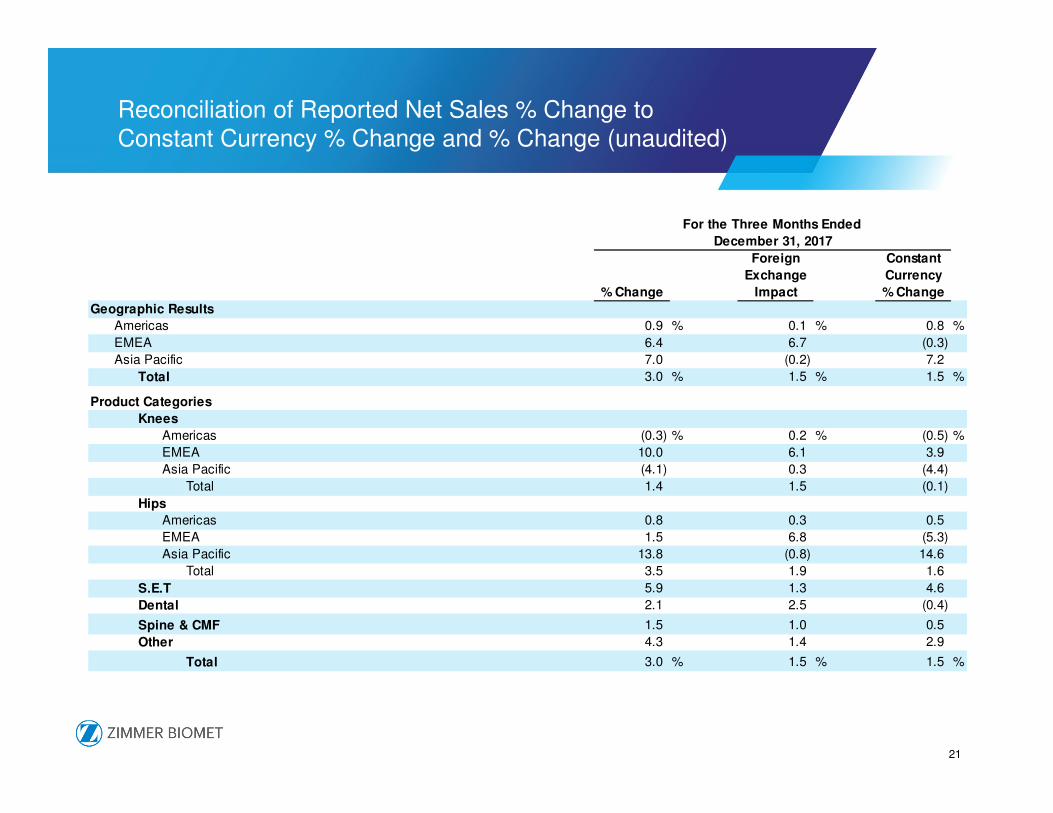
Reconciliation of Reported Net Sales % Change to Constant Currency % Change and % Change (unaudited)
Foreign Constant
Exchange Currency
% Change Impact % Change
Geographic Results
Americas 0.9 % 0.1 % 0.8 %
EMEA 6.4 6.7 (0.3)
Asia Pacific 7.0 (0.2) 7.2
Total 3.0 % 1.5 % 1.5 %
Product Categories
Knees
Americas (0.3) % 0.2 % (0.5) %
EMEA 10.0 6.1 3.9
Asia Pacific (4.1) 0.3 (4.4)
Total 1.4 1.5 (0.1)
Hips
Americas 0.8 0.3 0.5
EMEA 1.5 6.8 (5.3)
Asia Pacific 13.8 (0.8) 14.6
Total 3.5 1.9 1.6
S.E.T 5.9 1.3 4.6
Dental 2.1 2.5 (0.4)
Spine & CMF 1.5 1.0 0.5
Other 4.3 1.4 2.9
Total 3.0 % 1.5 % 1.5 %
For the Three Months Ended
December 31, 2017

22
Reconciliation of Reported Net Sales % Change to Constant Currency % Change and % Change Excluding LDR Holding Corporation (unaudited)
Foreign Constant
Exchange Currency
% Change Impact % Change
Geographic Results
Americas 1.3 % 0.1 % 1.2 %
EMEA 0.9 0.7 0.2
Asia Pacific 5.4 (0.9) 6.3
Total 1.8 % - % 1.8 %
Product Categories
Knees
Americas (1.7) % - % (1.7) %
EMEA 1.0 0.1 0.9
Asia Pacific 1.5 (0.1) 1.6
Total (0.6) - (0.6)
Hips
Americas (1.2) 0.1 (1.3)
EMEA (0.7) 1.1 (1.8)
Asia Pacific 7.5 (1.6) 9.1
Total 0.6 - 0.6
S.E.T 3.9 (0.1) 4.0
Dental (2.2) 0.4 (2.6)
Spine & CMF 14.7 0.3 14.4
Other (2.5) 0.1 (2.6)
Total 1.8 % - % 1.8 %
Impact of LDR Holding Corporation (1.3) - (1.3)
% Change excluding LDR Holding Corporation 0.5 % - % 0.5 %
For the Year Ended
December 31, 2017
23
Reconciliation of Cash Flow from Operating Activities to Free Cash Flow
Three Months Ended Three Months Ended Three Months Ended Three Months Ended Year Ended
March 31, 2017 June 30, 2017 September 30, 2017 December 31, 2017 December 31, 2017
Net cash provided by operating activities 275.4$ 440.5$ 463.5$ 402.9$ 1,582.3$
Additions to instruments (86.4) (86.2) (83.1) (81.3) (337.0)
Additions to other property, plant and equipment (43.1) (30.7) (36.0) (46.2) (156.0)
Free cash flow 145.9$ 323.6$ 344.4$ 275.4$ 1,089.3$
For the Quarterly and Year-to-Date Periods in Calendar Year Ending December 31, 2017
(in millions, unaudited)
Three Months Ended Three Months Ended Three Months Ended Three Months Ended Year Ended
March 31, 2016 June 30, 2016 September 30, 2016 December 31, 2016 December 31, 2016
Net cash provided by operating activities 272.8$ 379.6$ 352.6$ 627.2$ 1,632.2$
Additions to instruments (85.1) (72.2) (94.0) (94.2) (345.5)
Additions to other property, plant and equipment (27.6) (46.1) (56.4) (54.6) (184.7)
Free cash flow 160.1$ 261.3$ 202.2$ 478.4$ 1,102.0$
For the Quarterly and Year-to-Date Periods in Calendar Year Ending December 31, 2016
(in millions, unaudited)

24
Reconciliation of Gross Profit & Margin to Adjusted Gross Profit & Margin
Three Months Ended Three Months Ended Three Months Ended Three Months Ended Year Ended
March 31, 2017 June 30, 2017 September 30, 2017 December 31, 2017 December 31, 2017
Net Sales 1,977.3$ 1,954.4$ 1,818.1$ 2,074.3$ 7,824.1$
Cost of products sold, excluding intangible asset amortization 512.9 527.7 500.9 591.4 2,132.9
Intangible asset amortization 152.0 147.7 152.7 151.5 603.9
Gross profit 1,312.4$ 1,279.0$ 1,164.5$ 1,331.4$ 5,087.3$
Inventory step-up and other inventory
and manufacturing related charges 23.2 24.9 10.4 26.1 84.6
Intangible asset amortization 152.0 147.7 152.7 151.5 603.9
Adjusted gross profit 1,487.6$ 1,451.6$ 1,327.6$ 1,509.0$ 5,775.8$
Gross margin 66.4 % 65.4 % 64.1 % 64.2 % 65.0 %
Inventory step-up and other inventory
and manufacturing related charges 1.1 1.3 0.5 1.2 1.1
Intangible asset amortization 7.7 7.6 8.4 7.3 7.7
Adjusted gross margin 75.2 % 74.3 % 73.0 % 72.7 % 73.8 %
For the Quarterly and Year-to-Date Periods in Calendar Year Ending December 31, 2017
(in millions, unaudited)

25
Reconciliation of Gross Profit & Margin to Adjusted Gross Profit & Margin
Three Months Ended Three Months Ended Three Months Ended Three Months Ended Year Ended
March 31, 2016 June 30, 2016 September 30, 2016 December 31, 2016 December 31, 2016
Net Sales 1,904.0$ 1,934.0$ 1,832.8$ 2,013.1$ 7,683.9$
Cost of products sold, excluding intangible asset amortization 640.6 640.1 479.3 621.8 2,381.8
Intangible asset amortization 126.6 133.8 164.3 141.2 565.9
Gross profit 1,136.8$ 1,160.1$ 1,189.2$ 1,250.1$ 4,736.2$
Inventory step-up and other inventory
and manufacturing related charges 178.3 156.6 22.8 111.4 469.1
Intangible asset amortization 126.6 133.8 164.3 141.2 565.9
Adjusted gross profit 1,441.7$ 1,450.5$ 1,376.3$ 1,502.7$ 5,771.2$
Gross margin 59.7 % 60.0 % 64.9 % 62.1 % 61.6 %
Inventory step-up and other inventory
and manufacturing related charges 9.4 8.1 1.2 5.5 6.1
Intangible asset amortization 6.6 6.9 9.0 7.0 7.4
Adjusted gross margin 75.7 % 75.0 % 75.1 % 74.6 % 75.1 %
For the Quarterly and Year-to-Date Periods in Calendar Year Ending December 31, 2016
(in millions, unaudited)
26
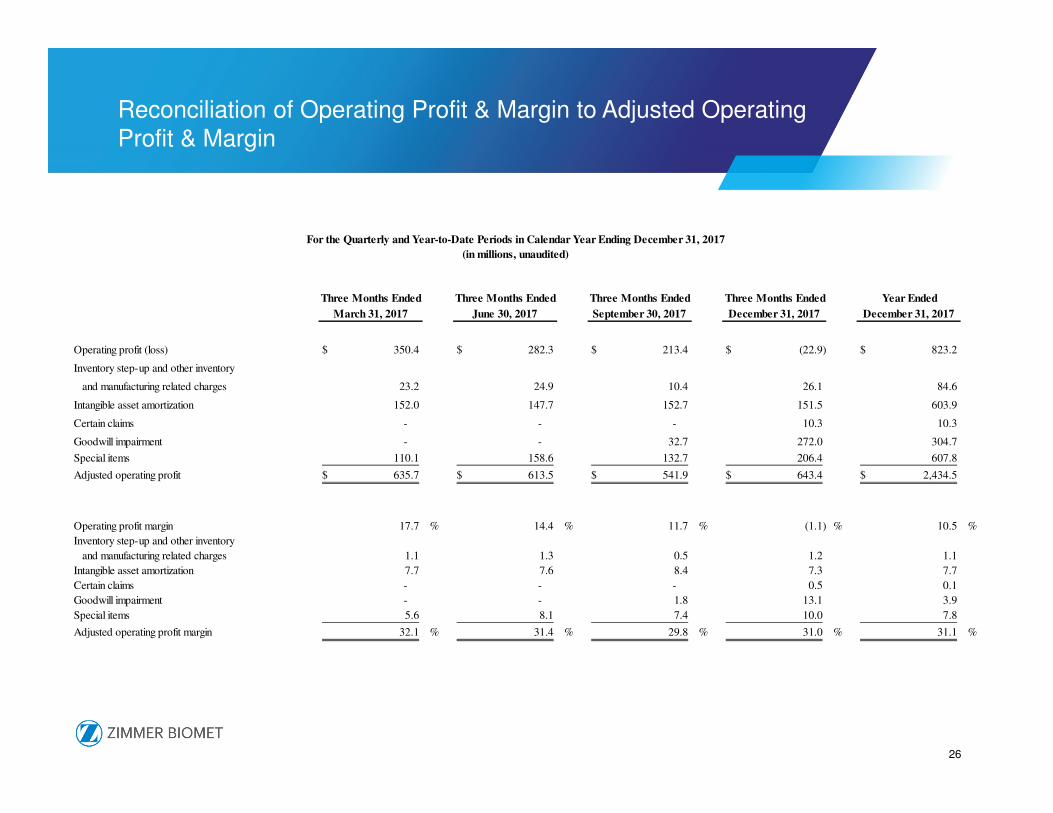
Reconciliation of Operating Profit & Margin to Adjusted Operating Profit & Margin
Three Months Ended Three Months Ended Three Months Ended Three Months Ended Year Ended
March 31, 2017 June 30, 2017 September 30, 2017 December 31, 2017 December 31, 2017
Operating profit (loss) 350.4$ 282.3$ 213.4$ (22.9)$ 823.2$
Inventory step-up and other inventory
and manufacturing related charges 23.2 24.9 10.4 26.1 84.6
Intangible asset amortization 152.0 147.7 152.7 151.5 603.9
Certain claims - - - 10.3 10.3
Goodwill impairment - - 32.7 272.0 304.7
Special items 110.1 158.6 132.7 206.4 607.8
Adjusted operating profit 635.7$ 613.5$ 541.9$ 643.4$ 2,434.5$
Operating profit margin 17.7 % 14.4 % 11.7 % (1.1) % 10.5 %
Inventory step-up and other inventory
and manufacturing related charges 1.1 1.3 0.5 1.2 1.1
Intangible asset amortization 7.7 7.6 8.4 7.3 7.7
Certain claims - - - 0.5 0.1
Goodwill impairment - - 1.8 13.1 3.9
Special items 5.6 8.1 7.4 10.0 7.8
Adjusted operating profit margin 32.1 % 31.4 % 29.8 % 31.0 % 31.1 %
For the Quarterly and Year-to-Date Periods in Calendar Year Ending December 31, 2017
(in millions, unaudited)
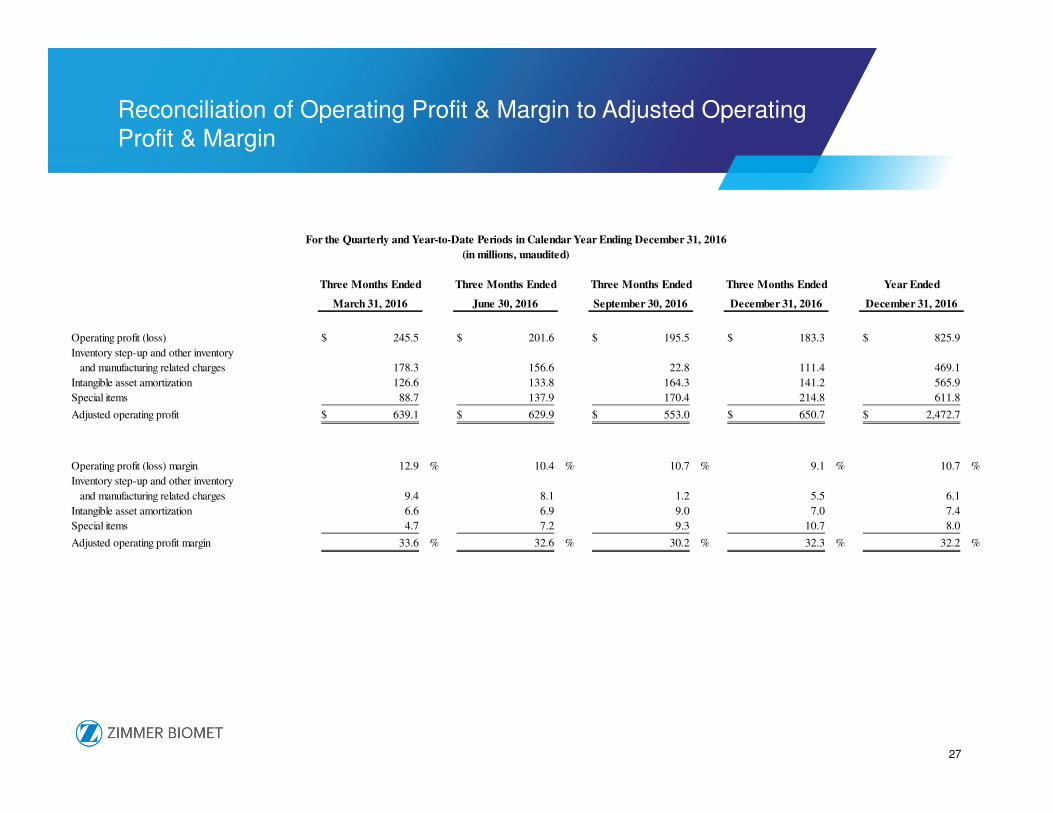
27
Reconciliation of Operating Profit & Margin to Adjusted Operating Profit & Margin
Three Months Ended Three Months Ended Three Months Ended Three Months Ended Year Ended
March 31, 2016 June 30, 2016 September 30, 2016 December 31, 2016 December 31, 2016
Operating profit (loss) 245.5$ 201.6$ 195.5$ 183.3$ 825.9$
Inventory step-up and other inventory
and manufacturing related charges 178.3 156.6 22.8 111.4 469.1
Intangible asset amortization 126.6 133.8 164.3 141.2 565.9
Special items 88.7 137.9 170.4 214.8 611.8
Adjusted operating profit 639.1$ 629.9$ 553.0$ 650.7$ 2,472.7$
Operating profit (loss) margin 12.9 % 10.4 % 10.7 % 9.1 % 10.7 %
Inventory step-up and other inventory
and manufacturing related charges 9.4 8.1 1.2 5.5 6.1
Intangible asset amortization 6.6 6.9 9.0 7.0 7.4
Special items 4.7 7.2 9.3 10.7 8.0
Adjusted operating profit margin 33.6 % 32.6 % 30.2 % 32.3 % 32.2 %
For the Quarterly and Year-to-Date Periods in Calendar Year Ending December 31, 2016
(in millions, unaudited)
28
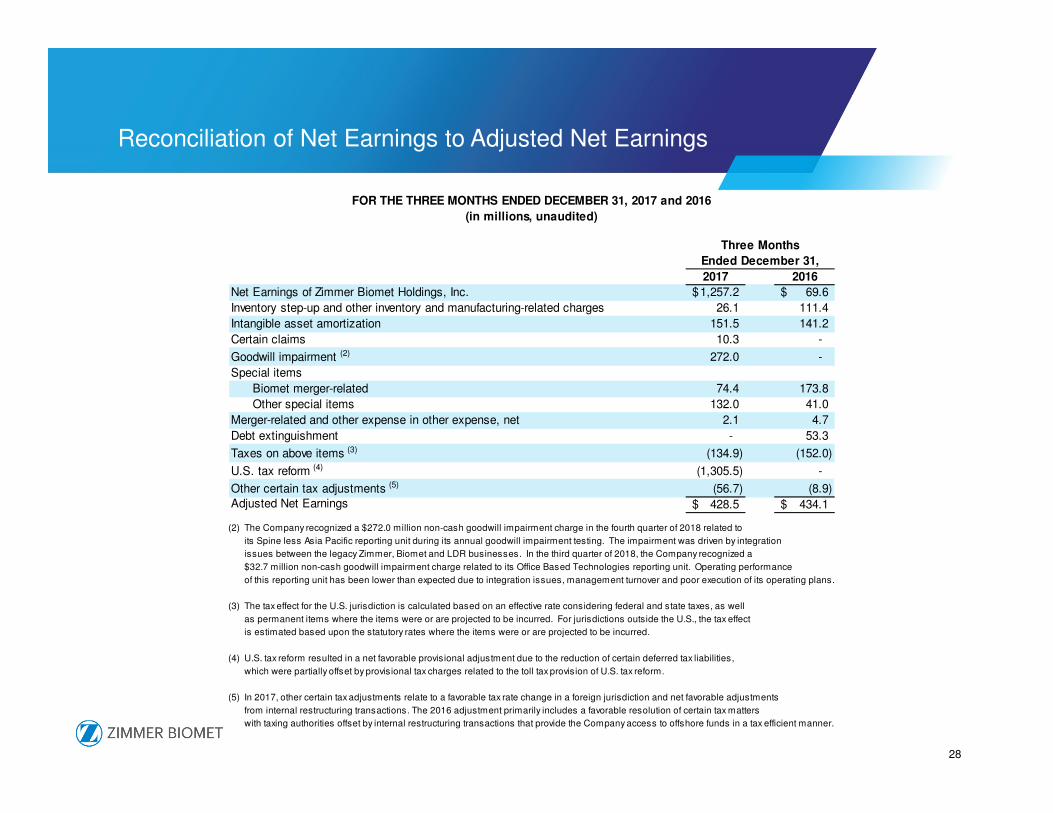
Reconciliation of Net Earnings to Adjusted Net Earnings
2017 2016
Net Earnings of Zimmer Biomet Holdings, Inc. 1,257.2$ 69.6$
Inventory step-up and other inventory and manufacturing-related charges 26.1 111.4
Intangible asset amortization 151.5 141.2
Certain claims 10.3 -
Goodwill impairment (2) 272.0 -
Special items
Biomet merger-related 74.4 173.8
Other special items 132.0 41.0
Merger-related and other expense in other expense, net 2.1 4.7
Debt extinguishment - 53.3
Taxes on above items (3) (134.9) (152.0)
U.S. tax reform (4) (1,305.5) -
Other certain tax adjustments (5) (56.7) (8.9) Adjusted Net Earnings 428.5$ 434.1$
FOR THE THREE MONTHS ENDED DECEMBER 31, 2017 and 2016
(in millions, unaudited)
Three Months
Ended December 31,
(2) The Company recognized a $272.0 million non-cash goodwill impairment charge in the fourth quarter of 2018 related to
its Spine less Asia Pacific reporting unit during its annual goodwill impairment testing. The impairment was driven by integration
issues between the legacy Zimmer, Biomet and LDR businesses. In the third quarter of 2018, the Company recognized a
$32.7 million non-cash goodwill impairment charge related to its Office Based Technologies reporting unit. Operating performance
of this reporting unit has been lower than expected due to integration issues, management turnover and poor execution of its operating plans.
(3) The tax effect for the U.S. jurisdiction is calculated based on an effective rate considering federal and state taxes, as well
as permanent items where the items were or are projected to be incurred. For jurisdictions outside the U.S., the tax effect
is estimated based upon the statutory rates where the items were or are projected to be incurred.
(4) U.S. tax reform resulted in a net favorable provisional adjustment due to the reduction of certain deferred tax liabilities,
which were partially offset by provisional tax charges related to the toll tax provision of U.S. tax reform.
(5) In 2017, other certain tax adjustments relate to a favorable tax rate change in a foreign jurisdiction and net favorable adjustments
from internal restructuring transactions. The 2016 adjustment primarily includes a favorable resolution of certain tax matters
with taxing authorities offset by internal restructuring transactions that provide the Company access to offshore funds in a tax efficient manner.
29
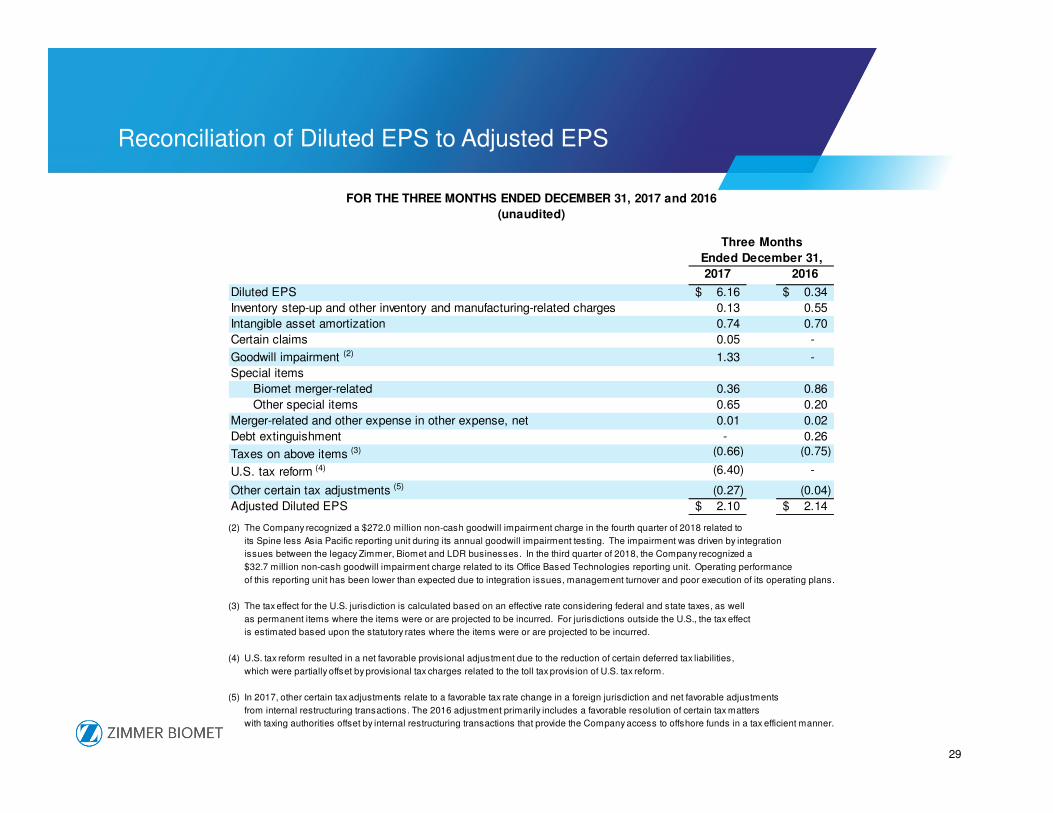
Reconciliation of Diluted EPS to Adjusted EPS
2017 2016
Diluted EPS 6.16$ 0.34$
Inventory step-up and other inventory and manufacturing-related charges 0.13 0.55
Intangible asset amortization 0.74 0.70
Certain claims 0.05 -
Goodwill impairment (2) 1.33 -
Special items
Biomet merger-related 0.36 0.86
Other special items 0.65 0.20
Merger-related and other expense in other expense, net 0.01 0.02
Debt extinguishment - 0.26
Taxes on above items (3) (0.66) (0.75)
U.S. tax reform (4) (6.40) -
Other certain tax adjustments (5) (0.27) (0.04)
Adjusted Diluted EPS 2.10$ 2.14$
Ended December 31,
FOR THE THREE MONTHS ENDED DECEMBER 31, 2017 and 2016
(unaudited)
Three Months
(2) The Company recognized a $272.0 million non-cash goodwill impairment charge in the fourth quarter of 2018 related to
its Spine less Asia Pacific reporting unit during its annual goodwill impairment testing. The impairment was driven by integration
issues between the legacy Zimmer, Biomet and LDR businesses. In the third quarter of 2018, the Company recognized a
$32.7 million non-cash goodwill impairment charge related to its Office Based Technologies reporting unit. Operating performance
of this reporting unit has been lower than expected due to integration issues, management turnover and poor execution of its operating plans.
(3) The tax effect for the U.S. jurisdiction is calculated based on an effective rate considering federal and state taxes, as well
as permanent items where the items were or are projected to be incurred. For jurisdictions outside the U.S., the tax effect
is estimated based upon the statutory rates where the items were or are projected to be incurred.
(4) U.S. tax reform resulted in a net favorable provisional adjustment due to the reduction of certain deferred tax liabilities,
which were partially offset by provisional tax charges related to the toll tax provision of U.S. tax reform.
(5) In 2017, other certain tax adjustments relate to a favorable tax rate change in a foreign jurisdiction and net favorable adjustments
from internal restructuring transactions. The 2016 adjustment primarily includes a favorable resolution of certain tax matters
with taxing authorities offset by internal restructuring transactions that provide the Company access to offshore funds in a tax efficient manner.
30
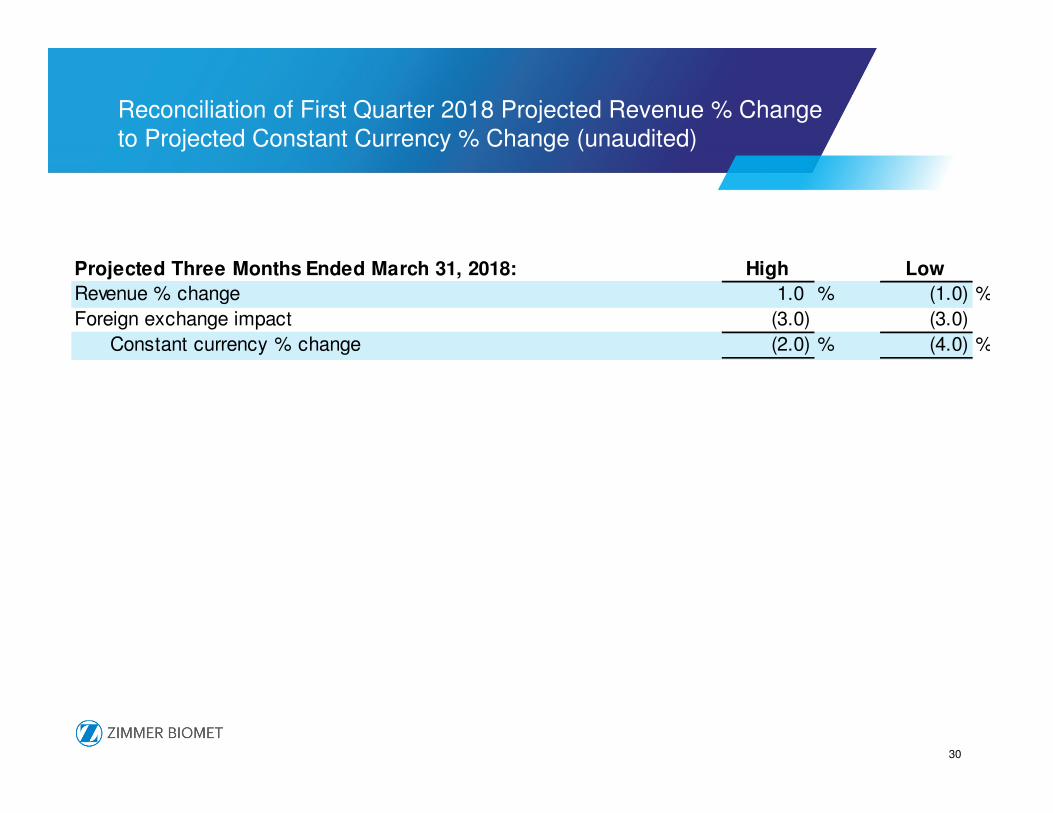
Reconciliation of First Quarter 2018 Projected Revenue % Change to Projected Constant Currency % Change (unaudited)
Projected Three Months Ended March 31, 2018: High Low
Revenue % change 1.0 % (1.0) %
Foreign exchange impact (3.0) (3.0)
Constant currency % change (2.0) % (4.0) %
31
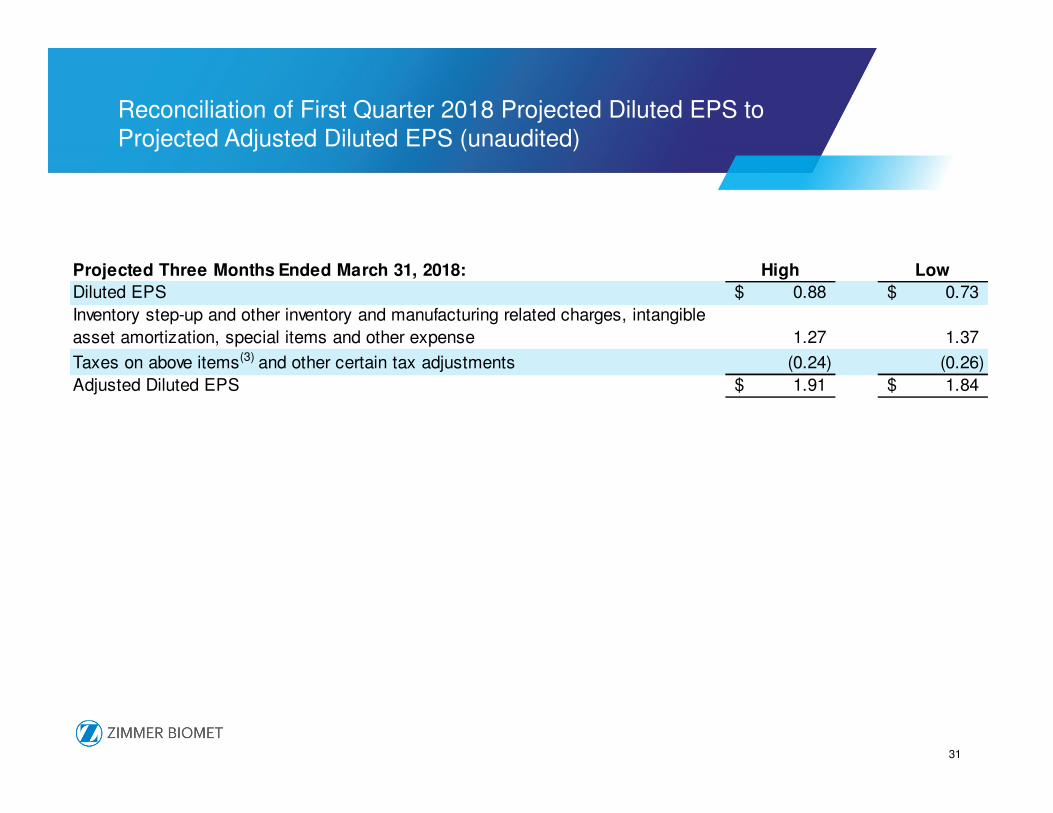
Reconciliation of First Quarter 2018 Projected Diluted EPS to Projected Adjusted Diluted EPS (unaudited)
Projected Three Months Ended March 31, 2018: High Low
Diluted EPS 0.88$ 0.73$
Inventory step-up and other inventory and manufacturing related charges, intangible
asset amortization, special items and other expense 1.27 1.37
Taxes on above items(3) and other certain tax adjustments (0.24) (0.26)
Adjusted Diluted EPS 1.91$ 1.84$
32