Embed Size (px)
Citation preview
1
Zscaler Reports Second Quarter Fiscal 2021 Financial Results
Second Quarter Highlights
• Revenue grows 55% year-over-year to $157.0 million
• Calculated billings grows 71% year-over-year to $232.0 million
• Deferred revenue grows 60% year-over-year to $446.8 million
• GAAP net loss of $67.5 million compared to GAAP net loss of $29.2 million on a year-over-year basis
• Non-GAAP net income of $14.0 million compared to non-GAAP net income of $13.5 million on a year-over-year basis
SAN JOSE, California - February 25, 2021 - Zscaler, Inc. (Nasdaq: ZS), the leader in cloud security, today announced financial results for its second quarter of fiscal year 2021, ended January 31, 2021.
"Businesses are accelerating their digital transformation, and this drove our strong second quarter results," said Jay Chaudhry, Chairman and CEO of Zscaler. "Our customers are turning to Zscaler’s Zero Trust Exchange to implement Zero Trust architecture to protect users, workloads and applications, and improve user experience. With strong momentum in our business, we will continue to aggressively invest to pursue our large market opportunity."
Second Quarter Fiscal 2021 Financial Highlights
• Revenue: $157.0 million, an increase of 55% year-over-year.
• Income (loss) from operations: GAAP loss from operations was $53.9 million, or 34% of total revenue, compared to $30.3 million, or 30% of total revenue, in the second quarter of fiscal 2020. Non-GAAP income from operations was $14.8 million, or 9% of total revenue, compared to $12.4 million, or 12% of total revenue, in the second quarter of fiscal 2020.
• Net income (loss): GAAP net loss was $67.5 million, compared to $29.2 million in the second quarter of fiscal 2020. Non-GAAP net income was $14.0 million, compared to $13.5 million in the second quarter of fiscal 2020.
• Net income (loss) per share: GAAP net loss per share was $0.50, compared to $0.23 in the second quarter of fiscal 2020. Non-GAAP net income per share was $0.10 for both the second quarter of fiscal 2021 and 2020.
• Cash flow: Cash provided by operations was $30.4 million, or 19% of revenue, compared to $5.4 million, or 5% of revenue, in the second quarter of fiscal 2020. Free cash flow was $18.0 million, or 11% of revenue, compared to negative $1.9 million, or negative 2% of revenue, in the second quarter of fiscal 2020. The free cash flow in the second quarter of fiscal 2020 was impacted by a $15.0 million cash payment as a result of a legal settlement agreement. Excluding this payment, free cash flow would have been $13.1 million, or 13% of revenue.
• Deferred revenue: $446.8 million as of January 31, 2021, an increase of 60% year-over-year.
• Cash, cash equivalents and short-term investments: $1,444.7 million as of January 31, 2021, an increase of $74.2 million from July 31, 2020.
Recent Business Highlights
• Launched a security assessment program designed to help organizations assess the SolarWinds supply-chain attack, analyze potential impact on their organizations, and conform adherence to Zscaler’s recommended best practices.
2
• Recognized as the only Leader in the Gartner Magic Quadrant for Secure Web Gateways (December 2020). Zscaler
was positioned furthest in "Completeness of Vision" and highest in "Ability to Execute" among all 12 vendors evaluated in the report. This marks the 10th consecutive year Zscaler has been named a Leader in the Gartner Magic Quadrant for Secure Web Gateways.
• Delivered a successful virtual Zenith Live 2020, with keynote participants including leaders from Siemens, Hitachi America Ltd., and DB Schenker where they shared their experiences in driving secure, digital transformation beyond the limits of legacy thinking.
• Introduced Zscaler Cloud Protection (ZCP), a new approach that takes the operational complexity and headaches out of cloud workload security. The new solution minimizes attack surfaces and automates globally enforced security policies across an organization’s multi-cloud footprint. This extends a zero-trust approach to cloud workloads, delivering the same high performance and reliability to protect business applications and internet access.
• Reached a new milestone by surpassing 5,000 customers during the quarter, including 500 of the Global 2000.
Change in Non-GAAP Measures Presentation
Effective August 1, 2020, the beginning of our fiscal year ending July 31, 2021, we have presented employer payroll taxes related to employee equity award transactions, which is a cash expense, as part of stock-based compensation expense in our non-GAAP results. These payroll taxes have been excluded from our non-GAAP results because they are tied to the timing and size of the exercise or vesting of the underlying equity awards and the price of our common stock at the time of vesting or exercise may vary from period to period independent of the operating performance of our business. Prior periods amounts have been recasted to conform to this presentation.
Financial Outlook
For the third quarter of fiscal 2021, we expect:
• Total revenue of $162 million to $164 million
• Non-GAAP income from operations of $11 million to $12 million
• Non-GAAP earnings per share of approximately $0.07, assuming approximately 146 million common shares outstanding
For the full year fiscal 2021, we expect:
• Total revenue of $634 million to $638 million
• Calculated billings of $820 million to $825 million
• Non-GAAP income from operations of $59 million to $61 million
• Non-GAAP net income per share of $0.39 to $0.40, assuming approximately 145 million to 146 million common shares outstanding
These statements are forward-looking and actual results may differ materially. Refer to the Forward-Looking Statements safe harbor below for information on the factors that could cause our actual results to differ materially from these forward-looking statements.
Guidance for non-GAAP income from operations excludes stock-based compensation expense and related payroll taxes, amortization expense of acquired intangible assets, asset impairment related to facility exit, certain litigation-related expenses, amortization of debt discount and issuance costs and income tax effects generated by intangible assets acquired in business
3
acquisitions. Guidance for non-GAAP net income per share includes the anti-dilutive impact of the capped call transactions entered into in connection with our convertible senior notes issued in June 2020. We have not reconciled our expectations to non-GAAP income from operations and non-GAAP net income per share to their most directly comparable GAAP measures because certain items are out of our control or cannot be reasonably predicted. Accordingly, a reconciliation for the guidance for non-GAAP income from operations and non-GAAP net income per share is not available without unreasonable effort.
Conference Call and Webcast Information
Zscaler will host a conference call for analysts and investors to discuss its second quarter fiscal 2021 earnings results and outlook for its third quarter of fiscal 2021 and full year fiscal 2021 today at 1:30 p.m. Pacific time (4:30 p.m. Eastern time).
Date: Thursday, February 25, 2021 Time: 1:30 p.m. PT Webcast: https://ir.zscaler.com Dial-in number: 918-922-3018
Upcoming Conferences
Third quarter of fiscal 2021 virtual investor conference participation schedule:
• JMP Securities Technology Conference Monday, March 1, 2021
• Morgan Stanley Technology, Media and Telecom Conference Tuesday, March 2, 2021
• Credit Suisse Software Investor Day Monday, March 8, 2021
• Truist Securities Technology, Internet and Services Conference Tuesday, March 9, 2021
• Loop Capital Markets Consumer, Industrials, and TMT Investor Conference Friday, March 12, 2021
Sessions which offer a webcast will be available on the Investor Relations section of the Zscaler website at
https://ir.zscaler.com.
4
Forward-Looking Statements
This press release contains forward-looking statements that involve risks and uncertainties, including statements regarding our future financial and operating performance, including our financial outlook for the third quarter of fiscal 2021 and full year fiscal 2021. There are a significant number of factors that could cause actual results to differ materially from statements made in this press release, including but not limited to: the duration and global impact of COVID-19 on our business, operations and financial results and the economy in general; our ability as an organization to acquire and integrate other companies, products or technologies in a successful manner; our limited operating history; our ability to identify and effectively implement the necessary changes to address execution challenges; risks associated with managing our rapid growth, including fluctuations from period to period; our limited experience with new product and subscription and support introductions and the risks associated with new products and subscription and support offerings, including the discovery of software bugs; our ability to attract and retain new customers; the failure to timely develop and achieve market acceptance of new products and subscriptions as well as existing products and subscription and support; rapidly evolving technological developments in the market for network security products and subscription and support offerings and our ability to remain competitive; length of sales cycles; and general market, political, economic and business conditions.
Additional risks and uncertainties that could affect our financial results are included under the captions “Risk Factors” and “Management’s Discussion and Analysis of Financial Condition and Results of Operations” set forth from time to time in our filings and reports with the Security Exchange Commission (SEC), including our Annual Report on Form 10-K for the fiscal year ended July 31, 2020 filed on September 17, 2020, as well as future filings and reports by us, copies of which are available on our website at ir.zscaler.com and on the SEC’s website at www.sec.gov. You should not rely on these forward-looking statements, as actual outcomes and results may differ materially from those contemplated by these forward-looking statements as a result of such risks and uncertainties. Additional information will also be set forth in other filings that we make with the SEC from time to time. All forward-looking statements in this press release are based on information available to us as of the date hereof, and we do not assume any obligation to update the forward-looking statements provided to reflect events that occur or circumstances that exist after the date on which they were made.
Use of Non-GAAP Financial Information
We believe that the presentation of non-GAAP financial information provides important supplemental information to management and investors regarding financial and business trends relating to our financial condition and results of operations. For further information regarding why we believe that these non-GAAP measures provide useful information to investors, the specific manner in which management uses these measures, and some of the limitations associated with the use of these measures, please refer to the “Explanation of Non-GAAP Financial Measures" section of this press release.
About Zscaler
Zscaler (Nasdaq: ZS) accelerates digital transformation so customers can be more agile, efficient, resilient, and secure. The Zscaler Zero Trust Exchange protects thousands of customers from cyberattacks and data loss by securely connecting users, devices, and applications in any location. Distributed across more than 150 data centers globally, the SASE-based Zero Trust Exchange is the world’s largest in-line cloud security platform.
Zscaler™ and the other trademarks listed at https://www.zscaler.com/legal/trademarks are either (i) registered trademarks or service marks or (ii) trademarks or service marks of Zscaler, Inc. in the United States and/or other countries. Any other trademarks are the properties of their respective owners.
Investor Relations Contacts:
Bill Choi, CFA

5
SVP, Investor Relations and Strategic Finance (408) 816-1478 [email protected] Natalia Wodecki Media Relations Contact [email protected]
6
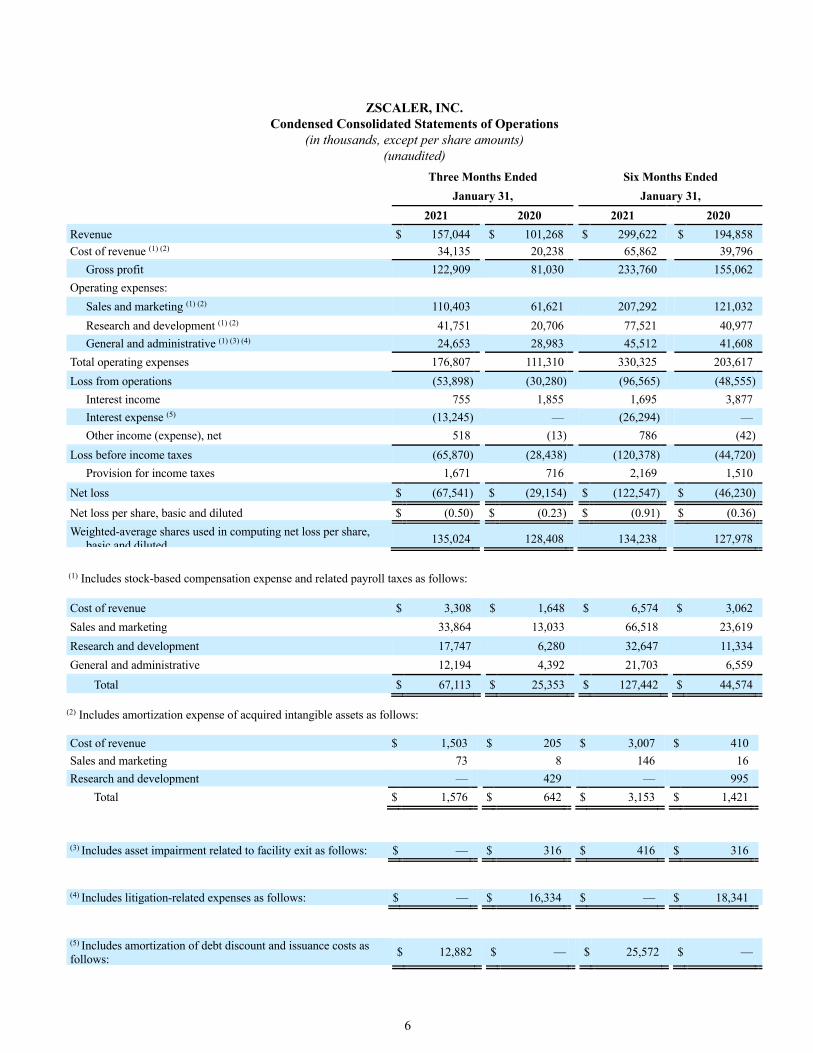
ZSCALER, INC. Condensed Consolidated Statements of Operations
(in thousands, except per share amounts) (unaudited)
Three Months Ended Six Months Ended January 31, January 31, 2021 2020 2021 2020 Revenue $ 157,044 $ 101,268 $ 299,622 $ 194,858 Cost of revenue (1) (2) 34,135 20,238 65,862 39,796
Gross profit 122,909 81,030 233,760 155,062 Operating expenses:
Sales and marketing (1) (2) 110,403 61,621 207,292 121,032 Research and development (1) (2) 41,751 20,706 77,521 40,977 General and administrative (1) (3) (4) 24,653 28,983 45,512 41,608
Total operating expenses 176,807 111,310 330,325 203,617 Loss from operations (53,898) (30,280) (96,565) (48,555)
Interest income 755 1,855 1,695 3,877 Interest expense (5) (13,245) — (26,294) — Other income (expense), net 518 (13) 786 (42)
Loss before income taxes (65,870) (28,438) (120,378) (44,720) Provision for income taxes 1,671 716 2,169 1,510
Net loss $ (67,541) $ (29,154) $ (122,547) $ (46,230) Net loss per share, basic and diluted $ (0.50) $ (0.23) $ (0.91) $ (0.36) Weighted-average shares used in computing net loss per share,
basic and diluted 135,024 128,408 134,238 127,978
(1) Includes stock-based compensation expense and related payroll taxes as follows:
Cost of revenue $ 3,308 $ 1,648 $ 6,574 $ 3,062 Sales and marketing 33,864 13,033 66,518 23,619 Research and development 17,747 6,280 32,647 11,334 General and administrative 12,194 4,392 21,703 6,559
Total $ 67,113 $ 25,353 $ 127,442 $ 44,574 (2) Includes amortization expense of acquired intangible assets as follows:
Cost of revenue $ 1,503 $ 205 $ 3,007 $ 410 Sales and marketing 73 8 146 16 Research and development — 429 — 995
Total $ 1,576 $ 642 $ 3,153 $ 1,421
(3) Includes asset impairment related to facility exit as follows: $ — $ 316 $ 416 $ 316
(4) Includes litigation-related expenses as follows: $ — $ 16,334 $ — $ 18,341
(5) Includes amortization of debt discount and issuance costs as follows: $ 12,882 $ — $ 25,572 $ —

7
8
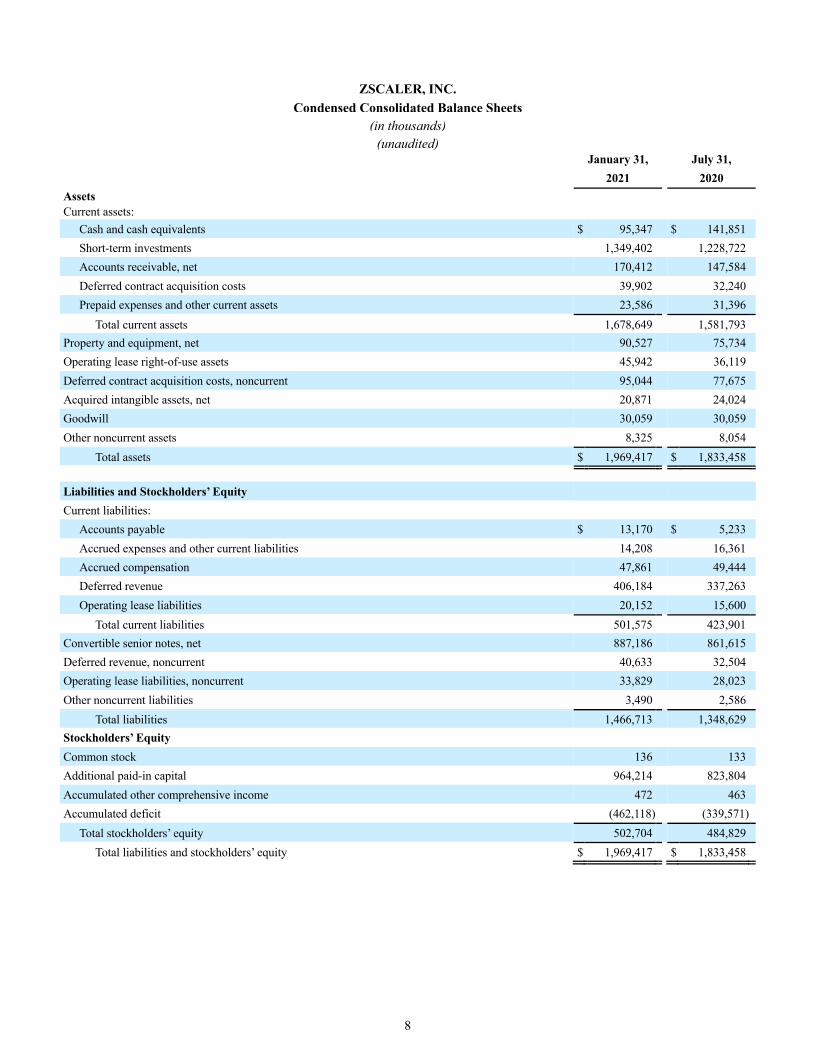
ZSCALER, INC. Condensed Consolidated Balance Sheets
(in thousands) (unaudited)
January 31, July 31, 2021 2020 Assets Current assets:
Cash and cash equivalents $ 95,347 $ 141,851 Short-term investments 1,349,402 1,228,722 Accounts receivable, net 170,412 147,584 Deferred contract acquisition costs 39,902 32,240 Prepaid expenses and other current assets 23,586 31,396
Total current assets 1,678,649 1,581,793 Property and equipment, net 90,527 75,734 Operating lease right-of-use assets 45,942 36,119 Deferred contract acquisition costs, noncurrent 95,044 77,675 Acquired intangible assets, net 20,871 24,024 Goodwill 30,059 30,059 Other noncurrent assets 8,325 8,054
Total assets $ 1,969,417 $ 1,833,458 Liabilities and Stockholders’ Equity Current liabilities:
Accounts payable $ 13,170 $ 5,233 Accrued expenses and other current liabilities 14,208 16,361 Accrued compensation 47,861 49,444 Deferred revenue 406,184 337,263 Operating lease liabilities 20,152 15,600
Total current liabilities 501,575 423,901 Convertible senior notes, net 887,186 861,615 Deferred revenue, noncurrent 40,633 32,504 Operating lease liabilities, noncurrent 33,829 28,023 Other noncurrent liabilities 3,490 2,586
Total liabilities 1,466,713 1,348,629 Stockholders’ Equity Common stock 136 133 Additional paid-in capital 964,214 823,804 Accumulated other comprehensive income 472 463 Accumulated deficit (462,118) (339,571)
Total stockholders’ equity 502,704 484,829 Total liabilities and stockholders’ equity $ 1,969,417 $ 1,833,458
9
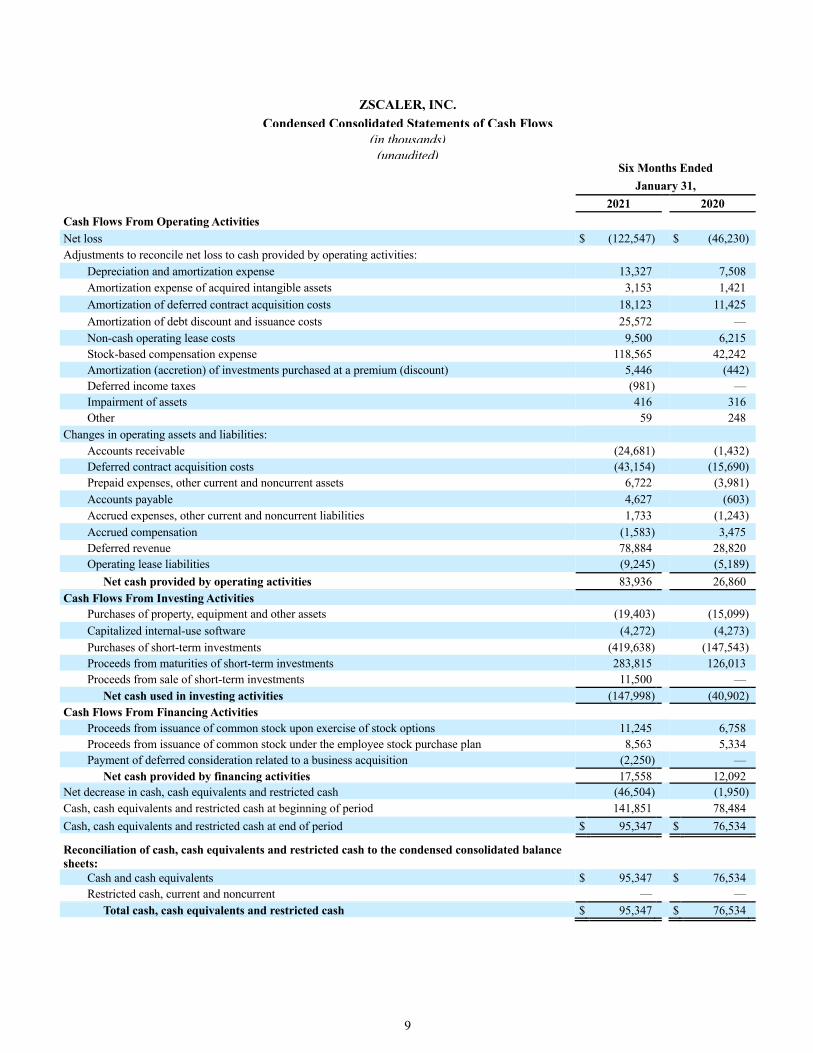
ZSCALER, INC. Condensed Consolidated Statements of Cash Flows
(in thousands) (unaudited)
Six Months Ended January 31, 2021 2020 Cash Flows From Operating Activities Net loss $ (122,547) $ (46,230) Adjustments to reconcile net loss to cash provided by operating activities:
Depreciation and amortization expense 13,327 7,508 Amortization expense of acquired intangible assets 3,153 1,421 Amortization of deferred contract acquisition costs 18,123 11,425 Amortization of debt discount and issuance costs 25,572 — Non-cash operating lease costs 9,500 6,215 Stock-based compensation expense 118,565 42,242 Amortization (accretion) of investments purchased at a premium (discount) 5,446 (442) Deferred income taxes (981) — Impairment of assets 416 316 Other 59 248
Changes in operating assets and liabilities: Accounts receivable (24,681) (1,432) Deferred contract acquisition costs (43,154) (15,690) Prepaid expenses, other current and noncurrent assets 6,722 (3,981) Accounts payable 4,627 (603) Accrued expenses, other current and noncurrent liabilities 1,733 (1,243) Accrued compensation (1,583) 3,475 Deferred revenue 78,884 28,820 Operating lease liabilities (9,245) (5,189)
Net cash provided by operating activities 83,936 26,860 Cash Flows From Investing Activities
Purchases of property, equipment and other assets (19,403) (15,099) Capitalized internal-use software (4,272) (4,273) Purchases of short-term investments (419,638) (147,543) Proceeds from maturities of short-term investments 283,815 126,013 Proceeds from sale of short-term investments 11,500 —
Net cash used in investing activities (147,998) (40,902) Cash Flows From Financing Activities
Proceeds from issuance of common stock upon exercise of stock options 11,245 6,758 Proceeds from issuance of common stock under the employee stock purchase plan 8,563 5,334 Payment of deferred consideration related to a business acquisition (2,250) —
Net cash provided by financing activities 17,558 12,092 Net decrease in cash, cash equivalents and restricted cash (46,504) (1,950) Cash, cash equivalents and restricted cash at beginning of period 141,851 78,484 Cash, cash equivalents and restricted cash at end of period $ 95,347 $ 76,534 Reconciliation of cash, cash equivalents and restricted cash to the condensed consolidated balance sheets:
Cash and cash equivalents $ 95,347 $ 76,534 Restricted cash, current and noncurrent — —
Total cash, cash equivalents and restricted cash $ 95,347 $ 76,534
10
ZSCALER, INC.
Reconciliation of GAAP to Non-GAAP Financial Measures (in thousands)
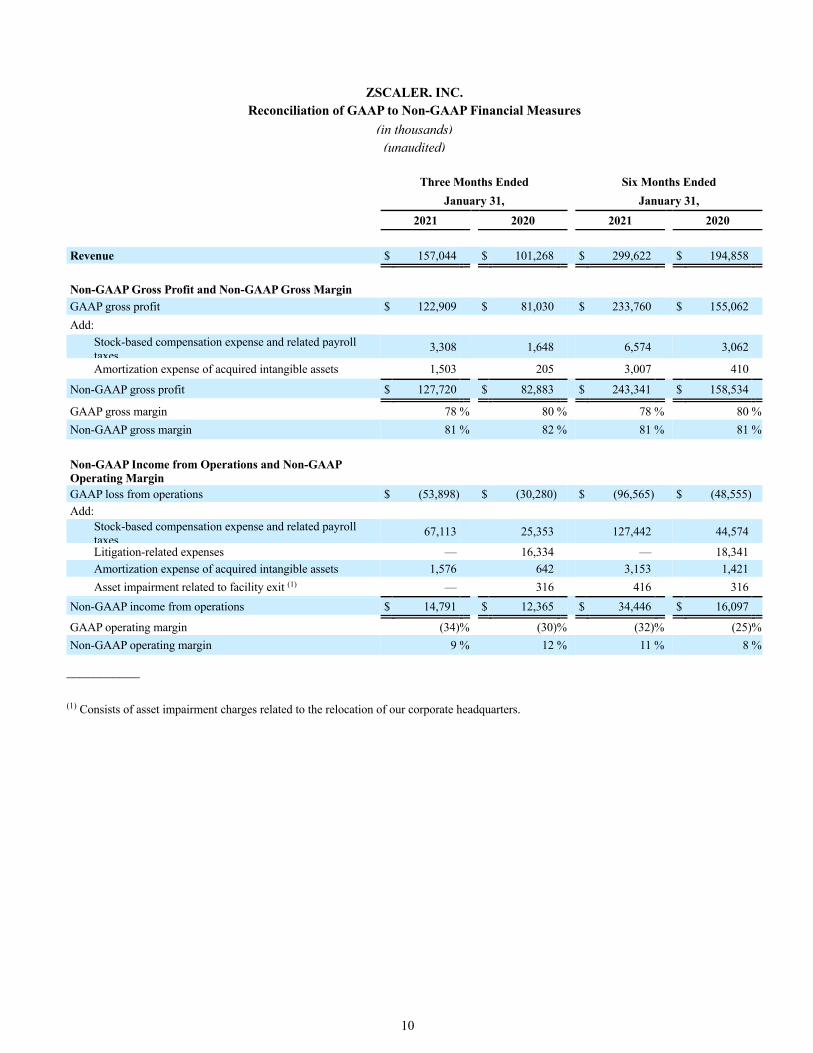
(unaudited) Three Months Ended Six Months Ended January 31, January 31, 2021 2020 2021 2020 Revenue $ 157,044 $ 101,268 $ 299,622 $ 194,858 Non-GAAP Gross Profit and Non-GAAP Gross Margin GAAP gross profit $ 122,909 $ 81,030 $ 233,760 $ 155,062 Add:
Stock-based compensation expense and related payroll taxes 3,308 1,648 6,574 3,062 Amortization expense of acquired intangible assets 1,503 205 3,007 410
Non-GAAP gross profit $ 127,720 $ 82,883 $ 243,341 $ 158,534 GAAP gross margin 78 % 80 % 78 % 80 % Non-GAAP gross margin 81 % 82 % 81 % 81 % Non-GAAP Income from Operations and Non-GAAP Operating Margin GAAP loss from operations $ (53,898) $ (30,280) $ (96,565) $ (48,555) Add:
Stock-based compensation expense and related payroll taxes 67,113 25,353 127,442 44,574 Litigation-related expenses — 16,334 — 18,341 Amortization expense of acquired intangible assets 1,576 642 3,153 1,421 Asset impairment related to facility exit (1) — 316 416 316
Non-GAAP income from operations $ 14,791 $ 12,365 $ 34,446 $ 16,097 GAAP operating margin (34) % (30) % (32) % (25) % Non-GAAP operating margin 9 % 12 % 11 % 8 %
___________
(1) Consists of asset impairment charges related to the relocation of our corporate headquarters.
11
ZSCALER, INC. Reconciliation of GAAP to Non-GAAP Financial Measures
(in thousands, except per share amounts) (unaudited)
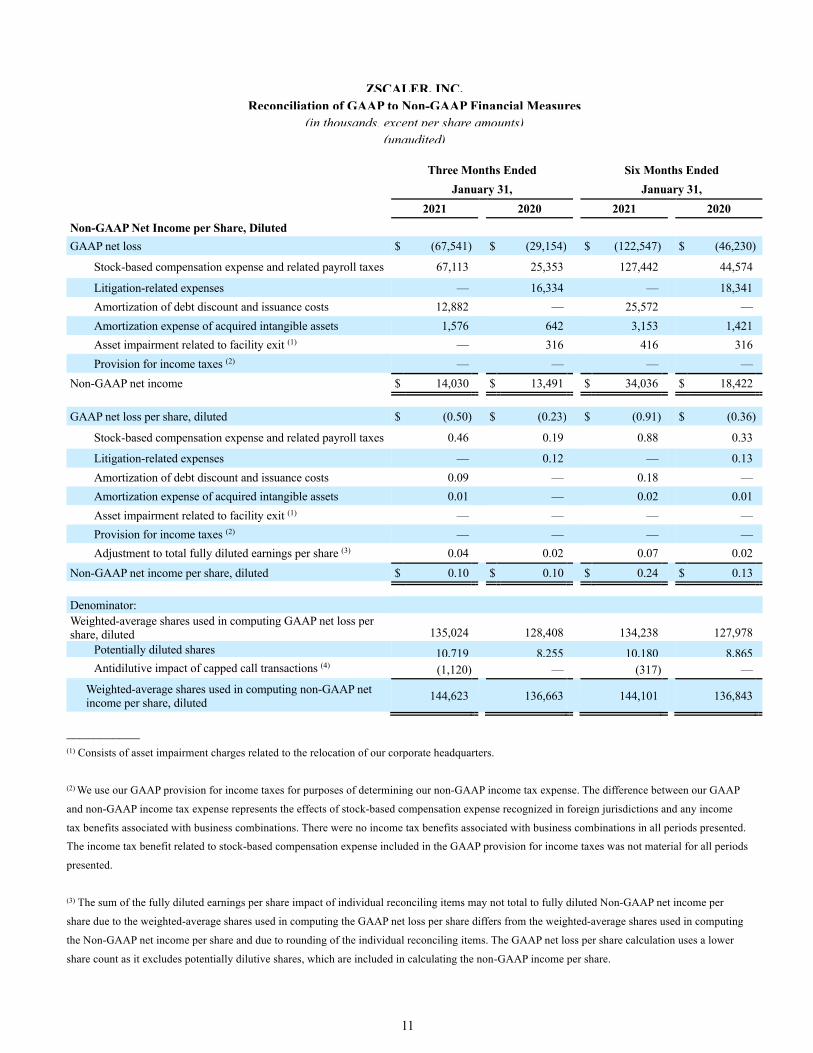
Three Months Ended Six Months Ended January 31, January 31, 2021 2020 2021 2020 Non-GAAP Net Income per Share, Diluted GAAP net loss $ (67,541) $ (29,154) $ (122,547) $ (46,230)
Stock-based compensation expense and related payroll taxes 67,113 25,353 127,442 44,574 Litigation-related expenses — 16,334 — 18,341 Amortization of debt discount and issuance costs 12,882 — 25,572 — Amortization expense of acquired intangible assets 1,576 642 3,153 1,421 Asset impairment related to facility exit (1) — 316 416 316 Provision for income taxes (2) — — — —
Non-GAAP net income $ 14,030 $ 13,491 $ 34,036 $ 18,422 GAAP net loss per share, diluted $ (0.50) $ (0.23) $ (0.91) $ (0.36)
Stock-based compensation expense and related payroll taxes 0.46 0.19 0.88 0.33 Litigation-related expenses — 0.12 — 0.13 Amortization of debt discount and issuance costs 0.09 — 0.18 — Amortization expense of acquired intangible assets 0.01 — 0.02 0.01 Asset impairment related to facility exit (1) — — — — Provision for income taxes (2) — — — — Adjustment to total fully diluted earnings per share (3) 0.04 0.02 0.07 0.02
Non-GAAP net income per share, diluted $ 0.10 $ 0.10 $ 0.24 $ 0.13 Denominator: Weighted-average shares used in computing GAAP net loss per share, diluted 135,024 128,408 134,238 127,978
Potentially diluted shares 10,719 8,255 10,180 8,865 Antidilutive impact of capped call transactions (4) (1,120) — (317) —
Weighted-average shares used in computing non-GAAP net income per share, diluted 144,623 136,663 144,101 136,843
___________ (1) Consists of asset impairment charges related to the relocation of our corporate headquarters.
(2) We use our GAAP provision for income taxes for purposes of determining our non-GAAP income tax expense. The difference between our GAAP
and non-GAAP income tax expense represents the effects of stock-based compensation expense recognized in foreign jurisdictions and any income
tax benefits associated with business combinations. There were no income tax benefits associated with business combinations in all periods presented.
The income tax benefit related to stock-based compensation expense included in the GAAP provision for income taxes was not material for all periods
presented.
(3) The sum of the fully diluted earnings per share impact of individual reconciling items may not total to fully diluted Non-GAAP net income per
share due to the weighted-average shares used in computing the GAAP net loss per share differs from the weighted-average shares used in computing
the Non-GAAP net income per share and due to rounding of the individual reconciling items. The GAAP net loss per share calculation uses a lower
share count as it excludes potentially dilutive shares, which are included in calculating the non-GAAP income per share.
12
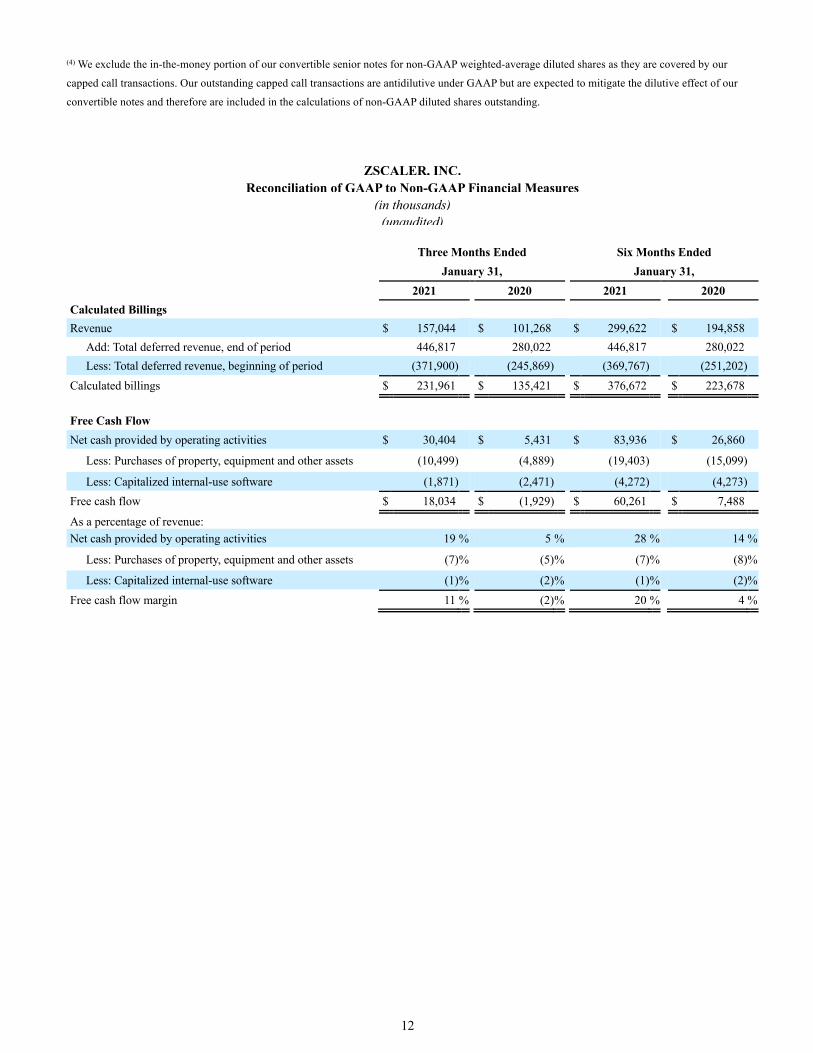
(4) We exclude the in-the-money portion of our convertible senior notes for non-GAAP weighted-average diluted shares as they are covered by our
capped call transactions. Our outstanding capped call transactions are antidilutive under GAAP but are expected to mitigate the dilutive effect of our
convertible notes and therefore are included in the calculations of non-GAAP diluted shares outstanding.
ZSCALER, INC. Reconciliation of GAAP to Non-GAAP Financial Measures
(in thousands) (unaudited)
Three Months Ended Six Months Ended January 31, January 31, 2021 2020 2021 2020 Calculated Billings Revenue $ 157,044 $ 101,268 $ 299,622 $ 194,858
Add: Total deferred revenue, end of period 446,817 280,022 446,817 280,022 Less: Total deferred revenue, beginning of period (371,900) (245,869) (369,767) (251,202)
Calculated billings $ 231,961 $ 135,421 $ 376,672 $ 223,678 Free Cash Flow Net cash provided by operating activities $ 30,404 $ 5,431 $ 83,936 $ 26,860
Less: Purchases of property, equipment and other assets (10,499) (4,889) (19,403) (15,099) Less: Capitalized internal-use software (1,871) (2,471) (4,272) (4,273)
Free cash flow $ 18,034 $ (1,929) $ 60,261 $ 7,488 As a percentage of revenue: Net cash provided by operating activities 19 % 5 % 28 % 14 %
Less: Purchases of property, equipment and other assets (7) % (5) % (7) % (8) % Less: Capitalized internal-use software (1) % (2) % (1) % (2) %
Free cash flow margin 11 % (2) % 20 % 4 %
13
ZSCALER, INC. Explanation of Non-GAAP Financial Measures
In addition to our results determined in accordance with generally accepted accounting principles in the United States of America (GAAP), we believe the following non-GAAP measures are useful in evaluating our operating performance. We use the following non-GAAP financial information to evaluate our ongoing operations and for internal planning and forecasting purposes. We believe that non-GAAP financial information, when taken collectively, may be helpful to investors because it provides consistency and comparability with past financial performance. However, non-GAAP financial information is presented for supplemental informational purposes only, has limitations as an analytical tool and should not be considered in isolation or as a substitute for financial information presented in accordance with GAAP. In particular, free cash flow is not a substitute for cash used in operating activities. Additionally, the utility of free cash flow as a measure of our liquidity is further limited as it does not represent the total increase or decrease in our cash balance for a given period. In addition, other companies, including companies in our industry, may calculate similarly-titled non-GAAP measures differently or may use other measures to evaluate their performance, all of which could reduce the usefulness of our non-GAAP financial measures as tools for comparison. A reconciliation of our historical non-GAAP financial measures to their most directly comparable financial measures stated in accordance with GAAP has been included in this press release. Investors are cautioned that there are a number of limitations associated with the use of non-GAAP financial measures and key metrics as analytical tools. Investors are encouraged to review these reconciliations, and not to rely on any single financial measure to evaluate our business.
Expenses Excluded from Non-GAAP Measures
Stock-based compensation expense is excluded primarily because they are non-cash expenses that management believes are not reflective of our ongoing operational performance. Effective August 1, 2020, the beginning of our fiscal year ending July 31, 2021, we have presented employer payroll taxes related to employee equity award transactions, which is a cash expense, as part of stock-based compensation expense in our non-GAAP results. These payroll taxes have been excluded from our non-GAAP results as these are tied to the timing and size of the exercise or vesting of the underlying equity awards and the price of our common stock at the time of vesting or exercise, which may vary from period to period independent of the operating performance of our business. Prior period amounts have been recasted to conform to this presentation. Amortization expense of acquired intangible assets is excluded because these are considered by management to be outside of our core business operating performance. Asset impairments related to facility exit costs are excluded because such charges are not reflective of our ongoing operational performance. Amortization of debt discount and issuance costs from our convertible senior notes are excluded because they are non-cash expenses and are not reflective of our ongoing operational performance. We also exclude certain litigation-related expenses consisting of professional fees and related costs incurred by us in defending against significant claims that we deem not to be in the ordinary course of our business and, if applicable, actual losses and accruals related to estimated losses in connection with these claims. There are many uncertainties and potential outcomes associated with any litigation, including the expense of litigation, timing of such expenses, court rulings, unforeseen developments, complications and delays, each of which may affect our results of operations from period to period, as well as the unknown magnitude of the potential loss relating to any lawsuit, all of which are inherently subject to change, difficult to predict and could adversely affect our results of operations. We estimate the tax effect of these items on our non-GAAP results and may adjust our GAAP provision for income taxes, if such effects have a material impact to our non-GAAP results.
Non-GAAP Financial Measures
Non-GAAP Gross Profit and Non-GAAP Gross Margin. We define non-GAAP gross profit as GAAP gross profit excluding stock-based compensation expense and related payroll taxes and amortization expense of acquired intangible assets. We define non-GAAP gross margin as non-GAAP gross profit as a percentage of revenue.
Non-GAAP Income from Operations and Non-GAAP Operating Margin. We define non-GAAP income from operations as GAAP loss from operations excluding stock-based compensation expense and related payroll taxes, amortization expense of acquired intangible assets, asset impairment related to facility exit and certain litigation-related expenses. We define non-GAAP operating margin as non-GAAP income from operations as a percentage of revenue.
Non-GAAP Net Income per Share, Diluted. We define non-GAAP net income as GAAP net loss plus stock-based compensation expense and related payroll taxes, amortization expense of acquired intangible assets, asset impairment related to facility exit, amortization of debt discount and issuance costs, certain litigation-related expenses, income tax effects generated by the effects of stock-based compensation expense recognized in foreign jurisdictions and any income tax benefits associated with business combinations. We define non-GAAP net income per share, diluted, as non-GAAP net income divided by the weighted-average diluted shares outstanding, which includes the dilutive effect of potentially diluted common stock equivalents outstanding during the period and the antidilutive impact of the capped call transactions entered into in connection with our convertible senior notes issued in June 2020.
Free Cash Flow and Free Cash Flow Margin. We define free cash flow as net cash provided by operating activities less purchases of property, equipment and other assets and capitalized internal-use software. We define free cash flow margin as free cash flow divided by revenue. We believe that free cash flow and free cash flow margin are meaningful indicators of liquidity information to management and investors about the amount of cash generated from our operations that, after the investments in property, equipment and other assets and capitalized internal-use software, can be used for strategic initiatives.
Calculated Billings. We define calculated billings as total revenue plus the change in deferred revenue in a period. Calculated billings in any particular period aims to reflect amounts invoiced for subscriptions to access our cloud platform, together with related support services related to our new and existing customers. We typically invoice our customers annually in advance, and to a lesser extent quarterly in advance, monthly in advance or multi-year in advance.