O.I.V. 05International Organisation of Vine and WineInternational Organisation of Vine and Wine
International Organisationof Vine and Wine
1
O.I.V. 05International Organisation of Vine and WineInternational Organisation of Vine and Wine
International Organisationof Vine and Wine
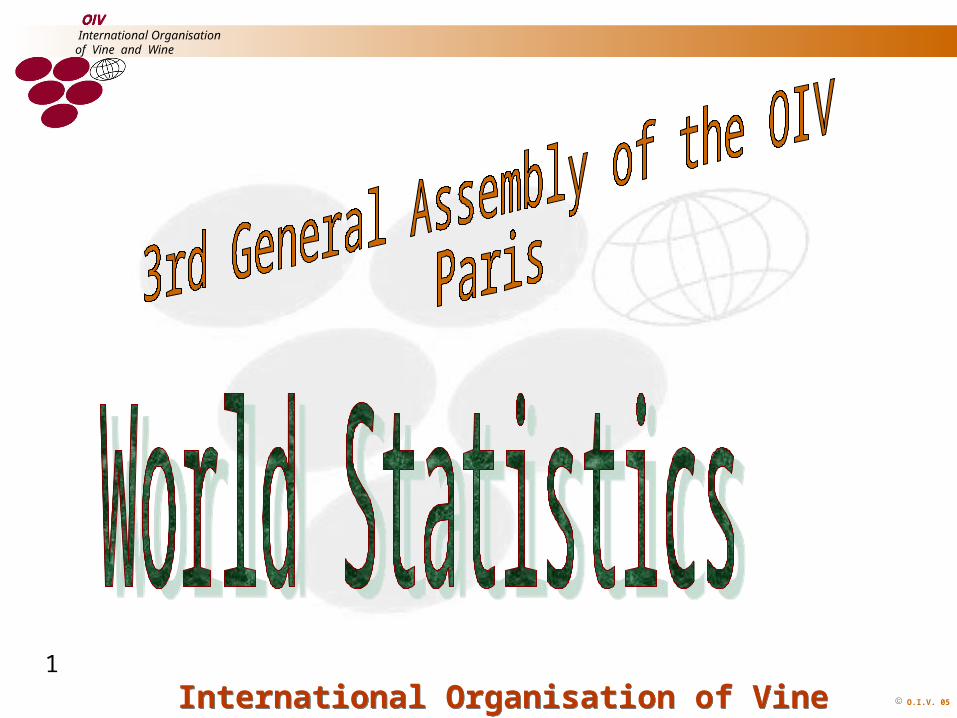
O.I.V. REPORT ON THESTATE OF THE VITIVINICULTURE
WORLD MARKET • Surface area of world vineyards •Grapes
•Global production •International trade
•Fresh grapes•Global production •Global consumption
•Raisins •Global production•Global consumption •International trade
•Wine•Global wine production • Global wine consumption• Degree of market equilibrium in the world of wine• International trade2
O.I.V. 05International Organisation of Vine and WineInternational Organisation of Vine and Wine
International Organisationof Vine and Wine Surface area of vineyards worldwide
Surface area of vineyards worldwide
3
O.I.V. 05International Organisation of Vine and WineInternational Organisation of Vine and Wine
International Organisationof Vine and Wine
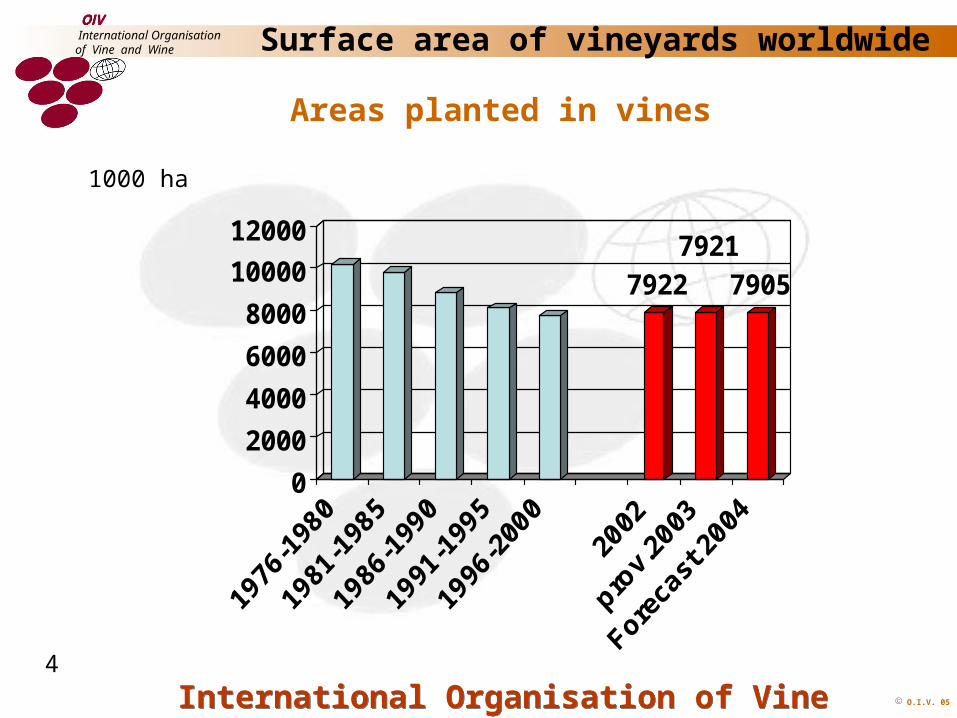
79227921
7905
0
2000
4000
6000
8000
10000
12000
1000 ha
Surface area of vineyards worldwide
Areas planted in vines
4
O.I.V. 05International Organisation of Vine and WineInternational Organisation of Vine and Wine
International Organisationof Vine and Wine
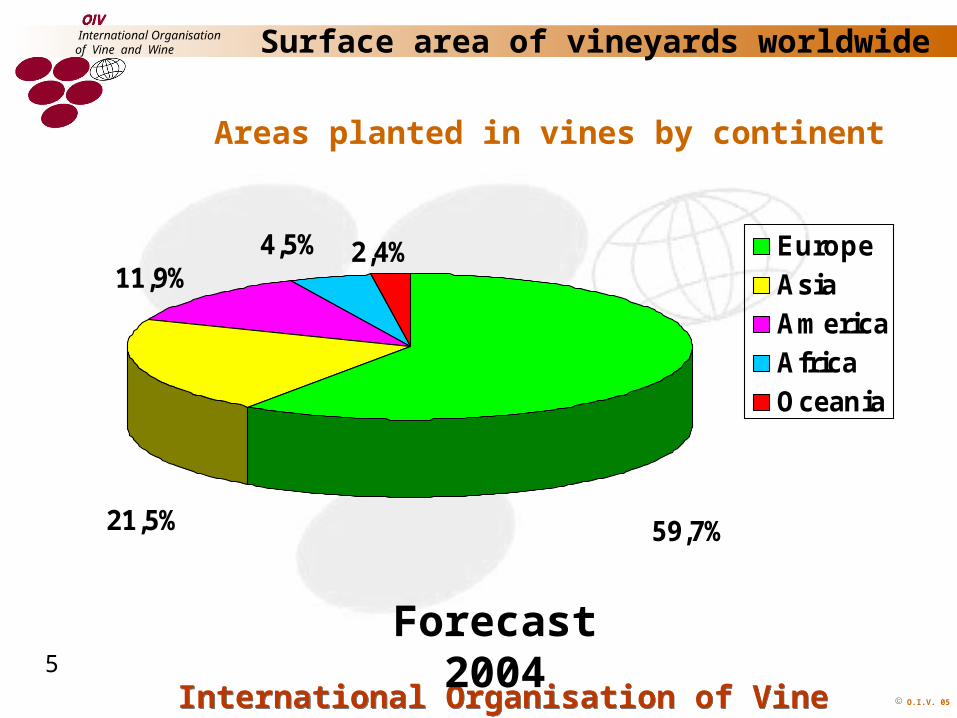
11,9%2,4%
59,7%
4,5%
21,5%
EuropeAsiaAmericaAfricaOceania
Areas planted in vines by continent
Forecast 2004
Surface area of vineyards worldwide
5
O.I.V. 05International Organisation of Vine and WineInternational Organisation of Vine and Wine
International Organisationof Vine and Wine
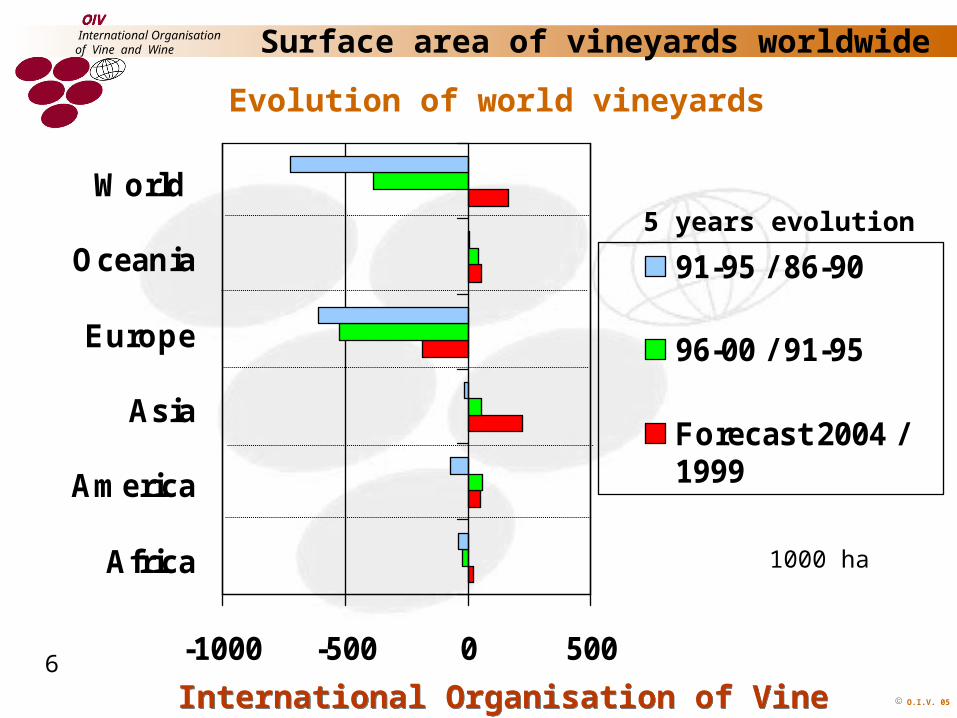
-1000 -500 0 500
Africa
America
Asia
Europe
Oceania
World
91-95 / 86-90
96-00 / 91-95
Forecast 2004 /1999
Evolution of world vineyards
Surface area of vineyards worldwide
1000 ha
5 years evolution
6
O.I.V. 05International Organisation of Vine and WineInternational Organisation of Vine and Wine
International Organisationof Vine and Wine Surface area of vineyards worldwide
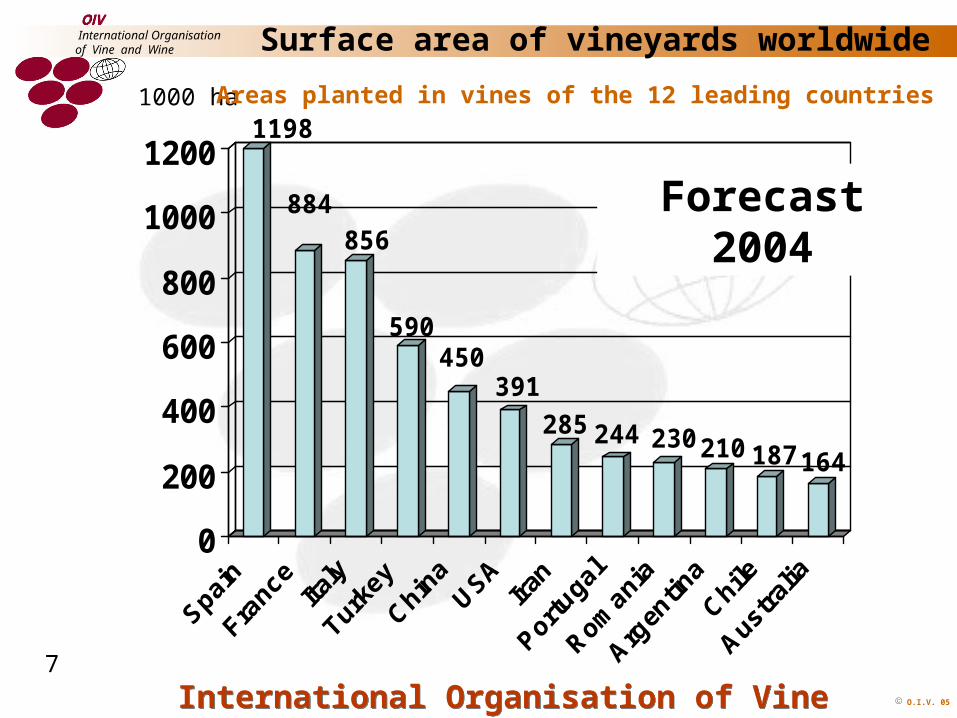
1198
884856
590450
391
285 244 230 210 187 164
0
200
400
600
800
1000
1200
1000 ha Areas planted in vines of the 12 leading countries
Forecast 2004
7
O.I.V. 05International Organisation of Vine and WineInternational Organisation of Vine and Wine
International Organisationof Vine and Wine Surface area of vineyards worldwide
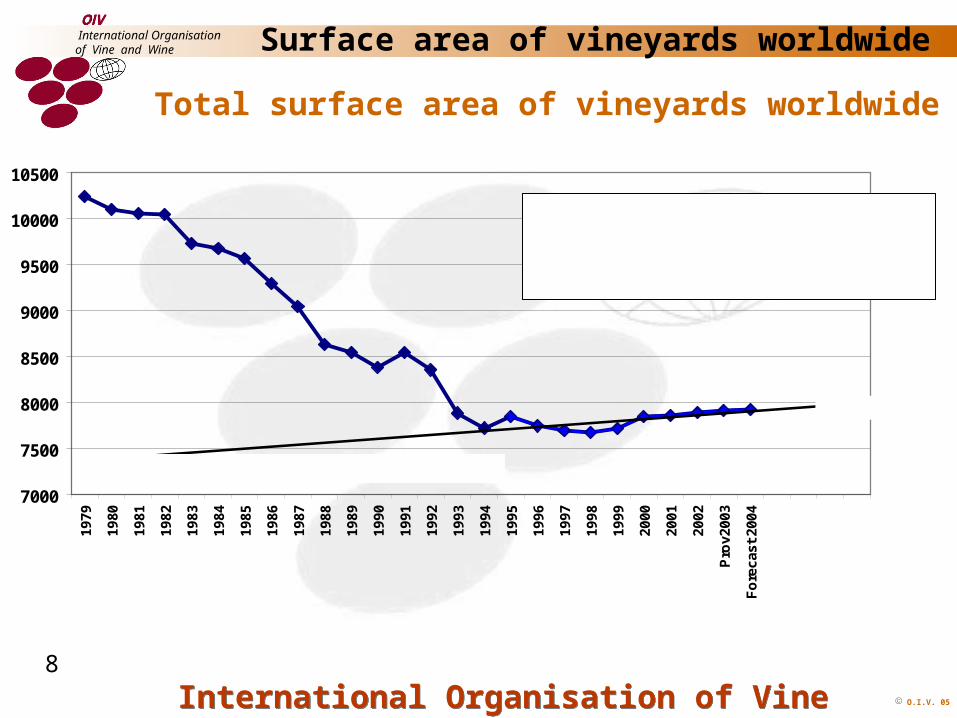
Total surface area of vineyards worldwide
7000
7500
8000
8500
9000
9500
10000
10500
1979
1980
1981
1982
1983
1984
1985
1986
1987
1988
1989
1990
1991
1992
1993
1994
1995
1996
1997
1998
1999
2000
2001
2002
Pro
v200
3
Fo
reca
st 2
004
SOURCE : OIV + conjoncture Mars 2005 (PA) Pro
jec
t.2
00
8
8000 mha
NB: if the rights for replanting within the EU-15 are taken into consideration and replanting is offset, we can foresee world area under vines in 2008 close to 8000 thousand ha
8
O.I.V. 05International Organisation of Vine and WineInternational Organisation of Vine and Wine
International Organisationof Vine and Wine Global grape production
Global grape production
9
O.I.V. 05International Organisation of Vine and WineInternational Organisation of Vine and Wine
International Organisationof Vine and Wine Global grape production
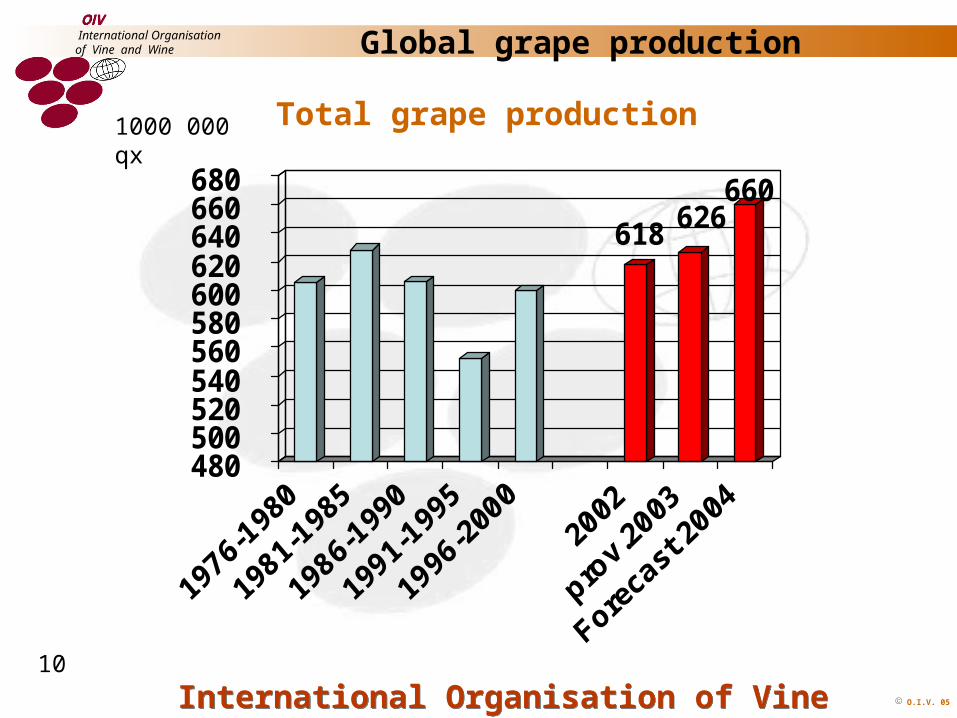
618 626660
480 500 520 540 560 580 600 620 640 660 680
Total grape production1000 000 qx
10
O.I.V. 05International Organisation of Vine and WineInternational Organisation of Vine and Wine
International Organisationof Vine and Wine Global grape production
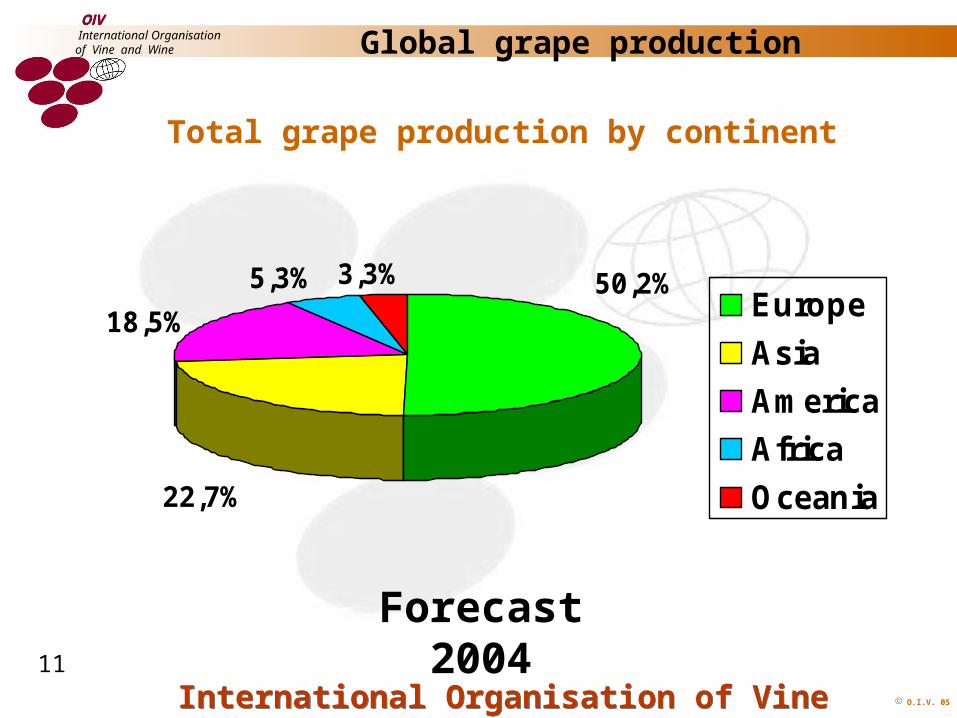
22,7%
18,5%
5,3% 50,2%3,3%Europe
Asia
America
Africa
Oceania
Forecast 2004
Total grape production by continent
11
O.I.V. 05International Organisation of Vine and WineInternational Organisation of Vine and Wine
International Organisationof Vine and Wine
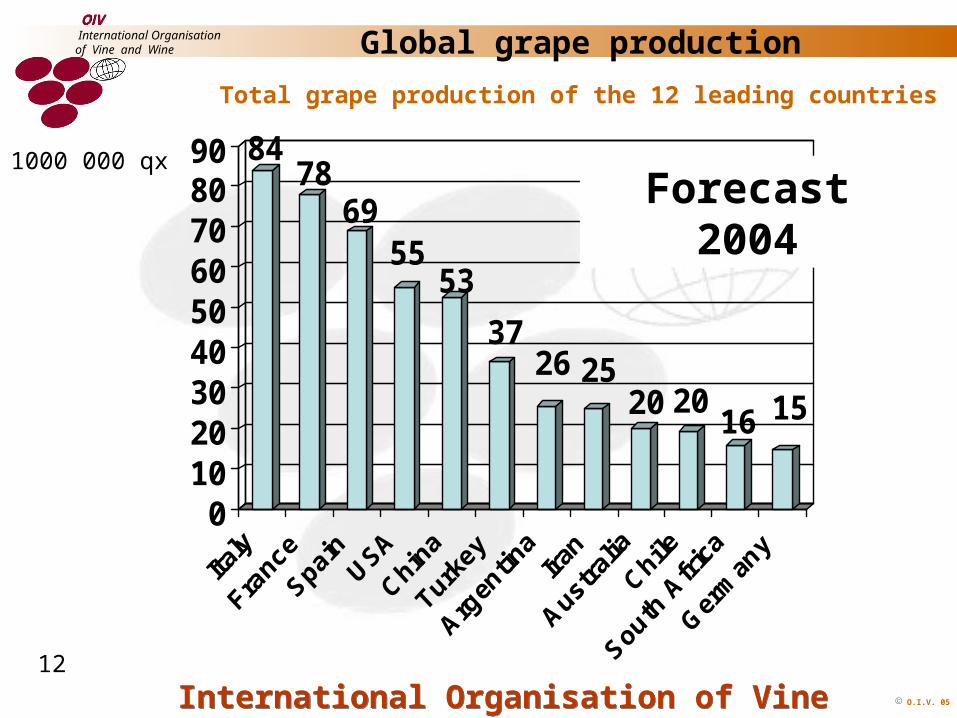
8478
6955
53
3726 25
20 2016 15
01020304050607080901000 000 qx
Total grape production of the 12 leading countries
Global grape production
Forecast 2004
12
O.I.V. 05International Organisation of Vine and WineInternational Organisation of Vine and Wine
International Organisationof Vine and Wine
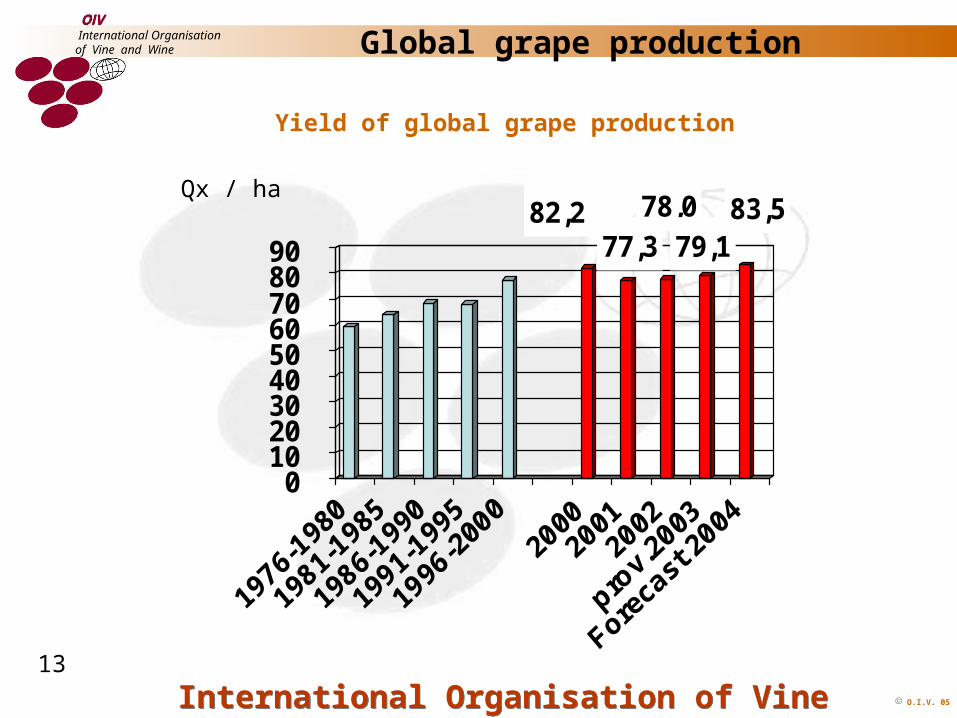
82,277,3
78,079,1
83,5
0 10 20 30 40 50 60 70 80 90
Global grape production
Qx / ha
Yield of global grape production
13
O.I.V. 05International Organisation of Vine and WineInternational Organisation of Vine and Wine
International Organisationof Vine and Wine Fresh grapes
International tradefresh grapes
14

O.I.V. 05International Organisation of Vine and WineInternational Organisation of Vine and Wine
International Organisationof Vine and Wine
25,4 25,1 28,0
05
101520253035404550
World importsof fresh grapes
Fresh grapes
1000 000 hl
15
O.I.V. 05International Organisation of Vine and WineInternational Organisation of Vine and Wine
International Organisationof Vine and Wine
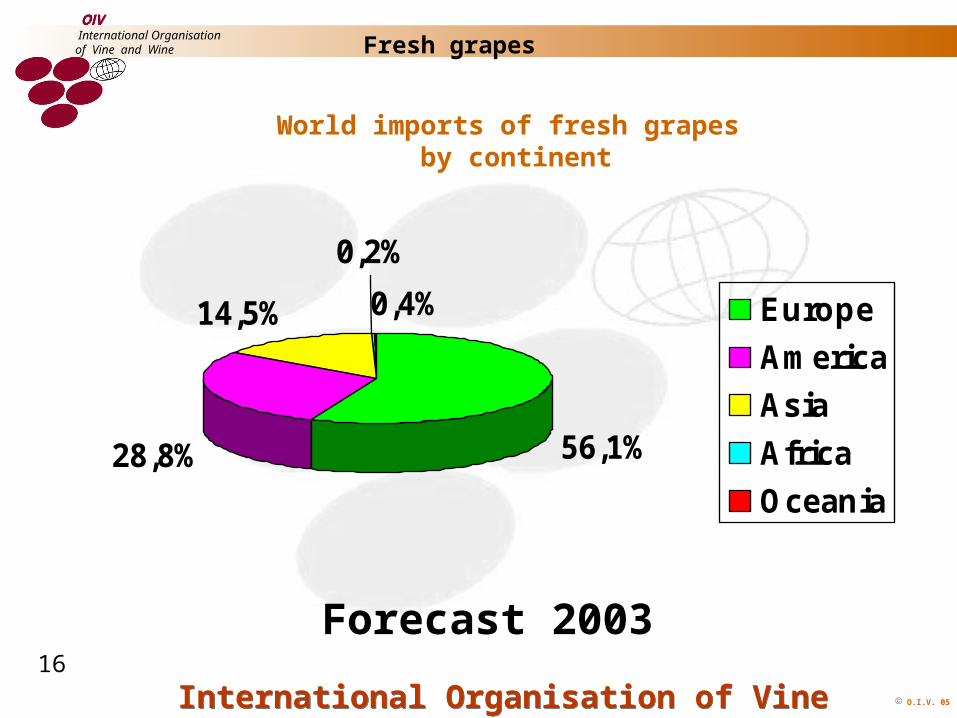
World imports of fresh grapes by continent
Forecast 2003
Fresh grapes
56,1%28,8%
14,5%
0,2%
0,4% Europe
America
Asia
Africa
Oceania
16
O.I.V. 05International Organisation of Vine and WineInternational Organisation of Vine and Wine
International Organisationof Vine and Wine
0500
100015002000250030003500400045005000
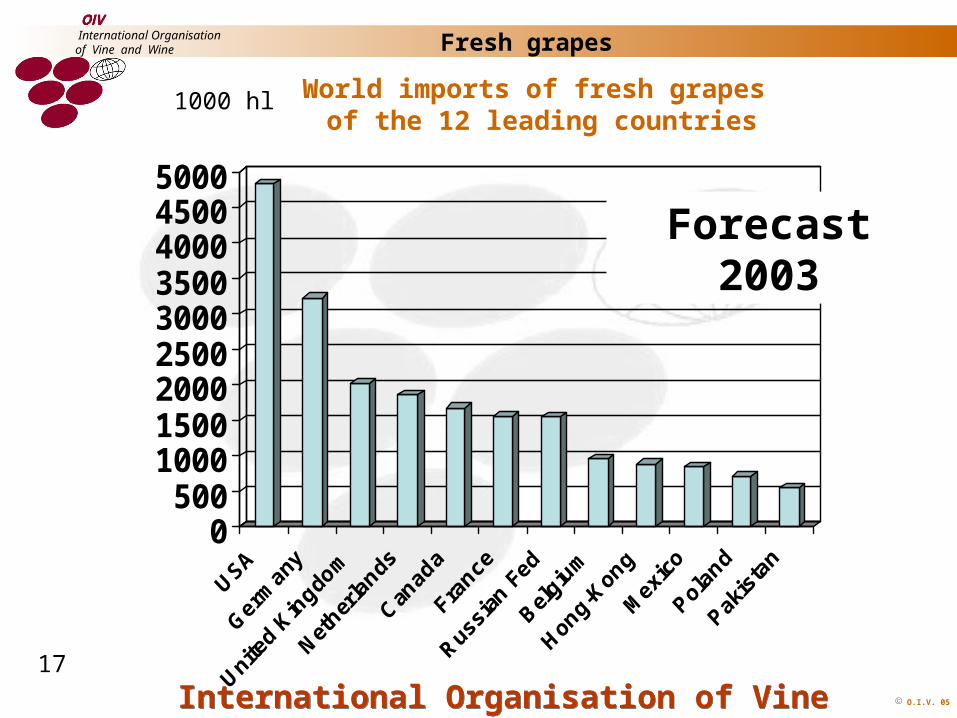
World imports of fresh grapes of the 12 leading countries
Fresh grapes
1000 hl
Forecast 2003
17
O.I.V. 05International Organisation of Vine and WineInternational Organisation of Vine and Wine
International Organisationof Vine and Wine
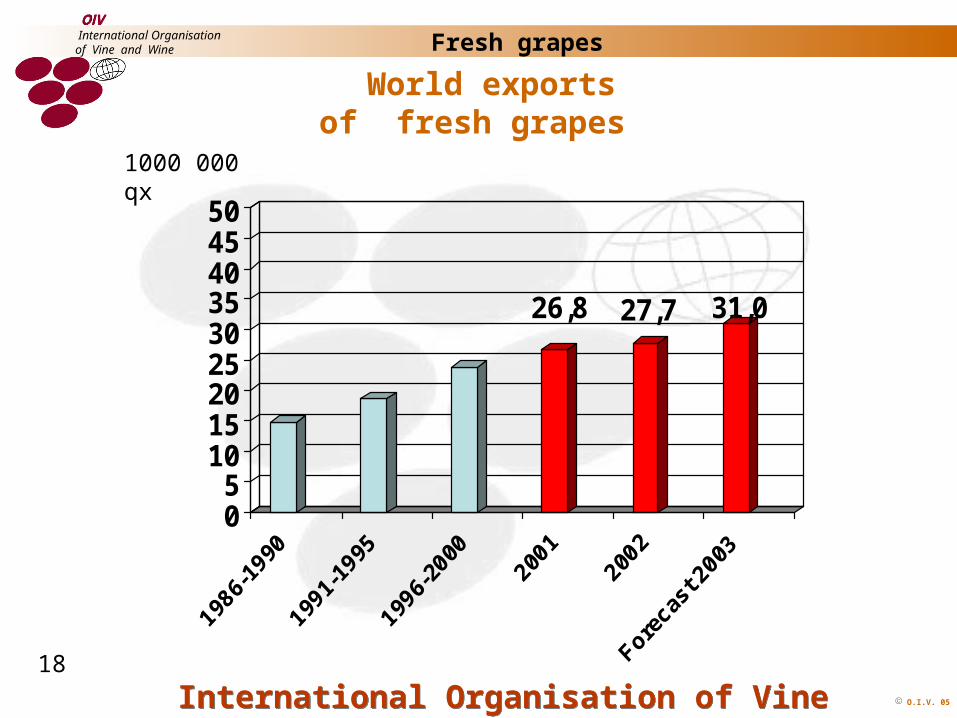
26,8 27,7 31,0
05
101520253035404550
World exportsof fresh grapes
Fresh grapes
1000 000 qx
18
O.I.V. 05International Organisation of Vine and WineInternational Organisation of Vine and Wine
International Organisationof Vine and Wine
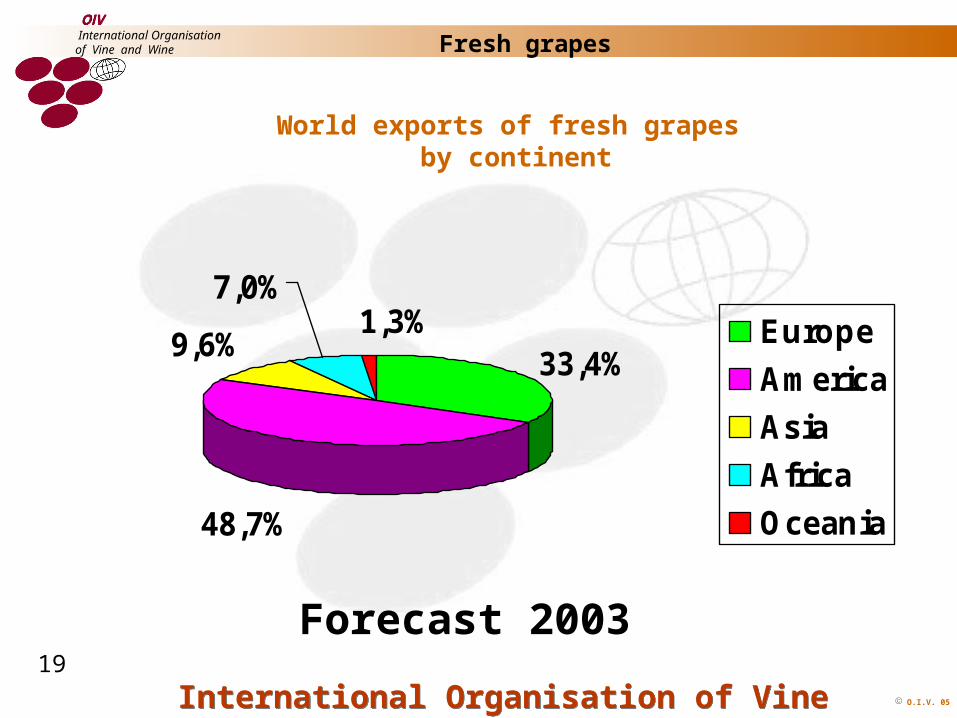
World exports of fresh grapes by continent
Forecast 2003
Fresh grapes
33,4%
48,7%
9,6%
7,0%1,3% Europe
America
Asia
Africa
Oceania
19
O.I.V. 05International Organisation of Vine and WineInternational Organisation of Vine and Wine
International Organisationof Vine and Wine
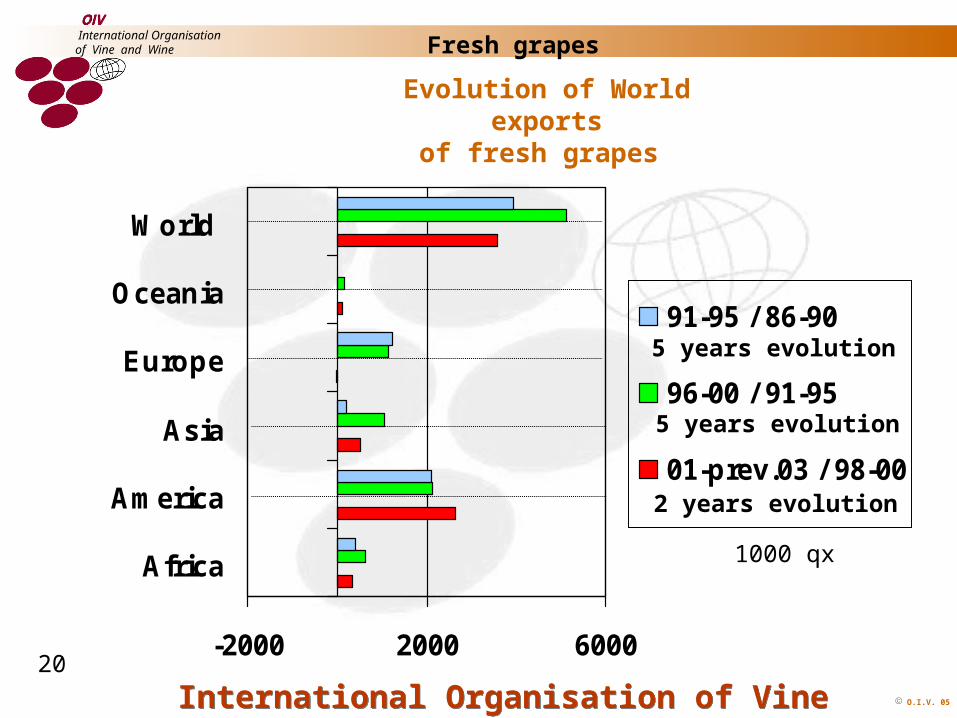
-2000 2000 6000
Africa
America
Asia
Europe
Oceania
World
91-95 / 86-90
96-00 / 91-95
01-prev.03 / 98-00
1000 qx
Fresh grapes
Evolution of World exportsof fresh grapes
5 years evolution
5 years evolution
2 years evolution
20
O.I.V. 05International Organisation of Vine and WineInternational Organisation of Vine and Wine
International Organisationof Vine and Wine
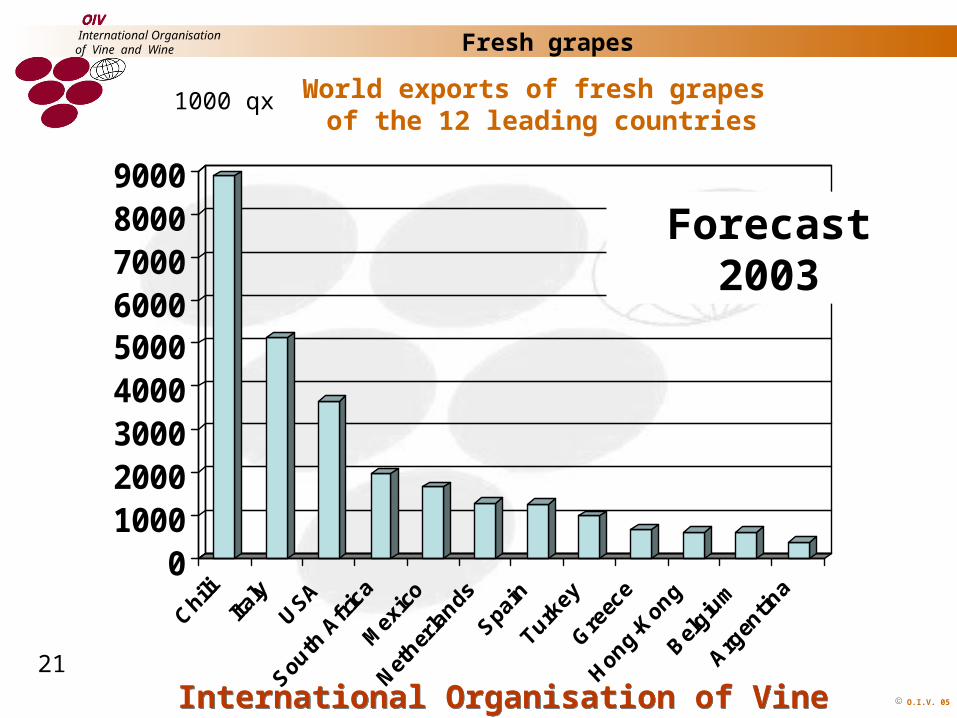
0100020003000400050006000700080009000
World exports of fresh grapes of the 12 leading countries
Fresh grapes
1000 qx
Forecast 2003
21
O.I.V. 05International Organisation of Vine and WineInternational Organisation of Vine and Wine
International Organisationof Vine and Wine Fresh grapes
Global production of grapes for fresh usage
22
O.I.V. 05International Organisation of Vine and WineInternational Organisation of Vine and Wine
International Organisationof Vine and Wine
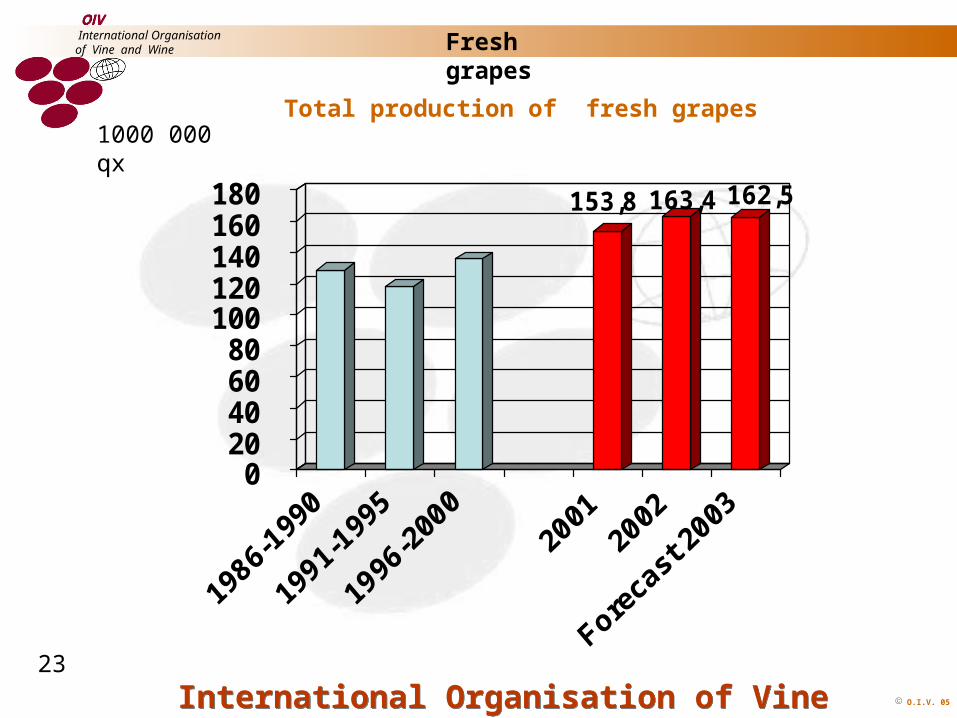
1000 000 qx Total production of fresh grapes
153,8 163,4 162,5
0 20 40 60 80
100 120 140 160 180
Fresh grapes
23
O.I.V. 05International Organisation of Vine and WineInternational Organisation of Vine and Wine
International Organisationof Vine and Wine
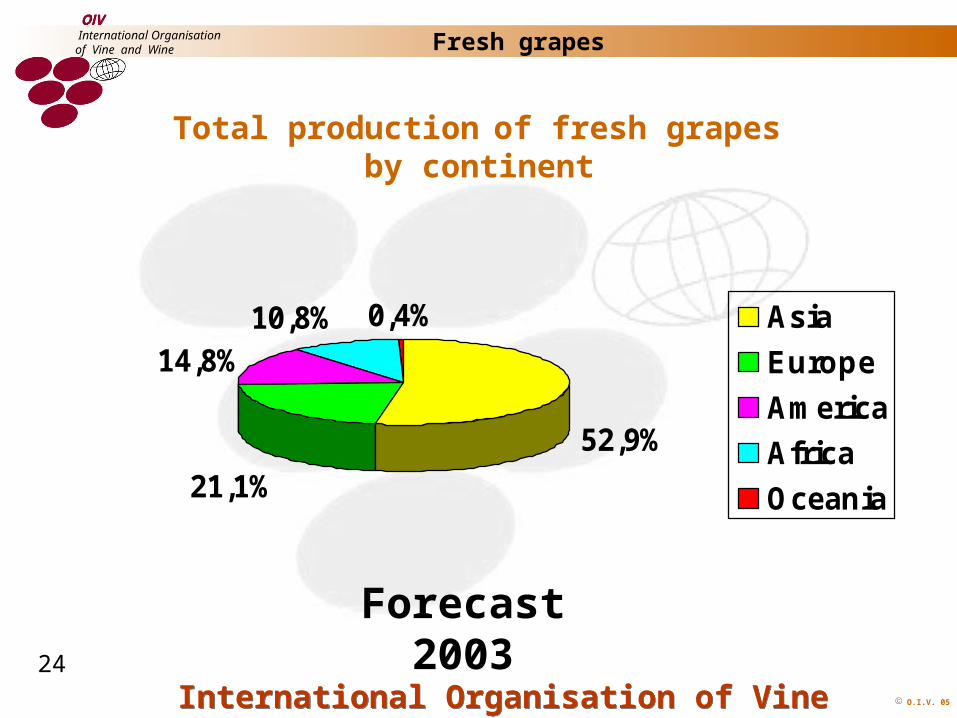
52,9%
21,1%
14,8%10,8% 0,4% Asia
Europe
America
Africa
Oceania
Total production of fresh grapes by continent
Forecast 2003
Fresh grapes
24
O.I.V. 05International Organisation of Vine and WineInternational Organisation of Vine and Wine
International Organisationof Vine and Wine
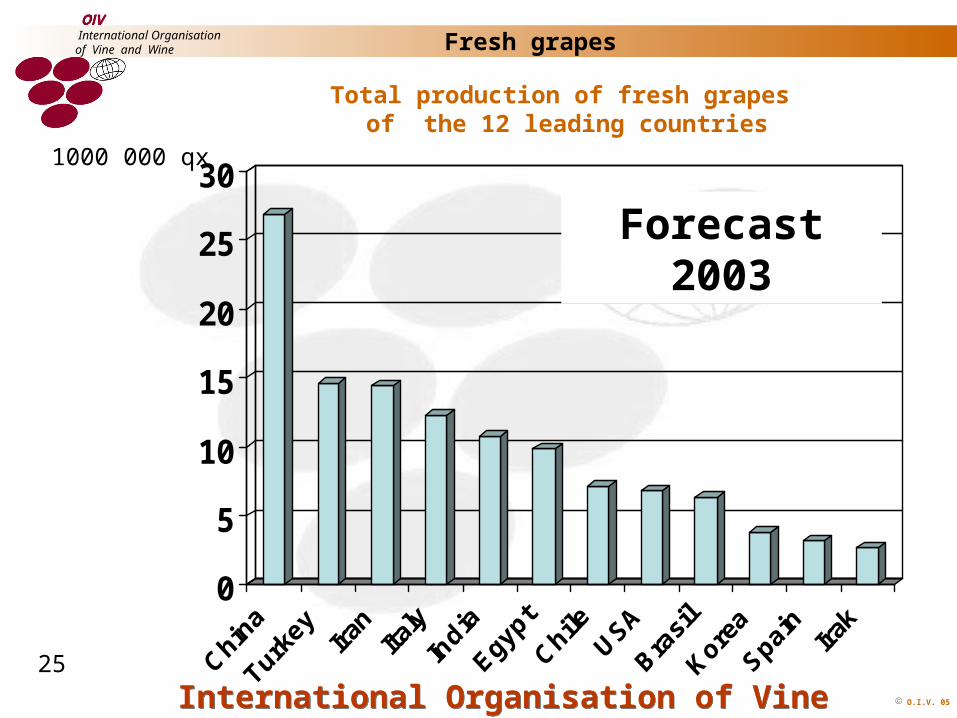
0
5
10
15
20
25
301000 000 qx
Total production of fresh grapes of the 12 leading countries
Forecast 2003
Fresh grapes
25
O.I.V. 05International Organisation of Vine and WineInternational Organisation of Vine and Wine
International Organisationof Vine and Wine Fresh grapes
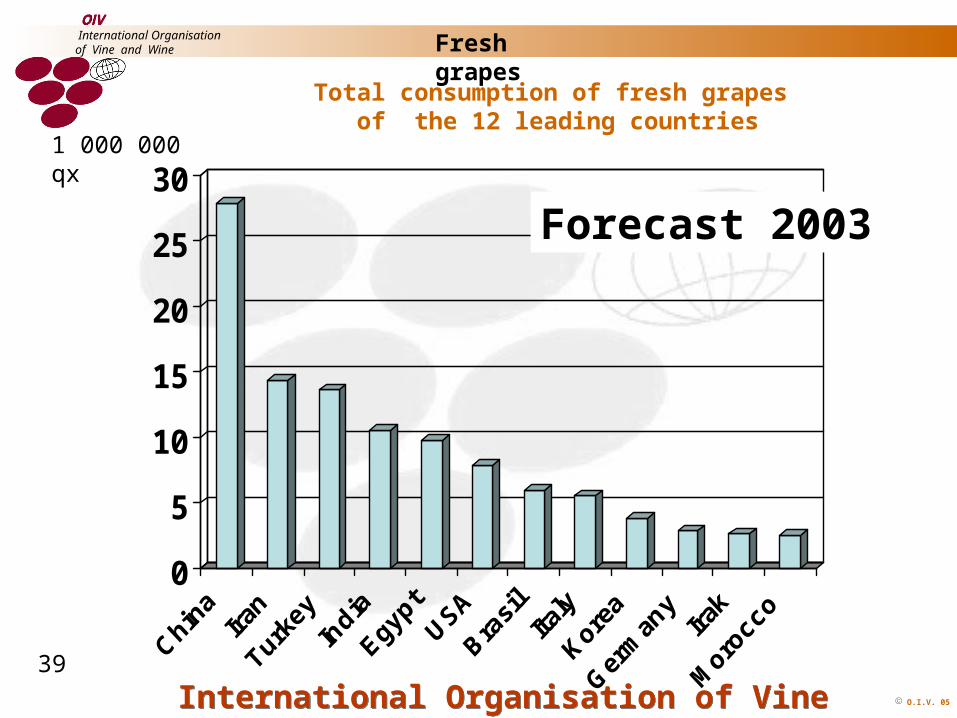
Global consumption of fresh grapes
26
O.I.V. 05International Organisation of Vine and WineInternational Organisation of Vine and Wine
International Organisationof Vine and Wine
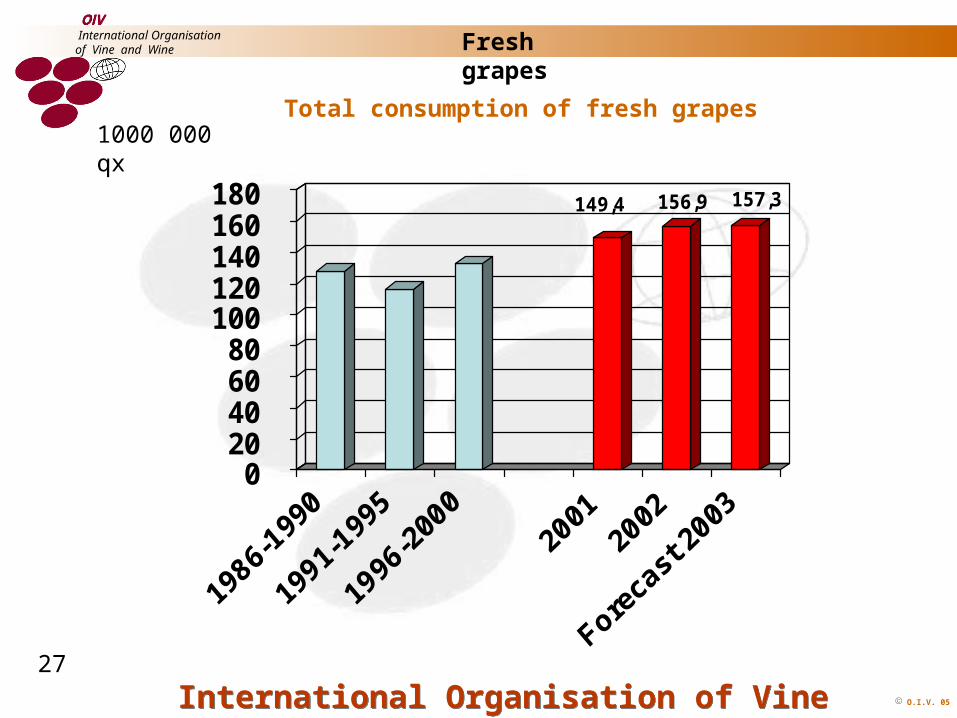
1000 000 qx Total consumption of fresh grapes
149,4 156,9 157,3
0 20 40 60 80
100 120 140 160 180
Fresh grapes
27
O.I.V. 05International Organisation of Vine and WineInternational Organisation of Vine and Wine
International Organisationof Vine and Wine
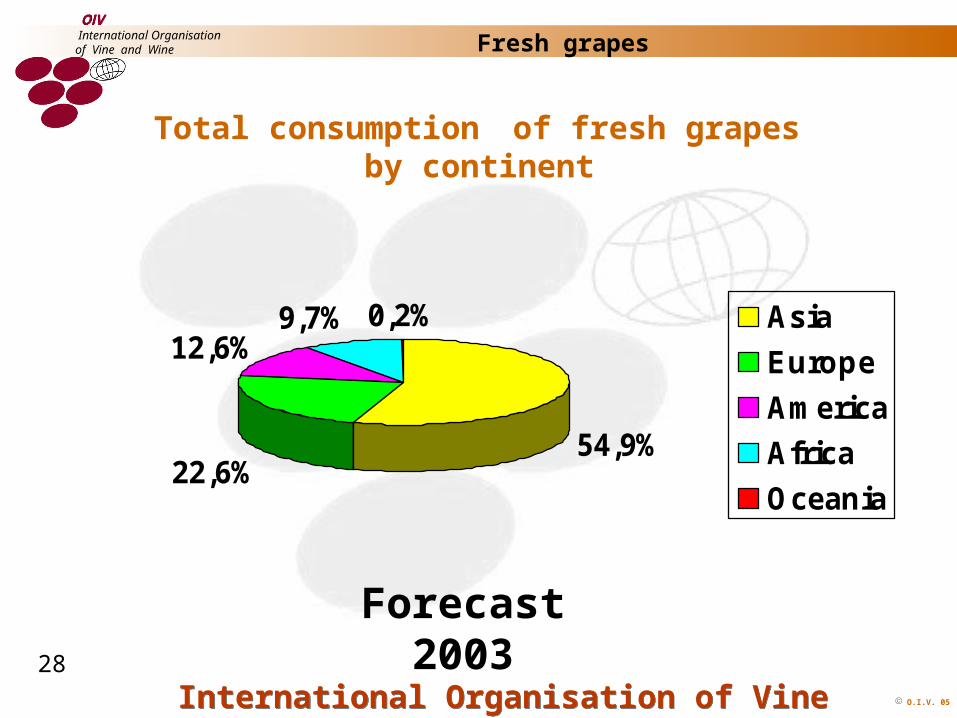
54,9%22,6%
12,6%9,7% 0,2% Asia
Europe
America
Africa
Oceania
Total consumption of fresh grapes by continent
Forecast 2003
Fresh grapes
28
O.I.V. 05International Organisation of Vine and WineInternational Organisation of Vine and Wine
International Organisationof Vine and Wine
0
5
10
15
20
25
301 000 000 qx
Total consumption of fresh grapes of the 12 leading countries
Forecast 2003
Fresh grapes
39
O.I.V. 05International Organisation of Vine and WineInternational Organisation of Vine and Wine
International Organisationof Vine and Wine Raisins
Global raisin production
30
O.I.V. 05International Organisation of Vine and WineInternational Organisation of Vine and Wine
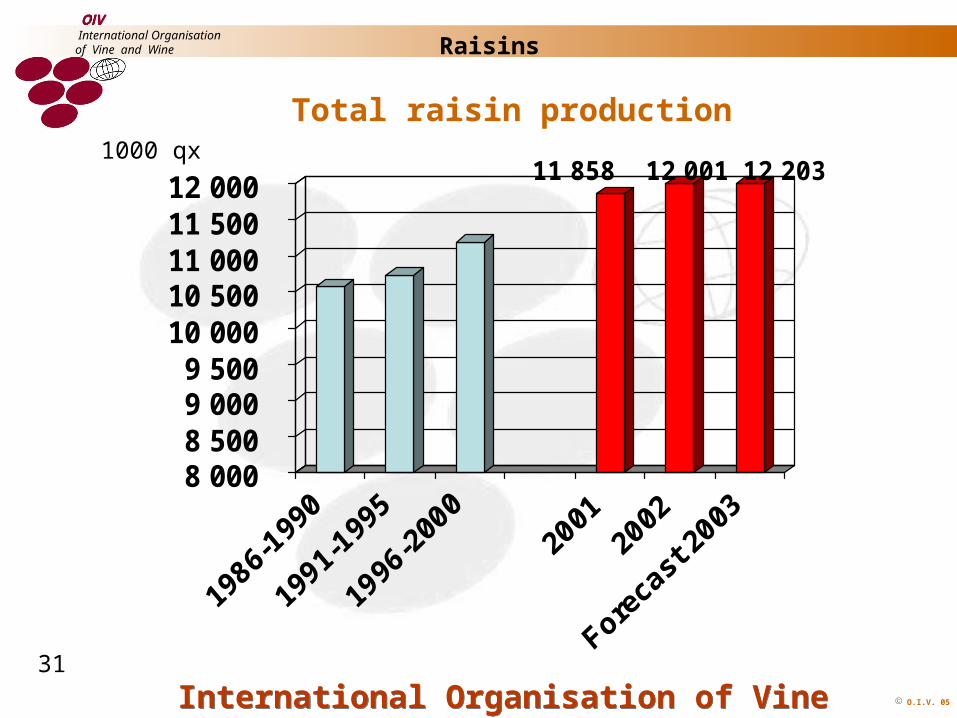
International Organisationof Vine and Wine Raisins
Total raisin production1000 qx
11 858 12 001 12 203
8 000 8 500 9 000 9 500
10 000 10 500 11 000 11 500 12 000
31
O.I.V. 05International Organisation of Vine and WineInternational Organisation of Vine and Wine
International Organisationof Vine and Wine
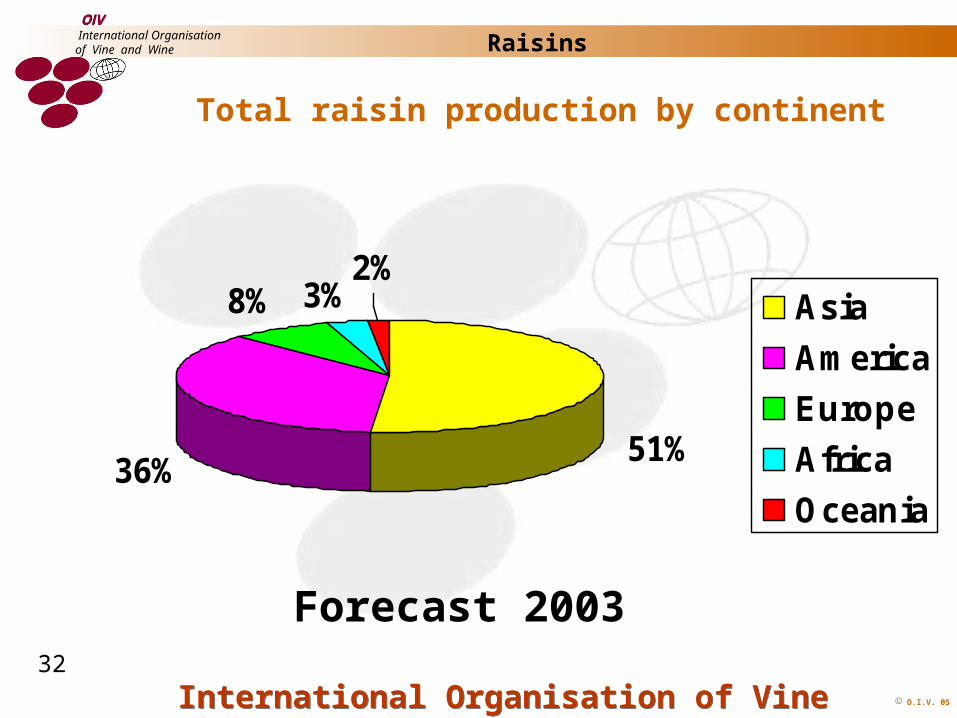
36%
8% 3%
51%
2%Asia
America
Europe
Africa
Oceania
Raisins
Total raisin production by continent
Forecast 200332
O.I.V. 05International Organisation of Vine and WineInternational Organisation of Vine and Wine
International Organisationof Vine and Wine
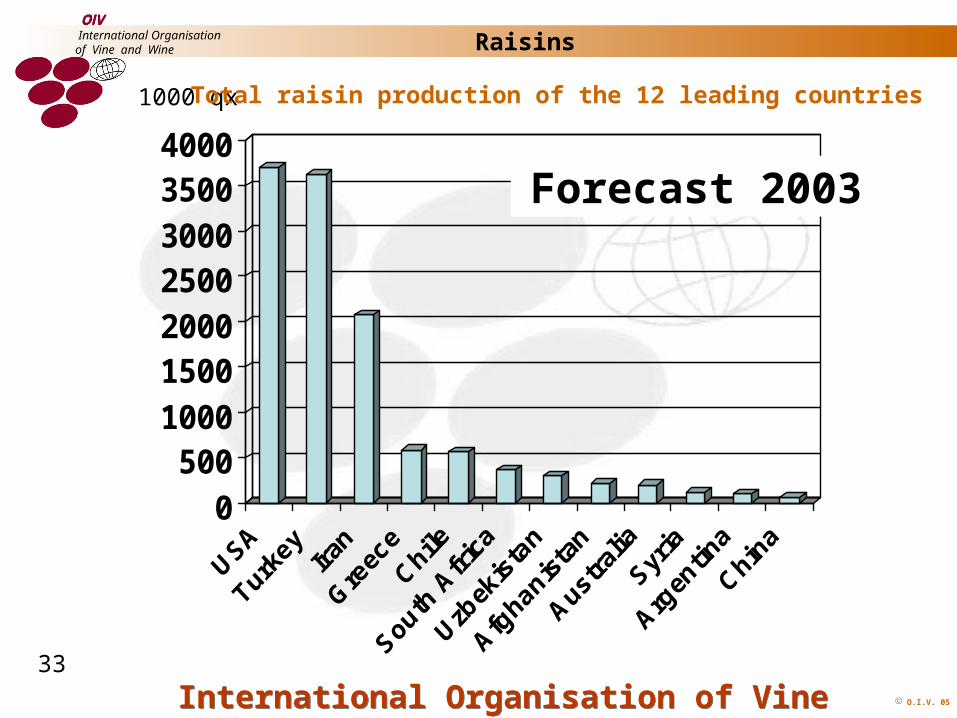
0500
1000150020002500300035004000
1000 qx Total raisin production of the 12 leading countries
Raisins
Forecast 2003
33
O.I.V. 05International Organisation of Vine and WineInternational Organisation of Vine and Wine
International Organisationof Vine and Wine Raisins
Global raisin consumption
34
O.I.V. 05International Organisation of Vine and WineInternational Organisation of Vine and Wine
International Organisationof Vine and Wine Raisins
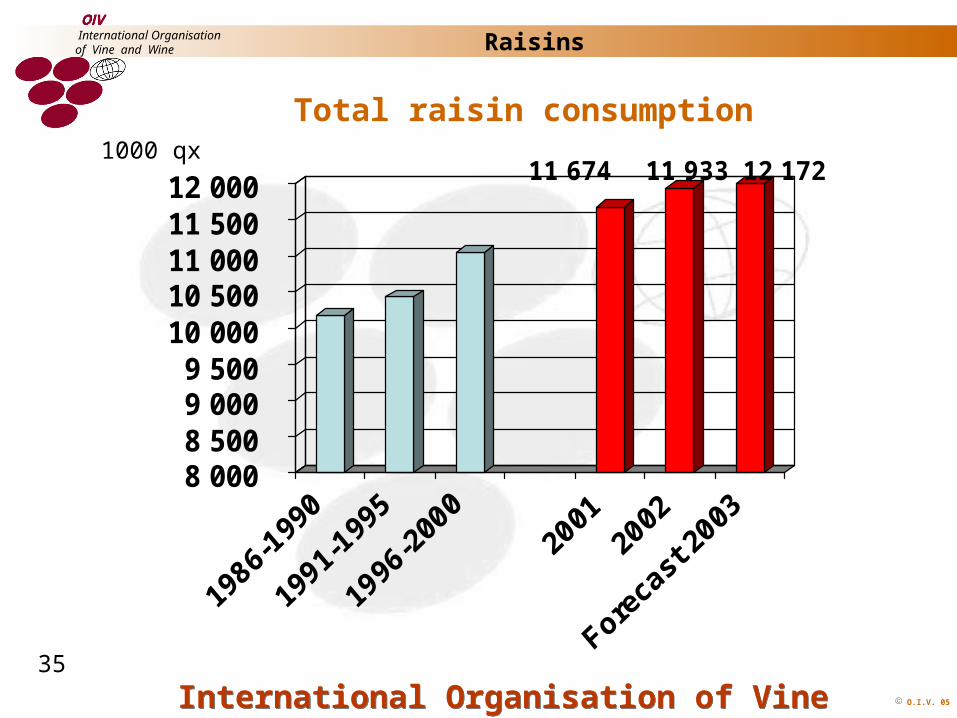
Total raisin consumption 1000 qx
11 674 11 933 12 172
8 000 8 500 9 000 9 500
10 000 10 500 11 000 11 500 12 000
35
O.I.V. 05International Organisation of Vine and WineInternational Organisation of Vine and Wine
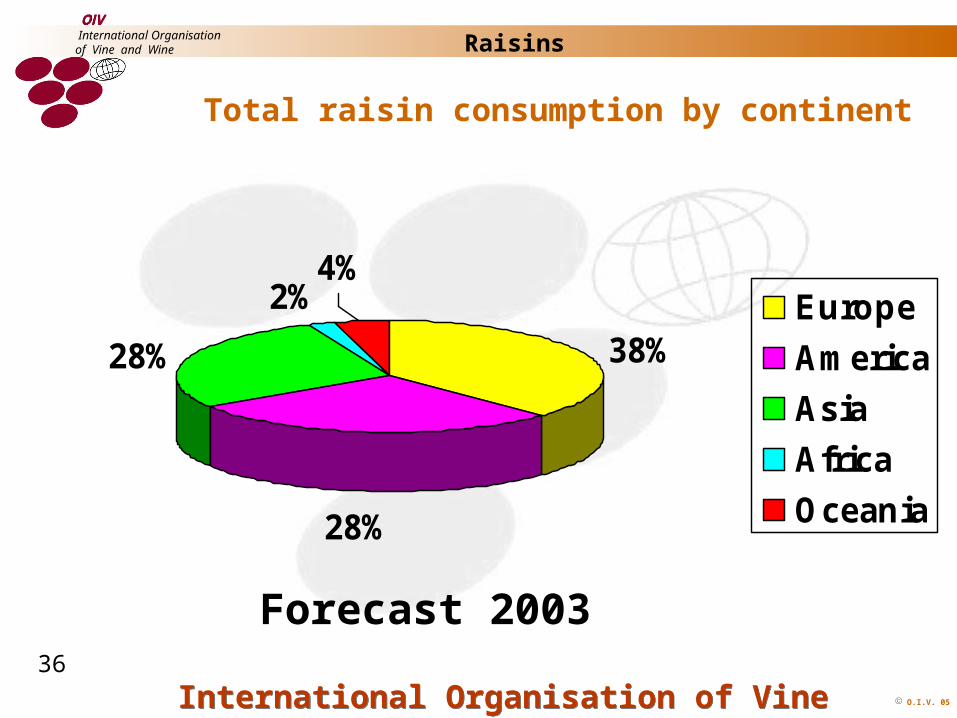
International Organisationof Vine and Wine
28%
28%
2%
38%
4%Europe
America
Asia
Africa
Oceania
Raisins
Total raisin consumption by continent
Forecast 200336
O.I.V. 05International Organisation of Vine and WineInternational Organisation of Vine and Wine
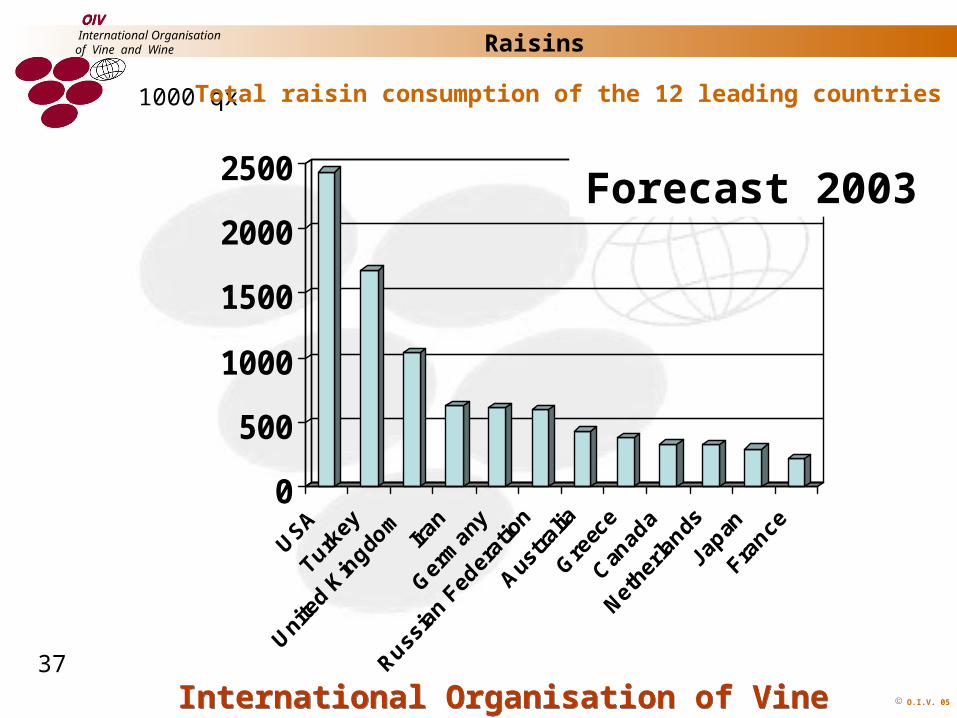
International Organisationof Vine and Wine
0
500
1000
1500
2000
2500
1000 qx Total raisin consumption of the 12 leading countries
Raisins
Forecast 2003
37
O.I.V. 05International Organisation of Vine and WineInternational Organisation of Vine and Wine
International Organisationof Vine and Wine Raisins
International tradeRaisins
38

O.I.V. 05International Organisation of Vine and WineInternational Organisation of Vine and Wine
International Organisationof Vine and Wine
6,6 6,9 7,0
02468
101214
World importsof raisins
Raisins
1000 000 qx
39
O.I.V. 05International Organisation of Vine and WineInternational Organisation of Vine and Wine
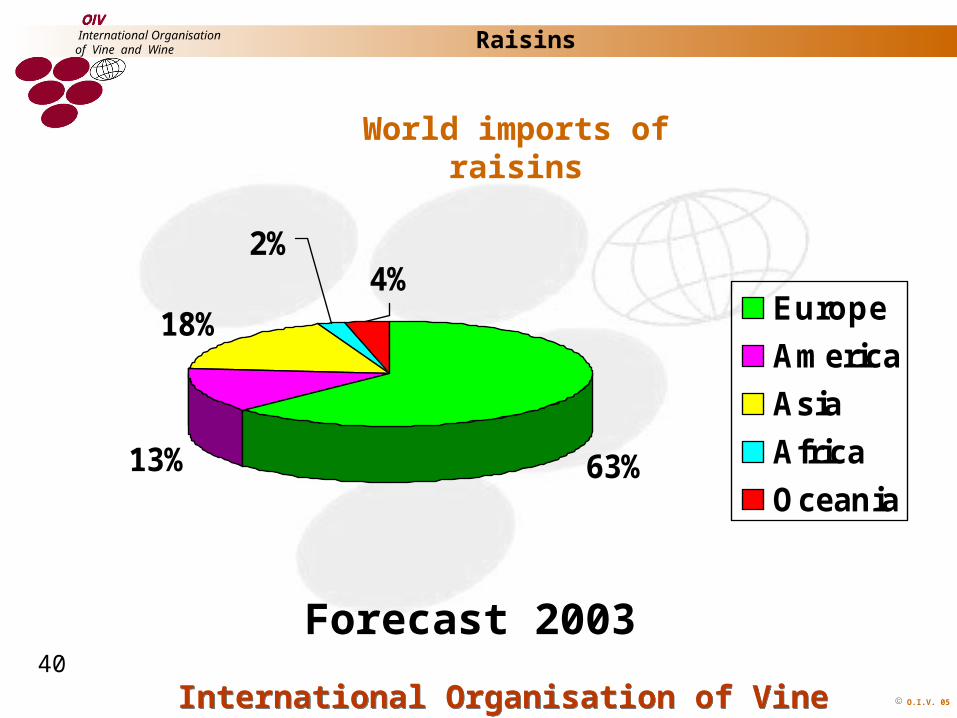
International Organisationof Vine and Wine
World imports ofraisins
Forecast 2003
Raisins
63%13%
18%
2%4%
Europe
America
Asia
Africa
Oceania
40
O.I.V. 05International Organisation of Vine and WineInternational Organisation of Vine and Wine
International Organisationof Vine and Wine
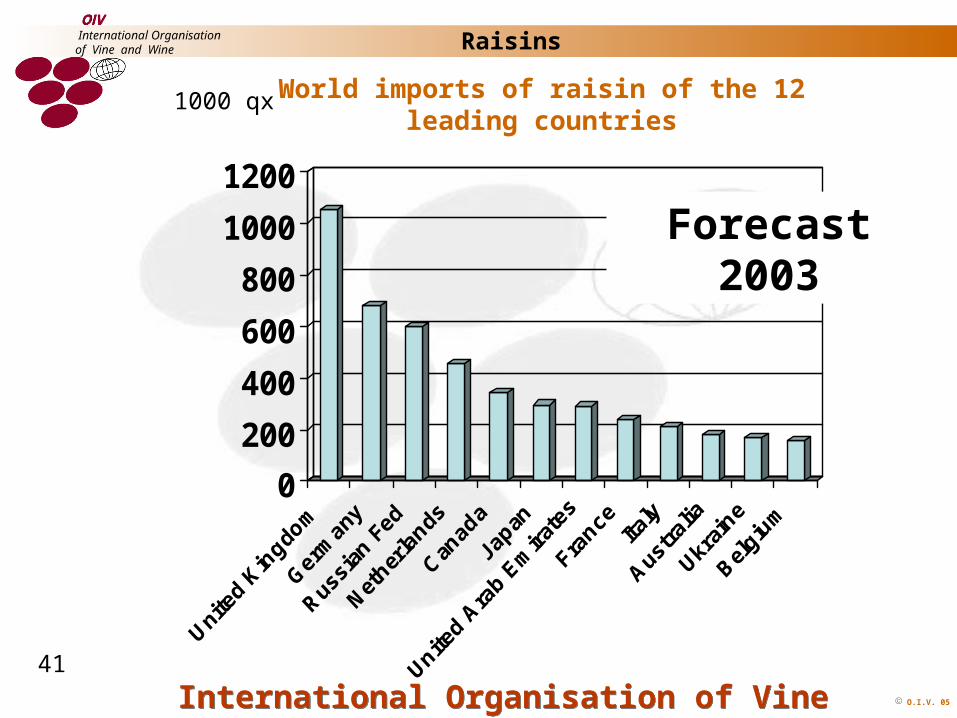
0
200
400
600
800
1000
1200
World imports of raisin of the 12 leading countries
Raisins
1000 qx
Forecast 2003
41
O.I.V. 05International Organisation of Vine and WineInternational Organisation of Vine and Wine
International Organisationof Vine and Wine
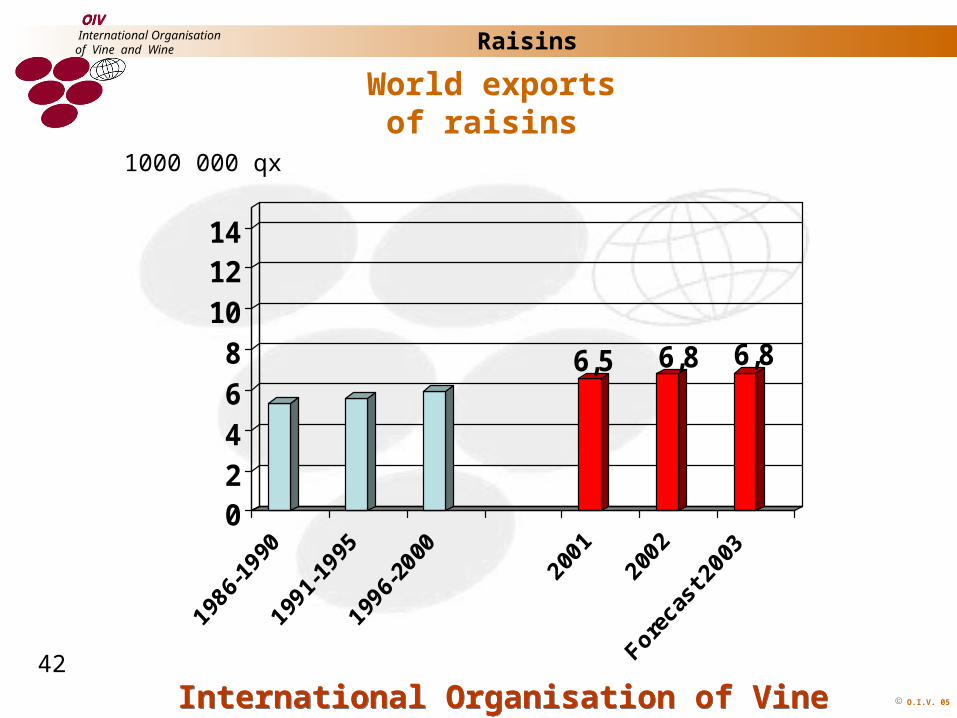
6,5 6,8 6,8
02468
101214
World exportsof raisins
Raisins
1000 000 qx
42
O.I.V. 05International Organisation of Vine and WineInternational Organisation of Vine and Wine
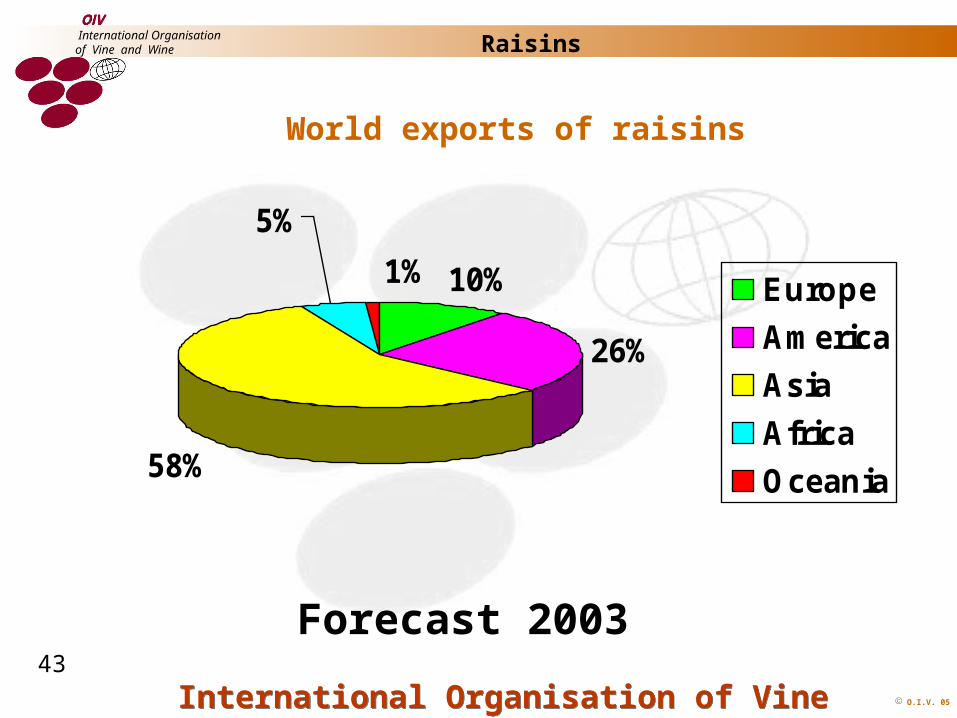
International Organisationof Vine and Wine
World exports of raisins
Forecast 2003
Raisins
10%
26%
58%
5%
1%Europe
America
Asia
Africa
Oceania
43
O.I.V. 05International Organisation of Vine and WineInternational Organisation of Vine and Wine
International Organisationof Vine and Wine
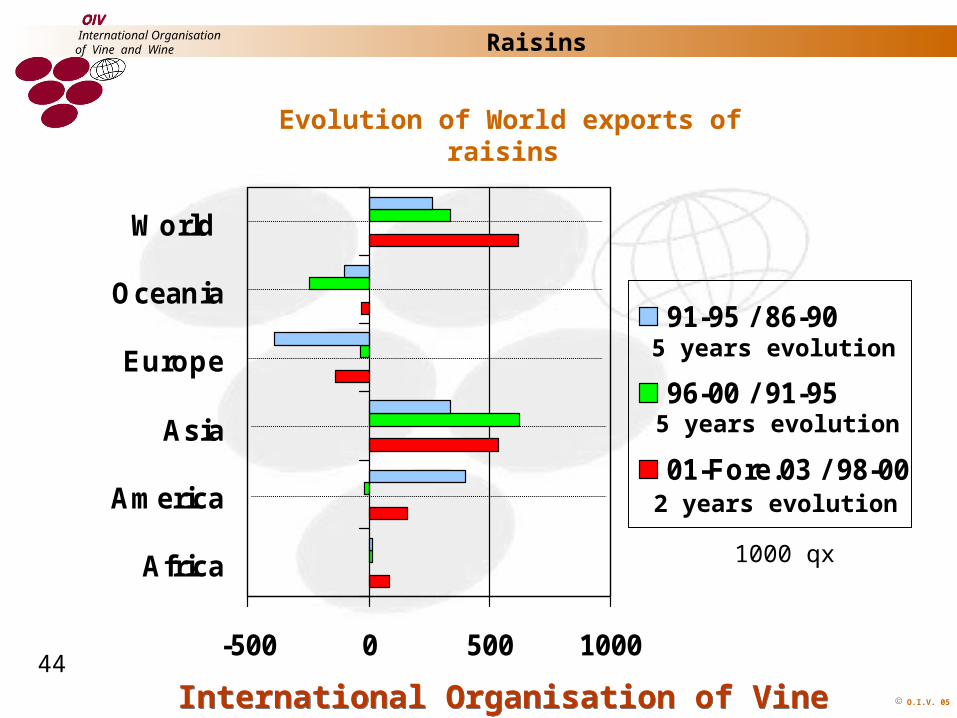
-500 0 500 1000
Africa
America
Asia
Europe
Oceania
World
91-95 / 86-90
96-00 / 91-95
01-Fore.03 / 98-00
1000 qx
Raisins
Evolution of World exports of raisins
5 years evolution
5 years evolution
2 years evolution
44
O.I.V. 05International Organisation of Vine and WineInternational Organisation of Vine and Wine
International Organisationof Vine and Wine
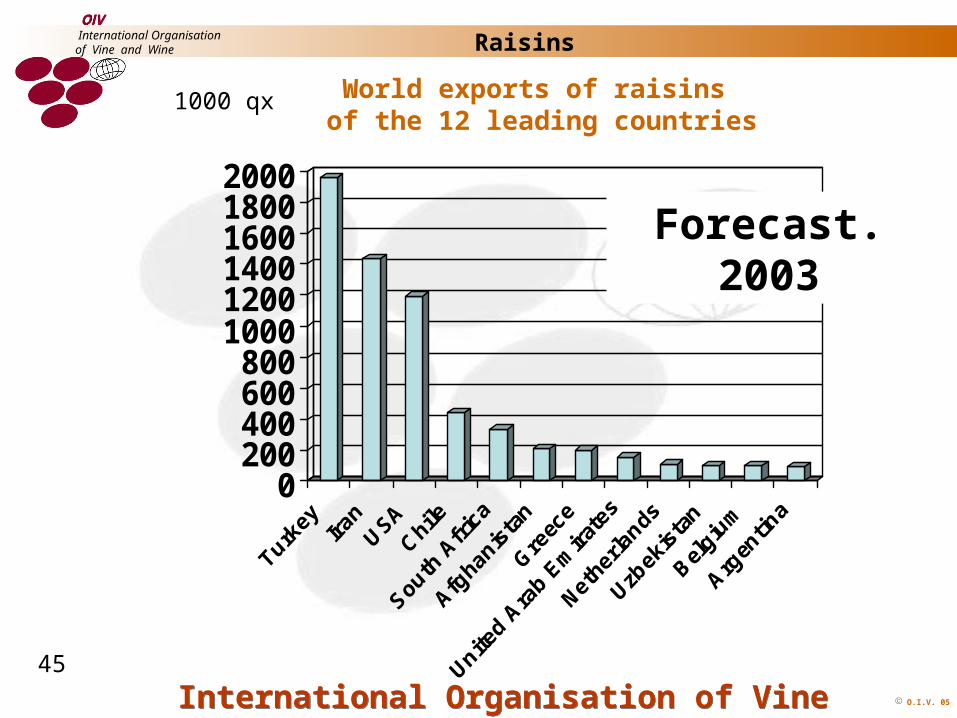
0200400600800
100012001400160018002000
World exports of raisins of the 12 leading countries
Raisins
1000 qx
Forecast. 2003
45
O.I.V. 05International Organisation of Vine and WineInternational Organisation of Vine and Wine
International Organisationof Vine and Wine Global wine production
Global wine production
46
O.I.V. 05International Organisation of Vine and WineInternational Organisation of Vine and Wine
International Organisationof Vine and Wine
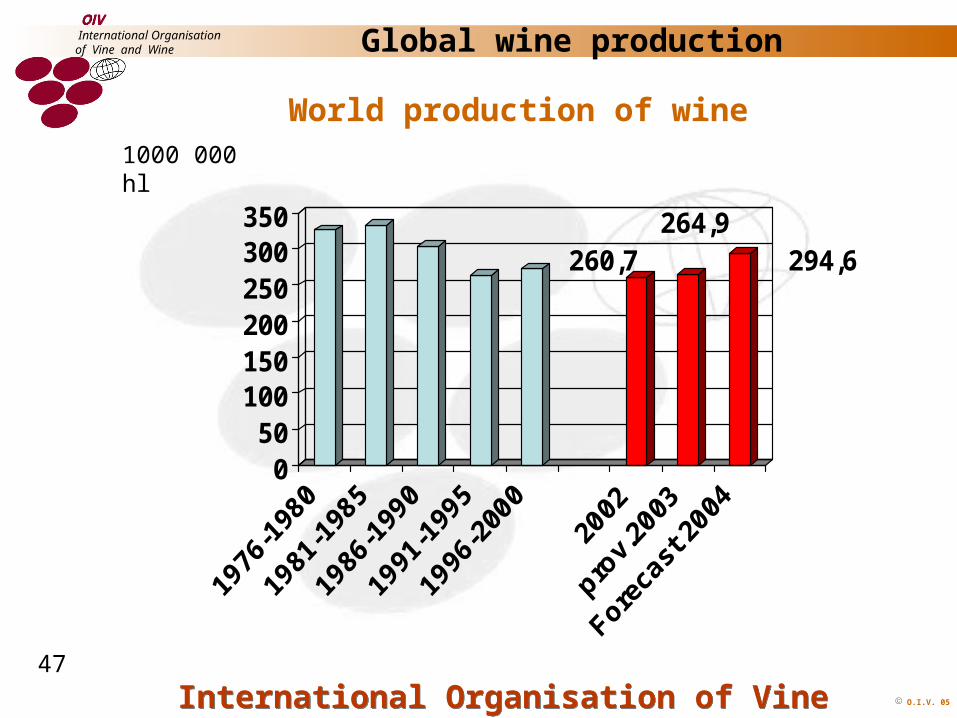
260,7264,9
294,6
050
100150200250300350
1000 000 hl
World production of wine
Global wine production
47
O.I.V. 05International Organisation of Vine and WineInternational Organisation of Vine and Wine
International Organisationof Vine and Wine
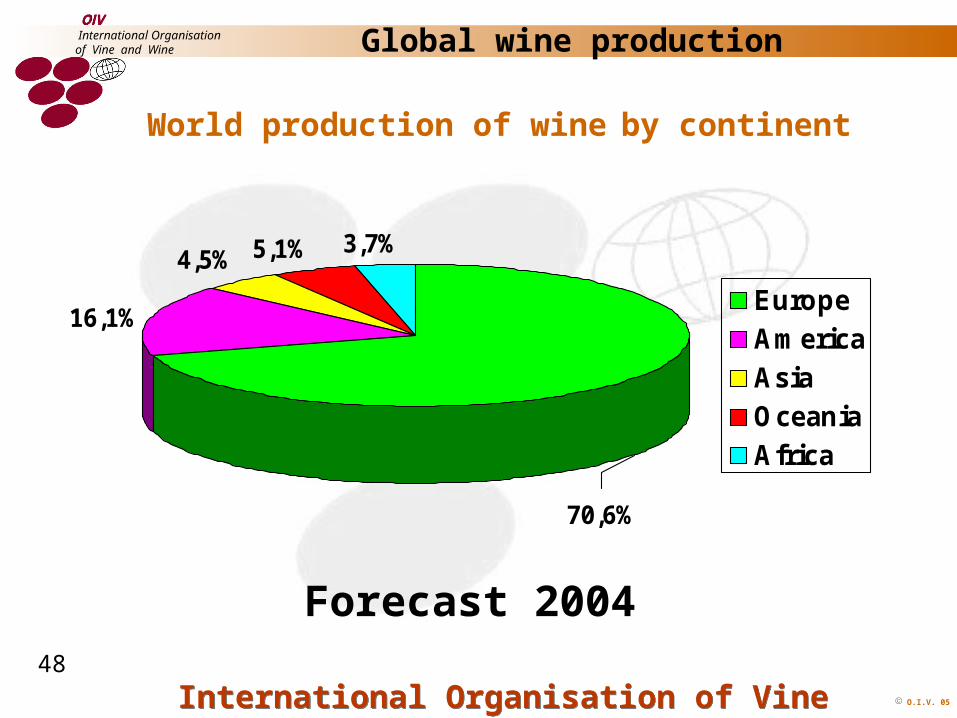
16,1%
4,5% 5,1% 3,7%
70,6%
EuropeAmericaAsiaOceaniaAfrica
World production of wine by continent
Forecast 2004
Global wine production
48
O.I.V. 05International Organisation of Vine and WineInternational Organisation of Vine and Wine
International Organisationof Vine and Wine
0
10
20
30
40
50
60
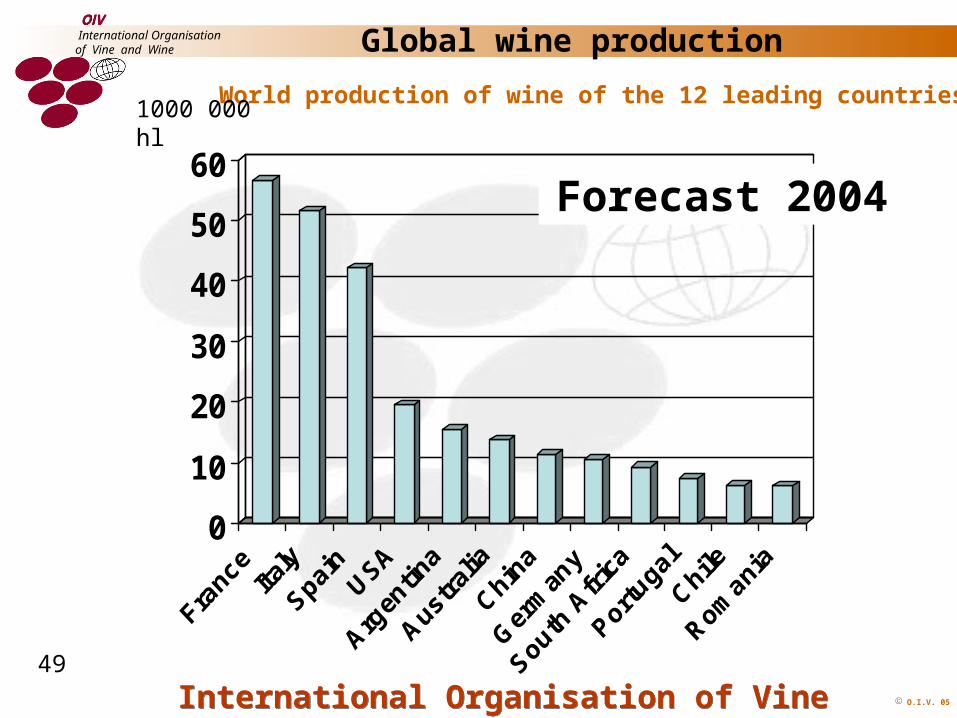
World production of wine of the 12 leading countries
Global wine production
1000 000 hl
Forecast 2004
49
O.I.V. 05International Organisation of Vine and WineInternational Organisation of Vine and Wine
International Organisationof Vine and Wine Global wine production
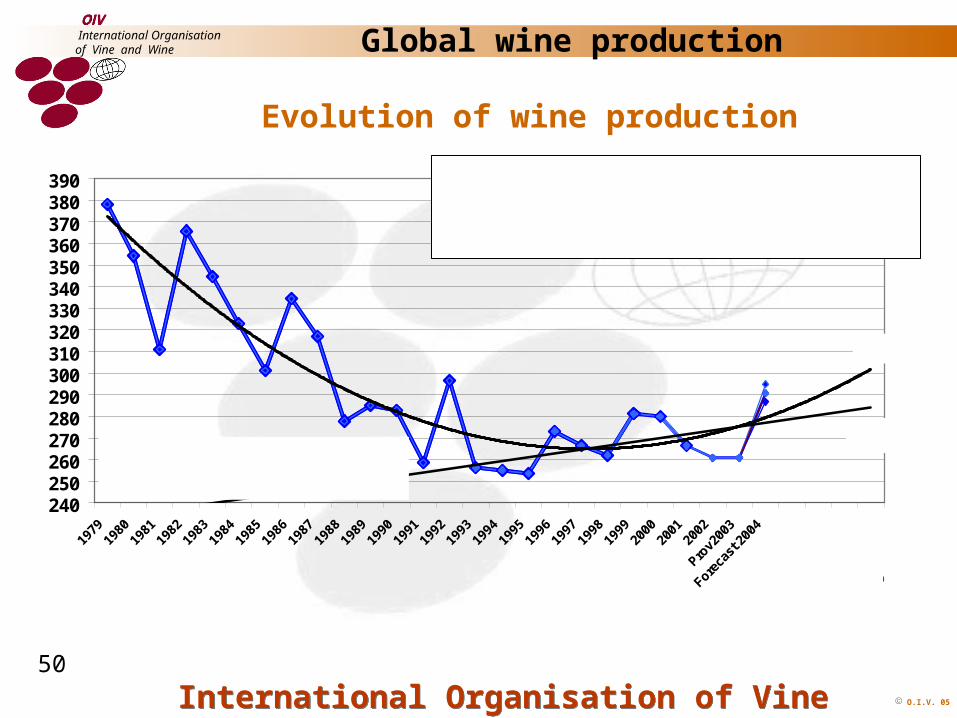
Evolution of wine production
240250260270280290300310320330340350360370380390
Pro
ject
.200
8
300 Miohl
283 Miohl
Given that "proj.surface area * Proj.yield" = between 8000 thousand ha * 36,6 hl/ha = 295 Miohl
we can foresee 290 Miohl in 2008
SOURCE : OIV + conjoncture Mars 2005 (PA)
50
O.I.V. 05International Organisation of Vine and WineInternational Organisation of Vine and Wine
International Organisationof Vine and Wine Global wine consumption
Global wine consumption
51

O.I.V. 05International Organisation of Vine and WineInternational Organisation of Vine and Wine
International Organisationof Vine and Wine
229 234 236
0
50
100
150
200
250
300
1000 000 hl
World consumption of wine
Global wine consumption
52
O.I.V. 05International Organisation of Vine and WineInternational Organisation of Vine and Wine
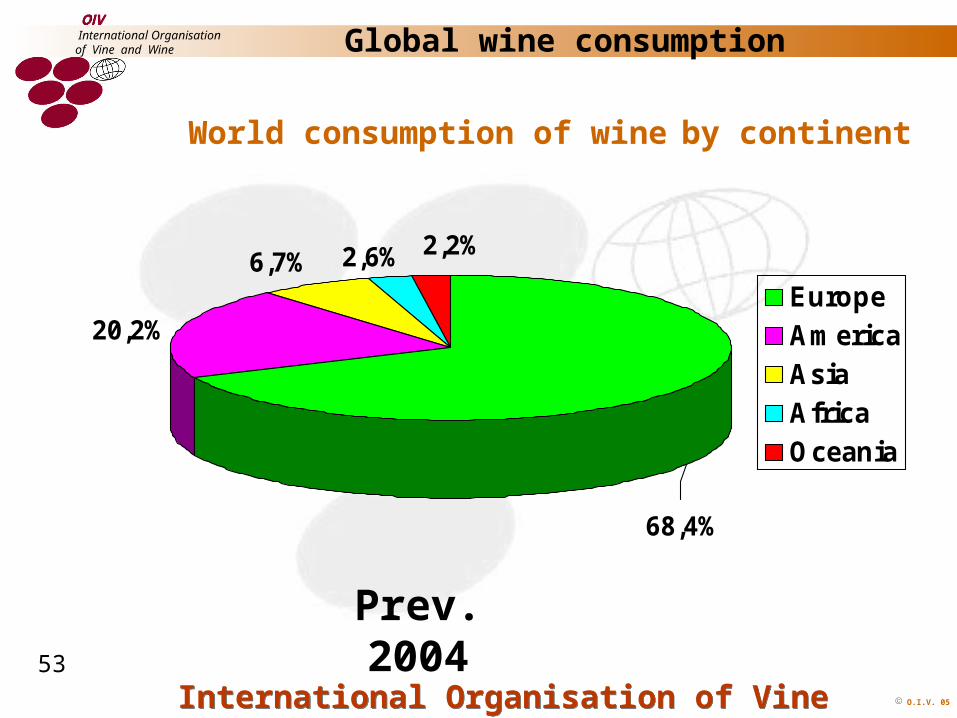
International Organisationof Vine and Wine
20,2%
6,7% 2,6% 2,2%
68,4%
EuropeAmericaAsiaAfricaOceania
World consumption of wine by continent
Prev. 2004
Global wine consumption
53
O.I.V. 05International Organisation of Vine and WineInternational Organisation of Vine and Wine
International Organisationof Vine and Wine
0
5
10
15
20
25
30
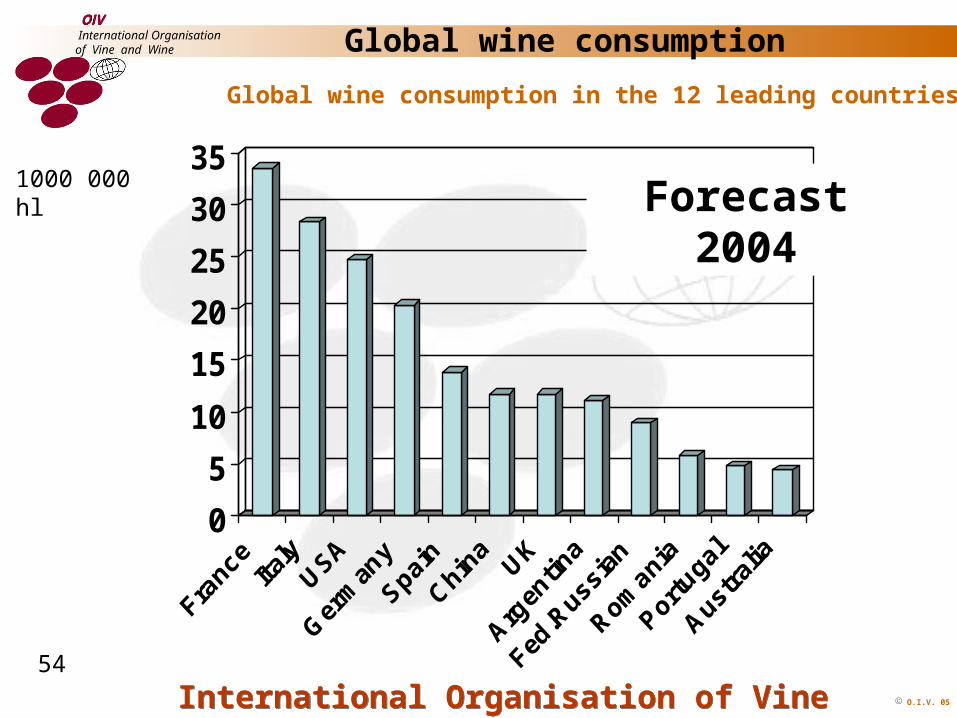
35
Global wine consumption in the 12 leading countries
1000 000 hl
Global wine consumption
Forecast 2004
54
O.I.V. 05International Organisation of Vine and WineInternational Organisation of Vine and Wine
International Organisationof Vine and Wine
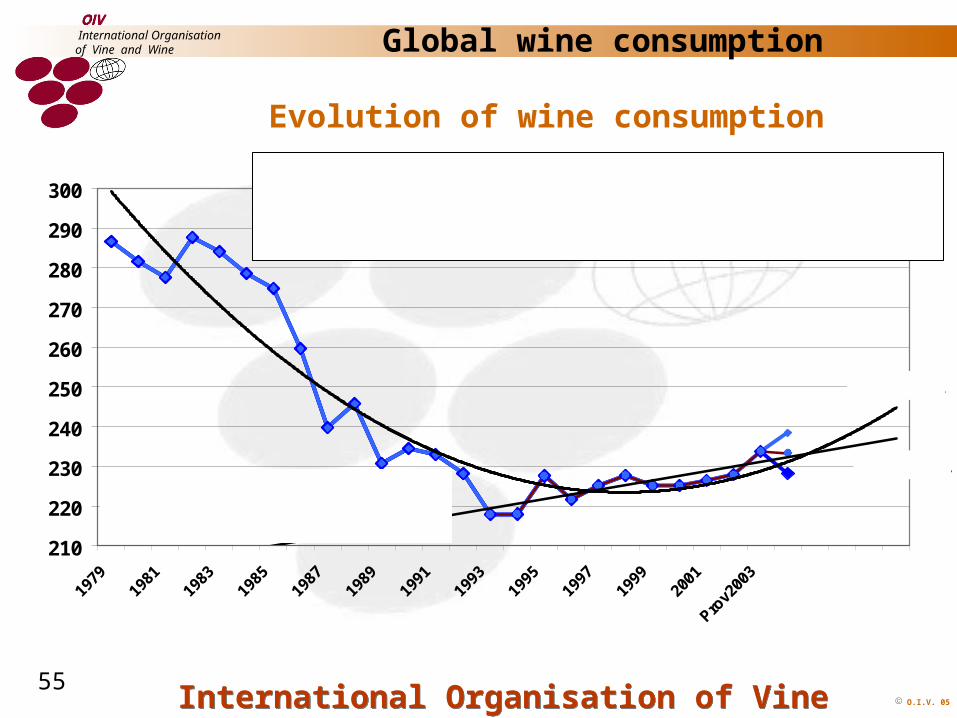
Evolution of wine consumption
Global wine consumption
210
220
230
240
250
260
270
280
290
300
Pro
ject
.200
8
237 Miohl
Given the difficulty of foreseeing and taking into account:- the development of new markets, and the
- type of competition between spirit beverages in different geographical areas,the estimated mean is situated between 235 and 245 million hl
SOURCE : OIV + conjoncture Mars 2004 (PA)
245 Miohl
55
O.I.V. 05International Organisation of Vine and WineInternational Organisation of Vine and Wine
International Organisationof Vine and Wine
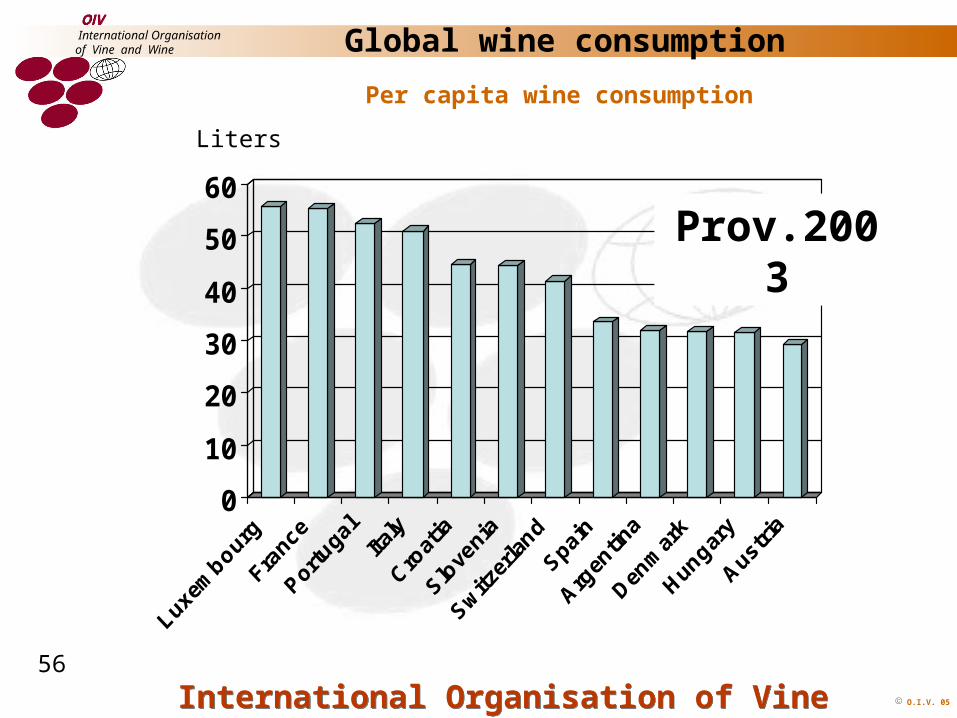
Per capita wine consumption
Liters
Global wine consumption
0
10
20
30
40
50
60
Prov.2003
56
O.I.V. 05International Organisation of Vine and WineInternational Organisation of Vine and Wine
International Organisationof Vine and Wine Degree of market equilibrium in the world of wine
Degree of market equilibrium in the world of wine
57
O.I.V. 05International Organisation of Vine and WineInternational Organisation of Vine and Wine
International Organisationof Vine and Wine
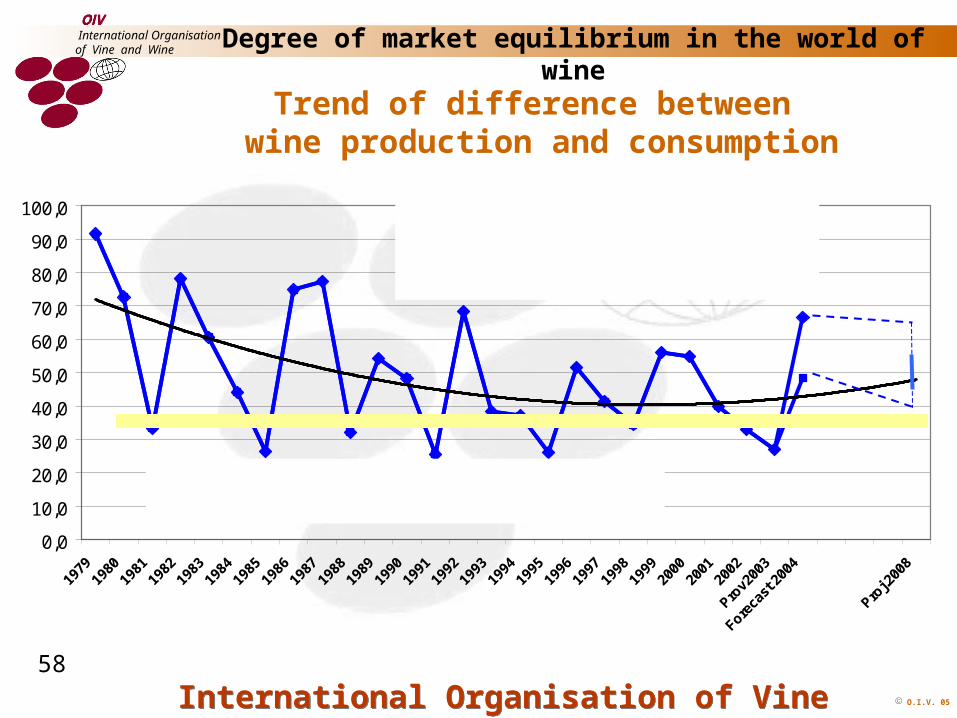
Trend of difference between wine production and consumption
Degree of market equilibrium in the world of wine
0,0
10,0
20,0
30,0
40,0
50,0
60,0
70,0
80,0
90,0
100,0
SOURCE : OIV + conjoncture Mars 2005 (PA)
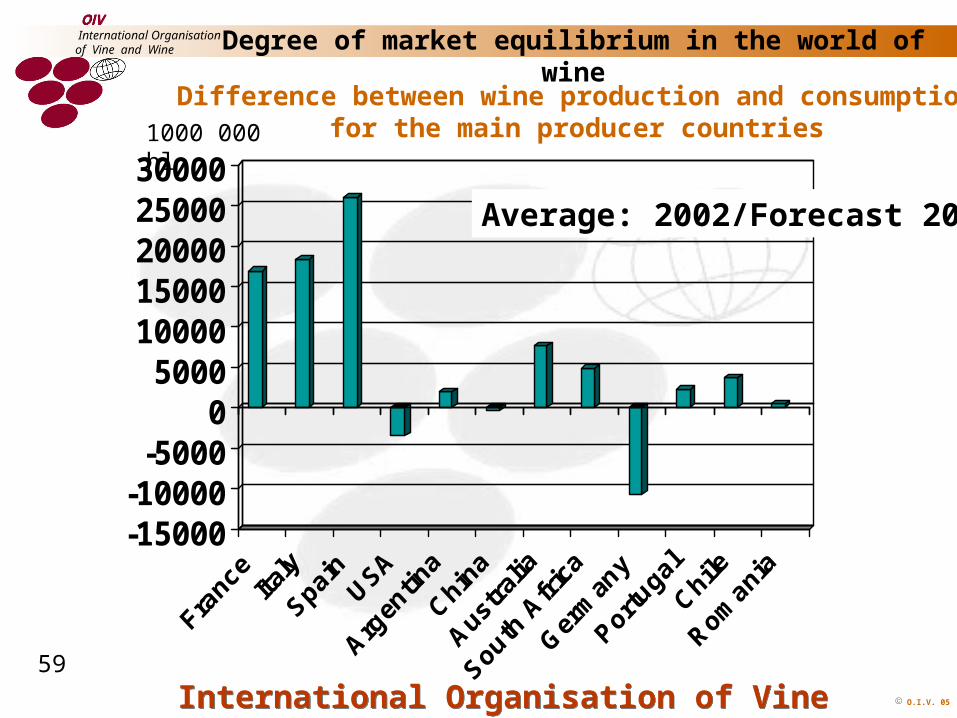
NB: this spread can not be considered as a surplus because 35 million hl are used to supply the market for industrial purposes:
brandies, carburation, vinegars, and vermouth.
Given the projections for 2008 for production and consumption, the spread between production and
consumption should be between 38 and 65 million hl
and most probably around 50 million hl
58
O.I.V. 05International Organisation of Vine and WineInternational Organisation of Vine and Wine
International Organisationof Vine and Wine
1000 000 hl
-15000-10000
-50000
50001000015000200002500030000
Degree of market equilibrium in the world of wine
Difference between wine production and consumption for the main producer countries
Average: 2002/Forecast 2004
59
O.I.V. 05International Organisation of Vine and WineInternational Organisation of Vine and Wine
International Organisationof Vine and Wine International trade
International trade
60
O.I.V. 05International Organisation of Vine and WineInternational Organisation of Vine and Wine
International Organisationof Vine and Wine
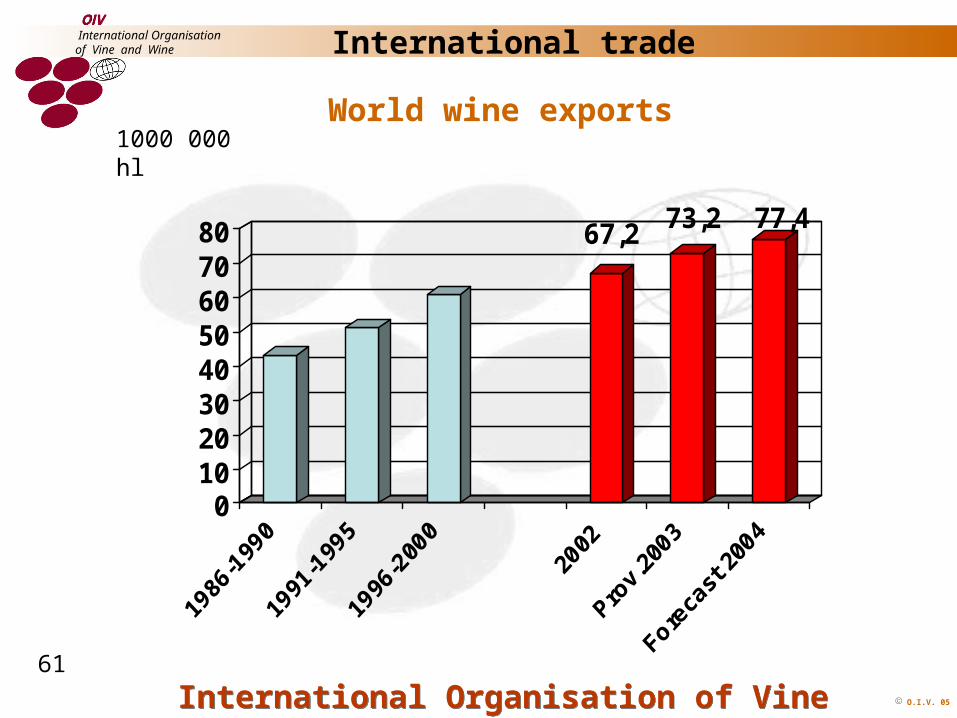
67,2 73,2 77,4
01020304050607080
World wine exports
International trade
1000 000 hl
61
O.I.V. 05International Organisation of Vine and WineInternational Organisation of Vine and Wine
International Organisationof Vine and Wine
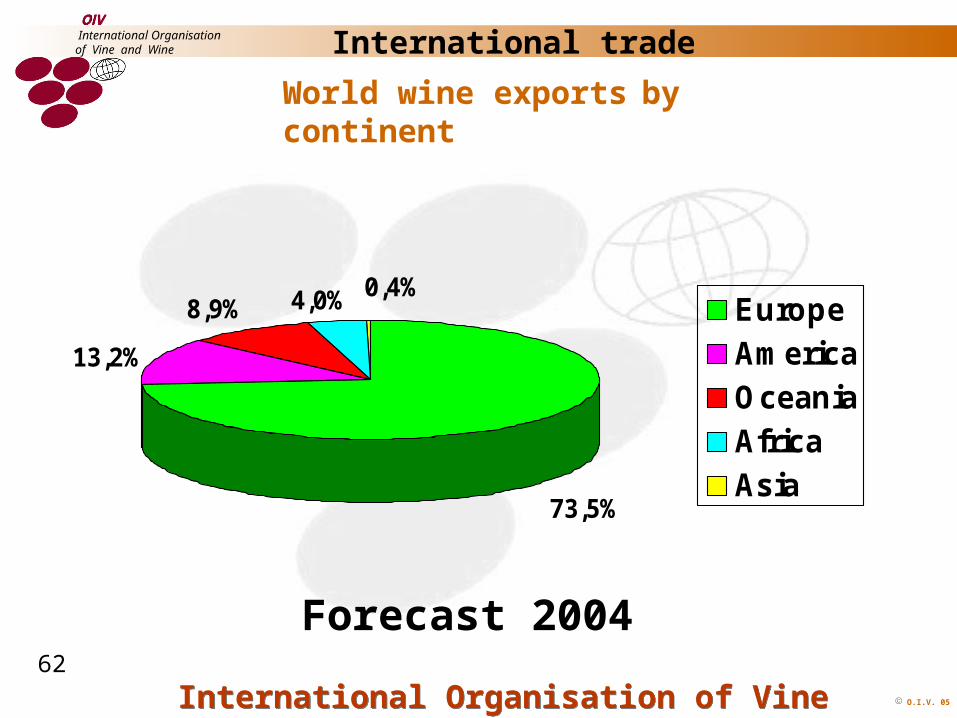
World wine exports by continent
Forecast 2004
International trade
73,5%
13,2%
8,9% 4,0% 0,4%EuropeAmericaOceaniaAfricaAsia
62
O.I.V. 05International Organisation of Vine and WineInternational Organisation of Vine and Wine
International Organisationof Vine and Wine
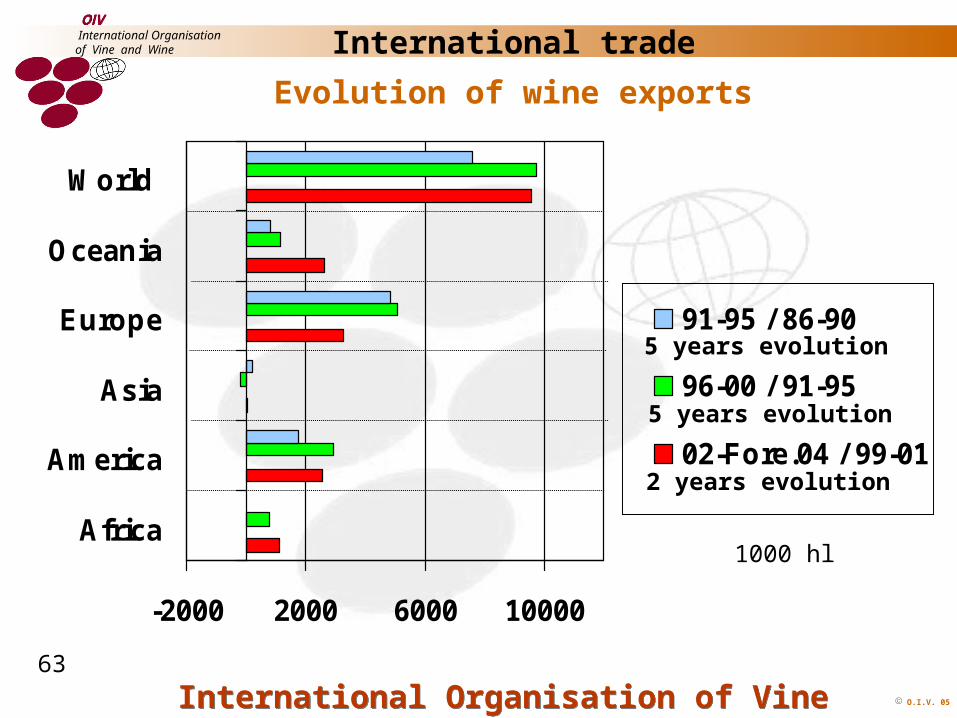
-2000 2000 6000 10000
Africa
America
Asia
Europe
Oceania
World
91-95 / 86-90
96-00 / 91-95
02-Fore.04 / 99-01
1000 hl
International trade
Evolution of wine exports
5 years evolution
5 years evolution
2 years evolution
63
O.I.V. 05International Organisation of Vine and WineInternational Organisation of Vine and Wine
International Organisationof Vine and Wine
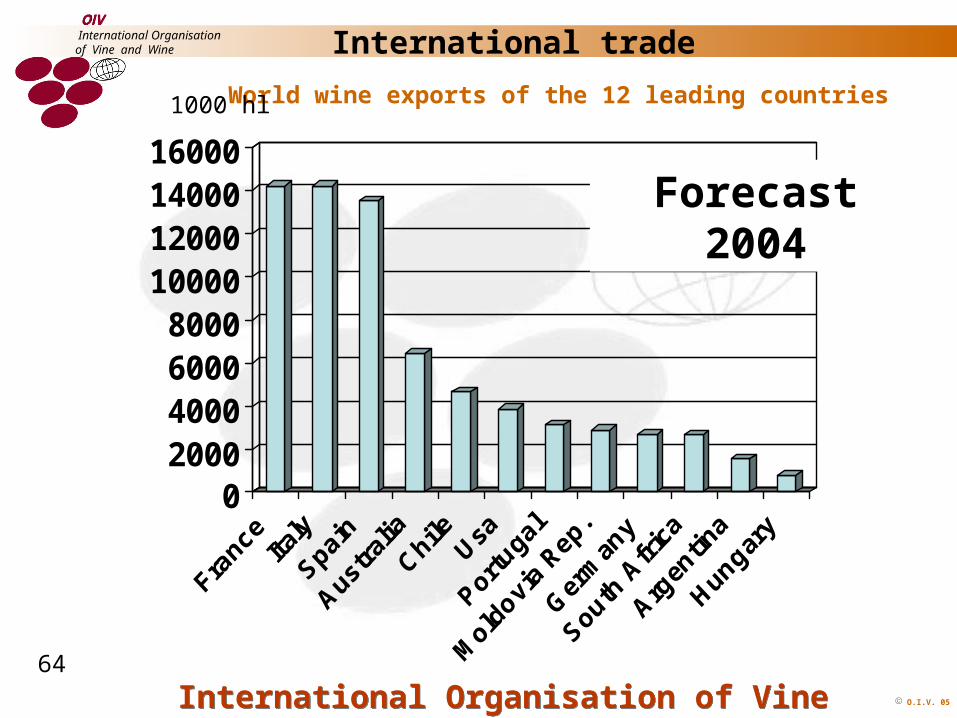
02000400060008000
10000120001400016000
World wine exports of the 12 leading countries
International trade
1000 hl
Forecast 2004
64
O.I.V. 05International Organisation of Vine and WineInternational Organisation of Vine and Wine
International Organisationof Vine and Wine
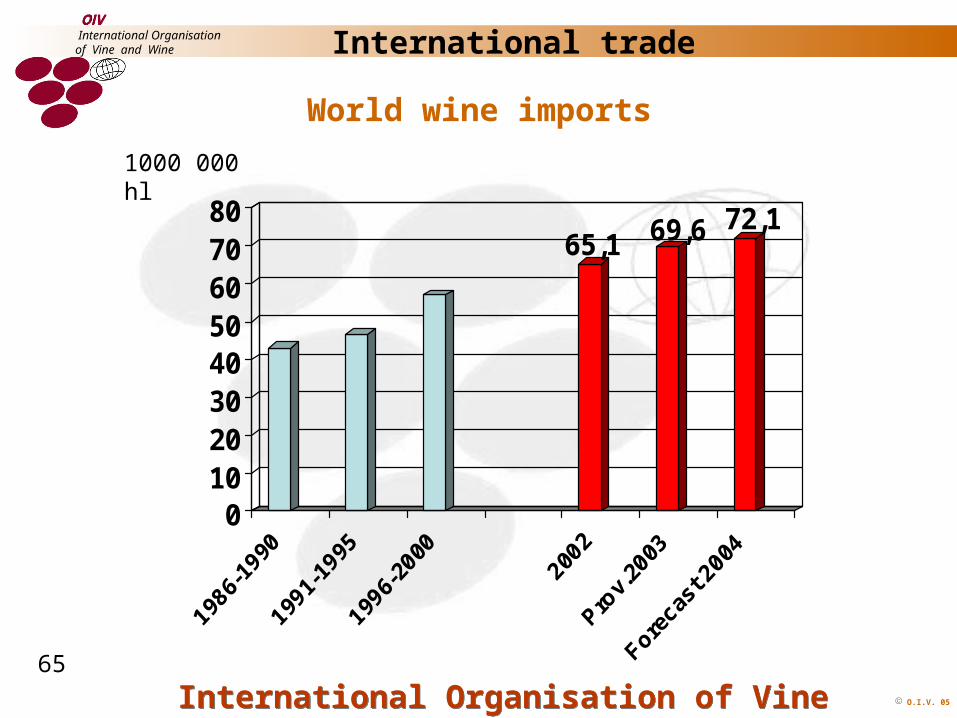
65,1 69,6 72,1
01020304050607080
World wine imports
International trade
1000 000 hl
65
O.I.V. 05International Organisation of Vine and WineInternational Organisation of Vine and Wine
International Organisationof Vine and Wine
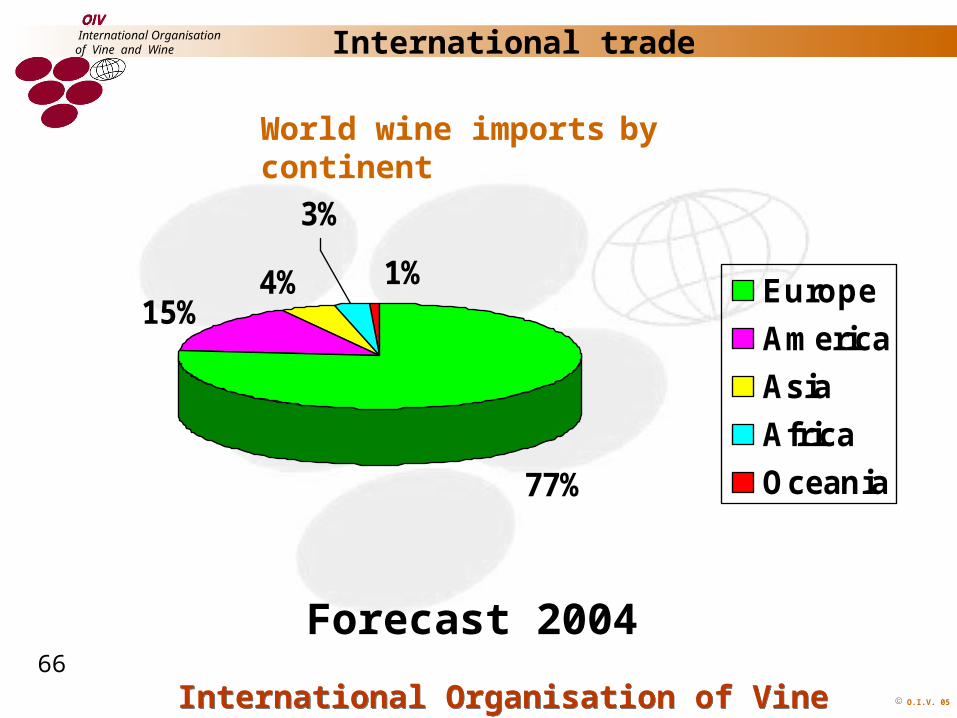
World wine imports by continent
Forecast 2004
International trade
77%
15%4%
3%
1%Europe
America
Asia
Africa
Oceania
66
O.I.V. 05International Organisation of Vine and WineInternational Organisation of Vine and Wine
International Organisationof Vine and Wine
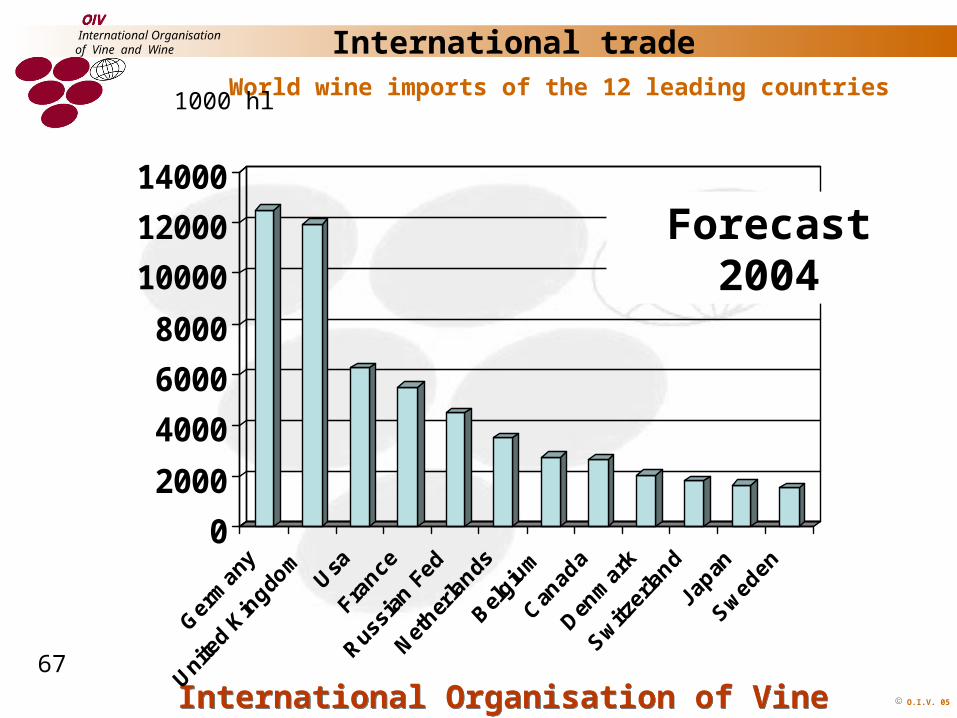
0
2000
4000
6000
8000
10000
12000
14000
World wine imports of the 12 leading countries
International trade
1000 hl
Forecast 2004
67

O.I.V. 05International Organisation of Vine and WineInternational Organisation of Vine and Wine
International Organisationof Vine and Wine
Vielen Dank für Ihre Aufmerksamkeit
Thank you for your attention
Gracias por su atención
Merci de votre attention
Grazie per la Loro attenzione68
Recommended

![Physicochemical and Sensory Characteristics of a Chagalapoli …downloads.hindawi.com/journals/ijfs/2019/9687281.pdf · 2019-10-12 · Organisation of Vine and Wine [13]. Colorimetric](https://img.pdfslide.net/doc/110x75/5ec8631ec3bf4e3c3d47d129/physicochemical-and-sensory-characteristics-of-a-chagalapoli-2019-10-12-organisation.jpg)