1
Chapter 11: Probability and Statistics
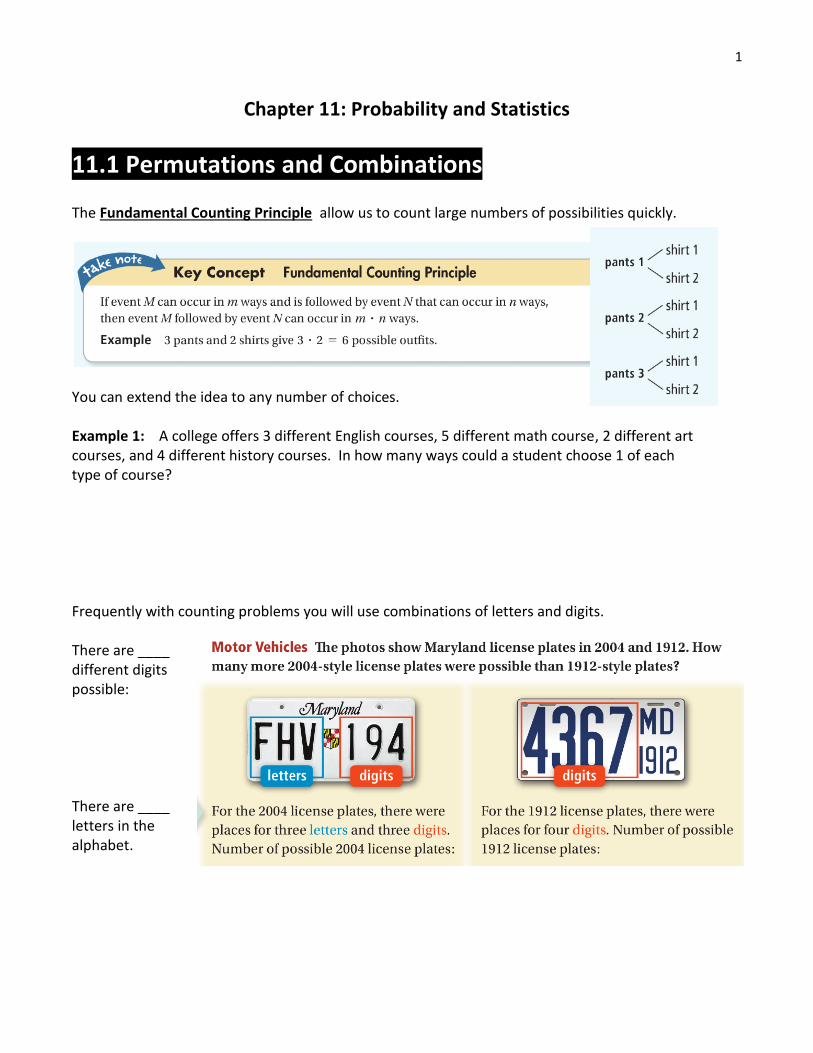
11.1 Permutations and Combinations The Fundamental Counting Principle allow us to count large numbers of possibilities quickly.
You can extend the idea to any number of choices. Example 1: A college offers 3 different English courses, 5 different math course, 2 different art courses, and 4 different history courses. In how many ways could a student choose 1 of each type of course? Frequently with counting problems you will use combinations of letters and digits. There are ____ different digits possible: There are ____ letters in the alphabet.
2
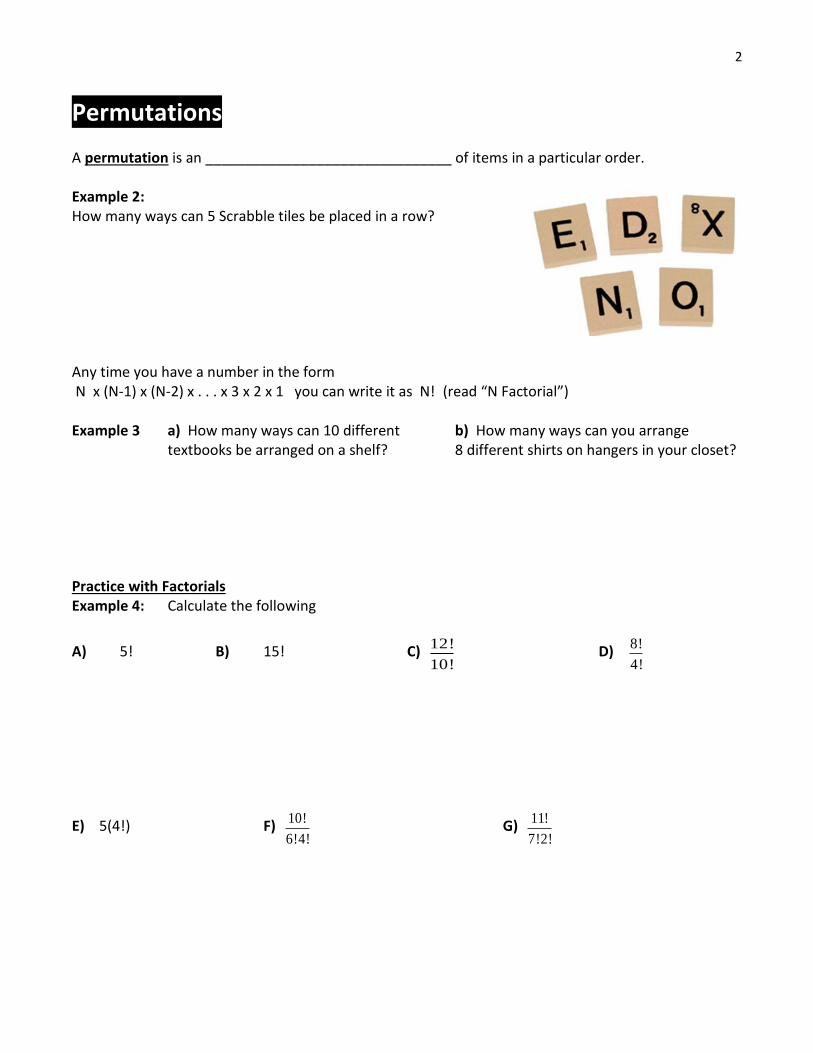
Permutations A permutation is an _______________________________ of items in a particular order. Example 2: How many ways can 5 Scrabble tiles be placed in a row? Any time you have a number in the form N x (N-1) x (N-2) x . . . x 3 x 2 x 1 you can write it as N! (read “N Factorial”) Example 3 a) How many ways can 10 different b) How many ways can you arrange textbooks be arranged on a shelf? 8 different shirts on hangers in your closet? Practice with Factorials Example 4: Calculate the following
A) 5! B) 15! C) 12!
10! D)
8!
4!
E) 5(4!) F) 10!
6!4! G)
11!
7!2!
3
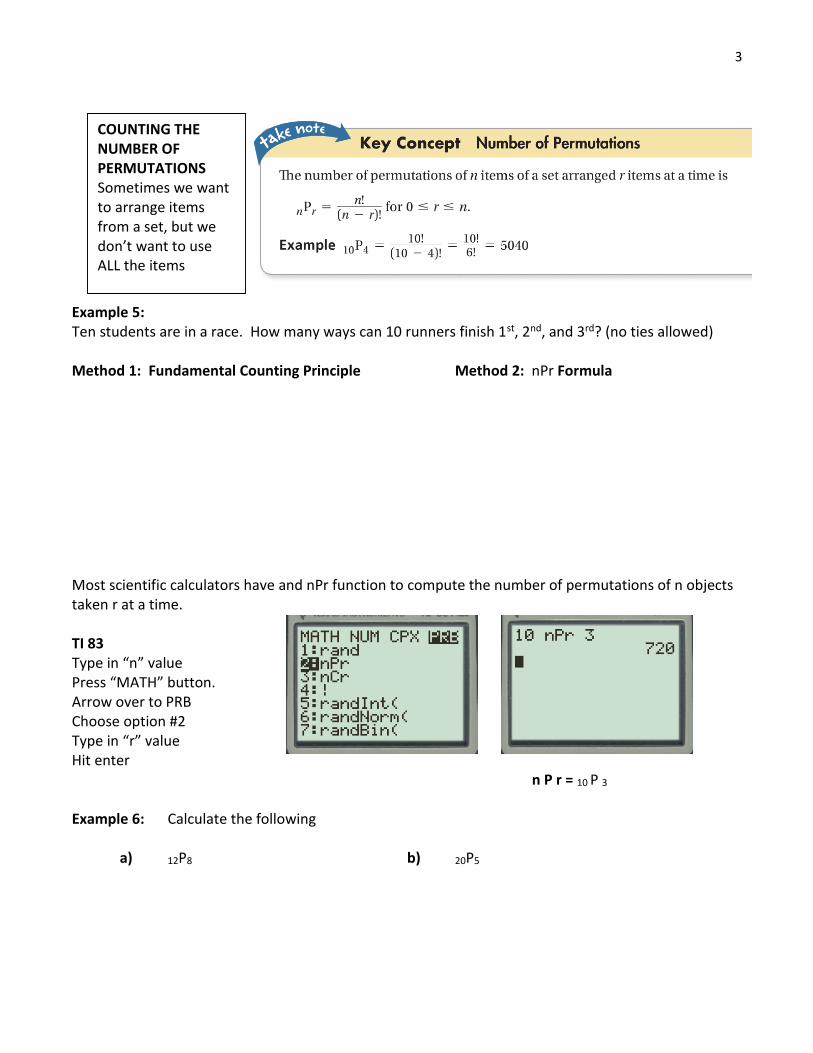
Example 5: Ten students are in a race. How many ways can 10 runners finish 1st, 2nd, and 3rd? (no ties allowed) Method 1: Fundamental Counting Principle Method 2: nPr Formula Most scientific calculators have and nPr function to compute the number of permutations of n objects taken r at a time. TI 83 Type in “n” value Press “MATH” button. Arrow over to PRB Choose option #2 Type in “r” value Hit enter n P r = 10 P 3
Example 6: Calculate the following a) 12P8 b) 20P5
COUNTING THE NUMBER OF PERMUTATIONS Sometimes we want to arrange items from a set, but we don’t want to use ALL the items
4
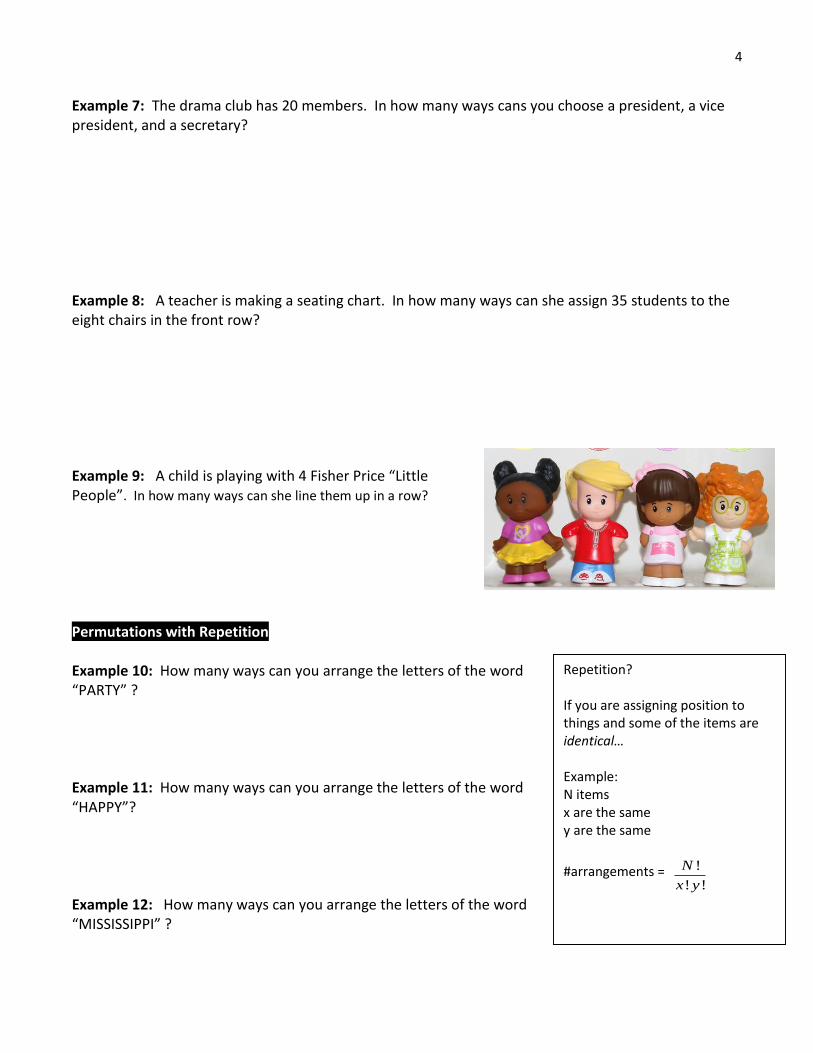
Example 7: The drama club has 20 members. In how many ways cans you choose a president, a vice president, and a secretary? Example 8: A teacher is making a seating chart. In how many ways can she assign 35 students to the eight chairs in the front row? Example 9: A child is playing with 4 Fisher Price “Little People”. In how many ways can she line them up in a row?
Permutations with Repetition Example 10: How many ways can you arrange the letters of the word “PARTY” ? Example 11: How many ways can you arrange the letters of the word “HAPPY”? Example 12: How many ways can you arrange the letters of the word “MISSISSIPPI” ?
Repetition? If you are assigning position to things and some of the items are identical… Example: N items x are the same y are the same
#arrangements = !
! !
N
x y
5
Example 13: How many ways can you make a stack of 5 blocks, 3 of which are red and 2 of which are blue?
Combinations
A combination is a _____________________ of items in which order doesn’t necessarily matter.
Example 1: Five men are nominated for the Academy Award for “Best Actor.” Choose your two favorite actors: ____________________________ ____________________________ The ORDER you write down your answers doesn’t matter since you were not asked to RANK the actors. If you write down: “Christian & Chiwetel” and your neighbor writes down: “Chiwetel & Christian”, you would both claim to have the same favorite actors. Example 2: “How many ways can you select three tiles from a set of five?”
6
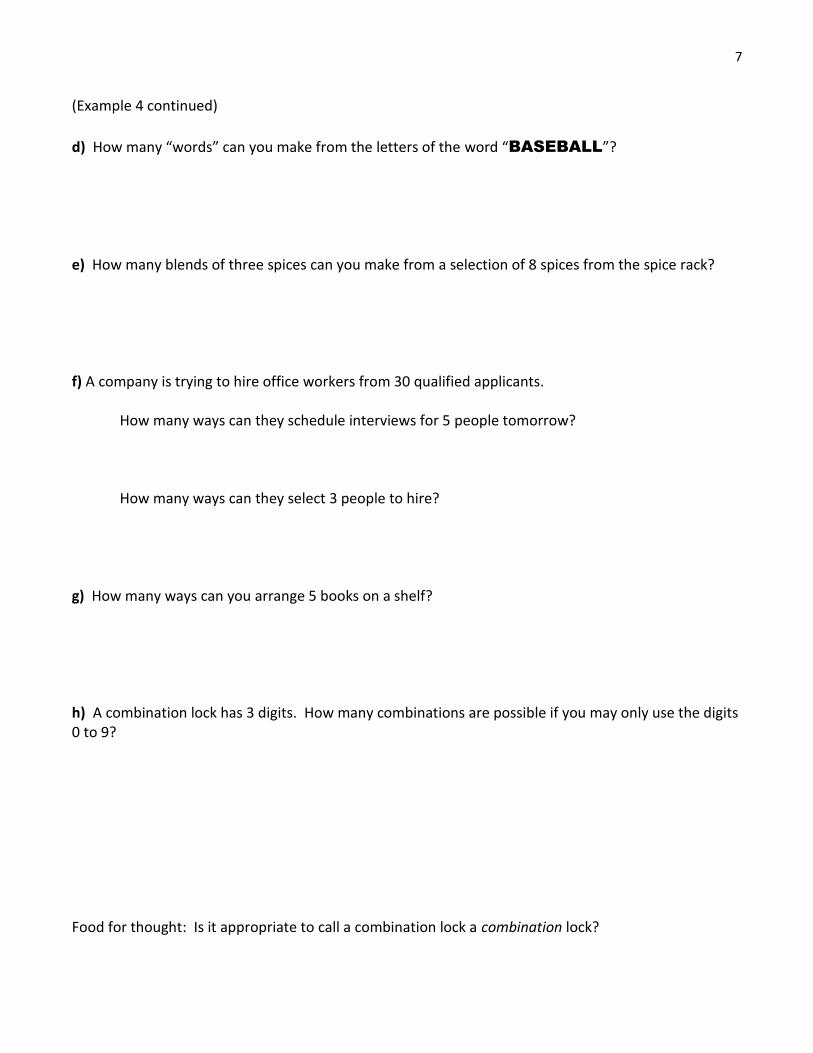
For a TI83, the nCr command is located right under the nPr command in the Math -> PRB menu
Example 3: Calculate the following a) 15C3 b) 12C9 c) 3(8C5)
Example 4: For each problem, consider whether you should use counting principle, permutations, or combinations to solve. Then find the indicated number of things. a) A chemistry teacher divides his class into eight groups. Each group submits one drawing of the molecular structure of water. In how many different ways can he select 4 of the drawings to display? b) You will draw winners from a total of 25 tickets in a raffle. The first ticket wins $100. The second ticket wins $50. The third ticket wins $10. In how many different ways can you draw the three winning tickets? c) Donna Noble is buying wedding clothes. She has it narrowed down to 5 dresses, 2 veils, and 8 pairs of shoes. How many possible outfits can she make by choosing 1 dress, 1 veil, and 1 pair of shoes?
7
(Example 4 continued)
d) How many “words” can you make from the letters of the word “BASEBALL”?
e) How many blends of three spices can you make from a selection of 8 spices from the spice rack? f) A company is trying to hire office workers from 30 qualified applicants. How many ways can they schedule interviews for 5 people tomorrow? How many ways can they select 3 people to hire? g) How many ways can you arrange 5 books on a shelf? h) A combination lock has 3 digits. How many combinations are possible if you may only use the digits 0 to 9? Food for thought: Is it appropriate to call a combination lock a combination lock?
8
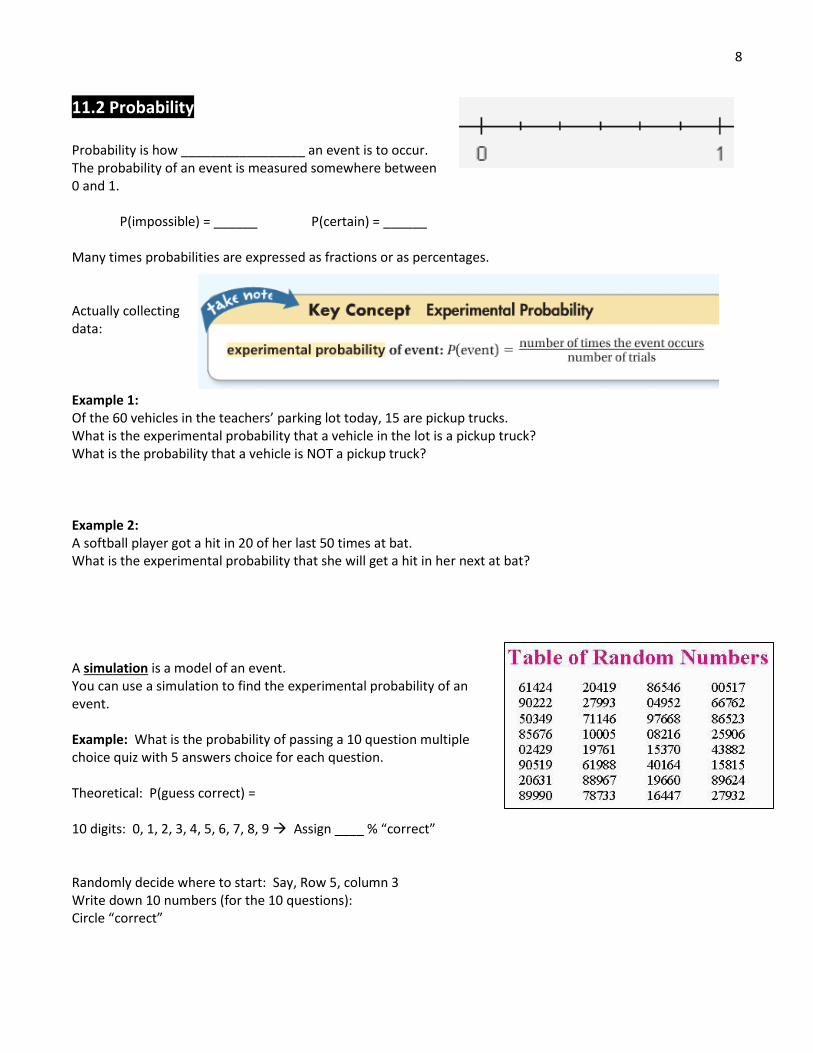
11.2 Probability Probability is how _________________ an event is to occur. The probability of an event is measured somewhere between 0 and 1. P(impossible) = ______ P(certain) = ______ Many times probabilities are expressed as fractions or as percentages. Actually collecting data: Example 1: Of the 60 vehicles in the teachers’ parking lot today, 15 are pickup trucks. What is the experimental probability that a vehicle in the lot is a pickup truck? What is the probability that a vehicle is NOT a pickup truck? Example 2: A softball player got a hit in 20 of her last 50 times at bat. What is the experimental probability that she will get a hit in her next at bat? A simulation is a model of an event. You can use a simulation to find the experimental probability of an event. Example: What is the probability of passing a 10 question multiple choice quiz with 5 answers choice for each question. Theoretical: P(guess correct) = 10 digits: 0, 1, 2, 3, 4, 5, 6, 7, 8, 9 Assign ____ % “correct” Randomly decide where to start: Say, Row 5, column 3 Write down 10 numbers (for the 10 questions): Circle “correct”

9
The sample space is the set of all possible outcomes of an experiment. When each outcome has the same chance of occurring, the outcomes are called equally likely outcomes. Example 3: Given a standard number cube, what is the theoretical probability of each event? a) P(even) b) P(7) c) P(even or multiple of 3) Example 4: Given a standard deck of 52 playing cards, what is the theoretical probability of each event? Note: 13 Cards: Ace, King, Queen, Jack, 10,9,8,7,6,5,4,3,2 4 Suits: Black Suits – Clubs, Spades Red Suits – Diamonds, Hearts a) P(King) b) P(Face Card) c) P(heart or a 10) Example 5: You open a bag of jawbreakers and find 15 red, 10 orange, 8 green, and 7 purple. What is the theoretical probability of each event? a) P (red or orange) b) P(not green) c) P(red or not orange)
Rolling a number cube:
Sample Space:
Equally likely?

10
Combinatorics When you are simultaneously choosing several things at once, you may need to use combinations to determine the probability of an event. Example 6: A student has a personal library of 30 zombie movies and 10 action movies. If the student randomly grabs 6 movies to take on vacation, what are the following theoretical probabilities? Sample Space: a) P(all zombie movies) b) P(all action movies) c) P(exactly 2 zombie movies) d) P(exactly 4 zombie movies) Example 7: What is the theoretical probability of being dealt the following 5 card hands from a standard 52-card deck? Sample Space: a) P(5 diamonds) b) P (all 2’s or 3’s) c) P(exactly 2 kings) c) P(exactly 3 hearts)
11
11.3 Probability of Multiple Events Consider the following: I have a stack of 10 cards each with a different number from 1 to 10. 1,2,3,4,5,6,7,8,9,10 Simple Probability (1 item, 1 time)
You draw 1 card from the stack. What is the probability that the card is an even number? Combinatorics (several items at the same time)
You choose 3 cards from the stack. What is the probability that all three cards are even?
You choose 3 cards from the stack. What is the probability of getting exactly 2 odd-numbered cards?
Multiple Events (1 item, several trials or different items)
You roll a standard number cube and flip a coin. What is the probability of getting a even number and heads?
You flip a coin 6 times in a row. What is the probability of getting all heads?
Dependent vs. Independent dependent - one event affects the outcome of another independent – events do not affect each other Example 1: a) Roll a number cube. Spin a spinner. b) Draw a card. Without replacing it, draw a second card. c) Flip a coin. Flip the coin again. d) Select a coin from a pile. Put it back. Select a coin again.
12
Probability of Independent Events If A and B are independent events, then P(A and B) = P(A) x P(B) Example 2: Find the probability of each of the following. a) You are rolling a standard number cube then flipping a coin. P( even number and head) b) You are flipping a coin three times. P(3 heads) c) There are 10 diet cokes and 5 regular cokes. There are 8 bags of Doritos and 12 bags of Gardettos. P( diet drink, Doritos) P( regular drink, Gardettos)
Mutually Exclusive Events Two events that cannot happen at the same time. P(A and B) = 0 Example 3: You roll a standard number cube. P(2 and 3) P(even and prime) Example 4: You draw a card from a deck of 52. P(K and Q) P(K and heart)
13
“OR”
Cannot happen at same time. CAN happen at same time. Mutually Exclusive Not Mutually Exclusive P(A or B) = P(A) + P(B) P(A or B) = P(A) + P(B) – P(A and B) Example 5: Students can take one foreign language at a time. Out of a total of 100 students, 37 of students take Spanish and 15 of students take French. P(Spanish or French) Example 6: Students can take multiple language courses at the same time. Out of a total of 100 students, 37 take Spanish, 15 take French, and 5 take Spanish and French. P(French ONLY) P (French or Spanish) Example 7: You are working with a standard deck of 52 playing cards. a) P(heart or a diamond) b) P(heart or a King) c) P(Ace or a King) d) P (Ace or Black Card)
14
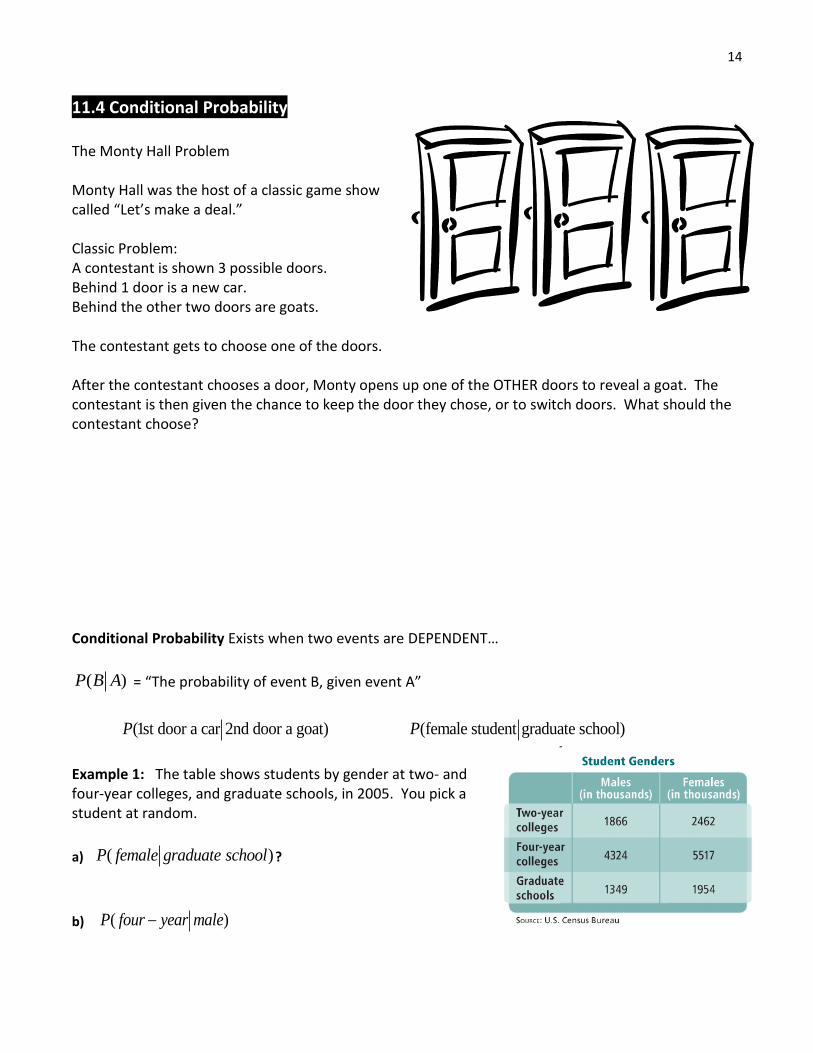
11.4 Conditional Probability The Monty Hall Problem Monty Hall was the host of a classic game show called “Let’s make a deal.” Classic Problem: A contestant is shown 3 possible doors. Behind 1 door is a new car. Behind the other two doors are goats. The contestant gets to choose one of the doors. After the contestant chooses a door, Monty opens up one of the OTHER doors to reveal a goat. The contestant is then given the chance to keep the door they chose, or to switch doors. What should the contestant choose? Conditional Probability Exists when two events are DEPENDENT…
( )P B A = “The probability of event B, given event A”
(1st door a car 2nd door a goat)P (female student graduate school)P
Example 1: The table shows students by gender at two- and four-year colleges, and graduate schools, in 2005. You pick a student at random.
a) ( )P female graduate school ?
b) ( )P four year male
15
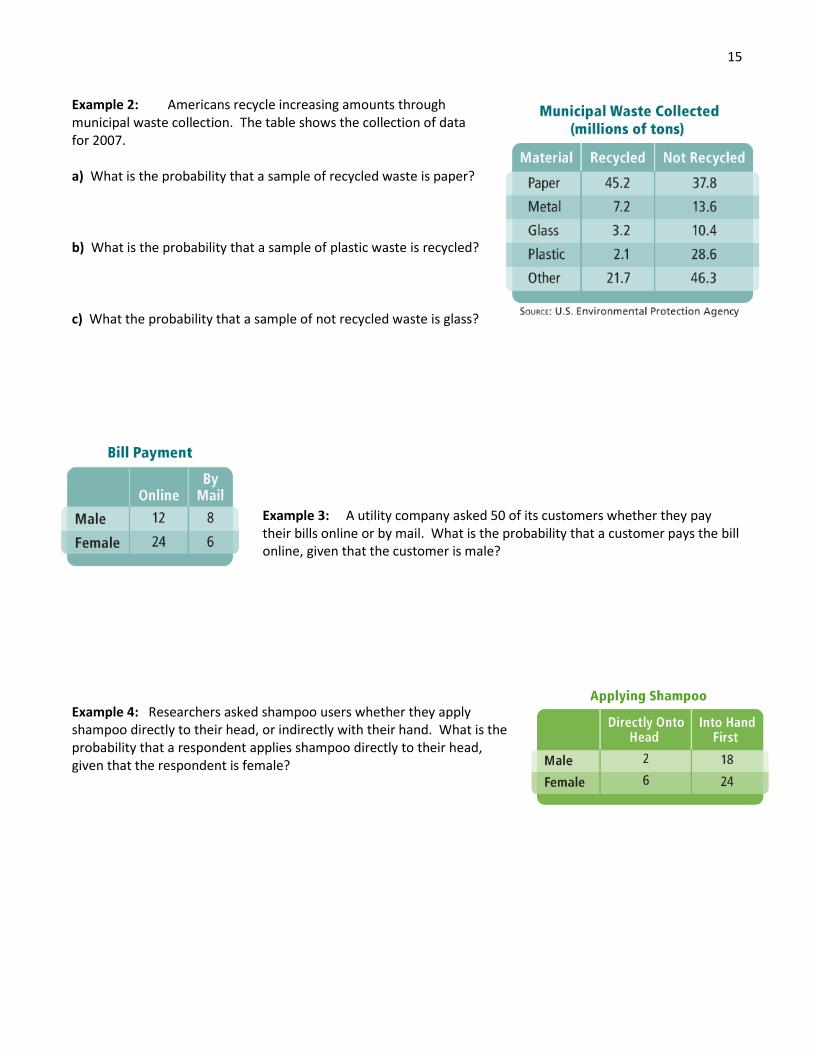
Example 2: Americans recycle increasing amounts through municipal waste collection. The table shows the collection of data for 2007. a) What is the probability that a sample of recycled waste is paper? b) What is the probability that a sample of plastic waste is recycled? c) What the probability that a sample of not recycled waste is glass?
Example 3: A utility company asked 50 of its customers whether they pay their bills online or by mail. What is the probability that a customer pays the bill online, given that the customer is male?
Example 4: Researchers asked shampoo users whether they apply shampoo directly to their head, or indirectly with their hand. What is the probability that a respondent applies shampoo directly to their head, given that the respondent is female?
16
Example 5: A school system compiled the following information from a survey it sent to people who were juniors 10 years earlier.
85% of the students graduated from high school
Of the students who graduated from high school, 90% are happy with their jobs.
Of the students who did not graduate from high school, 60% are happy with their jobs. Make a Tree Diagram: a) What is the probability that a person from the junior class 10 years ago graduated from high school and is happy with his or her job? b) What is the probability that a student from the junior class 10 years ago did not graduate and is happy with his or her present job?
17
11.5 Analyzing Data Anal
The average height of an adult male in the USA is 5 feet 9.2 inches. (source: http://pediatrics.about.com/cs/growthcharts2/f/avg_ht_male.htm)
“Average” is a word we used to summarize a set of data. This one number can be used to represent an entire population of people and is used to draw conclusions and make predictions about data.
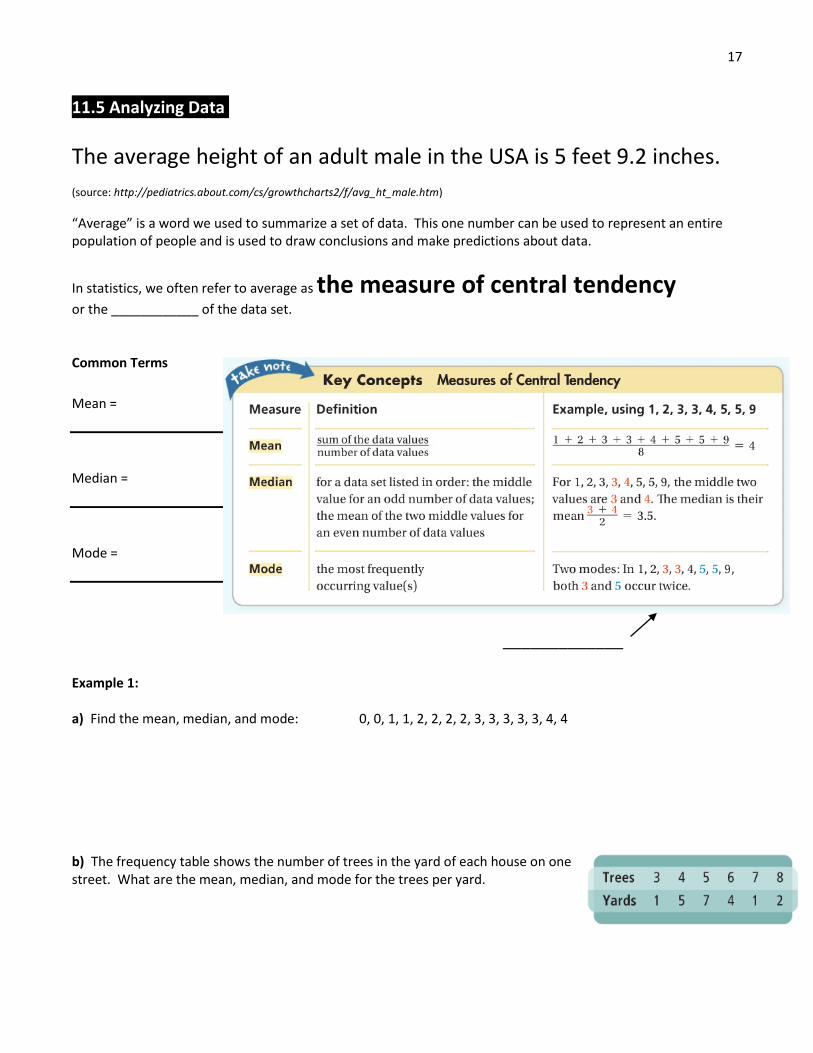
In statistics, we often refer to average as the measure of central tendency or the ____________ of the data set. Common Terms
Mean =
Median =
Mode =
_____________ Example 1: a) Find the mean, median, and mode: 0, 0, 1, 1, 2, 2, 2, 2, 3, 3, 3, 3, 3, 4, 4 b) The frequency table shows the number of trees in the yard of each house on one street. What are the mean, median, and mode for the trees per yard.
18
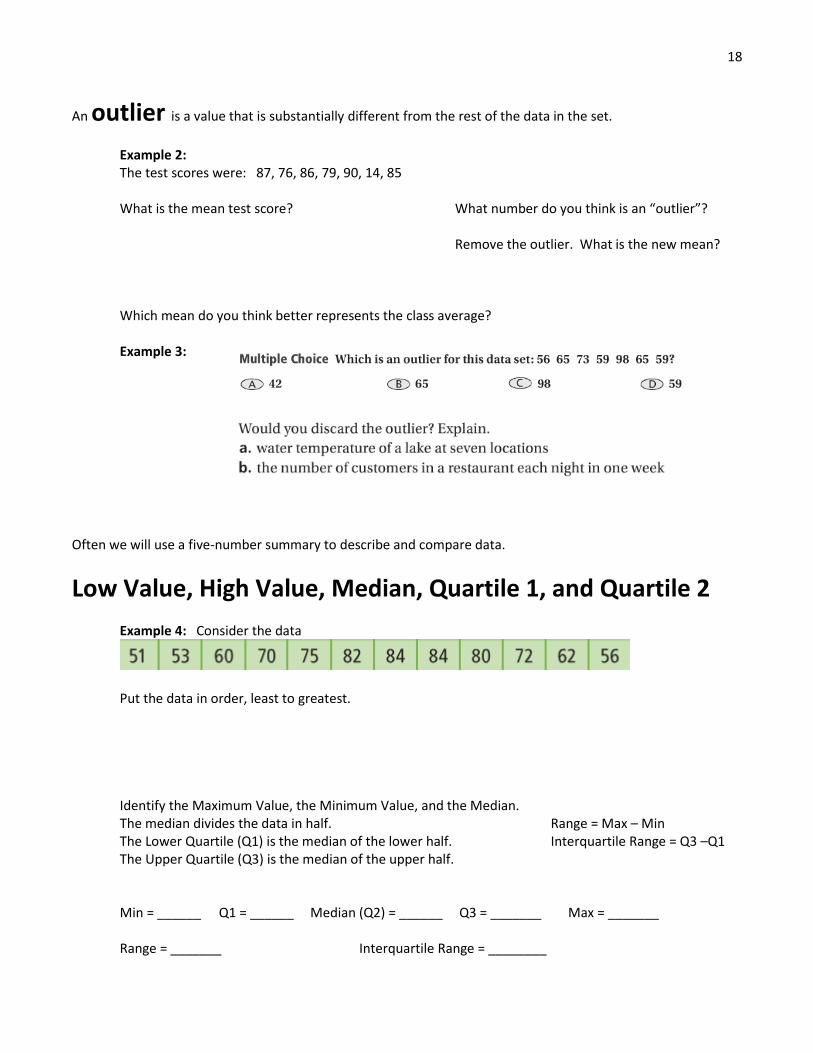
An outlier is a value that is substantially different from the rest of the data in the set.
Example 2: The test scores were: 87, 76, 86, 79, 90, 14, 85
What is the mean test score? What number do you think is an “outlier”?
Remove the outlier. What is the new mean?
Which mean do you think better represents the class average?
Example 3:
Often we will use a five-number summary to describe and compare data.
Low Value, High Value, Median, Quartile 1, and Quartile 2
Example 4: Consider the data
Put the data in order, least to greatest. Identify the Maximum Value, the Minimum Value, and the Median. The median divides the data in half. Range = Max – Min The Lower Quartile (Q1) is the median of the lower half. Interquartile Range = Q3 –Q1 The Upper Quartile (Q3) is the median of the upper half. Min = ______ Q1 = ______ Median (Q2) = ______ Q3 = _______ Max = _______ Range = _______ Interquartile Range = ________
19
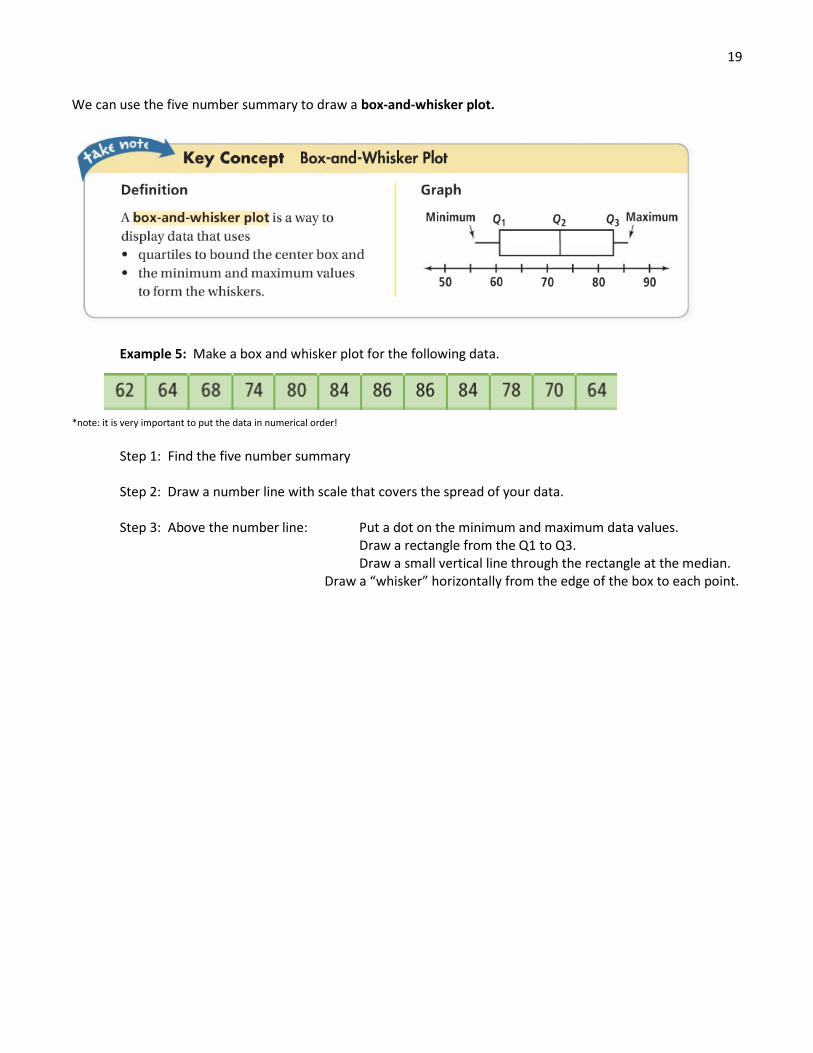
We can use the five number summary to draw a box-and-whisker plot.
Example 5: Make a box and whisker plot for the following data.
*note: it is very important to put the data in numerical order!
Step 1: Find the five number summary Step 2: Draw a number line with scale that covers the spread of your data. Step 3: Above the number line: Put a dot on the minimum and maximum data values. Draw a rectangle from the Q1 to Q3. Draw a small vertical line through the rectangle at the median.
Draw a “whisker” horizontally from the edge of the box to each point.
20
Percentiles You receive your S.A.T. scores and are told that you scored “in the 83rd percentile for math, 78th percentile for verbal, and 95th percentile for writing.” What does this mean? A percentile is a score from 0 to 100 that represents the percentage of data that is ______ x. This means that you scored the same or better than ______ of everyone else who took the test in math.
Example 6: John is told that his son is in the 58th percentile for height for 6-year-old boys. What percentage of 6-year old boys are shorter than or at the same height as John’s son? What percentage of 6-year-old boys are taller than John’s son?
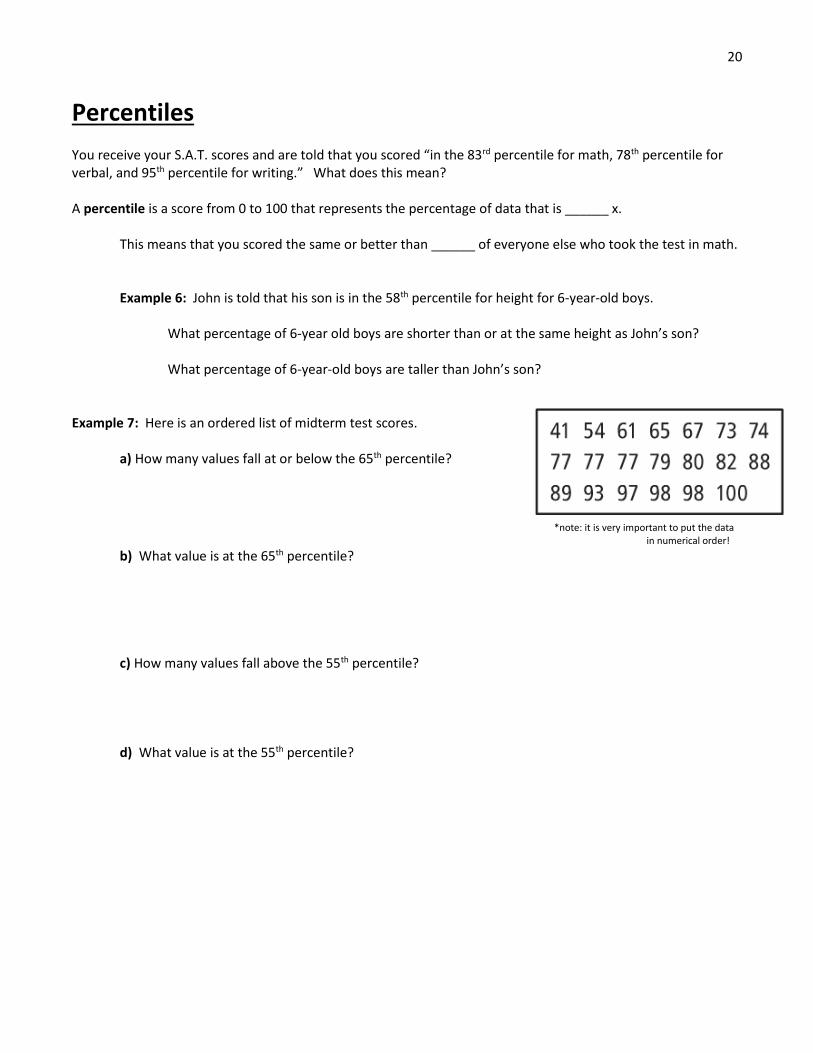
Example 7: Here is an ordered list of midterm test scores. a) How many values fall at or below the 65th percentile? *note: it is very important to put the data
in numerical order!
b) What value is at the 65th percentile? c) How many values fall above the 55th percentile? d) What value is at the 55th percentile?
21
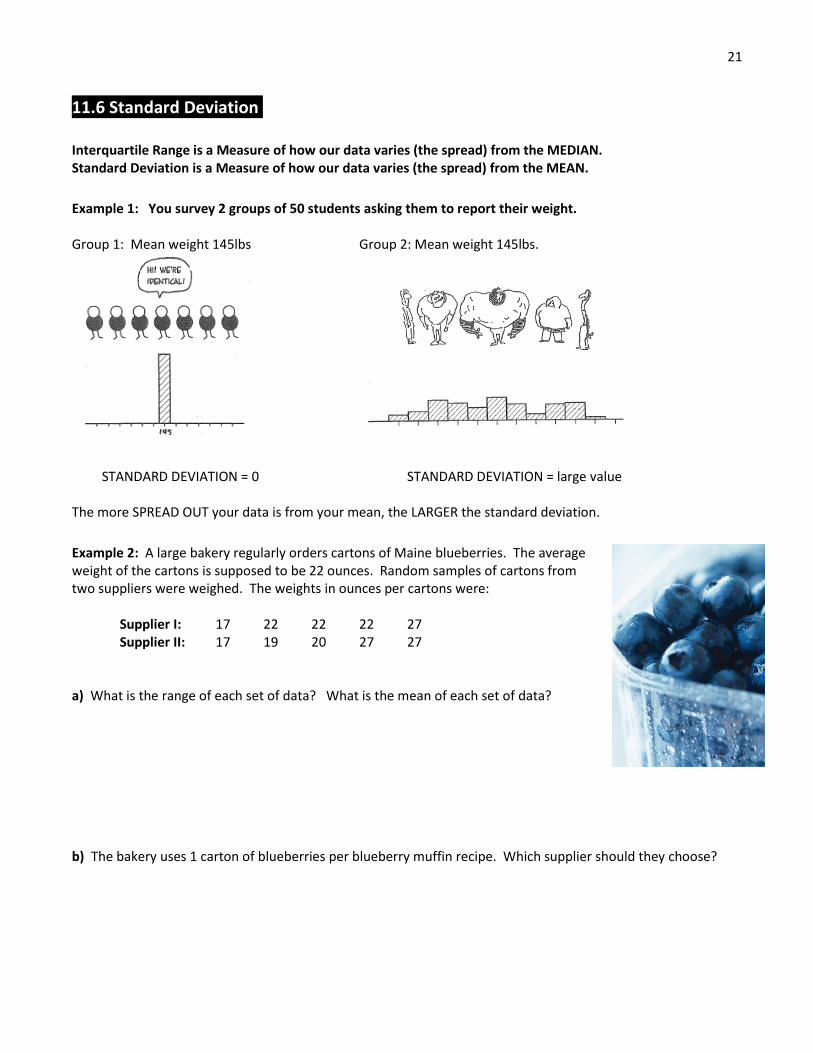
11.6 Standard Deviation Anal Interquartile Range is a Measure of how our data varies (the spread) from the MEDIAN. Standard Deviation is a Measure of how our data varies (the spread) from the MEAN.
Example 1: You survey 2 groups of 50 students asking them to report their weight. Group 1: Mean weight 145lbs Group 2: Mean weight 145lbs. STANDARD DEVIATION = 0 STANDARD DEVIATION = large value The more SPREAD OUT your data is from your mean, the LARGER the standard deviation. Example 2: A large bakery regularly orders cartons of Maine blueberries. The average weight of the cartons is supposed to be 22 ounces. Random samples of cartons from two suppliers were weighed. The weights in ounces per cartons were: Supplier I: 17 22 22 22 27 Supplier II: 17 19 20 27 27 a) What is the range of each set of data? What is the mean of each set of data? b) The bakery uses 1 carton of blueberries per blueberry muffin recipe. Which supplier should they choose?
22
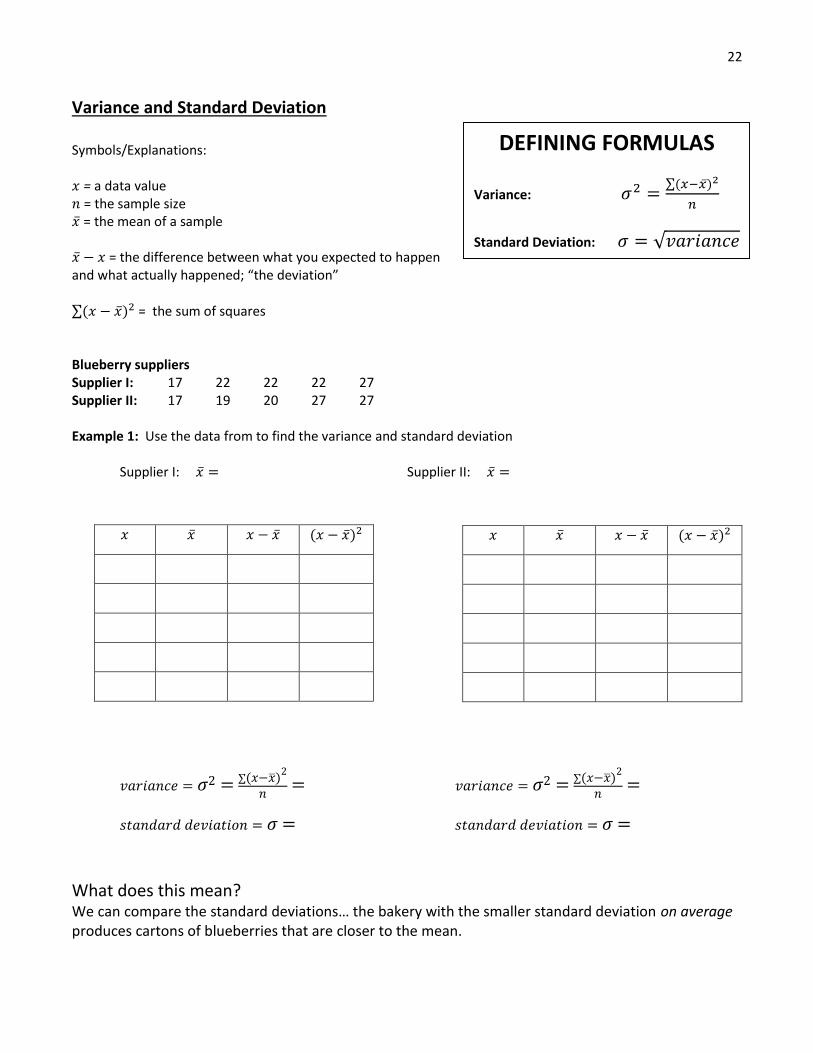
Variance and Standard Deviation Symbols/Explanations: 𝑥 = a data value 𝑛 = the sample size �̅� = the mean of a sample �̅� − 𝑥 = the difference between what you expected to happen and what actually happened; “the deviation” ∑(𝑥 − �̅�)2 = the sum of squares Blueberry suppliers Supplier I: 17 22 22 22 27 Supplier II: 17 19 20 27 27 Example 1: Use the data from to find the variance and standard deviation Supplier I: �̅� = Supplier II: �̅� =
𝑣𝑎𝑟𝑖𝑎𝑛𝑐𝑒 = 𝜎2 = ∑(𝑥−�̅�)2
𝑛= 𝑣𝑎𝑟𝑖𝑎𝑛𝑐𝑒 = 𝜎2 = ∑(𝑥−�̅�)
2
𝑛=
𝑠𝑡𝑎𝑛𝑑𝑎𝑟𝑑 𝑑𝑒𝑣𝑖𝑎𝑡𝑖𝑜𝑛 = 𝜎 = 𝑠𝑡𝑎𝑛𝑑𝑎𝑟𝑑 𝑑𝑒𝑣𝑖𝑎𝑡𝑖𝑜𝑛 = 𝜎 = What does this mean? We can compare the standard deviations… the bakery with the smaller standard deviation on average produces cartons of blueberries that are closer to the mean.
𝑥 �̅� 𝑥 − �̅� (𝑥 − �̅�)2
𝑥 �̅� 𝑥 − �̅� (𝑥 − �̅�)2
DEFINING FORMULAS
Variance: 𝜎2 =∑(𝑥−�̅�)2
𝑛
Standard Deviation: 𝜎 = √𝑣𝑎𝑟𝑖𝑎𝑛𝑐𝑒
23
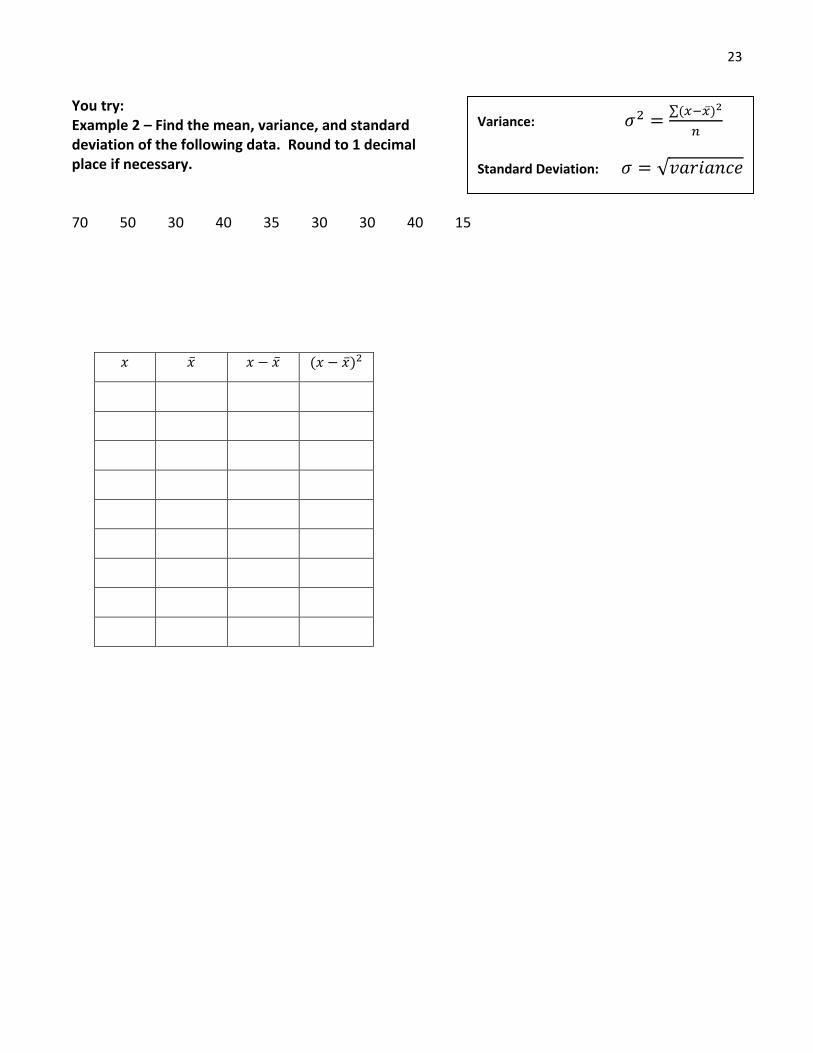
You try: Example 2 – Find the mean, variance, and standard deviation of the following data. Round to 1 decimal place if necessary. 70 50 30 40 35 30 30 40 15
𝑥 �̅� 𝑥 − �̅� (𝑥 − �̅�)2
Variance: 𝜎2 =∑(𝑥−�̅�)2
𝑛
Standard Deviation: 𝜎 = √𝑣𝑎𝑟𝑖𝑎𝑛𝑐𝑒
24
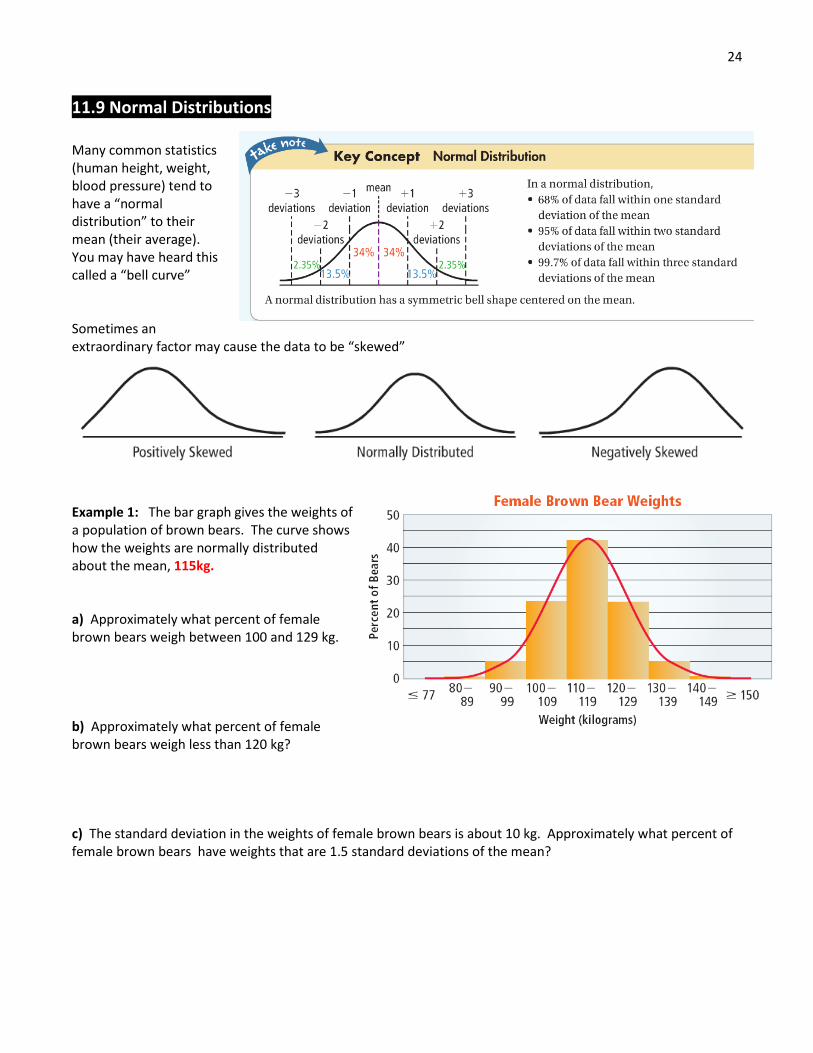
11.9 Normal Distributions Many common statistics (human height, weight, blood pressure) tend to have a “normal distribution” to their mean (their average). You may have heard this called a “bell curve” Sometimes an extraordinary factor may cause the data to be “skewed”
Example 1: The bar graph gives the weights of a population of brown bears. The curve shows how the weights are normally distributed about the mean, 115kg. a) Approximately what percent of female brown bears weigh between 100 and 129 kg. b) Approximately what percent of female brown bears weigh less than 120 kg? c) The standard deviation in the weights of female brown bears is about 10 kg. Approximately what percent of female brown bears have weights that are 1.5 standard deviations of the mean?
25
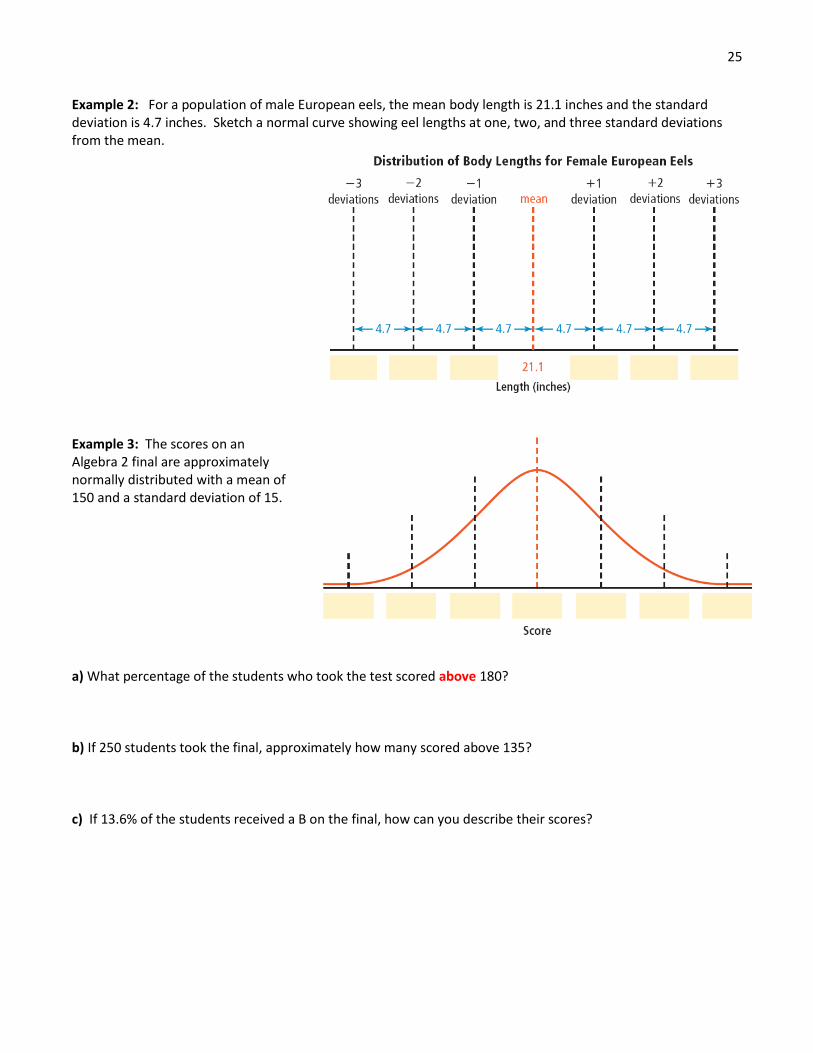
Example 2: For a population of male European eels, the mean body length is 21.1 inches and the standard deviation is 4.7 inches. Sketch a normal curve showing eel lengths at one, two, and three standard deviations from the mean. Example 3: The scores on an Algebra 2 final are approximately normally distributed with a mean of 150 and a standard deviation of 15. a) What percentage of the students who took the test scored above 180? b) If 250 students took the final, approximately how many scored above 135? c) If 13.6% of the students received a B on the final, how can you describe their scores?
Recommended