UNCLASSIFIED
UNCLASSIFIED
2016 Crime Statistics Report
Authorising Officer: Commissioner Of The Bermuda Police Service Author: Analysis Unit Date: 17-Apr-2016 File Location: G:\Intelligence Briefings\INTELLIGENCE ANALYSTS\2016\Quarterly Statistics\Q3 and Q4 2016\2016 Crime Statistics Report Security Classification: This document is marked as UNCLASSIFIED. Further dissemination is allowed internally and externally of the BPS, without further authorisation.
UNCLASSIFIED
UNCLASSIFIED 1
INDEX 1. INTRODUCTION Page 2 2. ALL CRIME Page 4 3. CRIMES AGAINST THE PERSON Page 5 4. FIREARM INCIDENTS Page 6 5. CRIMES AGAINST THE COMMUNITY Page 9 6. CRIMES AGAINST PROPERTY Page 10 7. TRAFFIC COLLISIONS Page 11 8. TRAFFIC ENFORCEMENT ACTIVITY Page 12 9. CALLS FOR SERVICE Page 13 10. ARRESTS - ALL OFFENCES Page 14 11. STOP AND SEARCH Page 18 12. PROCEEDS OF CRIME ACT (POCA) SEIZURES Page 19
Appendix A: Crime Statistics In Bermuda, By Quarter (2012 - 2016)
Appendix B: Traffic Enforcement Activity In Bermuda, By Quarter (2012 - 2016) Appendix C: Traffic Collisions Statistics In Bermuda, By Quarter (2012 - 2016) Appendix D: All Crime In Bermuda, By Quarter (2000 - 2016) Appendix E: Firearm Fatalities, Injuries and All Homicides In Bermuda,
By Year (2000 - 2016)
UNCLASSIFIED
UNCLASSIFIED 2
1. INTRODUCTION 1.1 SECURITY CLASSIFICATION This document is marked as UNCLASSIFIED as there are no sensitive details contained in it and it is expressly written to be circulated both internally and externally. 1.2 DATA INTEGRITY The statistics, tables and graphs contained in this document are based on substantiated principal offences, which have been actively investigated. While every effort is made to ensure that the information contained in this report is accurate, the BPS makes no warranty, representation or guarantee as to the content, sequence, accuracy, timeliness or completeness of any data or information provided. The reader should not rely on the data provided for comparison purposes over time, or for any reason. The BPS shall assume no liability for any errors, omissions, or inaccuracies in the information provided. The BPS will not be responsible for the use of, or the results obtained from the use of this report. The BPS assumes no liability for any decisions made or actions taken or not taken by the user in reliance of this report. Any use of the document for commercial purposes is prohibited. 1.3 EXPLANATION OF GRAPHS The graphs used in this report include standard deviation, which has been used as a means of objectively measuring how much the data has varied over time and is useful in identifying extreme highs and lows of crime. Standard deviation has been used so that where the data is above the red line (2 standard deviation above the mean average), it is considered exceptionally high. Where the data is below the blue line (2 standard deviation below the mean average), it is considered exceptionally low. In both cases, it can be referred to as statistically significant (high or low) and is an indication of whether the figures are exceptionally high or exceptionally low. 1.4 AIM The aim of this report is to produce accurate, timely, objective information that: Enables informed decisions to be made on the types of crime that threaten the
safety of the community. Is used to proactively manage risks to the island and ensure effective policing,
redeploying and directing resources at a strategic and tactical level, as required. Facilitates effective and open communication with our stakeholders, developing the
means to inform them of the plans, efforts and progress being made by the BPS. Provides meaningful information as one of the means of reassuring communities in
Bermuda. 1.5 SCHEDULE OF REPORTING Prior to 2016, crime statistics reports were produced every quarter and also included drug seizure information. The 2016 Crime Statistics Report and future reports will be produced once per year. A separate report is scheduled to be produced once per year that will detail drug seizures and drug enforcement.
UNCLASSIFIED
UNCLASSIFIED 3
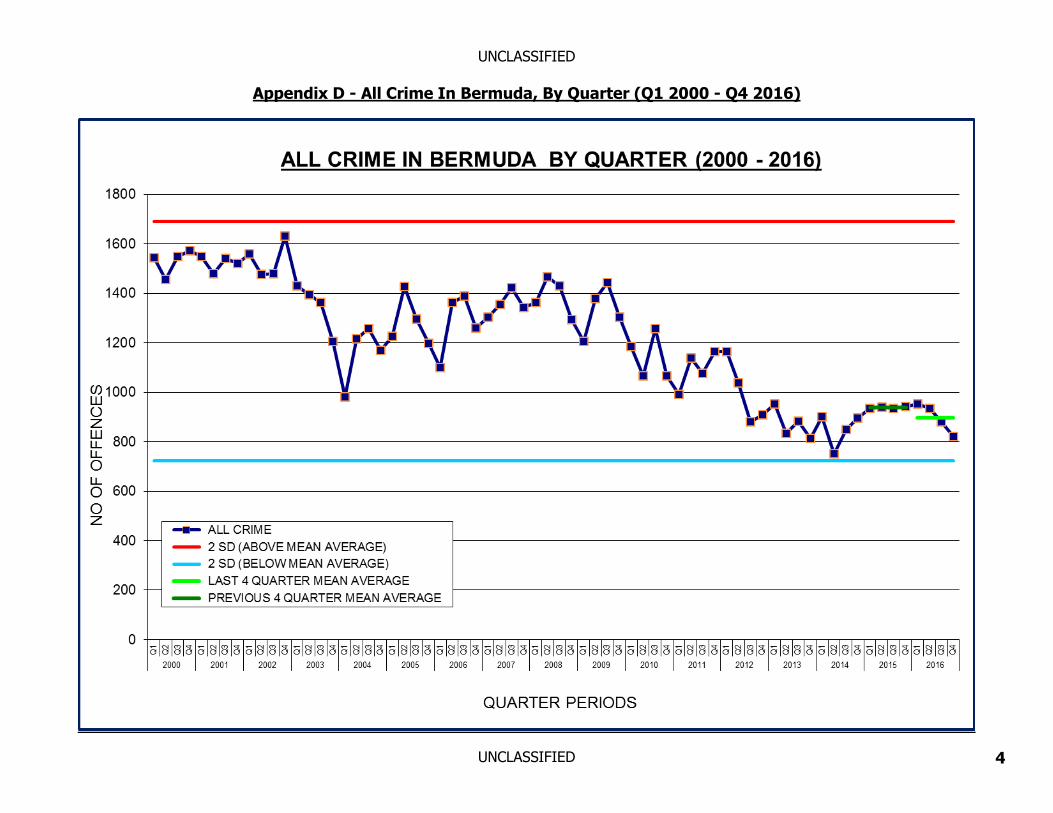
1.5 Executive Summary When comparing 2016 with 2015, All Crime decreased by -164 offences, from 3,751 in 2015 to 3,587 in 2016. 18 continuous quarters have been recorded with less than 1,000 offences between Q3 2012 and Q4 2016.
In 2016, recorded crime decreased in Crimes Against Property and Crimes Against The Community, with 9 of the 11 crime categories decreasing or remaining the same. Decreases were recorded in Disorder, Fraud and Deception, Anti-Social Behaviour, Theft of Property and Criminal Damage. In 2016, recorded crime increased in Crimes Against The Person, with 5 of the 8 crime categories recording an increase. Increases were recorded in Murder, Robbery, Sexual Assault, Offences Against Children and Other Assaults. An increase in Burglary (Crimes Against Property) was also recorded.
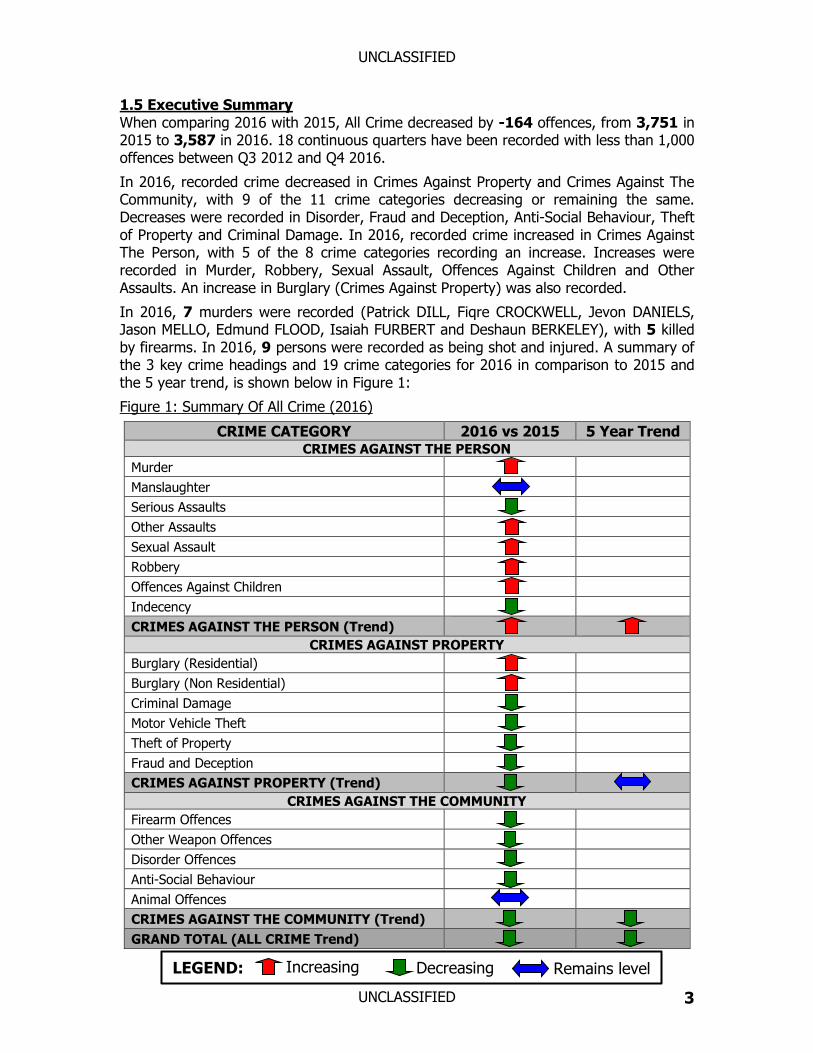
In 2016, 7 murders were recorded (Patrick DILL, Fiqre CROCKWELL, Jevon DANIELS, Jason MELLO, Edmund FLOOD, Isaiah FURBERT and Deshaun BERKELEY), with 5 killed by firearms. In 2016, 9 persons were recorded as being shot and injured. A summary of the 3 key crime headings and 19 crime categories for 2016 in comparison to 2015 and the 5 year trend, is shown below in Figure 1:
Figure 1: Summary Of All Crime (2016)
CRIME CATEGORY 2016 vs 2015 5 Year Trend CRIMES AGAINST THE PERSON
Murder Manslaughter Serious Assaults Other Assaults Sexual Assault Robbery Offences Against Children Indecency CRIMES AGAINST THE PERSON (Trend)
CRIMES AGAINST PROPERTY Burglary (Residential) Burglary (Non Residential) Criminal Damage Motor Vehicle Theft Theft of Property Fraud and Deception CRIMES AGAINST PROPERTY (Trend)
CRIMES AGAINST THE COMMUNITY Firearm Offences Other Weapon Offences Disorder Offences Anti-Social Behaviour Animal Offences CRIMES AGAINST THE COMMUNITY (Trend) GRAND TOTAL (ALL CRIME Trend)
Remains level Decreasing Increasing LEGEND:
UNCLASSIFIED
UNCLASSIFIED 4
2. ALL CRIME
2.1 SUMMARY There were 3,587 offences recorded for All Crime in 2016. This is shown below in Figure 2, split into quarters:
Figure 2: All Crime, By Quarter (Q1 2016 to Q4 2016)
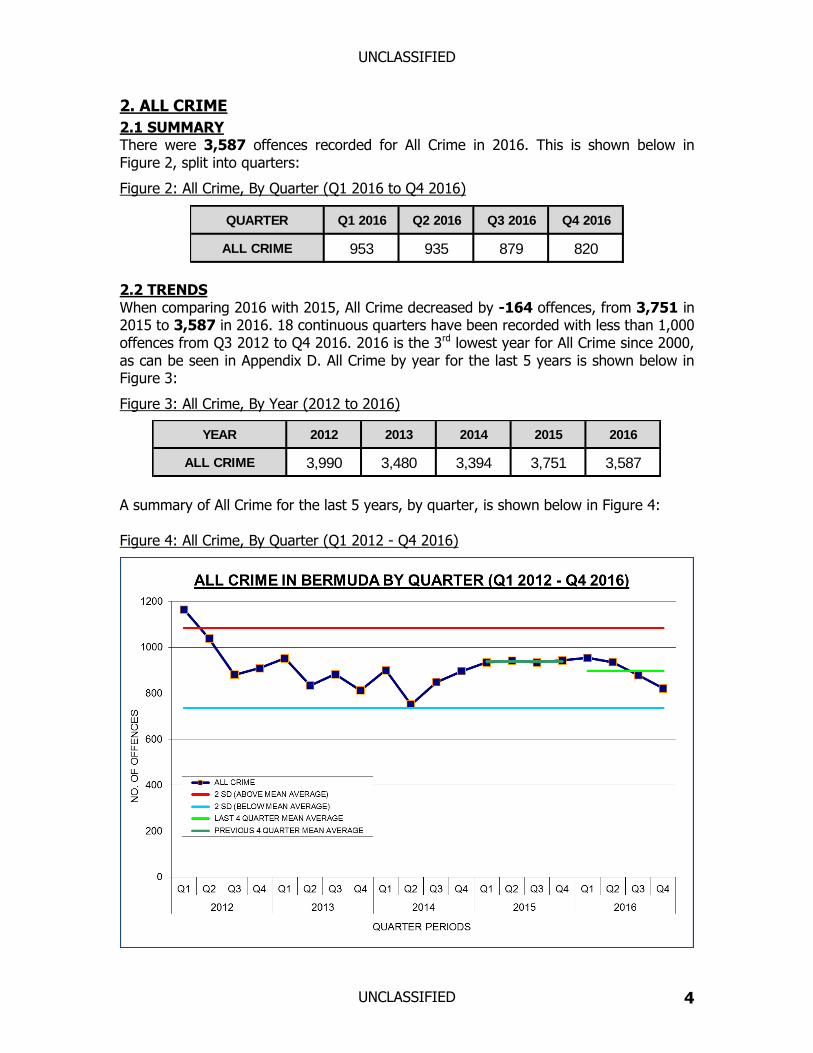
2.2 TRENDS When comparing 2016 with 2015, All Crime decreased by -164 offences, from 3,751 in 2015 to 3,587 in 2016. 18 continuous quarters have been recorded with less than 1,000 offences from Q3 2012 to Q4 2016. 2016 is the 3rd lowest year for All Crime since 2000, as can be seen in Appendix D. All Crime by year for the last 5 years is shown below in Figure 3:
Figure 3: All Crime, By Year (2012 to 2016)
A summary of All Crime for the last 5 years, by quarter, is shown below in Figure 4: Figure 4: All Crime, By Quarter (Q1 2012 - Q4 2016)
QUARTER Q1 2016 Q2 2016 Q3 2016 Q4 2016
ALL CRIME 953 935 879 820
YEAR 2012 2013 2014 2015 2016
ALL CRIME 3,990 3,480 3,394 3,751 3,587
UNCLASSIFIED
UNCLASSIFIED 5
3. CRIMES AGAINST THE PERSON
3.1 SUMMARY There were 740 offences recorded for Crimes Against The Person in 2016. This is shown below in Figure 5, split into quarters:
Figure 5: Crimes Against The Person, By Quarter (Q1 2016 to Q4 2016)
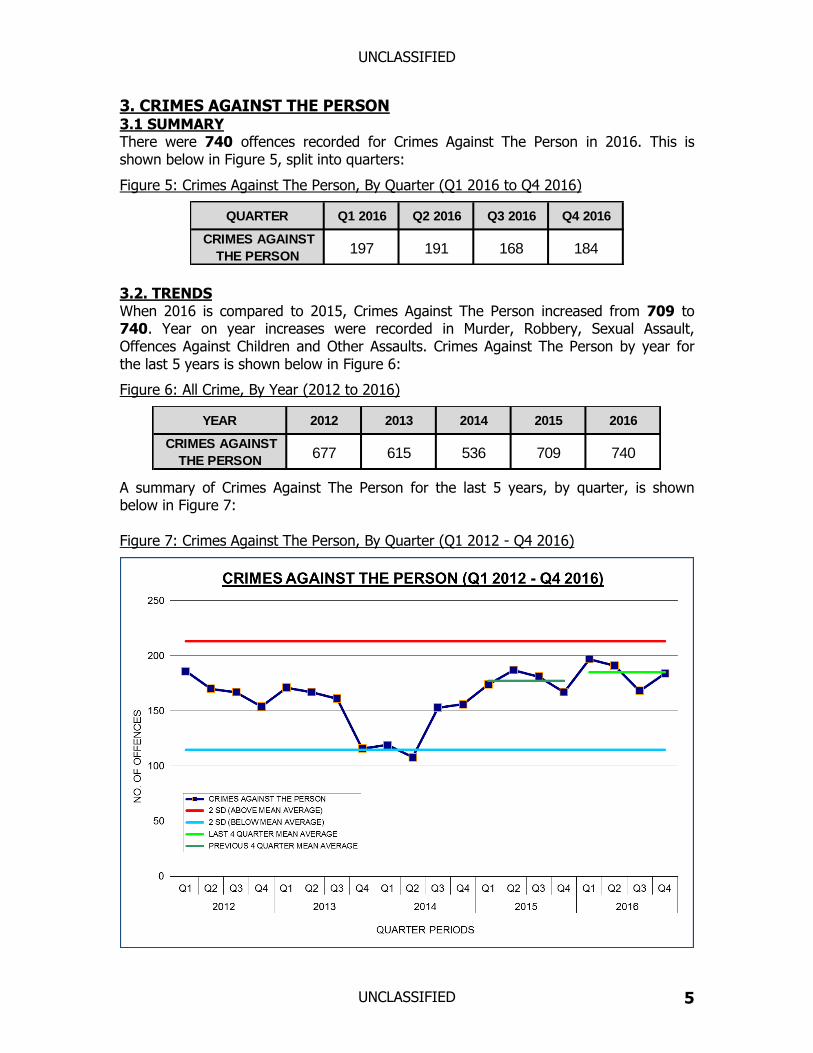
3.2. TRENDS When 2016 is compared to 2015, Crimes Against The Person increased from 709 to 740. Year on year increases were recorded in Murder, Robbery, Sexual Assault, Offences Against Children and Other Assaults. Crimes Against The Person by year for the last 5 years is shown below in Figure 6:
Figure 6: All Crime, By Year (2012 to 2016)
A summary of Crimes Against The Person for the last 5 years, by quarter, is shown below in Figure 7: Figure 7: Crimes Against The Person, By Quarter (Q1 2012 - Q4 2016)
QUARTER Q1 2016 Q2 2016 Q3 2016 Q4 2016
CRIMES AGAINST
THE PERSON197 191 168 184
YEAR 2012 2013 2014 2015 2016
CRIMES AGAINST
THE PERSON677 615 536 709 740
UNCLASSIFIED
UNCLASSIFIED 6
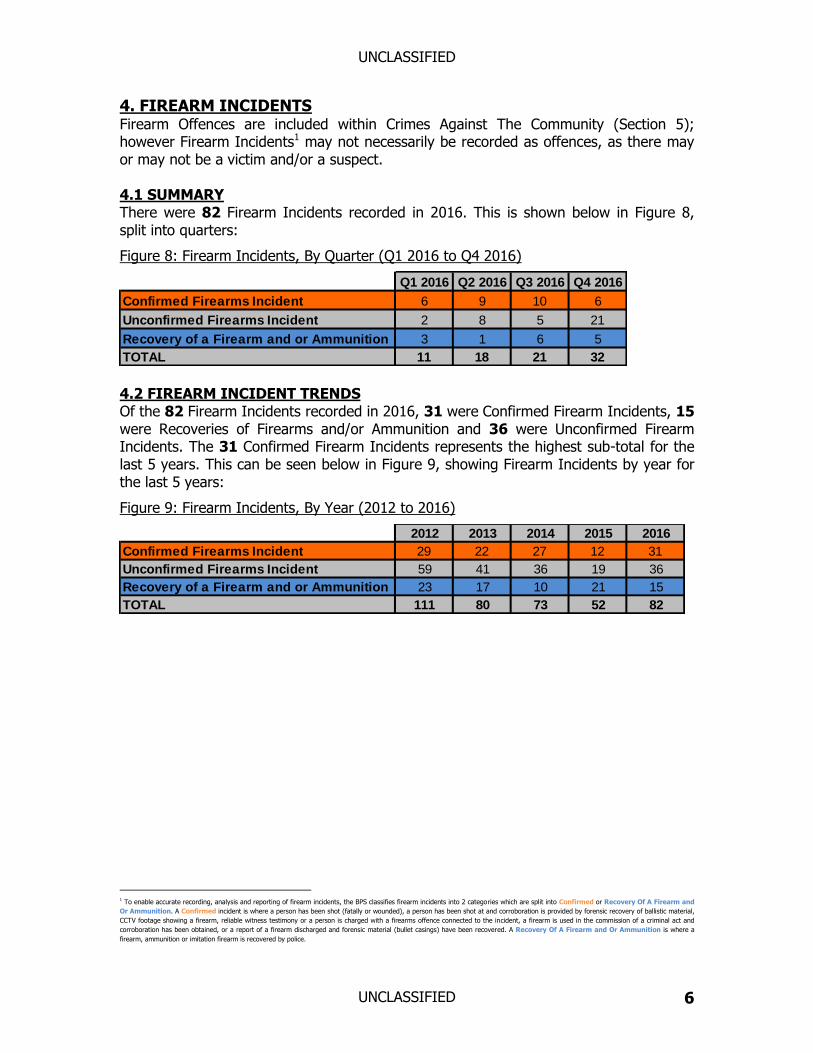
4. FIREARM INCIDENTS Firearm Offences are included within Crimes Against The Community (Section 5); however Firearm Incidents1 may not necessarily be recorded as offences, as there may or may not be a victim and/or a suspect. 4.1 SUMMARY There were 82 Firearm Incidents recorded in 2016. This is shown below in Figure 8, split into quarters:
Figure 8: Firearm Incidents, By Quarter (Q1 2016 to Q4 2016)
4.2 FIREARM INCIDENT TRENDS Of the 82 Firearm Incidents recorded in 2016, 31 were Confirmed Firearm Incidents, 15 were Recoveries of Firearms and/or Ammunition and 36 were Unconfirmed Firearm Incidents. The 31 Confirmed Firearm Incidents represents the highest sub-total for the last 5 years. This can be seen below in Figure 9, showing Firearm Incidents by year for the last 5 years:
Figure 9: Firearm Incidents, By Year (2012 to 2016)
1 To enable accurate recording, analysis and reporting of firearm incidents, the BPS classifies firearm incidents into 2 categories which are split into Confirmed or Recovery Of A Firearm and
Or Ammunition. A Confirmed incident is where a person has been shot (fatally or wounded), a person has been shot at and corroboration is provided by forensic recovery of ballistic material,
CCTV footage showing a firearm, reliable witness testimony or a person is charged with a firearms offence connected to the incident, a firearm is used in the commission of a criminal act and
corroboration has been obtained, or a report of a firearm discharged and forensic material (bullet casings) have been recovered. A Recovery Of A Firearm and Or Ammunition is where a
firearm, ammunition or imitation firearm is recovered by police.
Q1 2016 Q2 2016 Q3 2016 Q4 2016
Confirmed Firearms Incident 6 9 10 6
Unconfirmed Firearms Incident 2 8 5 21
Recovery of a Firearm and or Ammunition 3 1 6 5
TOTAL 11 18 21 32
2012 2013 2014 2015 2016
Confirmed Firearms Incident 29 22 27 12 31
Unconfirmed Firearms Incident 59 41 36 19 36
Recovery of a Firearm and or Ammunition 23 17 10 21 15
TOTAL 111 80 73 52 82
UNCLASSIFIED
UNCLASSIFIED 7
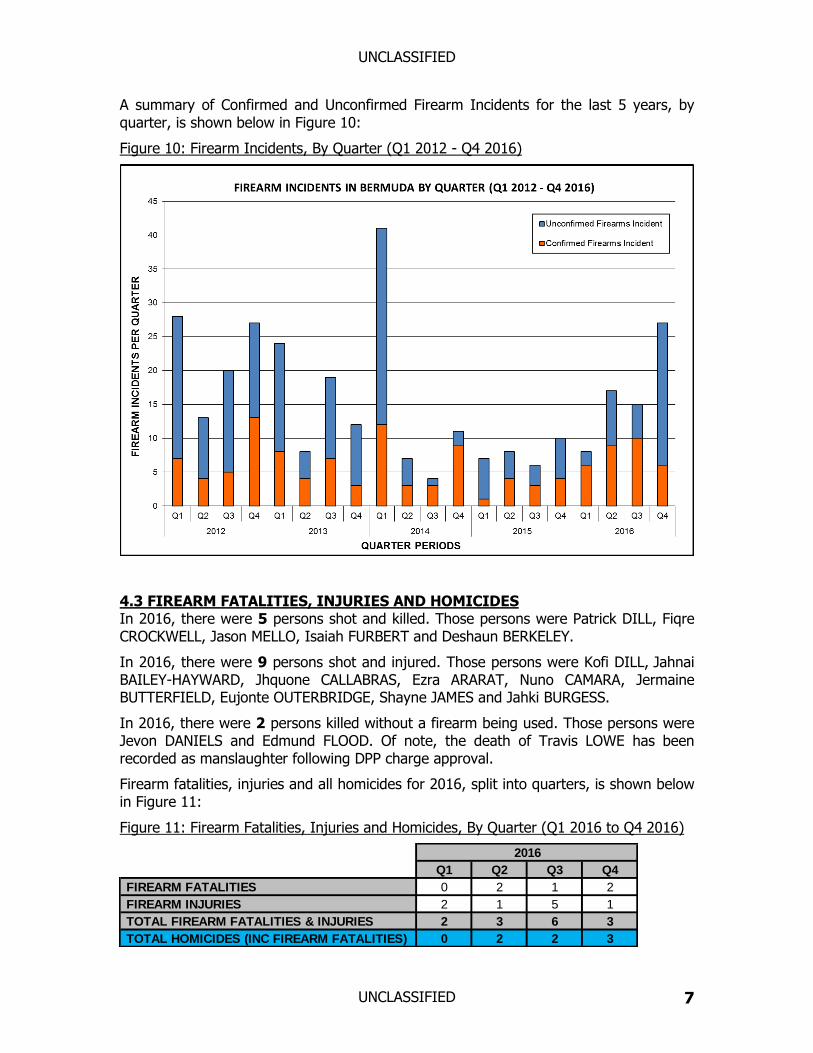
A summary of Confirmed and Unconfirmed Firearm Incidents for the last 5 years, by quarter, is shown below in Figure 10:
Figure 10: Firearm Incidents, By Quarter (Q1 2012 - Q4 2016)
4.3 FIREARM FATALITIES, INJURIES AND HOMICIDES In 2016, there were 5 persons shot and killed. Those persons were Patrick DILL, Fiqre CROCKWELL, Jason MELLO, Isaiah FURBERT and Deshaun BERKELEY.
In 2016, there were 9 persons shot and injured. Those persons were Kofi DILL, Jahnai BAILEY-HAYWARD, Jhquone CALLABRAS, Ezra ARARAT, Nuno CAMARA, Jermaine BUTTERFIELD, Eujonte OUTERBRIDGE, Shayne JAMES and Jahki BURGESS.
In 2016, there were 2 persons killed without a firearm being used. Those persons were Jevon DANIELS and Edmund FLOOD. Of note, the death of Travis LOWE has been recorded as manslaughter following DPP charge approval.
Firearm fatalities, injuries and all homicides for 2016, split into quarters, is shown below in Figure 11:
Figure 11: Firearm Fatalities, Injuries and Homicides, By Quarter (Q1 2016 to Q4 2016)
Q1 Q2 Q3 Q4
FIREARM FATALITIES 0 2 1 2
FIREARM INJURIES 2 1 5 1
TOTAL FIREARM FATALITIES & INJURIES 2 3 6 3
TOTAL HOMICIDES (INC FIREARM FATALITIES) 0 2 2 3
2016
UNCLASSIFIED
UNCLASSIFIED 8
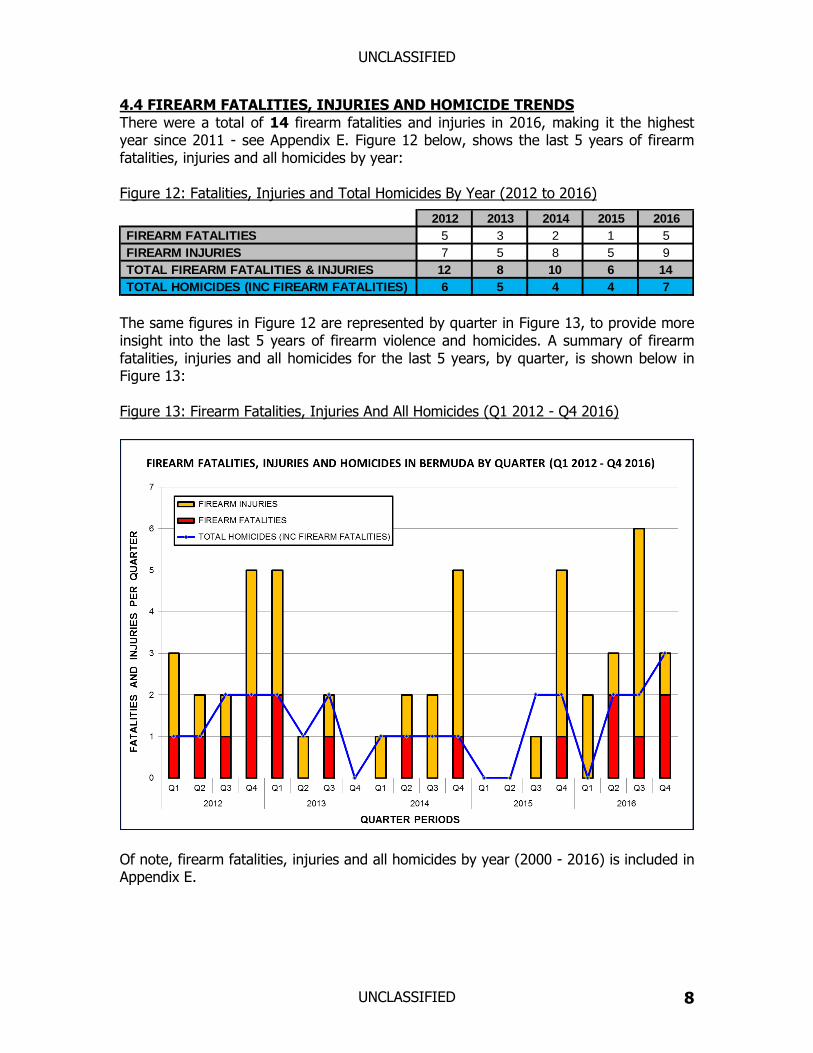
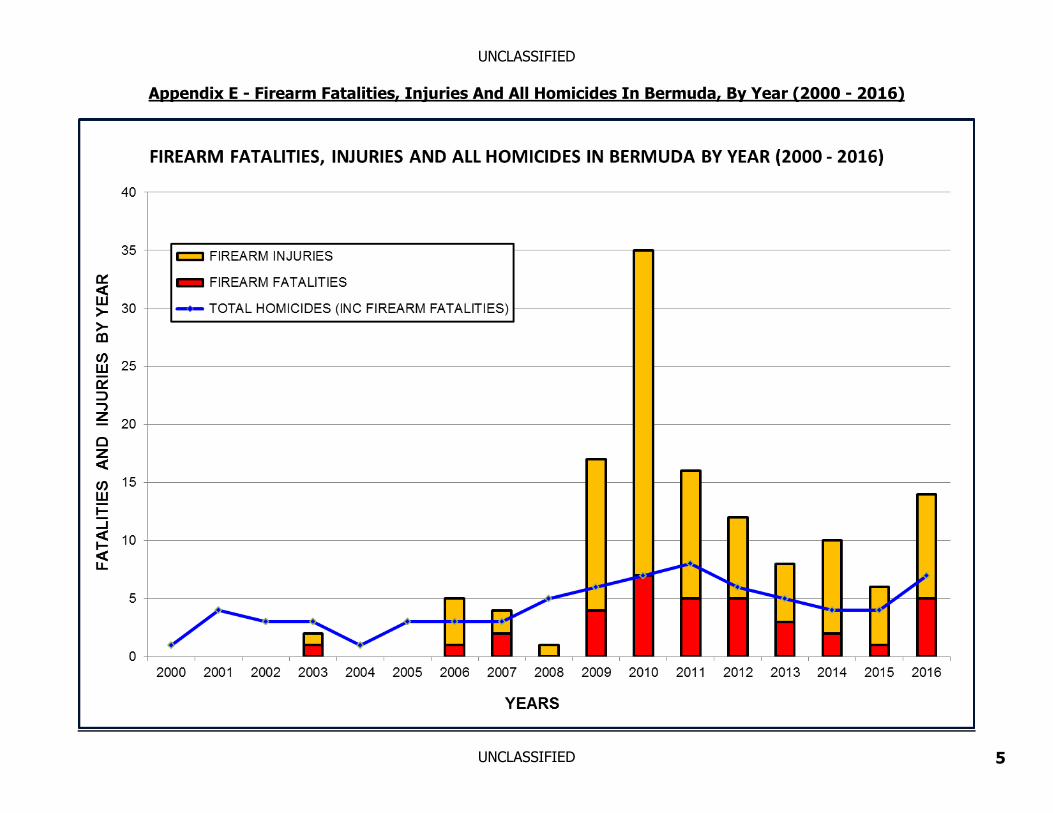
4.4 FIREARM FATALITIES, INJURIES AND HOMICIDE TRENDS There were a total of 14 firearm fatalities and injuries in 2016, making it the highest year since 2011 - see Appendix E. Figure 12 below, shows the last 5 years of firearm fatalities, injuries and all homicides by year: Figure 12: Fatalities, Injuries and Total Homicides By Year (2012 to 2016)
The same figures in Figure 12 are represented by quarter in Figure 13, to provide more insight into the last 5 years of firearm violence and homicides. A summary of firearm fatalities, injuries and all homicides for the last 5 years, by quarter, is shown below in Figure 13: Figure 13: Firearm Fatalities, Injuries And All Homicides (Q1 2012 - Q4 2016)
Of note, firearm fatalities, injuries and all homicides by year (2000 - 2016) is included in Appendix E.
2012 2013 2014 2015 2016
FIREARM FATALITIES 5 3 2 1 5
FIREARM INJURIES 7 5 8 5 9
TOTAL FIREARM FATALITIES & INJURIES 12 8 10 6 14
TOTAL HOMICIDES (INC FIREARM FATALITIES) 6 5 4 4 7
UNCLASSIFIED
UNCLASSIFIED 9
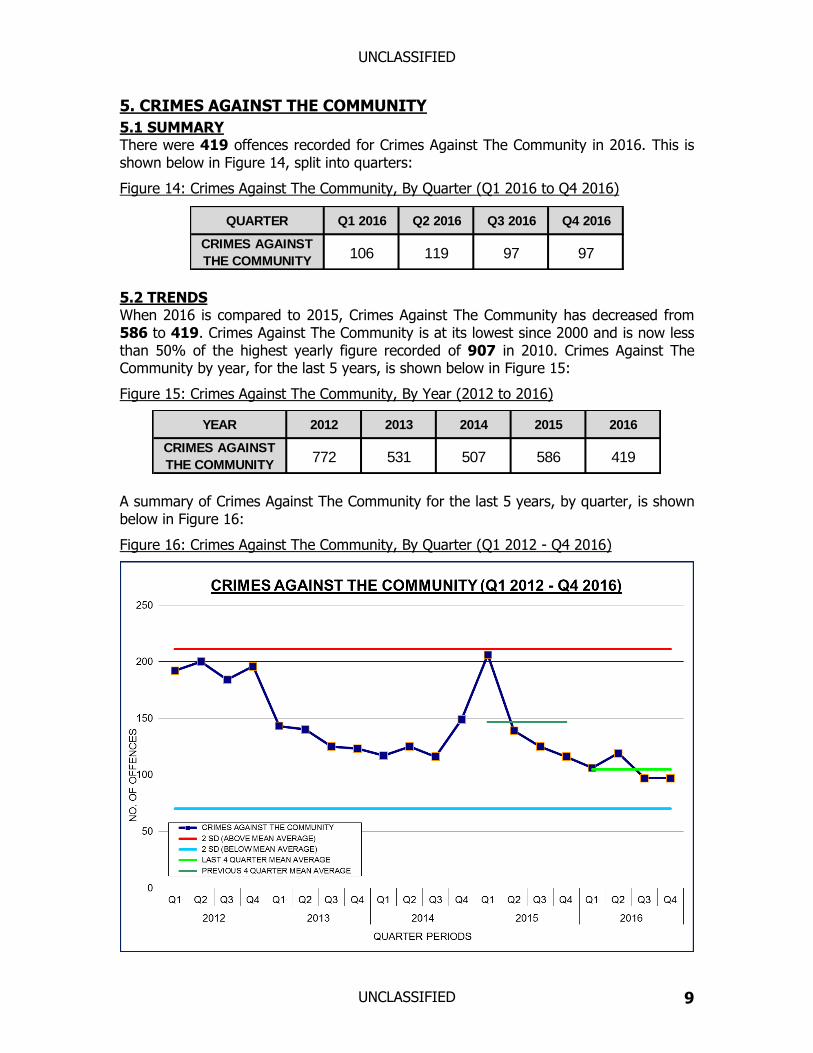
5. CRIMES AGAINST THE COMMUNITY
5.1 SUMMARY There were 419 offences recorded for Crimes Against The Community in 2016. This is shown below in Figure 14, split into quarters:
Figure 14: Crimes Against The Community, By Quarter (Q1 2016 to Q4 2016)
5.2 TRENDS When 2016 is compared to 2015, Crimes Against The Community has decreased from 586 to 419. Crimes Against The Community is at its lowest since 2000 and is now less than 50% of the highest yearly figure recorded of 907 in 2010. Crimes Against The Community by year, for the last 5 years, is shown below in Figure 15:
Figure 15: Crimes Against The Community, By Year (2012 to 2016)
A summary of Crimes Against The Community for the last 5 years, by quarter, is shown below in Figure 16:
Figure 16: Crimes Against The Community, By Quarter (Q1 2012 - Q4 2016)
QUARTER Q1 2016 Q2 2016 Q3 2016 Q4 2016
CRIMES AGAINST
THE COMMUNITY 106 119 97 97
YEAR 2012 2013 2014 2015 2016
CRIMES AGAINST
THE COMMUNITY 772 531 507 586 419
UNCLASSIFIED
UNCLASSIFIED 10
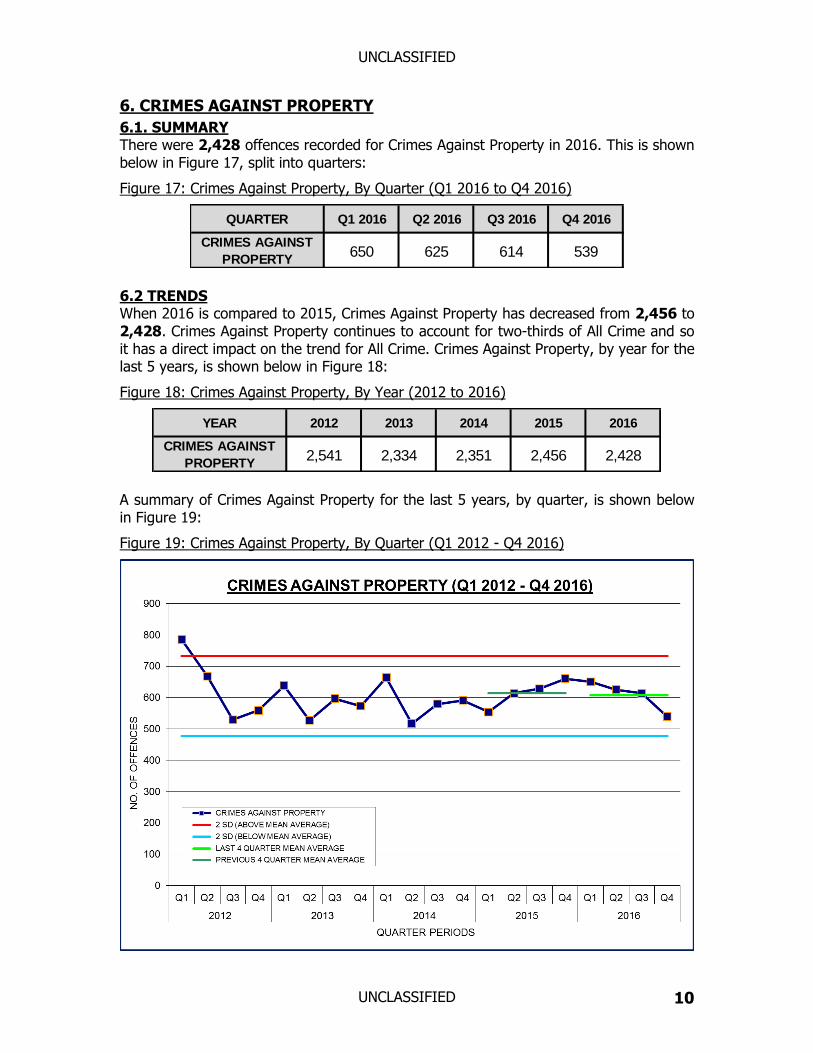
6. CRIMES AGAINST PROPERTY
6.1. SUMMARY There were 2,428 offences recorded for Crimes Against Property in 2016. This is shown below in Figure 17, split into quarters:
Figure 17: Crimes Against Property, By Quarter (Q1 2016 to Q4 2016)
6.2 TRENDS When 2016 is compared to 2015, Crimes Against Property has decreased from 2,456 to 2,428. Crimes Against Property continues to account for two-thirds of All Crime and so it has a direct impact on the trend for All Crime. Crimes Against Property, by year for the last 5 years, is shown below in Figure 18:
Figure 18: Crimes Against Property, By Year (2012 to 2016)
A summary of Crimes Against Property for the last 5 years, by quarter, is shown below in Figure 19:
Figure 19: Crimes Against Property, By Quarter (Q1 2012 - Q4 2016)
QUARTER Q1 2016 Q2 2016 Q3 2016 Q4 2016
CRIMES AGAINST
PROPERTY650 625 614 539
YEAR 2012 2013 2014 2015 2016
CRIMES AGAINST
PROPERTY2,541 2,334 2,351 2,456 2,428
UNCLASSIFIED
UNCLASSIFIED 11
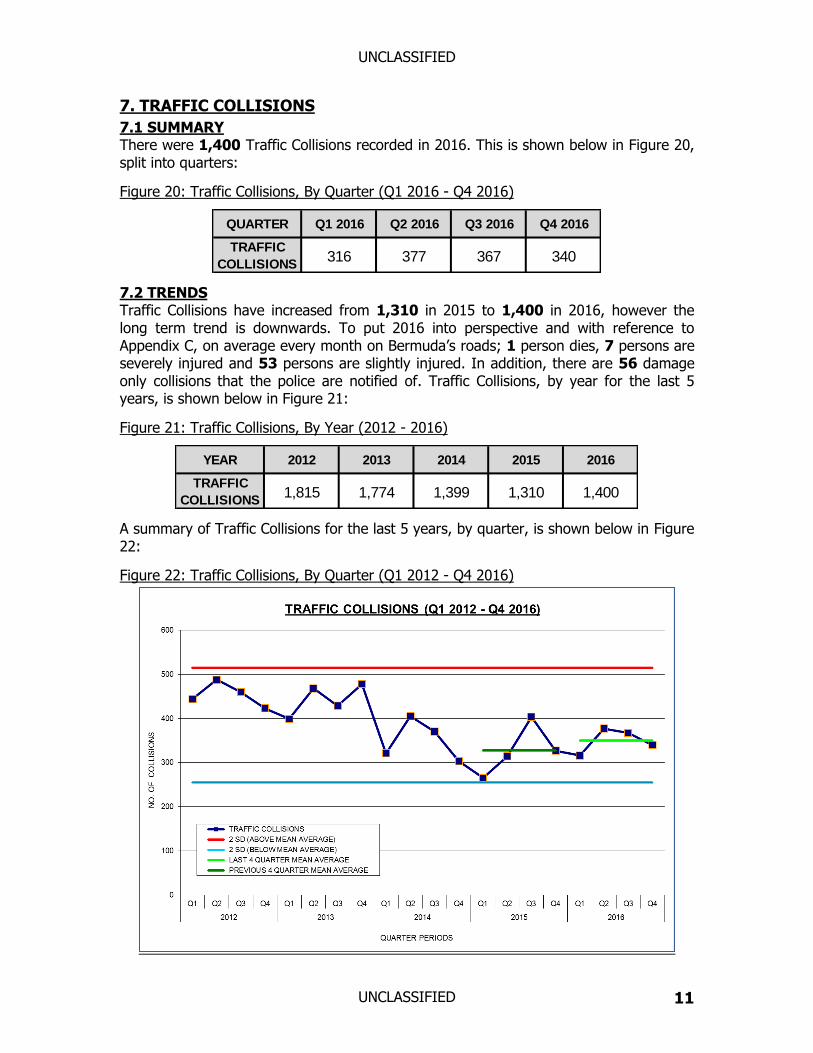
7. TRAFFIC COLLISIONS
7.1 SUMMARY There were 1,400 Traffic Collisions recorded in 2016. This is shown below in Figure 20, split into quarters:
Figure 20: Traffic Collisions, By Quarter (Q1 2016 - Q4 2016)
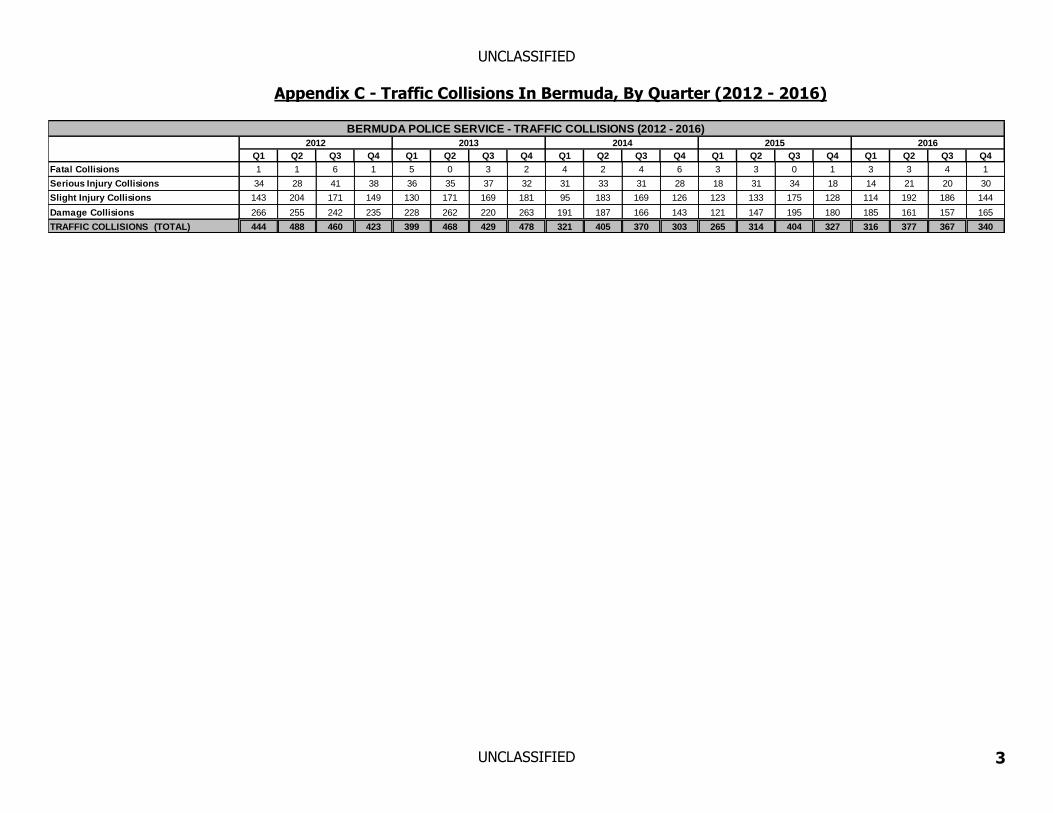
7.2 TRENDS Traffic Collisions have increased from 1,310 in 2015 to 1,400 in 2016, however the long term trend is downwards. To put 2016 into perspective and with reference to Appendix C, on average every month on Bermuda’s roads; 1 person dies, 7 persons are severely injured and 53 persons are slightly injured. In addition, there are 56 damage only collisions that the police are notified of. Traffic Collisions, by year for the last 5 years, is shown below in Figure 21:
Figure 21: Traffic Collisions, By Year (2012 - 2016)
A summary of Traffic Collisions for the last 5 years, by quarter, is shown below in Figure 22:
Figure 22: Traffic Collisions, By Quarter (Q1 2012 - Q4 2016)
QUARTER Q1 2016 Q2 2016 Q3 2016 Q4 2016
TRAFFIC
COLLISIONS316 377 367 340
YEAR 2012 2013 2014 2015 2016
TRAFFIC
COLLISIONS1,815 1,774 1,399 1,310 1,400
UNCLASSIFIED
UNCLASSIFIED 12
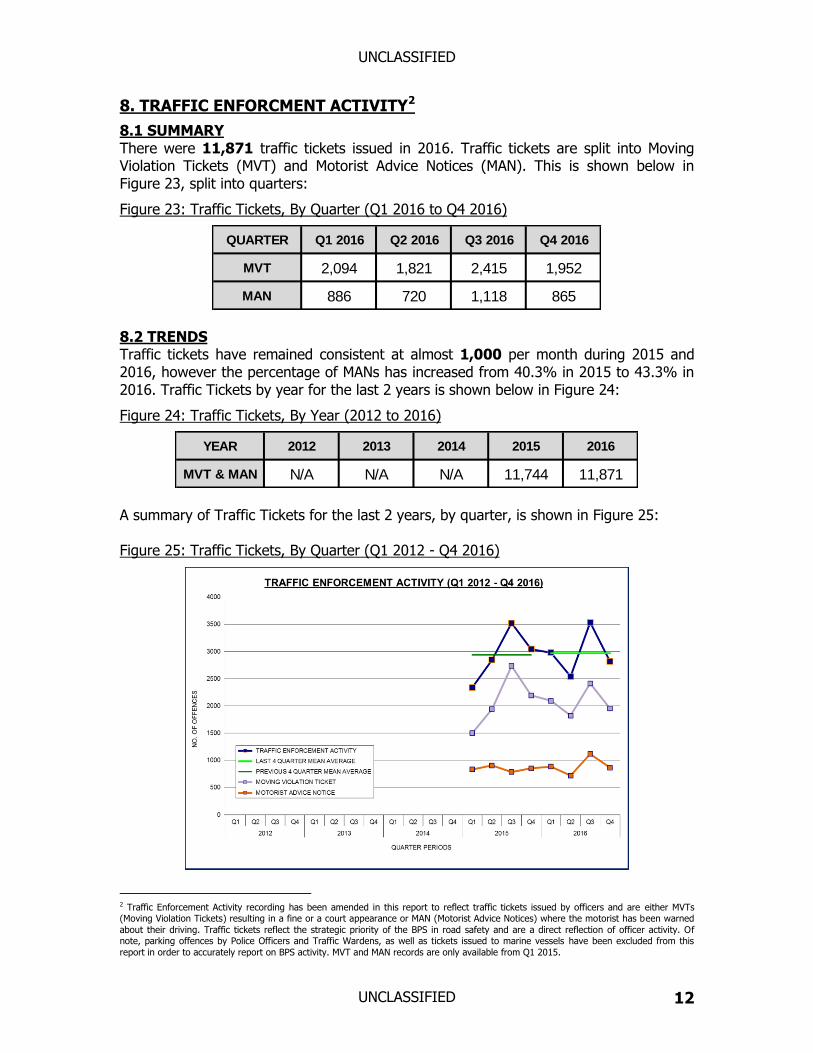
8. TRAFFIC ENFORCMENT ACTIVITY2
8.1 SUMMARY There were 11,871 traffic tickets issued in 2016. Traffic tickets are split into Moving Violation Tickets (MVT) and Motorist Advice Notices (MAN). This is shown below in Figure 23, split into quarters:
Figure 23: Traffic Tickets, By Quarter (Q1 2016 to Q4 2016)
8.2 TRENDS Traffic tickets have remained consistent at almost 1,000 per month during 2015 and 2016, however the percentage of MANs has increased from 40.3% in 2015 to 43.3% in 2016. Traffic Tickets by year for the last 2 years is shown below in Figure 24:
Figure 24: Traffic Tickets, By Year (2012 to 2016)
A summary of Traffic Tickets for the last 2 years, by quarter, is shown in Figure 25: Figure 25: Traffic Tickets, By Quarter (Q1 2012 - Q4 2016)
2 Traffic Enforcement Activity recording has been amended in this report to reflect traffic tickets issued by officers and are either MVTs (Moving Violation Tickets) resulting in a fine or a court appearance or MAN (Motorist Advice Notices) where the motorist has been warned
about their driving. Traffic tickets reflect the strategic priority of the BPS in road safety and are a direct reflection of officer activity. Of note, parking offences by Police Officers and Traffic Wardens, as well as tickets issued to marine vessels have been excluded from this
report in order to accurately report on BPS activity. MVT and MAN records are only available from Q1 2015.
QUARTER Q1 2016 Q2 2016 Q3 2016 Q4 2016
MVT 2,094 1,821 2,415 1,952
MAN 886 720 1,118 865
YEAR 2012 2013 2014 2015 2016
MVT & MAN N/A N/A N/A 11,744 11,871
UNCLASSIFIED
UNCLASSIFIED 13
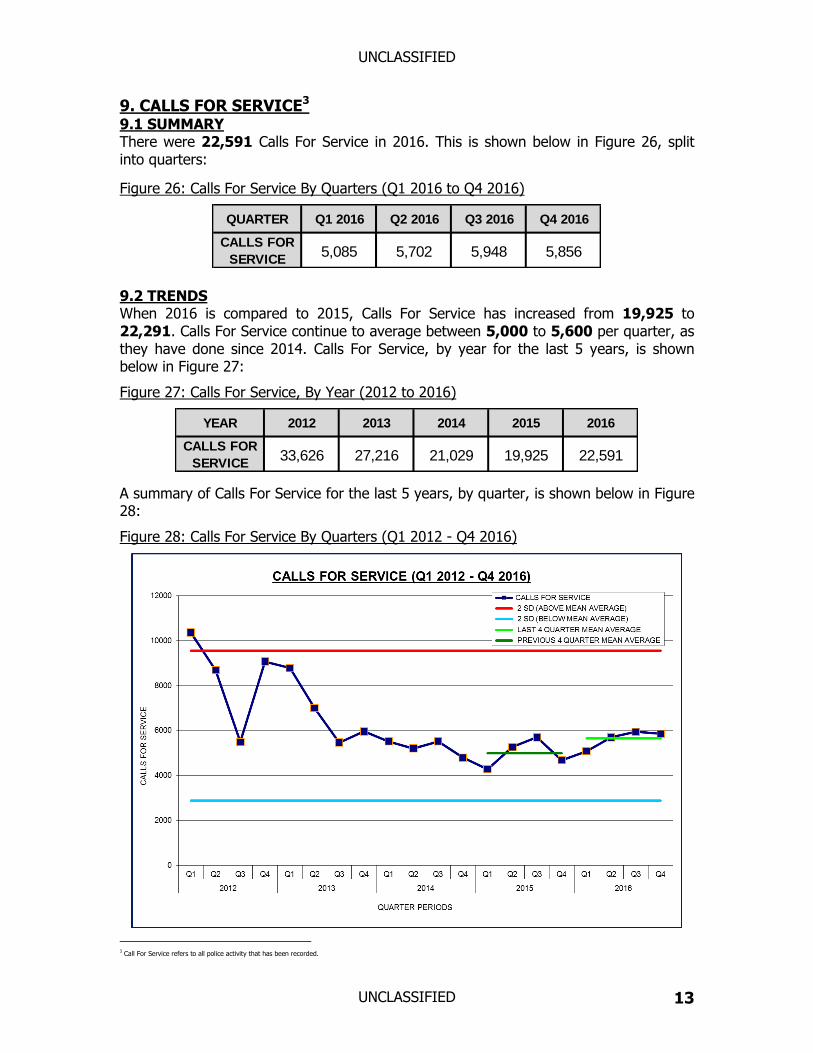
9. CALLS FOR SERVICE3
9.1 SUMMARY There were 22,591 Calls For Service in 2016. This is shown below in Figure 26, split into quarters:
Figure 26: Calls For Service By Quarters (Q1 2016 to Q4 2016)
9.2 TRENDS When 2016 is compared to 2015, Calls For Service has increased from 19,925 to 22,291. Calls For Service continue to average between 5,000 to 5,600 per quarter, as they have done since 2014. Calls For Service, by year for the last 5 years, is shown below in Figure 27:
Figure 27: Calls For Service, By Year (2012 to 2016)
A summary of Calls For Service for the last 5 years, by quarter, is shown below in Figure 28:
Figure 28: Calls For Service By Quarters (Q1 2012 - Q4 2016)
3 Call For Service refers to all police activity that has been recorded.
QUARTER Q1 2016 Q2 2016 Q3 2016 Q4 2016
CALLS FOR
SERVICE5,085 5,702 5,948 5,856
YEAR 2012 2013 2014 2015 2016
CALLS FOR
SERVICE33,626 27,216 21,029 19,925 22,591
UNCLASSIFIED
UNCLASSIFIED 14
10. ARRESTS - ALL OFFENCES4
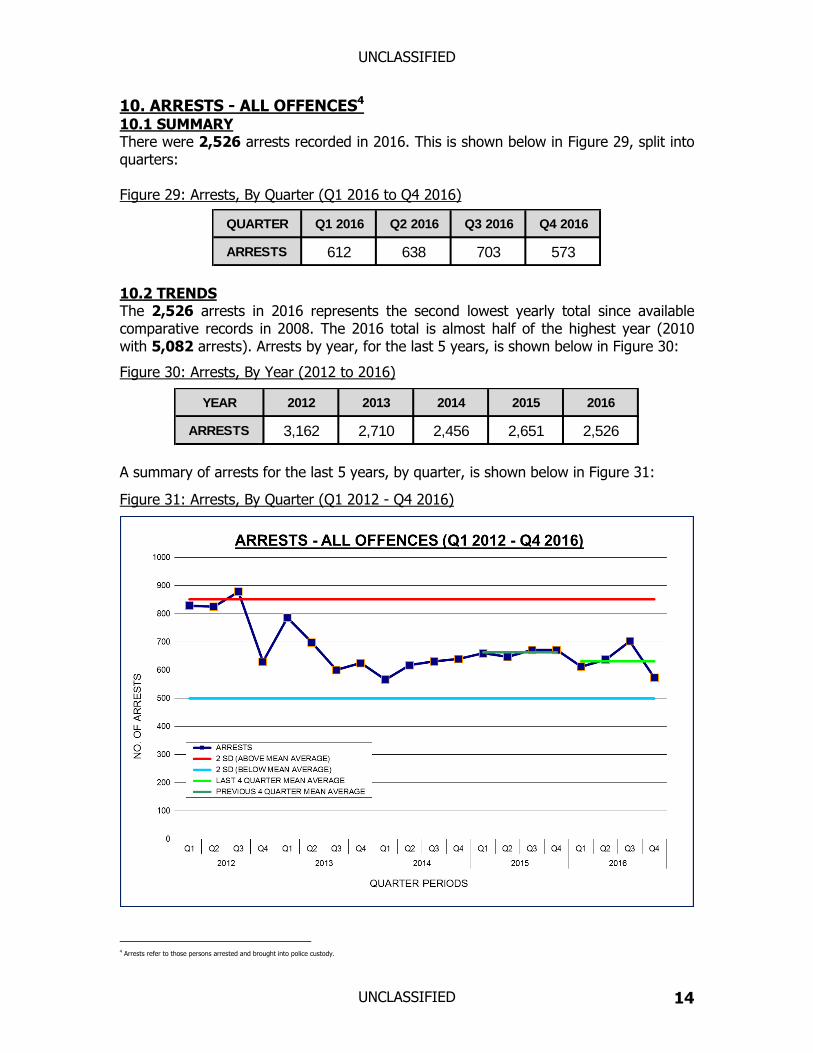
10.1 SUMMARY There were 2,526 arrests recorded in 2016. This is shown below in Figure 29, split into quarters: Figure 29: Arrests, By Quarter (Q1 2016 to Q4 2016)
10.2 TRENDS The 2,526 arrests in 2016 represents the second lowest yearly total since available comparative records in 2008. The 2016 total is almost half of the highest year (2010 with 5,082 arrests). Arrests by year, for the last 5 years, is shown below in Figure 30:
Figure 30: Arrests, By Year (2012 to 2016)
A summary of arrests for the last 5 years, by quarter, is shown below in Figure 31:
Figure 31: Arrests, By Quarter (Q1 2012 - Q4 2016)
4 Arrests refer to those persons arrested and brought into police custody.
QUARTER Q1 2016 Q2 2016 Q3 2016 Q4 2016
ARRESTS 612 638 703 573
YEAR 2012 2013 2014 2015 2016
ARRESTS 3,162 2,710 2,456 2,651 2,526
UNCLASSIFIED
UNCLASSIFIED 15
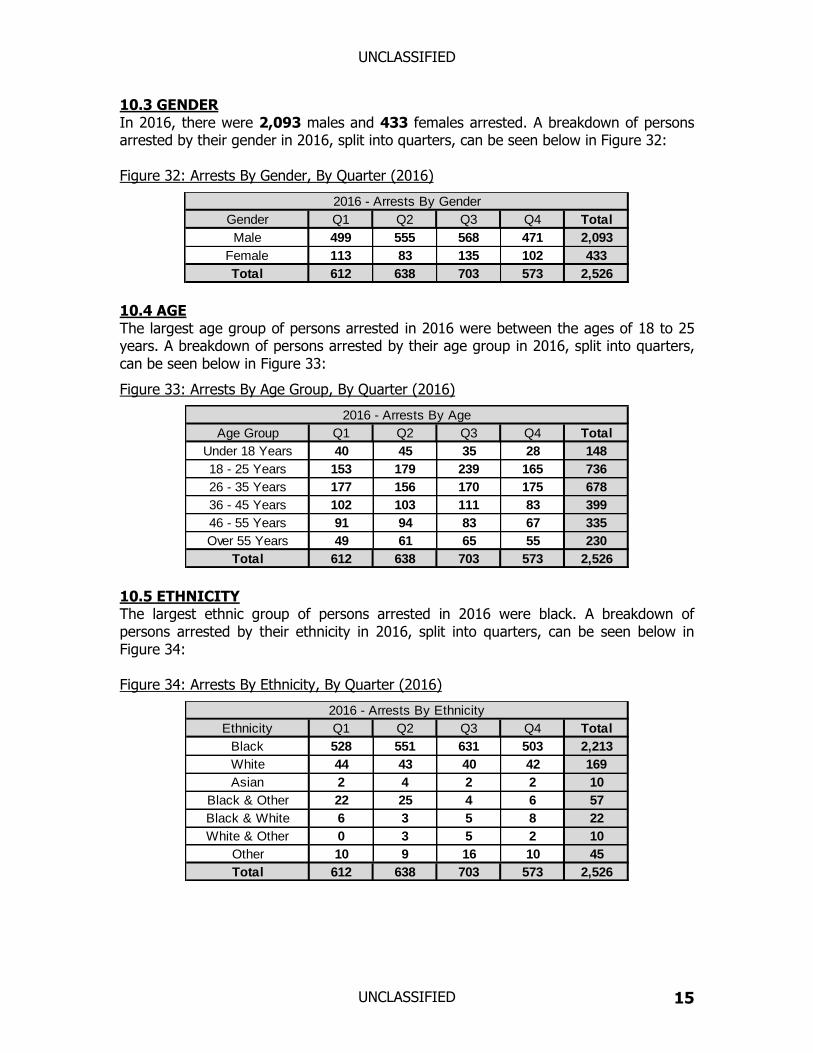
10.3 GENDER In 2016, there were 2,093 males and 433 females arrested. A breakdown of persons arrested by their gender in 2016, split into quarters, can be seen below in Figure 32: Figure 32: Arrests By Gender, By Quarter (2016)
10.4 AGE The largest age group of persons arrested in 2016 were between the ages of 18 to 25 years. A breakdown of persons arrested by their age group in 2016, split into quarters, can be seen below in Figure 33:
Figure 33: Arrests By Age Group, By Quarter (2016)
10.5 ETHNICITY The largest ethnic group of persons arrested in 2016 were black. A breakdown of persons arrested by their ethnicity in 2016, split into quarters, can be seen below in Figure 34:
Figure 34: Arrests By Ethnicity, By Quarter (2016)
Gender Q1 Q2 Q3 Q4 Total
Male 499 555 568 471 2,093
Female 113 83 135 102 433
Total 612 638 703 573 2,526
2016 - Arrests By Gender
Age Group Q1 Q2 Q3 Q4 Total
Under 18 Years 40 45 35 28 148
18 - 25 Years 153 179 239 165 736
26 - 35 Years 177 156 170 175 678
36 - 45 Years 102 103 111 83 399
46 - 55 Years 91 94 83 67 335
Over 55 Years 49 61 65 55 230
Total 612 638 703 573 2,526
2016 - Arrests By Age
Ethnicity Q1 Q2 Q3 Q4 Total
Black 528 551 631 503 2,213
White 44 43 40 42 169
Asian 2 4 2 2 10
Black & Other 22 25 4 6 57
Black & White 6 3 5 8 22
White & Other 0 3 5 2 10
Other 10 9 16 10 45
Total 612 638 703 573 2,526
2016 - Arrests By Ethnicity
UNCLASSIFIED
UNCLASSIFIED 16
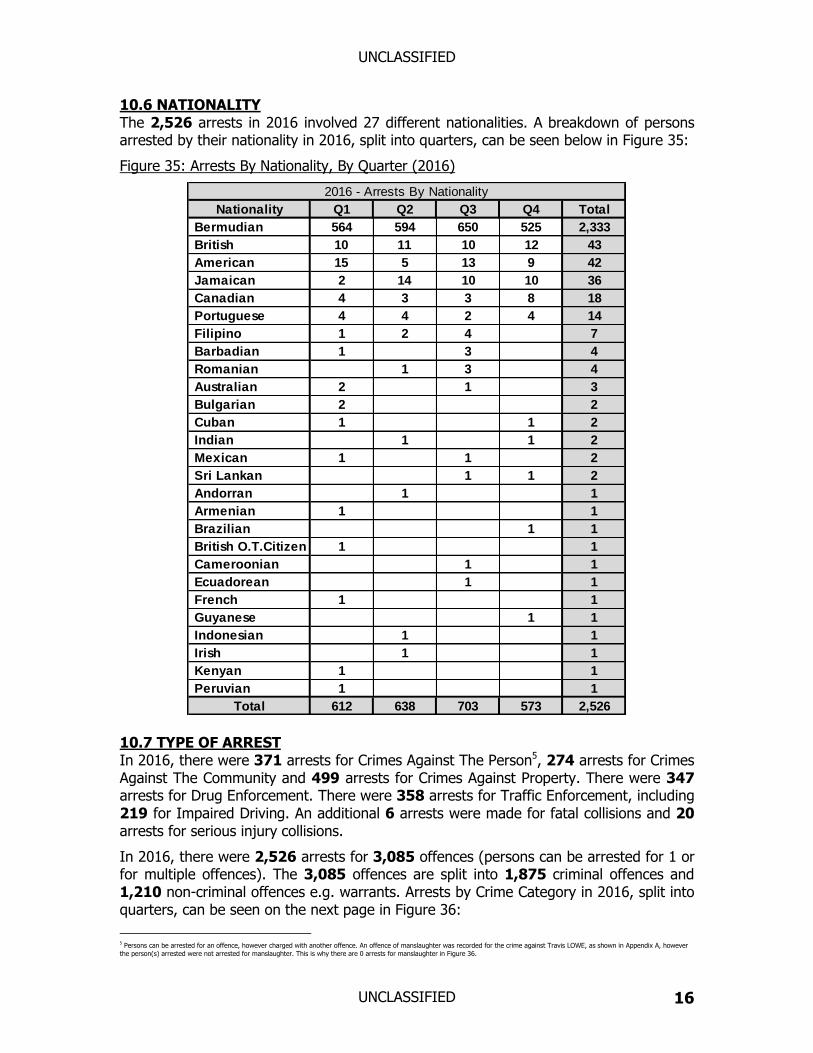
10.6 NATIONALITY The 2,526 arrests in 2016 involved 27 different nationalities. A breakdown of persons arrested by their nationality in 2016, split into quarters, can be seen below in Figure 35:
Figure 35: Arrests By Nationality, By Quarter (2016)
10.7 TYPE OF ARREST In 2016, there were 371 arrests for Crimes Against The Person5, 274 arrests for Crimes Against The Community and 499 arrests for Crimes Against Property. There were 347 arrests for Drug Enforcement. There were 358 arrests for Traffic Enforcement, including 219 for Impaired Driving. An additional 6 arrests were made for fatal collisions and 20 arrests for serious injury collisions.
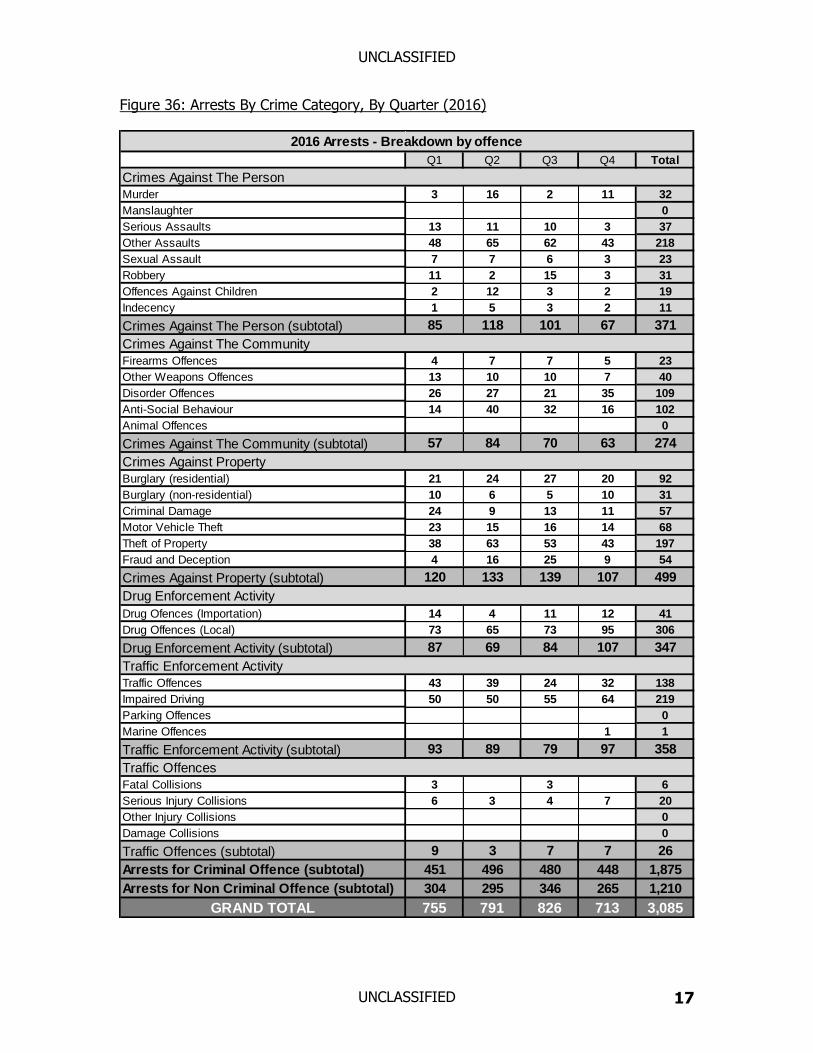
In 2016, there were 2,526 arrests for 3,085 offences (persons can be arrested for 1 or for multiple offences). The 3,085 offences are split into 1,875 criminal offences and 1,210 non-criminal offences e.g. warrants. Arrests by Crime Category in 2016, split into quarters, can be seen on the next page in Figure 36:
5 Persons can be arrested for an offence, however charged with another offence. An offence of manslaughter was recorded for the crime against Travis LOWE, as shown in Appendix A, however
the person(s) arrested were not arrested for manslaughter. This is why there are 0 arrests for manslaughter in Figure 36.
Nationality Q1 Q2 Q3 Q4 Total
Bermudian
(British)
564 594 650 525 2,333
British 10 11 10 12 43
American 15 5 13 9 42
Jamaican 2 14 10 10 36
Canadian 4 3 3 8 18
Portuguese 4 4 2 4 14
Filipino 1 2 4 7
Barbadian 1 3 4
Romanian 1 3 4
Australian 2 1 3
Bulgarian 2 2
Cuban 1 1 2
Indian 1 1 2
Mexican 1 1 2
Sri Lankan 1 1 2
Andorran 1 1
Armenian 1 1
Brazilian 1 1
British O.T.Citizen 1 1
Cameroonian 1 1
Ecuadorean 1 1
French 1 1
Guyanese 1 1
Indonesian 1 1
Irish 1 1
Kenyan 1 1
Peruvian 1 1
Total 612 638 703 573 2,526
2016 - Arrests By Nationality
UNCLASSIFIED
UNCLASSIFIED 17
Figure 36: Arrests By Crime Category, By Quarter (2016)
Q1 Q2 Q3 Q4 Total
Murder 3 16 2 11 32
Manslaughter 0
Serious Assaults 13 11 10 3 37
Other Assaults 48 65 62 43 218
Sexual Assault 7 7 6 3 23
Robbery 11 2 15 3 31
Offences Against Children 2 12 3 2 19
Indecency 1 5 3 2 11
Crimes Against The Person (subtotal) 85 118 101 67 371
Firearms Offences 4 7 7 5 23
Other Weapons Offences 13 10 10 7 40
Disorder Offences 26 27 21 35 109
Anti-Social Behaviour 14 40 32 16 102
Animal Offences 0
Crimes Against The Community (subtotal) 57 84 70 63 274
Burglary (residential) 21 24 27 20 92
Burglary (non-residential) 10 6 5 10 31
Criminal Damage 24 9 13 11 57
Motor Vehicle Theft 23 15 16 14 68
Theft of Property 38 63 53 43 197
Fraud and Deception 4 16 25 9 54
Crimes Against Property (subtotal) 120 133 139 107 499
Drug Ofences (Importation) 14 4 11 12 41
Drug Offences (Local) 73 65 73 95 306
Drug Enforcement Activity (subtotal) 87 69 84 107 347
Traffic Offences 43 39 24 32 138
Impaired Driving 50 50 55 64 219
Parking Offences 0
Marine Offences 1 1
Traffic Enforcement Activity (subtotal) 93 89 79 97 358
Fatal Collisions 3 3 6
Serious Injury Collisions 6 3 4 7 20
Other Injury Collisions 0
Damage Collisions 0
Traffic Offences (subtotal) 9 3 7 7 26
Arrests for Criminal Offence (subtotal) 451 496 480 448 1,875
Arrests for Non Criminal Offence (subtotal) 304 295 346 265 1,210
GRAND TOTAL 755 791 826 713 3,085
Traffic Offences
Drug Enforcement Activity
Traffic Enforcement Activity
Crimes Against Property
Crimes Against The Community
Crimes Against The Person
2016 Arrests - Breakdown by offence
UNCLASSIFIED
UNCLASSIFIED 18
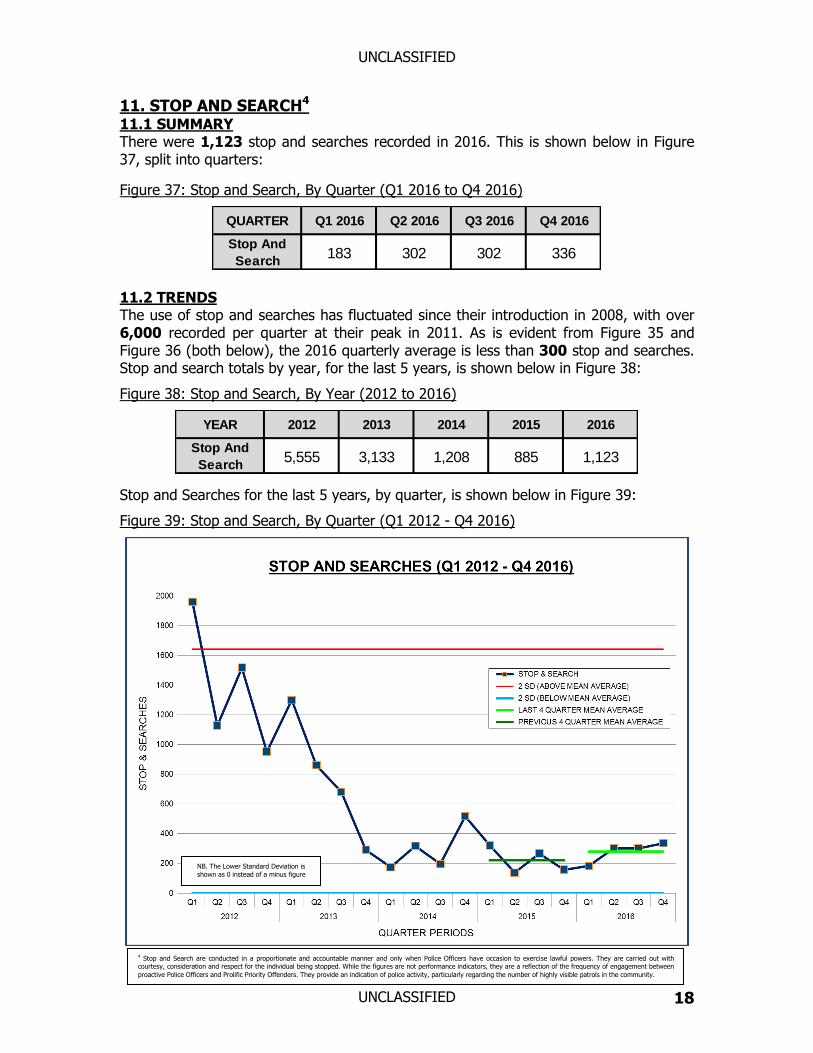
11. STOP AND SEARCH4 11.1 SUMMARY There were 1,123 stop and searches recorded in 2016. This is shown below in Figure 37, split into quarters:
Figure 37: Stop and Search, By Quarter (Q1 2016 to Q4 2016)
11.2 TRENDS The use of stop and searches has fluctuated since their introduction in 2008, with over 6,000 recorded per quarter at their peak in 2011. As is evident from Figure 35 and Figure 36 (both below), the 2016 quarterly average is less than 300 stop and searches. Stop and search totals by year, for the last 5 years, is shown below in Figure 38:
Figure 38: Stop and Search, By Year (2012 to 2016)
Stop and Searches for the last 5 years, by quarter, is shown below in Figure 39:
Figure 39: Stop and Search, By Quarter (Q1 2012 - Q4 2016)
QUARTER Q1 2016 Q2 2016 Q3 2016 Q4 2016
Stop And
Search183 302 302 336
YEAR 2012 2013 2014 2015 2016
Stop And
Search5,555 3,133 1,208 885 1,123
NB. The Lower Standard Deviation is shown as 0 instead of a minus figure
4 Stop and Search are conducted in a proportionate and accountable manner and only when Police Officers have occasion to exercise lawful powers. They are carried out with
courtesy, consideration and respect for the individual being stopped. While the figures are not performance indicators, they are a reflection of the frequency of engagement between
proactive Police Officers and Prolific Priority Offenders. They provide an indication of police activity, particularly regarding the number of highly visible patrols in the community.
UNCLASSIFIED
UNCLASSIFIED 19
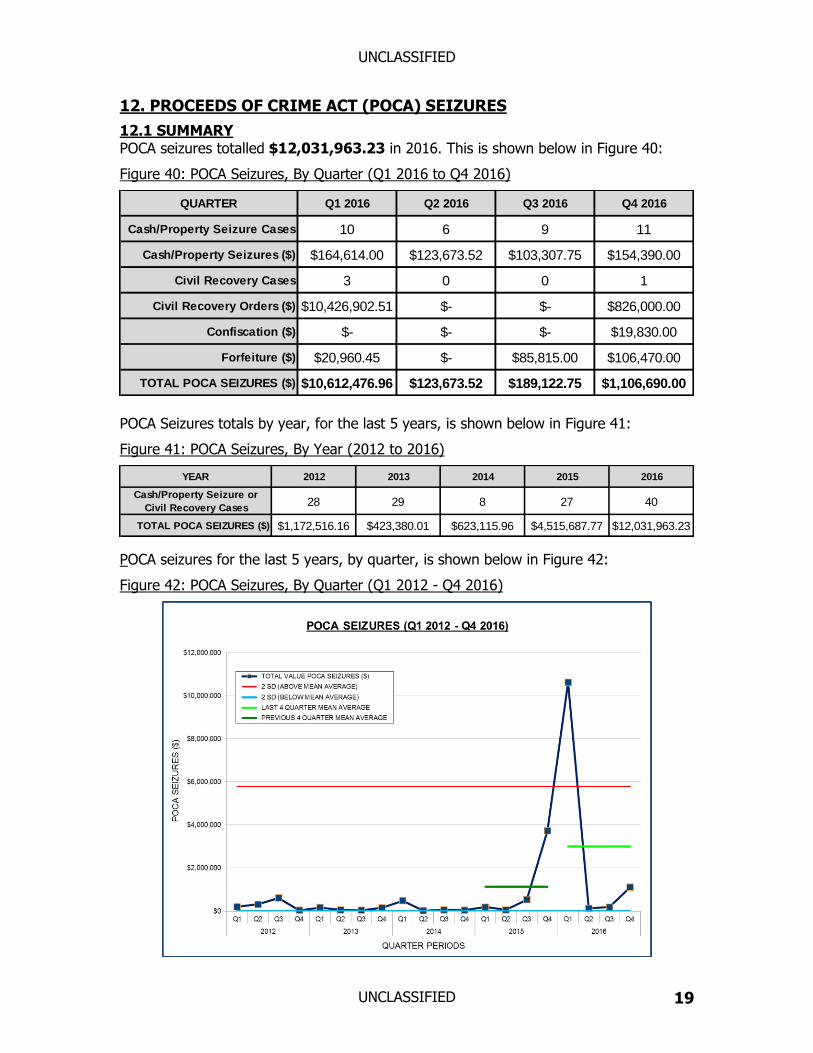
12. PROCEEDS OF CRIME ACT (POCA) SEIZURES
12.1 SUMMARY POCA seizures totalled $12,031,963.23 in 2016. This is shown below in Figure 40:
Figure 40: POCA Seizures, By Quarter (Q1 2016 to Q4 2016)
POCA Seizures totals by year, for the last 5 years, is shown below in Figure 41:
Figure 41: POCA Seizures, By Year (2012 to 2016)
POCA seizures for the last 5 years, by quarter, is shown below in Figure 42:
Figure 42: POCA Seizures, By Quarter (Q1 2012 - Q4 2016)
QUARTER Q1 2016 Q2 2016 Q3 2016 Q4 2016
Cash/Property Seizure Cases 10 6 9 11
Cash/Property Seizures ($) $164,614.00 $123,673.52 $103,307.75 $154,390.00
Civil Recovery Cases 3 0 0 1
Civil Recovery Orders ($) $10,426,902.51 $- $- $826,000.00
Confiscation ($) $- $- $- $19,830.00
Forfeiture ($) $20,960.45 $- $85,815.00 $106,470.00
TOTAL POCA SEIZURES ($) $10,612,476.96 $123,673.52 $189,122.75 $1,106,690.00
YEAR 2012 2013 2014 2015 2016
Cash/Property Seizure or
Civil Recovery Cases28 29 8 27 40
TOTAL POCA SEIZURES ($) $1,172,516.16 $423,380.01 $623,115.96 $4,515,687.77 $12,031,963.23
UNCLASSIFIED
UNCLASSIFIED 1
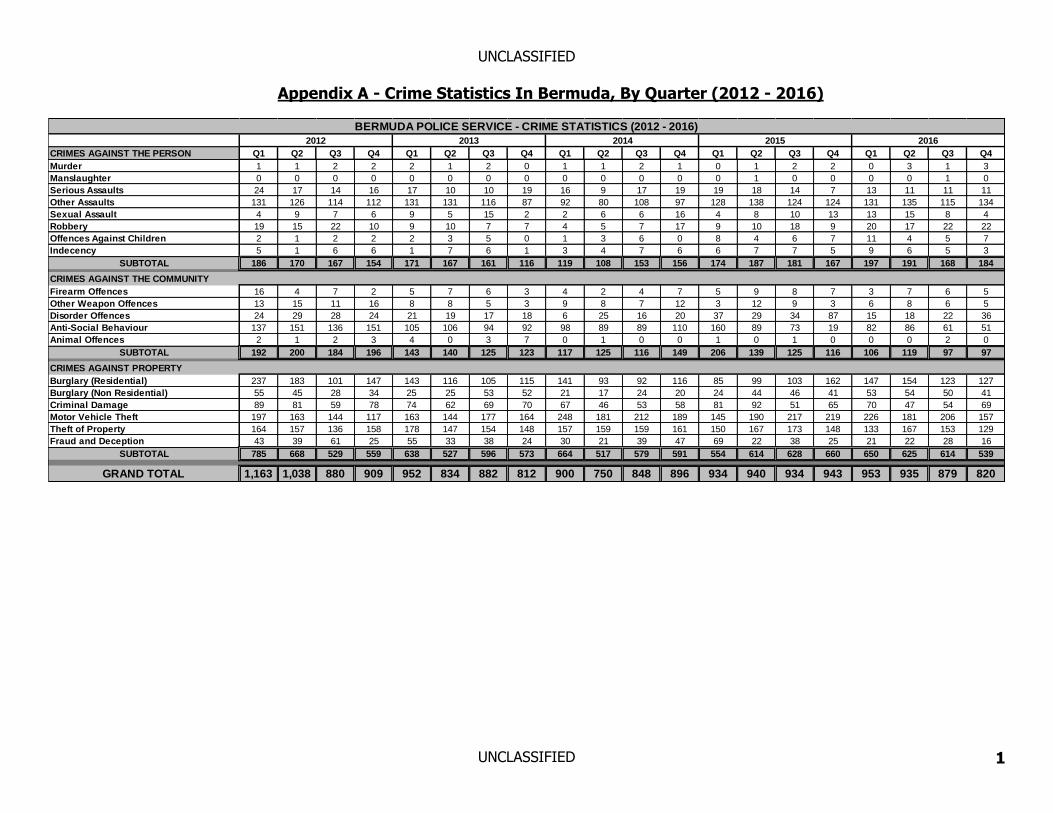
Appendix A - Crime Statistics In Bermuda, By Quarter (2012 - 2016)
CRIMES AGAINST THE PERSON Q1 Q2 Q3 Q4 Q1 Q2 Q3 Q4 Q1 Q2 Q3 Q4 Q1 Q2 Q3 Q4 Q1 Q2 Q3 Q4
Murder 1 1 2 2 2 1 2 0 1 1 2 1 0 1 2 2 0 3 1 3
Manslaughter 0 0 0 0 0 0 0 0 0 0 0 0 0 1 0 0 0 0 1 0
Serious Assaults 24 17 14 16 17 10 10 19 16 9 17 19 19 18 14 7 13 11 11 11
Other Assaults 131 126 114 112 131 131 116 87 92 80 108 97 128 138 124 124 131 135 115 134
Sexual Assault 4 9 7 6 9 5 15 2 2 6 6 16 4 8 10 13 13 15 8 4
Robbery 19 15 22 10 9 10 7 7 4 5 7 17 9 10 18 9 20 17 22 22
Offences Against Children 2 1 2 2 2 3 5 0 1 3 6 0 8 4 6 7 11 4 5 7
Indecency 5 1 6 6 1 7 6 1 3 4 7 6 6 7 7 5 9 6 5 3
SUBTOTAL 186 170 167 154 171 167 161 116 119 108 153 156 174 187 181 167 197 191 168 184
CRIMES AGAINST THE COMMUNITY
Firearm Offences 16 4 7 2 5 7 6 3 4 2 4 7 5 9 8 7 3 7 6 5
Other Weapon Offences 13 15 11 16 8 8 5 3 9 8 7 12 3 12 9 3 6 8 6 5
Disorder Offences 24 29 28 24 21 19 17 18 6 25 16 20 37 29 34 87 15 18 22 36
Anti-Social Behaviour 137 151 136 151 105 106 94 92 98 89 89 110 160 89 73 19 82 86 61 51
Animal Offences 2 1 2 3 4 0 3 7 0 1 0 0 1 0 1 0 0 0 2 0
SUBTOTAL 192 200 184 196 143 140 125 123 117 125 116 149 206 139 125 116 106 119 97 97
CRIMES AGAINST PROPERTY
Burglary (Residential) 237 183 101 147 143 116 105 115 141 93 92 116 85 99 103 162 147 154 123 127
Burglary (Non Residential) 55 45 28 34 25 25 53 52 21 17 24 20 24 44 46 41 53 54 50 41
Criminal Damage 89 81 59 78 74 62 69 70 67 46 53 58 81 92 51 65 70 47 54 69
Motor Vehicle Theft 197 163 144 117 163 144 177 164 248 181 212 189 145 190 217 219 226 181 206 157
Theft of Property 164 157 136 158 178 147 154 148 157 159 159 161 150 167 173 148 133 167 153 129
Fraud and Deception 43 39 61 25 55 33 38 24 30 21 39 47 69 22 38 25 21 22 28 16
SUBTOTAL 785 668 529 559 638 527 596 573 664 517 579 591 554 614 628 660 650 625 614 539
GRAND TOTAL 1,163 1,038 880 909 952 834 882 812 900 750 848 896 934 940 934 943 953 935 879 820
2014 2016
BERMUDA POLICE SERVICE - CRIME STATISTICS (2012 - 2016)
20152012 2013
UNCLASSIFIED
UNCLASSIFIED 2
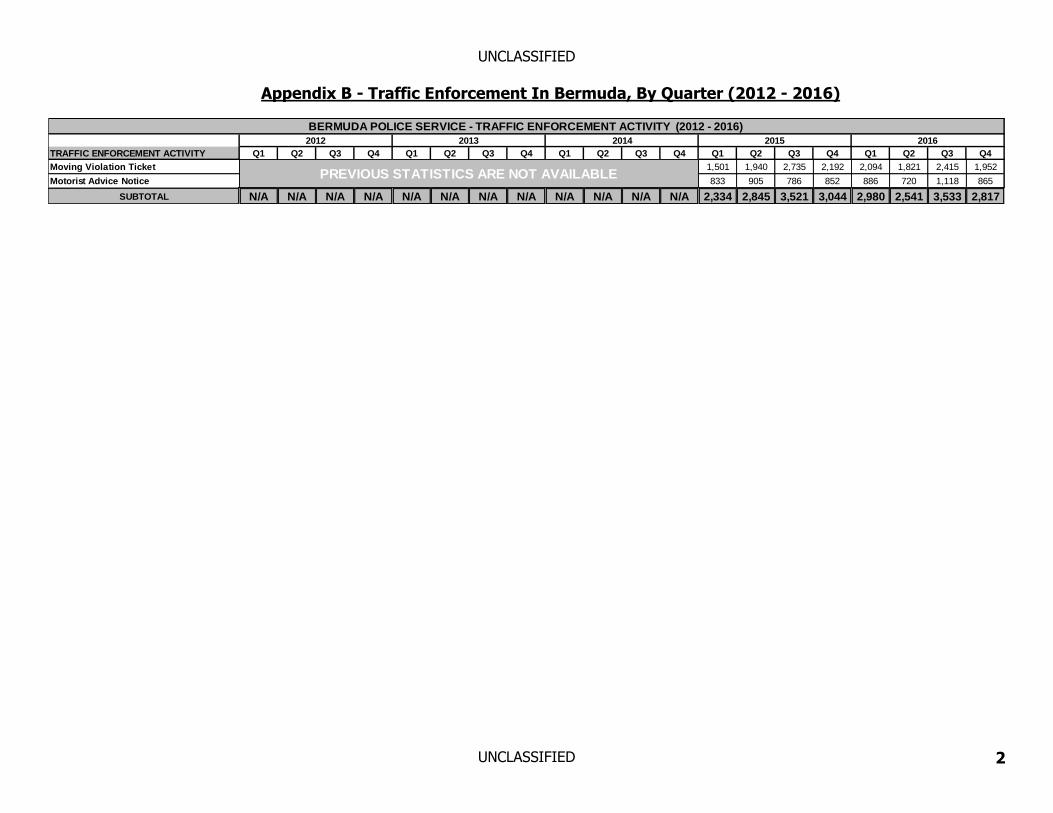
Appendix B - Traffic Enforcement In Bermuda, By Quarter (2012 - 2016)
TRAFFIC ENFORCEMENT ACTIVITY Q1 Q2 Q3 Q4 Q1 Q2 Q3 Q4 Q1 Q2 Q3 Q4 Q1 Q2 Q3 Q4 Q1 Q2 Q3 Q4
Moving Violation Ticket 1,501 1,940 2,735 2,192 2,094 1,821 2,415 1,952
Motorist Advice Notice 833 905 786 852 886 720 1,118 865
SUBTOTAL N/A N/A N/A N/A N/A N/A N/A N/A N/A N/A N/A N/A 2,334 2,845 3,521 3,044 2,980 2,541 3,533 2,817
PREVIOUS STATISTICS ARE NOT AVAILABLE
2015 2016
BERMUDA POLICE SERVICE - TRAFFIC ENFORCEMENT ACTIVITY (2012 - 2016)
2012 2013 2014
UNCLASSIFIED
UNCLASSIFIED 3
Appendix C - Traffic Collisions In Bermuda, By Quarter (2012 - 2016)
Q1 Q2 Q3 Q4 Q1 Q2 Q3 Q4 Q1 Q2 Q3 Q4 Q1 Q2 Q3 Q4 Q1 Q2 Q3 Q4
Fatal Collisions 1 1 6 1 5 0 3 2 4 2 4 6 3 3 0 1 3 3 4 1
Serious Injury Collisions 34 28 41 38 36 35 37 32 31 33 31 28 18 31 34 18 14 21 20 30
Slight Injury Collisions 143 204 171 149 130 171 169 181 95 183 169 126 123 133 175 128 114 192 186 144
Damage Collisions 266 255 242 235 228 262 220 263 191 187 166 143 121 147 195 180 185 161 157 165
TRAFFIC COLLISIONS (TOTAL) 444 488 460 423 399 468 429 478 321 405 370 303 265 314 404 327 316 377 367 340
2014 2016
BERMUDA POLICE SERVICE - TRAFFIC COLLISIONS (2012 - 2016)
201520132012
UNCLASSIFIED
UNCLASSIFIED 4
Appendix D - All Crime In Bermuda, By Quarter (Q1 2000 - Q4 2016)
UNCLASSIFIED
UNCLASSIFIED 5
Appendix E - Firearm Fatalities, Injuries And All Homicides In Bermuda, By Year (2000 - 2016)
Recommended