1
LESSON 1
INTRODUCTION TO ACCOUNTING
STRUCTURE: 1.1 Introduction
1.2 Objectives of Accounting
1.3 Uses of Accounting Information
1.4 Principles of Accounting
1.4.1 Accounting Concepts
1.4.2 Accounting Conventions
1.5 Some Important Terms used in Book – Keeping
1.6 Summary
1.7 Key Words
1.1 INTRODUCTION:
Accounting can be defined as, `an art of recording, classifying and summarizing in a
significant manner and in terms of money, transactions and events which are, in part at least
of a financial character, and interpreting the result thereof.” Accounting, which involves
recording, classifying and summarizing the transactions of financial nature in order to
compute the results and financial position of the business. Accounting facilitates external
reporting to the owners or shareholders, potential investors, trade creditors, creditors for
expenses, banks and financial institutions, management and employees, society, Income-tax
department, academicians, and other interested parties. As this branch of accounting is based
OBJECTIVES: To explain the meanings and importance of accounting To know the utility of accounting information to various stakeholders To know the principles which guide the preparation and reporting of accounting
statements To familiarize with the frequently used words in accounting
2
on historical or past data, it is described as the post-mortem of financial transactions. In
Financial Accounting all the transactions of financial nature are recorded in a book called
Journal in chronological order or in order of their occurrence, then classified in another book
called Ledger and finally summarized into a schedule called Trial Balance, from which an
Income statement is prepared to know the results of the transactions of financial nature in a
business firm as on a particular date and the same are analyzed with the help of the tools of
financial analysis, such as, comparative and common size financial statements, trend analysis,
Ratio analysis, fund flow analysis and cash flow analysis. These days, Double Entry System
of Accounting is followed by every Corporate and also most businesses which are organized
in forms other than Corporate. Hence the subsequent discussion in this chapter and latter
chapters would be on Double Entry System of Book Keeping.
1.2 OBJECTIVES OF ACCOUNTING:
Accounts are maintained
1. To have a permanent record of all mercantile transactions.
2. To maintain records of incomes, expenses and losses in such a way that the net profit or
net loss for any selected period may be readily ascertained.
3. To keep records of assets and liabilities in such a way that the financial position of the
undertaking at any point of time may be readily ascertained.
4. To enable the review and revision of policies in the light of past experience brought to
light by analyzing and interpreting records and reports.
1.3 USERS OF ACCOUNTING INFORMATION:
The importance of accounting is to provide meaningful information about a business enterprise
to those persons who are directly or indirectly interested in the performance and financial
position of business enterprise. Such persons may include owners, creditors, investors,
employees, government, public, research scholars and the managers.
3
1. Owners:
The owners of a business furnish capital to be used for the purpose of business. They are
interested to know whether the business has earned a profit or loss during a particular period
and also its financial position on a particular date. They want accounting reports in order to
have an appraisal of past performance and also for an assessment of future prospects.
2. Creditors:
The creditors include suppliers of goods and services, bankers and other lenders of money.
They are interested in the financial stability of the concern before making loans or granting
credit. They look to the ability of the business to pay interest and principal as and when it
becomes due for payment. They also look to the trends of earnings as it ultimately affects the
solvency of a concern.
3. Investors:
Investors look not only the earning capacity of business but also its financial strength and
solvency before deciding whether to subscribe or not for the shares in a Company. They are
interested in steady and good return on their capital, the safety of their capital and appreciation
in the value of the shares.
4. Employees:
Employees are interested in earning capacity of a concern as their salaries, bonus and pension
schemes are dependent on this factor. They have a permanent stake in the business and in order
to have an assurance of steady employment they are very much interested in the stability of the
organization.
5. Government:
Government is interested in accounting statements and reports in order to see the performance
of a particular unit, its cost structure and income in order to impose tax and excise duty.
4
6. Public:
The public as consumers is interested in accounting statements in order to know whether control
is exercised on production, selling and distribution expenses in order to reduce the prices of
goods they buy. They can also judge whether the economic resources of the concern are being
utilized for the benefit of the common man or not.
7. Research Scholars:
Such persons are interested in accounting statements and reports in order to get data for proving
their thesis on which they are working and hence to complete their research projects.
8. Managers:
The managers of an enterprise need accounting information for planning, control, evaluation of
performance and decision-making. Their main responsibility is to operate the business so as to
obtain maximum return on capital employed without causing any detriment to the interest of the
stakeholders.
1.4 PRINCIPLES OF ACCOUNTING:
Accounting is a system evolved to achieve a set of objectives. The objective being able to
communicate accounting information, to its users. In order to achieve the goals, we need a set
of rules or guidelines. These guidelines are termed here as Basic Accounting Principles.
In order to ensure authenticity, and comparability in the matter of recording and interpretation
of Accounts, Accounting Principles are followed. These Principles can be divided into
Concepts and Conventions. The following few paragraphs deal with these concepts and
conventions.
1.4.1 ACCOUNTING CONCEPTS:
5
The term `concepts’ includes those basic assumptions or conditions upon which the science of
accounting is based. The following are the important accounting concepts. The term Concept
means an idea or thought. Basic Accounting Concepts are the fundamental ideas or basic
assumptions underlying the theory and practice of financial accounting.
1. Separate Entity Concept:
Business is treated separate from the proprietor. All the transactions are recorded in the books
of business and not in the books of the proprietor. The proprietor is treated as a creditor for the
business. When he contributes capital he is treated as person who has invested his amount in
the business. Therefore, capital appears in the liabilities of balance sheet of the Organisation.
The concept of separate entity is applicable to all forms of business organizations. For
example, in case of a partnership business or sole proprietorship business, though the partners
or sole proprietor are not considered as separate entities in the eyes of law, but for accounting
purposes they will be considered as separate entities. The major effects of this concept are
that:
a) Financial position of the business can be easily found out.
b) Earning capacity of business can be easily ascertained.
c) The personal affairs of the owners are not mixed up with that of the business
2. Going Concern Concept:
The assumption is that business will continue to exist for unlimited period of time. There is
neither the intention nor the necessity to liquidate the particular business venture in the
foreseeable future. On account of this concept, the accountant while valuing the assets does not
take into account sale value of assets. Moreover, he charges depreciation on fixed assets on the
basis of their expected lives rather than on their market values.
3. Money Measurement Concept:
Only those transactions are recorded in accounting which can be expressed in terms of money.
Measurement of business in terms of money helps in understanding the state of affairs of the
business in a much better way. For example if a business owns Rs.10,000 of cash, certain
6
quantity of raw materials, two factories, 1,000 square feet of building space etc. These amounts
cannot be added together to produce a meaningful total of what the business owns. However, if
these items are expressed in monetary terms such as Rs.10,000 of cash, Rs.12,000 of raw
materials, Rs.2,00,000 of factories, and Rs.50,000 of building, all such items can be added and
much more intelligible and precise estimate about the assets of the business will be available.
The transactions which cannot be expressed in monetary terms fall beyond the scope of
accounting. This is also a limitation of accounting. For example, if a business has got a team of
dedicated and trusted employees, it is definitely an asset to the business but since their monetary
measurement is not possible, they are not shown in the books of the business
4. Cost Concept:
According to this concept, an asset is recorded at its cost in the books of account, i.e., the price
which is paid at the time of acquiring it. This concept is mainly applicable for fixed assets.
Current assets are not affected by it. Cost concept has the advantage of bringing objectivity in
the preparation and presentation of financial statements. In the absence of this concept the
figures shown in the accounting records would have depended on the subjective views of a
person. However, on account of continued inflationary tendencies the preparation of financial
statements on the basis of historical costs, creates problems of credibility in judging the
financial position of the business. This is the reason for the growing importance of inflation
accounting.
5. Accounting period Concept:
According to this concept, the life of the business is divided into appropriate time periods for
studying the results shown by the business after each segment. This is because though the life
of the business is considered to be indefinite (according to going concern concept), the
measurement of income and studying the financial position of the business after a very long
period would not be helpful in taking proper corrective steps at the appropriate time. It is
therefore, absolutely necessary that after each segment or time interval the businessman must
7
`stop and `see back’, how things are going. In accounting such a time period or time is called
`accounting period’. It is usually one year.
Every business wants to know the result of his investment and efforts after a certain period.
Usually one-year period is regarded as an ideal for this purpose; it may be 6 months or 2 years
also. This concept helps financial position and earning capacity of one year may be compared
with another year and also in planning and increasing the efficiency of business.
6. Dual Aspect Concept:
This is the basic concept of accounting. According to this concept every business transaction
has a dual effect. The two fold aspects are Receiving of benefit and Giving of equivalent
benefit. For example, if A starts a business with a capital of Rs.10,000. There are two aspects
of the transaction. On the one hand the business has asset of Rs.10,000 while on the other hand
the business owes to the proprietor a sum of Rs.10,000 which is taken as proprietor’s capital.
This expression can be shown in the form of following equation:
Capital (Equities) = Cash (Assets)
10,000 = 10,000
The term `assets denotes the resources owned by a business while the term “Equities” denotes
the claims of various parties against the assets, Equities are of two types. They are owners’
equity and outsiders’ equity. Owners’ equity (or capital) is the claim of owners against the
assets of the business while outsiders’ equity (or liabilities) is the claim of outside parties such
as creditors, debenture-holders against the assets of the business. Since all assets of the
business are claimed by someone (either owners outsiders), the total of assets will be equal to
total of liabilities, thus:
Equities = Assets
OR
Liabilities + Capital = Assets
In the example given above, if the business purchases furniture worth Rs.5,000 out of the
money provided by A, the situation will be as follows:
8
Equities =Assets
Capital Rs.10,000 = Cash Rs.5,000 + Furniture Rs.5,000
Subsequently if the business borrows Rs.30,000 from a bank, the new position would be as
follows:
Equities = Assets
Capital Rs.10,000 + Bank Loan Rs.30,000 = Cash 35,000 + Furniture Rs.5,000.
The term `accounting equation’ is also used to denote the relationship of equities to assets.
The equation can be technically stated as “for every debit, there is an equivalent credit”. As a
matter of fact the entire system of double entry book-keeping is based on this concept.
7. Matching Concept:
Every businessman is eager to make maximum profit at minimum cost. Hence, he tries to find
out revenue and cost during the accounting period. In order to ascertain the profit made by the
business during a period, it is necessary that `revenues’ of the period should be matched with
the costs (expenses) of the period. The term `matching’ means appropriate association of
related revenues and expenses. In other words, surplus made by the business during a period
can be measured only when the revenue earned during a period is compared with the
expenditure incurred for earning the revenue. On account of this concept, adjustments are made
for all outstanding expenses, accrued incomes, prepaid expenses and unearned incomes, etc.,
while preparing the final accounts at the end of the accounting period.
8. Realization Concept:
According to this concept revenue is recognized when a sale is made. Sale is considered to be
made at the point when the property in goods passes to the buyer and he becomes legally liable
to pay and not when the actual payment is made. For example, A places an order with B for
supply of certain goods yet to be manufactured. On receipt of order, B purchases raw materials,
employs workers, produces the goods and delivers them to A. A makes payment on receipt of
9
goods. In this case the sale will be presumed to have been made not at the time of receipt of the
cash for the goods but at the time when goods are delivered to A.
9. Accounting Equivalence Concept:
The proprietor provides funds for acquisition of assets. Hence the assets owned by the business
must be equal to the funds provided by the proprietor. Funds provided by the proprietor are
called equity. Hence accounting equivalence concept is:
Assets = Equities
In addition to own funds, money is borrowed which is known as liability. Therefore assets are
acquired through equity and liability. Therefore, accounting equation is:
Assets = Owner’s Equity + liabilities
10. Objective Evidence Concept:
This concept relates with the verification of accounting record with Objective evidence.
Objective evidence means study of those documents and vouchers on the basis of which
accounting record has been made. This helps a lot in auditing of accounts and Account remains
free from error and fraud due to existence of vouchers, documents etc.
1.4.2 ACCOUNTING CONVENTIONS:
The term `convention’ includes those customs or traditions which guide the accountant while
preparing the accounting statements. The following are the important accounting conventions:
Convention of Consistency
Convention of Conservatism.
Convention of Full Disclosure.
10
Convention of Materiality.
1. Convention of Consistency:
Continuance of same practice for number of years indicates consistency. Whatever accounting
practice has been adopted in one year, the same should be continued in future years also. If
depreciation is charged on fixed assets according to diminishing balance method, it should be
done year after year. This is necessary for the purposes of comparison. However, consistency
does not mean inflexibility. It does not forbid introduction of improved accounting techniques.
If better method is found, it must be followed, but a note for making a change must be in the
accounts. The biggest advantage of this convention is that it facilitates comparison of one
year’s accounts with other years.
2. Convention of Conservation:
Future is uncertain. Though projections may be made about future events, no one can forecast
future with perfect certainty in business. Therefore some arrangement or provision is made to
meet future uncertainties. Every sincere businessman makes an estimate of future losses and
then some provision for it e.g., provision for bad debts is made. However, businessmen mostly
ignore the items of future profits. This tendency is termed as conservatism. Therefore, the
common accounting practices are:
o Do not consider any income or gain till the same is realized in cash.
o Create or make a provision for future expected losses and contingencies on the
basis of past experience.
The convention of conservatism has become target of serious criticism these days especially on
the ground that it goes against the convention of full disclosure. It also gives room to the
accountant to create secrete reserves (e.g. by creating excess provision for bad and doubtful
11
debts, depreciation etc.), and the financial statements do not depict a true and fair view of state
of affairs of the business.
3.Convention of Full Disclosure:
Accounting records and statements should be honest and materially informative, Exclusion of
material facts makes them incomplete and unreliable. This convention is gaining more
importance because most of big businesses are run in the form of joint stock companies where
ownership is divorced from management. The Companies Act, 1956, not only requires that
Income Statement and Balance Sheet of a company must give a true and fair view of the state of
affairs of the company but it also gives the prescribed forms in which these statements are to be
prepared. The practice of appending notes to the accounting statements (such as about
contingent liabilities or market value of investments) is pursuant to the convention of full
disclosure. This is done to benefit the proprietor and all those outsiders who are interested in
assessing the efficiency of financial position of the business unit.
4.Convention of Materiality:
Materiality means relative importance. Whether a matter should be disclosed or not in the
financial statements depends on its materiality, i.e., whether it is material or not. According to
this convention accounting record should be made of all material facts. Immaterial items may
either be clubbed with material items and then recorded or these may be ignored. For example
purchase of a waste paper basket, might amount to purchase of a capital asset, since this lasts
for more than a year, but by virtue of the amount involved, it is better treated as revenue
expenditure. Thus, the term `materiality’ is a subjective term. The accountant should regard an
item as material if there is reason to believe that knowledge of it would influence the decision
of the informed investor.
12
1.5 SOME IMPORTANT TERMS USED IN BOOK – KEEPING: Before you get into the
specifics of Accounting, you should be familiar with some of the terms which are generally
used in Accounting. A few of them are given below:
Business Transactions: Any exchange of money or money’s worth is called business
transaction. Events like purchase and sale of goods, receipts and payments of cash for
services or on personal accounts are the examples of transactions. When payment for
business activity is made immediately, it is called cash transaction, but when the
payment is postponed to a future date, it is called a credit transaction.
Debtor: A debtor is a person who owes something to the business
Creditor: A creditor is a person to whom something is owing, by the business.
Debit and Credit: To debit an account means to enter the transaction on the debit side
of that account. To credit an account means to enter the transaction on the credit side
of that account.
Capital: It is the amount invested by the proprietor in the business. For the business,
capital is a liability towards the owner. Sometimes it is called `owner’s equity’ i.e.
owners claim against the assets. Owner’s equity or capital is always equal to assets
minus liabilities.
Drawing: It is the value of cash or goods withdrawn from the business by the owner
for his personal use.
Goods: It includes all commodities or articles in which a trader deals.
13
Assets: These are the material things or possessions or properties of the business
including the amounts due to it. Examples are Cash and Bank balances, Land and
Building, Plant and Machinery etc.
Liabilities: The term liabilities denote the amounts which the business owes to others
such as loan from bank, creditors for goods supplied, for outstanding expenses etc.
Accounts: An account is a summary of the record of all the transactions relating to a
person, asset, expense or gain. It has two sides-the left hand side called the debit side
and the right hand side called the credit side.
Accounts are of three types Personal, Real and Nominal accounts:
Personal Accounts:
These are the accounts of natural persons (such as Ram”s accounts, Gopal’s account)
artificial persons (such as Uday Ltd., Syndicate Bank’,) and representative personal
account (such as Prepaid Insurance account, outstanding salary account) with whom
the trader deals)
Real Accounts:
Accounts relating to properties or assets of a trader are known as real accounts. It
includes tangible assets such as building, furniture, cash etc., and also intangible
assets such as goodwill, trade marks, patent rights
Nominal Accounts:
Accounts dealing with expenses, losses, gains and incomes are called Nominal
Accounts, e.g. salaries account, wages account, commission account etc.
Real and Nominal Accounts are also called Impersonal accounts because they
do not affect any particular person but affect business in general.
1.6 SUMMARY:
14
Accounting can be defined as, `an art of recording, classifying and summarizing in a significant
manner and in terms of money, transactions and events which are, in part at least of a financial
character, and interpreting the result thereof.” Accounting is a system evolved to achieve a set
of objectives. The objective is to communicate accounting information to its users. In order to
achieve the goals, we need a set of rules or guidelines. These guidelines are termed here as
Accounting Principles. The importance of accounting is to provide meaningful information
about a business enterprise to those persons who are directly or indirectly interested in the
performance and financial position of business enterprise. Such persons may include owners,
creditors, investors, employees, government, public, research scholars and the managers.
1.7 KEY WORDS:
Double Entry System of Book Keeping Separate Entity Concept
Going Concern Concept Money Measurement Concept
Cost Concept Accounting period Concept
Dual Aspect Concept Matching Concept
Realization Concept Accounting Equivalence Concept
Objective Evidence Concept Convention of Consistency
Convention of Conservatism. Convention of Full Disclosure.
Convention of Materiality.
Try yourself:
1. Explain the principles of Accounting.
2. Discuss important Accounting Concepts
3. Explain the significance of Accounting conventions.
4. Who are the users of Accounting information?
FURTHER READINGS:
Jain S.P. and Narang, K.L., .Advanced Accountancy, Kalyani Publishers
Mukherjee & Khan, Modern Accountancy, Tata Mcgraw Hill
15
LESSON 2 ACCOUNTING CYCLE - I
STRUCTURE
STRUCTURE:
STRUCTURE: 2.1 Introduction
2.2 Journal
2.3 Ledger
2.4 Subsidiary Books- Division Of Journal
2.5 Trial Balance
2.6 Accounting Cycle
2.7 Summary
2.8 Key Words
2.1 INTRODUCTION:
As discussed in the first chapter, businesses aim at earning profit. Entities which do not have
profit earning as an objective also aim to be financially viable. Therefore, earning a profit or
being viable is an important objective which is pursued by all organizations. However, it is
not possible to ascertain whether operations have been viable or not, unless a proper record of
all the transactions is kept in a systematic way.
OBJECTIVES:
Explain importance of Journal, be able to record transactions in the journal
Know the importance of Ledger, be able to do the ledger posting, and Balance the accounts
Describe the importance and utility of Subsidiary books. Prepare the trial balance
16
Maintaining such a systematic record of all transaction is called book-keeping and when such
record-keeping moves on to classifying and summarizing, preparation of final reports and
interpretation, we call it accounting.
In India, Accounting had been practised as far back as Mauryan Dynasty times which we can
see from Kautilya’s Artha Shastra. However, the present day accounting has its origins in
Luco Pacioli’s Double Entry System of Accounting. In this chapter, we shall learn to
journalise, and post it into the ledger. The two steps mark the beginning of the Accounting
cycle.
2.2 JOURNAL :
Journal is the book wherein a business transaction is first written or recorded and therefore it
is also known as book of Original Entry. In the French language Jour means day. Journal
therefore is a book where day to day transactions are written. Journal is written
chronologically i.e., it is written date wise, for example; transaction relating January 1 are first
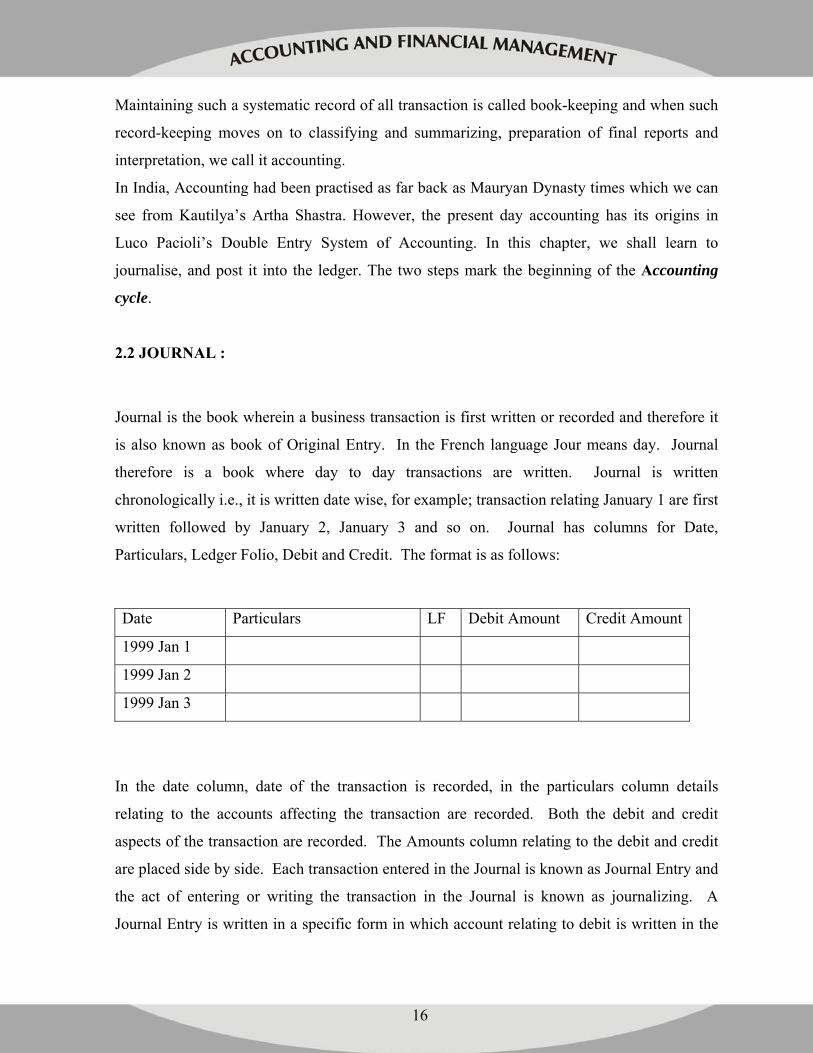
written followed by January 2, January 3 and so on. Journal has columns for Date,
Particulars, Ledger Folio, Debit and Credit. The format is as follows:
Date Particulars LF Debit Amount Credit Amount
1999 Jan 1
1999 Jan 2
1999 Jan 3
In the date column, date of the transaction is recorded, in the particulars column details
relating to the accounts affecting the transaction are recorded. Both the debit and credit
aspects of the transaction are recorded. The Amounts column relating to the debit and credit
are placed side by side. Each transaction entered in the Journal is known as Journal Entry and
the act of entering or writing the transaction in the Journal is known as journalizing. A
Journal Entry is written in a specific form in which account relating to debit is written in the
17
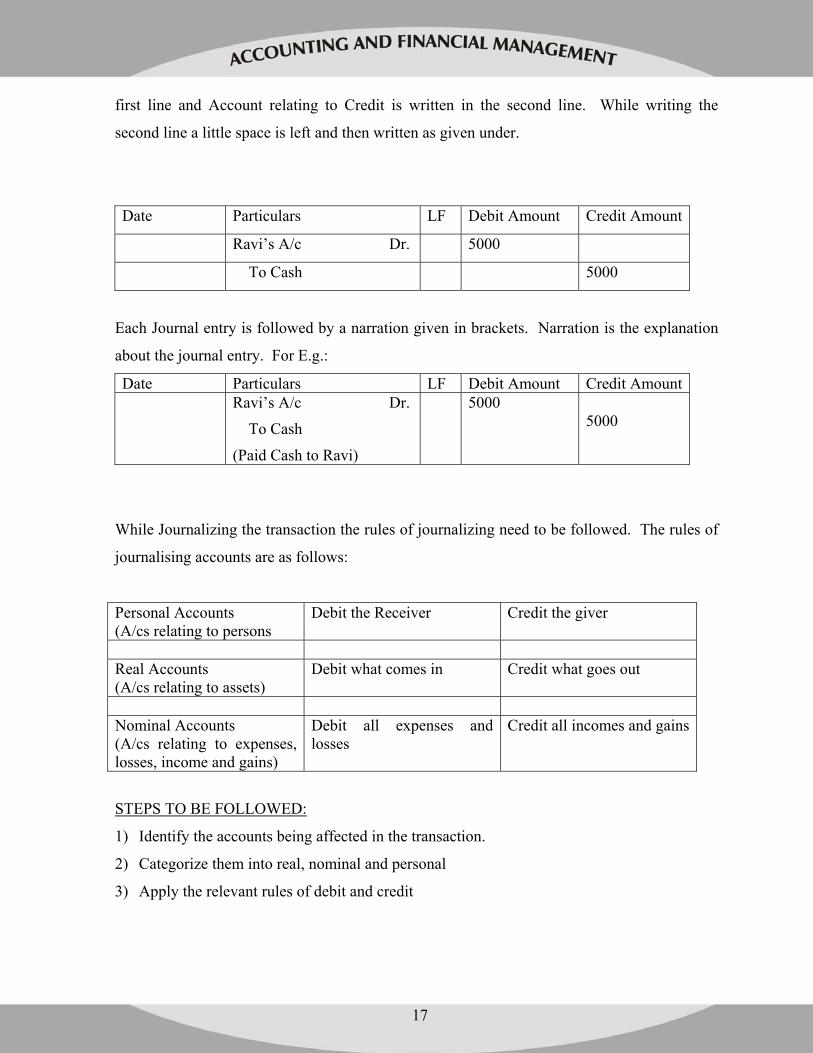
first line and Account relating to Credit is written in the second line. While writing the
second line a little space is left and then written as given under.
Date Particulars LF Debit Amount Credit Amount
Ravi’s A/c Dr. 5000
To Cash 5000
Each Journal entry is followed by a narration given in brackets. Narration is the explanation
about the journal entry. For E.g.:
Date Particulars LF Debit Amount Credit Amount Ravi’s A/c Dr.
To Cash
(Paid Cash to Ravi)
5000 5000
While Journalizing the transaction the rules of journalizing need to be followed. The rules of
journalising accounts are as follows:
Personal Accounts (A/cs relating to persons
Debit the Receiver Credit the giver
Real Accounts (A/cs relating to assets)
Debit what comes in Credit what goes out
Nominal Accounts (A/cs relating to expenses, losses, income and gains)
Debit all expenses and losses
Credit all incomes and gains
STEPS TO BE FOLLOWED:
1) Identify the accounts being affected in the transaction.
2) Categorize them into real, nominal and personal
3) Apply the relevant rules of debit and credit
18
However, in order to journalize it is very important that you should be to identify and classify
the accounts into proper categories. You should know the category into which a particular
account falls. For example you should know whether Capital Account is a personal account,
nominal account or a real account, only then you can apply the rule related to that category.
Consider, Cash since it is a real account you should apply the rules relating to real account.
And again take Rent since we know that it is a nominal account rules of debit and credit
relating to nominal accounts need to be applied while journalising the transactions. Personal
Accounts relate to Accounts relating to persons. Persons could mean individuals, business
organization, a sole proprietary concern, partnership firm, and so on. It could be a bank, an
educational, institution, a hospital or any institution. The term person includes a natural
person as well as an artificial person.
Real accounts relate to assets. They could be land, building, motor car, machinery, furniture,
cash, goodwill, patents and so on. Assets could be Tangible or intangible. Examples of
intangible assets could be good will, patents, trade and so on.
Nominal accounts relate to expenses, losses, incomes and gains. For eg: Rent, Interest, Salary.
Having understood the meaning of a journal, the rules of journalizing, the style of writing a
journal entry, the format of a journal, the various type of accounts, we shall now try to enter or
write sample business transactions into a Journal.
January 1, 2005 – Ravi Started business with Cash Rs.50000
In this business transaction it is obvious that Cash A/c is affected. We see that Cash is being
brought into the business. So the first account that is affected is Cash and the other is the
Personal A/c of the owner which is called as Capital.
Now since Cash is a real account the rules of debit and credit relating to Real accounts need to
be applied. And the rule is debit what comes in and credit what goes out. We see here that
cash is coming into the business and so we need to debit the Cash A/c.
19
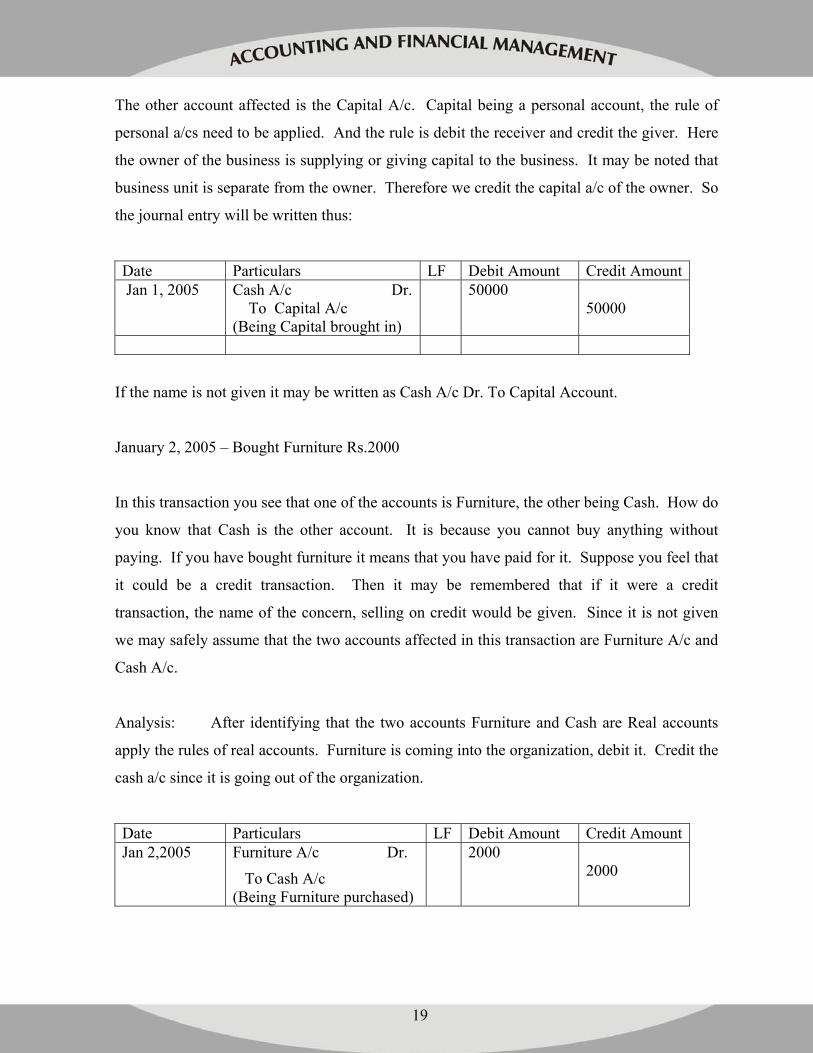
The other account affected is the Capital A/c. Capital being a personal account, the rule of
personal a/cs need to be applied. And the rule is debit the receiver and credit the giver. Here
the owner of the business is supplying or giving capital to the business. It may be noted that
business unit is separate from the owner. Therefore we credit the capital a/c of the owner. So
the journal entry will be written thus:
Date Particulars LF Debit Amount Credit Amount Jan 1, 2005 Cash A/c Dr.
To Capital A/c (Being Capital brought in)
50000 50000
If the name is not given it may be written as Cash A/c Dr. To Capital Account.
January 2, 2005 – Bought Furniture Rs.2000
In this transaction you see that one of the accounts is Furniture, the other being Cash. How do
you know that Cash is the other account. It is because you cannot buy anything without
paying. If you have bought furniture it means that you have paid for it. Suppose you feel that
it could be a credit transaction. Then it may be remembered that if it were a credit
transaction, the name of the concern, selling on credit would be given. Since it is not given
we may safely assume that the two accounts affected in this transaction are Furniture A/c and
Cash A/c.
Analysis: After identifying that the two accounts Furniture and Cash are Real accounts
apply the rules of real accounts. Furniture is coming into the organization, debit it. Credit the
cash a/c since it is going out of the organization.
Date Particulars LF Debit Amount Credit AmountJan 2,2005 Furniture A/c Dr.
To Cash A/c (Being Furniture purchased)
2000 2000
20
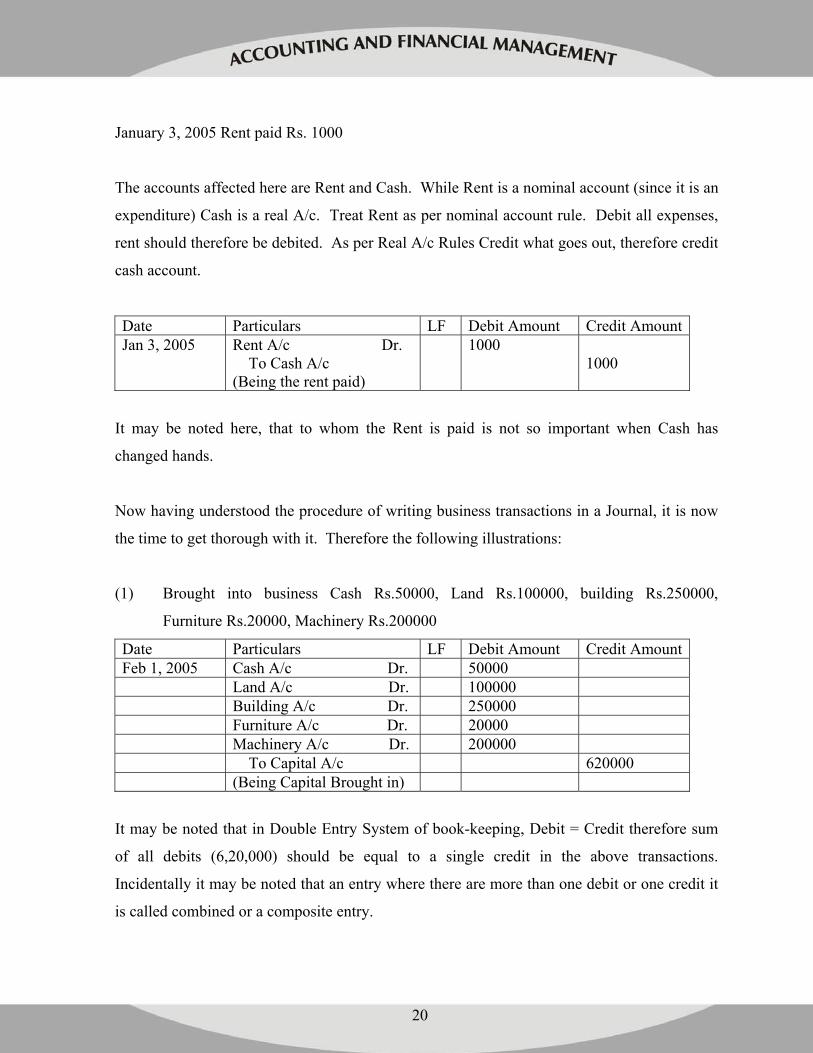
January 3, 2005 Rent paid Rs. 1000
The accounts affected here are Rent and Cash. While Rent is a nominal account (since it is an
expenditure) Cash is a real A/c. Treat Rent as per nominal account rule. Debit all expenses,
rent should therefore be debited. As per Real A/c Rules Credit what goes out, therefore credit
cash account.
Date Particulars LF Debit Amount Credit AmountJan 3, 2005 Rent A/c Dr.
To Cash A/c (Being the rent paid)
1000 1000
It may be noted here, that to whom the Rent is paid is not so important when Cash has
changed hands.
Now having understood the procedure of writing business transactions in a Journal, it is now
the time to get thorough with it. Therefore the following illustrations:
(1) Brought into business Cash Rs.50000, Land Rs.100000, building Rs.250000,
Furniture Rs.20000, Machinery Rs.200000
Date Particulars LF Debit Amount Credit AmountFeb 1, 2005 Cash A/c Dr. 50000 Land A/c Dr. 100000 Building A/c Dr. 250000 Furniture A/c Dr. 20000 Machinery A/c Dr. 200000 To Capital A/c 620000 (Being Capital Brought in)
It may be noted that in Double Entry System of book-keeping, Debit = Credit therefore sum
of all debits (6,20,000) should be equal to a single credit in the above transactions.
Incidentally it may be noted that an entry where there are more than one debit or one credit it
is called combined or a composite entry.
21
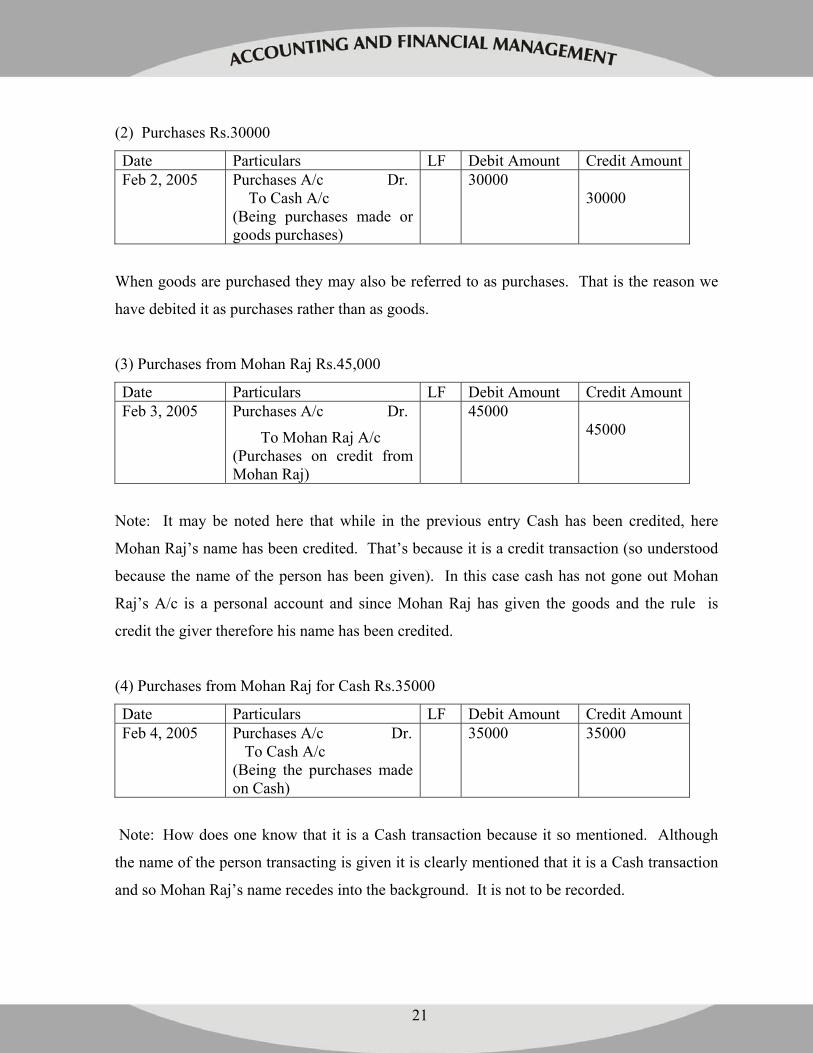
(2) Purchases Rs.30000
Date Particulars LF Debit Amount Credit AmountFeb 2, 2005 Purchases A/c Dr.
To Cash A/c (Being purchases made or goods purchases)
30000 30000
When goods are purchased they may also be referred to as purchases. That is the reason we
have debited it as purchases rather than as goods.
(3) Purchases from Mohan Raj Rs.45,000
Date Particulars LF Debit Amount Credit AmountFeb 3, 2005 Purchases A/c Dr.
To Mohan Raj A/c (Purchases on credit from Mohan Raj)
45000 45000
Note: It may be noted here that while in the previous entry Cash has been credited, here
Mohan Raj’s name has been credited. That’s because it is a credit transaction (so understood
because the name of the person has been given). In this case cash has not gone out Mohan
Raj’s A/c is a personal account and since Mohan Raj has given the goods and the rule is
credit the giver therefore his name has been credited.
(4) Purchases from Mohan Raj for Cash Rs.35000
Date Particulars LF Debit Amount Credit AmountFeb 4, 2005 Purchases A/c Dr.
To Cash A/c (Being the purchases made on Cash)
35000 35000
Note: How does one know that it is a Cash transaction because it so mentioned. Although
the name of the person transacting is given it is clearly mentioned that it is a Cash transaction
and so Mohan Raj’s name recedes into the background. It is not to be recorded.
22
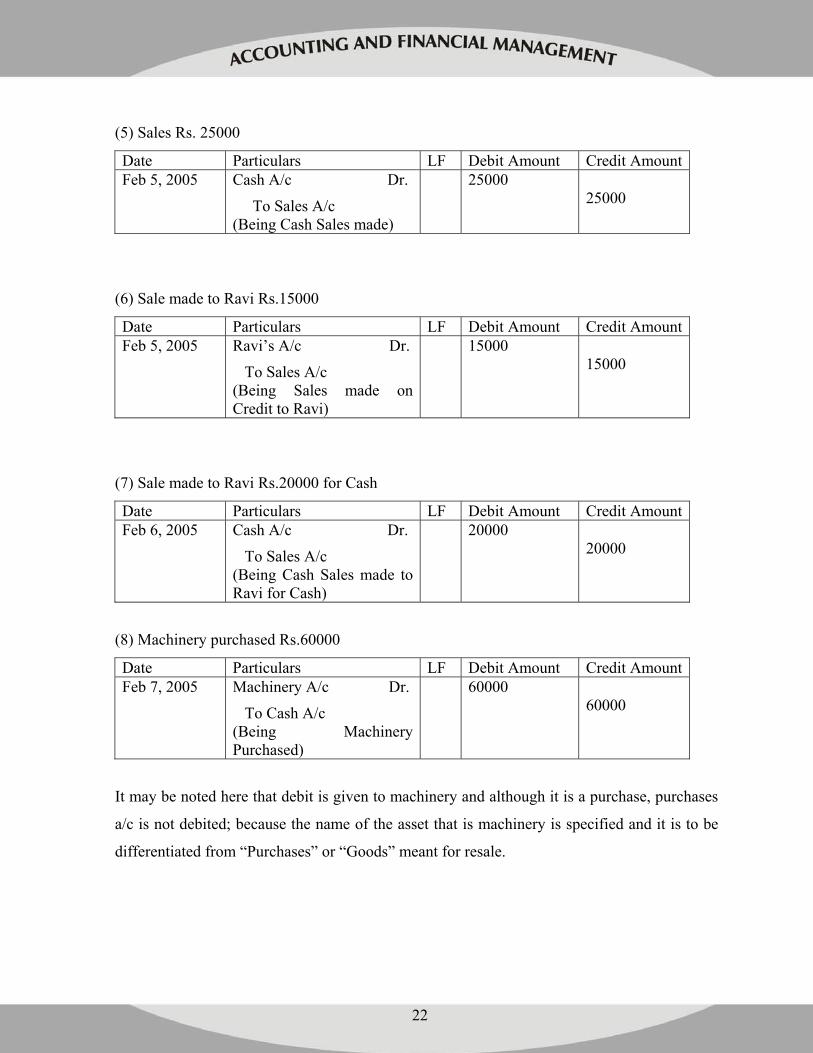
(5) Sales Rs. 25000
Date Particulars LF Debit Amount Credit AmountFeb 5, 2005 Cash A/c Dr.
To Sales A/c (Being Cash Sales made)
25000 25000
(6) Sale made to Ravi Rs.15000
Date Particulars LF Debit Amount Credit AmountFeb 5, 2005 Ravi’s A/c Dr.
To Sales A/c (Being Sales made on Credit to Ravi)
15000 15000
(7) Sale made to Ravi Rs.20000 for Cash
Date Particulars LF Debit Amount Credit AmountFeb 6, 2005 Cash A/c Dr.
To Sales A/c (Being Cash Sales made to Ravi for Cash)
20000 20000
(8) Machinery purchased Rs.60000
Date Particulars LF Debit Amount Credit AmountFeb 7, 2005 Machinery A/c Dr.
To Cash A/c (Being Machinery Purchased)
60000 60000
It may be noted here that debit is given to machinery and although it is a purchase, purchases
a/c is not debited; because the name of the asset that is machinery is specified and it is to be
differentiated from “Purchases” or “Goods” meant for resale.
23
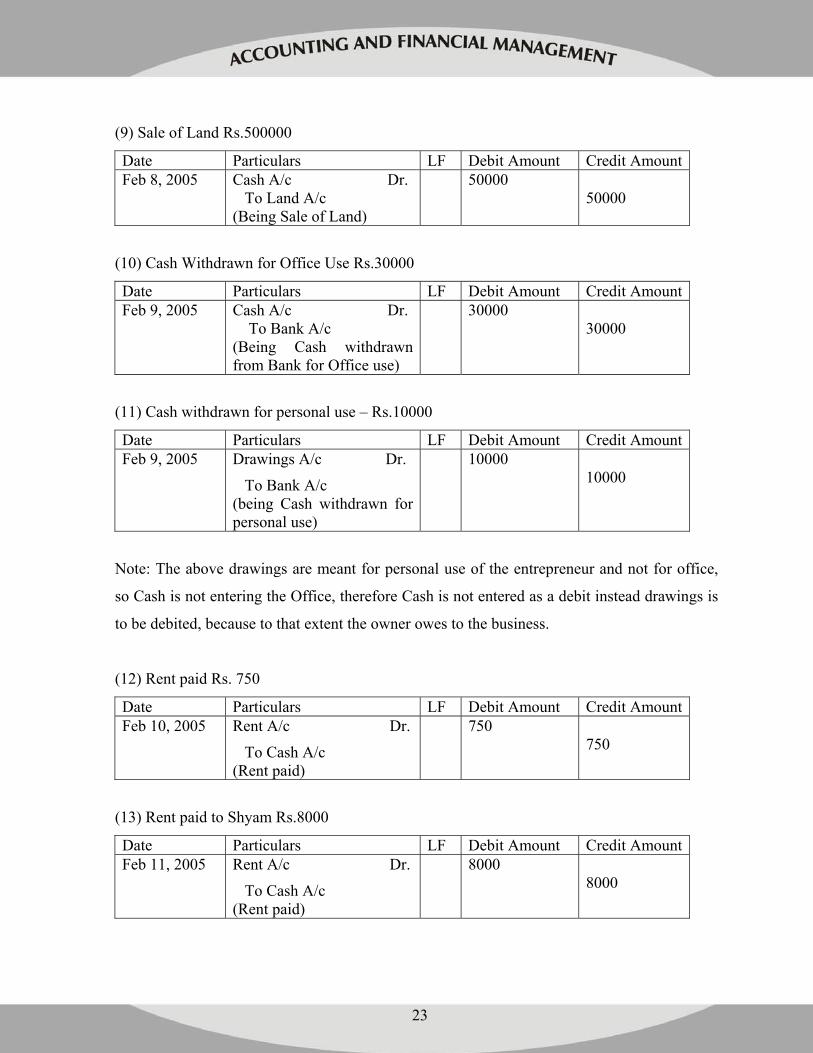
(9) Sale of Land Rs.500000
Date Particulars LF Debit Amount Credit AmountFeb 8, 2005 Cash A/c Dr.
To Land A/c (Being Sale of Land)
50000 50000
(10) Cash Withdrawn for Office Use Rs.30000
Date Particulars LF Debit Amount Credit AmountFeb 9, 2005 Cash A/c Dr.
To Bank A/c (Being Cash withdrawn from Bank for Office use)
30000 30000
(11) Cash withdrawn for personal use – Rs.10000
Date Particulars LF Debit Amount Credit AmountFeb 9, 2005 Drawings A/c Dr.
To Bank A/c (being Cash withdrawn for personal use)
10000 10000
Note: The above drawings are meant for personal use of the entrepreneur and not for office,
so Cash is not entering the Office, therefore Cash is not entered as a debit instead drawings is
to be debited, because to that extent the owner owes to the business.
(12) Rent paid Rs. 750
Date Particulars LF Debit Amount Credit AmountFeb 10, 2005 Rent A/c Dr.
To Cash A/c (Rent paid)
750 750
(13) Rent paid to Shyam Rs.8000
Date Particulars LF Debit Amount Credit AmountFeb 11, 2005 Rent A/c Dr.
To Cash A/c (Rent paid)
8000 8000
24
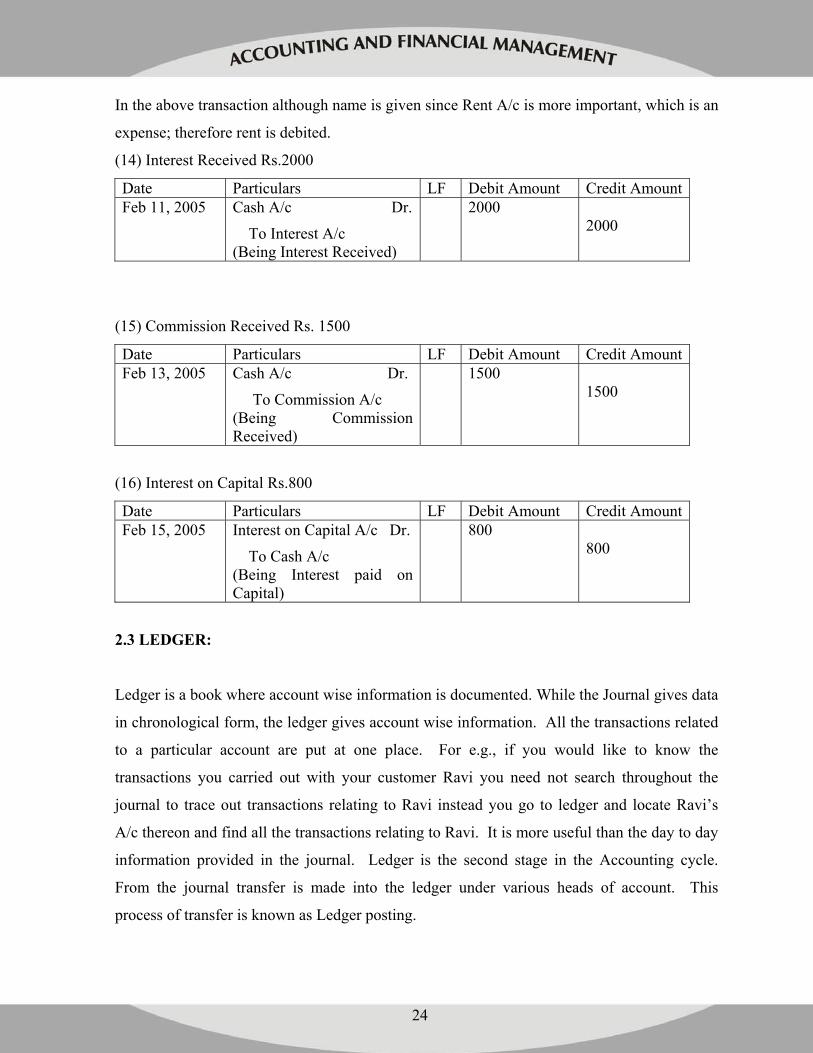
In the above transaction although name is given since Rent A/c is more important, which is an
expense; therefore rent is debited.
(14) Interest Received Rs.2000
Date Particulars LF Debit Amount Credit AmountFeb 11, 2005 Cash A/c Dr.
To Interest A/c (Being Interest Received)
2000 2000
(15) Commission Received Rs. 1500
Date Particulars LF Debit Amount Credit AmountFeb 13, 2005 Cash A/c Dr.
To Commission A/c (Being Commission Received)
1500 1500
(16) Interest on Capital Rs.800
Date Particulars LF Debit Amount Credit AmountFeb 15, 2005 Interest on Capital A/c Dr.
To Cash A/c (Being Interest paid on Capital)
800 800
2.3 LEDGER:
Ledger is a book where account wise information is documented. While the Journal gives data
in chronological form, the ledger gives account wise information. All the transactions related
to a particular account are put at one place. For e.g., if you would like to know the
transactions you carried out with your customer Ravi you need not search throughout the
journal to trace out transactions relating to Ravi instead you go to ledger and locate Ravi’s
A/c thereon and find all the transactions relating to Ravi. It is more useful than the day to day
information provided in the journal. Ledger is the second stage in the Accounting cycle.
From the journal transfer is made into the ledger under various heads of account. This
process of transfer is known as Ledger posting.
25
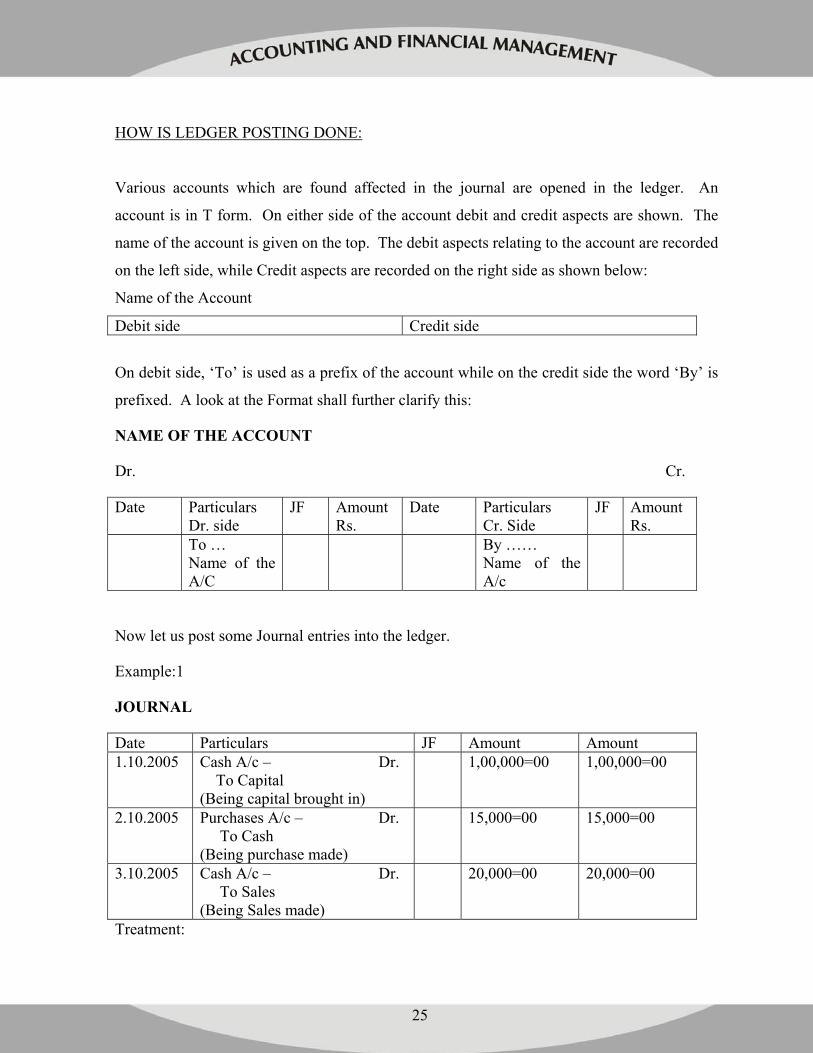
HOW IS LEDGER POSTING DONE:
Various accounts which are found affected in the journal are opened in the ledger. An
account is in T form. On either side of the account debit and credit aspects are shown. The
name of the account is given on the top. The debit aspects relating to the account are recorded
on the left side, while Credit aspects are recorded on the right side as shown below:
Name of the Account
Debit side Credit side
On debit side, ‘To’ is used as a prefix of the account while on the credit side the word ‘By’ is
prefixed. A look at the Format shall further clarify this:
NAME OF THE ACCOUNT
Dr. Cr.
Date Particulars Dr. side
JF Amount Rs.
Date Particulars Cr. Side
JF Amount Rs.
To … Name of the A/C
By …… Name of the A/c
Now let us post some Journal entries into the ledger.
Example:1
JOURNAL
Date Particulars JF Amount Amount 1.10.2005 Cash A/c – Dr.
To Capital (Being capital brought in)
1,00,000=00 1,00,000=00
2.10.2005 Purchases A/c – Dr. To Cash (Being purchase made)
15,000=00 15,000=00
3.10.2005 Cash A/c – Dr. To Sales (Being Sales made)
20,000=00 20,000=00
Treatment:
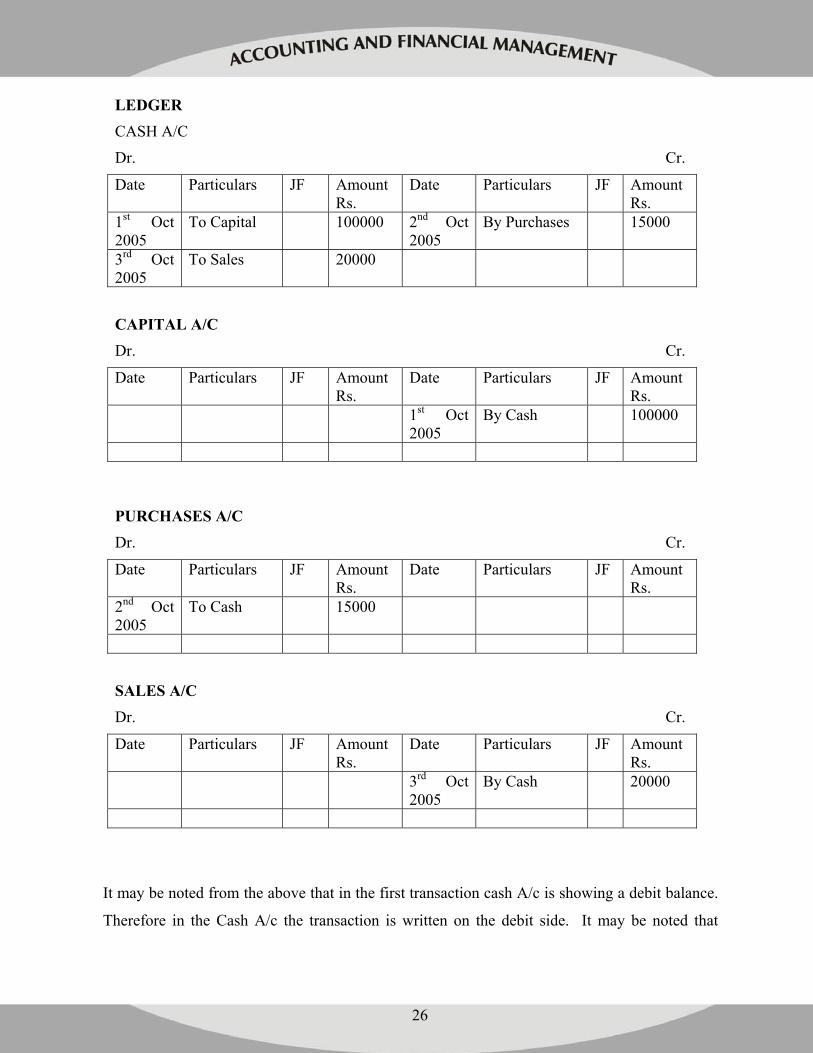
26
LEDGER CASH A/C
Dr. Cr.
Date Particulars JF Amount Rs.
Date Particulars JF Amount Rs.
1st Oct 2005
To Capital 100000 2nd Oct 2005
By Purchases 15000
3rd Oct 2005
To Sales 20000
CAPITAL A/C Dr. Cr.
Date Particulars JF Amount Rs.
Date Particulars JF Amount Rs.
1st Oct 2005
By Cash 100000
PURCHASES A/C Dr. Cr.
Date Particulars JF Amount Rs.
Date Particulars JF Amount Rs.
2nd Oct 2005
To Cash 15000
SALES A/C
Dr. Cr.
Date Particulars JF Amount Rs.
Date Particulars JF Amount Rs.
3rd Oct 2005
By Cash 20000
It may be noted from the above that in the first transaction cash A/c is showing a debit balance.
Therefore in the Cash A/c the transaction is written on the debit side. It may be noted that
27
when the name of the account having the credit balance is written Viz: in the Cash A/c it is
written as To Capital Account. Whereas in the capital account which shows credit balance it is
written as By Cash A/c on the credit side.
In the second transaction purchases A/c is showing a debit balance and therefore in the
purchases A/c the transaction is written on the debit side as ‘To Cash A/c. Whereas in the
Cash A/c which is showing credit balance it is written as “By purchases”.
In the third transaction Cash A/c is showing a debit balance and therefore on the debit side of
the cash account it is written as ‘To Sales’, while in the Sales A/c it is recorded as ‘By Cash’.
From the above three transactions it is seen as to how ledger posting or transfer of transaction
is made from the journal to the ledger.
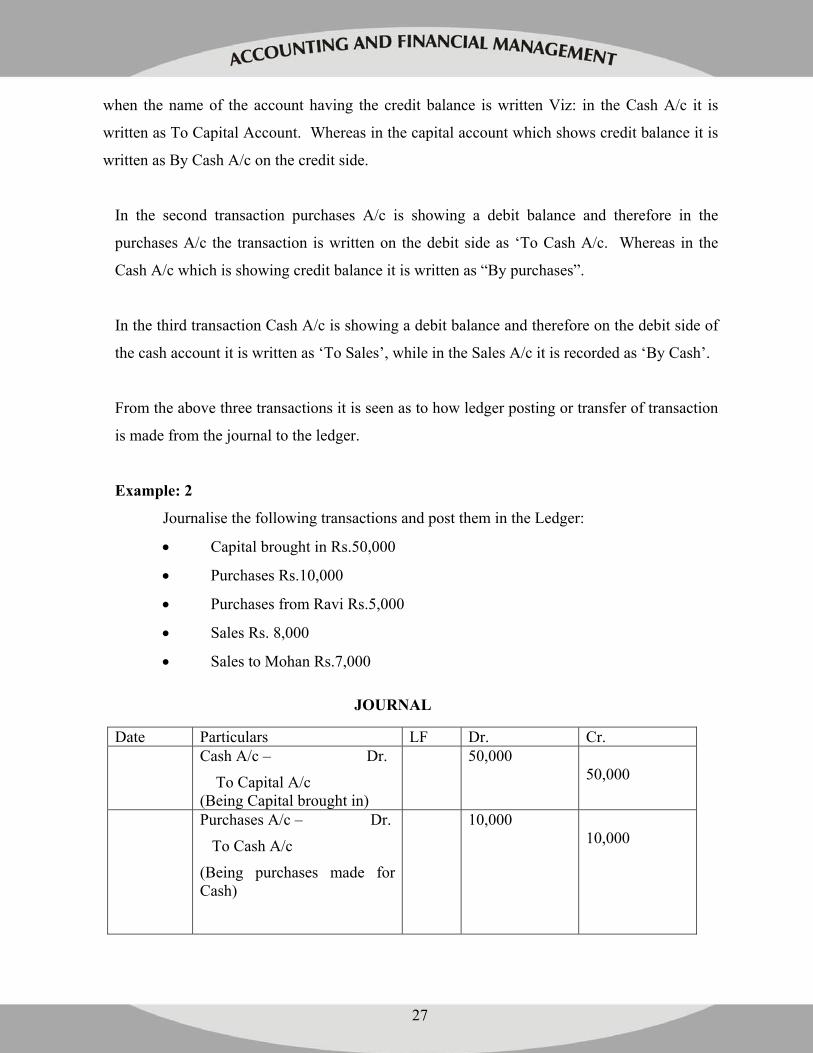
Example: 2
Journalise the following transactions and post them in the Ledger:
• Capital brought in Rs.50,000
• Purchases Rs.10,000
• Purchases from Ravi Rs.5,000
• Sales Rs. 8,000
• Sales to Mohan Rs.7,000
JOURNAL
Date Particulars LF Dr. Cr. Cash A/c – Dr.
To Capital A/c (Being Capital brought in)
50,000 50,000
Purchases A/c – Dr.
To Cash A/c
(Being purchases made for Cash)
10,000 10,000
28
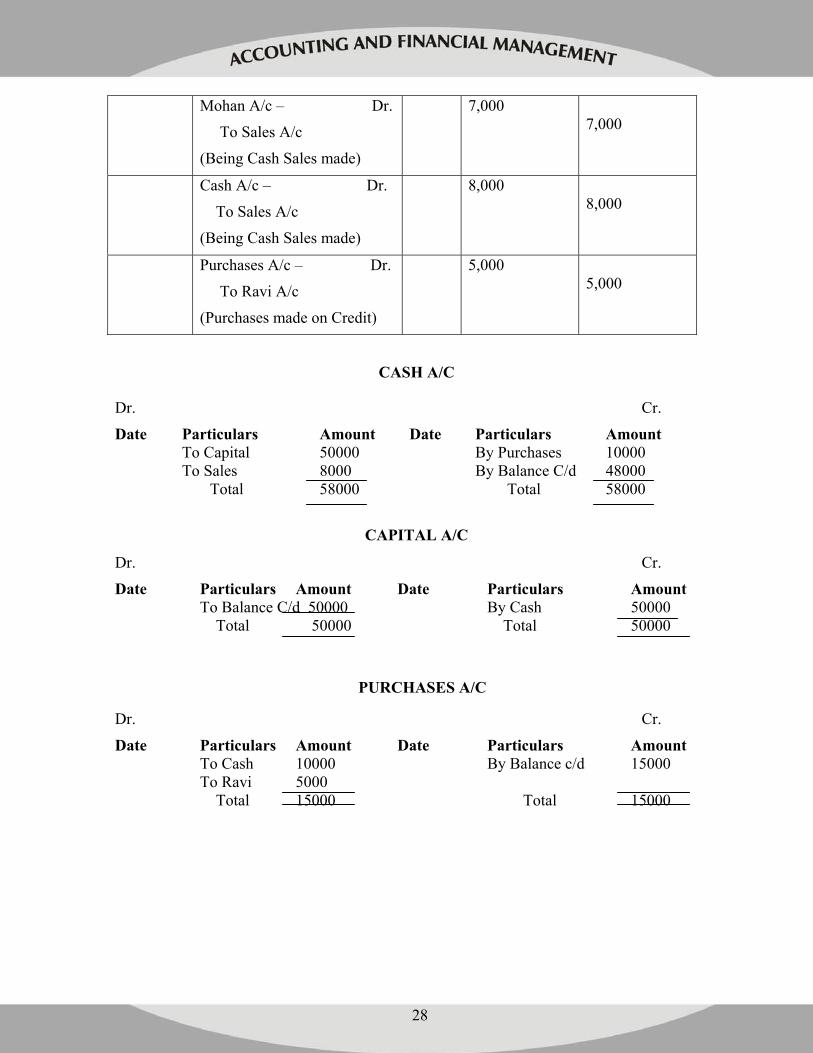
Mohan A/c – Dr.
To Sales A/c
(Being Cash Sales made)
7,000 7,000
Cash A/c – Dr.
To Sales A/c
(Being Cash Sales made)
8,000 8,000
Purchases A/c – Dr.
To Ravi A/c
(Purchases made on Credit)
5,000 5,000
CASH A/C
Dr. Cr.
Date Particulars Amount Date Particulars Amount To Capital 50000 By Purchases 10000 To Sales 8000 By Balance C/d 48000 Total 58000 Total 58000
CAPITAL A/C
Dr. Cr.
Date Particulars Amount Date Particulars Amount To Balance C/d 50000 By Cash 50000 Total 50000 Total 50000
PURCHASES A/C
Dr. Cr.
Date Particulars Amount Date Particulars Amount To Cash 10000 By Balance c/d 15000 To Ravi 5000 Total 15000 Total 15000
29
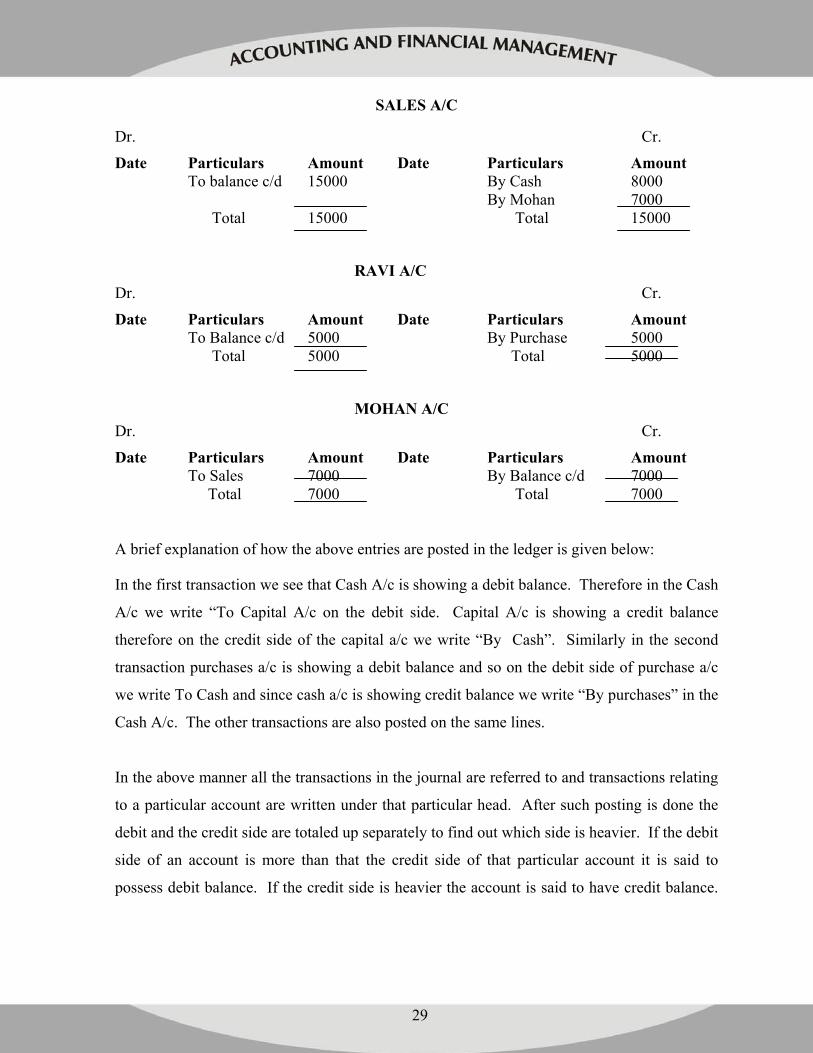
SALES A/C
Dr. Cr.
Date Particulars Amount Date Particulars Amount To balance c/d 15000 By Cash 8000 By Mohan 7000 Total 15000 Total 15000
RAVI A/C Dr. Cr.
Date Particulars Amount Date Particulars Amount To Balance c/d 5000 By Purchase 5000 Total 5000 Total 5000
MOHAN A/C Dr. Cr.
Date Particulars Amount Date Particulars Amount To Sales 7000 By Balance c/d 7000 Total 7000 Total 7000 A brief explanation of how the above entries are posted in the ledger is given below:
In the first transaction we see that Cash A/c is showing a debit balance. Therefore in the Cash
A/c we write “To Capital A/c on the debit side. Capital A/c is showing a credit balance
therefore on the credit side of the capital a/c we write “By Cash”. Similarly in the second
transaction purchases a/c is showing a debit balance and so on the debit side of purchase a/c
we write To Cash and since cash a/c is showing credit balance we write “By purchases” in the
Cash A/c. The other transactions are also posted on the same lines.
In the above manner all the transactions in the journal are referred to and transactions relating
to a particular account are written under that particular head. After such posting is done the
debit and the credit side are totaled up separately to find out which side is heavier. If the debit
side of an account is more than that the credit side of that particular account it is said to
possess debit balance. If the credit side is heavier the account is said to have credit balance.
30
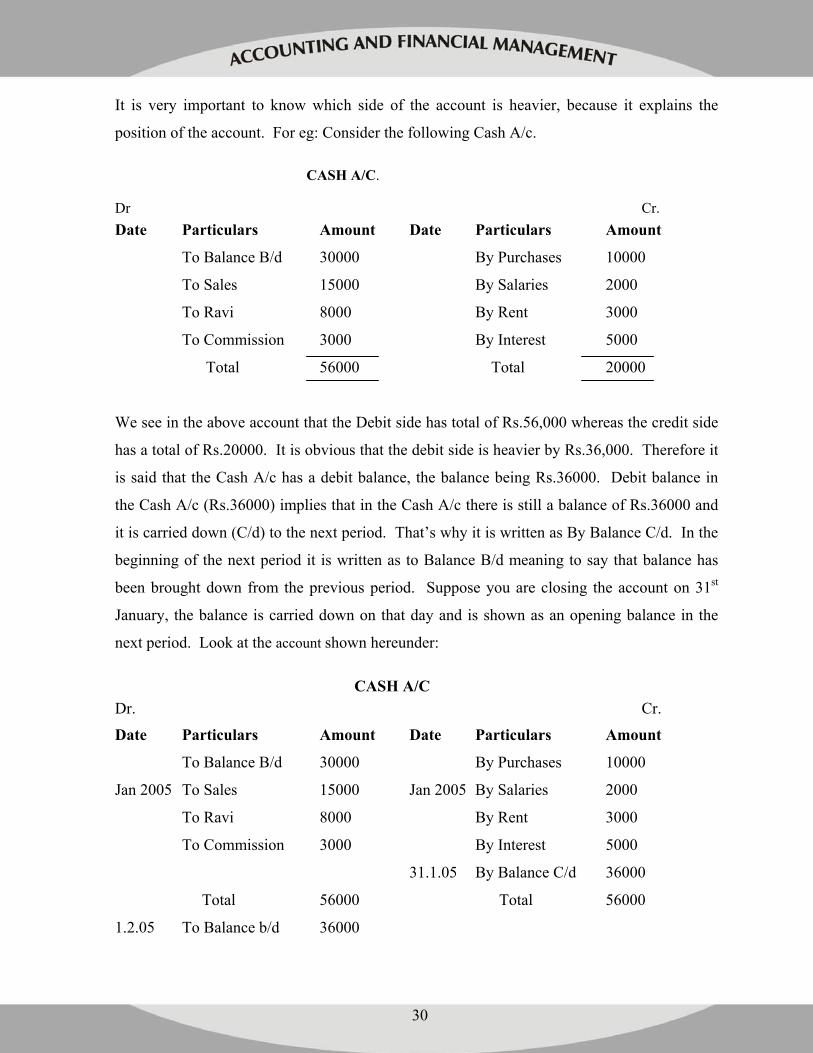
It is very important to know which side of the account is heavier, because it explains the
position of the account. For eg: Consider the following Cash A/c.
CASH A/C.
Dr Cr. Date Particulars Amount Date Particulars Amount
To Balance B/d 30000 By Purchases 10000
To Sales 15000 By Salaries 2000
To Ravi 8000 By Rent 3000
To Commission 3000 By Interest 5000
Total 56000 Total 20000
We see in the above account that the Debit side has total of Rs.56,000 whereas the credit side
has a total of Rs.20000. It is obvious that the debit side is heavier by Rs.36,000. Therefore it
is said that the Cash A/c has a debit balance, the balance being Rs.36000. Debit balance in
the Cash A/c (Rs.36000) implies that in the Cash A/c there is still a balance of Rs.36000 and
it is carried down (C/d) to the next period. That’s why it is written as By Balance C/d. In the
beginning of the next period it is written as to Balance B/d meaning to say that balance has
been brought down from the previous period. Suppose you are closing the account on 31st
January, the balance is carried down on that day and is shown as an opening balance in the
next period. Look at the account shown hereunder:
CASH A/C Dr. Cr.
Date Particulars Amount Date Particulars Amount
To Balance B/d 30000 By Purchases 10000
Jan 2005 To Sales 15000 Jan 2005 By Salaries 2000
To Ravi 8000 By Rent 3000
To Commission 3000 By Interest 5000
31.1.05 By Balance C/d 36000
Total 56000 Total 56000
1.2.05 To Balance b/d 36000
31
What do Debit and Credit Balances mean:
1. If a personal account shows a debit balance it means that the person is a debtor which
means he has to pay money to the firm. If it shows a credit balance he has to receive
money from the firm.
2. If Real accounts show debit balance it means that the firm owns property or asset to
the extent of balance in the account
3. If a nominal account shows a debit balance it means than an expense or loss to that
extent has been incurred by the firm and vice versa.
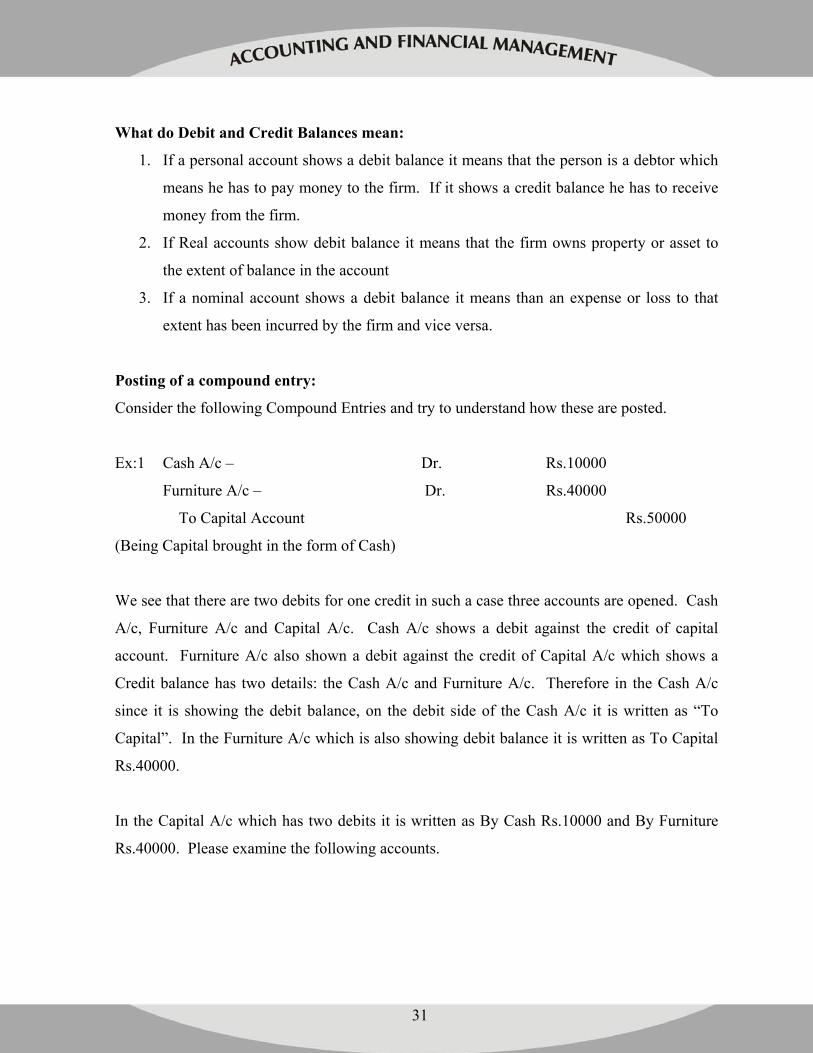
Posting of a compound entry:
Consider the following Compound Entries and try to understand how these are posted.
Ex:1 Cash A/c – Dr. Rs.10000
Furniture A/c – Dr. Rs.40000
To Capital Account Rs.50000
(Being Capital brought in the form of Cash)
We see that there are two debits for one credit in such a case three accounts are opened. Cash
A/c, Furniture A/c and Capital A/c. Cash A/c shows a debit against the credit of capital
account. Furniture A/c also shown a debit against the credit of Capital A/c which shows a
Credit balance has two details: the Cash A/c and Furniture A/c. Therefore in the Cash A/c
since it is showing the debit balance, on the debit side of the Cash A/c it is written as “To
Capital”. In the Furniture A/c which is also showing debit balance it is written as To Capital
Rs.40000.
In the Capital A/c which has two debits it is written as By Cash Rs.10000 and By Furniture
Rs.40000. Please examine the following accounts.
32
CASH A/C Dr. Cr.
Date Particulars Amount Date Particulars Amount To Capital 10000 By Purchases 10000
FURNITURE A/C Dr. Cr.
Date Particulars Amount Date Particulars Amount
To Capital 40000 By Purchases 10000
CAPITAL A/C Dr. Cr.
Date Particulars Amount Date Particulars Amount
By Cash 1000
By Furniture 40000
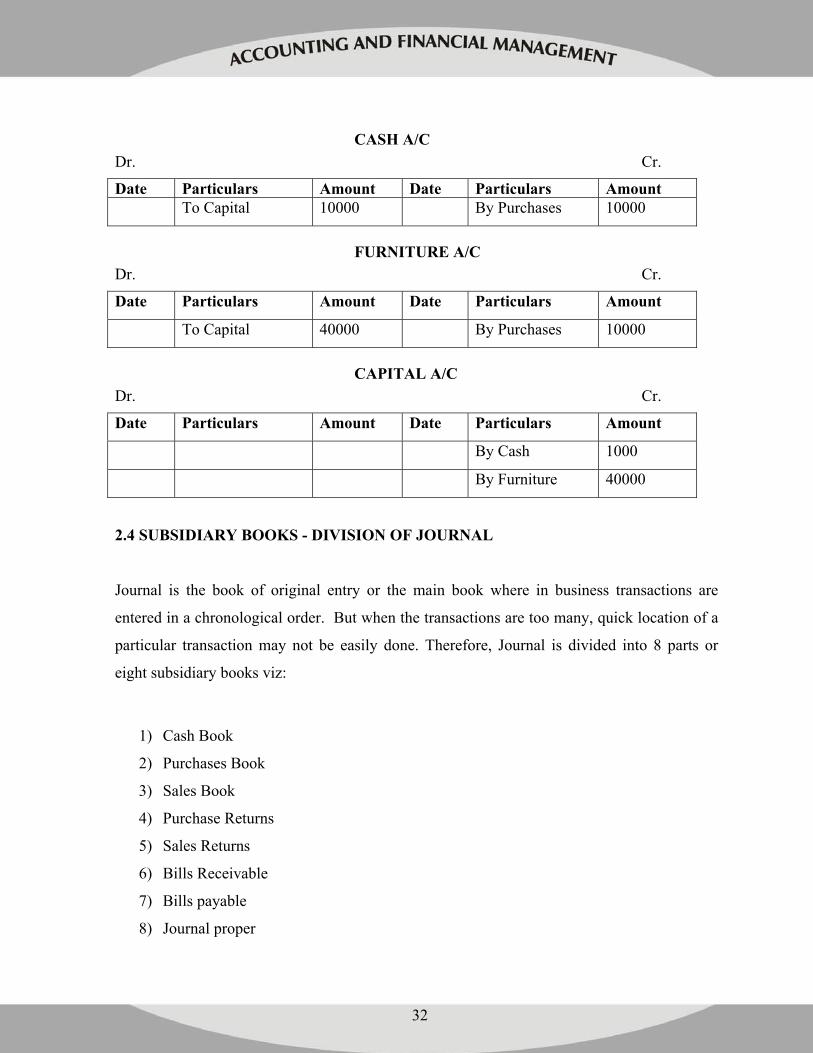
2.4 SUBSIDIARY BOOKS - DIVISION OF JOURNAL
Journal is the book of original entry or the main book where in business transactions are
entered in a chronological order. But when the transactions are too many, quick location of a
particular transaction may not be easily done. Therefore, Journal is divided into 8 parts or
eight subsidiary books viz:
1) Cash Book
2) Purchases Book
3) Sales Book
4) Purchase Returns
5) Sales Returns
6) Bills Receivable
7) Bills payable
8) Journal proper
33
Thus subsidiary books are parts or sub-divisions of a journal. The following paragraphs explain
more about the individual Subsidiary Books.
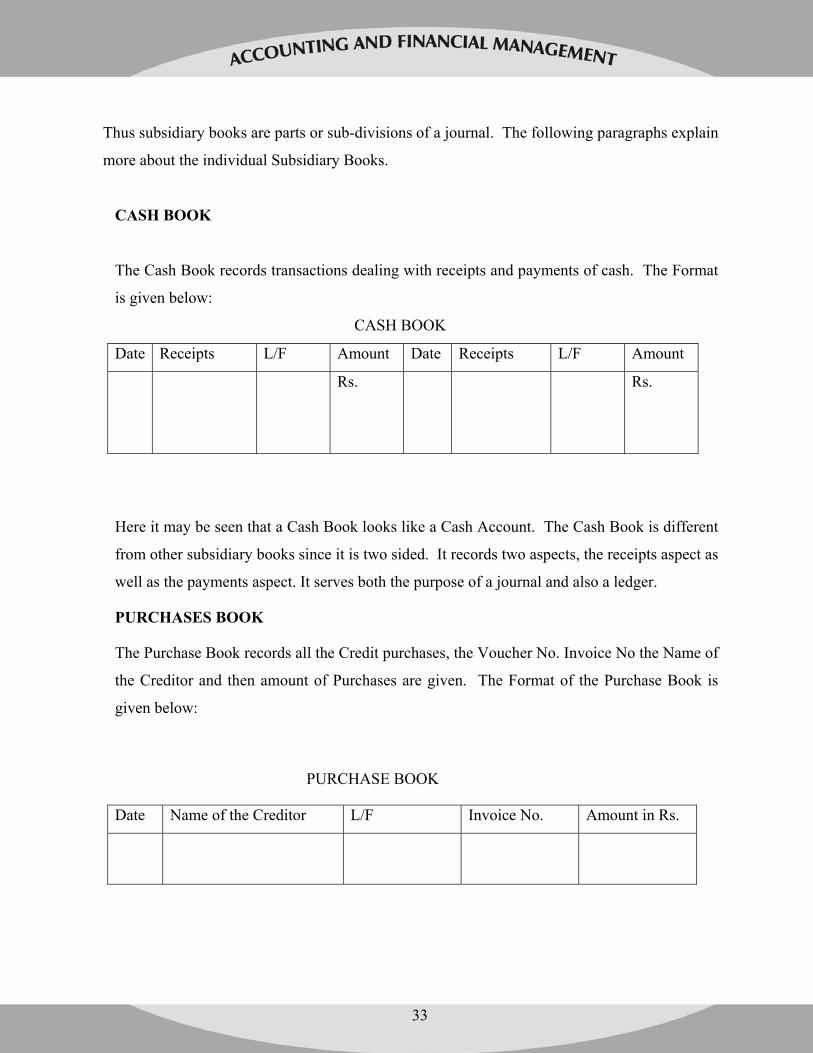
CASH BOOK
The Cash Book records transactions dealing with receipts and payments of cash. The Format
is given below:
CASH BOOK
Date Receipts L/F Amount Date Receipts L/F Amount
Rs. Rs.
Here it may be seen that a Cash Book looks like a Cash Account. The Cash Book is different
from other subsidiary books since it is two sided. It records two aspects, the receipts aspect as
well as the payments aspect. It serves both the purpose of a journal and also a ledger.
PURCHASES BOOK
The Purchase Book records all the Credit purchases, the Voucher No. Invoice No the Name of
the Creditor and then amount of Purchases are given. The Format of the Purchase Book is
given below:
PURCHASE BOOK
Date Name of the Creditor L/F Invoice No. Amount in Rs.
34
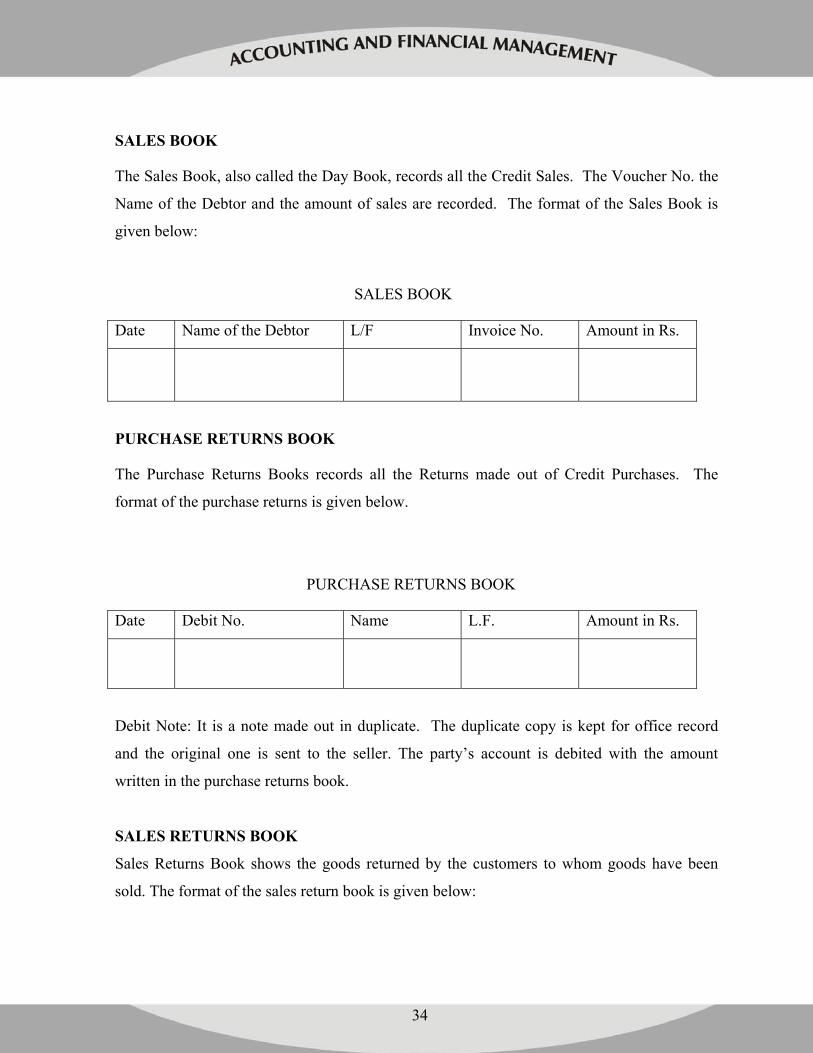
SALES BOOK
The Sales Book, also called the Day Book, records all the Credit Sales. The Voucher No. the
Name of the Debtor and the amount of sales are recorded. The format of the Sales Book is
given below:
SALES BOOK
Date Name of the Debtor L/F Invoice No. Amount in Rs.
PURCHASE RETURNS BOOK
The Purchase Returns Books records all the Returns made out of Credit Purchases. The
format of the purchase returns is given below.
PURCHASE RETURNS BOOK
Date Debit No. Name L.F. Amount in Rs.
Debit Note: It is a note made out in duplicate. The duplicate copy is kept for office record
and the original one is sent to the seller. The party’s account is debited with the amount
written in the purchase returns book.
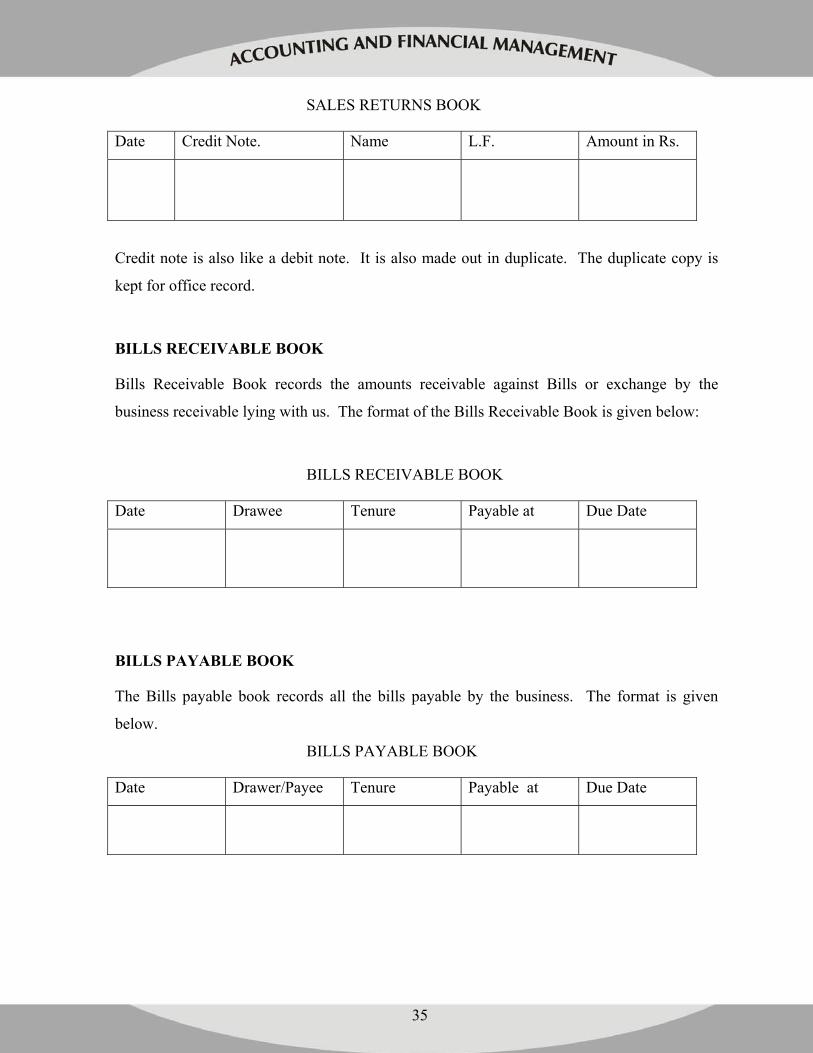
SALES RETURNS BOOK
Sales Returns Book shows the goods returned by the customers to whom goods have been
sold. The format of the sales return book is given below:
35
SALES RETURNS BOOK
Date Credit Note. Name L.F. Amount in Rs.
Credit note is also like a debit note. It is also made out in duplicate. The duplicate copy is
kept for office record.
BILLS RECEIVABLE BOOK
Bills Receivable Book records the amounts receivable against Bills or exchange by the
business receivable lying with us. The format of the Bills Receivable Book is given below:
BILLS RECEIVABLE BOOK
Date Drawee Tenure Payable at Due Date
BILLS PAYABLE BOOK
The Bills payable book records all the bills payable by the business. The format is given
below.
BILLS PAYABLE BOOK
Date Drawer/Payee Tenure Payable at Due Date
36
JOURNAL PROPER:
This books makes a record of certain special entries like opening Entries, Closing entries,
adjustment entries and rectification entries, transfer entries, Entries relating to dishonour of
promissory notes withdrawal of goods by the proprietor for personal use or loss of goods by
theft, fire etc., Credit purchase of Sale of assets; Bad debts etc., Those transactions which
cannot be entered in any of the seven specific subsidiary books, get entered in the Journal
Proper.
2.5 TRIAL BALANCE:
The fundamental principle of Double Entry System of Book Keeping is that for every debit
there must be a corresponding credit. It follows, therefore, that the sum total of debit amounts
should equal the sum total of credit amounts of ledger at any date.
Trial Balance is a statement of all the debit and credit balances. It is basically prepared to
check the arithmetical accuracy. It is prepared from the balances obtained from the Ledger.
However, it may be noted that the agreement of the Trial balance is not a conclusive proof of
accuracy. Although it points out certain errors, several errors may remain undetected even
after the preparation of the trial balance.
TRIAL BALANCE – THE LINK:
The agreement of the Trial Balance reveals that both the aspects of each transaction have been
recorded and that the books are arithmetically accurate. If the Trial Balance does not agree, it
shows that there are some errors, which must be detected and rectified before the final
accounts are prepared. Thus, Trial balance forms a connecting Link between the ledger
accounts and the final accounts. It is the third stage in the accounting cycle.
37
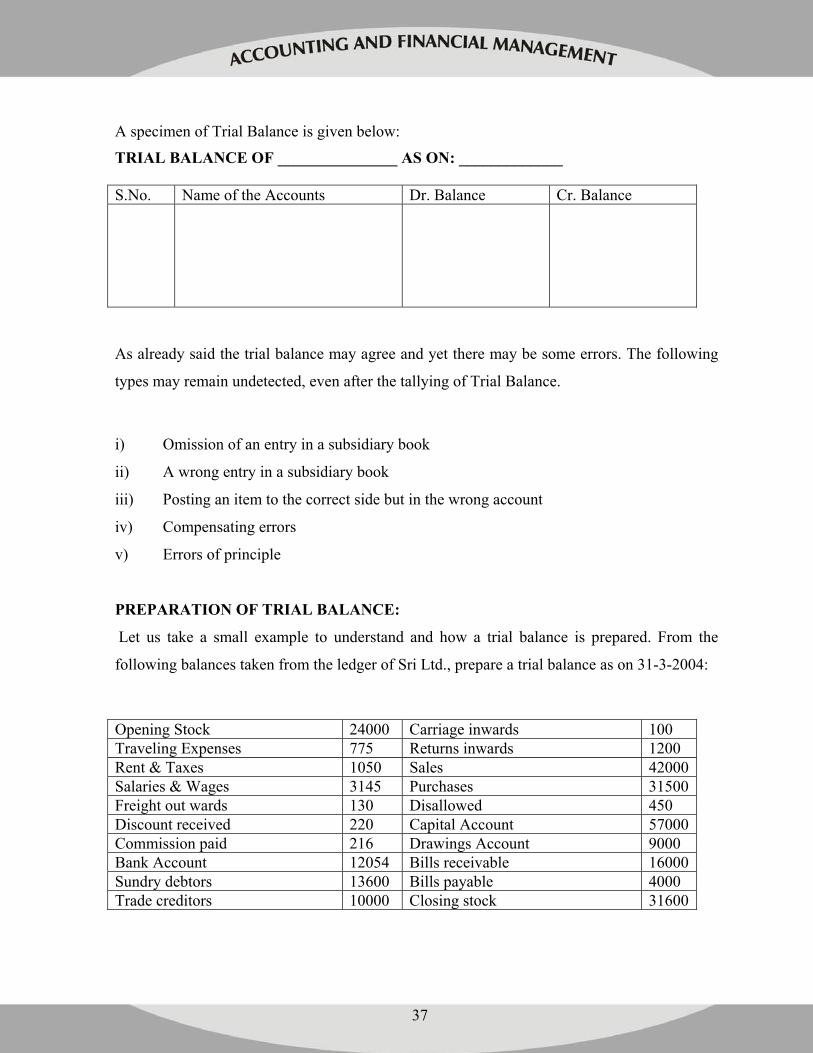
A specimen of Trial Balance is given below:
TRIAL BALANCE OF _______________ AS ON: _____________
S.No. Name of the Accounts Dr. Balance Cr. Balance
As already said the trial balance may agree and yet there may be some errors. The following
types may remain undetected, even after the tallying of Trial Balance.
i) Omission of an entry in a subsidiary book
ii) A wrong entry in a subsidiary book
iii) Posting an item to the correct side but in the wrong account
iv) Compensating errors
v) Errors of principle
PREPARATION OF TRIAL BALANCE:
Let us take a small example to understand and how a trial balance is prepared. From the
following balances taken from the ledger of Sri Ltd., prepare a trial balance as on 31-3-2004:
Opening Stock 24000 Carriage inwards 100 Traveling Expenses 775 Returns inwards 1200 Rent & Taxes 1050 Sales 42000Salaries & Wages 3145 Purchases 31500Freight out wards 130 Disallowed 450 Discount received 220 Capital Account 57000Commission paid 216 Drawings Account 9000 Bank Account 12054 Bills receivable 16000Sundry debtors 13600 Bills payable 4000 Trade creditors 10000 Closing stock 31600
38
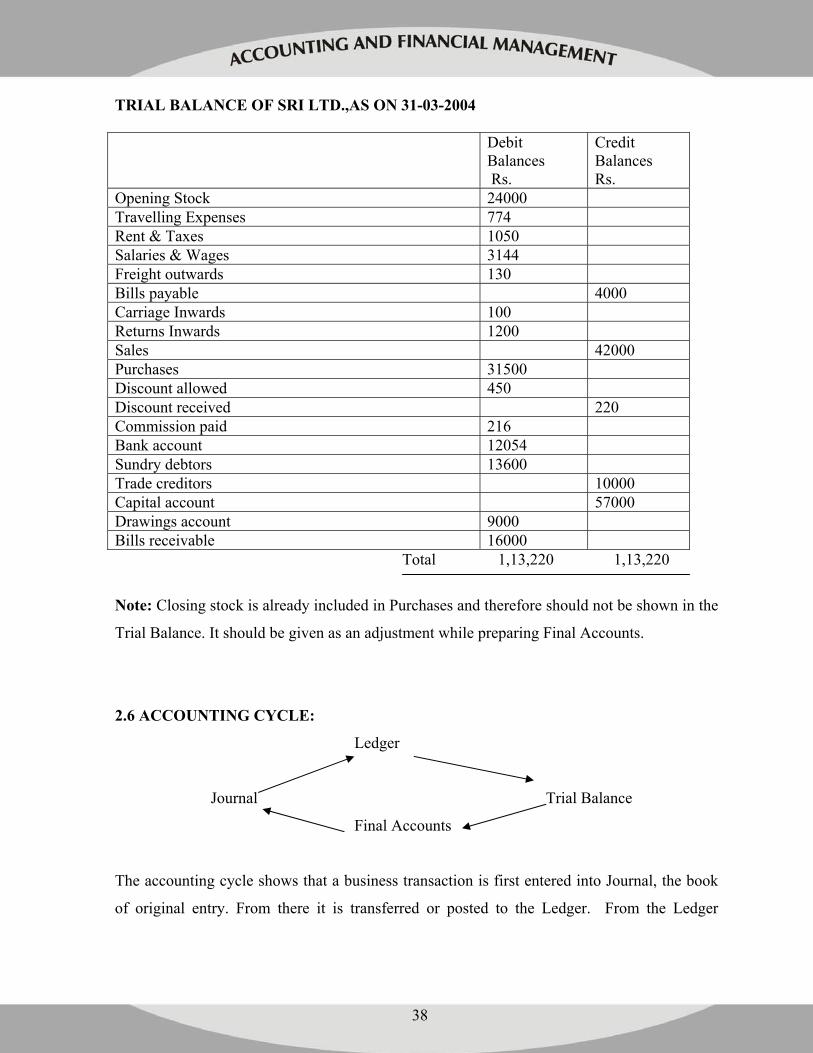
TRIAL BALANCE OF SRI LTD.,AS ON 31-03-2004 Debit
Balances Rs.
Credit Balances Rs.
Opening Stock 24000 Travelling Expenses 774 Rent & Taxes 1050 Salaries & Wages 3144 Freight outwards 130 Bills payable 4000 Carriage Inwards 100 Returns Inwards 1200 Sales 42000 Purchases 31500 Discount allowed 450 Discount received 220 Commission paid 216 Bank account 12054 Sundry debtors 13600 Trade creditors 10000 Capital account 57000 Drawings account 9000 Bills receivable 16000 Total 1,13,220 1,13,220
Note: Closing stock is already included in Purchases and therefore should not be shown in the
Trial Balance. It should be given as an adjustment while preparing Final Accounts.
2.6 ACCOUNTING CYCLE:
Ledger
Journal Trial Balance
Final Accounts
The accounting cycle shows that a business transaction is first entered into Journal, the book
of original entry. From there it is transferred or posted to the Ledger. From the Ledger
39
Balances a Trial Balance is prepared. Trial balance is a statement of debits and credits. From
these balances the Final Accounts are prepared. Thus it may be remembered that the
Accounting Cycle starts with Journal and ends with the Final Accounts. At the Journal stage
documentation of the Business transactions is done, while at the Ledger stage account wise
information is obtained and summarized and at the Trial Balance stage List of Debit and
Credit balances is obtained to check the arithmetical accuracy and at the final accounting
stage the profit or loss position of the business is found out.
2.7 SUMMARY:
Maintaining a systematic record of all transaction is called book-keeping and when such
record-keeping moves on to classifying and summarizing, preparation of final reports and
their interpretation, we call it accounting. Journal is the book wherein a business transaction
is first written or recorded and therefore it is also known as book of Original Entry. Steps to
be followed while journalizing are: Identify the accounts being affected in the transaction;
Categorize them into real, nominal and personal and; apply the relevant rules of debit and
credit. Ledger is a book where account wise information is documented. While the Journal
gives data in chronological form, the ledger gives account wise information. All the
transactions related to a particular account are put at one place .
Journal is the book of original entry or the main book where in business transactions are
entered in a chronological order. But when there are too many transactions, Journal is divided
into 8 parts or eight subsidiary books. Thus subsidiary books are parts or sub-divisions of a
journal. Trial Balance is a statement of all the debit and credit balances. It is basically
prepared to check the arithmetical accuracy. It is prepared from the balances obtained from
the Ledger.
2.8 KEY WORDS: Journal Journalising
Narration Real Account
Nominal Account Personal Account
Ledger Ledger Posting
40
Balancing Debit Balance
Credit Balance Subsidiary Books
Trial Balance
Try Yourself:
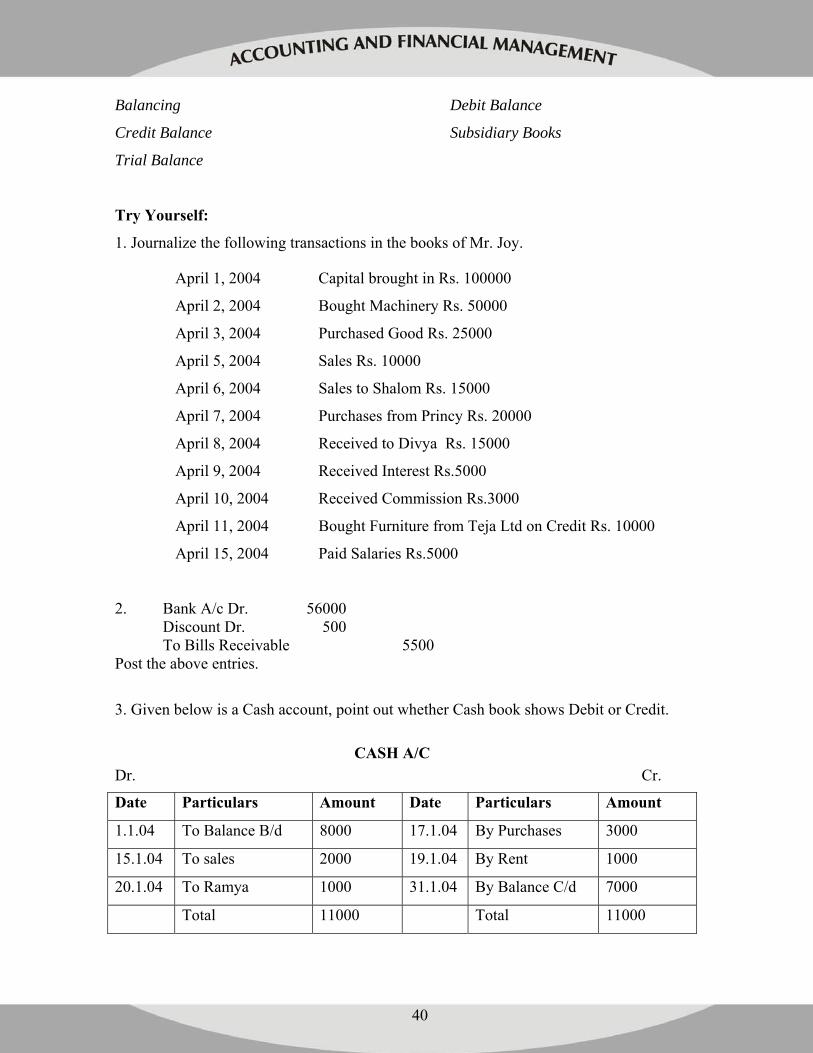
1. Journalize the following transactions in the books of Mr. Joy.
April 1, 2004 Capital brought in Rs. 100000
April 2, 2004 Bought Machinery Rs. 50000
April 3, 2004 Purchased Good Rs. 25000
April 5, 2004 Sales Rs. 10000
April 6, 2004 Sales to Shalom Rs. 15000
April 7, 2004 Purchases from Princy Rs. 20000
April 8, 2004 Received to Divya Rs. 15000
April 9, 2004 Received Interest Rs.5000
April 10, 2004 Received Commission Rs.3000
April 11, 2004 Bought Furniture from Teja Ltd on Credit Rs. 10000
April 15, 2004 Paid Salaries Rs.5000
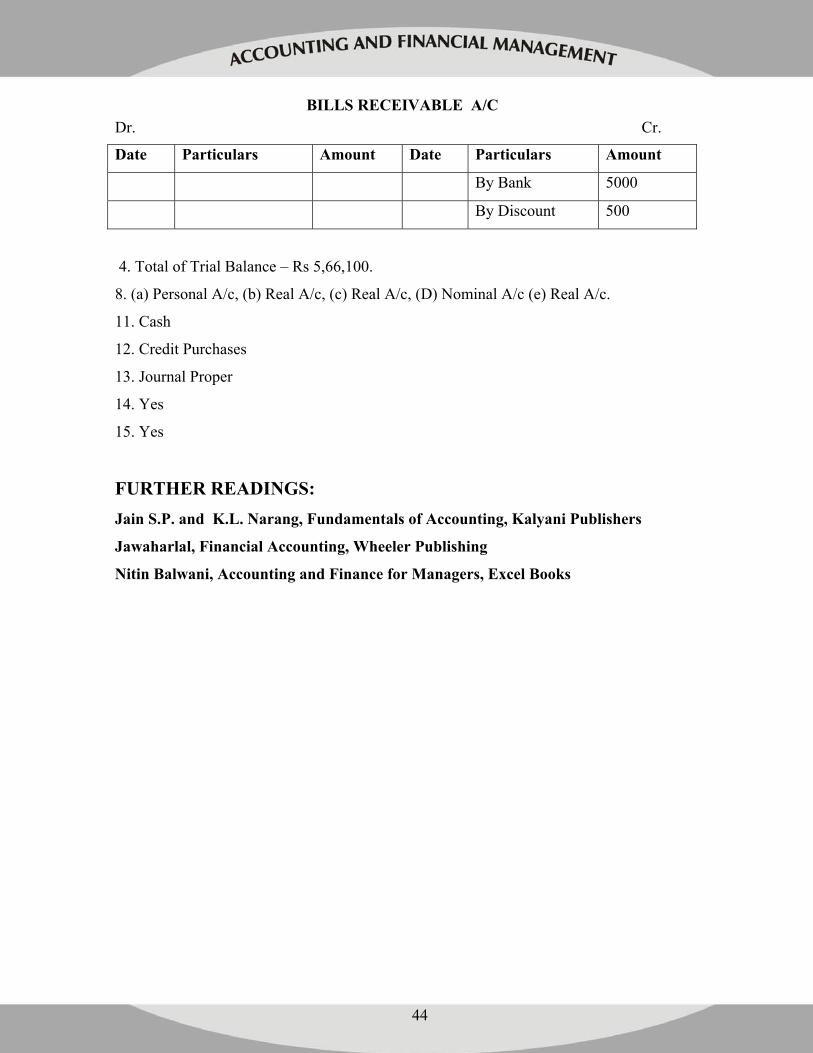
2. Bank A/c Dr. 56000 Discount Dr. 500 To Bills Receivable 5500 Post the above entries.
3. Given below is a Cash account, point out whether Cash book shows Debit or Credit.
CASH A/C Dr. Cr.
Date Particulars Amount Date Particulars Amount
1.1.04 To Balance B/d 8000 17.1.04 By Purchases 3000
15.1.04 To sales 2000 19.1.04 By Rent 1000
20.1.04 To Ramya 1000 31.1.04 By Balance C/d 7000
Total 11000 Total 11000
41
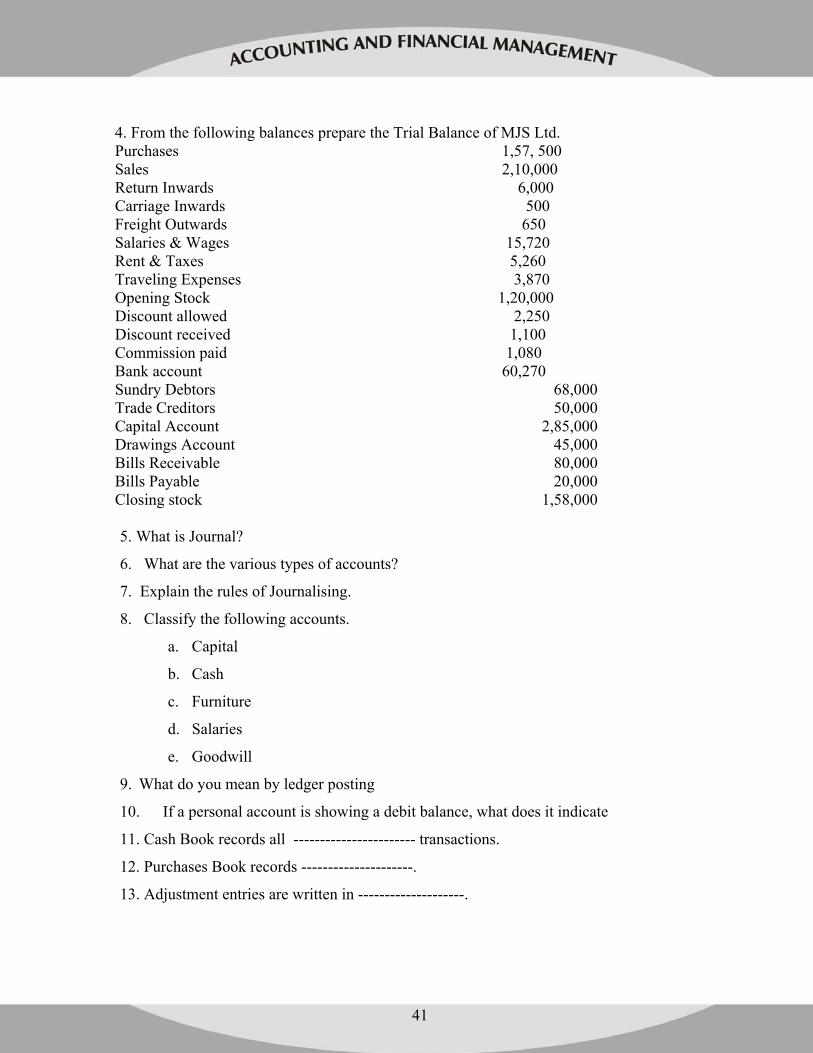
4. From the following balances prepare the Trial Balance of MJS Ltd. Purchases 1,57, 500 Sales 2,10,000 Return Inwards 6,000 Carriage Inwards 500 Freight Outwards 650 Salaries & Wages 15,720 Rent & Taxes 5,260 Traveling Expenses 3,870 Opening Stock 1,20,000 Discount allowed 2,250 Discount received 1,100 Commission paid 1,080 Bank account 60,270 Sundry Debtors 68,000 Trade Creditors 50,000 Capital Account 2,85,000 Drawings Account 45,000 Bills Receivable 80,000 Bills Payable 20,000 Closing stock 1,58,000 5. What is Journal?
6. What are the various types of accounts?
7. Explain the rules of Journalising.
8. Classify the following accounts.
a. Capital
b. Cash
c. Furniture
d. Salaries
e. Goodwill
9. What do you mean by ledger posting
10. If a personal account is showing a debit balance, what does it indicate
11. Cash Book records all ----------------------- transactions.
12. Purchases Book records ---------------------.
13. Adjustment entries are written in --------------------.
42
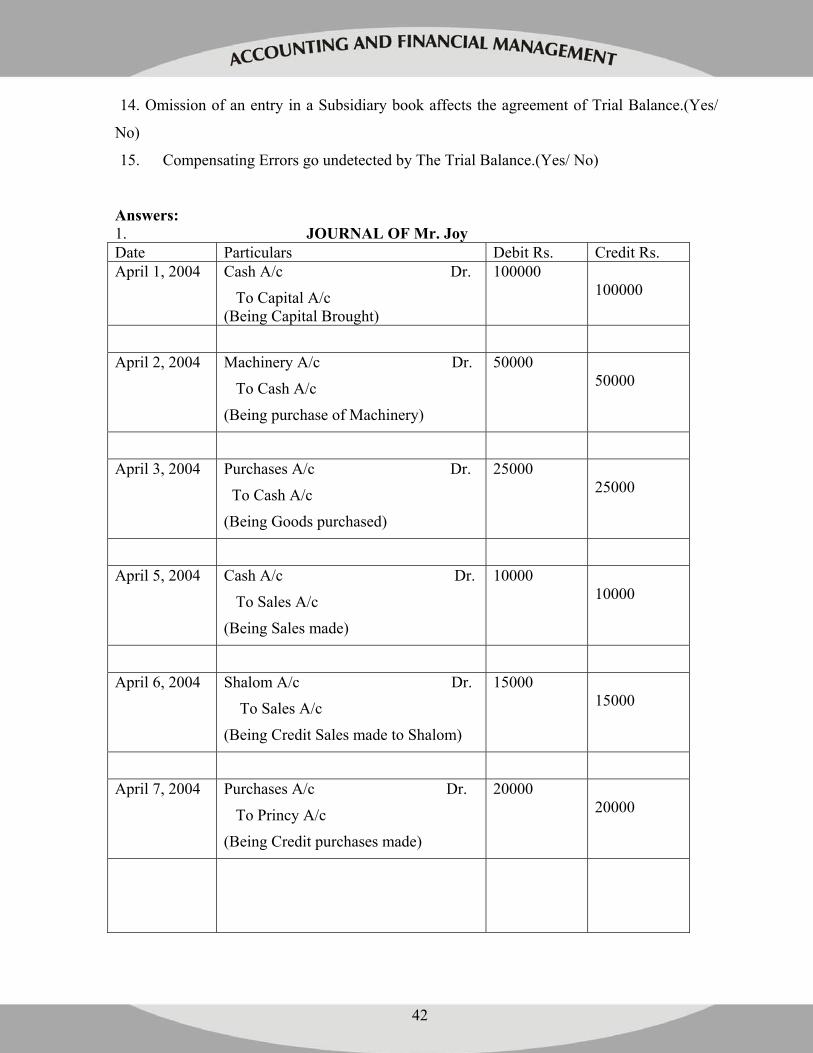
14. Omission of an entry in a Subsidiary book affects the agreement of Trial Balance.(Yes/
No)
15. Compensating Errors go undetected by The Trial Balance.(Yes/ No)
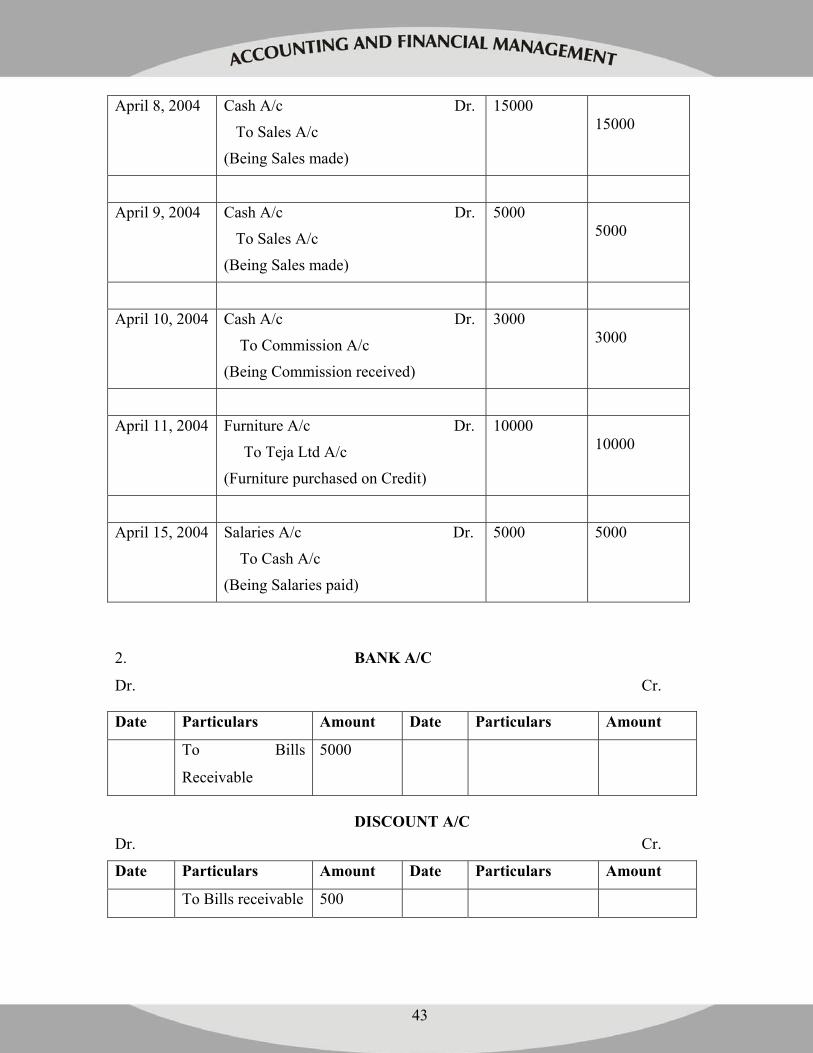
Answers: 1. JOURNAL OF Mr. Joy Date Particulars Debit Rs. Credit Rs. April 1, 2004 Cash A/c Dr.
To Capital A/c (Being Capital Brought)
100000 100000
April 2, 2004 Machinery A/c Dr.
To Cash A/c
(Being purchase of Machinery)
50000 50000
April 3, 2004 Purchases A/c Dr.
To Cash A/c
(Being Goods purchased)
25000 25000
April 5, 2004 Cash A/c Dr.
To Sales A/c
(Being Sales made)
10000 10000
April 6, 2004 Shalom A/c Dr.
To Sales A/c
(Being Credit Sales made to Shalom)
15000 15000
April 7, 2004 Purchases A/c Dr.
To Princy A/c
(Being Credit purchases made)
20000 20000
43
April 8, 2004 Cash A/c Dr.
To Sales A/c
(Being Sales made)
15000 15000
April 9, 2004 Cash A/c Dr.
To Sales A/c
(Being Sales made)
5000 5000
April 10, 2004 Cash A/c Dr.
To Commission A/c
(Being Commission received)
3000 3000
April 11, 2004 Furniture A/c Dr.
To Teja Ltd A/c
(Furniture purchased on Credit)
10000 10000
April 15, 2004 Salaries A/c Dr.
To Cash A/c
(Being Salaries paid)
5000 5000
2. BANK A/C
Dr. Cr.
Date Particulars Amount Date Particulars Amount
To Bills
Receivable
5000
DISCOUNT A/C Dr. Cr.
Date Particulars Amount Date Particulars Amount
To Bills receivable 500
44
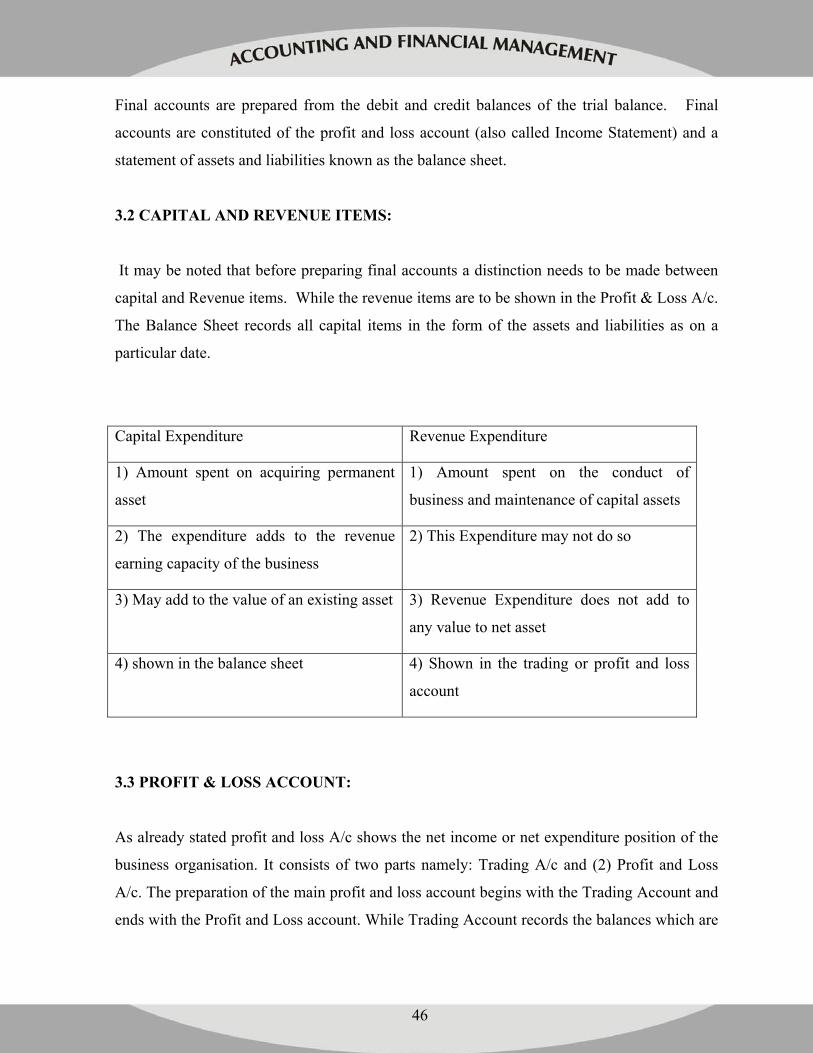
BILLS RECEIVABLE A/C Dr. Cr.
Date Particulars Amount Date Particulars Amount
By Bank 5000
By Discount 500
4. Total of Trial Balance – Rs 5,66,100.
8. (a) Personal A/c, (b) Real A/c, (c) Real A/c, (D) Nominal A/c (e) Real A/c.
11. Cash
12. Credit Purchases
13. Journal Proper
14. Yes
15. Yes
FURTHER READINGS: Jain S.P. and K.L. Narang, Fundamentals of Accounting, Kalyani Publishers
Jawaharlal, Financial Accounting, Wheeler Publishing
Nitin Balwani, Accounting and Finance for Managers, Excel Books
45
LESSON 3
ACCOUNTING CYCLE-II (FINAL ACCOUNTS)
STRUCTURE:
3.1 Introduction
3.2 Capital and Revenue Items
3.3 Profit & Loss Account
3.4 Balance Sheet
3.5 Adjustments
3.6 Summary
3.7 Key Words
3.1 INTRODUCTION:
The final stage in the accounting cycle is the preparation of final accounts. It is common
knowledge that the ultimate objective of maintaining accounts is to find out profit or loss
position and also the financial position of the organization concerned.
OBJECTIVES
To be able to appreciate the need for preparation of Final Accounts.
To be able to prepare the Trading A/c
To be able to prepare the Profit and Loss A/c
To be able to prepare the Balance Sheet
46
Final accounts are prepared from the debit and credit balances of the trial balance. Final
accounts are constituted of the profit and loss account (also called Income Statement) and a
statement of assets and liabilities known as the balance sheet.
3.2 CAPITAL AND REVENUE ITEMS:
It may be noted that before preparing final accounts a distinction needs to be made between
capital and Revenue items. While the revenue items are to be shown in the Profit & Loss A/c.
The Balance Sheet records all capital items in the form of the assets and liabilities as on a
particular date.
Capital Expenditure Revenue Expenditure
1) Amount spent on acquiring permanent
asset
1) Amount spent on the conduct of
business and maintenance of capital assets
2) The expenditure adds to the revenue
earning capacity of the business
2) This Expenditure may not do so
3) May add to the value of an existing asset 3) Revenue Expenditure does not add to
any value to net asset
4) shown in the balance sheet 4) Shown in the trading or profit and loss
account
3.3 PROFIT & LOSS ACCOUNT:
As already stated profit and loss A/c shows the net income or net expenditure position of the
business organisation. It consists of two parts namely: Trading A/c and (2) Profit and Loss
A/c. The preparation of the main profit and loss account begins with the Trading Account and
ends with the Profit and Loss account. While Trading Account records the balances which are
47
directly related to the manufacturing the product, the profit and loss account records the
expenses and incomes and expenses, profits and losses which are related to the business but
not directly related to the making of the product saleable.
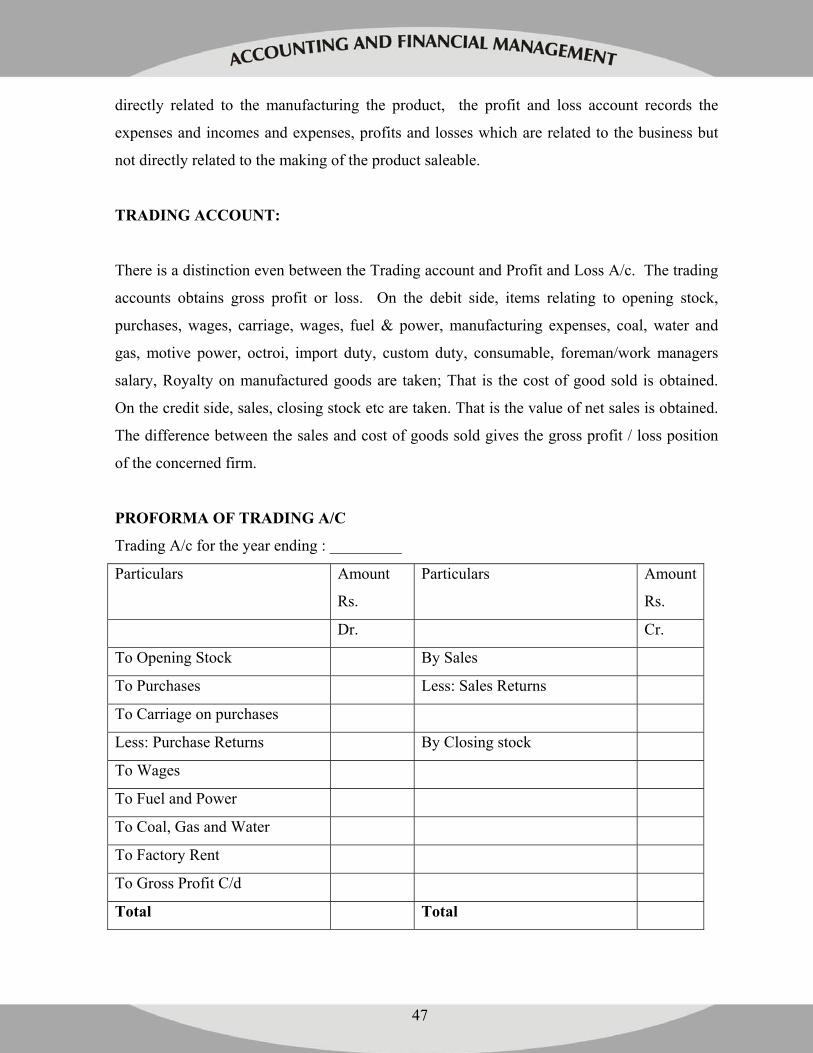
TRADING ACCOUNT:
There is a distinction even between the Trading account and Profit and Loss A/c. The trading
accounts obtains gross profit or loss. On the debit side, items relating to opening stock,
purchases, wages, carriage, wages, fuel & power, manufacturing expenses, coal, water and
gas, motive power, octroi, import duty, custom duty, consumable, foreman/work managers
salary, Royalty on manufactured goods are taken; That is the cost of good sold is obtained.
On the credit side, sales, closing stock etc are taken. That is the value of net sales is obtained.
The difference between the sales and cost of goods sold gives the gross profit / loss position
of the concerned firm.
PROFORMA OF TRADING A/C
Trading A/c for the year ending : _________
Particulars Amount
Rs.
Particulars Amount
Rs.
Dr. Cr.
To Opening Stock By Sales
To Purchases Less: Sales Returns
To Carriage on purchases
Less: Purchase Returns By Closing stock
To Wages
To Fuel and Power
To Coal, Gas and Water
To Factory Rent
To Gross Profit C/d
Total Total
48
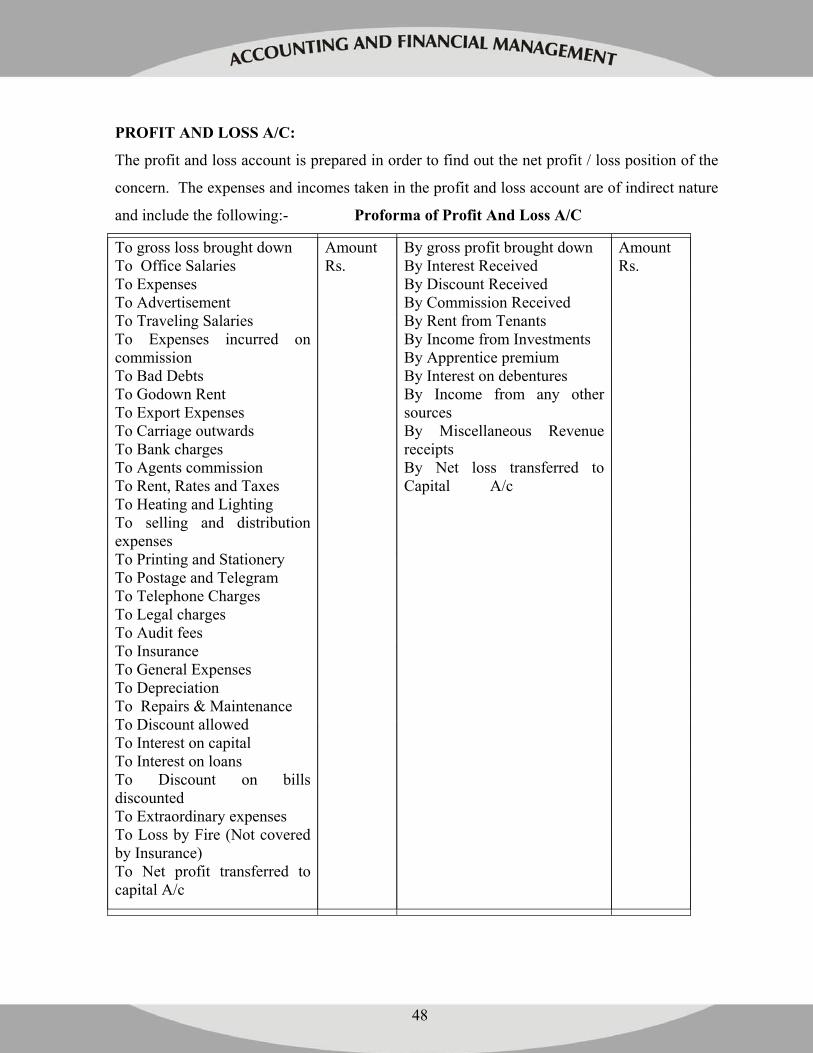
PROFIT AND LOSS A/C:
The profit and loss account is prepared in order to find out the net profit / loss position of the
concern. The expenses and incomes taken in the profit and loss account are of indirect nature
and include the following:- Proforma of Profit And Loss A/C
To gross loss brought down To Office Salaries To Expenses To Advertisement To Traveling Salaries To Expenses incurred on commission To Bad Debts To Godown Rent To Export Expenses To Carriage outwards To Bank charges To Agents commission To Rent, Rates and Taxes To Heating and Lighting To selling and distribution expenses To Printing and Stationery To Postage and Telegram To Telephone Charges To Legal charges To Audit fees To Insurance To General Expenses To Depreciation To Repairs & Maintenance To Discount allowed To Interest on capital To Interest on loans To Discount on bills discounted To Extraordinary expenses To Loss by Fire (Not covered by Insurance) To Net profit transferred to capital A/c
Amount Rs.
By gross profit brought down By Interest Received By Discount Received By Commission Received By Rent from Tenants By Income from Investments By Apprentice premium By Interest on debentures By Income from any other sources By Miscellaneous Revenue receipts By Net loss transferred to Capital A/c
Amount Rs.
49
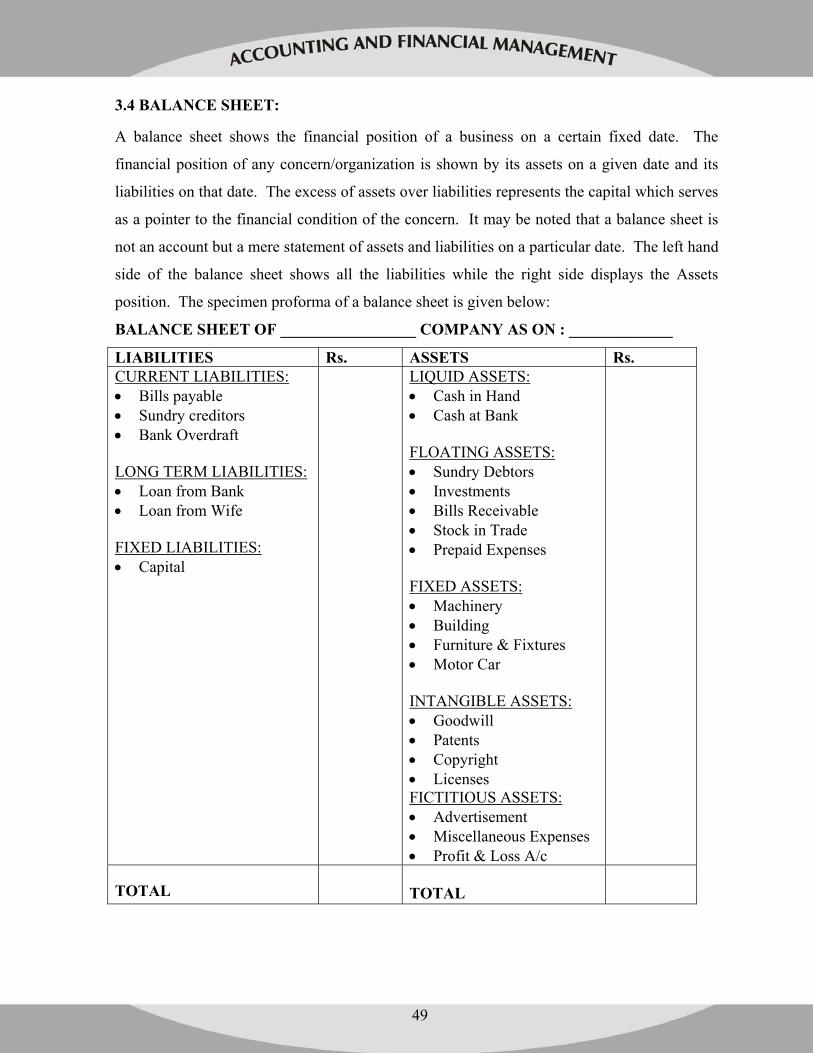
3.4 BALANCE SHEET:
A balance sheet shows the financial position of a business on a certain fixed date. The
financial position of any concern/organization is shown by its assets on a given date and its
liabilities on that date. The excess of assets over liabilities represents the capital which serves
as a pointer to the financial condition of the concern. It may be noted that a balance sheet is
not an account but a mere statement of assets and liabilities on a particular date. The left hand
side of the balance sheet shows all the liabilities while the right side displays the Assets
position. The specimen proforma of a balance sheet is given below:
BALANCE SHEET OF _________________ COMPANY AS ON : _____________
LIABILITIES Rs. ASSETS Rs. CURRENT LIABILITIES: • Bills payable • Sundry creditors • Bank Overdraft LONG TERM LIABILITIES: • Loan from Bank • Loan from Wife FIXED LIABILITIES: • Capital
LIQUID ASSETS: • Cash in Hand • Cash at Bank FLOATING ASSETS: • Sundry Debtors • Investments • Bills Receivable • Stock in Trade • Prepaid Expenses FIXED ASSETS: • Machinery • Building • Furniture & Fixtures • Motor Car INTANGIBLE ASSETS: • Goodwill • Patents • Copyright • Licenses FICTITIOUS ASSETS: • Advertisement • Miscellaneous Expenses • Profit & Loss A/c
TOTAL
TOTAL
50
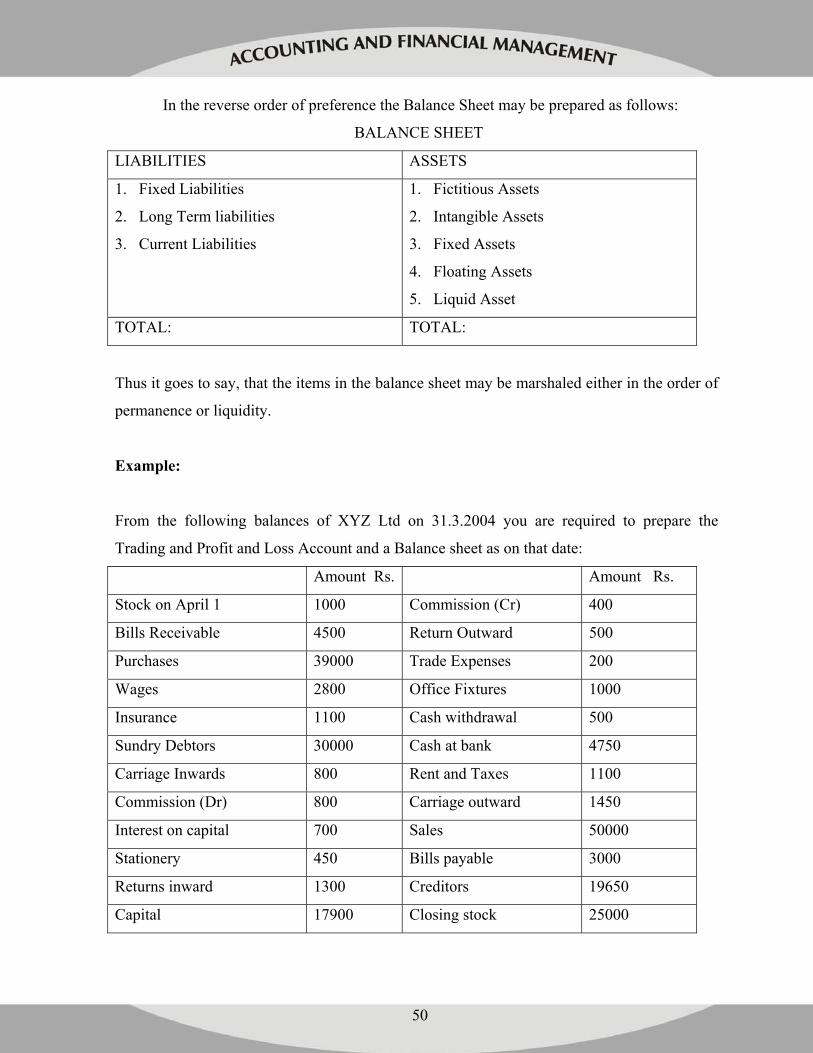
In the reverse order of preference the Balance Sheet may be prepared as follows:
BALANCE SHEET
LIABILITIES ASSETS
1. Fixed Liabilities
2. Long Term liabilities
3. Current Liabilities
1. Fictitious Assets
2. Intangible Assets
3. Fixed Assets
4. Floating Assets
5. Liquid Asset
TOTAL: TOTAL:
Thus it goes to say, that the items in the balance sheet may be marshaled either in the order of
permanence or liquidity.
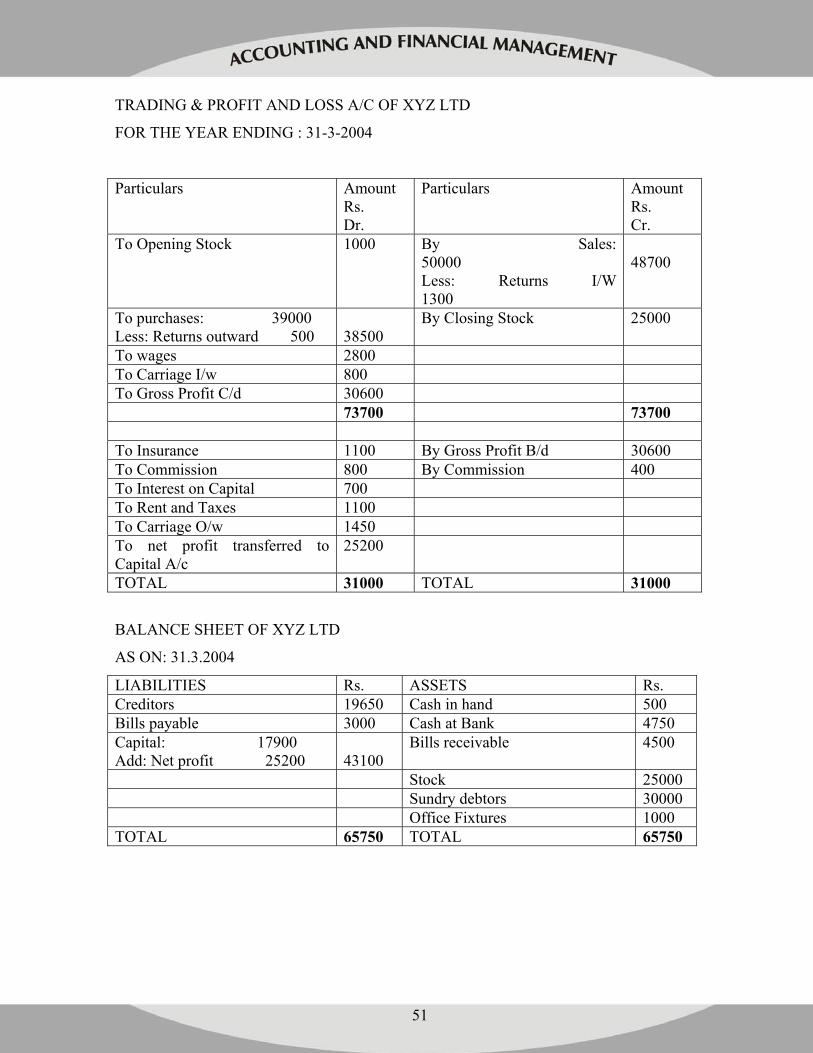
Example:
From the following balances of XYZ Ltd on 31.3.2004 you are required to prepare the
Trading and Profit and Loss Account and a Balance sheet as on that date:
Amount Rs. Amount Rs.
Stock on April 1 1000 Commission (Cr) 400
Bills Receivable 4500 Return Outward 500
Purchases 39000 Trade Expenses 200
Wages 2800 Office Fixtures 1000
Insurance 1100 Cash withdrawal 500
Sundry Debtors 30000 Cash at bank 4750
Carriage Inwards 800 Rent and Taxes 1100
Commission (Dr) 800 Carriage outward 1450
Interest on capital 700 Sales 50000
Stationery 450 Bills payable 3000
Returns inward 1300 Creditors 19650
Capital 17900 Closing stock 25000
51
TRADING & PROFIT AND LOSS A/C OF XYZ LTD
FOR THE YEAR ENDING : 31-3-2004
Particulars Amount Rs. Dr.
Particulars Amount Rs. Cr.
To Opening Stock 1000 By Sales: 50000 Less: Returns I/W 1300
48700
To purchases: 39000 Less: Returns outward 500
38500
By Closing Stock 25000
To wages 2800 To Carriage I/w 800 To Gross Profit C/d 30600 73700 73700 To Insurance 1100 By Gross Profit B/d 30600 To Commission 800 By Commission 400 To Interest on Capital 700 To Rent and Taxes 1100 To Carriage O/w 1450 To net profit transferred to Capital A/c
25200
TOTAL 31000 TOTAL 31000
BALANCE SHEET OF XYZ LTD
AS ON: 31.3.2004
LIABILITIES Rs. ASSETS Rs. Creditors 19650 Cash in hand 500 Bills payable 3000 Cash at Bank 4750 Capital: 17900 Add: Net profit 25200
43100
Bills receivable 4500
Stock 25000 Sundry debtors 30000 Office Fixtures 1000 TOTAL 65750 TOTAL 65750
52
3.5 ADJUSTMENTS:
Bits of information which are received/discovered after the preparation of Trial Balance have
to be accommodated into financial statements. They are, therefore called adjustments. It may
be remembered that sometimes adjustments thus need to be made in the final accounts. Since
the adjustments are given after the trial balance is prepared, they have to be given the two fold
effect. Once they appear in the trading/profit and loss account and the second time in the
balance sheet. These adjustments enable the firm to make its accounts fall in line with the
matching and such other concepts whichmake the final statements of account to reflect the
true and fair view of the affairs of the business. Treatment for some of the adjustments is
given below:
Closing Stock:
This may be shown on the credit side of the Trading account and the Second time on the asset
side of the balance sheet.
Outstanding Expenses:
These are expenses due to be paid but not paid. These expenses should be added to the
amounts already paid and shown in the trading account or the profit and loss account
depending upon whether it is a direct expenditure or indirect expenditure. For Eg:
outstanding wages should be added to “Wages” in Trading account and if it is outstanding
salary should be added to “Salary” account in the profit and loss account. The second effect
is that should it should be shown on the liability side of balance sheet.
Prepaid (Unexpired) Expenses:
These are expenses paid in advance and therefore should be deducted from the respective
expenditure on the debit side of Trading and profit and loss a/c and then shown on the asset
side of the balance sheet. For instance if insurance is prepaid, it should be deducted from
Insurance on the debit side of profit and loss account and should be shown on the asset side of
the Balance sheet as prepaid insurance.
53
Accrued Income:
That income which has been earned but not received during the accounting year is called
accrued income. Such income needs to be added to the respective income on the credit side
of the profit and loss and again on the asset side of the balance sheet.
Income Received In Advance:
Income received but not earned during the accounting year is known as Income received in
Advance. This should be deducted from the respective income in the profit and loss a/c and
should be shown in the balance sheet as a liability.
Depreciation:
This is reduction in the value of the fixed Asset and is usually calculated as a percentage of
the assets. The amount of depreciation is shown on the debit side of profit and loss account
and is to be deducted from the respective asset value in the balance sheet.
Bad Debts:
Debts which cannot be recovered or become irrecoverable are called bad debts. Since this is a
loss for the business it is shown on the debit side of the Profit and Loss account and deducted
from Sundry Debtors on the asset side of the Balance sheet.
Interest on Capital:
This is calculated as a percentage on capital and is shown on the debit side of Profit and Loss
account and added to capital on the liability side of the Balance sheet.
Interest on Drawings:
The two fold effect of this adjustment is that it will be shown on the credit side of profit and
loss account and is added to the amount of drawings on the liability side of the Balance sheet.
Provision for Doubtful Debts:
This is a provision maintained to meet doubtful debts. It is usually calculated as a percentage
on sundry debtors and is shown on the debit side of profit and loss account and is deducted
from sundry Debtors on the asset side of the Balance sheet.
Provision for Discount on Debtors:
In order to encourage prompt payment, discount is given to debtors. To meet the expenses of
discount a provision is maintained on debtors. This provision, known as Discount on Debtors
54
is shown on the debit side of the profit and loss account and is deducted from sundry debtors
on the asset side of the balance sheet.
Provision for Discount on Creditors:
This is calculated as a percentage on creditors and is shown on the credit side of Profit and
Loss account and is deducted from sundry creditors on the liability side of the Balance sheet.
Deferred Revenue Expenditure:
Advertisement expenditure is the best example for deferred revenue expenditure. A huge
amount may be spent on advertisement in a single year but the benefits of such advertisements
may be spread over the ensuing years too. Therefore only a part of such expenditure will be
written off each year. The written off expenditure is shown on the debit side of profit and loss
account and the unwritten part of the expenditure is shown on the asset side. Such unwritten
off portions of deferred revenue expenditure from fictitious assets.
Manager’s Commission:
Manager’s Commission may be given at a certain percentage (say 5%) on the net profit (say
Rs.50000) before charging such commission; In such a case commission is calculated as
follows:
Net Profit x Rate of Commission
= 50000 x 5/100 = Rs.2500
But sometimes it is given as after charging such commission, In such a case
commission is calculated as given below:
Profit x % of commission 50000 x 5
------------------------------ ------------ =Rs. 2380.95
100 + % of commission 100 + 5
This commission needs to be put on the debit side of the profit and loss account and is shown
as a liability in the Balance sheet.
55
Reserve Fund:
Reserve is created out of profit and loss account. It is shown on the debit side of profit and
loss account and is also shown on the liability side of the Balance sheet.
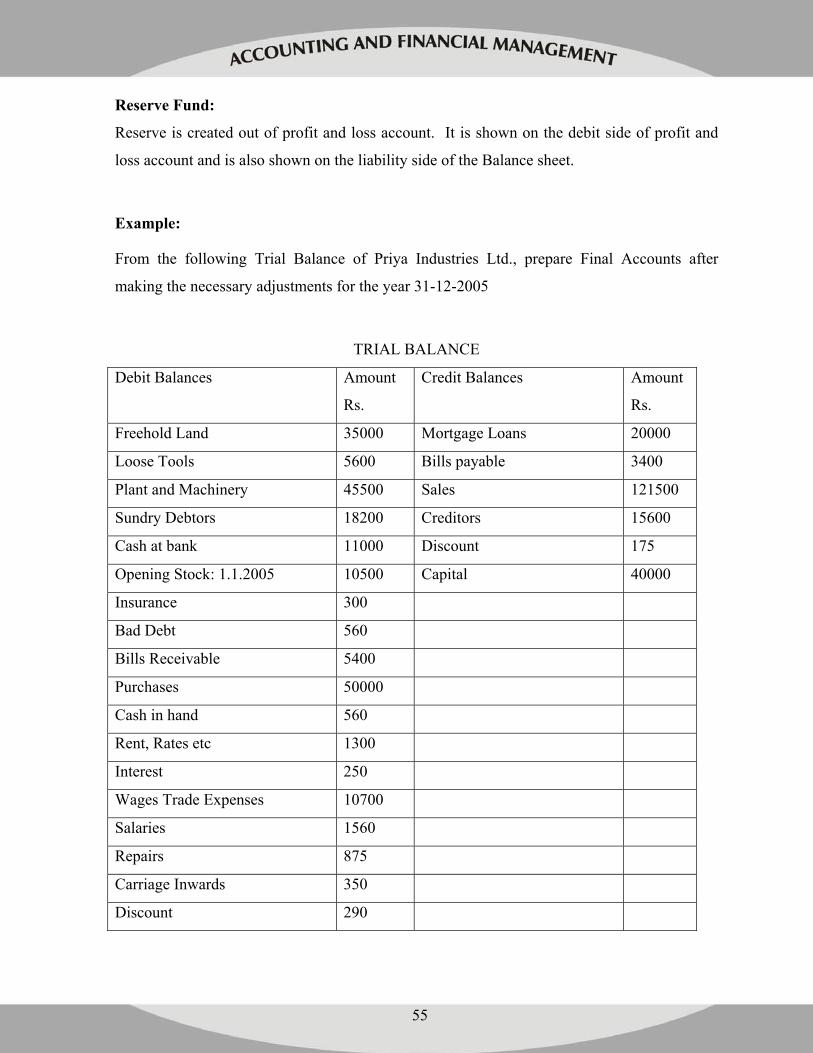
Example:
From the following Trial Balance of Priya Industries Ltd., prepare Final Accounts after
making the necessary adjustments for the year 31-12-2005
TRIAL BALANCE
Debit Balances Amount
Rs.
Credit Balances Amount
Rs.
Freehold Land 35000 Mortgage Loans 20000
Loose Tools 5600 Bills payable 3400
Plant and Machinery 45500 Sales 121500
Sundry Debtors 18200 Creditors 15600
Cash at bank 11000 Discount 175
Opening Stock: 1.1.2005 10500 Capital 40000
Insurance 300
Bad Debt 560
Bills Receivable 5400
Purchases 50000
Cash in hand 560
Rent, Rates etc 1300
Interest 250
Wages Trade Expenses 10700
Salaries 1560
Repairs 875
Carriage Inwards 350
Discount 290
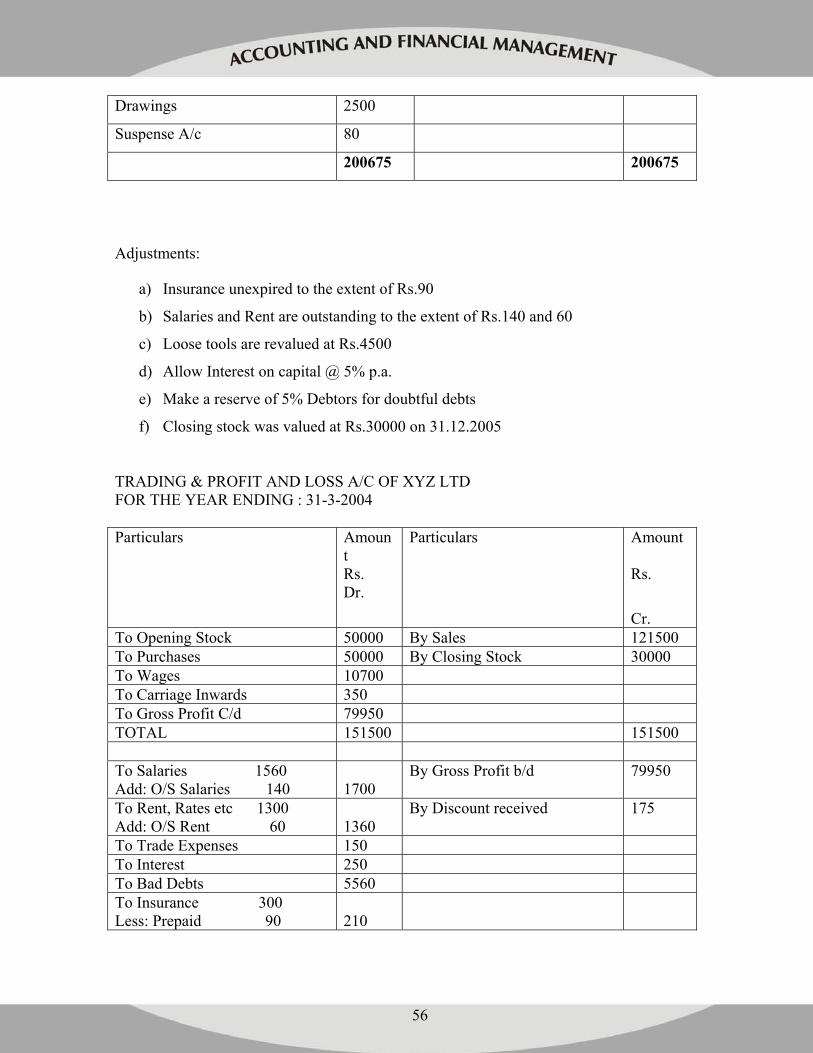
56
Drawings 2500
Suspense A/c 80
200675 200675
Adjustments:
a) Insurance unexpired to the extent of Rs.90
b) Salaries and Rent are outstanding to the extent of Rs.140 and 60
c) Loose tools are revalued at Rs.4500
d) Allow Interest on capital @ 5% p.a.
e) Make a reserve of 5% Debtors for doubtful debts
f) Closing stock was valued at Rs.30000 on 31.12.2005
TRADING & PROFIT AND LOSS A/C OF XYZ LTD FOR THE YEAR ENDING : 31-3-2004 Particulars Amoun
t Rs. Dr.
Particulars Amount
Rs.
Cr. To Opening Stock 50000 By Sales 121500 To Purchases 50000 By Closing Stock 30000 To Wages 10700 To Carriage Inwards 350 To Gross Profit C/d 79950 TOTAL 151500 151500 To Salaries 1560 Add: O/S Salaries 140
1700
By Gross Profit b/d 79950
To Rent, Rates etc 1300 Add: O/S Rent 60
1360
By Discount received 175
To Trade Expenses 150 To Interest 250 To Bad Debts 5560 To Insurance 300 Less: Prepaid 90
210
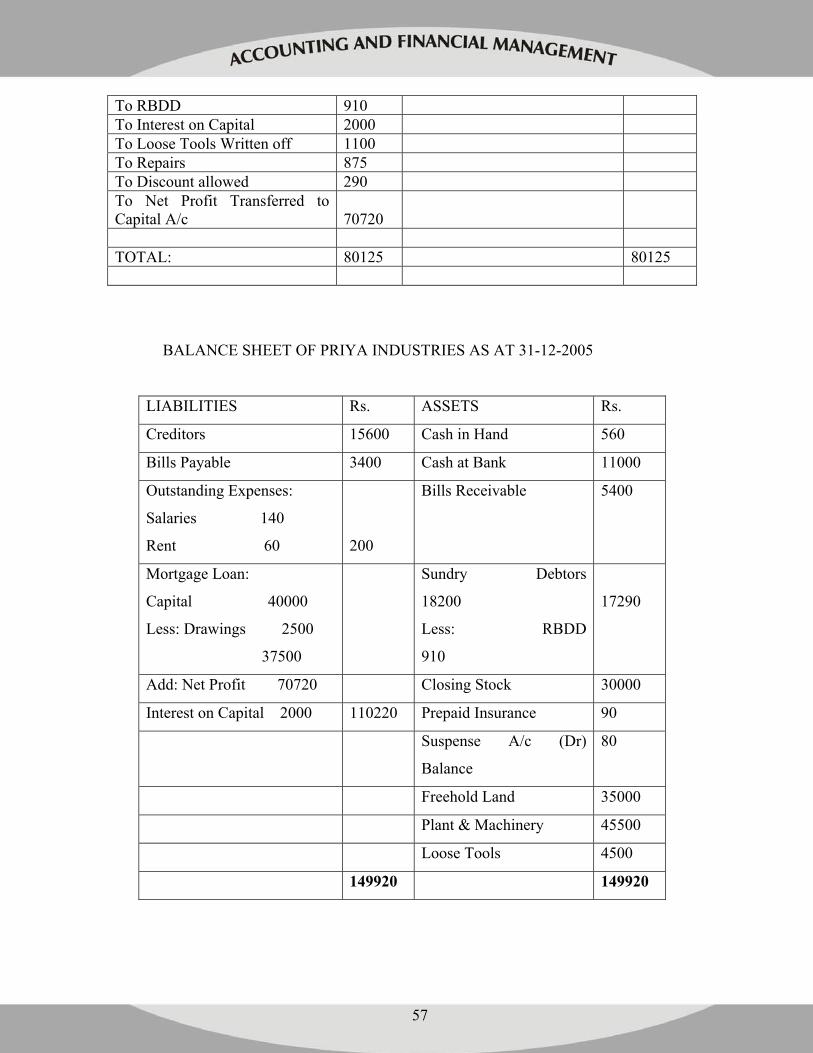
57
To RBDD 910 To Interest on Capital 2000 To Loose Tools Written off 1100 To Repairs 875 To Discount allowed 290 To Net Profit Transferred to Capital A/c
70720
TOTAL: 80125 80125
BALANCE SHEET OF PRIYA INDUSTRIES AS AT 31-12-2005
LIABILITIES Rs. ASSETS Rs.
Creditors 15600 Cash in Hand 560
Bills Payable 3400 Cash at Bank 11000
Outstanding Expenses:
Salaries 140
Rent 60
200
Bills Receivable 5400
Mortgage Loan:
Capital 40000
Less: Drawings 2500
37500
Sundry Debtors
18200
Less: RBDD
910
17290
Add: Net Profit 70720 Closing Stock 30000
Interest on Capital 2000 110220 Prepaid Insurance 90
Suspense A/c (Dr)
Balance
80
Freehold Land 35000
Plant & Machinery 45500
Loose Tools 4500
149920 149920
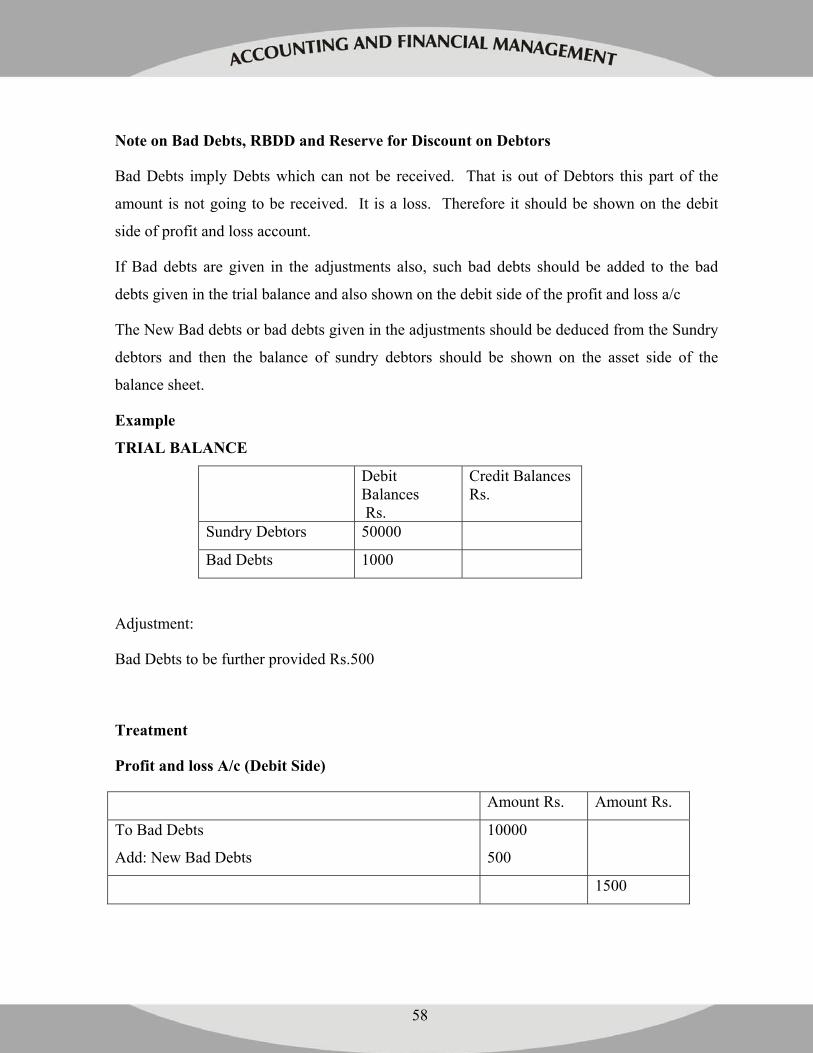
58
Note on Bad Debts, RBDD and Reserve for Discount on Debtors
Bad Debts imply Debts which can not be received. That is out of Debtors this part of the
amount is not going to be received. It is a loss. Therefore it should be shown on the debit
side of profit and loss account.
If Bad debts are given in the adjustments also, such bad debts should be added to the bad
debts given in the trial balance and also shown on the debit side of the profit and loss a/c
The New Bad debts or bad debts given in the adjustments should be deduced from the Sundry
debtors and then the balance of sundry debtors should be shown on the asset side of the
balance sheet.
Example
TRIAL BALANCE
Debit Balances Rs.
Credit Balances Rs.
Sundry Debtors 50000
Bad Debts 1000
Adjustment:
Bad Debts to be further provided Rs.500
Treatment
Profit and loss A/c (Debit Side)
Amount Rs. Amount Rs.
To Bad Debts
Add: New Bad Debts
10000
500
1500
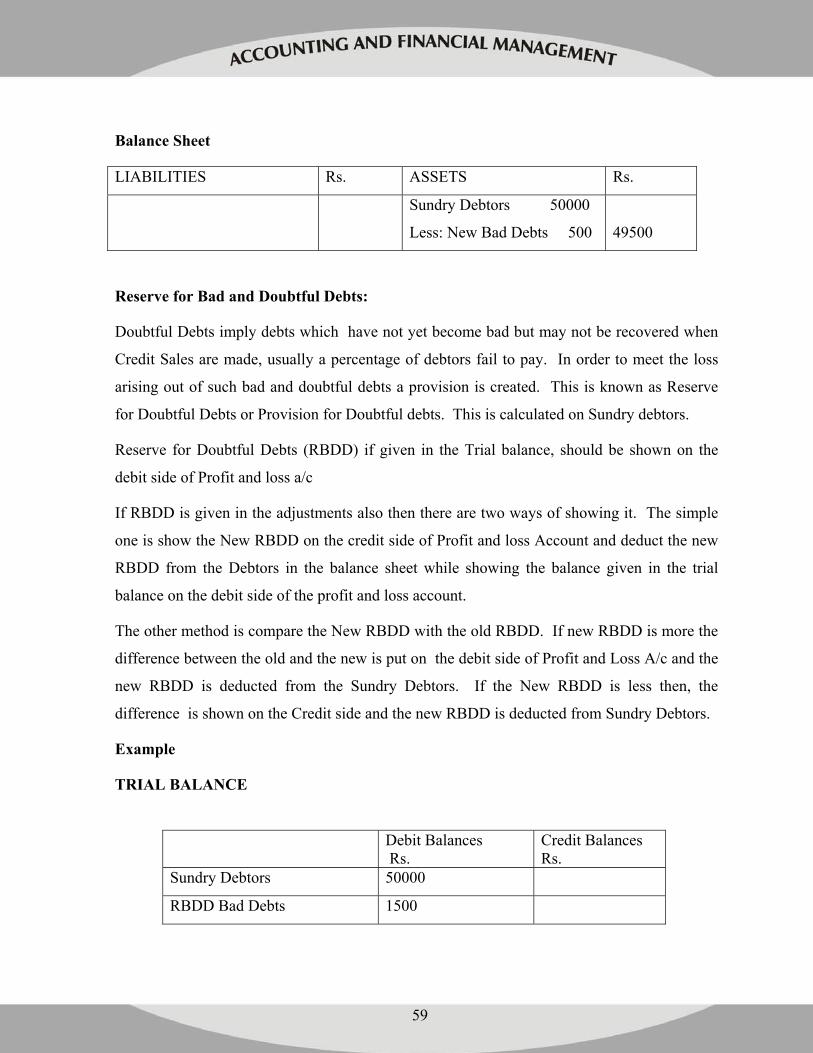
59
Balance Sheet
LIABILITIES Rs. ASSETS Rs.
Sundry Debtors 50000
Less: New Bad Debts 500
49500
Reserve for Bad and Doubtful Debts:
Doubtful Debts imply debts which have not yet become bad but may not be recovered when
Credit Sales are made, usually a percentage of debtors fail to pay. In order to meet the loss
arising out of such bad and doubtful debts a provision is created. This is known as Reserve
for Doubtful Debts or Provision for Doubtful debts. This is calculated on Sundry debtors.
Reserve for Doubtful Debts (RBDD) if given in the Trial balance, should be shown on the
debit side of Profit and loss a/c
If RBDD is given in the adjustments also then there are two ways of showing it. The simple
one is show the New RBDD on the credit side of Profit and loss Account and deduct the new
RBDD from the Debtors in the balance sheet while showing the balance given in the trial
balance on the debit side of the profit and loss account.
The other method is compare the New RBDD with the old RBDD. If new RBDD is more the
difference between the old and the new is put on the debit side of Profit and Loss A/c and the
new RBDD is deducted from the Sundry Debtors. If the New RBDD is less then, the
difference is shown on the Credit side and the new RBDD is deducted from Sundry Debtors.
Example
TRIAL BALANCE
Debit Balances Rs.
Credit Balances Rs.
Sundry Debtors 50000
RBDD Bad Debts 1500
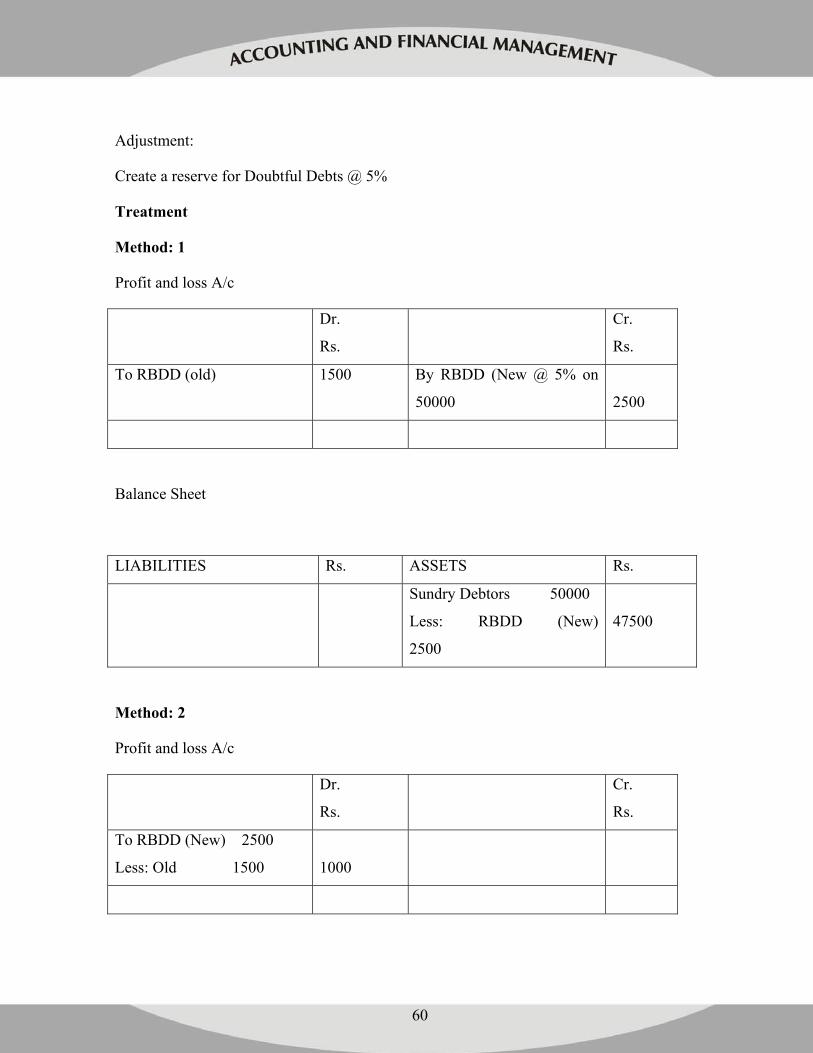
60
Adjustment:
Create a reserve for Doubtful Debts @ 5%
Treatment
Method: 1
Profit and loss A/c
Dr.
Rs.
Cr.
Rs.
To RBDD (old) 1500 By RBDD (New @ 5% on
50000
2500
Balance Sheet
LIABILITIES Rs. ASSETS Rs.
Sundry Debtors 50000
Less: RBDD (New)
2500
47500
Method: 2
Profit and loss A/c
Dr.
Rs.
Cr.
Rs.
To RBDD (New) 2500
Less: Old 1500
1000
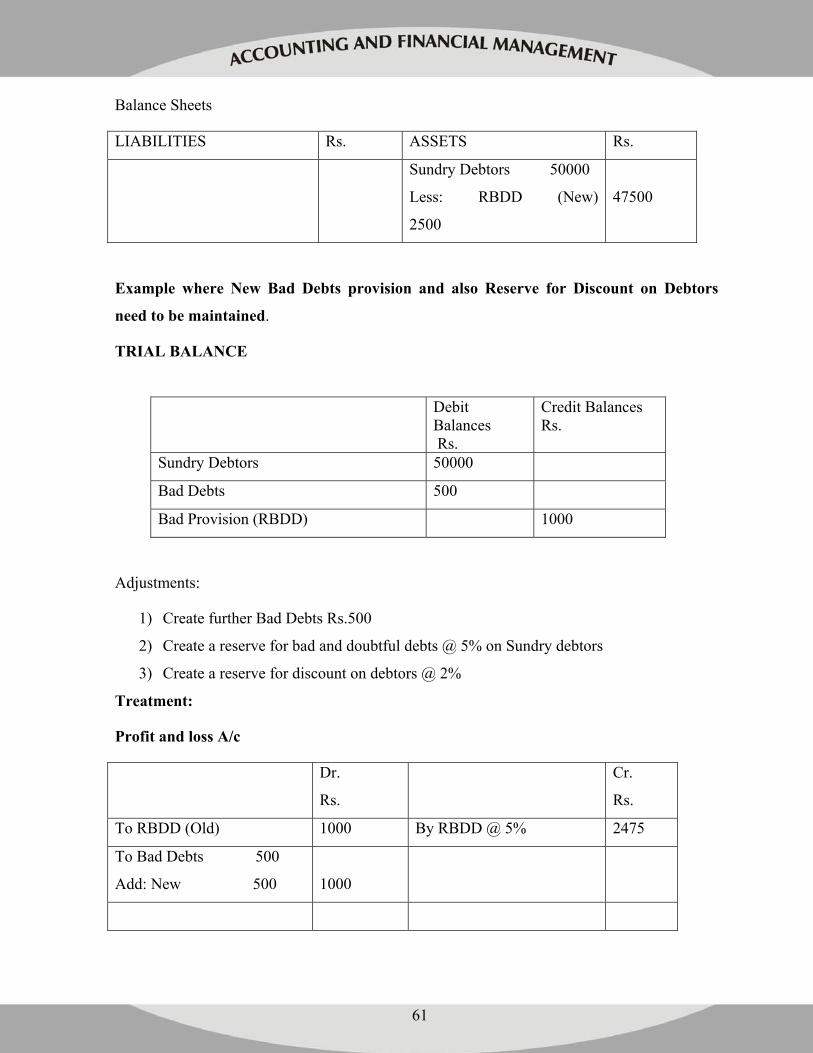
61
Balance Sheets
LIABILITIES Rs. ASSETS Rs.
Sundry Debtors 50000
Less: RBDD (New)
2500
47500
Example where New Bad Debts provision and also Reserve for Discount on Debtors
need to be maintained.
TRIAL BALANCE
Debit Balances Rs.
Credit Balances Rs.
Sundry Debtors 50000
Bad Debts 500
Bad Provision (RBDD) 1000
Adjustments:
1) Create further Bad Debts Rs.500
2) Create a reserve for bad and doubtful debts @ 5% on Sundry debtors
3) Create a reserve for discount on debtors @ 2%
Treatment:
Profit and loss A/c
Dr.
Rs.
Cr.
Rs.
To RBDD (Old) 1000 By RBDD @ 5% 2475
To Bad Debts 500
Add: New 500
1000
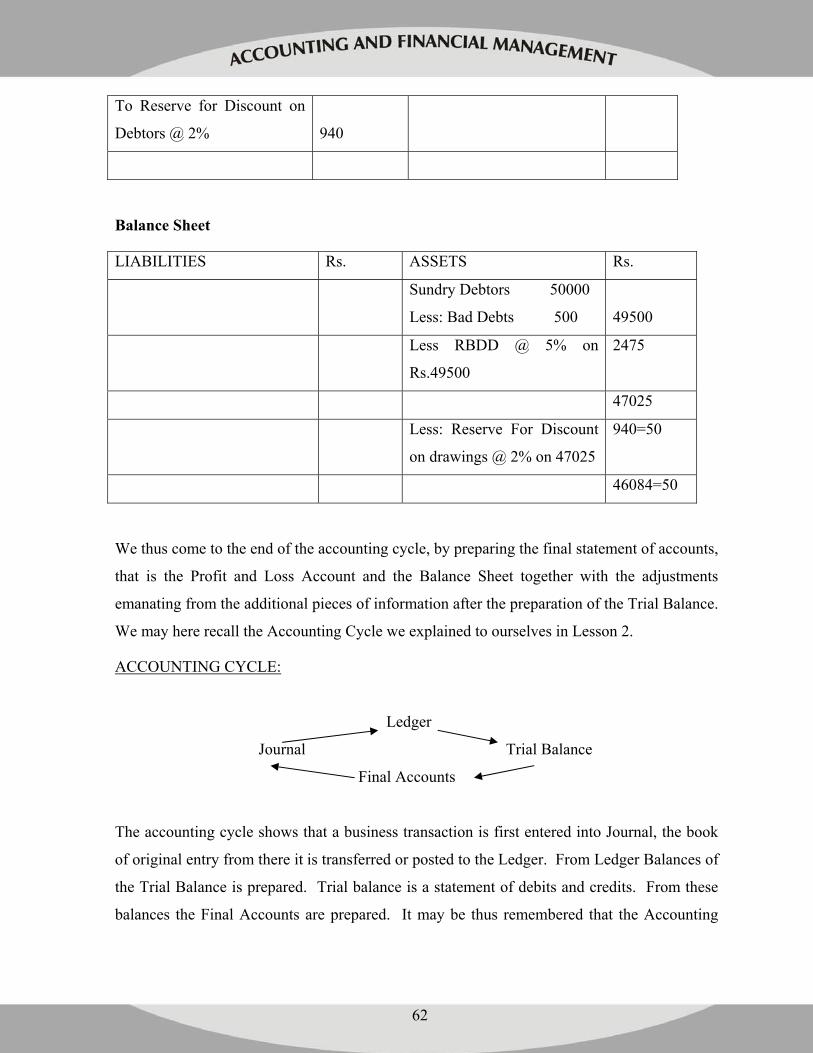
62
To Reserve for Discount on
Debtors @ 2%
940
Balance Sheet
LIABILITIES Rs. ASSETS Rs.
Sundry Debtors 50000
Less: Bad Debts 500
49500
Less RBDD @ 5% on
Rs.49500
2475
47025
Less: Reserve For Discount
on drawings @ 2% on 47025
940=50
46084=50
We thus come to the end of the accounting cycle, by preparing the final statement of accounts,
that is the Profit and Loss Account and the Balance Sheet together with the adjustments
emanating from the additional pieces of information after the preparation of the Trial Balance.
We may here recall the Accounting Cycle we explained to ourselves in Lesson 2.
ACCOUNTING CYCLE:
Ledger
Journal Trial Balance
Final Accounts
The accounting cycle shows that a business transaction is first entered into Journal, the book
of original entry from there it is transferred or posted to the Ledger. From Ledger Balances of
the Trial Balance is prepared. Trial balance is a statement of debits and credits. From these
balances the Final Accounts are prepared. It may be thus remembered that the Accounting
63
Cycle starts with Journal and ends with the Final Accounts. At the Journal stage
documentation of the Business transactions is done, while at the Ledger stage account wise
information is obtained and summarized and at the Trial Balance stage List of Debit and
Credit balances is obtained to check the arithmetical accuracy and at the final accounting
stage the profit or loss position of the business concern is ascertained.
3.6 SUMMARY:
The final stage in the accounting cycle is the preparation of final accounts. It is common
knowledge that the ultimate objective of maintaining accounts is to find out operating results
and also the financial position of the organization concerned. Final accounts are prepared
from the trial balance. Final accounts consist of the profit and loss account (also called
Income Statement) and a statement of assets and liabilities known as the balance sheet.
Distinction needs to be made between capital and Revenue items. Profit and loss A/c shows
the net income or net expenditure position of the business organisation. It consists of two
parts namely: (1) Trading A/c and (2) Profit and Loss A/c. The preparation of the main profit
and loss account begins with the Trading Account and ends with the Profit and Loss account.
While Trading Account records the balances which are directly related to the manufacturing
the product, the profit and loss account records the expenses and incomes and expenses,
profits and losses which though related to the business are not directly related to the making
of the product saleable. A balance sheet shows the financial position of a business on a
certain fixed date. The financial position of any concern/organization is shown by its assets
on a given date and its liabilities on that date. The excess of assets over liabilities represents
the capital Bits of information which are received/discovered after the preparation of Trial
Balance have to be accommodated into financial statements. They are, therefore called
adjustments. Since the adjustments are given after the trial balance is prepared, they have to
be given the two fold effect. These adjustments enable the firm to make its accounts fall in
line with the matching and such other concepts to make the final statements of account to
reflect the true and fair view of the affairs of the business.
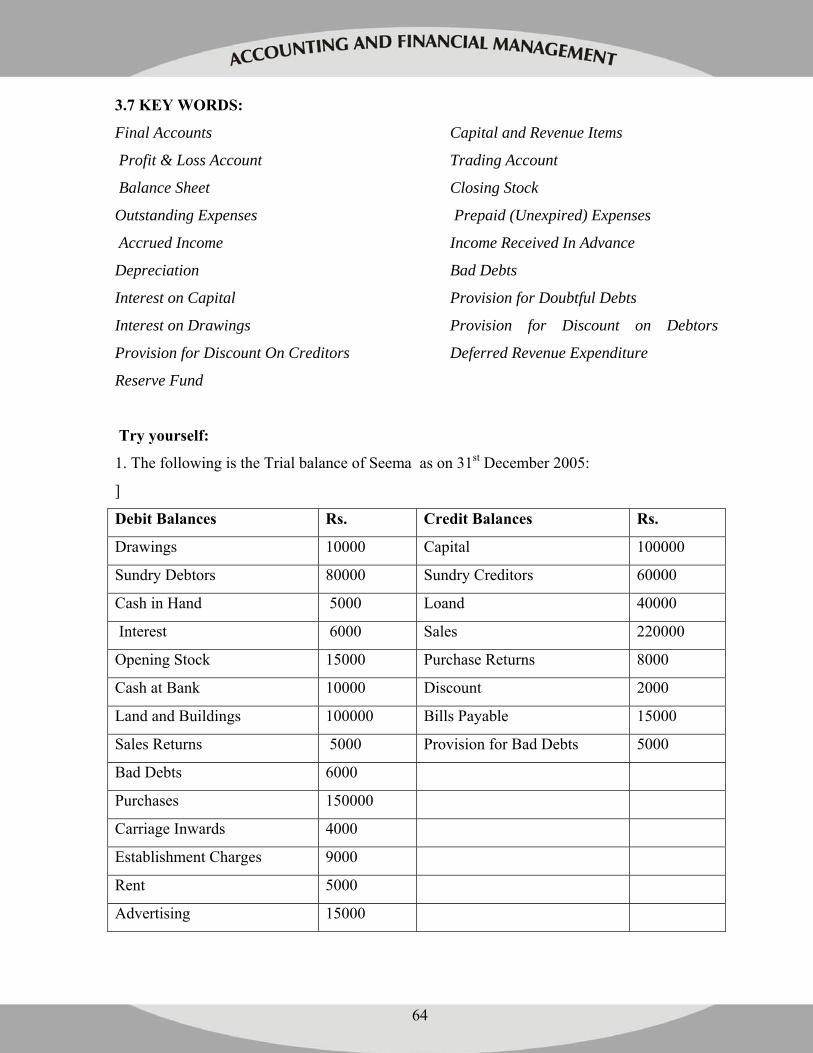
64
3.7 KEY WORDS:
Final Accounts Capital and Revenue Items
Profit & Loss Account Trading Account
Balance Sheet Closing Stock
Outstanding Expenses Prepaid (Unexpired) Expenses
Accrued Income Income Received In Advance
Depreciation Bad Debts
Interest on Capital Provision for Doubtful Debts
Interest on Drawings Provision for Discount on Debtors
Provision for Discount On Creditors Deferred Revenue Expenditure
Reserve Fund
Try yourself:
1. The following is the Trial balance of Seema as on 31st December 2005:
]
Debit Balances Rs. Credit Balances Rs.
Drawings 10000 Capital 100000
Sundry Debtors 80000 Sundry Creditors 60000
Cash in Hand 5000 Loand 40000
Interest 6000 Sales 220000
Opening Stock 15000 Purchase Returns 8000
Cash at Bank 10000 Discount 2000
Land and Buildings 100000 Bills Payable 15000
Sales Returns 5000 Provision for Bad Debts 5000
Bad Debts 6000
Purchases 150000
Carriage Inwards 4000
Establishment Charges 9000
Rent 5000
Advertising 15000
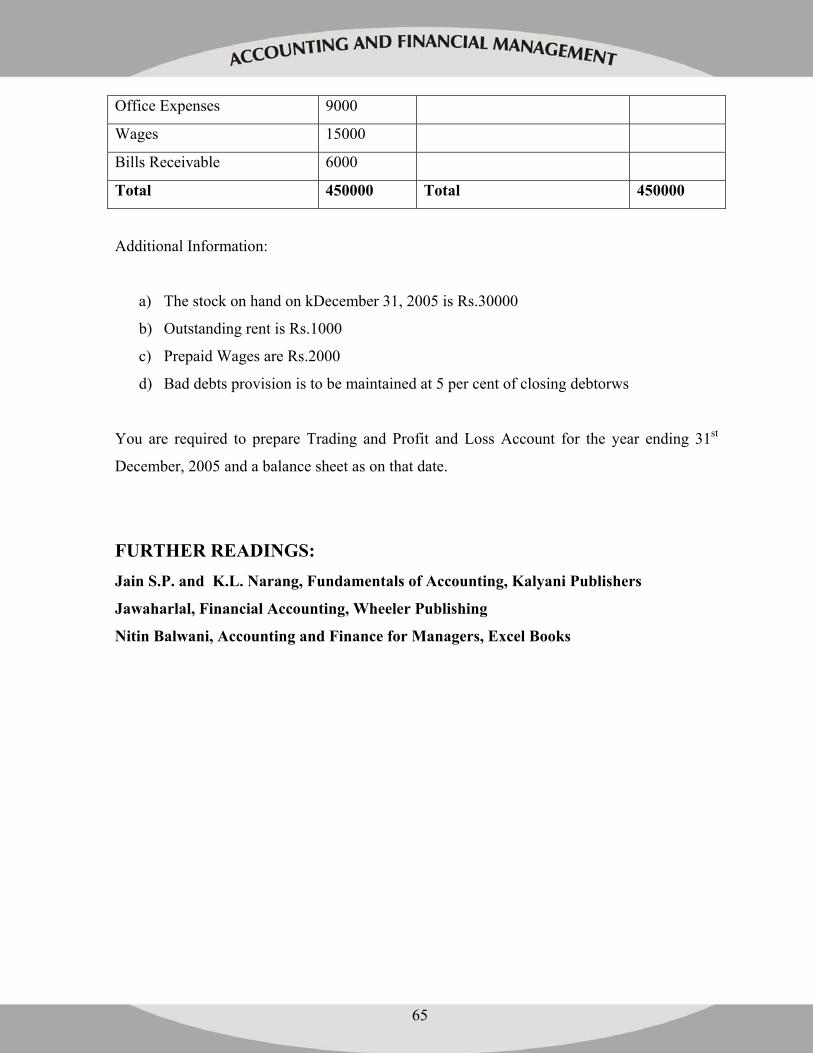
65
Office Expenses 9000
Wages 15000
Bills Receivable 6000
Total 450000 Total 450000
Additional Information:
a) The stock on hand on kDecember 31, 2005 is Rs.30000
b) Outstanding rent is Rs.1000
c) Prepaid Wages are Rs.2000
d) Bad debts provision is to be maintained at 5 per cent of closing debtorws
You are required to prepare Trading and Profit and Loss Account for the year ending 31st
December, 2005 and a balance sheet as on that date.
FURTHER READINGS: Jain S.P. and K.L. Narang, Fundamentals of Accounting, Kalyani Publishers
Jawaharlal, Financial Accounting, Wheeler Publishing
Nitin Balwani, Accounting and Finance for Managers, Excel Books
66
LESSON 4
FINANCIAL STATEMENT ANALYSIS
STRUCTURE:
4.1 Introduction
4.2 Meaning and nature of Financial Statements
4.3 Objectives and types of Financial Statements
4.4 Importance and uses of Financial Statements
4.5 Limitations of Financial Statements
4.6 Meaning of Financial Statement Analysis
4.7 Types and importance of Financial Analysis
4.8 Techniques of Financial Analysis
4.9 Comparative Financial Statement Analysis
4.10 Common size Financial Statement Analysis
4.11 Trend Analysis
4.12 Limitations of financial analysis
4.13 Summary
4.14 Key words
OBJECTIVES:
• Explain the meaning and nature of Financial Statements • Describe the objectives and types of Financial Statements • Recognize the importance and limitations of Financial Statements • Understand the meaning and importance of Financial Analysis • Prepare Comparative and Common size Financial Statements and
interpret them; and • Calculate the Trend Percentages and interpret them.
67
4.1 INTRODUCTION:
In the previous lesson you have understood the preparation of trading account, profit and loss
account and balance sheet. The financial statements viz., the Balance sheet and Profit and loss
account are the end products of the accounting process. The accounting system of a firm
becomes the basis for financial information. The accounting system helps to measure,
compare, analyze and communicate financial data to various interested parties for making
rational decisions. Understanding the nature of financial statements, their form, content and
factors that affect them in projecting the true and fair view of financial position is the basic
foundation for analysis of financial statements.
4.2 MEANING AND NATURE OF FINANCIAL STATEMENTS:
Meaning of Financial statements: Financial statements are the basic and formal means
through which the company communicates financial information to various parties. Financial
statements serve the varied needs of internal and external parties like owners, employees,
management, creditors, investors etc.
According to American Institute of Certified Public Accountants (AICPA) “Financial
statements are prepared for the purpose of presenting a periodical review or report on progress
made by the management and deal with the status of investment in the business and the results
achieved during the period under review”.
Financial statements are prepared for the purpose of disclosing the financial position of the
business concern at a point of time and also operating results during the period under review.
Thus, these are, in one sense, the periodical reports about the progress made by the
management of the business concerns.
Nature of Financial Statements
The data contained in the financial statements are the combined results of recorded facts,
accounting conventions, postulates and personal judgment used in the application of
68
accounting principles. Therefore, it is clear that the financial statements are composed of data,
which are of a combination of:
• Recorded facts
• Accounting conventions adopted to facilitate accounting techniques
• Postulates or assumptions made
• Personal judgment of the accountants in using or applying a particular convention or
postulates.
The financial statements are used by investors and financial analysts to measure the firm’s
performance in order to make investment decisions, so, they should be prepared with utmost
care and contain as much information as possible. The financial statements have to be
prepared in conformity with the GAAP.
4.3 OBJECTIVES OF FINANCIAL STATEMENTS:
A financial statement shows both the performance and the financial position of the concern.
These statements are the primary source of information on the basis of which conclusions are
drawn about the profitability and financial position of the concern. The basic objective of
financial statements is to furnish information required for decision making. The Accounting
Principles Board of America (APB) states the following objectives of financial statements.
• To provide adequate, reliable and periodical information about economic resources
and obligations of a business firm to external parties who have a limited access to
gather data.
• To provide useful financial data to evaluate the firm’s earning capacity and future
potential.
• To supply information which is useful for judging management’s ability to utilize the
resources of the firm effectively
• To disclose, to the extent possible other information related to the financial statements
that is relevant to the users of these statements.
• To disclose, significant policies, concepts, methods followed in the accounting
process.
69
• To report the activities of the business concern which are affecting the society and
accounting for them
• To provide information to investors and creditors for predicting, evaluating potential
funds in terms of amount, time and uncertainty
4.3.1 TYPES OF FINANCIAL STATEMENTS:
Financial statements generally refer to two statements viz., Income statement or Profit and
loss account and Balance sheet. Income statement shows only revenue receipts and revenue
payments which are of nominal nature. Balance sheet shows all the balances which are of
capital nature. The statement which shows total of assets and liabilities is known as Balance
sheet. As per Generally Accepted Accounting Principles (GAAP), financial statements
include the following.
• The position statement or balance sheet
• The income statement or profit and loss account
• A statement of changes in owners equity and
• A statement of changes in financial position
The two major financial statements i.e., balance sheet and income statement are required for
external reporting and also for internal needs of the management like planning, forecasting
and control. These two statements are supported by number of schedules, annexure,
supplementing the data contained in the balance sheet and income statement. Apart from these
two financial statements, there is a need to know about changes in funds position and
movement of cash. For this purpose statement of changes in financial position and a cash flow
statement is prepared.
1. Balance Sheet:-
Balance sheet is the most important financial statement which is prepared to measure the
financial position of a concern as on a certain date. The balance sheet communicates
information about assets, liabilities and owners funds for a business firm as on a specific date.
70
Balance sheet is a static document as it shows assets, liabilities and shareholders funds at a
particular point of time. Balance sheet can be called by different names like “Statement of
financial position”, “Statement of assets and liabilities”, Statement of Net Worth and
Statement of Property. The balance sheet can be presented in the accounting form or in the
report form. In the account firm or T form of balance sheet, all assets are shown on the right
hand side and capital and liabilities on the left hand side. Report form is also called vertical
form of balance sheet, where assets and listed on the top of the page and capital and liabilities
are shown below the assets.
2. Profit and Loss Account or Income Statement:-
Profit and loss account reports the operating results of the business during a specific
accounting period. It is usually prepared on “accrued basis”, all expenses incurred and due are
debited to profit and loss account, whether they are actually paid or not and similarly all
incomes earned and due are credited to it whether they are actually received or not. Net profit
or Net loss is the result of these expenses and revenues. This net profit denotes the operational
efficiency of the management. Profit and loss account may be divided into three components.
Trading account
Profit and Loss account
Profit and loss appropriation account
Trading account reflects the gross profit or loss arising out of trading and manufacturing
operations. Whereas profit and loss account reflects the net profit or net loss on account of
operating expenses like administration, selling and financial expenses. On the other hand,
profit and loss appropriation account reflects the various appropriations made out of profits
like dividends, transfer to reserves etc.
The income statement is normally prepared in account form dividing it into two parts known
as debit side and credit side. On the other hand it can also be prepared in a vertical manner
with detailed data. Vertical form of preparing income statements is suitable for further
analysis and providing suitable data for decision-making.
71
3. Statement of Changes in Owners Equity:-
Owners equity refers to the shareholders funds which includes paid up share capital, reserves
and surplus, undistributed profits and balance in profit and loss account. It is also known as
profit and loss appropriation account or income disposal statement. This statement reflects the
various appropriations made during the year out of current profits.
4. Statement of Changes in Financial Position:-
This statement is prepared to know the movement of funds either in working capital or cash
during a particular period. The statement of changes in financial position prepared on the
basis of funds or working capital is known as funds flow statement and on the basis of cash is
known as cash flow statement. These two statements depict the causes for changes in financial
position in the form of changes in working capital and changes in cash in the form of sources
and uses between two balance sheet dates.
4.4 IMPORTANCE AND USES OF FINANCIAL STATEMENTS:
The financial statements are mirrorS, which reflects the financial position and operating
strength or weakness of the firm. The impact of business transactions on the financial position
and progress of the enterprise is briefly disclosed by these statements. The users of financial
statements include management, investors, shareholders, creditors, government, bankers,
employees and public at large. They provide not only information about the efficiency of the
management to the various interested parties in the concern but also help in taking rational
decisions. The uses and importance of financial statements are presented below:-
1. As a report of Stewardship:- Management is responsible for the over all performance of
the concern. They make several decisions and therefore, need information. Financial
statements report on the performance of the policies of the management to the shareholders.
2. As a basis for fiscal policy:- The fiscal policies particularly taxation policies of the
government are related with the financial performance of corporate undertakings. Thus,
72
financial statements serve as a basis for industrial, taxation and other social and economic
policies of the government.
3. Basis for dividend policies:- Potential investors, owners get an idea about the firm’s
financial strength and performance from its financial reports. They are generally interested in
the earnings, dividend and growth trends of the firm. The dividend policies of the corporate
sector are linked with the government regulations and financial performance of the company.
Hence financial statements form basis for dividend policies of companies.
4. Basis for granting of credit:- Companies have to borrow funds from banks and other
financial institutions for various purposes. Credit granting institutions are interested in the
continuing profitable performance of the firm, so that they can regularly receive their interest
and principal sum. So, they need accounting information, which is provided by financial
statements to estimate the firm’s performance.
5. Basis for Investment decisions:- Both present and prospective investors are interested in
the financial statements for measuring long term and short term solvency as well as the
profitability of the concern. Their prime considerations in their investment decisions are
security and liquidity of their investment with reasonable profitability. Financial statements
provide information to the investors in taking such important decisions.
6. Aids Government in policy framework:- These statements enable the government to
know whether business is following various rules and regulations or not. These statements
also form a base for framing and amending various laws for the regulation of the business.
7. As a basis for price fixation:- Customers may be interested in financial statements of a
firm, because a careful study of the financial statements may provide information about the
prices being fixed by the firm.
8. Helps trade unions and employees:- Trade unions and employees also make use of the
financial statements of a firm for the purpose of preparing ground for bargain on matters
relating to salary, bonus, fringe benefits, working conditions etc. They analyze the financial
statements for measuring the profitability of the firm.
9. Helpful to stock exchanges:- Financial statements help the stock exchanges to
understand the financial performance of the concerns to enable it to pass on the information to
its members and stock brokers to take decisions about the prices to be quoted.
73
In a nutshell, financial statements may be described as a comprehensive index of the financial
affairs of a concern and are useful in many ways to a variety of interested parties.
4.5 LIMITATIONS OF FINANCIAL STATEMENTS:
Financial statements are the result of the accounting process. But the profit or loss figure and
financial position which is disclosed by the Income statement and Balance sheet respectively
cannot be taken to be an exact representation of actual position of the concern. The financial
statements are based on certain accounting concepts and conventions which cannot be said to
be fool proof. The following are the important limitations of financial statements:
(i) Interim and not final reports:- Financial statements do not depict the exact position and
are essentially interim reports. The exact position can be only known if the business is closed.
(ii) Lack of precision and definiteness:- Financial statements may not be realistic because
these are prepared by following certain basic assumptions/concepts and conventions.
(iii)Lack of Objective judgment:- Financial statements are influenced to a major extent by
the personal judgment of the accountant. For example, method of charging depreciation,
valuation of closing stock, amortization of goodwill and treatment of deferred revenue
expenditure etc.
(iv) Records only monetary facts:- Financial statements disclose only monetary facts, i.e.,
those transactions that are recorded in the books of accounts, which can be measured in
monetary terms.
(v) Historical in nature:- These statements are drawn after the happening of the events. They
attempt to present a view of the past performance and have nothing to do with the accounting
for the future.
(vi) Artificial view:- These statements do not give a real and correct report about the worth of
assets and their loss of value as these are shown on historical cost basis.
(vii) Scope for manipulations: These statements are sometimes prepared according to needs
of the situation or the whims of the management. For this purpose under or over valuation of
inventory, over or under charge of depreciation and other such manipulations may be resorted
to.
74
(viii) Inadequate information:- There are many parties who are interested in the information
given in the financial statements but their objectives and requirements may differ. The
financial statements are prepared according to the provisions of the Companies Act, 1956, and
may fail to meet the needs of all the users.
4.5 MEANING OF FINANCIAL STATEMENT ANALYSIS:
Financial statements are the end product of the financial accounting practices. Financial
statements comprise two major statements, namely balance sheet and income statement.
These statements are the records of operating performance with its impact on the financial
position and the progress of the firm. Financial statements are prepared primarily for decision-
making. The information contained in these statements is of immense use in making decisions
through analysis and interpretation of financial statements. Financial analysis is a process of
synthesis and summarization of financial operative data with a view to getting an insight into
the operative activities of a business enterprise. It is the process of identifying the financial
strengths and weakness of the firm by properly establishing relationship between the items of
balance sheet and income statement.
The term financial analysis includes both ‘analysis and ‘interpretation’. The term analysis
means simplification of financial data, by methodical classification of data given in financial
statements. Interpretation means explaining the meaning and significance of the data so
simplified. Thus, analysis and interpretation are closely interlinked and are complimentary to
each other. Analysis is useless without interpretation and interpretation without analysis is
difficult or impossible.
4.6 OBJECTIVES OF FINANCIAL STATEMENT ANALYSIS:
Financial statement analysis is helpful in assessing the financial position and profitability of a
concern. Broadly, the objectives of the analysis are to understand the data contained in the
financial statements with a view to understand the strengths and weaknesses of the firm,
75
thereby enabling to take different decisions regarding the operations of firm. The main
objectives for analysis of financial statements are:-
• To assess the present profitability and operating efficiency of the firm as a whole and to
judge the financial health of the firm.
• To examine the earning-capacity and efficiency of various business activities with the
help of income statements.
• To estimate about the performance efficiency and managerial ability of the management
of a business concern.
• To determine short-term and long term solvency of the business concern with the help of
the Balance sheet
• To enquire about the ‘financial position and ability to pay’ of the concerns seeking loans
and credits.
• To determine the profitability and future prospects of the concern.
• To investigate the future potential of the concern
• To make a comparative study of operational efficiency of similar concerns engaged in the
identical industry.
Thus, the analysis of financial statements helps the management at self-appraisal and also
helps the shareholders to judge the performance of the concern.
4.7 TYPES OF FINANCIAL ANALYSIS:
Various users do the analysis of financial statements from different angles for different
purposes. The analysis of financial statements can be classified into different categories as
under:-
(i) On the basis of the nature of the analyst and the material used by him,
(ii) On the basis of the objective of the analysis, and
(iii)On the basis of the Modus Operandi of the analysis.
76
(i) According to the nature of the analyst and the material used by him:- On this basis the
financial analysis can be external and internal analysis.
(a) External Analysis:- This type of analysis is done by external parties or outsiders like
creditors, investors, governmental agencies, credit granting institutions etc. who do not have
access to the books of accounts and other related information of the firm. This analysis is
dependent on the published financial data of the firm and so can serve only limited purpose.
(b) Internal Analysis:- The internal analysis is done by the persons who have access to the
internal records and books of accounts of the concern. Such a analysis is done by
management, employees of the firm
(ii) According to the Objectives of the analysis:- On this basis the analysis can be long-term
and short-term analysis.
(a) Long-Term Analysis:- This analysis is made in order to study the long-term financial
stability, solvency and liquidity as well as profitability and earning capacity of a business
concern. This type of analysis helps in the long-term financial planning of the business.
(b) Short-Term Analysis:- This type of analysis is made to determine the short term
solvency, stability and liquidity and as well as to know the earning power of the concern.
Such type of analysis may be helpful for short term financial planning and long term
planning.
(iii) According to the Modus Operandi of the Analysis:- On this basis, the analysis may be
horizontal analysis and vertical analysis.
(a) Horizontal Analysis:- This analysis is also called dynamic analysis. This analysis covers
a period of several years and it gives considerable insights into areas of financial weaknesses
and strengths of the firm.
(b) Vertical Analysis:- This analysis is also called static analysis. This analysis is made on
the basis of only one set of financial statements at a particular period. Different types of ratios
establishing meaningful relationship between the items of financial statements can be
computed to understand the financial position of the firm.
77
4.7.1 IMPORTANCE OF FINANCIAL ANALYSIS:
Financial analysis focuses on managerial performance, corporate efficiency, financial
strengths and weaknesses and credit worthiness of the company. A finance manager must be
well equipped with the different tools of analysis to make rational decisions of the firm. The
importance of financial analysis is not limited to the finance manager alone. Its scope of
importance is quite broad which includes top management, creditors, investors, and
employees.
Financial analysis helps the top management in measuring the company’s operations,
evaluating individual’s performance and also helps in performing the functions of
coordination and control.
A creditor, through an analysis of financial statements appraises not only the ability of the
company to repay but also judges the profitability of the concern to meet all its financial
obligations.
The investors evaluate the efficiency of the firm in terms of solvency, liquidity, profitability
and also future potentiality.
Employees and trade unions analyze the financial statements to assess whether the company
has sufficient profits to afford a wage increase and whether it can absorb a wage increase
through increased productivity or by raising prices.
The use of a particular technique depends by and large on the purpose. A technique used by
one user need not necessarily serve the purpose of another user because of varied interests in
analysis of financial statements.
4.8 TECHNIQUES OF FINANCIAL STATEMENT ANALYSIS
In order to analyze and interpret the data in the financial statements, the analyst may
use any one or more of the methods or tools. The more commonly used tools of financial
analysis are:
• Comparative Financial Statements
78
• Common Size Financial Statements
• Trend percentages
• Ratio analysis and
• Funds Flow Statement
• Cash Flow Statement
In this lesson the first three tools viz, comparative statements, common size statements and
trend analysis are explained and the others are discussed in the subsequent lessons.
4.9 COMPARATIVE FINANCIAL STATEMENT ANALYSIS:
These are the statements showing the financial position of a firm at different periods of time.
Here, both the Income statement and balance sheet are prepared by providing columns for the
figures for both, the current year as well as for the previous year and for the changes during
the year both, in absolute and relative terms. The elements of financial statements are shown
in a comparative form to give an idea about the financial position of two or more periods. In
order to use this method of analysis, it is necessary that the same accounting methods,
procedures, policies, practices are followed consistently from one period to another, or other
wise the very purpose of analysis will be defeated. This type of presentation is useful to the
outsiders to take decisions about the company.
ILLUSTRATION 1:
Convert the following income statement into a comparative Income statement of Anu Ltd. and
interpret the changes in 2005 in the light of the conditions in 2004.
Particulars 2004 2005
Rs. Rs.
Gross Sales 30,600 36,720
Less: Sales Returns 600 700
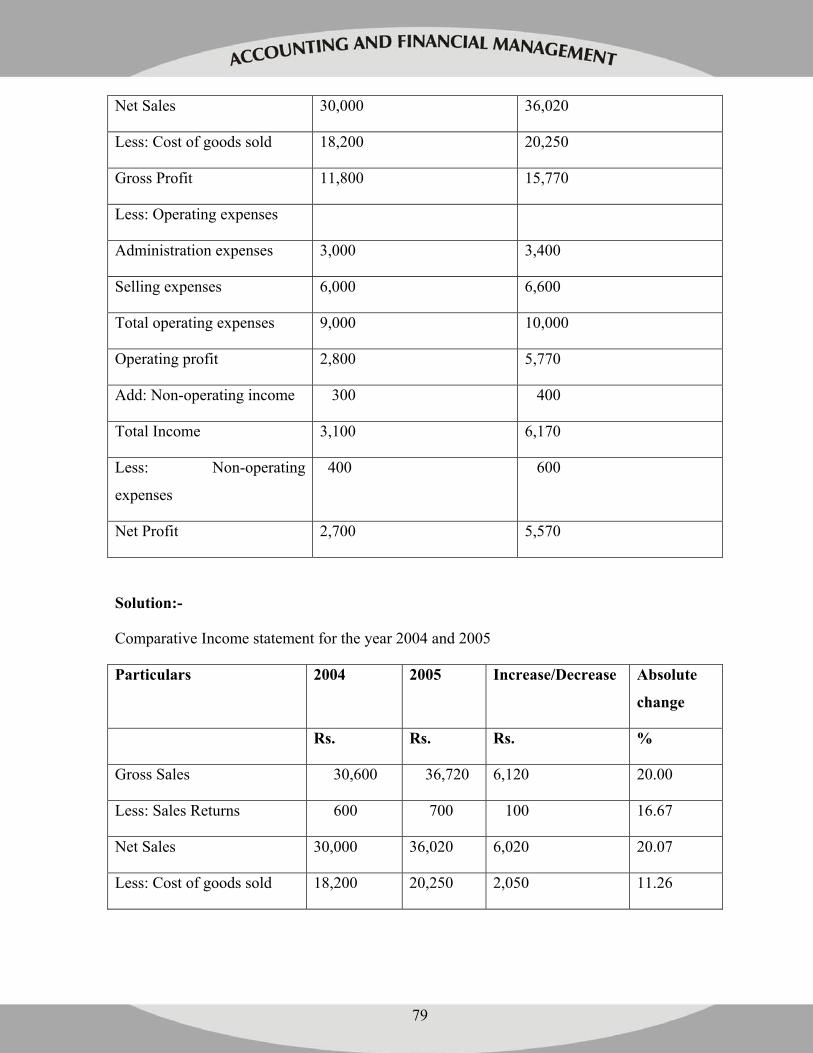
79
Net Sales 30,000 36,020
Less: Cost of goods sold 18,200 20,250
Gross Profit 11,800 15,770
Less: Operating expenses
Administration expenses 3,000 3,400
Selling expenses 6,000 6,600
Total operating expenses 9,000 10,000
Operating profit 2,800 5,770
Add: Non-operating income 300 400
Total Income 3,100 6,170
Less: Non-operating
expenses
400 600
Net Profit 2,700 5,570
Solution:-
Comparative Income statement for the year 2004 and 2005
Particulars 2004 2005 Increase/Decrease Absolute
change
Rs. Rs. Rs. %
Gross Sales 30,600 36,720 6,120 20.00
Less: Sales Returns 600 700 100 16.67
Net Sales 30,000 36,020 6,020 20.07
Less: Cost of goods sold 18,200 20,250 2,050 11.26
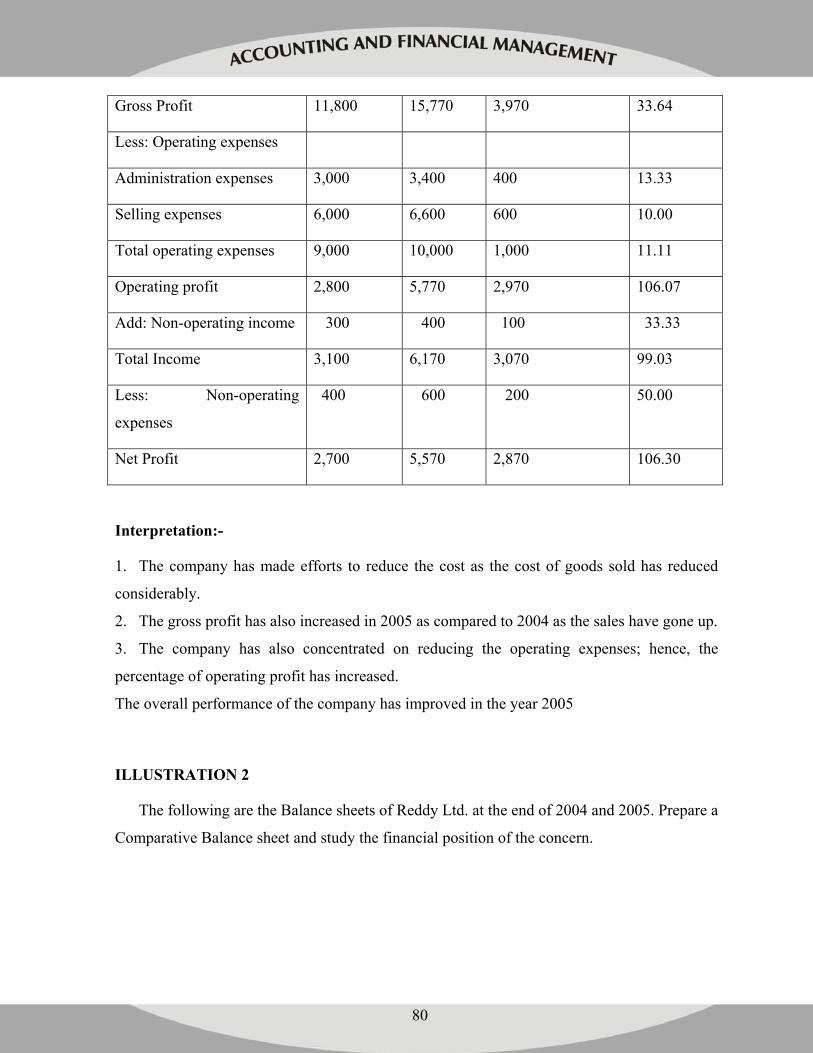
80
Gross Profit 11,800 15,770 3,970 33.64
Less: Operating expenses
Administration expenses 3,000 3,400 400 13.33
Selling expenses 6,000 6,600 600 10.00
Total operating expenses 9,000 10,000 1,000 11.11
Operating profit 2,800 5,770 2,970 106.07
Add: Non-operating income 300 400 100 33.33
Total Income 3,100 6,170 3,070 99.03
Less: Non-operating
expenses
400 600 200 50.00
Net Profit 2,700 5,570 2,870 106.30
Interpretation:-
1. The company has made efforts to reduce the cost as the cost of goods sold has reduced
considerably.
2. The gross profit has also increased in 2005 as compared to 2004 as the sales have gone up.
3. The company has also concentrated on reducing the operating expenses; hence, the
percentage of operating profit has increased.
The overall performance of the company has improved in the year 2005
ILLUSTRATION 2
The following are the Balance sheets of Reddy Ltd. at the end of 2004 and 2005. Prepare a
Comparative Balance sheet and study the financial position of the concern.
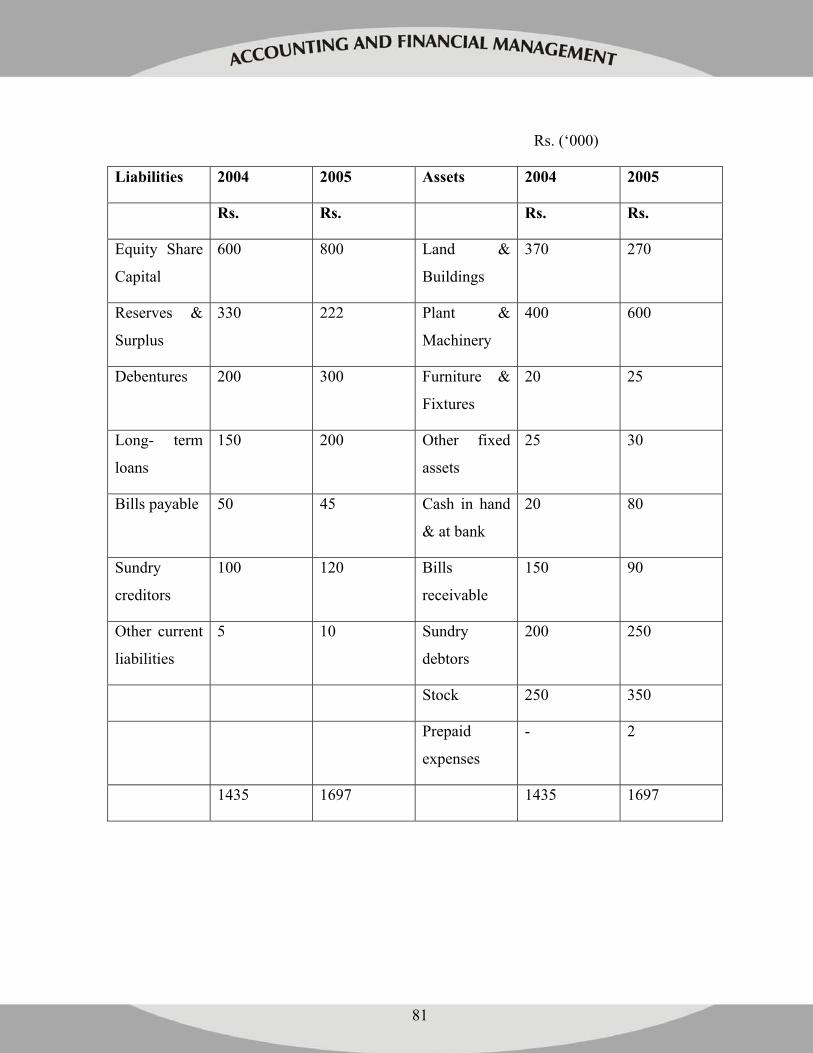
81
Rs. (‘000)
Liabilities 2004 2005 Assets 2004 2005
Rs. Rs. Rs. Rs.
Equity Share
Capital
600 800 Land &
Buildings
370 270
Reserves &
Surplus
330 222 Plant &
Machinery
400 600
Debentures 200 300 Furniture &
Fixtures
20 25
Long- term
loans
150 200 Other fixed
assets
25 30
Bills payable 50 45 Cash in hand
& at bank
20 80
Sundry
creditors
100 120 Bills
receivable
150 90
Other current
liabilities
5 10 Sundry
debtors
200 250
Stock 250 350
Prepaid
expenses
- 2
1435 1697 1435 1697
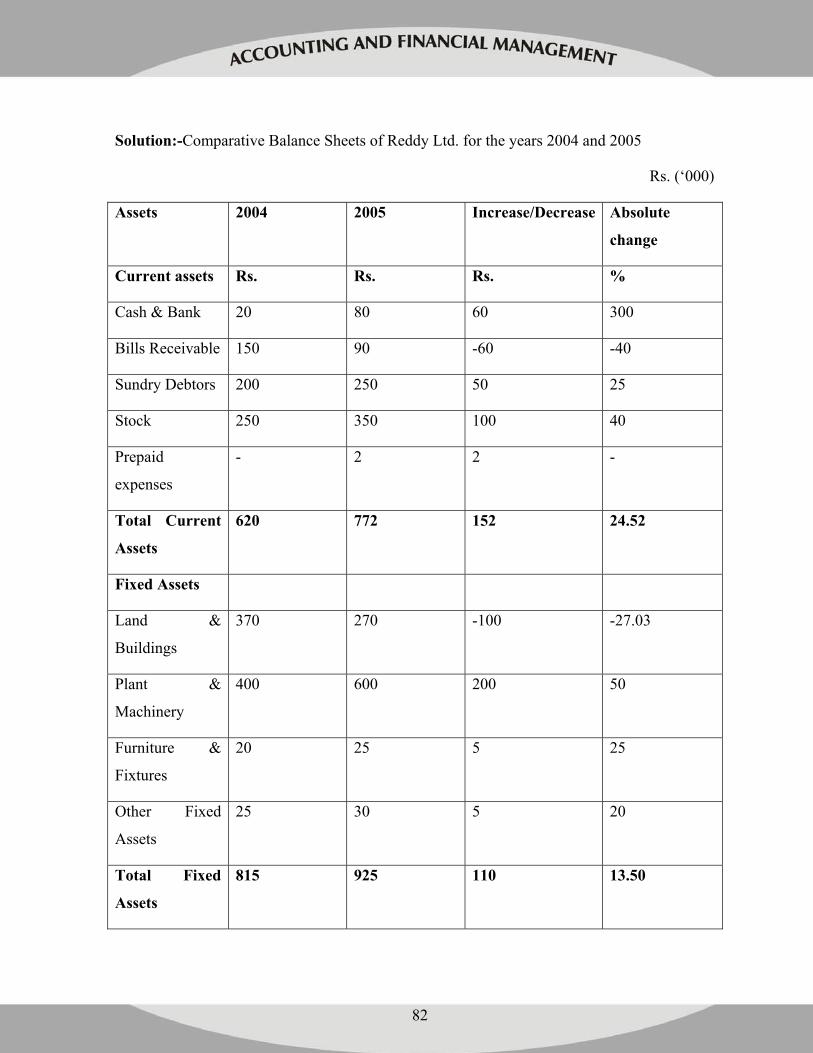
82
Solution:-Comparative Balance Sheets of Reddy Ltd. for the years 2004 and 2005
Rs. (‘000)
Assets 2004 2005 Increase/Decrease Absolute
change
Current assets Rs. Rs. Rs. %
Cash & Bank 20 80 60 300
Bills Receivable 150 90 -60 -40
Sundry Debtors 200 250 50 25
Stock 250 350 100 40
Prepaid
expenses
- 2 2 -
Total Current
Assets
620 772 152 24.52
Fixed Assets
Land &
Buildings
370 270 -100 -27.03
Plant &
Machinery
400 600 200 50
Furniture &
Fixtures
20 25 5 25
Other Fixed
Assets
25 30 5 20
Total Fixed
Assets
815 925 110 13.50
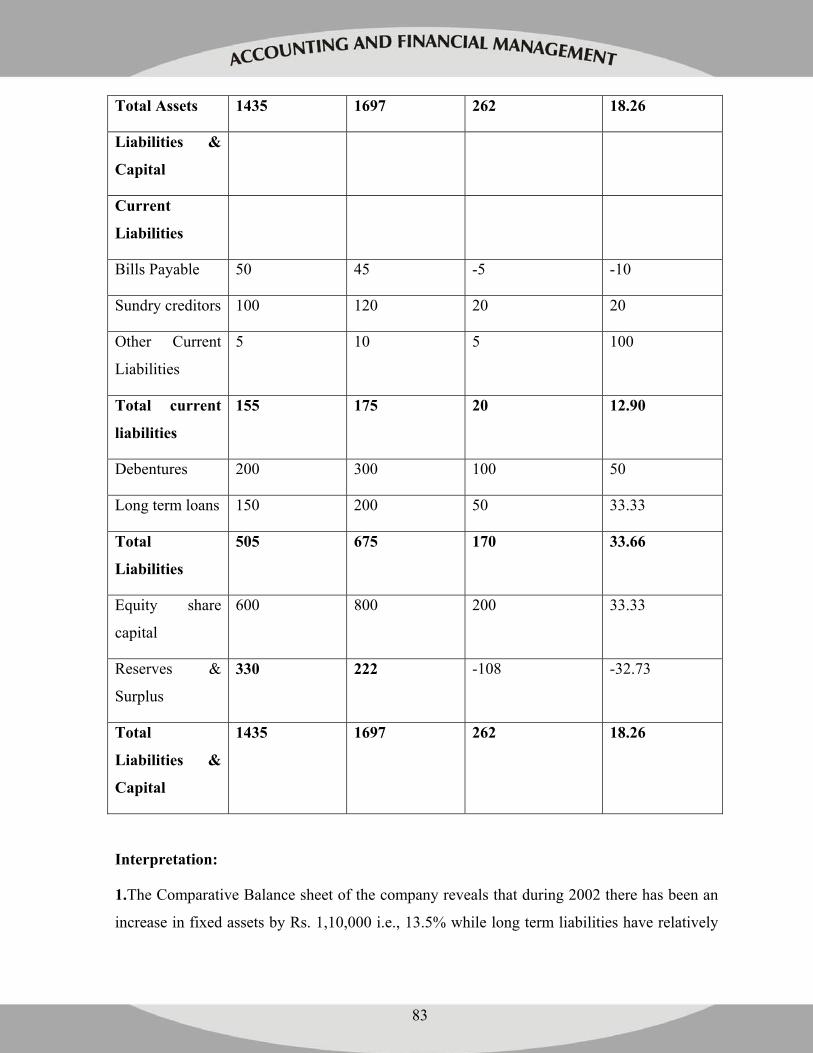
83
Total Assets 1435 1697 262 18.26
Liabilities &
Capital
Current
Liabilities
Bills Payable 50 45 -5 -10
Sundry creditors 100 120 20 20
Other Current
Liabilities
5 10 5 100
Total current
liabilities
155 175 20 12.90
Debentures 200 300 100 50
Long term loans 150 200 50 33.33
Total
Liabilities
505 675 170 33.66
Equity share
capital
600 800 200 33.33
Reserves &
Surplus
330 222 -108 -32.73
Total
Liabilities &
Capital
1435 1697 262 18.26
Interpretation:
1.The Comparative Balance sheet of the company reveals that during 2002 there has been an
increase in fixed assets by Rs. 1,10,000 i.e., 13.5% while long term liabilities have relatively
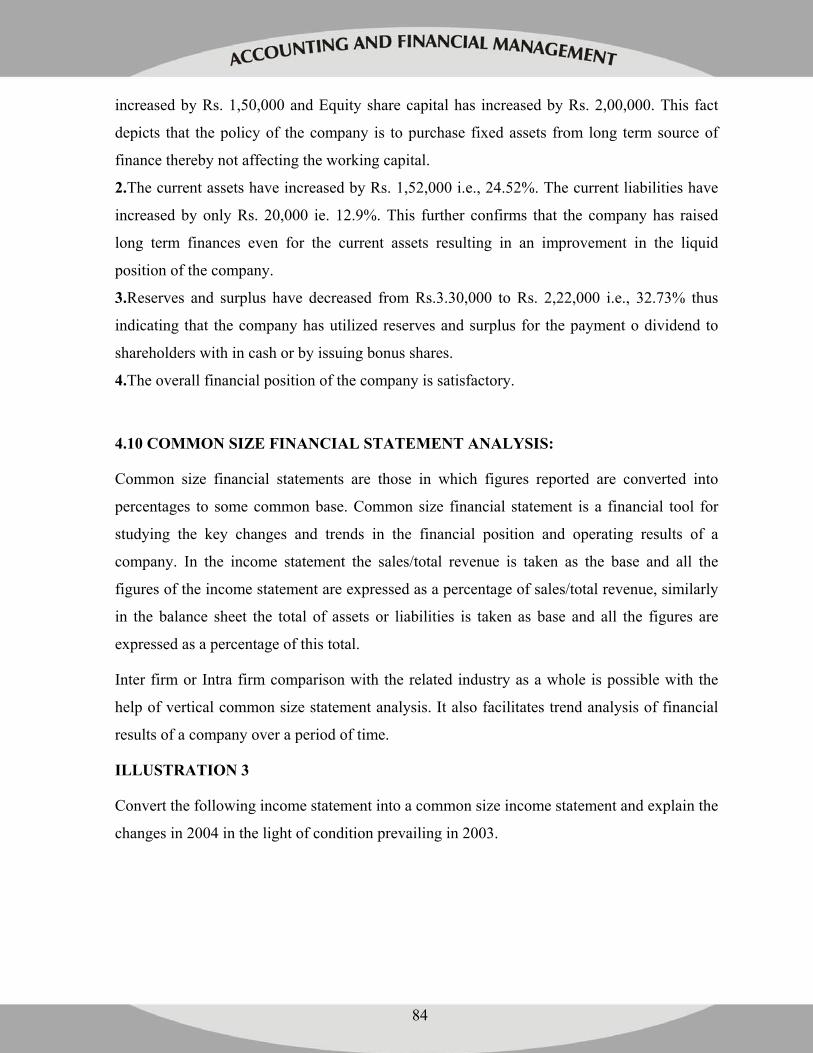
84
increased by Rs. 1,50,000 and Equity share capital has increased by Rs. 2,00,000. This fact
depicts that the policy of the company is to purchase fixed assets from long term source of
finance thereby not affecting the working capital.
2.The current assets have increased by Rs. 1,52,000 i.e., 24.52%. The current liabilities have
increased by only Rs. 20,000 ie. 12.9%. This further confirms that the company has raised
long term finances even for the current assets resulting in an improvement in the liquid
position of the company.
3.Reserves and surplus have decreased from Rs.3.30,000 to Rs. 2,22,000 i.e., 32.73% thus
indicating that the company has utilized reserves and surplus for the payment o dividend to
shareholders with in cash or by issuing bonus shares.
4.The overall financial position of the company is satisfactory.
4.10 COMMON SIZE FINANCIAL STATEMENT ANALYSIS:
Common size financial statements are those in which figures reported are converted into
percentages to some common base. Common size financial statement is a financial tool for
studying the key changes and trends in the financial position and operating results of a
company. In the income statement the sales/total revenue is taken as the base and all the
figures of the income statement are expressed as a percentage of sales/total revenue, similarly
in the balance sheet the total of assets or liabilities is taken as base and all the figures are
expressed as a percentage of this total.
Inter firm or Intra firm comparison with the related industry as a whole is possible with the
help of vertical common size statement analysis. It also facilitates trend analysis of financial
results of a company over a period of time.
ILLUSTRATION 3
Convert the following income statement into a common size income statement and explain the
changes in 2004 in the light of condition prevailing in 2003.
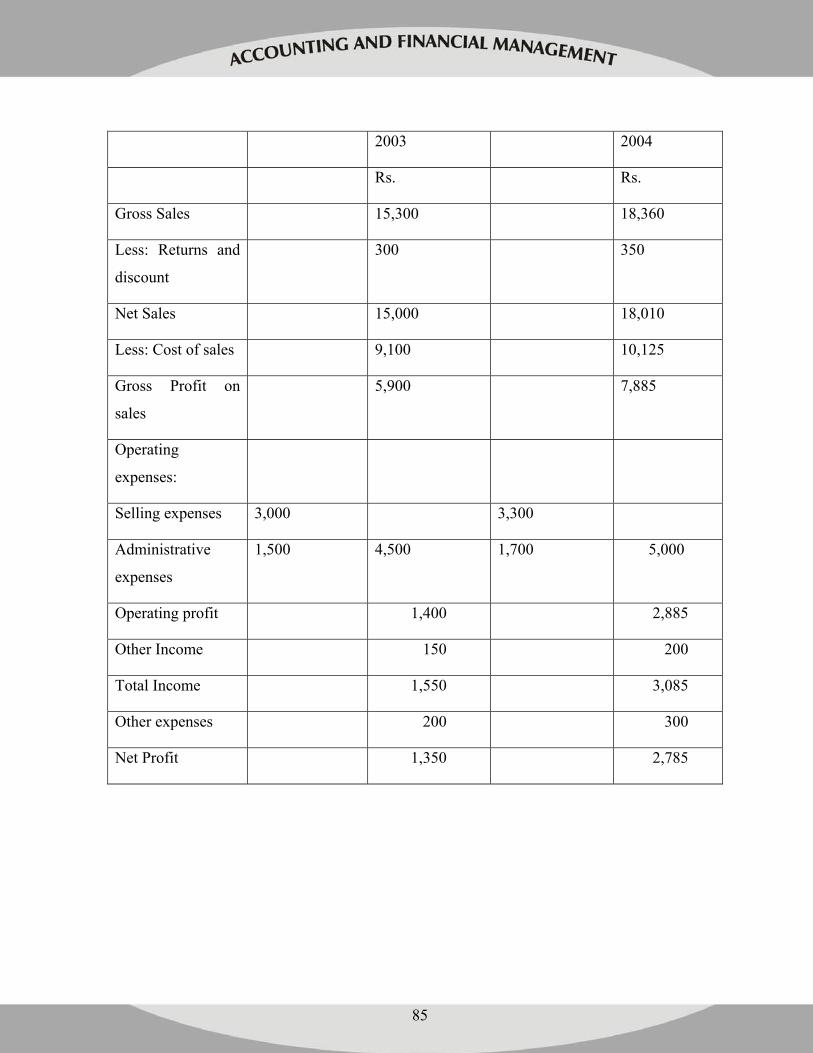
85
2003 2004
Rs. Rs.
Gross Sales 15,300 18,360
Less: Returns and
discount
300 350
Net Sales 15,000 18,010
Less: Cost of sales 9,100 10,125
Gross Profit on
sales
5,900 7,885
Operating
expenses:
Selling expenses 3,000 3,300
Administrative
expenses
1,500 4,500 1,700 5,000
Operating profit 1,400 2,885
Other Income 150 200
Total Income 1,550 3,085
Other expenses 200 300
Net Profit 1,350 2,785
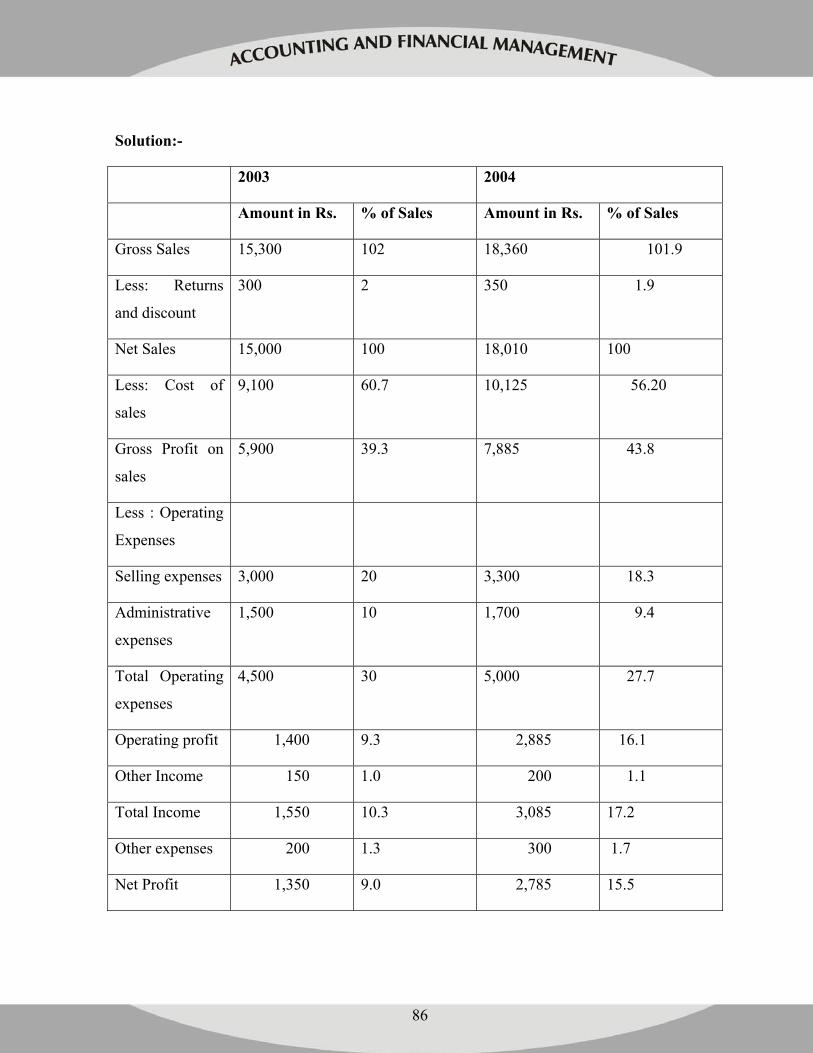
86
Solution:-
2003 2004
Amount in Rs. % of Sales Amount in Rs. % of Sales
Gross Sales 15,300 102 18,360 101.9
Less: Returns
and discount
300 2 350 1.9
Net Sales 15,000 100 18,010 100
Less: Cost of
sales
9,100 60.7 10,125 56.20
Gross Profit on
sales
5,900 39.3 7,885 43.8
Less : Operating
Expenses
Selling expenses 3,000 20 3,300 18.3
Administrative
expenses
1,500 10 1,700 9.4
Total Operating
expenses
4,500 30 5,000 27.7
Operating profit 1,400 9.3 2,885 16.1
Other Income 150 1.0 200 1.1
Total Income 1,550 10.3 3,085 17.2
Other expenses 200 1.3 300 1.7
Net Profit 1,350 9.0 2,785 15.5
87
Interpretation:
The analysis of the above income statement reveals the following points:
1. The percentage of gross profit has increased from 39.3% in 2003 to 43.8% in 2004. This is
due to decline in percentage of cost of goods sold from 60.7% of sales in 2003 to 56.2% in
2004. The decline in % of cost of goods sold may be due to fall in raw material prices and/or
efficiency of the purchasing department.
2. Though the absolute amounts of selling and administration expenses have increased
during the year 2004 but this increase is less than proportionate of the increase in sales.
Because of this the percentage of operating expenses to sales has declined from 30% in 2003
to 27.7% in 2004. This is a sign of company’s operating efficiency and economy in
expenditure.
3. The company’s percentage of net operating profit of sales has increased from 9.3% in
2003 to 16.1% in 2004 due to the combined effect of decrease in cost of goods sold and
operating expenses. This may be possible because of effective management policies of the
concern.
4. The increase in the non-operating income of the business is significant but the
disproportionate increase in non-operating expenses is not justified.
In conclusion it may be said that the company has been operated more efficiently in 2004 as
compared to 2003.
ILLUSTRATION 4
From the following Balance sheet of Rayon Company Ltd. for the year ended 31st December,
1997 and 1998, you are required to prepare a Comparative Common size Balance Sheet.
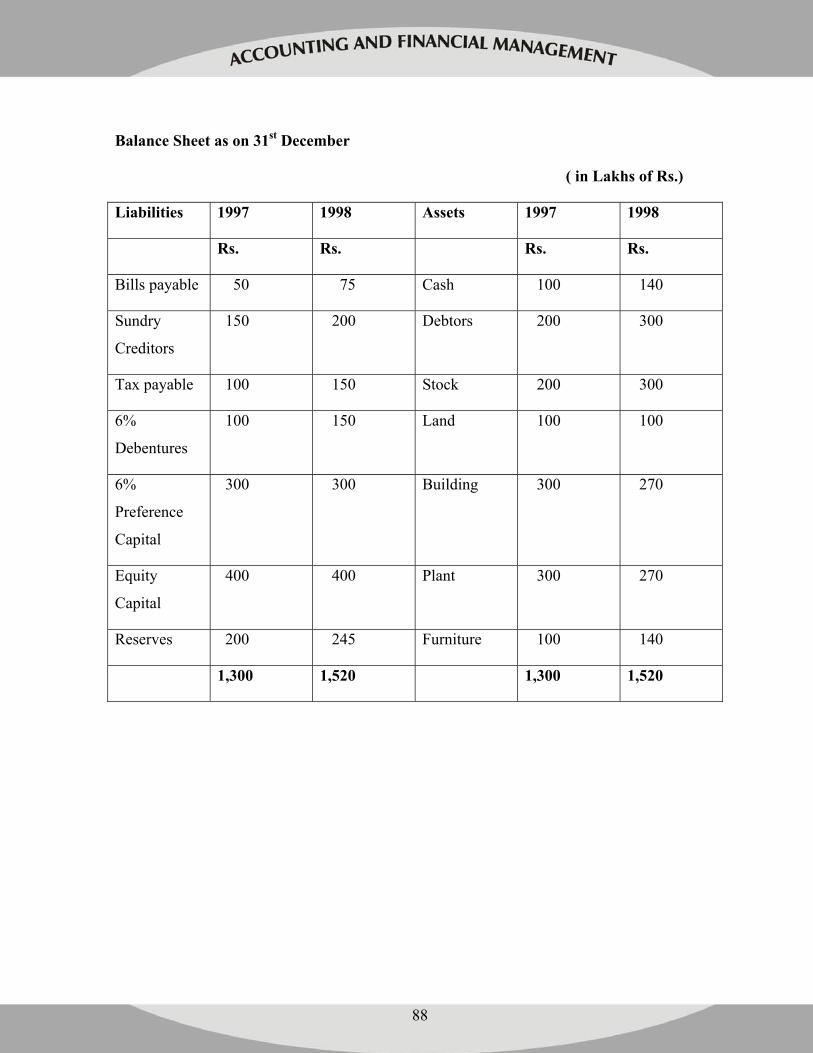
88
Balance Sheet as on 31st December
( in Lakhs of Rs.)
Liabilities 1997 1998 Assets 1997 1998
Rs. Rs. Rs. Rs.
Bills payable 50 75 Cash 100 140
Sundry
Creditors
150 200 Debtors 200 300
Tax payable 100 150 Stock 200 300
6%
Debentures
100 150 Land 100 100
6%
Preference
Capital
300 300 Building 300 270
Equity
Capital
400 400 Plant 300 270
Reserves 200 245 Furniture 100 140
1,300 1,520 1,300 1,520
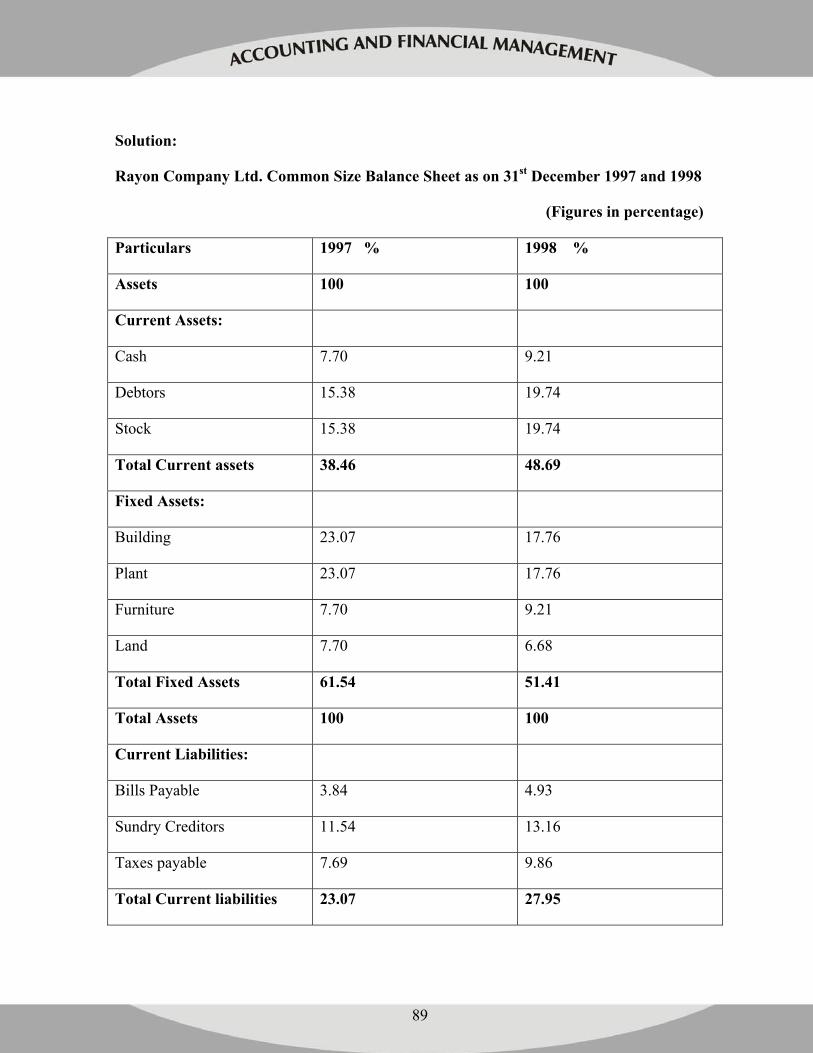
89
Solution:
Rayon Company Ltd. Common Size Balance Sheet as on 31st December 1997 and 1998
(Figures in percentage)
Particulars 1997 % 1998 %
Assets 100 100
Current Assets:
Cash 7.70 9.21
Debtors 15.38 19.74
Stock 15.38 19.74
Total Current assets 38.46 48.69
Fixed Assets:
Building 23.07 17.76
Plant 23.07 17.76
Furniture 7.70 9.21
Land 7.70 6.68
Total Fixed Assets 61.54 51.41
Total Assets 100 100
Current Liabilities:
Bills Payable 3.84 4.93
Sundry Creditors 11.54 13.16
Taxes payable 7.69 9.86
Total Current liabilities 23.07 27.95
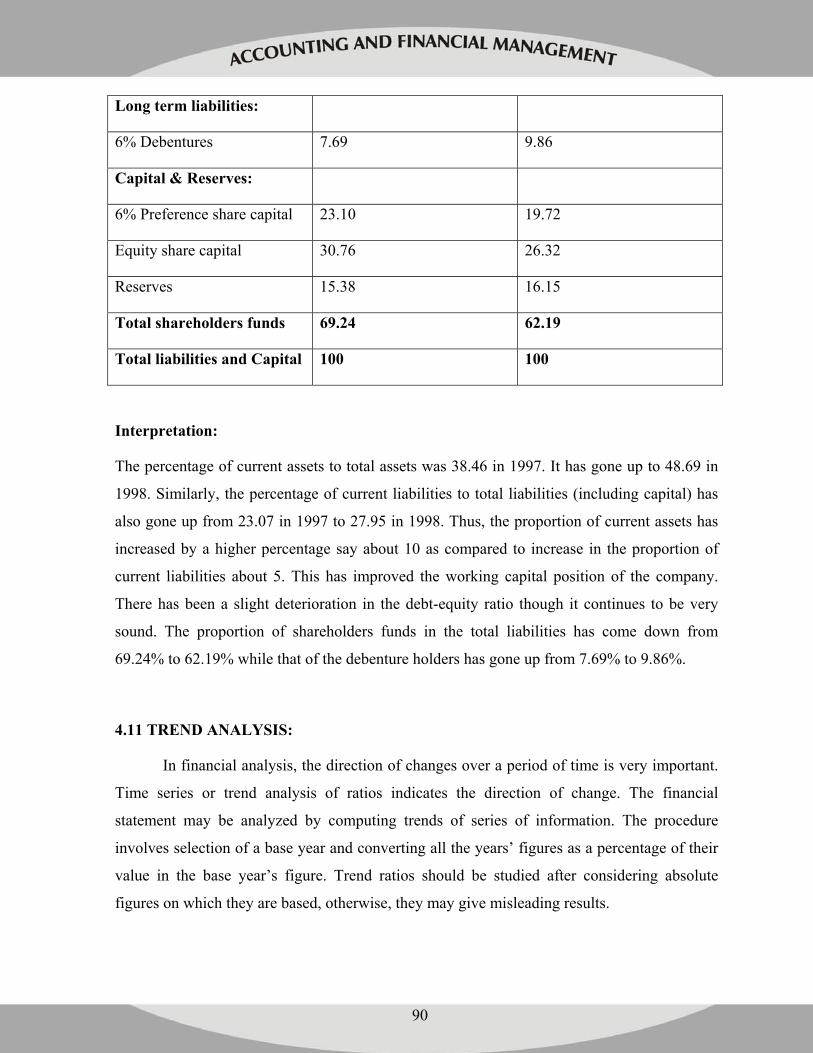
90
Long term liabilities:
6% Debentures 7.69 9.86
Capital & Reserves:
6% Preference share capital 23.10 19.72
Equity share capital 30.76 26.32
Reserves 15.38 16.15
Total shareholders funds 69.24 62.19
Total liabilities and Capital 100 100
Interpretation:
The percentage of current assets to total assets was 38.46 in 1997. It has gone up to 48.69 in
1998. Similarly, the percentage of current liabilities to total liabilities (including capital) has
also gone up from 23.07 in 1997 to 27.95 in 1998. Thus, the proportion of current assets has
increased by a higher percentage say about 10 as compared to increase in the proportion of
current liabilities about 5. This has improved the working capital position of the company.
There has been a slight deterioration in the debt-equity ratio though it continues to be very
sound. The proportion of shareholders funds in the total liabilities has come down from
69.24% to 62.19% while that of the debenture holders has gone up from 7.69% to 9.86%.
4.11 TREND ANALYSIS:
In financial analysis, the direction of changes over a period of time is very important.
Time series or trend analysis of ratios indicates the direction of change. The financial
statement may be analyzed by computing trends of series of information. The procedure
involves selection of a base year and converting all the years’ figures as a percentage of their
value in the base year’s figure. Trend ratios should be studied after considering absolute
figures on which they are based, otherwise, they may give misleading results.
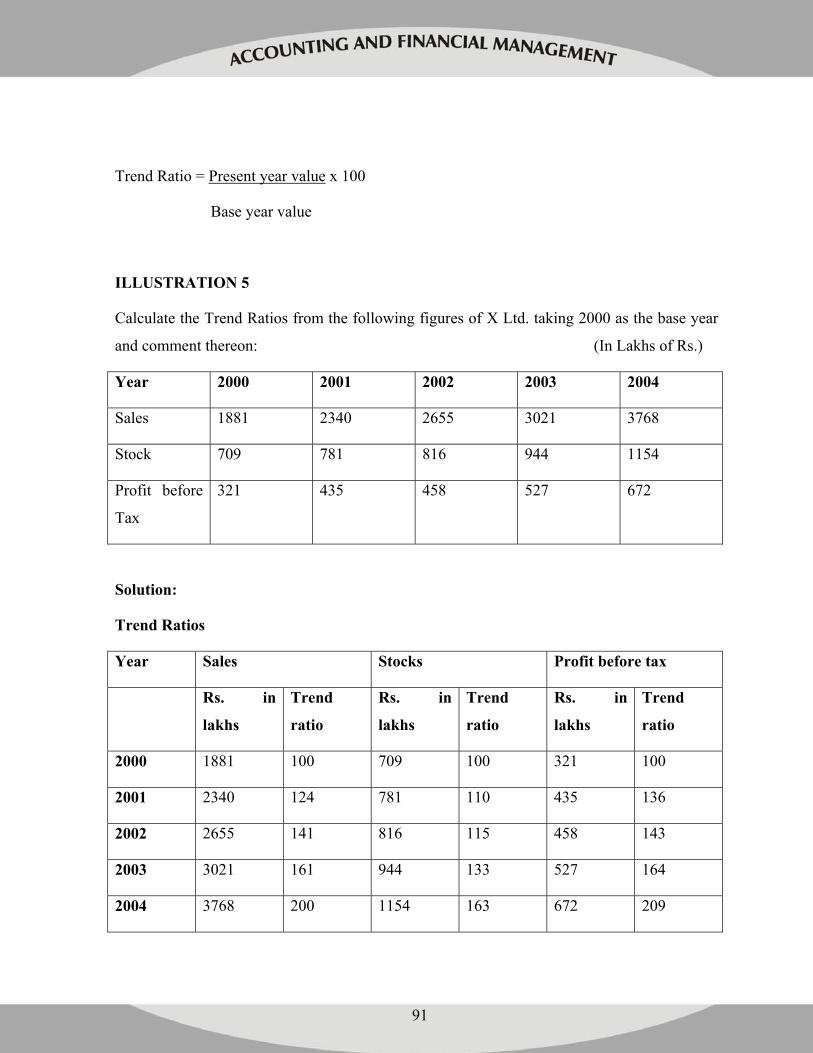
91
Trend Ratio = Present year value x 100
Base year value
ILLUSTRATION 5
Calculate the Trend Ratios from the following figures of X Ltd. taking 2000 as the base year
and comment thereon: (In Lakhs of Rs.)
Year 2000 2001 2002 2003 2004
Sales 1881 2340 2655 3021 3768
Stock 709 781 816 944 1154
Profit before
Tax
321 435 458 527 672
Solution:
Trend Ratios
Year Sales Stocks Profit before tax
Rs. in
lakhs
Trend
ratio
Rs. in
lakhs
Trend
ratio
Rs. in
lakhs
Trend
ratio
2000 1881 100 709 100 321 100
2001 2340 124 781 110 435 136
2002 2655 141 816 115 458 143
2003 3021 161 944 133 527 164
2004 3768 200 1154 163 672 209
92
Interpretation:
The following points are worth noting from the trend ratios:
1. There is continuous increase in the sales in the last five years. This is a favorable tendency
as success of business depends on sales.
2. Though there is increase in quantity of stock during the last five years yet it is
comparatively less than the increase in sales. To keep less stock in spite of increase in the
sales is an indicator of efficient inventory management.
3. Profit before tax is constantly increasing and its percentage increase is always more as
compared to the percentage increase in sales.
In conclusion, it can be said that all the three tendencies are in favour of the business and are
indicator of full efficiency prevailing in the concern.
4.12 LIMITATIONS OF FINANCIAL STATEMENT ANALYSIS:
Though, financial analysis is an important tool of a firm, determining the financial strengths
and weakness of a firm, the analysis is based on the information available in financial
statements. As such, the financial analysis also suffers from the same limitations of financial
statements. Some other limitations are:
• Financial analysis is just a study of interim reports
• Financial analysis does not consider changes in price levels
• Financial analysis considers only monetary facts, non-monetary facts are ignored.
• If there is any change in accounting procedures and practices, the financial analysis
may be misleading.
• The financial statements are prepared on the basis of going concern concept, as such it
does not disclose correct position of the concern
• There is not single tool of analysis which is useful to all types of users
93
4.13 SUMMARY:
An organized collection of data according to logical and consistent accounting procedures is
known as financial statements. The methodical classification of the data given in the financial
statements is called as ‘analysis’ and explaining the meaning and significance of the data so
simplified is termed as ‘interpretation’.
The financial statements generally refers to income statement and balance sheet, statement of
retained earnings, funds flow statement etc. The financial analysis may be external. Internal,
long term, short term, horizontal or vertical.
The financial analysis helps a layman also to understand the statements easily and take
decision wisely with the help of various tools and techniques of financial statement analysis.
Most widely used techniques of financial statement analysis are Comparative statements,
Common size statements, Trend analysis, Ratio analysis, funds flow analysis and cash flow
analysis.
4.14 KEY WORDS:
Financial Statements Financial Analysis
Interpretation External Analysis
Internal Analysis Horizontal Analysis
Vertical Analysis Comparative Statements
Common-size Statement Trend Analysis
Try yourself:
1. Explain the meaning and importance of financial statement analysis.
2. Explain briefly the terms analysis and interpretation of financial statements. What are the
different tools employed for financial analysis?
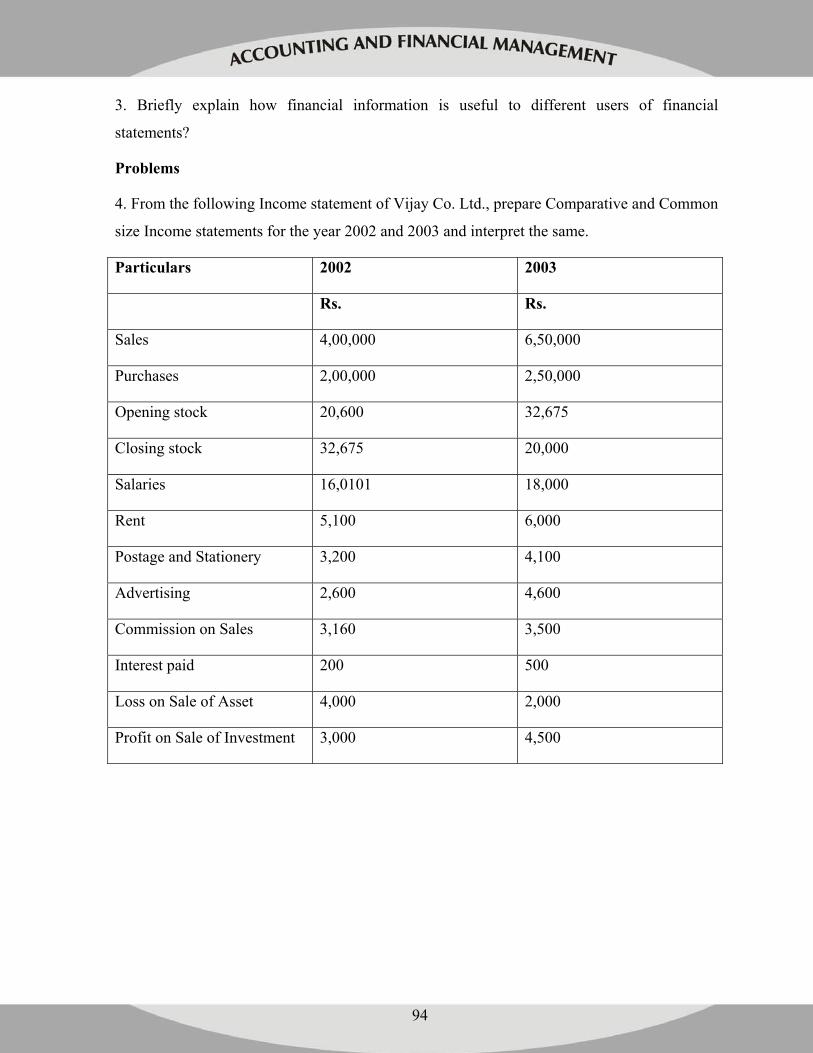
94
3. Briefly explain how financial information is useful to different users of financial
statements?
Problems
4. From the following Income statement of Vijay Co. Ltd., prepare Comparative and Common
size Income statements for the year 2002 and 2003 and interpret the same.
Particulars 2002 2003
Rs. Rs.
Sales 4,00,000 6,50,000
Purchases 2,00,000 2,50,000
Opening stock 20,600 32,675
Closing stock 32,675 20,000
Salaries 16,0101 18,000
Rent 5,100 6,000
Postage and Stationery 3,200 4,100
Advertising 2,600 4,600
Commission on Sales 3,160 3,500
Interest paid 200 500
Loss on Sale of Asset 4,000 2,000
Profit on Sale of Investment 3,000 4,500
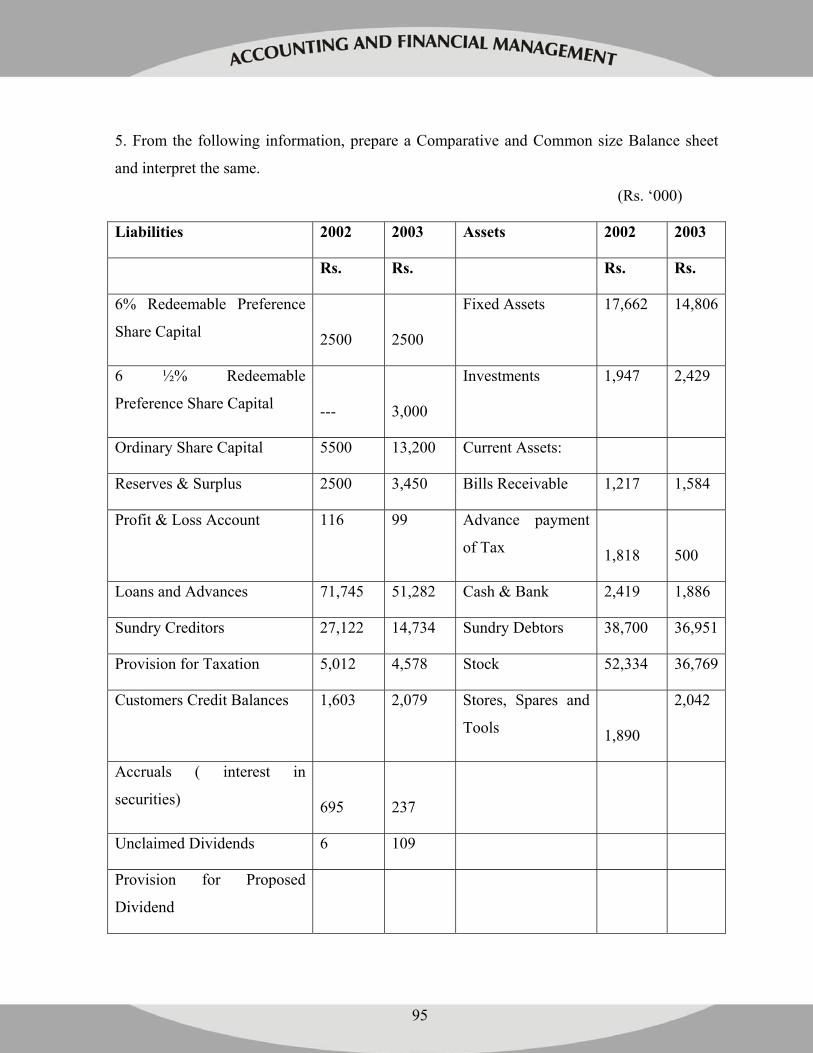
95
5. From the following information, prepare a Comparative and Common size Balance sheet
and interpret the same.
(Rs. ‘000)
Liabilities 2002 2003 Assets 2002 2003
Rs. Rs. Rs. Rs.
6% Redeemable Preference
Share Capital
2500
2500
Fixed Assets 17,662 14,806
6 ½% Redeemable
Preference Share Capital
---
3,000
Investments 1,947 2,429
Ordinary Share Capital 5500 13,200 Current Assets:
Reserves & Surplus 2500 3,450 Bills Receivable 1,217 1,584
Profit & Loss Account 116 99 Advance payment
of Tax
1,818
500
Loans and Advances 71,745 51,282 Cash & Bank 2,419 1,886
Sundry Creditors 27,122 14,734 Sundry Debtors 38,700 36,951
Provision for Taxation 5,012 4,578 Stock 52,334 36,769
Customers Credit Balances 1,603 2,079 Stores, Spares and
Tools
1,890
2,042
Accruals ( interest in
securities)
695
237
Unclaimed Dividends 6 109
Provision for Proposed
Dividend
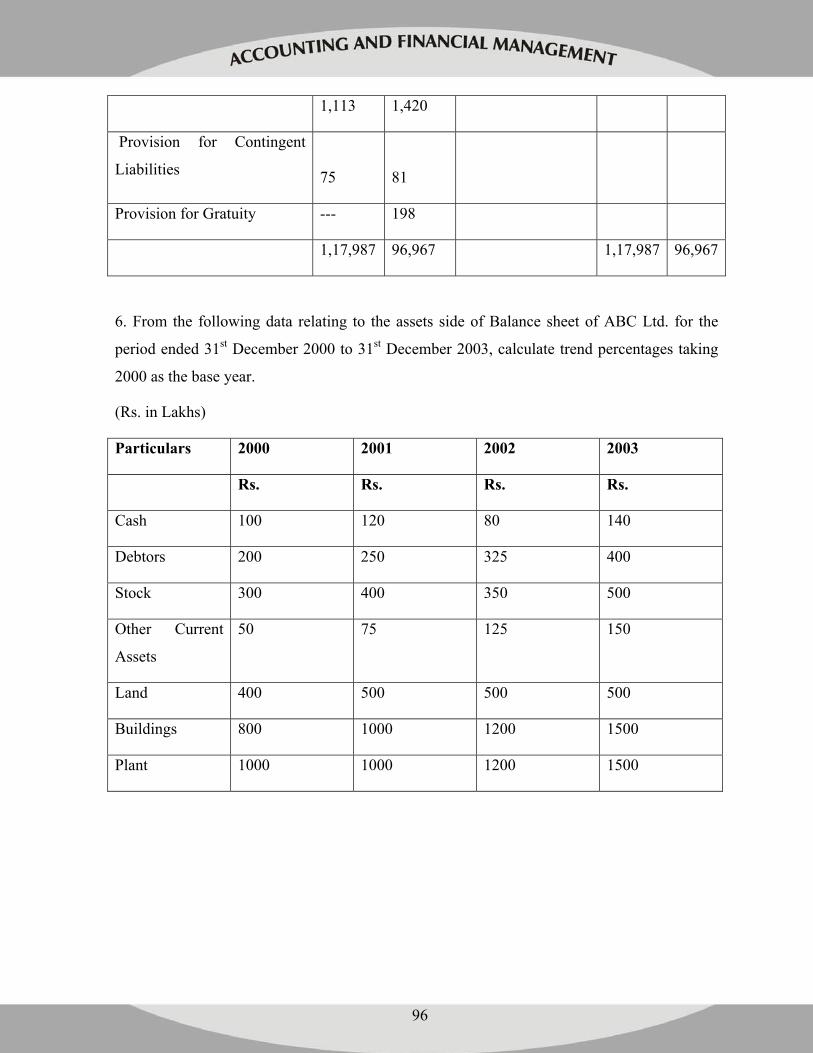
96
1,113 1,420
Provision for Contingent
Liabilities
75
81
Provision for Gratuity --- 198
1,17,987 96,967 1,17,987 96,967
6. From the following data relating to the assets side of Balance sheet of ABC Ltd. for the
period ended 31st December 2000 to 31st December 2003, calculate trend percentages taking
2000 as the base year.
(Rs. in Lakhs)
Particulars 2000 2001 2002 2003
Rs. Rs. Rs. Rs.
Cash 100 120 80 140
Debtors 200 250 325 400
Stock 300 400 350 500
Other Current
Assets
50 75 125 150
Land 400 500 500 500
Buildings 800 1000 1200 1500
Plant 1000 1000 1200 1500
97
FURTHER READINGS:
Khan M.Y. & Jain P.K., Management Accounting, Tata McGraw Hill
Publishing co.Ltd.
Maheswari S.N. , Principles of Management Accounting, Sultan Chand & sons, New
Delhi.
Pandey I.M., Management Accounting, Vikas Publishing House, New Delhi.
Sharma R.K. & Gupta S.K., Management Accounting, Kalyani Publishers, New Delhi.
Made Gowda J. , Management Accounting, Himalaya Publishing House, Mumbai
Saravanavel P. , Management Accounting, Principles and Practice, Crown publishing
House, 1986.
98
LESSON-5
FINANCIAL STATEMENT ANALYSIS: II
(RATIO ANALYSIS)
STRUCTURE:
5.1 Introduction
5.2 Meaning of Ratio and Ratio Analysis
5.3 Objectives of Ratio Analysis
5.4 Uses and Significance of Ratio analysis
5.5 Classification of Ratios
5.6 Profitability Ratios
5.7 Liquidity Ratios
5.8 Activity Ratios
5.9 Leverage Ratios
5.10 Coverage Ratios
5.11 Limitations of Ratio Analysis
5.12 Summary
5.13 Key words
OBJECTIVES:
Explain the meaning of Ratios and Ratio Analysis; State the objectives of Ratio Analysis Grasp the importance of Ratio Analysis; Understand the limitations of Ratios; Classify and interpret different kinds of ratios.
99
5.1 INTRODUCTION:
We have already studied in the preceding chapter that there are various techniques for
analyzing the financial statements, such as Comparative Statements, Common size Statements
and Trend Analysis. The Financial Statements viz., the Balance Sheet and the Profit and Loss
Account are the end products of the accounting process, which are expressed in absolute
monetary units do not provide much scope for understanding the liquidity, solvency
profitability and operational efficiency of the business concern. For a meaningful and realistic
assessment of the financial position and performance of the firm the financial analyst should
try to establish and evaluate the relationships between different items of the Balance sheet and
Profit and loss account. Ratio analysis is one of the most powerful tools of financial analysis,
which is extremely useful in this regard. It is the process of establishing meaningful
relationship between two or more accounting figures of the Balance sheet and/or Profit and
loss account. With the help of ratios financial statements can be analyzed more clearly and
decision-making is facilitated from such analysis.
5.2 MEANING OF RATIO AND RATIO ANALYSIS:
The term ‘ratio’ refers to the arithmetical or quantitative relationship that exists between the
items or variables in the financial statements. In simple language, ratio is the one number
expressed in terms of another and can be calculated by dividing one number with the other.
The relationship between two or more accounting figures/groups is called a ‘financial ratio’ or
‘Accounting ratio’. A financial ratio helps the firm to summarize abundant financial data into
a concise form and further facilitates interpretation and conclusions about the profitability and
solvency of the firm. A ratio may be expressed as quotient or rate or percentage. In financial
analysis, a ratio is used as an indicator or yardstick for evaluating the financial position and
performance of a firm.
100
Since the analysis and interpretation of financial statements is made with the help of ratios, so
it may be called as ratio analysis. Ratio analysis is the process of computing, determining and
interpreting the relationships between two accounting figures based on financial statements.
5.3 OBJECTIVES OF RATIO ANALYSIS:
With the help of ratio analysis one can measure the financial condition of a firm. Ratios act as
an index/barometer of the efficiency of the enterprise. It also facilitates Inter and Intra firm
comparison. The main objectives of ratio analysis are to:
1. To analyze the liquidity position of the firm in terms of long term and short term solvency.
2. To know the credit worthiness of the concern.
3. To analyze the capital structure of the business.
4. To evaluate the firms profitability over a period of time and predict its future capacity.
5. To assess the efficiency of the firm in terms of the various assets employed.
6. To find out the financial health of the firm.
7. To measure the earning power of the concern.
5.4 USES AND SIGNIFICANCE OF RATIO ANALYSIS:
Ratio analysis is one of the most powerful tools of financial analysis. With the help of ratio
analysis we can know the financial health of a firm. Ratios act as an indicator of the efficiency
of the firm. Ratios have wide applications and are of immense use. The important advantages
of ratio analysis are:
• Ratios are important tools, which will help in maximizing profits and minimizing
costs.
• Ratio analysis helps to frame policies for future including capital expenditure
decisions.
• The utility of ratio analysis lies in the fact that it presents data on a comparative basis
and enables drawing conclusions regarding the operating efficiency of a firm.
101
• Ratio analysis helps the employees by providing them the information related to the
profitability of the company, which becomes the basis for claiming their benefits.
• Ratio analysis will be useful to the investor in taking decisions relating to investment
by presenting the information relating to financial soundness of the concern.
• Ratios allow comparisons within the firm and with other firms, so that healthy
competition prevails not only between the divisions of the firm but also between the
firms.
• Ratios are helpful to the management in identifying the loopholes of the firm, so that
necessary action can be taken in time.
• The trend ratios enable to know whether the firm has improved its performance over a
period of time.
• Ratio analysis is very much useful to the management in carrying out their functions
like planning, forecasting, coordination and control.
• Ratios enable the financial analyst to summarize and evaluate the financial data to
measure the firm’s performance in terms of solvency and profitability.
• With the help of ratio analysis one can measure the firm’s solvency both long term
and short term efficiency and earning power can be assessed.
5.5 CLASSIFICATION OF RATIOS:
For analysis and interpretation of financial statements ratios can be classified in a number of
ways depending on the basis adopted. They may be classified on the basis of their source,
nature, importance and function.
Ratios which are broadly classified according to the purpose or function, which they are
expected to perform are called as functional ratios, Liquidity ratios, Solvency ratios,
Profitability ratios, Turnover ratios, Coverage ratios are examples of functional ratios.
The ratios have to be studied together in order to determine the financial soundness of the
business. In order that ratios serve as a tool of financial analysis, ratios have to be classified
under the following broad heads.
102
• Profitability ratios
• Liquidity ratios
• Activity or turnover ratios
• Financial ratios
• Leverage ratios
• Coverage ratios
5.6 PROFITABILITY RATIOS:
The profitability ratios measure the operational efficiency or the profitability of the concern.
There are different parties who are interested in knowing profits of the firm. Among them
there are three groups of persons who are interested in the analysis of the profitability of the
firm. The shareholders/owners are interested in the ultimate return on their investment; the
management is interested in the overall profitability and operational efficiency of the firm and
the bankers, credit granting institutions, creditors who are interested in the credit worthiness
of the firm. Therefore, every firm should earn sufficient profits in order to discharge its
obligations towards the various parties concerned. Profit is determined by two important
factors i.e. sales and investment. Accordingly, profitability ratios can be calculated under
these two heads.
1. Profitability ratios in relation to sales and
2. Profitability ratios in relation to investment
Every firm should earn adequate profits on each rupee of sales in order to cover its operating
and non-operating expenses (like interest charges etc.). Similarly, the firm should earn
sufficient return on its investment in assets and in terms of capital employed, otherwise the
firm’s survival will be at stake.
103
Profitability ratios in relation to Sales:-
Under this category, many ratios are calculated relating to different concepts of profits to
sales. Some of them are:-
Gross Profit Ratio:-
The gross profit ratio is also called the gross margin ratio or average mark up ratio. This ratio
establishes the relationship between Gross profit and Net sales. It is expressed as a percentage
of Gross profit earned on sales. The formula for calculating the gross profit ratio is as under:
Gross Profit Ratio = Gross Profit x 100
Net Sales
Where Gross profit = Net sales – Cost of goods sold
Net Sales = Total sales- Sales Returns
Cost of Goods Sold = Opening stock+ Purchases+ Direct expenses- Closing Stock
The ideal norm for this ratio is higher the ratio, the better it is. A low ratio indicates that there
is a decrease in selling price without a proportionate decrease in cost of goods sold or there is
an increase in cost of production. The gross profit should be sufficient to meet fixed expenses
and non-operating expenses, and for building up of reserves.
Operating Ratio:-
This ratio establishes relationship between operating cost and the net sales, which is expressed
as a percentage of sales. Operating cost is the sum total of the cost of goods sold and other
operating expenses for running the business. But it excludes all non-operating incomes and
expenses like interest and dividends, interest paid on long term borrowings, profit or loss on
sale of fixed assets. It is calculated as follows:
Operating ratio = Operating cost x 100
Net Sales
104
Where operating cost = Cost of goods sold+ Administration expenses+ Selling and
Distribution expenses – Financial expenses – Abnormal losses.
Cost of goods sold = Sales – Gross Profit Or
Operating ratio = Cost of Sales x 100
Net Sales
Cost of Sales = Cost of goods sold + Operating expenses
It is always better to have a lower ratio. Higher operating ratio is unfavourable because it
would leave small amount of operating profit for meeting financial charges and for creating
reserves.
Operating Profit Ratio:-
This ratio establishes the relationship between operating profit and Net Sales. It is calculated
as follows:-
Operating Profit Ratio = Operating Profit x 100 Or
Net Sales
Operating Profit Ratio = 100 – Operating ratio
Where Operating profit = Gross profit – Operating expenses.
This ratio should be always on the higher side. The ratio denotes the amount left over after
meeting all the operating costs and operating expenses.
Expenses Ratio:-
Operating costs comprises of Manufacturing costs, administration expenses and selling and
distribution expenses. In order to know how individual expenses have their impact on sales,
these expense ratios are calculated. These expense ratios are given below:
1. Manufacturing cost ratio = Manufacturing cost x 100
Net Sales
2. Administration expenses ratio = Administration expenses x 100
Net Sales
3.Selling and Distribution expenses ratio = Selling and distribution expenses x100
Net Sales
105
Any item of expenditure can be shown as a ratio to sales. A lower expenses ratio is better for
the firm.
Net Profit Ratio:-
It is an important ratio as it indicates the overall profitability of the firm. It is calculated by
dividing net profit by net sales. The purpose of this ratio is to reveal the amount of profit left
to shareholders after meeting all costs and expenses of the business. The ideal ratio is higher
the ratio better it is. Higher ratio indicates greater profitability of the concern. Therefore,
Net Profit ratio = Net profit after tax x 100
Net Sales
Profitability Ratios in relation to Investment:-
Profitability of a firm can be measured in terms of the investment made. The profitability of a
firm can also be analyzed with reference to assets employed in the business. In order to know
how much amount of profits is earned on the investment made on the assets, there are a
number of other profitability ratios, which are calculated for estimating the efficiency of the
concern. The important ratios are discussed here under:
Return on Investment Ratio (ROI Ratio)
This ratio is also known as return on capital employed (ROCE) or over all profitability ratio
or primary ratio. The Profitability of the firm can be analyzed from the point of view of the
total funds employed into the business.
Capital Employed = Equity share capital + Preference share capital + Reserves and Surplus
+Profit and loss account balance+ long-term loans+ Debentures-Fictitious assets.
Alternatively, it is also calculated as
Capital employed = Tangible assets + Intangible fixed assets + Current assets – Current
liabilities
106
Fictitious assets means any amount shown on the assets side of the balance sheet such as
preliminary expenses, discount on issue of shares and debentures, debit balance of profit and
loss account, deferred revenue expenditure.
Higher the ratio the better it is. Higher the return on capital employed the more efficient the
firm is. The formula for calculating the ROI is as follows:-
ROCE = Net profit before Interest and Tax x 100
Capital Employed
Return of Assets Ratio (ROA Ratio)
This ratio is calculated to evaluate the profitability of the investment made in the assets of the
firm. It is calculated by the following formula:
ROA = Net Profit after Taxes x 100
Total Assets
Where Total assets = Fixed assets +Current assets +Investments. Fictitious assets are not
included for calculation of this ratio. With the help of this ratio the firm can know whether is
assets are properly utilized or not. Higher the ratio better it is for the company.
Return on Net worth Ratio
A return on shareholders equity is calculated to assess the profitability of the owner’s
investment. The ratio measures the relationship between the Net profit and shareholders
funds. The shareholders equity is also called net worth, which is calculated as follows:-
Net worth (shareholders equity or funds) = Equity share capital+ Preference
share capital+ Reserves and surplus – Fictitious assets.
And Return on Net worth ratio = Net profit after tax x 100
Net worth
107
The higher the ratio, the better it is for owners of the company. However, in order to know
whether the returns are adequate or not, inter firm comparisons should be made.
Return on Equity Shareholders Funds
Equity shareholders who are the owners of the company are eligible for all the profits
remaining after paying out all outside claims and preference dividend. This ratio expresses the
equity shareholders return on their investments. It is calculated as
Return on Equity shareholders funds = Profit after tax – Preference Dividend x100
Equity shareholders funds
Where Equity shareholders funds = Equity share capital +Reserves and surplus –Accumulated
losses.
A higher ratio is better for the equity shareholders.
Return on Fixed Assets Ratio
This ratio is calculated to measure the profit after tax earned against the investments made in
fixed assets, to find out whether the assets are properly used or not in the business. It is
calculated as
Return on Fixed Assets ratio = Profit after Tax x 100
Fixed Assets
The higher the ratio, better for the company.
Return on Current Assets Ratio
This ratio is calculated to measure the profit after tax earned against the investments made in
current assets. It is calculated as
Return on Current assets = Profit after Tax x 100
Current Assets
108
Return on Working Capital Ratio
Working capital is the capital which is required to meet the day to day operations of the
concern. It is calculated by the following formula:
Working capital = Current assets – Current liabilities
This ratio enables us to understand how the working capital was utilized in running the
business for earning the profits. The ratio is calculated as under:
Return on Working capital ratio = Net profit after interest and tax x 100
Working capital
Earnings per Share (EPS)
The profitability of a firm can also be measured in terms of number of equity shares. This
ratio is known as EPS, which is useful in investment analysis and also financial analysis. EPS
is calculated by employing the following formula:
EPS = Net profit after tax – Preference Dividend
Number of equity shareholders
The higher the EPS, the better is the performance of the company. To assess the relative
profitability of the firm its EPS should be compared with that of similar concerns and the
industry average.
Dividend per Share (DPS)
This ratio establishes the relationship between the net profits distributed after interest and
preference dividend to equity shareholders and the number of equity shares. The purpose of
this ratio is to show dividend paid to equity shareholders on per share basis. It is calculated as:
Dividend per share = Earnings distributed as dividend to equity shareholders
Number of equity shares
109
From the present and potential investor’s point of view, a higher dividend per share is a good
sign. A large number of investors are usually interested in DPS rather than in EPS. However,
the company should consider a number of factors before declaring any dividend.
Price Earnings Ratio (PE ratio)
This ratio establishes the relationship between market price of share of a company and EPS
of that company. The PE ratio indicates the expectations of the equity investors about the
earnings of the firm. This ratio helps the shareholders in deciding whether the shares should
be sold or purchased. PE ratio is calculated as follows:
Price Earnings Ratio = Market price per share x 100
EPS
From the point of view of investors, the higher the ratio, the better it is.
Dividend Yield Ratio and Earnings Yield Ratio
The purpose of calculating dividend yield ratio is to know current rate of return to the
shareholders as a percentage of their investment. It is calculated as:
Dividend yield ratio = Dividend per share x 100
Market value per share
The purpose of calculating earnings yield ratio is to evaluate the rate of return of shareholders
in relation to the market value per share. It is calculated as:
Earnings Yield ratio = EPS x 100
Market value per share
The earnings yield and the dividend yield evaluate the profitability of the firm in terms of the
market price of the share. The higher these ratios, the better would be the return to
shareholders and vice versa.
110
Dividend Pay-out ratio (D/P ratio)
The DP ratio is the relationship between the DPS and the EPS of the firm. This ratio indicates
as to what proportion of EPS is being declared as dividend and what percentage is retained by
the company in the business. The proportion of retained earnings is equal to 100-DP ratio. DP
ratio is calculated as under:
Dividend Pay out ratio = Dividend per Share
Earning per share
The shareholder must look for a low pay out ratio.
Book value of Equity Share
It is the relationship between the amount of net worth or shareholders funds of the firm, to one
equity share of the business. It is determined as:
Book value of equity share = Equity shareholders funds or Net worth
Number of equity shares
5.7 LIQUIDITY RATIOS:
These ratios are also termed as ‘working capital ratio’ or short-term solvency ratio. These
ratios measure the short-term solvency of the firm. Liquidity is the ability of a firm to meet its
current or short-term obligations when they become due. The short-term creditors like
suppliers of goods, banks which provide short term credit are primarily interested in the
company’s ability to meet its short term obligations. The firm can meet its short term
obligations only when it has sufficient liquid funds. Some of the common liquidity ratios are:
Current Ratio
Liquid Ratio
Absolute Quick Ratio
111
Current Ratio /Working Capital Ratio
Current ratio is the most widely used ratio, which studies the short term financial position of
the company. This ratio establishes the relationship between current assets and current
liabilities. For computing this ratio, the following formula is used.
Current ratio = Current Assets
Current Liabilities
This ratio is also called working capital ratio. The reason being the two components of
working capital, i.e., current assets and current liabilities are used for calculating this ratio.
Current assets are the assets, which can be converted into cash within one year. Cash in hand,
cash at bank, inventory/stock, Debtors, bills receivable, short term investments, outstanding
incomes, prepaid expenses, etc are the examples of current assets.
Current liabilities are those liabilities, which are to be paid within one year. Creditors, Bills
payable, outstanding expenses, bank overdraft, tax payable, dividend payable, short term
loans etc are the examples of current liabilities.
The standard norm for the current ratio is 2:1. If the current assets are 2 times of current
liabilities, then the business operations will not be adversely affected as current liabilities can
still be paid. If the ratio is less than 2, the business doesn’t enjoy adequate liquidity. And if the
ratio is more than 2, it implies that funds are idle and has not been invested them properly.
Therefore, every firm should strike a balance between liquidity and profitability.
Quick Ratio or Acid Test Ratio
This ratio measures the relationship between quick current assets and current liabilities. Quick
current assets are those assets, which can be quickly converted in cash without loss of time or
value. It includes all current assets except stock and prepaid expenses.
112
Quick assets = Current assets – (Stock + prepaid expenses)
It is an acid test of a concern’s liquidity position. The quick ratio is calculated by dividing
quick assets by current liabilities.
Quick Ratio = Quick Assets
Current liabilities
Sometimes instead of total current liabilities, only those current liabilities are taken, which are
really payable within one year. Then the formula for calculating quick ratio will become:
Quick ratio = Quick Assets/Liquid Assets
Quick liabilities
Generally, a Quick ratio of 1:1 is considered to be ideal. Ratio below 1 is an indicator of
inadequate liquidity and above 1 is also not advisable.
Absolute Quick Ratio or Super Quick Ratio
This ratio establishes relationship between the absolute liquid assets and liquid liabilities.
However, for calculation purposes, it is taken as absolute quick assets to current liabilities.
Absolute quick ratio = Absolute quick assets
Current liabilities
Absolute quick assets = cash in hand + cash at bank + short term marketable securities
Current liabilities
The ideal ratio is 0.5:1. This ratio is a conservative test of liquidity and is not widely used in
practice.
113
5.8 ACTIVITY RATIOS OR TURNOVER RATIOS/ PERFORMANCE RATIOS:
Turnover Ratios measure the relationship between sales and various assets. Activity ratios are
employed to evaluate the efficiency with which the firm manages and utilizes its resources
and assets. These ratios are also called turnover ratios, because they indicate the speed with
which assets are being converted or turned over into sales. These activity ratios are also
known as ‘efficiency ratios’, because these ratios indicate the efficiency with which the firm
manages and uses its assets. Some of the important Activity ratios are discussed below:
Capital Employed Turnover Ratio or Capital Turnover Ratio
This ratio examines the efficiency of Capital employed in the business. This ratio indicates the
firms’ ability to generate sales per rupee of the Capital Employed.
Capital Turnover Ratio = Net Sales
Capital Employed
The higher the ratio, the more efficient is the firm in the utilization of owners’ and long term
creditors’ funds.
Total Assets Turnover Ratio
This ratio shows the firms’ ability in earning sales in relation to Total assets employed in the
business. This ratio measures the overall performance and efficiency of the firm. This ratio is
calculated as under:
Total Assets Turnover ratio = Total Sales
Total Assets
The standard norm for this ratio is 2 times. A higher ratio indicates overtrading and lower
ratio indicates that the assets are idle.
114
Fixed Assets Turnover Ratio
This ratio indicates the firms’ efficiency in utilizing the fixed assets for generating sales and
earning profits. This ratio is considered important because firms make large investments in
fixed assets for producing sales. It is calculated by dividing net sales by fixed assets.
Fixed Assets Turnover ratio = Net Sales
Net Fixed Assets
Net fixed assets imply fixed assets after depreciation. Normally, a ratio of 5 times is
considered as ideal. The fixed assets turnover ratio can further be divided into turnover of
each item of fixed assets to know the extent of each fixed asset in relation to sales, whether
they have been properly utilized. Then the formula will be:
Plant and Machinery Turnover ratio = Net Sales
Plant and Machinery (Net)
Buildings Turnover Ratio = Net Sales
Buildings (Net)
Current Assets Turnover Ratio
It indicates the efficiency of the firms’ investments in current assets in relation to Net Sales.
This ratio is calculated as :
Current Assets Turnover ratio = Net Sales
Current Assets
A higher ratio indicates the firms efficiency in earning profit by efficient utilization of current
assets and vice versa.
115
Working Capital Turnover Ratio
This ratio indicates whether or not working capital has been effectively utilized in making
sales. It is calculated as under:
Working capital Turnover Ratio = Net Sales Or = Cost of goods sold
Net working capital Net Working Capital
There is no standard norm for this ratio. Firms should have adequate and appropriate working
capital to justify the sales generated.
Stock Turnover Ratio or Inventory Turnover Ratio
This ratio indicates the rapidity with which the stock is turned into sales. It also indicates the
efficiency of the firms’ inventory management. It is calculated as under:
Stock Turnover Ratio = Cost of goods sold
Average Inventory
Average Stock = Opening Stock + Closing Stock
2
In case, the information regarding cost of goods sold and average stock is not given, then
stock turnover ratio can be calculated as:
Stock Turnover Ratio = Sales
Closing Stock
Higher the ratio, the better it is for the company, as the ratio shows that the finished stock is
turned over rapidly. Usually a stock turnover ratio of “8” is considered as an ideal one.
116
Stock Velocity or Stock Conversion Period
It indicates the time taken by the stock to get converted into sales, which is expressed in terms
of months, weeks or number of days. That is
Stock Velocity (Days) = Average Stock x 365
Cost of goods sold
Or
Stock Velocity (Months) = Average Stock x 12
Cost of goods sold
Or
Stock Velocity (Weeks) = Average Stock x 52
Cost of goods sold
A higher stock velocity is always better.
Debtors/Receivables Turnover Ratio
It establishes the relationship between accounts receivables i.e.(Debtors+Bills receivable) and
credit sales. This ratio indicates the speed with which these debtors are collected which affects
the liquidity position of the firm. Debtors turnover ratio is calculated as under:
Debtors Turnover ratio = Net Credit Sales
Average Trade Debtors
Where net credit sales = credit sales – sales returns
Trade debtors = Sundry debtors+ Bills receivable+ Accounts receivable
Average trade debtors = Opening trade debtors +Closing trade debtors
2
If the information about credit sales and average debtors is not given, then total sales and
closing debtors should be taken for calculating debtors turnover ratio. A debtors turnover ratio
of 10-12 is usually considered as ideal. A higher debtors turnover ratio is an indicator of
sound credit management policy.
117
Debt Collection Period Ratio/Debtors Velocity/ Average Collection Period
It shows the time taken for the debtors to get converted into cash. It is calculated as
Debt Collection Period Ratio = No of days or Months or weeks in a year
Debtors Turnover ratio
Lower the period, it is better for the firm and the ideal period is 30-36 days.
Creditors/Accounts Payable Turnover Ratio
It expresses the relationship between creditors and purchases. The purpose of this ratio
is to know the speed with which payments are made to creditors for credit purchases. This
ratio gives the average credit period enjoyed from the creditors and is calculated as:
Creditors Turnover ratio = Net Credit Purchases
Average Creditors
Or
Creditors Turnover ratio = Total Purchases
Closing Creditors
A high ratio indicates that creditors are not paid in time, while a low ratio indicates firms’
inefficiency in availing the credit facility allowed by creditors.
Creditors Velocity/Average Payment Period Ratio
This ratio shows the number of days taken by the firm to pay off its debts and is
calculated as:
Creditors Velocity = Number of days or months or weeks in a year
Creditors Turnover ratio
The average payment period gives an ideal about the number of days the fir m can post pone,
on an average, its payment to the creditors.
118
5.9 FINANCIAL AND LEVERAGE RATIOS:
The financial position of the firm can be analyzed from two angles viz., the short term
financial position and the long term financial position. The short-term financial position can
be studied from liquidity ratios, which has already been discussed. The long term creditors
like debenture holders, financial institutions etc. judge the financial soundness of the firm in
terms of its ability to pay interest regularly during the period of loan as well as make
repayment of the principal amount on maturity. The long-term solvency of the firm can be
examined with the help of the leverage or capital structure ratios. These ratios are also known
as ‘long term solvency ratios’ or ‘capital gearing ratios’. There are two aspects of the long-
term solvency of the firm, to repay the principal amount on maturity and pay interest at
periodic intervals. These two aspects give rise to two types of leverage ratios.
1. The first type of leverage ratios, which establishes the relationship between borrowed funds
and owned funds and are computed from Balance sheet. Some of the leverage ratios are:
(a) Debt-Equity ratio
(b) Proprietory ratio
( c) Capital gearing ratio
2. The second type of leverage ratios, which are also called as “coverage ratios’ are computed
from profit and loss account. They are:
(a) Interest coverage ratio
(b) Dividend coverage ratio
Debt-Equity Ratio
This ratio is also called ‘External equities to internal equities ratio. It shows the relationship
between borrowed funds and owners’ funds or external funds (debt) and internal funds
(equity). There are a number of approaches to the calculation of debt equity ratio.
119
Debt equity ratio = External equities Or = Total debt
Shareholders funds Internal equities
Total debt includes long-term liabilities and current liabilities. Shareholders funds consist of
equity share capital, preference share capital, capital reserves, revenue reserves, accumulated
profits and other surpluses. However, accumulated losses and deferred expenses are to be
deducted. Another approach is
Debt equity ratio = Long term debt
Shareholders equity
Debt equity ratio of 2:1 is considered ideal. A very high debt equity ratio is unfavourable and
low ratio implies that the creditors are relatively at lower risk.
Proprietory Ratio
This ratio is also known as equity ratio or net worth to total assets ratio. The purpose of this
ratio is to express the obligation of owners in the total value of assets. It gives an idea about
the extent to which the owners have financed the firm. It is calculated as:
Proprietory ratio = Net worth Or = Proprietory funds
Total Assets Total Assets
Where proprietory funds include equity share capital, preference share capital, Reserves and
surplus and undistributed profits and accumulated losses should be deducted. There is no
standard norm for this ratio. But some of the financial expert’s view that proprietory funds
should be from 67% to 75% and outsider’s funds should be from 25% to 33%. A high ratio
implies that the firm is not optimally utilizing its outsider’s funds.
Capital Gearing Ratio
This ratio establishes a relationship between funds bearing fixed interest or fixed dividend and
the equity shareholders funds. The fixed interest bearing funds are debentures and long term
loans and fixed dividend bearing funds are preference shareholders. The proportion of
120
debentures and preference share capital to net worth or equity funds is referred to as capital
gearing ratio. It can be calculated as:
Capital Gearing Ratio = Funds bearing fixed interest/fixed dividend
Equity shareholders funds
A firm is said to be highly geared when the sum of preference capital and all other fixed
interest bearing securities is more than the equity capital. On the other hand, a firm is said to
be low geared when the sum of equity capital is more that the sum of preference capital and
all other fixed interest-bearing securities. The ideal norm for this ratio is 2:1.
5.10 COVERAGE RATIOS:
The second type of leverage ratios is coverage ratios. In order to judge the solvency of the
firm the creditors assess the firms’ ability to service their claims. In the same way, preference
shareholders evaluate the firm’s ability to pay the dividend. These aspects are revealed by the
coverage ratios. These ratios measure the ability of the firm to satisfy the claims of creditors,
preference shareholders and debenture holders. These ratios are:
• Interest Coverage ratios and
• Dividend coverage ratios
Interest Coverage Ratio
This ratio is also known as “Debt Service Ratio”. One of the approaches to test the solvency
of the firm is interest coverage ratio. A firm is considered solvent then its business is earning
sufficient profits to pay the interest charges, particularly where payment of fixed interest on
long term loans is concerned. The ratio is calculated as under:
Interest Coverage Ratio = Earnings before interest and tax
Fixed interest charges
A Debt service ratio of around 6 times is normally considered as ideal. Higher the ratio, the
better it is from the point of creditors. But too high a ratio indicates that the firm is very
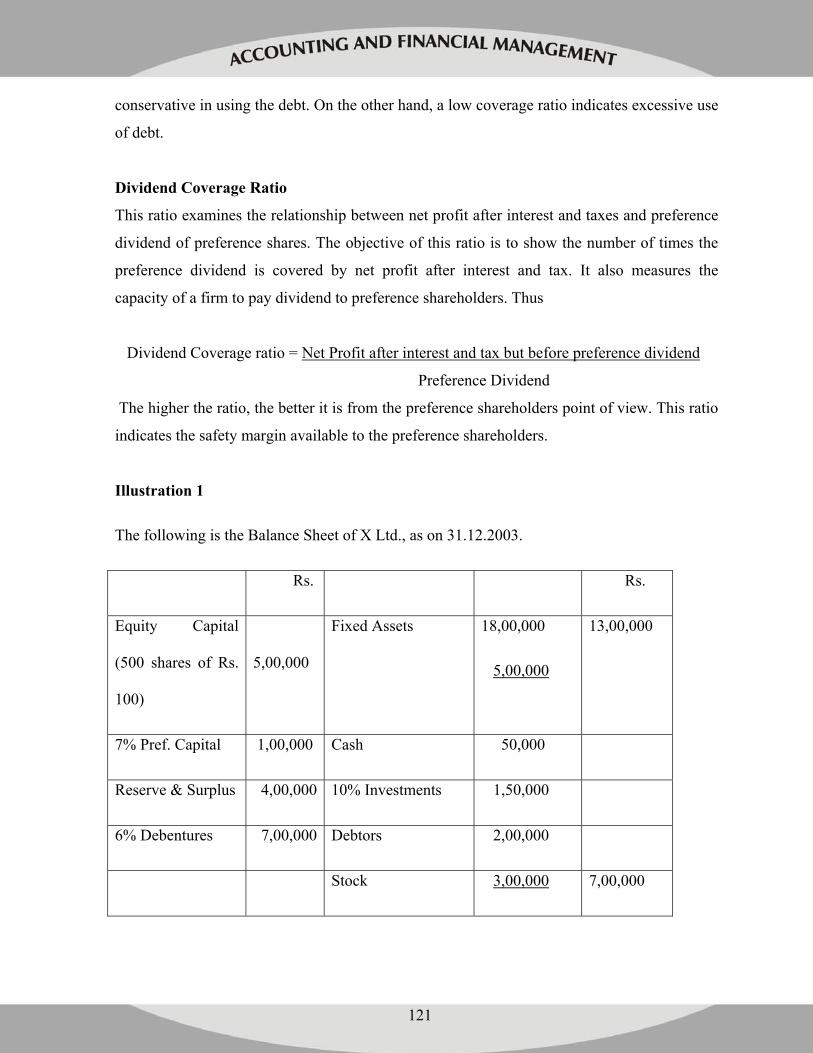
121
conservative in using the debt. On the other hand, a low coverage ratio indicates excessive use
of debt.
Dividend Coverage Ratio
This ratio examines the relationship between net profit after interest and taxes and preference
dividend of preference shares. The objective of this ratio is to show the number of times the
preference dividend is covered by net profit after interest and tax. It also measures the
capacity of a firm to pay dividend to preference shareholders. Thus
Dividend Coverage ratio = Net Profit after interest and tax but before preference dividend
Preference Dividend
The higher the ratio, the better it is from the preference shareholders point of view. This ratio
indicates the safety margin available to the preference shareholders.
Illustration 1
The following is the Balance Sheet of X Ltd., as on 31.12.2003.
Rs. Rs.
Equity Capital
(500 shares of Rs.
100)
5,00,000
Fixed Assets 18,00,000
5,00,000
13,00,000
7% Pref. Capital 1,00,000 Cash 50,000
Reserve & Surplus 4,00,000 10% Investments 1,50,000
6% Debentures 7,00,000 Debtors 2,00,000
Stock 3,00,000 7,00,000
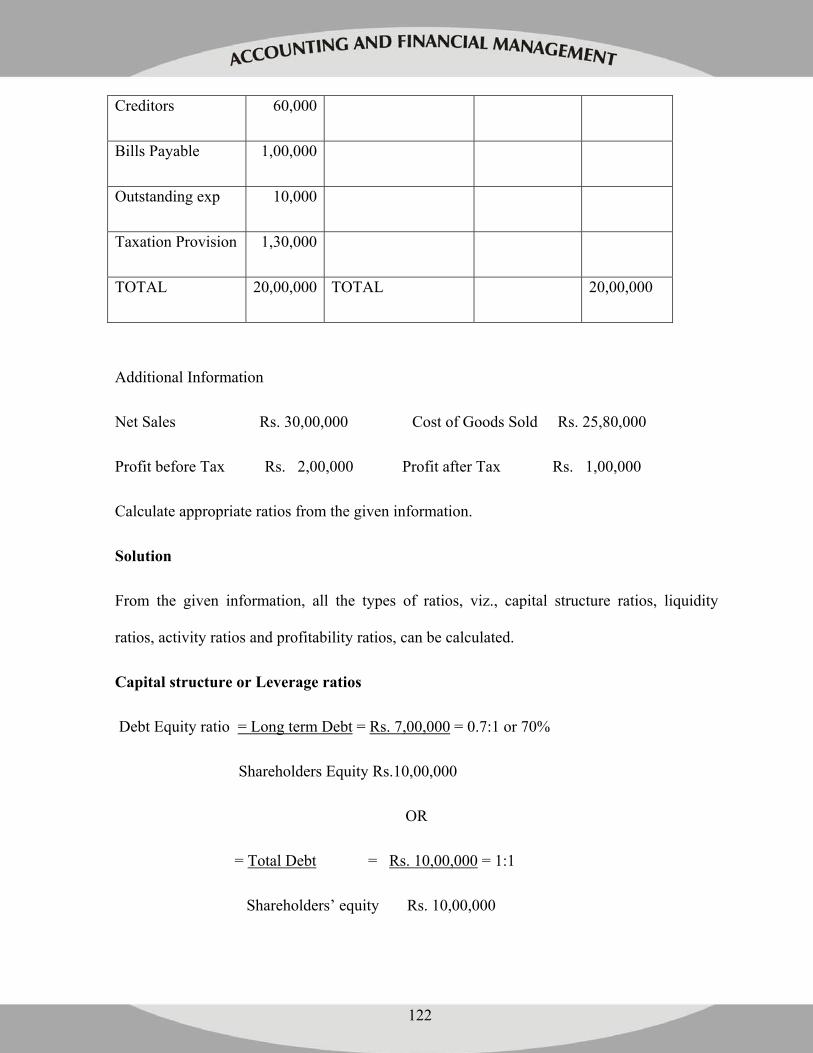
122
Creditors 60,000
Bills Payable 1,00,000
Outstanding exp 10,000
Taxation Provision 1,30,000
TOTAL 20,00,000 TOTAL 20,00,000
Additional Information
Net Sales Rs. 30,00,000 Cost of Goods Sold Rs. 25,80,000
Profit before Tax Rs. 2,00,000 Profit after Tax Rs. 1,00,000
Calculate appropriate ratios from the given information.
Solution
From the given information, all the types of ratios, viz., capital structure ratios, liquidity
ratios, activity ratios and profitability ratios, can be calculated.
Capital structure or Leverage ratios
Debt Equity ratio = Long term Debt = Rs. 7,00,000 = 0.7:1 or 70%
Shareholders Equity Rs.10,00,000
OR
= Total Debt = Rs. 10,00,000 = 1:1
Shareholders’ equity Rs. 10,00,000
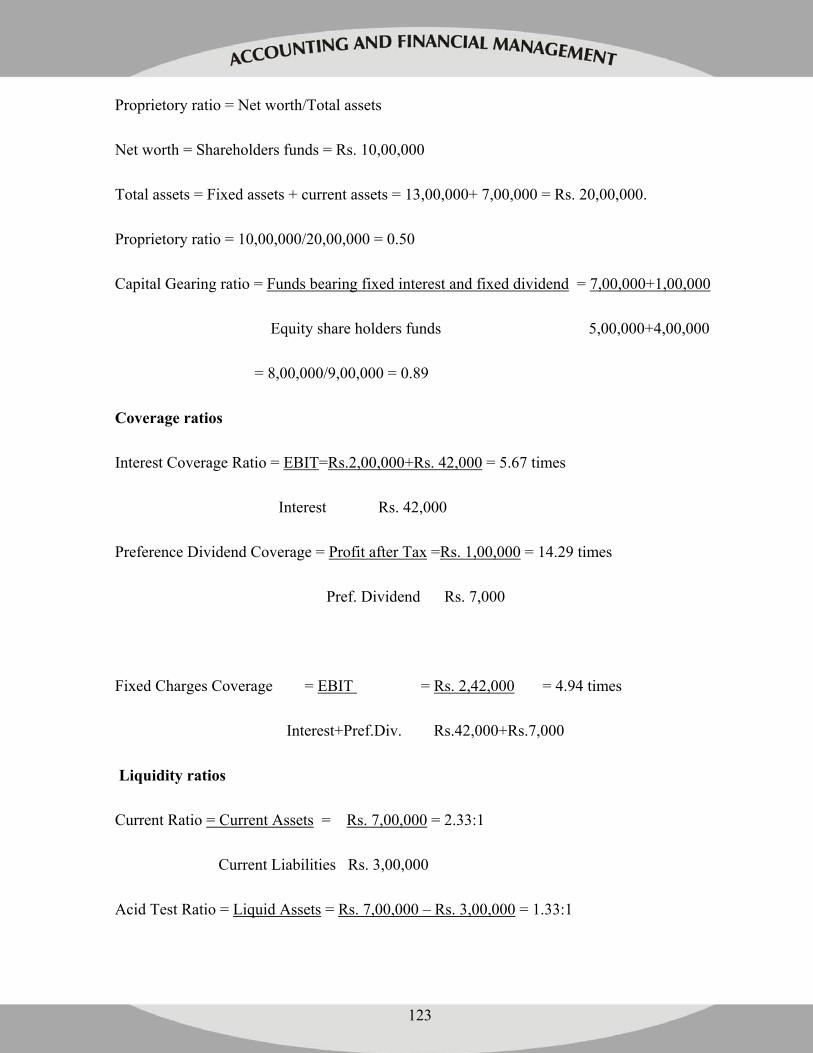
123
Proprietory ratio = Net worth/Total assets
Net worth = Shareholders funds = Rs. 10,00,000
Total assets = Fixed assets + current assets = 13,00,000+ 7,00,000 = Rs. 20,00,000.
Proprietory ratio = 10,00,000/20,00,000 = 0.50
Capital Gearing ratio = Funds bearing fixed interest and fixed dividend = 7,00,000+1,00,000
Equity share holders funds 5,00,000+4,00,000
= 8,00,000/9,00,000 = 0.89
Coverage ratios
Interest Coverage Ratio = EBIT=Rs.2,00,000+Rs. 42,000 = 5.67 times
Interest Rs. 42,000
Preference Dividend Coverage = Profit after Tax =Rs. 1,00,000 = 14.29 times
Pref. Dividend Rs. 7,000
Fixed Charges Coverage = EBIT = Rs. 2,42,000 = 4.94 times
Interest+Pref.Div. Rs.42,000+Rs.7,000
Liquidity ratios
Current Ratio = Current Assets = Rs. 7,00,000 = 2.33:1
Current Liabilities Rs. 3,00,000
Acid Test Ratio = Liquid Assets = Rs. 7,00,000 – Rs. 3,00,000 = 1.33:1
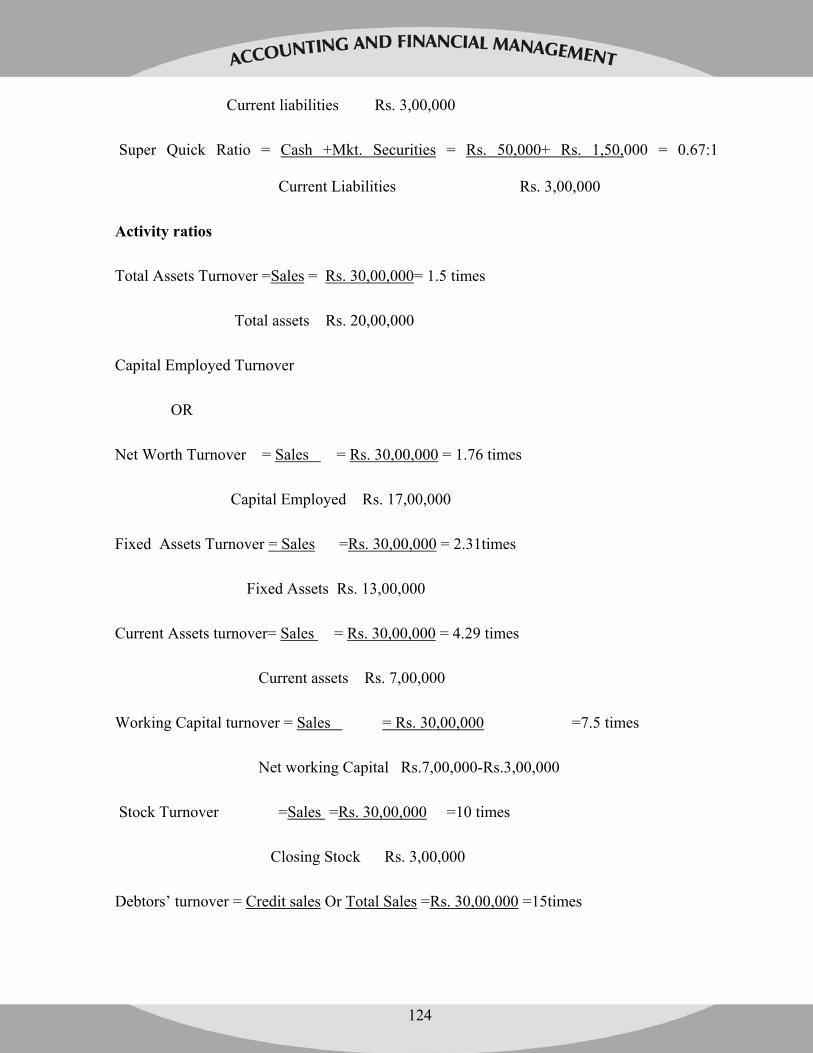
124
Current liabilities Rs. 3,00,000
Super Quick Ratio = Cash +Mkt. Securities = Rs. 50,000+ Rs. 1,50,000 = 0.67:1
Current Liabilities Rs. 3,00,000
Activity ratios
Total Assets Turnover =Sales = Rs. 30,00,000= 1.5 times
Total assets Rs. 20,00,000
Capital Employed Turnover
OR
Net Worth Turnover = Sales = Rs. 30,00,000 = 1.76 times
Capital Employed Rs. 17,00,000
Fixed Assets Turnover = Sales =Rs. 30,00,000 = 2.31times
Fixed Assets Rs. 13,00,000
Current Assets turnover= Sales = Rs. 30,00,000 = 4.29 times
Current assets Rs. 7,00,000
Working Capital turnover = Sales = Rs. 30,00,000 =7.5 times
Net working Capital Rs.7,00,000-Rs.3,00,000
Stock Turnover =Sales =Rs. 30,00,000 =10 times
Closing Stock Rs. 3,00,000
Debtors’ turnover = Credit sales Or Total Sales =Rs. 30,00,000 =15times
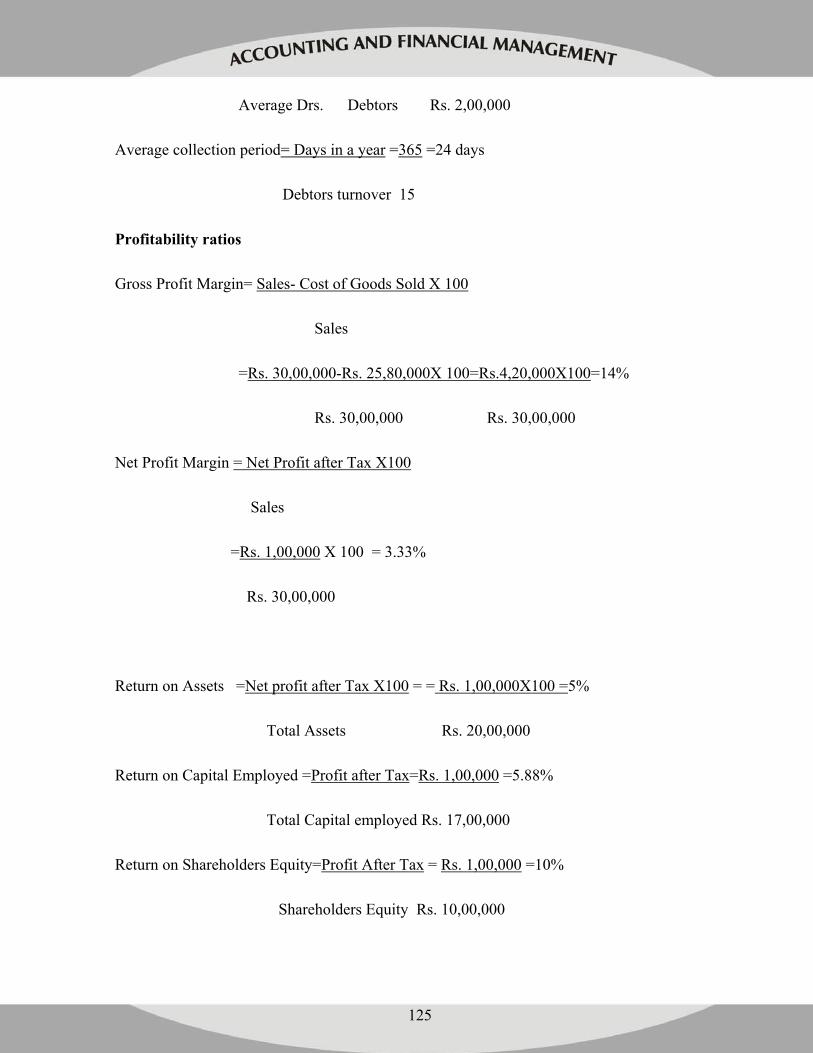
125
Average Drs. Debtors Rs. 2,00,000
Average collection period= Days in a year =365 =24 days
Debtors turnover 15
Profitability ratios
Gross Profit Margin= Sales- Cost of Goods Sold X 100
Sales
=Rs. 30,00,000-Rs. 25,80,000X 100=Rs.4,20,000X100=14%
Rs. 30,00,000 Rs. 30,00,000
Net Profit Margin = Net Profit after Tax X100
Sales
=Rs. 1,00,000 X 100 = 3.33%
Rs. 30,00,000
Return on Assets =Net profit after Tax X100 = = Rs. 1,00,000X100 =5%
Total Assets Rs. 20,00,000
Return on Capital Employed =Profit after Tax=Rs. 1,00,000 =5.88%
Total Capital employed Rs. 17,00,000
Return on Shareholders Equity=Profit After Tax = Rs. 1,00,000 =10%
Shareholders Equity Rs. 10,00,000
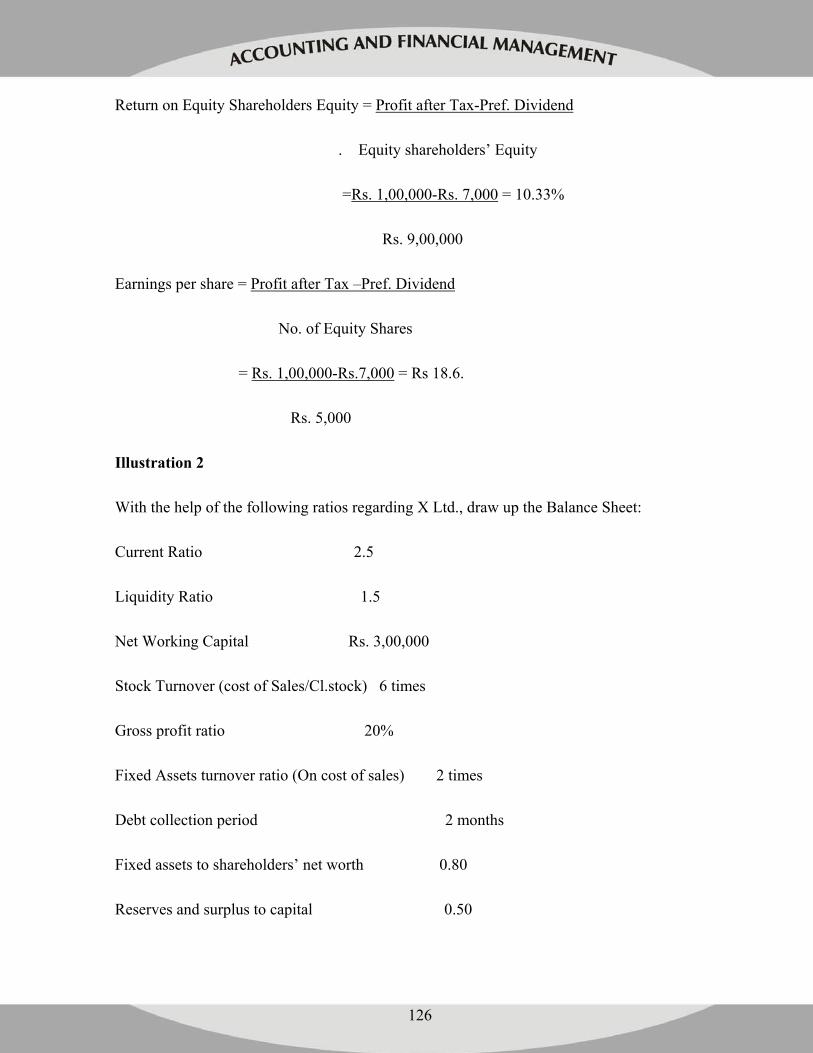
126
Return on Equity Shareholders Equity = Profit after Tax-Pref. Dividend
. Equity shareholders’ Equity
=Rs. 1,00,000-Rs. 7,000 = 10.33%
Rs. 9,00,000
Earnings per share = Profit after Tax –Pref. Dividend
No. of Equity Shares
= Rs. 1,00,000-Rs.7,000 = Rs 18.6.
Rs. 5,000
Illustration 2
With the help of the following ratios regarding X Ltd., draw up the Balance Sheet:
Current Ratio 2.5
Liquidity Ratio 1.5
Net Working Capital Rs. 3,00,000
Stock Turnover (cost of Sales/Cl.stock) 6 times
Gross profit ratio 20%
Fixed Assets turnover ratio (On cost of sales) 2 times
Debt collection period 2 months
Fixed assets to shareholders’ net worth 0.80
Reserves and surplus to capital 0.50
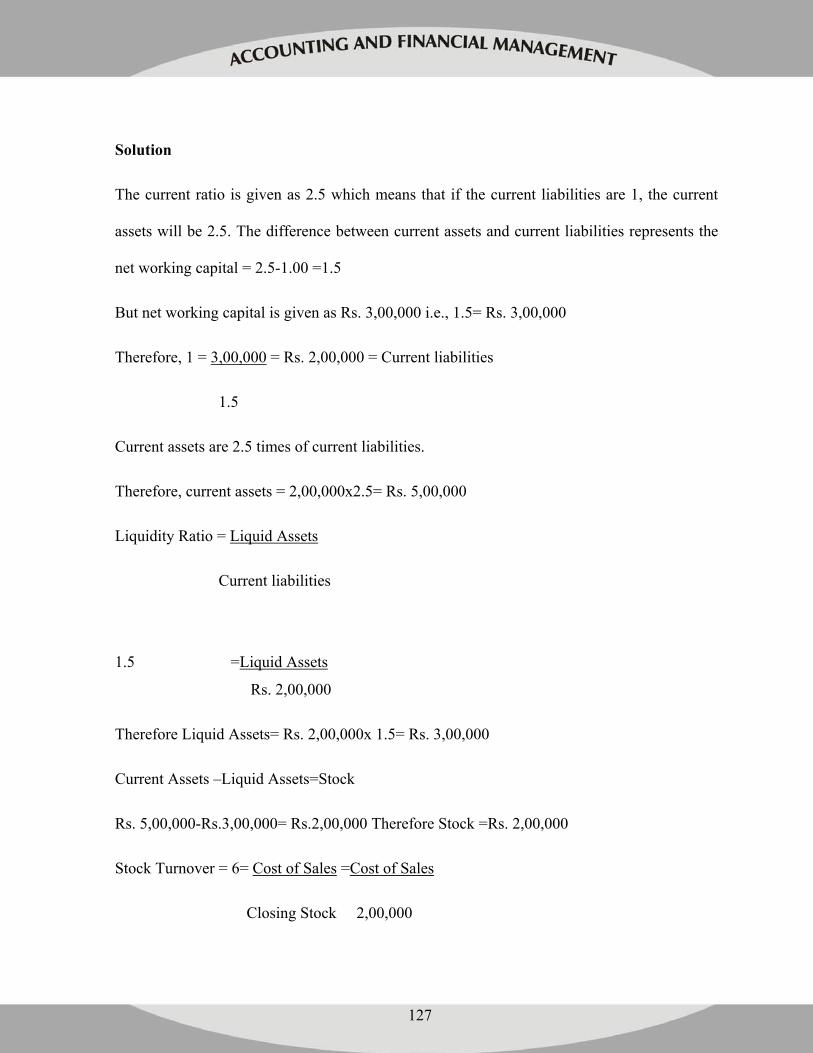
127
Solution
The current ratio is given as 2.5 which means that if the current liabilities are 1, the current
assets will be 2.5. The difference between current assets and current liabilities represents the
net working capital = 2.5-1.00 =1.5
But net working capital is given as Rs. 3,00,000 i.e., 1.5= Rs. 3,00,000
Therefore, 1 = 3,00,000 = Rs. 2,00,000 = Current liabilities
1.5
Current assets are 2.5 times of current liabilities.
Therefore, current assets = 2,00,000x2.5= Rs. 5,00,000
Liquidity Ratio = Liquid Assets
Current liabilities
1.5 =Liquid Assets
Rs. 2,00,000
Therefore Liquid Assets= Rs. 2,00,000x 1.5= Rs. 3,00,000
Current Assets –Liquid Assets=Stock
Rs. 5,00,000-Rs.3,00,000= Rs.2,00,000 Therefore Stock =Rs. 2,00,000
Stock Turnover = 6= Cost of Sales =Cost of Sales
Closing Stock 2,00,000
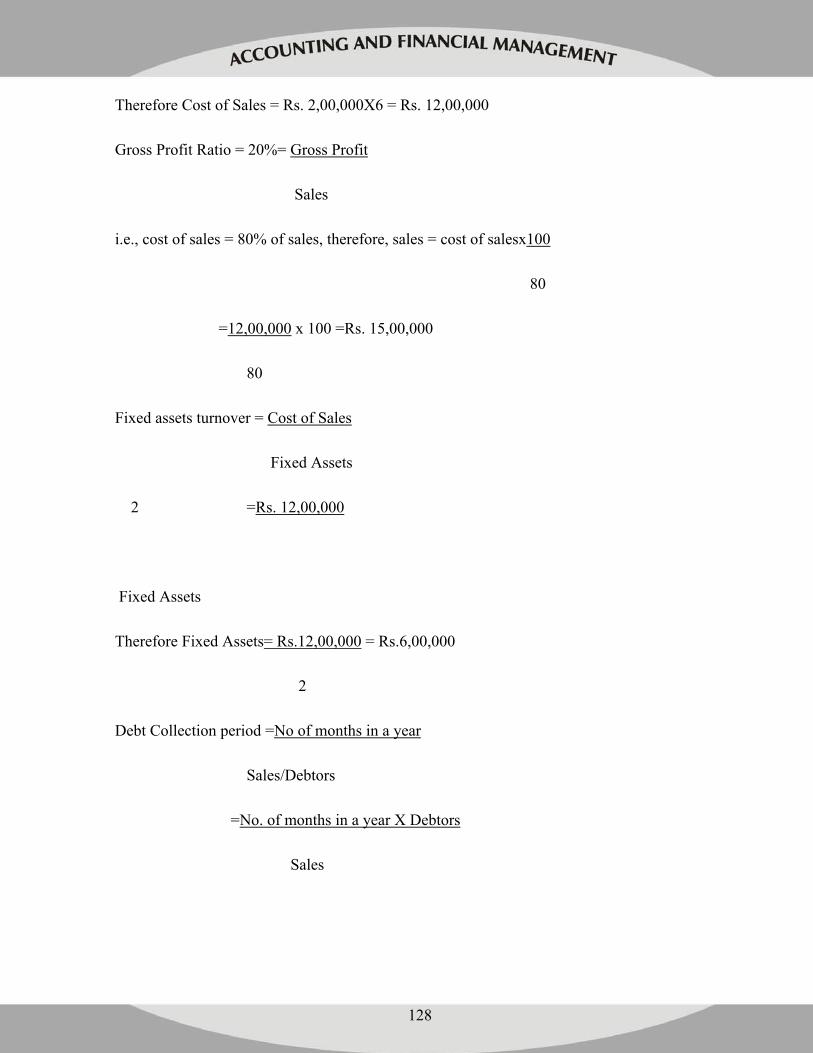
128
Therefore Cost of Sales = Rs. 2,00,000X6 = Rs. 12,00,000
Gross Profit Ratio = 20%= Gross Profit
Sales
i.e., cost of sales = 80% of sales, therefore, sales = cost of salesx100
80
=12,00,000 x 100 =Rs. 15,00,000
80
Fixed assets turnover = Cost of Sales
Fixed Assets
2 =Rs. 12,00,000
Fixed Assets
Therefore Fixed Assets= Rs.12,00,000 = Rs.6,00,000
2
Debt Collection period =No of months in a year
Sales/Debtors
=No. of months in a year X Debtors
Sales
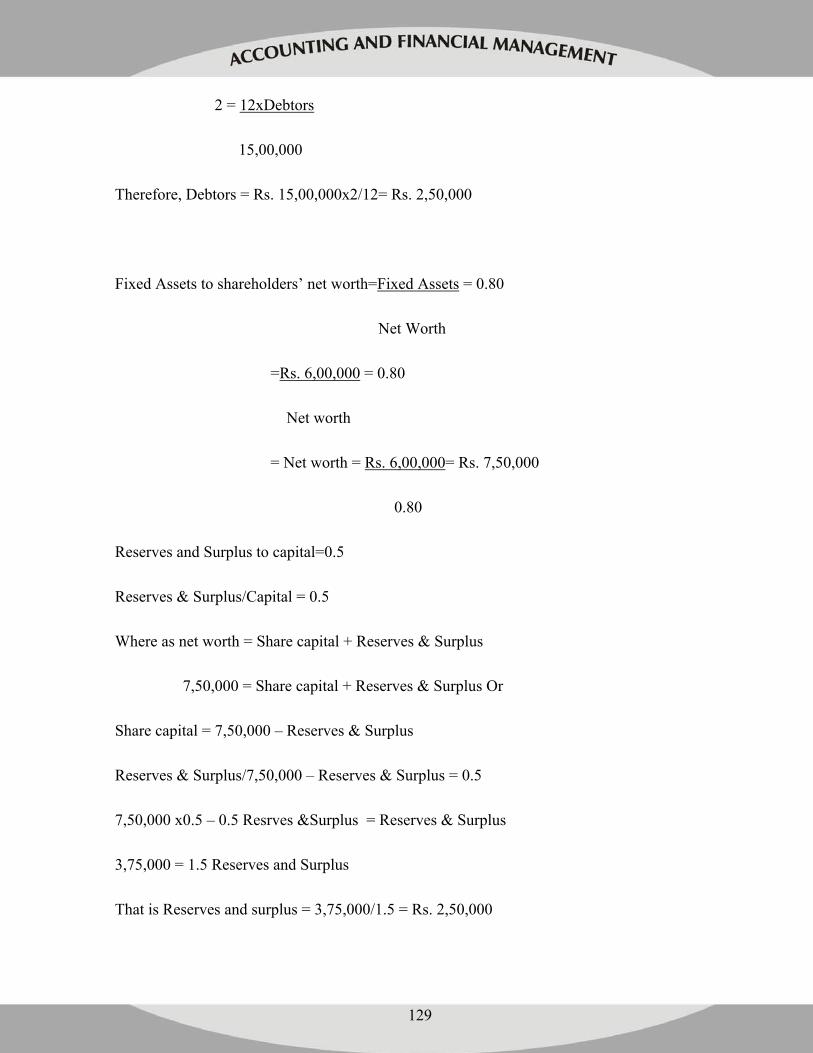
129
2 = 12xDebtors
15,00,000
Therefore, Debtors = Rs. 15,00,000x2/12= Rs. 2,50,000
Fixed Assets to shareholders’ net worth=Fixed Assets = 0.80
Net Worth
=Rs. 6,00,000 = 0.80
Net worth
= Net worth = Rs. 6,00,000= Rs. 7,50,000
0.80
Reserves and Surplus to capital=0.5
Reserves & Surplus/Capital = 0.5
Where as net worth = Share capital + Reserves & Surplus
7,50,000 = Share capital + Reserves & Surplus Or
Share capital = 7,50,000 – Reserves & Surplus
Reserves & Surplus/7,50,000 – Reserves & Surplus = 0.5
7,50,000 x0.5 – 0.5 Resrves &Surplus = Reserves & Surplus
3,75,000 = 1.5 Reserves and Surplus
That is Reserves and surplus = 3,75,000/1.5 = Rs. 2,50,000
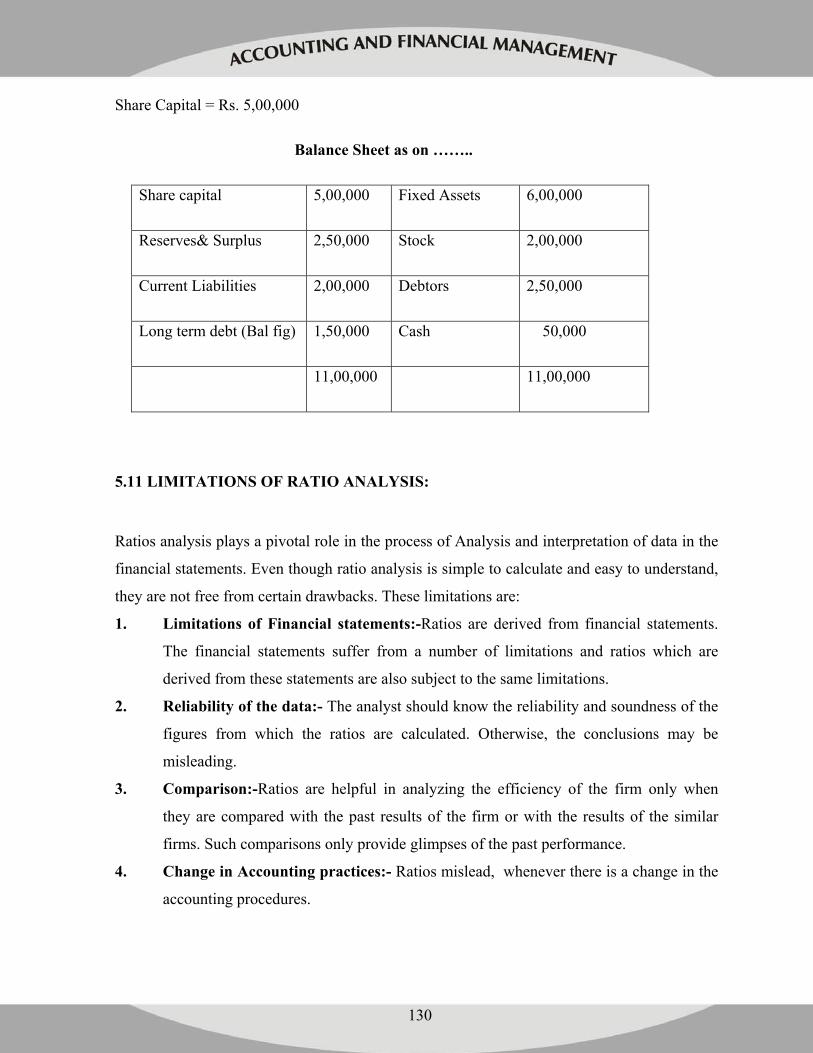
130
Share Capital = Rs. 5,00,000
Balance Sheet as on ……..
Share capital 5,00,000 Fixed Assets 6,00,000
Reserves& Surplus 2,50,000 Stock 2,00,000
Current Liabilities 2,00,000 Debtors 2,50,000
Long term debt (Bal fig) 1,50,000 Cash 50,000
11,00,000 11,00,000
5.11 LIMITATIONS OF RATIO ANALYSIS:
Ratios analysis plays a pivotal role in the process of Analysis and interpretation of data in the
financial statements. Even though ratio analysis is simple to calculate and easy to understand,
they are not free from certain drawbacks. These limitations are:
1. Limitations of Financial statements:-Ratios are derived from financial statements.
The financial statements suffer from a number of limitations and ratios which are
derived from these statements are also subject to the same limitations.
2. Reliability of the data:- The analyst should know the reliability and soundness of the
figures from which the ratios are calculated. Otherwise, the conclusions may be
misleading.
3. Comparison:-Ratios are helpful in analyzing the efficiency of the firm only when
they are compared with the past results of the firm or with the results of the similar
firms. Such comparisons only provide glimpses of the past performance.
4. Change in Accounting practices:- Ratios mislead, whenever there is a change in the
accounting procedures.
131
5. No Fixed Standards:- To make ratios as acceptable norms, there should be some
well acceptable standards. But unfortunately, no such standards exist. They vary from,
industry to industry and from firm to firm.
6. Price Level changes:- Financial statements are based on historical cost concepts and
no consideration is made to the changes in the price levels. And the ratios also suffer
from the same limitations.
7. Ratios alone are not enough:- Ratios are only indicators, they cannot be taken s final
regarding the financial health of the concern. They are only means of financial
analysis and not an end in itself.
8. Absolute figures are distortive:-Ratios are calculated from absolute figures. It is
basically a quantitative analysis and not a qualitative analysis. They can never be
substitute for the raw figures.
9. Difficulty in Definitions:- The differences in the definitions of various items of the
balance sheet and income statement make the interpretation of ratios a difficult task.
Some such items are Net profit, Net worth, and Capital employed which convey
different meanings.
10. Single Ratio is not adequate:-Instead of single ratio, often a number of ratios are
calculated to make a better interpretation of the financial data, which sometimes is
confusing rather than helpful in decision making.
11. Other factors:-Apart from financial factors, other factors like economic, social and
political factors also should be considered to make ratio analysis meaningful.
It may be concluded that ratio analysis is a useful tool of financial analysis, but it
mechanically done, it in not only misleading but also dangerous.
5.12 SUMMARY :
Ratio is a mathematical relationship existing among two or more items in the financial
statements. The process of establishing and interpreting various ratios between figures and
groups of figures may be termed as ‘Ratio analysis’. Ratio analysis helps in ascertaining the
financial condition of a firm. Ratios are used to evaluate the performance such as liquidity,
132
solvency, profitability and operational efficiency of a firm. Though ratio analysis is one of the
most powerful tools of financial management they suffer from some limitations. Ratios
themselves are not of much significance. They become useful only when they are compared
with some standards.
5.13 KEY WORDS: Ratio Ratio Analysis
Primary ratio Profitability Ratios
Liquidity Ratios Activity Ratios
Leverage Ratios Coverage Ratios
Try Yourself:
1. Define the meaning of Ratio.
2. Give two objectives of Ratio analysis.
3. Give two uses of Ratio analysis.
4. Given Net sales Rs. 1,00,000; Gross profit Rs. 60,000. Calculate Cost of goods sold ratio.
5. From the following calculate (i) Operating ratio (ii) Operating profit ratio. Given
Operating cost Rs. 70,000; net sales Rs. 1,00,000.
6. Given Net profit after taxes Rs. 1,12,450; current assets Rs.1,00,000; current liabilities Rs.
80,000. Calculate return on working capital.
7. Name any three Current Assets.
8. Given Current ratio is 2:2; working capital: Rs. 10,000; Calculate Current Assets and
Current liabilities.
9. What is the formula for calculating Price Earnings Ratio?
10. Stock turnover ratio = 6 times, Calculate stock velocity (in days).
11.What for Interest coverage ratio is useful?
12.Average debtors are
13.Given Cash Rs. 20,000, Bill receivable Rs 10,000, Sundry debtors Rs. 50,000, stocks Rs.
40,000, Sundry creditors Rs. 60,000, cost of sales Rs 3,00,000. Calculate working capital
turnover ratio.
133
14.Calculate the Debtors turnover ratio from the following:
total Sales Rs.2,00,000, Cash sales Rs. 40,000, Opening debtors Rs. 20,000, Closing
debtors Rs. 30,000, Opening balance of bills receivable Rs.15,000 and closing balance of bills
receivable Rs. 25,000.
Answers to Try Yourself:
1. A ratio is a numerical relationship existing between two related figures in the financial
statements.
2.1. To assess the profitability of a firm.
2. To find out the financial condition of a firm.
3.1. Ratio analysis facilitates inter firm comparison.
2. Ratio analysis helpful to the management in performing the important functions like
planning, coordination, control and forecasting.
4. COGS = (40,000 x100) / 1,00,000 = 40%
5. (i) Operating ratio =( 70,000 x100) / 1,00,000 =70%
(ii) Operating profit ratio = 100 – Operating ratio = 100 – 70% = 30%
6. Return on working capital = 1,12,450 x 100 /20,000 = 562.25%
7. Cash in hand, Sundry Debtors, Inventory (Stocks)
8. Current liabilities = Rs. 10,000 current assets = Rs. 20,000
9. Price Earning Ratio =Market price of Equity share/Earnings per share
10. Stock velocity ( in days) = 365/6 = 60.83 days.
11. It is useful for knowing the firms debt servicing capacity.
12. Average Debtors =( Opening trade debtors + Closing trade debtors) / 2
13. Working capital turnover ratio = 3,00,000/60,000 = 5 times
14. Debtors turnover ratio = 1,60,000/45,000= 3.56 times
Questions:
1. What do you understand by ratio analysis? Discuss its objectives and limitations.
2. “Ratio analysis is a tool to examine the health of business with a view to make financial
results more intelligible”. Explain.
3. Examine the relationship between Solvency, Liquidity and Profitability?
134
FURTHER READINGS: Battacharya S.K. & Dearden J., Accounting for Management, Vikas Publishing House,
New Delhi.
Khan M.Y. & Jain P.K., Management Accounting, Tata McGraw Hill
Publishing co.Ltd.
Maheswari S.N. , Principles of Management Accounting, Sultan Chand & sons,
New Delhi.
Pandey I.M., Management Accounting, Vikas Publishing House, New Delhi.
Sharma R.K. & Gupta S.K. , Management Accounting, Kalyani Publishers, New Delhi.
135
LESSON 6
FUNDS FLOW ANALYSIS OBJECTIVES:
Define of “Funds” and explain significance of Fund Flow Statements Differentiate between Income, Position, and Funds Flow Statements Illustrate and explain the Preparation of Funds Flow and Cash Flow
Statement Classification of Cash Flow Statement as per AS-3 (Revised)
STRUCTURE: 6.1 Introduction
6.2 Procedure for Preparing Funds Flow Statement
6.3 Financial / Total Resource Basis
6.4 Working Capital Basis
6.5 Cash Basis – Cash Flow Statement
6.6 Status and Applicability of AS-3 (Revised): Cash Flow Statement
6.7 Summary
6.8 Key Words
6.1 INTRODUCTION:
Every company has to prepare its balance sheet at the end of the accounting year. It reveals
the financial position of the company at a certain point of time. However, it does not present
any analysis, as it is simply a statement of assets and liabilities. Its usefulness is, therefore,
limited for analysis and planning purposes. The statement of sources and application of funds
serves the purpose, which is the popularly known as “Funds Flow Statement”. Funds Flow
Statement is a widely used tool in the hands of financial executives for analyzing the financial
performance of a concern. Though it is not mandatory for external reporting, leading
organizations always prepare such a statement along with the balance sheet for internal
136
consumption. This statement shows how the activities of a business have been financed or
how the available financial resources have been used during a particular period.
An income statement is primarily a presentation of revenue and expenses items and
computation of net income for the period and the position statement gives a snapshot of the
assets and liabilities on a specific date. Both these statements do not explain the changes in
assets, liabilities, and owner’s equity. The Funds Flow Statement is a report of financial
operations of a business undertaking. It generally reports changes in current assets and
current liabilities and is much useful for financial executives, financial institutions and
creditors for the analysis of financial position of the company.
Different thinkers interpret the term ‘funds’ differently. They may mean (i) financial
resources (arising from both current and non-current items) (ii) working capital (the
difference between current assets and current liabilities) and (iii) cash. It is critically
important to understand the specific funds movements caused in the business system by daily
management decisions on investment, operations, and financing. Management decisions, in
one form or another, affect the company’s ability to pay its bills, obtain credit from suppliers
and lenders, extend credit to its customers, and maintain a level of operations that matches the
demand for the company’s products or services, supported by appropriate investments. Every
decision has a monetary impact on the ongoing cycle of uses or sources of funds. It is
management’s job to strike a proper balance between the inflows and outflows of funds at all
times and to allow for any changes in level of operations, caused by management decisions or
by outside influences, that may affect these flows.
6.2 PROCEDURE FOR PREPARING FUNDS FLOW STATEMENT:
As there are varied interpretations for “funds”, the preparation of funds flow statement differs
depending on how we define the term. In a very narrow sense, it may mean only “cash”, the
more comprehensive view may capture “financial resources”, and between these two extreme
137
view points lie the “working capital” definition of funds. All the three analytical methods are
discussed below which give further clarity to the concept of flow of funds.
6.3 FINANCIAL RESOURCES BASIS:
Under this technique, a single statement is prepared which captures all the items in the
balance sheet. The “sources” of funds will include a reduction in current assets and fixed
assets and increase in current liabilities and non-current liabilities including equity. On the
other hand, an increase in current assets and fixed assets together with a decrease in current
liabilities and non-current liabilities are recorded under “uses” of funds. As all the items in the
balance sheet are considered, the sources of funds
Illustration 1
From the following details available for two balance sheet dates prepare a statement of
Sources andUses of Funds on Financial Resources Basis.
Liabilities As on 1st As on 31st Assets As on 1st As on 31st
Jan 1986 Dec.1986 Jan 1986 Dec. 1986
Rs. Rs. Rs. Rs.
Share Capital 6,00,000 7,00,000 Fixed Assets 10,20,000 12,40,000
Debentures 2,00,000 5,00,000 Investments 60,000 40,000
General Reserve 3,00,000 4,00,000 Current Assets 4,80,000 8,70,000
P&L a/c 1,20,000 1,40,000 Discount on
Debentures 10,000 ---
Depreciation
Reserve 1,80,000 2,60,000
Provision for
Doubtful Debts 20,000 30,000
138
Current Liabilities 1,50,000 1,20,000
----------- ------------ ------------ -----------
15,70,000 21,50,000 15,70,000 21,50,000
Solution:
Statement of Sources and Uses of Funds
Sources
Increase in Share Capital
Increase in General Reserves
Increase in Profit and Loss Account
Increase in Debentures
Increase in Provisions
Increase in Depreciation Reserve
Decrease in Investments
Decrease in Discount of Debentures
Total Sources
Uses
Increase in Fixed Assets
Increase in Current Assets
Decrease in Current Liabilities
Total Uses
1,00,000
1,00,000
20,000
3,00,000
10,000
80,000
20,000
10,000
6,40,000
2,20,000
3,90,000
30,000
6,40,000
Interpreting the Funds Flow Statement
This company is not able to generate enough funds internally for its capital expenditure
requirements as Rs 2,00,000 generated through an increase in the P&L A/c, General Reserves,
and Depreciation Reserves are less than the increase in Fixed Assets at Rs 2,20,000. Issue of
equity share capital and debentures amounting to Rs 4,00,000 seems to be for meeting the
139
working capital requirements of Rs 3,90,000. While the company’s customers are able to
access further credit, the suppliers are denying credit to this company. This increase in current
assets significantly in the face of decrease in current liabilities is definitely a discouraging
sign.
6.4 WORKING CAPITAL BASIS:
Under this technique, the following three statements are prepared. A proforma of these
statements are given at the end.
(a) Statement of Changes in Working Capital: Where increase in current assets and
decrease in current liabilities increases working capital and decrease in current assets and
increase in current liabilities decreases working capital.
(b) Funds From Operations: The net profit/net loss that is reported by an entity is not the
actual fund position for the accounting year. Hence, we need to make adjustments to the
profit and loss account to arrive at the actual funds generated/lost from operating
activities. To sustain any business, its core activities should generate a positive fund flow.
The very purpose of preparing this statement is to discover the operational excellence of a
company as is reflected in the funds from operations and not get carried away by a healthy
net profits which can never tell the actual story. Hence, to the net profits reported in the
income statement, we need to add all the non-cash expenses like depreciation and
amortization and non-operating items such as dividends and taxes.
(c) Funds Flow Statement: It captures both “sources” and “uses” of funds. All items
which generate fund inflows such as an increase in share capital, term loans, debentures,
sale of assets, decrease in working capital, and funds from operations are recorded under
Sources, while items which result in outflow of funds such as purchase of assets,
redemption of debentures, payment of taxes, payment of dividends, increase in working
capital, and funds lost in operations are recorded under Uses.
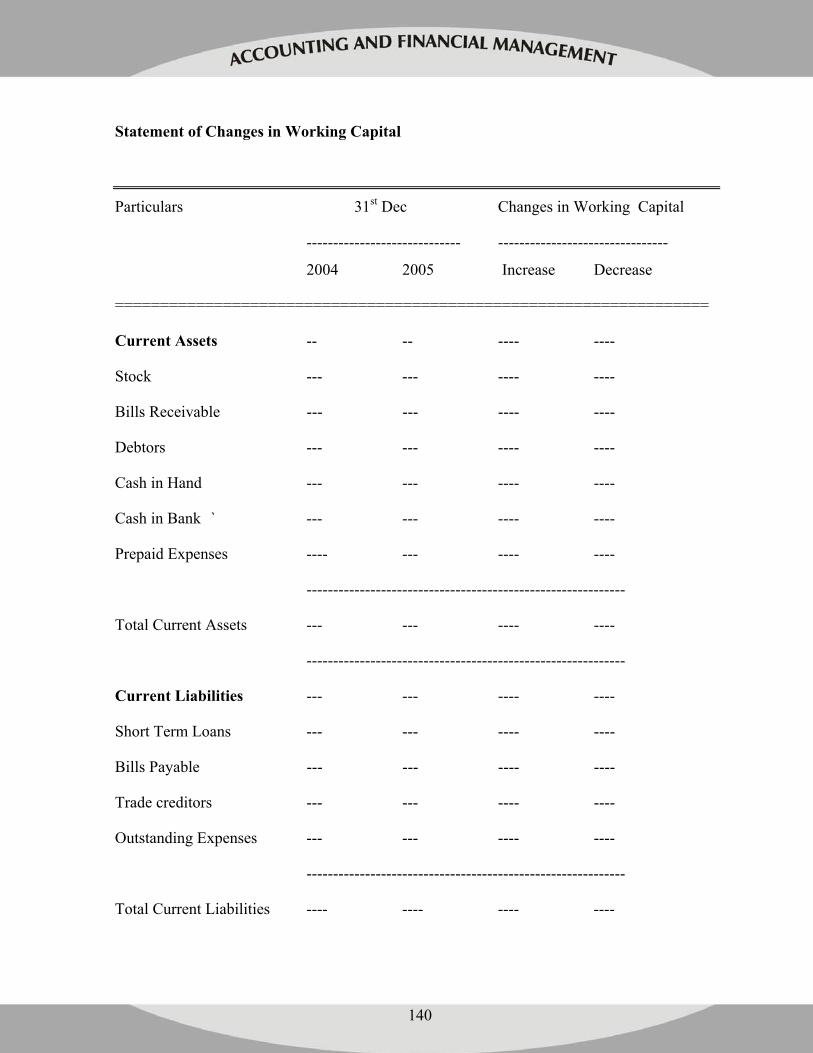
140
Statement of Changes in Working Capital
Particulars 31st Dec Changes in Working Capital
----------------------------- --------------------------------
2004 2005 Increase Decrease
==================================================================
Current Assets -- -- ---- ----
Stock --- --- ---- ----
Bills Receivable --- --- ---- ----
Debtors --- --- ---- ----
Cash in Hand --- --- ---- ----
Cash in Bank ` --- --- ---- ----
Prepaid Expenses ---- --- ---- ----
------------------------------------------------------------
Total Current Assets --- --- ---- ----
------------------------------------------------------------
Current Liabilities --- --- ---- ----
Short Term Loans --- --- ---- ----
Bills Payable --- --- ---- ----
Trade creditors --- --- ---- ----
Outstanding Expenses --- --- ---- ----
------------------------------------------------------------
Total Current Liabilities ---- ---- ---- ----
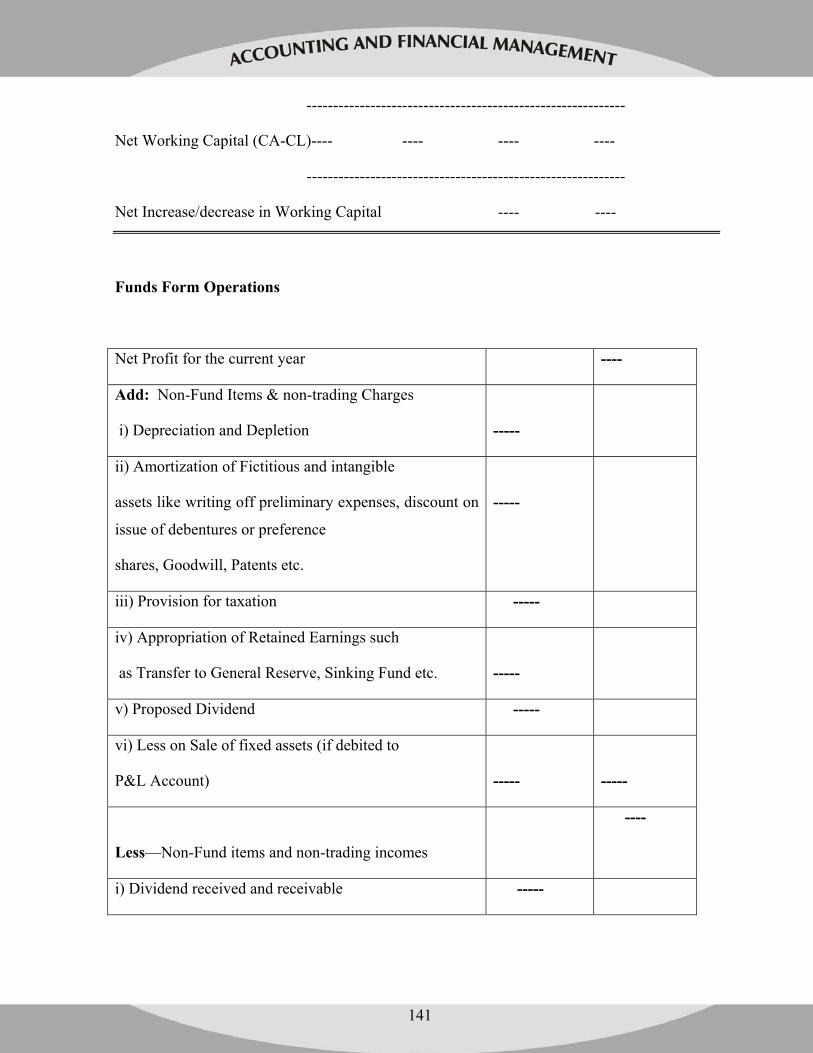
141
------------------------------------------------------------
Net Working Capital (CA-CL)---- ---- ---- ----
------------------------------------------------------------
Net Increase/decrease in Working Capital ---- ----
Funds Form Operations
Net Profit for the current year ----
Add: Non-Fund Items & non-trading Charges
i) Depreciation and Depletion
-----
ii) Amortization of Fictitious and intangible
assets like writing off preliminary expenses, discount on
issue of debentures or preference
shares, Goodwill, Patents etc.
-----
iii) Provision for taxation -----
iv) Appropriation of Retained Earnings such
as Transfer to General Reserve, Sinking Fund etc.
-----
v) Proposed Dividend -----
vi) Less on Sale of fixed assets (if debited to
P&L Account)
-----
-----
Less—Non-Fund items and non-trading incomes
----
i) Dividend received and receivable -----
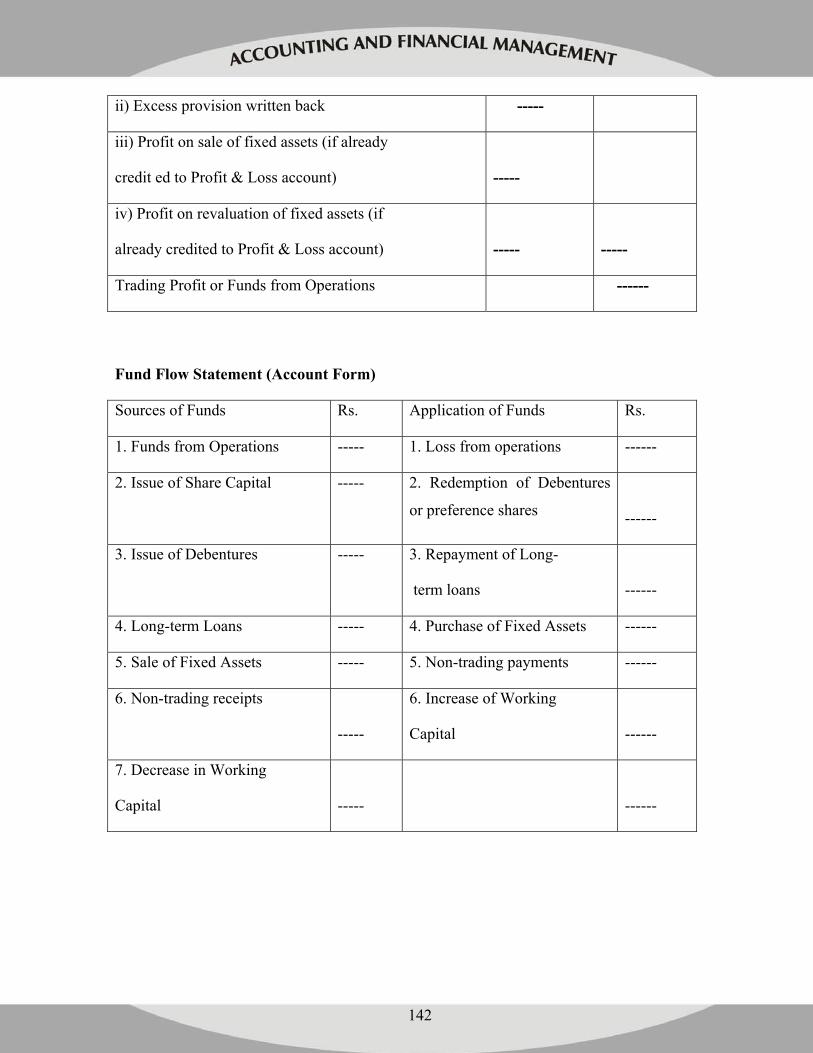
142
ii) Excess provision written back -----
iii) Profit on sale of fixed assets (if already
credit ed to Profit & Loss account)
-----
iv) Profit on revaluation of fixed assets (if
already credited to Profit & Loss account)
-----
-----
Trading Profit or Funds from Operations ------
Fund Flow Statement (Account Form)
Sources of Funds Rs. Application of Funds Rs.
1. Funds from Operations ----- 1. Loss from operations ------
2. Issue of Share Capital ----- 2. Redemption of Debentures
or preference shares
------
3. Issue of Debentures ----- 3. Repayment of Long-
term loans
------
4. Long-term Loans ----- 4. Purchase of Fixed Assets ------
5. Sale of Fixed Assets ----- 5. Non-trading payments ------
6. Non-trading receipts
-----
6. Increase of Working
Capital
------
7. Decrease in Working
Capital
-----
------
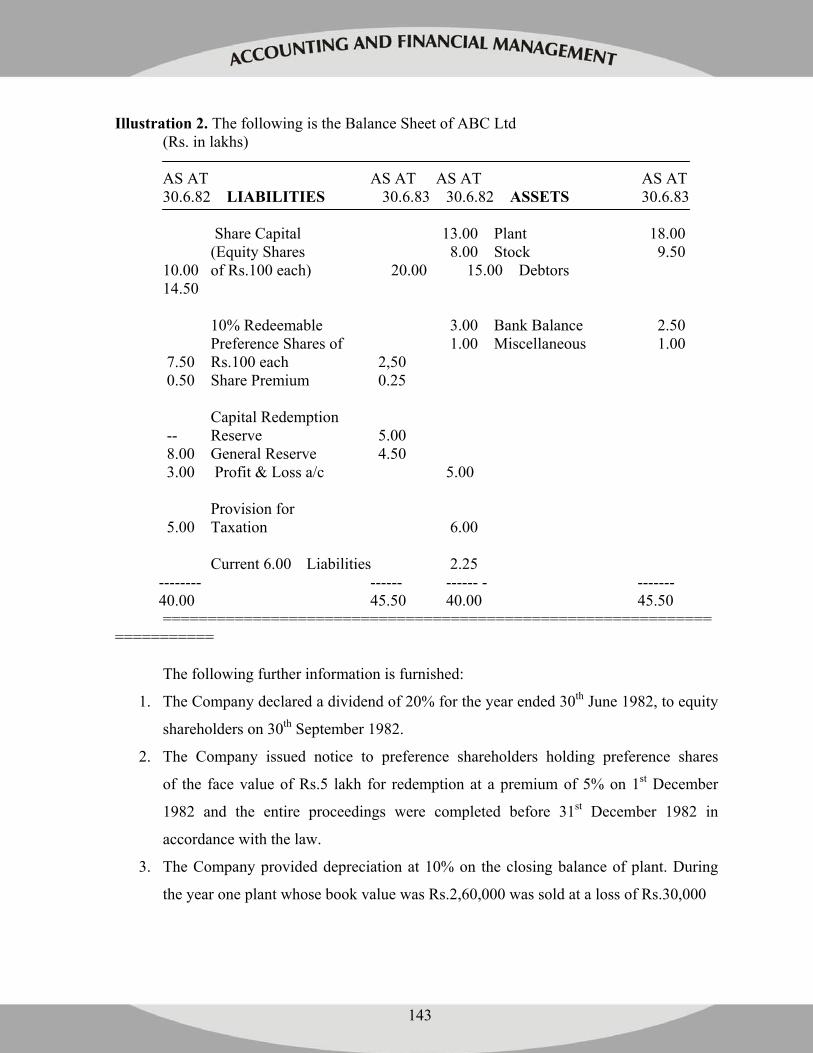
143
Illustration 2. The following is the Balance Sheet of ABC Ltd
(Rs. in lakhs) AS AT AS AT AS AT AS AT 30.6.82 LIABILITIES 30.6.83 30.6.82 ASSETS 30.6.83 Share Capital 13.00 Plant 18.00 (Equity Shares 8.00 Stock 9.50 10.00 of Rs.100 each) 20.00 15.00 Debtors 14.50 10% Redeemable 3.00 Bank Balance 2.50 Preference Shares of 1.00 Miscellaneous 1.00 7.50 Rs.100 each 2,50 0.50 Share Premium 0.25 Capital Redemption -- Reserve 5.00 8.00 General Reserve 4.50 3.00 Profit & Loss a/c 5.00 Provision for 5.00 Taxation 6.00 Current 6.00 Liabilities 2.25
-------- ------ ------ - ------- 40.00 45.50 40.00 45.50 ======================================================================== The following further information is furnished:
1. The Company declared a dividend of 20% for the year ended 30th June 1982, to equity
shareholders on 30th September 1982.
2. The Company issued notice to preference shareholders holding preference shares
of the face value of Rs.5 lakh for redemption at a premium of 5% on 1st December
1982 and the entire proceedings were completed before 31st December 1982 in
accordance with the law.
3. The Company provided depreciation at 10% on the closing balance of plant. During
the year one plant whose book value was Rs.2,60,000 was sold at a loss of Rs.30,000
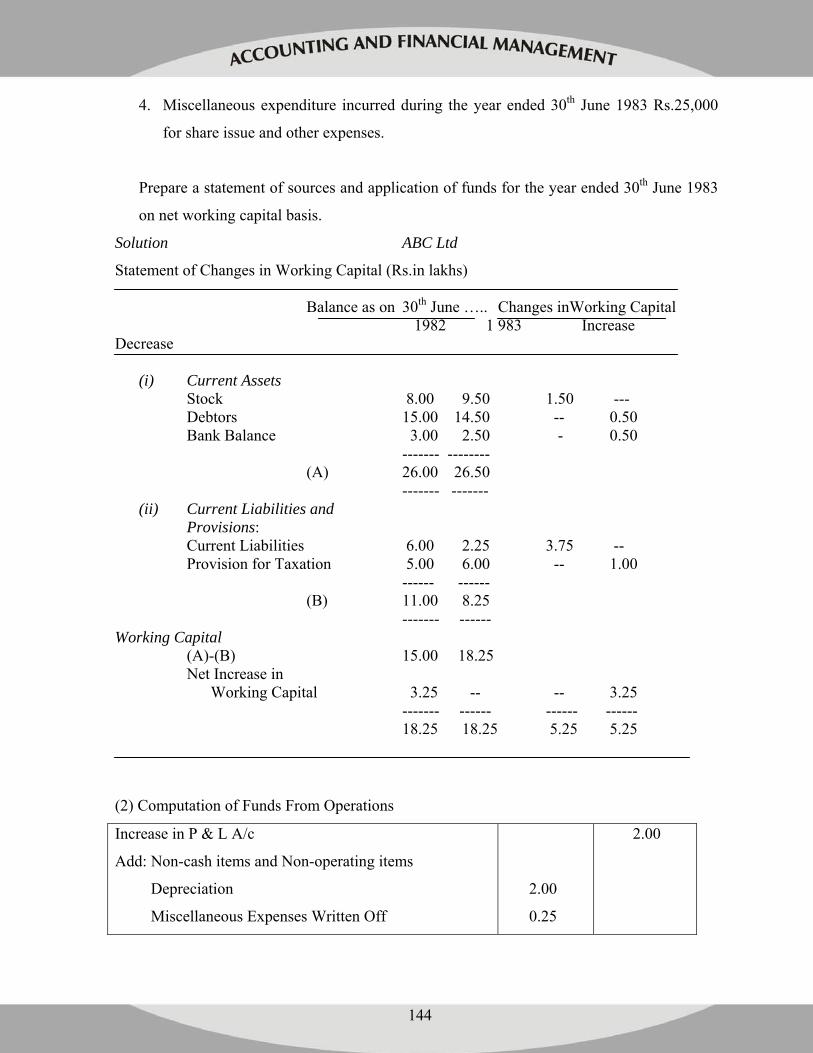
144
4. Miscellaneous expenditure incurred during the year ended 30th June 1983 Rs.25,000
for share issue and other expenses.
Prepare a statement of sources and application of funds for the year ended 30th June 1983
on net working capital basis.
Solution ABC Ltd
Statement of Changes in Working Capital (Rs.in lakhs) Balance as on 30th June ….. Changes inWorking Capital 1982 1 983 Increase Decrease
(i) Current Assets Stock 8.00 9.50 1.50 --- Debtors 15.00 14.50 -- 0.50 Bank Balance 3.00 2.50 - 0.50 ------- -------- (A) 26.00 26.50 ------- -------
(ii) Current Liabilities and Provisions:
Current Liabilities 6.00 2.25 3.75 -- Provision for Taxation 5.00 6.00 -- 1.00 ------ ------ (B) 11.00 8.25 ------- ------ Working Capital
(A)-(B) 15.00 18.25 Net Increase in Working Capital 3.25 -- -- 3.25 ------- ------ ------ ------ 18.25 18.25 5.25 5.25
(2) Computation of Funds From Operations
Increase in P & L A/c
Add: Non-cash items and Non-operating items
Depreciation
Miscellaneous Expenses Written Off
2.00
0.25
2.00
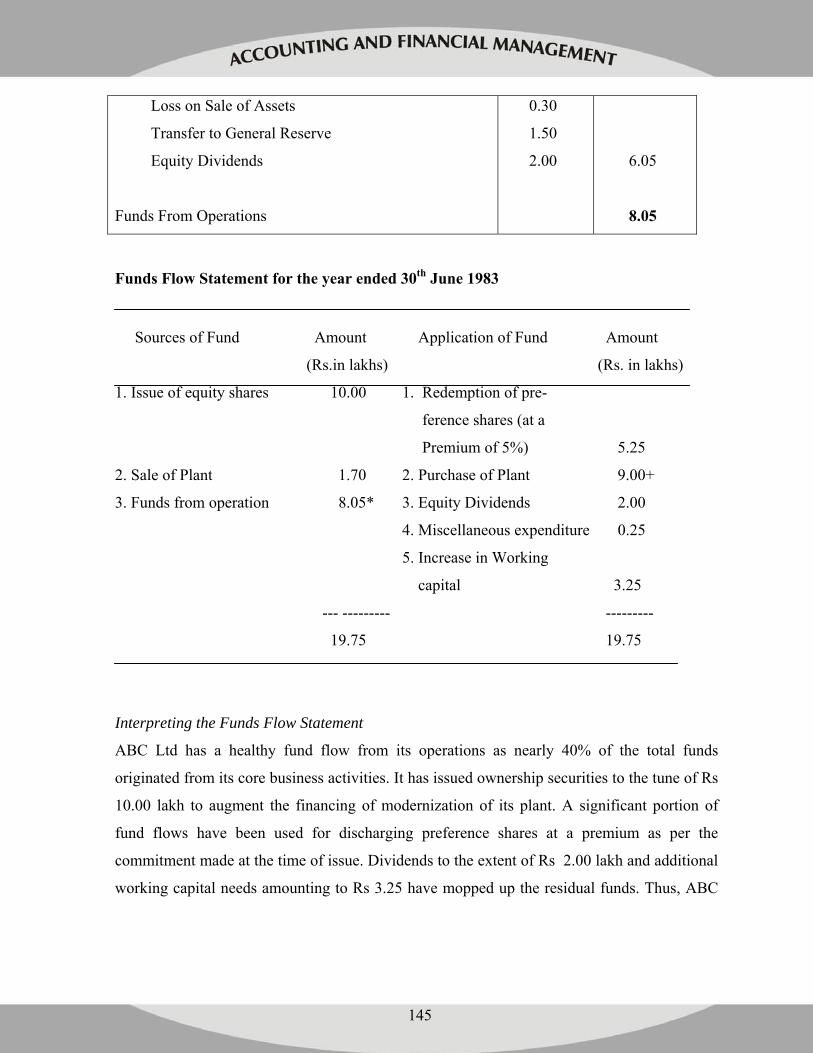
145
Loss on Sale of Assets
Transfer to General Reserve
Equity Dividends
Funds From Operations
0.30
1.50
2.00
6.05
8.05
Funds Flow Statement for the year ended 30th June 1983
Sources of Fund Amount Application of Fund Amount
(Rs.in lakhs) (Rs. in lakhs)
1. Issue of equity shares 10.00 1. Redemption of pre-
ference shares (at a
Premium of 5%) 5.25
2. Sale of Plant 1.70 2. Purchase of Plant 9.00+
3. Funds from operation 8.05* 3. Equity Dividends 2.00
4. Miscellaneous expenditure 0.25
5. Increase in Working
capital 3.25
--- --------- ---------
19.75 19.75
Interpreting the Funds Flow Statement
ABC Ltd has a healthy fund flow from its operations as nearly 40% of the total funds
originated from its core business activities. It has issued ownership securities to the tune of Rs
10.00 lakh to augment the financing of modernization of its plant. A significant portion of
fund flows have been used for discharging preference shares at a premium as per the
commitment made at the time of issue. Dividends to the extent of Rs 2.00 lakh and additional
working capital needs amounting to Rs 3.25 have mopped up the residual funds. Thus, ABC
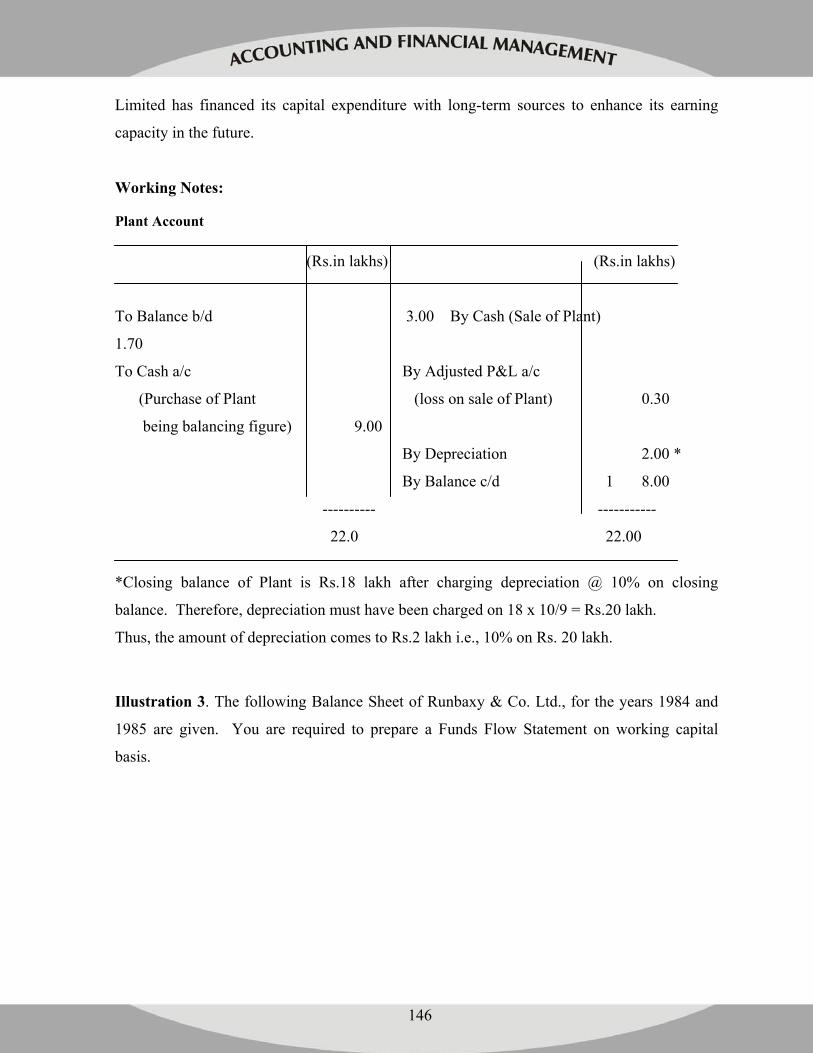
146
Limited has financed its capital expenditure with long-term sources to enhance its earning
capacity in the future.
Working Notes:
Plant Account
(Rs.in lakhs) (Rs.in lakhs)
To Balance b/d 3.00 By Cash (Sale of Plant)
1.70
To Cash a/c By Adjusted P&L a/c
(Purchase of Plant (loss on sale of Plant) 0.30
being balancing figure) 9.00
By Depreciation 2.00 *
By Balance c/d 1 8.00
---------- -----------
22.0 22.00
*Closing balance of Plant is Rs.18 lakh after charging depreciation @ 10% on closing
balance. Therefore, depreciation must have been charged on 18 x 10/9 = Rs.20 lakh.
Thus, the amount of depreciation comes to Rs.2 lakh i.e., 10% on Rs. 20 lakh.
Illustration 3. The following Balance Sheet of Runbaxy & Co. Ltd., for the years 1984 and
1985 are given. You are required to prepare a Funds Flow Statement on working capital
basis.
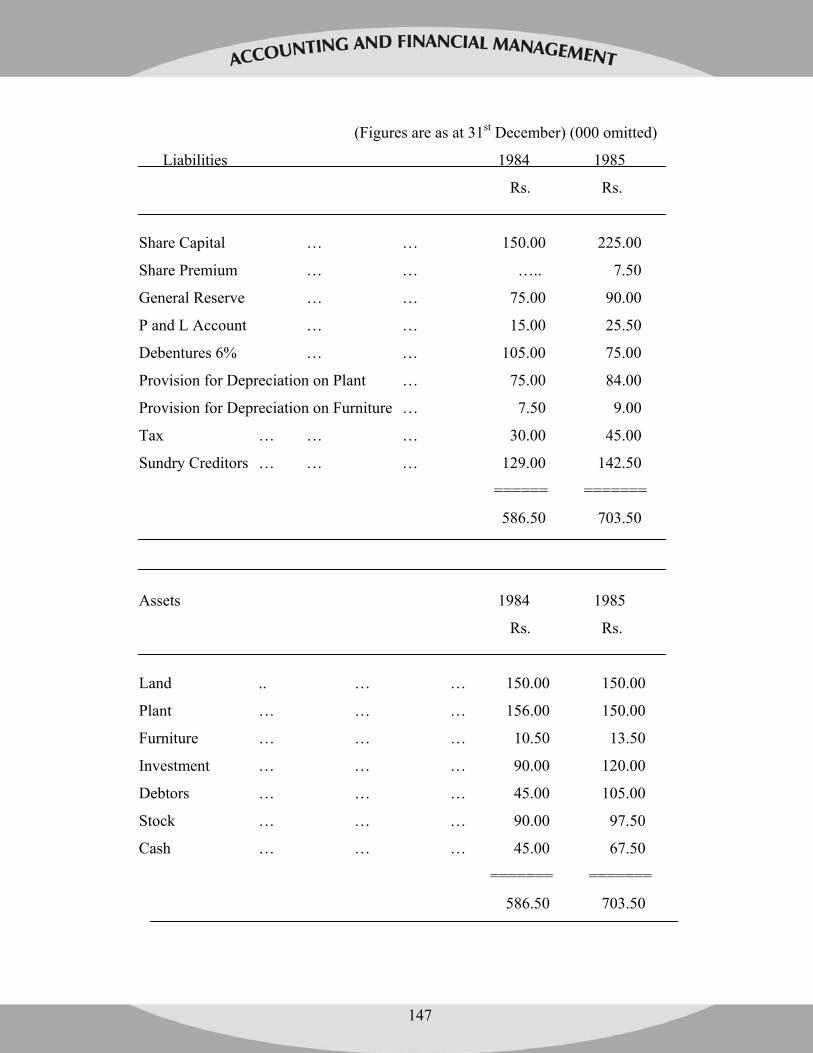
147
(Figures are as at 31st December) (000 omitted)
Liabilities 1984 1985
Rs. Rs.
Share Capital … … 150.00 225.00
Share Premium … … ….. 7.50
General Reserve … … 75.00 90.00
P and L Account … … 15.00 25.50
Debentures 6% … … 105.00 75.00
Provision for Depreciation on Plant … 75.00 84.00
Provision for Depreciation on Furniture … 7.50 9.00
Tax … … … 30.00 45.00
Sundry Creditors … … … 129.00 142.50
====== =======
586.50 703.50
Assets 1984 1985
Rs. Rs.
Land .. … … 150.00 150.00
Plant … … … 156.00 150.00
Furniture … … … 10.50 13.50
Investment … … … 90.00 120.00
Debtors … … … 45.00 105.00
Stock … … … 90.00 97.50
Cash … … … 45.00 67.50
======= =======
586.50 703.50
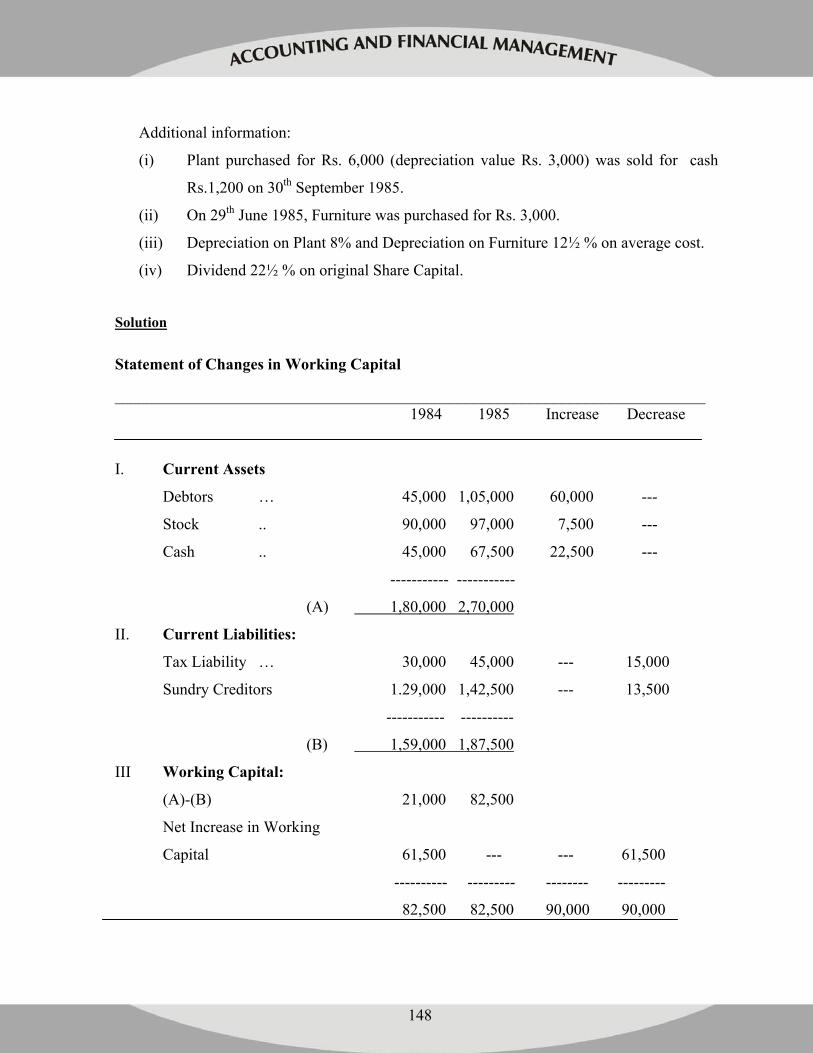
148
Additional information:
(i) Plant purchased for Rs. 6,000 (depreciation value Rs. 3,000) was sold for cash
Rs.1,200 on 30th September 1985.
(ii) On 29th June 1985, Furniture was purchased for Rs. 3,000.
(iii) Depreciation on Plant 8% and Depreciation on Furniture 12½ % on average cost.
(iv) Dividend 22½ % on original Share Capital.
Solution
Statement of Changes in Working Capital
__________________________________________________________________________ 1984 1985 Increase Decrease
I. Current Assets
Debtors … 45,000 1,05,000 60,000 ---
Stock .. 90,000 97,000 7,500 ---
Cash .. 45,000 67,500 22,500 ---
----------- -----------
(A) 1,80,000 2,70,000
II. Current Liabilities:
Tax Liability … 30,000 45,000 --- 15,000
Sundry Creditors 1.29,000 1,42,500 --- 13,500
----------- ----------
(B) 1,59,000 1,87,500
III Working Capital:
(A)-(B) 21,000 82,500
Net Increase in Working
Capital 61,500 --- --- 61,500
---------- --------- -------- ---------
82,500 82,500 90,000 90,000
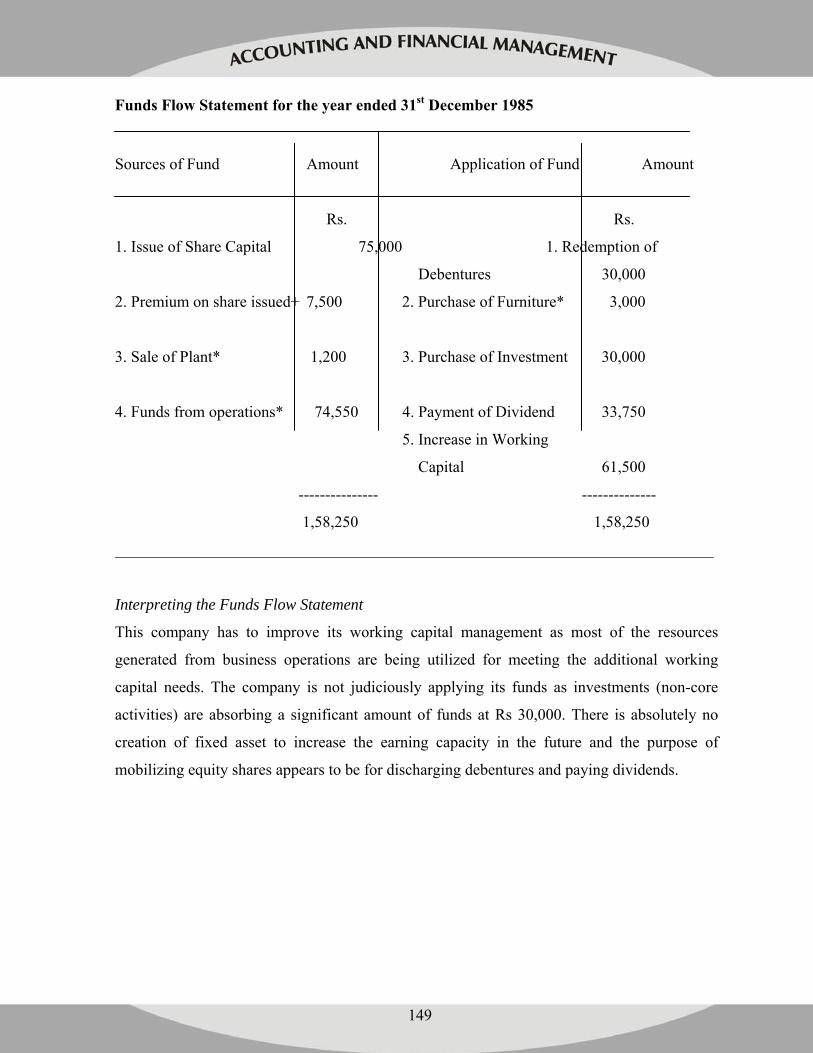
149
Funds Flow Statement for the year ended 31st December 1985
Sources of Fund Amount Application of Fund Amount
Rs. Rs.
1. Issue of Share Capital 75,000 1. Redemption of
Debentures 30,000
2. Premium on share issued+ 7,500 2. Purchase of Furniture* 3,000
3. Sale of Plant* 1,200 3. Purchase of Investment 30,000
4. Funds from operations* 74,550 4. Payment of Dividend 33,750
5. Increase in Working
Capital 61,500
--------------- --------------
1,58,250 1,58,250
___________________________________________________________________________
Interpreting the Funds Flow Statement
This company has to improve its working capital management as most of the resources
generated from business operations are being utilized for meeting the additional working
capital needs. The company is not judiciously applying its funds as investments (non-core
activities) are absorbing a significant amount of funds at Rs 30,000. There is absolutely no
creation of fixed asset to increase the earning capacity in the future and the purpose of
mobilizing equity shares appears to be for discharging debentures and paying dividends.
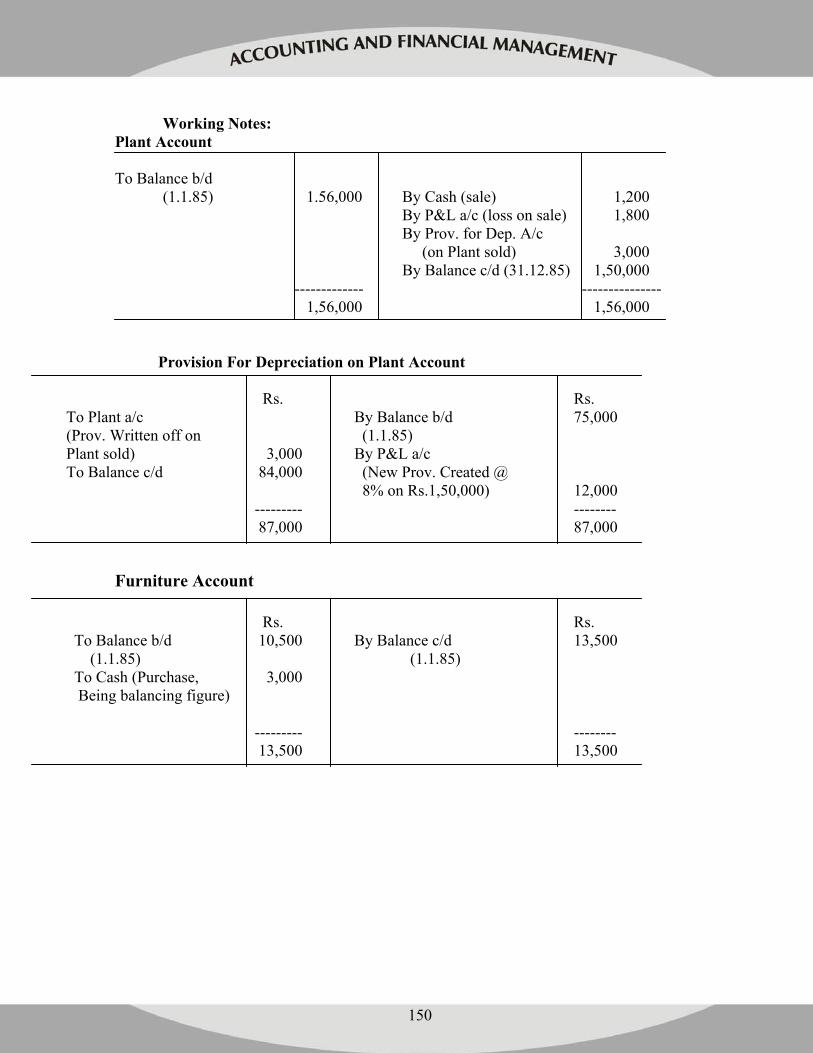
150
Working Notes:
Plant Account To Balance b/d (1.1.85) 1.56,000 By Cash (sale) 1,200 By P&L a/c (loss on sale) 1,800 By Prov. for Dep. A/c (on Plant sold) 3,000 By Balance c/d (31.12.85) 1,50,000 ------------- ---------------
1,56,000 1,56,000
Provision For Depreciation on Plant Account
Rs. Rs. To Plant a/c By Balance b/d 75,000 (Prov. Written off on (1.1.85) Plant sold) 3,000 By P&L a/c To Balance c/d 84,000 (New Prov. Created @ 8% on Rs.1,50,000) 12,000 --------- -------- 87,000 87,000
Furniture Account Rs. Rs. To Balance b/d 10,500 By Balance c/d 13,500 (1.1.85) (1.1.85) To Cash (Purchase, 3,000 Being balancing figure) --------- -------- 13,500 13,500
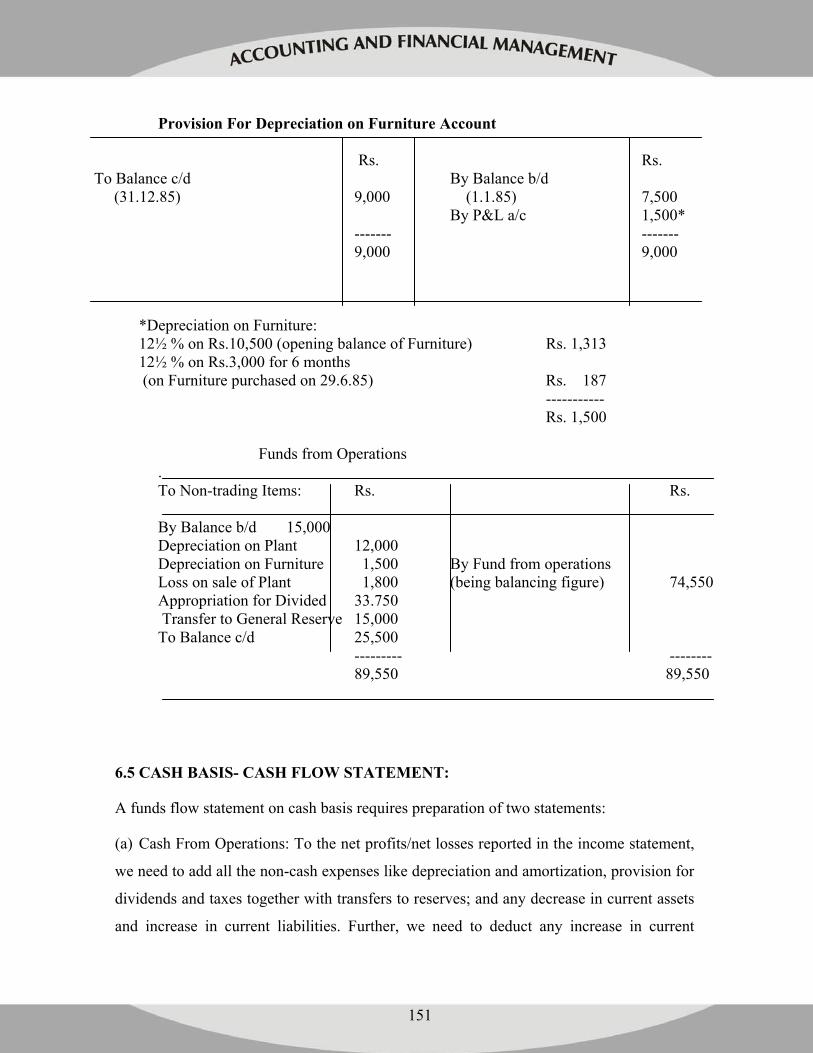
151
Provision For Depreciation on Furniture Account Rs. Rs. To Balance c/d By Balance b/d (31.12.85) 9,000 (1.1.85) 7,500 By P&L a/c 1,500* ------- -------
9,000 9,000 *Depreciation on Furniture: 12½ % on Rs.10,500 (opening balance of Furniture) Rs. 1,313 12½ % on Rs.3,000 for 6 months (on Furniture purchased on 29.6.85) Rs. 187 ----------- Rs. 1,500 Funds from Operations
. To Non-trading Items: Rs. Rs.
By Balance b/d 15,000 Depreciation on Plant 12,000 Depreciation on Furniture 1,500 By Fund from operations Loss on sale of Plant 1,800 (being balancing figure) 74,550 Appropriation for Divided 33.750 Transfer to General Reserve 15,000 To Balance c/d 25,500 --------- --------
89,550 89,550
6.5 CASH BASIS- CASH FLOW STATEMENT:
A funds flow statement on cash basis requires preparation of two statements:
(a) Cash From Operations: To the net profits/net losses reported in the income statement,
we need to add all the non-cash expenses like depreciation and amortization, provision for
dividends and taxes together with transfers to reserves; and any decrease in current assets
and increase in current liabilities. Further, we need to deduct any increase in current
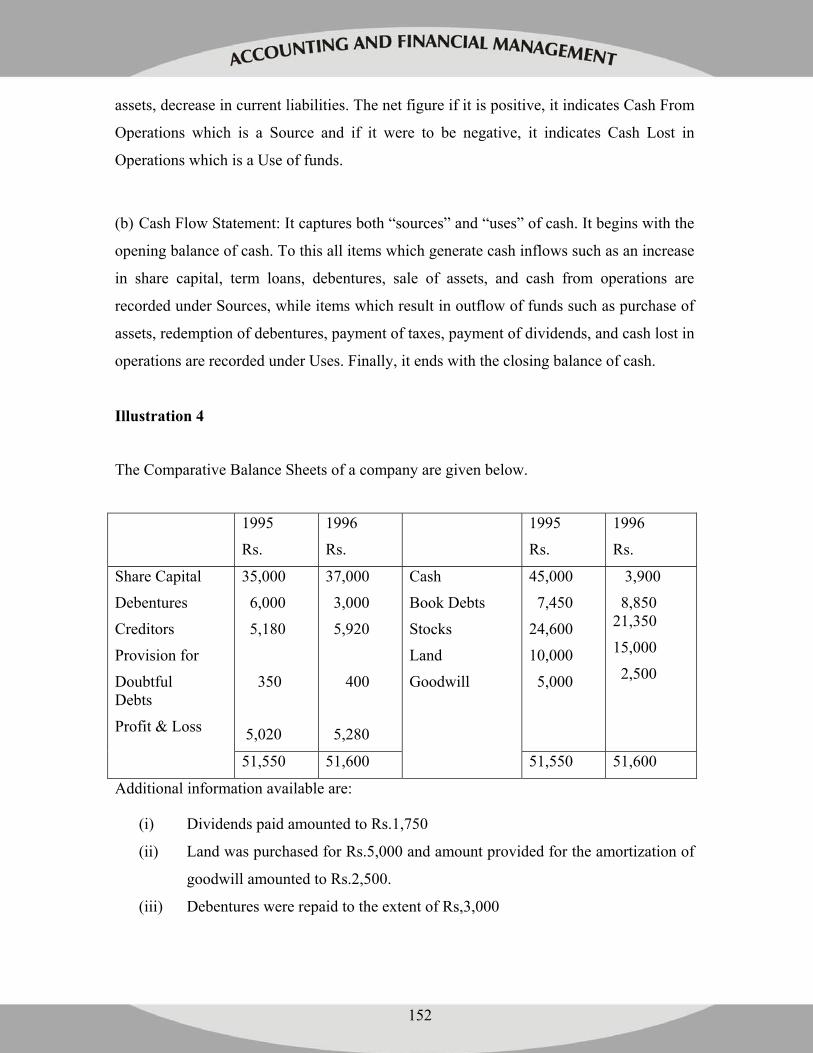
152
assets, decrease in current liabilities. The net figure if it is positive, it indicates Cash From
Operations which is a Source and if it were to be negative, it indicates Cash Lost in
Operations which is a Use of funds.
(b) Cash Flow Statement: It captures both “sources” and “uses” of cash. It begins with the
opening balance of cash. To this all items which generate cash inflows such as an increase
in share capital, term loans, debentures, sale of assets, and cash from operations are
recorded under Sources, while items which result in outflow of funds such as purchase of
assets, redemption of debentures, payment of taxes, payment of dividends, and cash lost in
operations are recorded under Uses. Finally, it ends with the closing balance of cash.
Illustration 4
The Comparative Balance Sheets of a company are given below.
1995
Rs.
1996
Rs.
1995
Rs.
1996
Rs.
35,000
6,000
5,180
350
5,020
37,000
3,000
5,920
400
5,280
45,000
7,450
24,600
10,000
5,000
3,900
8,850 21,350
15,000
2,500
Share Capital
Debentures
Creditors
Provision for
Doubtful Debts
Profit & Loss
51,550 51,600
Cash
Book Debts
Stocks
Land
Goodwill
51,550 51,600
Additional information available are:
(i) Dividends paid amounted to Rs.1,750
(ii) Land was purchased for Rs.5,000 and amount provided for the amortization of
goodwill amounted to Rs.2,500.
(iii) Debentures were repaid to the extent of Rs,3,000
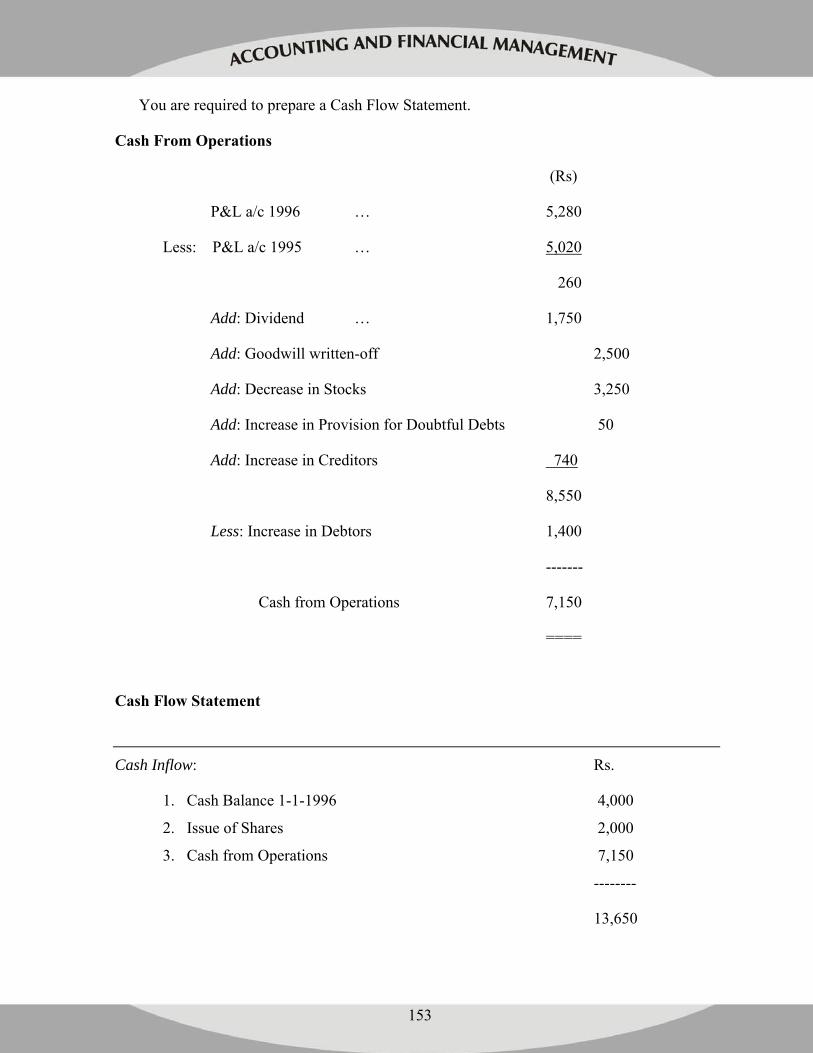
153
You are required to prepare a Cash Flow Statement.
Cash From Operations
(Rs)
P&L a/c 1996 … 5,280
Less: P&L a/c 1995 … 5,020
260
Add: Dividend … 1,750
Add: Goodwill written-off 2,500
Add: Decrease in Stocks 3,250
Add: Increase in Provision for Doubtful Debts 50
Add: Increase in Creditors 740
8,550
Less: Increase in Debtors 1,400
-------
Cash from Operations 7,150
====
Cash Flow Statement
Cash Inflow: Rs.
1. Cash Balance 1-1-1996 4,000
2. Issue of Shares 2,000
3. Cash from Operations 7,150
--------
13,650
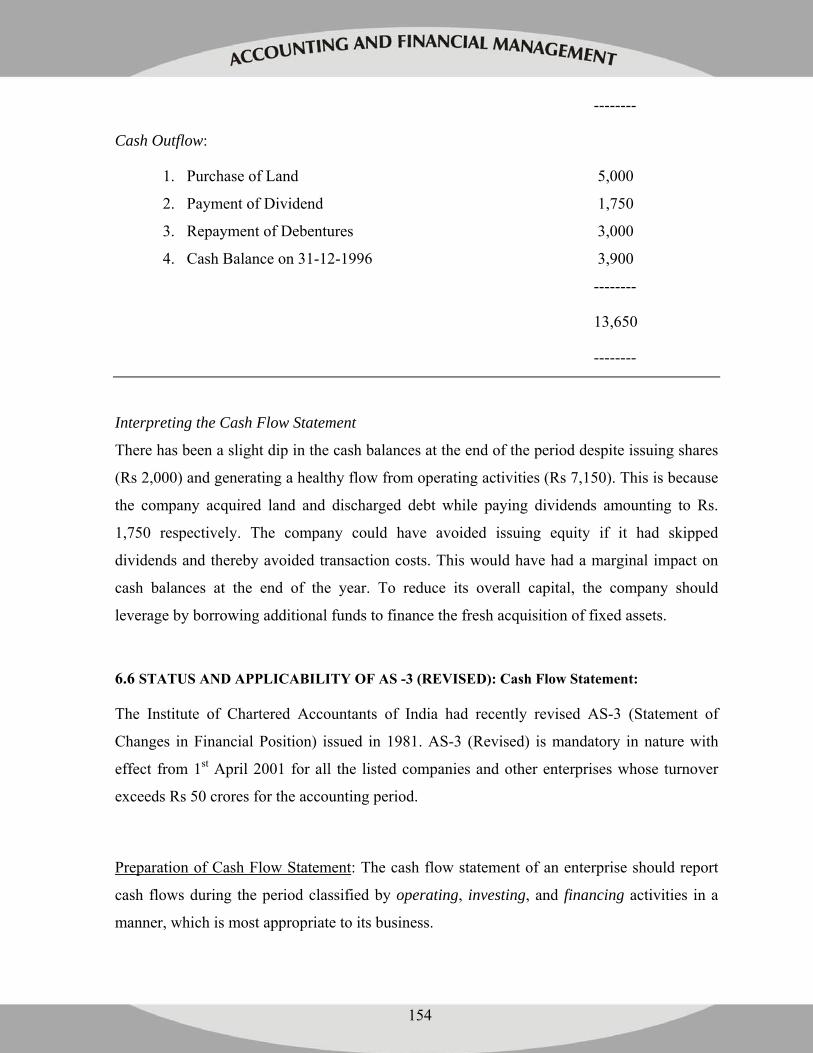
154
--------
Cash Outflow:
1. Purchase of Land 5,000
2. Payment of Dividend 1,750
3. Repayment of Debentures 3,000
4. Cash Balance on 31-12-1996 3,900
--------
13,650
--------
Interpreting the Cash Flow Statement
There has been a slight dip in the cash balances at the end of the period despite issuing shares
(Rs 2,000) and generating a healthy flow from operating activities (Rs 7,150). This is because
the company acquired land and discharged debt while paying dividends amounting to Rs.
1,750 respectively. The company could have avoided issuing equity if it had skipped
dividends and thereby avoided transaction costs. This would have had a marginal impact on
cash balances at the end of the year. To reduce its overall capital, the company should
leverage by borrowing additional funds to finance the fresh acquisition of fixed assets.
6.6 STATUS AND APPLICABILITY OF AS -3 (REVISED): Cash Flow Statement:
The Institute of Chartered Accountants of India had recently revised AS-3 (Statement of
Changes in Financial Position) issued in 1981. AS-3 (Revised) is mandatory in nature with
effect from 1st April 2001 for all the listed companies and other enterprises whose turnover
exceeds Rs 50 crores for the accounting period.
Preparation of Cash Flow Statement: The cash flow statement of an enterprise should report
cash flows during the period classified by operating, investing, and financing activities in a
manner, which is most appropriate to its business.
155
Operating Activities
Cash flows from operating activities are primarily derived from the principal revenue-
producing activities of the company. Cash flows from operating activities are:
Cash receipts from sale of goods and services;
Cash receipts from royalties, fees, commissions, and other revenues;
Cash payments for all operating expenses;
Cash receipts and cash payments of insurance enterprise for premiums and claims,
annuities and other policy benefits; and
Cash payments or refund of income taxes.
Investing Activities
The investment activities are those that are related to the investment of funds in the fixed
assets and other investments. The separate disclosure of cash flows arising from investing
activities shows the extent to which expenditures have been made for resources intended to
generate future income and cash flows. They can be:
Cash payments to acquire fixed assets, intangibles and those relating to capitalized
research and development costs and self-constructed fixed assets;
Cash receipts from disposal of fixed assets and intangibles;
Cash payments to acquire shares, warrants, or debt instruments of other enterprises
and interests in joint ventures;
Cash advances and loans made to third parties (other than advances and loans
made by a financial enterprise);
Cash receipts from the repayment of advances and loans made to third parties
(other than advances and loans made by a financial enterprise); and
Cash receipt by way of interest, dividend or any other cash income from the
investee enterprise.
156
Financing Activities
These activities include those relating to long-term funds i.e., share capital and borrowings.
Cash flows arising from financing activities may include:
Cash proceeds from issuing shares or other similar instruments;
Cash proceeds from issuing debentures, loans, notes, bonds, and other short or
long-term borrowings;
Cash repayments of amounts borrowed;
Interest or dividend repayments; and
Cash payments for redemption of bonds, debentures, or preference shares.
6.7 SUMMARY:
In this unit, we have discussed the need for constructing a funds flow and cash flow
statements to supplement the information provided by income and position statements. Funds
flow analysis details the financial resources availed and the ways in which such resources are
used during an accounting period. As the sources side captures the funds generated from
operations internally, it explains reasons for liquidity problems of the firm even though it is
earning profits. The changes in working capital position can also be tracked by observing the
surplus / deficit of funds during an accounting period. The top management may, however,
like to know the ability of an enterprise to generate cash and cash equivalents and the timing
and certainty of their generation. This warrants preparation of a cash flow statement, which
provides the information about the cash receipts and cash payments of a firm for a given
period.
6.8 KEY WORDS:
Working capital Total resources; Funds from operations
Cash from operation Cash Flow Statement
Funds Flow Statement
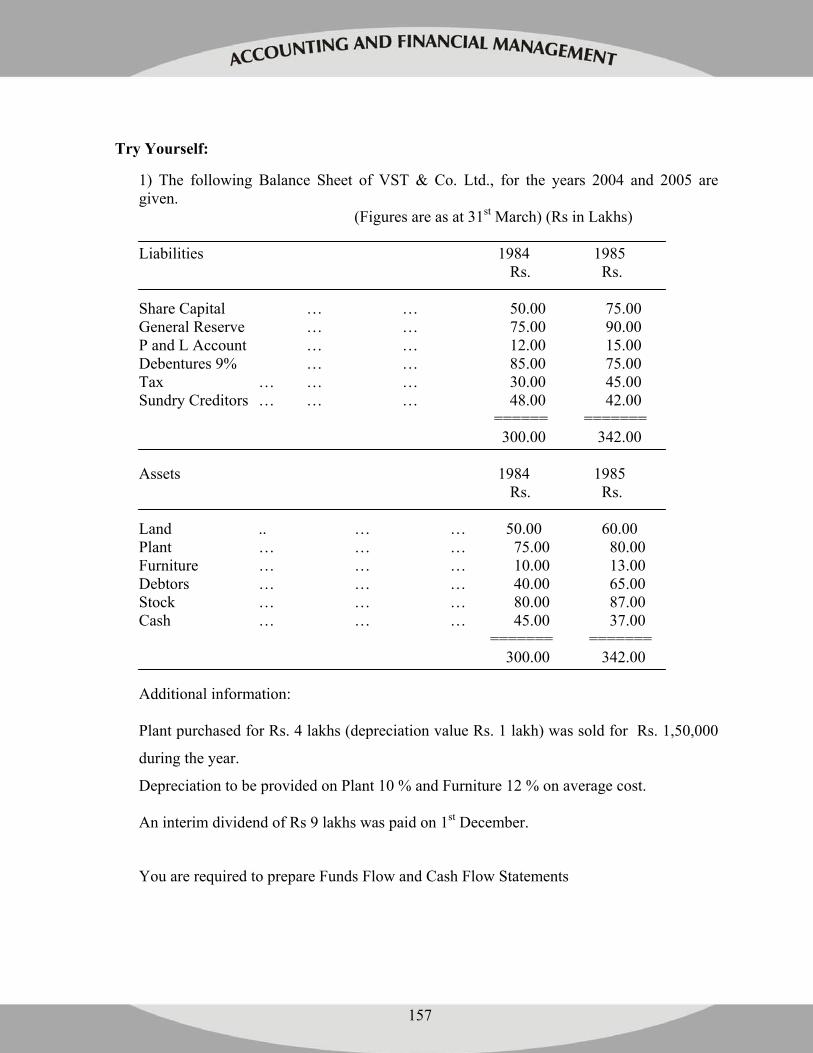
157
Try Yourself:
1) The following Balance Sheet of VST & Co. Ltd., for the years 2004 and 2005 are given.
(Figures are as at 31st March) (Rs in Lakhs) Liabilities 1984 1985 Rs. Rs. Share Capital … … 50.00 75.00 General Reserve … … 75.00 90.00 P and L Account … … 12.00 15.00 Debentures 9% … … 85.00 75.00 Tax … … … 30.00 45.00 Sundry Creditors … … … 48.00 42.00 ====== ======= 300.00 342.00 Assets 1984 1985 Rs. Rs. Land .. … … 50.00 60.00 Plant … … … 75.00 80.00 Furniture … … … 10.00 13.00 Debtors … … … 40.00 65.00 Stock … … … 80.00 87.00 Cash … … … 45.00 37.00 ======= ======= 300.00 342.00 Additional information: Plant purchased for Rs. 4 lakhs (depreciation value Rs. 1 lakh) was sold for Rs. 1,50,000
during the year.
Depreciation to be provided on Plant 10 % and Furniture 12 % on average cost. An interim dividend of Rs 9 lakhs was paid on 1st December.
You are required to prepare Funds Flow and Cash Flow Statements
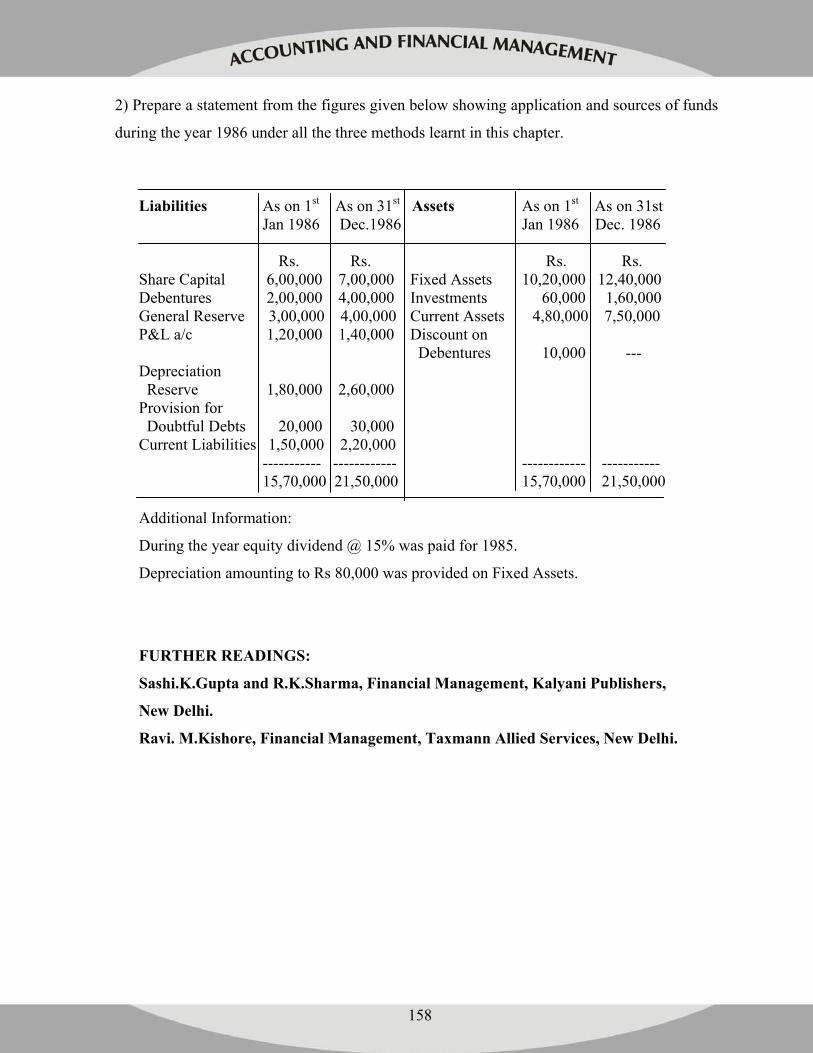
158
2) Prepare a statement from the figures given below showing application and sources of funds
during the year 1986 under all the three methods learnt in this chapter.
Liabilities As on 1st As on 31st Assets As on 1st As on 31st Jan 1986 Dec.1986 Jan 1986 Dec. 1986
Rs. Rs. Rs. Rs. Share Capital 6,00,000 7,00,000 Fixed Assets 10,20,000 12,40,000 Debentures 2,00,000 4,00,000 Investments 60,000 1,60,000 General Reserve 3,00,000 4,00,000 Current Assets 4,80,000 7,50,000 P&L a/c 1,20,000 1,40,000 Discount on Debentures 10,000 --- Depreciation Reserve 1,80,000 2,60,000 Provision for Doubtful Debts 20,000 30,000 Current Liabilities 1,50,000 2,20,000 ----------- ------------ ------------ ----------- 15,70,000 21,50,000 15,70,000 21,50,000 Additional Information:
During the year equity dividend @ 15% was paid for 1985.
Depreciation amounting to Rs 80,000 was provided on Fixed Assets.
FURTHER READINGS:
Sashi.K.Gupta and R.K.Sharma, Financial Management, Kalyani Publishers,
New Delhi.
Ravi. M.Kishore, Financial Management, Taxmann Allied Services, New Delhi.
159
LESSON-7
COST VOLUME PROFIT ANALYSIS
STRUCTURE
STRUCTURE: 7.1 Introduction
7.2 Assumptions of Breakeven Analysis
7.3 Breakeven Point (BEP)
7.4 Contribution
7.5 Profit- Volume Ratio
7.6 Margin of Safety
7.7 Profit Goal
7.8 Breakeven Analysis in Multi-product Firm
7.9 Applications of BEP Analysis for Managerial Decision Making
7.10 Limitations of CVP Analysis
7.11 Summary
7.12 Key Words
7.1 INTRODUCTION:
Every Organisation, whether commercial or otherwise needs to create a surplus. While
commercial organizations necessarily exist to make a surplus which they would call a profit,
non-commercial organizations also need to make a surplus, if they need to sustain themselves
and survive. Hence every Organisation or firm needs to make a surplus and devise plans to
make a surplus and be financially viable.
OBJECTIVES:
To explain the relationships between cost, volume, selling price and profit
To explain the utility of Breakeven Analysis for Profit Planning To apply Breakeven Analysis for Managerial Decision Making
160
One of the methods of profit planning for manufacturing organizations is the Cost-Volume
Profit-Analysis or C-V-P Analysis for short. This method aims to examine the inter
relationships that exist between cost, selling-price of the product, and the volume of sales on
the profit and use these inter relationships to aid in Profit Planning C-V-P Analysis is
synonymously used with Breakeven Analysis, which is by far the most popular tool of C-V-P
Analysis.
7.2 ASSUMPTIONS OF BREAKEVEN ANALYSIS :
C-V-P Analysis as a tool of profit planning is based on certain assumptions which are
explained below.
1. Segregability of Costs: Breakeven Analysis assumes that all costs can be segregated into
‘Fixed Costs’ and ‘Variable Costs’. Even those costs which are semi-variable in nature can
ultimately be separated into fixed and variable components.
‘Fixed Costs ’: Fixed costs are those costs which are incurred by a firm irrespective of its
level of output. These are the costs which are not directly related to making of the product,
and therefore remain unchanged no matter what the level of production.
‘Variable Costs’: Variable Cost are those costs which are directly involved in the making of
the product and therefore vary in direct sympathy with the level of output.
A point to be noted here is that while Fixed Costs remain constant in aggregate, the per unit
fixed costs varies as the production levels vary, whereas variable costs remain constant per
unit, but change in aggregate as the level of production Changes.
2. Constancy of Selling Price: The second assumption is that the selling price of the firm
products remains constant, no matter what the level of output. This is in contravention to the
normal economic laws of supply and demand where we see that price is a function of supply
and demand.
161
3. Constancy of Product Mix: Another assumption on which CVP Analysis is based is that
the firm produces only one product, i.e., it is a uni-product firm or even if it is a multi-product
firm, the product mix would remain constant and not change.
4. Synchronisation of Production and Sales: CVP Analysis also assumes that there is
perfect harmony between production and sales that all that has been produced will be sold and
therefore there will not be any changes in levels of inventory.
7.3 BREAKEVEN POINT (BEP):
As already explained CVP Analysis mainly depends on the concept called Breakeven Point.
Breakeven Point is that level of output and sales, where the total costs (TC) are equal to Total
Revenues (TR).
TC = TR
TC = FC (fixed costs) + FC (variable costs)
Since costs are equal to revenues, the firm has neither a profit nor a loss at this level of output.
Breakeven Point can be ascertained algebraically using the following:
BQ = F
S-V
Where BQ stands for BEP in quantity or No. of units.
F stands for Fixed Cost.
S stands for Selling Price per unit.
V stands for Variable Cost per unit.
Example:
If S = Rs.10, V = Rs.6 and Fixed Costs are Rs.80,000, BQ =?
BQ = F = 80,000 = 20,000 units
S – V 10 – 6
To verify @ a sales level of 20,000 units
162
Sales Revenue is 20,000 x10 = 2,00,000
Variable cost is 20,000 x 6 = 1,20,000
------------
Contribution 80,000
Less: Fixed costs 80,000
-----------
Profit/Loss NIL
------------
7.4 CONTRIBUTION:
The difference between the Sales Revenue and the Variable Costs is called contribution
because it contributes to the firm to cover the fixed cost and if any balance is left out after
covering fixed cost, the same goes to contribute to the profit of the firm.
Breakeven Point can also be ascertained in terms of value, by simply multiplying BQ by S,
Therefore, Total Sales revenue at which point the firm will break even, in terms of rupees can
be known as under.
BRs = F x S or F
( S – V ) (1 – V/S) Example:
If S = Rs.30, V = Rs.20, and F is Rs. 20,000, Compute the BEP in quantity and Rupees.
BRs = BQ x S or F (1 – V/S)
BQ = 20,000 = 2,000 units
30 – 20
BRs = 10,000 x 30 = Rs. 6,00,000
OR
20,000 = 20,000 x 30 = Rs.6,00,000
( 1 – 20/30 ) 10
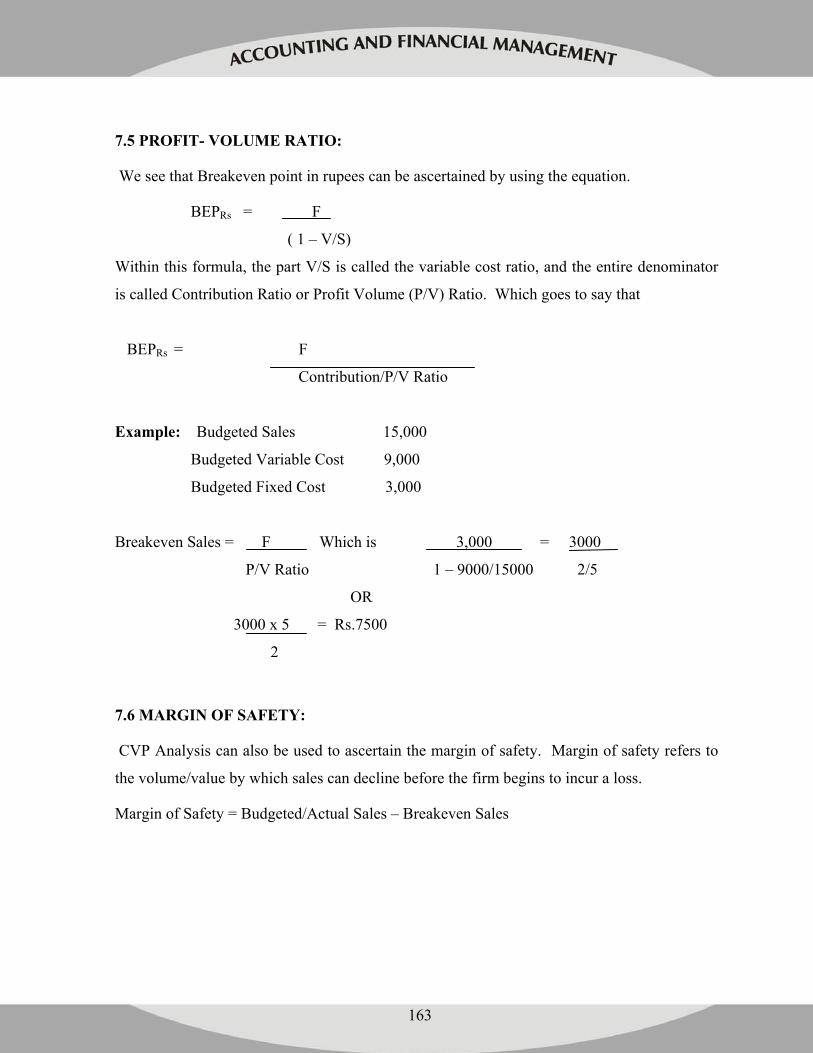
163
7.5 PROFIT- VOLUME RATIO:
We see that Breakeven point in rupees can be ascertained by using the equation.
BEPRs = F
( 1 – V/S)
Within this formula, the part V/S is called the variable cost ratio, and the entire denominator
is called Contribution Ratio or Profit Volume (P/V) Ratio. Which goes to say that
BEPRs = F
Contribution/P/V Ratio
Example: Budgeted Sales 15,000
Budgeted Variable Cost 9,000
Budgeted Fixed Cost 3,000
Breakeven Sales = F Which is 3,000 = 3000
P/V Ratio 1 – 9000/15000 2/5
OR
3000 x 5 = Rs.7500
2
7.6 MARGIN OF SAFETY:
CVP Analysis can also be used to ascertain the margin of safety. Margin of safety refers to
the volume/value by which sales can decline before the firm begins to incur a loss.
Margin of Safety = Budgeted/Actual Sales – Breakeven Sales
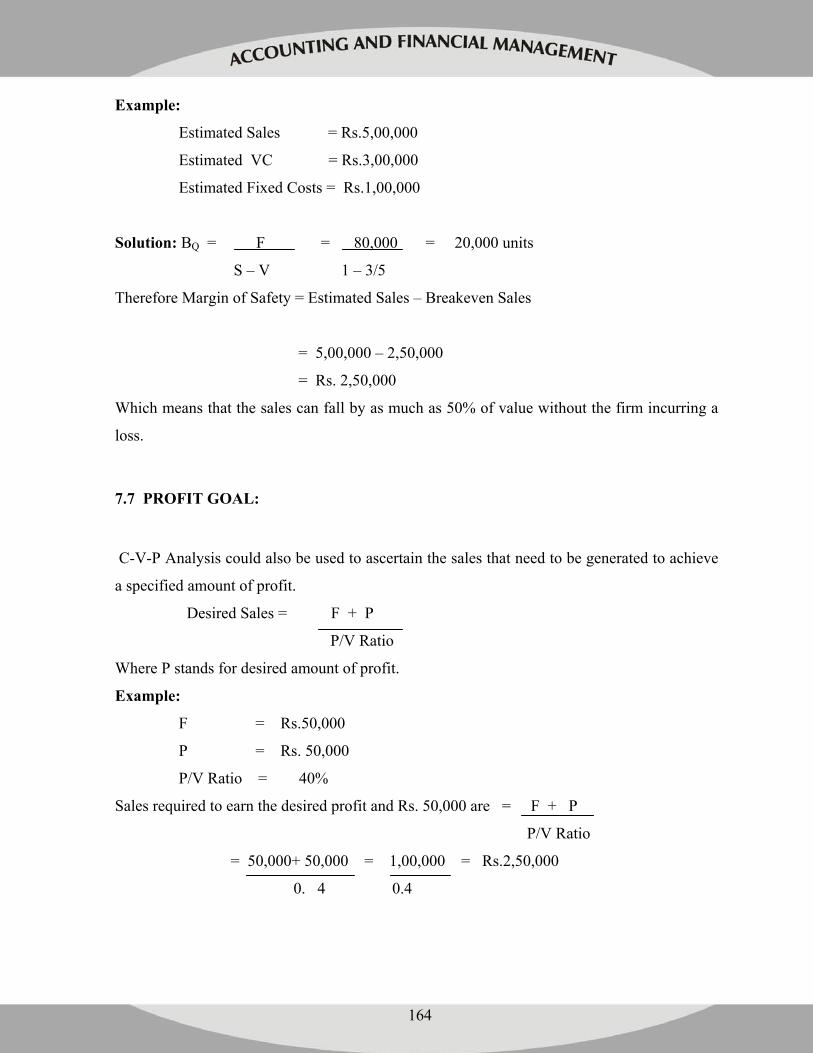
164
Example:
Estimated Sales = Rs.5,00,000
Estimated VC = Rs.3,00,000
Estimated Fixed Costs = Rs.1,00,000
Solution: BQ = F = 80,000 = 20,000 units
S – V 1 – 3/5
Therefore Margin of Safety = Estimated Sales – Breakeven Sales
= 5,00,000 – 2,50,000
= Rs. 2,50,000
Which means that the sales can fall by as much as 50% of value without the firm incurring a
loss.
7.7 PROFIT GOAL:
C-V-P Analysis could also be used to ascertain the sales that need to be generated to achieve
a specified amount of profit.
Desired Sales = F + P
P/V Ratio
Where P stands for desired amount of profit.
Example:
F = Rs.50,000
P = Rs. 50,000
P/V Ratio = 40%
Sales required to earn the desired profit and Rs. 50,000 are = F + P
P/V Ratio
= 50,000+ 50,000 = 1,00,000 = Rs.2,50,000
0. 4 0.4
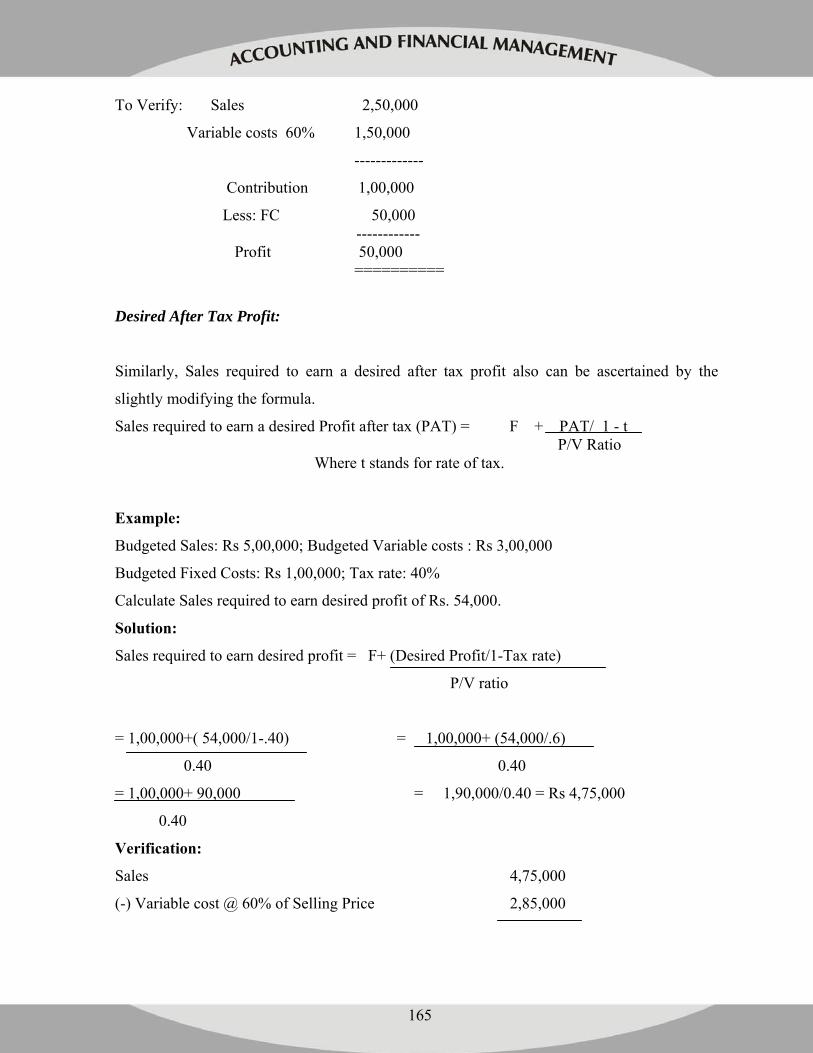
165
To Verify: Sales 2,50,000
Variable costs 60% 1,50,000
-------------
Contribution 1,00,000
Less: FC 50,000 ------------ Profit 50,000 ==========
Desired After Tax Profit:
Similarly, Sales required to earn a desired after tax profit also can be ascertained by the
slightly modifying the formula.
Sales required to earn a desired Profit after tax (PAT) = F + PAT/ 1 - t P/V Ratio Where t stands for rate of tax.
Example:
Budgeted Sales: Rs 5,00,000; Budgeted Variable costs : Rs 3,00,000
Budgeted Fixed Costs: Rs 1,00,000; Tax rate: 40%
Calculate Sales required to earn desired profit of Rs. 54,000.
Solution:
Sales required to earn desired profit = F+ (Desired Profit/1-Tax rate)
P/V ratio
= 1,00,000+( 54,000/1-.40) = 1,00,000+ (54,000/.6)
0.40 0.40
= 1,00,000+ 90,000 = 1,90,000/0.40 = Rs 4,75,000
0.40
Verification:
Sales 4,75,000
(-) Variable cost @ 60% of Selling Price 2,85,000
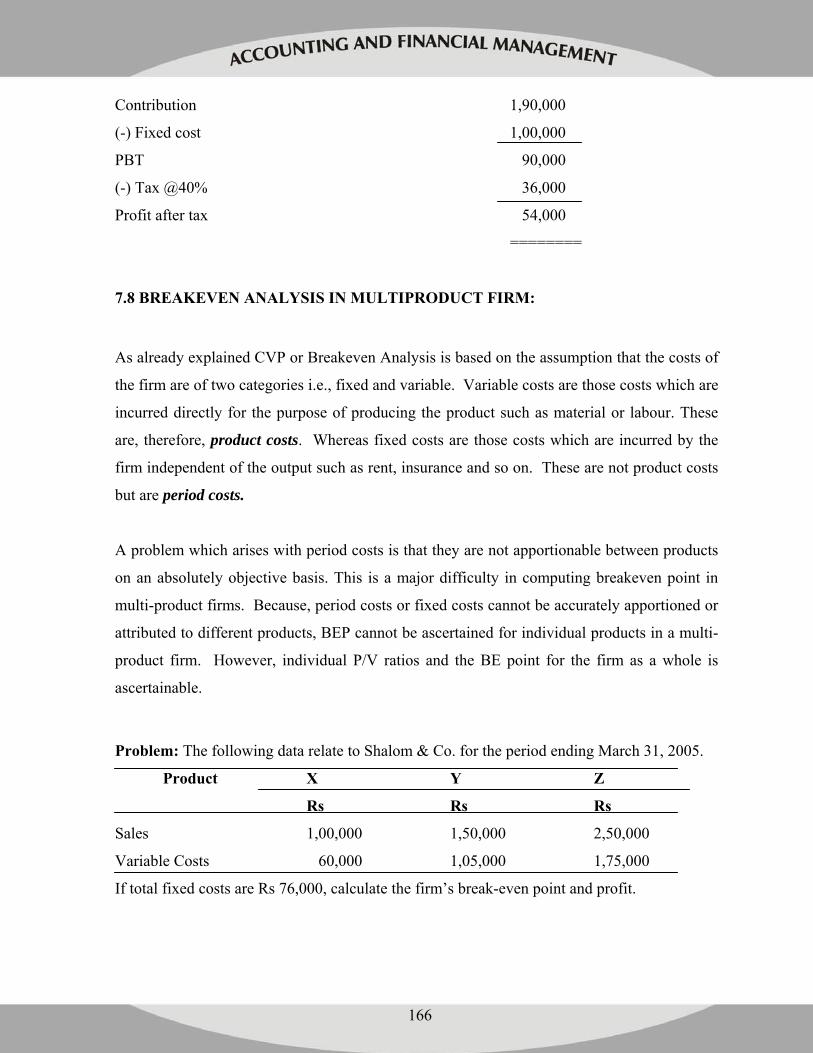
166
Contribution 1,90,000
(-) Fixed cost 1,00,000
PBT 90,000
(-) Tax @40% 36,000
Profit after tax 54,000
========
7.8 BREAKEVEN ANALYSIS IN MULTIPRODUCT FIRM:
As already explained CVP or Breakeven Analysis is based on the assumption that the costs of
the firm are of two categories i.e., fixed and variable. Variable costs are those costs which are
incurred directly for the purpose of producing the product such as material or labour. These
are, therefore, product costs. Whereas fixed costs are those costs which are incurred by the
firm independent of the output such as rent, insurance and so on. These are not product costs
but are period costs.
A problem which arises with period costs is that they are not apportionable between products
on an absolutely objective basis. This is a major difficulty in computing breakeven point in
multi-product firms. Because, period costs or fixed costs cannot be accurately apportioned or
attributed to different products, BEP cannot be ascertained for individual products in a multi-
product firm. However, individual P/V ratios and the BE point for the firm as a whole is
ascertainable.
Problem: The following data relate to Shalom & Co. for the period ending March 31, 2005.
Product X Y Z
Rs Rs Rs
Sales 1,00,000 1,50,000 2,50,000
Variable Costs 60,000 1,05,000 1,75,000
If total fixed costs are Rs 76,000, calculate the firm’s break-even point and profit.
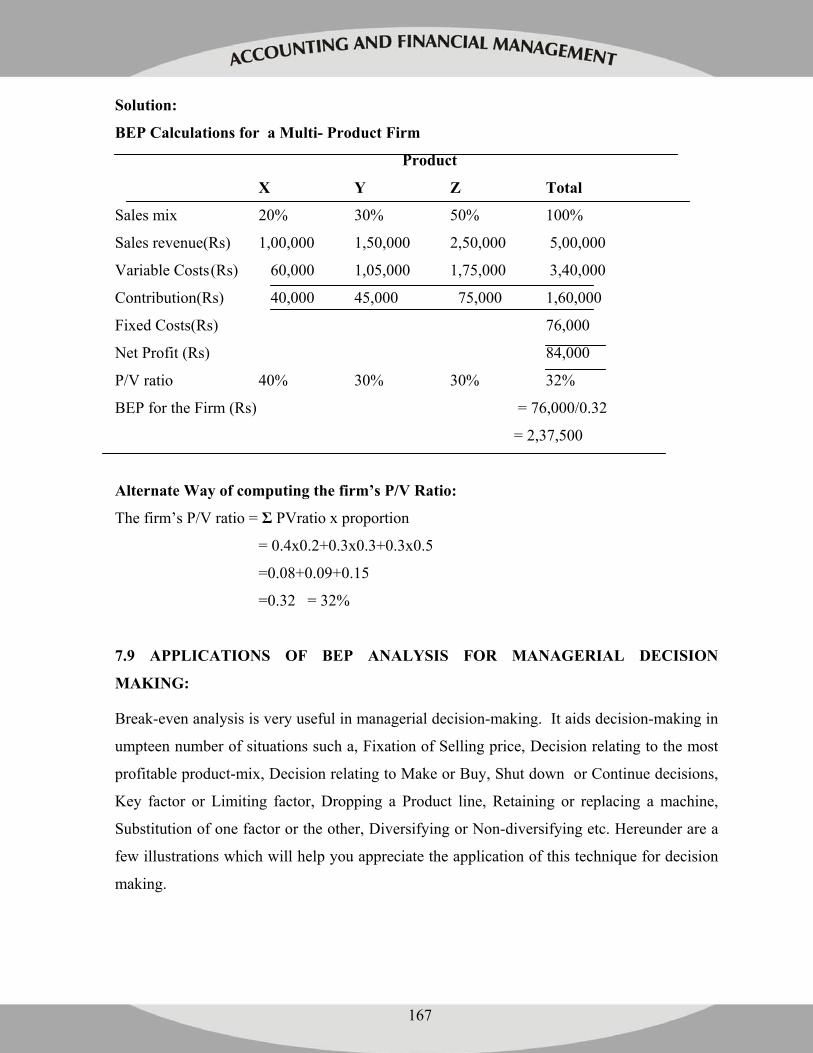
167
Solution:
BEP Calculations for a Multi- Product Firm
Product
X Y Z Total
Sales mix 20% 30% 50% 100%
Sales revenue(Rs) 1,00,000 1,50,000 2,50,000 5,00,000
Variable Costs (Rs) 60,000 1,05,000 1,75,000 3,40,000
Contribution(Rs) 40,000 45,000 75,000 1,60,000
Fixed Costs(Rs) 76,000
Net Profit (Rs) 84,000
P/V ratio 40% 30% 30% 32%
BEP for the Firm (Rs) = 76,000/0.32
= 2,37,500
Alternate Way of computing the firm’s P/V Ratio:
The firm’s P/V ratio = Σ PVratio x proportion
= 0.4x0.2+0.3x0.3+0.3x0.5
=0.08+0.09+0.15
=0.32 = 32%
7.9 APPLICATIONS OF BEP ANALYSIS FOR MANAGERIAL DECISION
MAKING:
Break-even analysis is very useful in managerial decision-making. It aids decision-making in
umpteen number of situations such a, Fixation of Selling price, Decision relating to the most
profitable product-mix, Decision relating to Make or Buy, Shut down or Continue decisions,
Key factor or Limiting factor, Dropping a Product line, Retaining or replacing a machine,
Substitution of one factor or the other, Diversifying or Non-diversifying etc. Hereunder are a
few illustrations which will help you appreciate the application of this technique for decision
making.
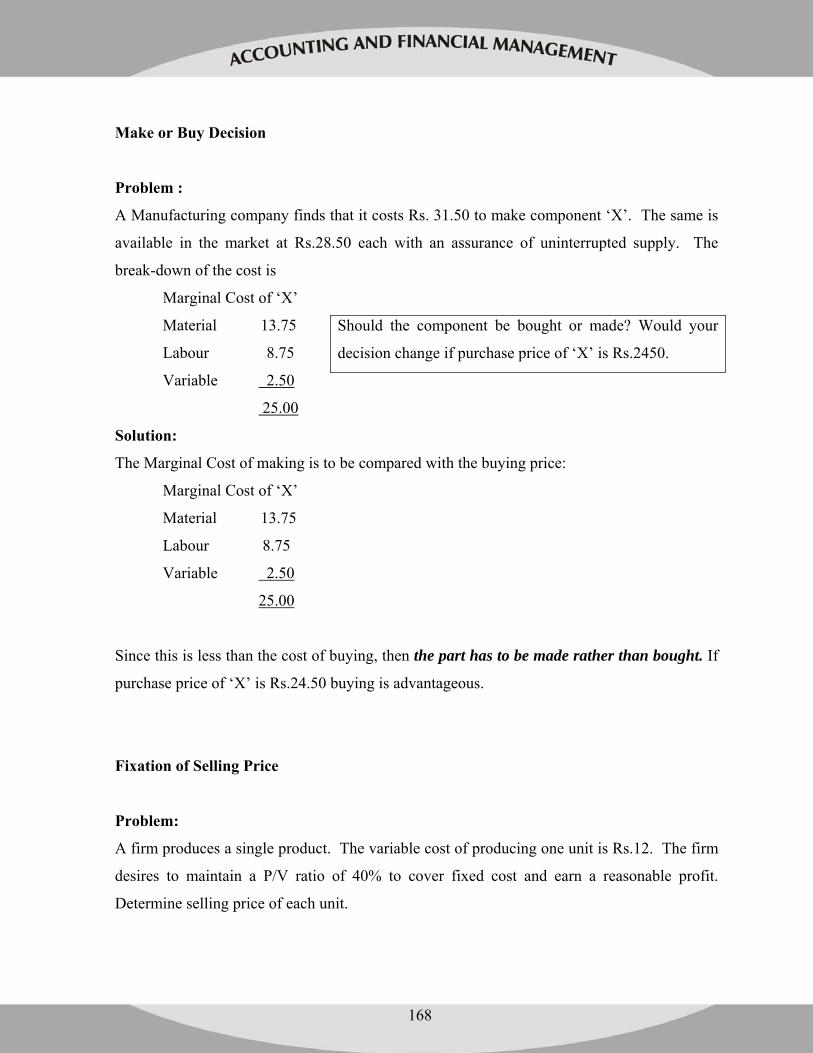
168
Make or Buy Decision
Problem :
A Manufacturing company finds that it costs Rs. 31.50 to make component ‘X’. The same is
available in the market at Rs.28.50 each with an assurance of uninterrupted supply. The
break-down of the cost is
Marginal Cost of ‘X’
Material 13.75
Labour 8.75
Variable 2.50
25.00
Solution:
The Marginal Cost of making is to be compared with the buying price:
Marginal Cost of ‘X’
Material 13.75
Labour 8.75
Variable 2.50
25.00
Since this is less than the cost of buying, then the part has to be made rather than bought. If
purchase price of ‘X’ is Rs.24.50 buying is advantageous.
Fixation of Selling Price
Problem:
A firm produces a single product. The variable cost of producing one unit is Rs.12. The firm
desires to maintain a P/V ratio of 40% to cover fixed cost and earn a reasonable profit.
Determine selling price of each unit.
Should the component be bought or made? Would your
decision change if purchase price of ‘X’ is Rs.2450.
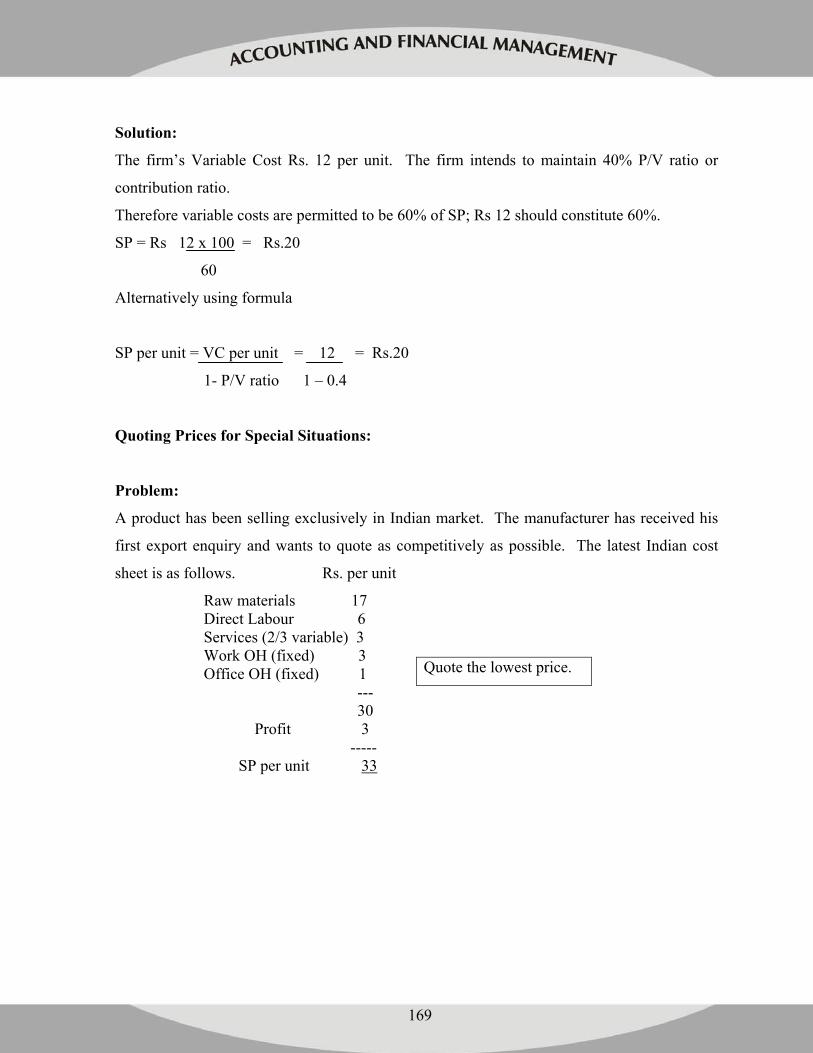
169
Solution:
The firm’s Variable Cost Rs. 12 per unit. The firm intends to maintain 40% P/V ratio or
contribution ratio.
Therefore variable costs are permitted to be 60% of SP; Rs 12 should constitute 60%.
SP = Rs 12 x 100 = Rs.20
60
Alternatively using formula
SP per unit = VC per unit = 12 = Rs.20
1- P/V ratio 1 – 0.4
Quoting Prices for Special Situations:
Problem:
A product has been selling exclusively in Indian market. The manufacturer has received his
first export enquiry and wants to quote as competitively as possible. The latest Indian cost
sheet is as follows. Rs. per unit
Raw materials 17 Direct Labour 6 Services (2/3 variable) 3 Work OH (fixed) 3 Office OH (fixed) 1 --- 30 Profit 3 ----- SP per unit 33
Quote the lowest price.
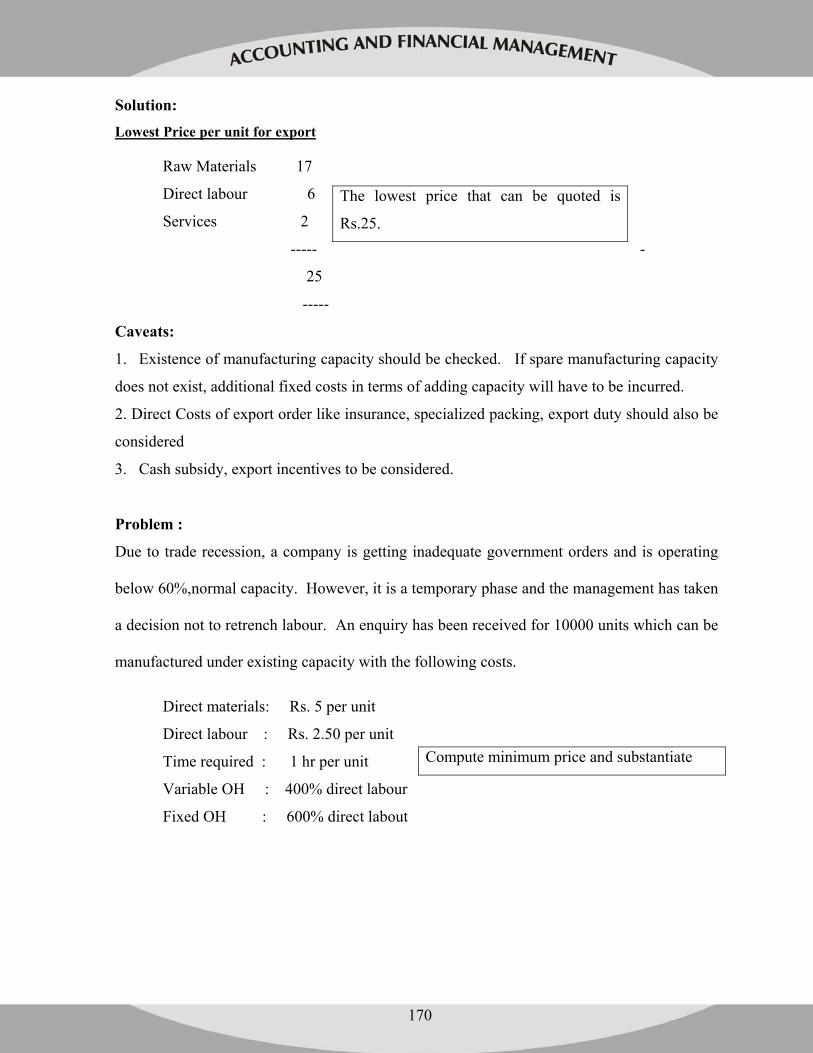
170
Solution:
Lowest Price per unit for export
Raw Materials 17
Direct labour 6
Services 2
----- -
25
-----
Caveats:
1. Existence of manufacturing capacity should be checked. If spare manufacturing capacity
does not exist, additional fixed costs in terms of adding capacity will have to be incurred.
2. Direct Costs of export order like insurance, specialized packing, export duty should also be
considered
3. Cash subsidy, export incentives to be considered.
Problem :
Due to trade recession, a company is getting inadequate government orders and is operating
below 60%,normal capacity. However, it is a temporary phase and the management has taken
a decision not to retrench labour. An enquiry has been received for 10000 units which can be
manufactured under existing capacity with the following costs.
Direct materials: Rs. 5 per unit
Direct labour : Rs. 2.50 per unit
Time required : 1 hr per unit
Variable OH : 400% direct labour
Fixed OH : 600% direct labout
The lowest price that can be quoted is
Rs.25.
Compute minimum price and substantiate
171
Solution: Per Unit Total
Direct material 5 50,000
Direct labour 2.50 25,000
Variable OH (400% DL) 10 100000
-------- ----------
17.50 175000
--------- ----------
The lowest price is Rs17.50 per unit
Recovery of Rs.25,000 as wages which are for the present fixed cost because of management
decision not to retrench labour.
Shut down or Continue Decisions
Problem :
A company produces a single product. Its selling price and cost of production per unit are as
under.
Output 40,000 units
Material Cost Rs. 2.00
Labout Cost Rs. 2.00
Variable OH Rs. 1.00
Fixed expenses Rs. 2.00
-------------
Total Cost Rs. 7.00
Due to depression the company is not able to sell at the existing price of Rs.8/- per unit.
However, the entire output can be sold at Rs.6/- per unit. Advise whether the company should
continue or close.
172
Solution:
If the product is being sold for Rs.6/-, there is a loss of Rs.1 per unit.
Therefore Total Loss = 1x 40,000
= Rs. 40,000
However, it is recovering Rs,2/- of fixed cost per unit other wise the firm would incur a loss
of Rs.2 x40,000 units = Rs. 80,000. The firm is able to reduce its loss by continuing.
Or
Profit Statement:
Sales Revenue 6 x 40,000 = 2,40,000
(-) VC 2,00,000
Contribution 40,000
(-) FC 80,000
Loss 40,000
Problem :
Lara Company Operates at normal capacity of 1,00,000 unit and sells them @ Rs.60/- per
unit. The unit cost of manufacturing at normal capacities is as follows.
Direct material 16.25
Direct labour 6.50
Variable OH 8.25
Fixed OH 10.00
-----------
Total 41.00
-----------
The variable S&D expenses are Rs.1.50 per unit. Due to recession, the company feels that
only 10,000 units can be sold next year at Rs.50/- per unit. Shut down option is available. In
173
case of shut down fixed manufacturing overhead can be reduced to Rs.7,25,000/- for the next
year. Additional costs of shut down are estimated to be Rs. 1.82,500/-. Advise whether to shut
down or not.
Solution:
To Continue Shut Down
Sales Revenue (10,000x50 5,00,000 Unavoidable FC 7,25,000
(-) VC (10,000x32.50) 3,25,000 Additional shut down cost 1,87,500
-------------- -------------
Contribution 1,75,000 Shut down costs 9,12,500
(-) Fixed Costs 10,00,000 -----------
---------------
Operating Loss 8,25,000
---------------
Therefore since there is greater loss in case of shut down, it is advised to continue.
7.10 LIMITATIONS OF CVP ANALYSIS:
The CVP analysis is subject to the following limitations. C-V-P Analysis as a tool of profit
planning is based on certain assumptions which have been explained earlier. These
assumptions themselves become the major limitations.
Segregability of Costs: Breakeven Analysis assumes that all costs can be segregated into
‘Fixed Costs’ and ‘Variable Costs’. ♦ Not all costs can be easily and accurately separated into
fixed and variable elements. ♦ Total fixed costs do not remain constant beyond certain ranges
of activity levels but increase in a step-like fashion. ♦ It assumes that output is the only factor
affecting costs, but there are other variables which can affect costs, e.g., inflation, efficiency
and economic and political factors.
Constancy of Selling Price: The second assumption is that the selling price of the firm
products remains constant, no matter what the level of output. This is in contravention to the
174
normal economic laws of supply and demand where we see that price is a function of supply
and demand. ♦CVP analysis assumes that costs and sales can be predicted with certainty.
However, these variables are uncertain and the Finance Manager must try to incorporate the
effects of uncertainty into his information.
Constancy of Product Mix: Another assumption on which CVP Analysis is based is that the
firm produces only one product, i.e., it is a uni-product firm or even if it is a multi-product
firm, the product mix would remain constant and not change. However, the sales mix will be
continually changing owing to changes in demand
Synchronisation of Production and Sales: CVP Analysis also assumes that there is perfect
harmony between production and sales that all that has been produced will be sold and
therefore there will not be any changes in levels of inventory. ♦ There is an assumption that
there are either no stocks, or no changes in stock levels. Profit is therefore dependent on the
sales volume. However, when changes in stock levels occur and such stocks are valued using
absorption costing principles, then profit will vary with both production and sales. If sales are
depressed, profit can be raised by increasing production and thereby increasing stock levels.
Profit is therefore a function of two independent variables (sales and production). The
conventional break-even chart is two dimensional and cannot cope with two independent
variables. It is important to note that if stocks are valued using marginal costing principles
then profit is a function of sales, only, and the conventional CVP analysis applies.
7.11 SUMMARY:
Every Organisation, whether commercial or otherwise needs to create a surplus One of the
methods of profit planning for manufacturing organizations is the Cost-Volume Profit-
Analysis or C-V-P Analysis for short. C-V-P Analysis as a tool of profit planning is based on
certain assumptions. CVP Analysis mainly depends on the concept called Breakeven Point.
Breakeven Point is that level of output and sales, where the total costs (TC) are equal to Total
Revenues (TR). CVP Analysis can also be used to ascertain the margin of safety, ascertain
the sales that need to be generated to achieve a specified amount of profit. Sales required to
175
earn a desired after tax profit also can be ascertained Break-even analysis is very useful in
managerial decision-making. It aids decision-making in umpteen number of situations such
as Fixation of Selling price, Decision relating to the most profitable product-mix, Decision
relating to Make or Buy, Shut down or Continue decisions, Key factor or Limiting factor,
Dropping a Product line, Retaining or replacing a machine, Substitution of one factor or the
other, Diversifying or Non-diversifying etc. The CVP analysis, however, is subject to certain
limitations. As a tool of profit planning certain the assumptions on which C-V-P Analysis is
based become its major limitations. However, in the short-run CVP Analysis is of immense
use as a profit planning device.
7.12 KEY WORDS:
Breakeven Point (BEP) Contribution
Profit- Volume Ratio Margin Of Safety
Profit Goal
Try yourself:
1. From the following particulars calculate
(i) BEP in Rs & Units
(ii) Number of units that must be sold to earn a profit of Rs 90,000
Fixed Factory costs : Rs 60,000
Fixed Selling costs: Rs 12,000
Variable Manufacturing cost per unit : Rs 12
Variable Selling cost per unit: Rs3
Selling price per unit: Rs24
Solution: BQ =8000 units; BR =Rs.1,92,000
Required Sales to earn a profit of Rs 90,000 is 4,32,000 units
Further Readings:
I.M. Pandey, Financial Management, Vikas Publishing, New Delhi.
N.K. Prasad, Principles of Cost Accounting, Book Syndicate Private Limited, Calcutta.
176
LESSON-8
BUDGETING
STRUCTURE:
8.1 Introduction
8.2 Importance of Budgets
8.3 Pre-requisites for Effective Budgeting
8.4 Process of Budget Formulation
8.5 Types of Budget Formulation
8.6 Techniques of Budgets
8.7 Key words
8.1 INTRODUCTION:
Budgeting is essentially a process of funding the activities needed to achieve the objectives of the
organization, during a definite period of time. “In its most basic form budgeting may be seen as
the financial expression of the sources of funding for and the allocation of such resources to the
various activities of the over a specified time period”1. Thus there are two important steps in the
budgeting process: (a) the determination of funds, and (b) allocation of funds. The scope of
OBJECTIVES:
Explains the meaning and importance of Budgeting
Discusses various types of Budgets
Discusses various techniques of Budgeting
177
budgeting to a large extent, depends upon the purposes for which an organization exists, from a
typical government budgeting to a truly business budgeting.
In the early stages of evolution of management in the business, budgeting served almost every
need of the business. Budgeting, thus, was identified with every aspect of management.
“Budgeting is essentially a managerial process. A business budget is a plan covering all phases of
operations for a definite period in the future. It is a formal expression of policies, plans,
objectives and goals laid down in advance by the top management for the concern as a whole and
for each sub division thereof.”2 Budget is an important document prepared by an organization.
The Institute of costs and Works Accountants defined the budget as “a financial and/or
quantitative statement, prepared and approved prior to a defined period of time, of the policy to
be pursued during that period for the purpose of attaining given objective. It may include income,
expenditure and the employment of capital”.3 From the above definition, the characterization of
Budget can be as shown below:
1. It is a financial and or quantitative statement
2. It is prepared in advance pertaining to a definite period, say for one year
3. Its purpose is to attain pre determined objectives
4. It reflects policies of an organization
5. It includes items of income and expenditure
8.2 IMPORTANCE OF BUDGETS:
i) Budget serves as an instrument of Planning and Control.
Planning is the first step in the management process. “Planning function determines
organizational objectives and policies, programmes, schedules, procures and methods for
achieving them. Planning is essentially decision making since it involves choosing among
alternatives and it also encompasses innovation. Thus planning is the decision on any phase of
organisedactivity”.4 Budget is essentially deciding about the alternatives to achieve objectives set
out for the organization as well as for various departments and on allocation of resources to
178
achieve the targets during the defined period. Budget enforces a discipline of planned thinking
and action for encompassing entire organization. Budget also decides on which activities need to
be carried out and at what level (volume) and at what cost.
Budget serves also serves as a tool of control. Control is the next step after formulation of
budgets. Control is equally an important element in the managerial process, to ensure that the
actual performance in the organization conforms to plans for realization of objectives set out.
The interest of the management does not end with the formulation of a budget, but extends to
implementing the budget which finally results in the achievement of objective. Thus the scope of
budgeting extends to controlling the activities to conform to the budget. Budgetary control is the
logical extension of budget formulation. The Institute of Cost and Works Accountants defined
the budgetary control as “the establishment of budgets relating the responsibilities of executives
to the requirements of a policy and the continuous comparison of actual with the budgeted results
either to secure individual action the objective of that policy, or to provide a basis for its
revision”. 5 By this definition, budgetary control is considered as a tool of management control
system by measuring the performance, reporting to the different levels of management relating
the budget with actual performance and enabling the management to take corrective action. The
feed back system sometimes leads to correction of plans because of changes in underlying
assumption made in plans. Thus budgetary control will be useful when it aids the management in
monitoring the performance on a continuous basis, comparison and reporting promptly and
accurately.
ii) Budgeting facilities coordination of different functions.
According to Welch “Coordination is the process whereby each sub-division of a concern works
toward the common objective, with due regard for all other sub-divisions and with a unity of
effort”.6 For example, there should be proper balance among the various functions like sales,
production, purchasing, personnel and finance etc to achieve the organizational objectives. This
can be achieved only through proper coordination. Coordination to a great extent depends upon
communication. Coordination is facilitated when each responsible executive is informed as to the
179
targets and actual performance with reference to the budget of his area of responsibility, related
functions and for the entire organization.
iii) Budgeting facilitates communication:
Management is effective where there is proper communication so that every body understands in
the same way. Budgeting ensures a two-way communication between top management and floor
level staff. Top management communicates to the floor level staff the budgets which indicate
targets to be achieved and the floor level managers indicate their requirements of resources to
achieve the targets. Finally the budget will be finalized after discussion at various levels.
Secondly, each function or division depends on other functions/divisions to achieve their targets.
A horizontal communication among various departments and functions in the form of group
meetings and discussions will remove misgivings and bring in the necessary cooperation. This is
achieved by budgeting process where in several meetings are held with representatives of all
functions and departments. Only after achieving consensus among various departments the
budget will be finalized. Thus budgeting facilitates important management process of
communication in the organization.
8.3 PRE-REQUISITES FOR EFFECTIVE BUDGETING:
The following mentioned factors should be prevalent for proper budgeting:
1. The budgeting process should be fully supported by top management
2. There should be an organization chart with clear identification of responsibilities for
managing resources and achieving results. It should also depict relationships between
various responsibility centres.
3. Budget manual which prescribes the procedures to be followed and various formats for
preparing the budget
4. All the staff charged with the responsibility of achieving budget should be actively
involved in the formulation of budget
180
5. Budget calendar – There should be budget calendar with possible scheduled dates for
initiating budget, communicating approved budgets to various heads of departments,
periodicity of performance reports, revision of budgets etc.
6. Uniform terminology - the budget department should develop uniform terms for common
understanding of all the concerned with the formulation and implementation of budget.
8.4 PROCESS OF BUDGET FORMULATION:
Procedure for budget formulation varies according to nature, needs, resources:
i) Classification of organization structure in terms of functions, programmes and activities
show precise objectives, the work done and the organizational responsibilities by each of them.
Function is a broad grouping of operations which are directed towards accomplishment of a major
purpose of an organization. Programme implies broad category within a function that identifies
end products of major organization. The purpose of a programme is to contribute to the
achievement of the objective of the function to which it belongs. Activity is a division of a
programme into homogenous type of work on schemes. An activity contributes towards
attainment of the end result of the programme to which it belongs.
ii) Establishment of proper measures of work or services to be rendered under each programme
and activity developing appropriate norms or standard for appraisal of performance of each
programme and activity in relating to its objectives.
iii) Construction of accounts along with functional lines is necessary for synchronization of
budget heads and accounting heads.
iv) Budget committee is formed with heads of decisions chaired by the Chief Executive Officer
of the organization and coordinated generally by the head of Finance division also known as
budget officer
v) Chairman of the budget committee or CEO initiates budget process by communicating the
heads of departments broadly indicating the business environment and suggested targets to be
achieved by the organization.
181
vi) The heads of department in turn communicates to the various heads of budget centres for
formulating the budgets relating to their respective centres of activities. These centres propose
the requirements of resources, for various activity levels.
vii) After internal discussion with various heads of budget centres, the heads of
departments/functions propose the budgets to the Budget committee.
viii) The Budget Committee discusses the proposals with heads of departments/functions and
draws upon draft budget for the entire organization.
ix) The board of directors finally approves the budget
x) The budget officer communicates the budgets of various departments for implementation.
From the discussion the main advantages of budgeting are as follows:
i) It is an instrument of management
ii) It evaluates factors affecting future of the organization
iii) It promotes cooperation among departments and coordination of different functional heads
iv) It is powerful tool of communication
v) It motivates employees to exceed the provisions performance
vi) It tries to improve efficiency and accountability at various levels of the organization.
Limitations of Budgeting:
i) its success depends upon the support of the top management
ii) it is not a substitute to good management and leadership
8.5 TYPES OF BUDGET:
Budgets can be classified on the basis of time, activities, approach and variability. These are
explained below.
On the basis of time:
Budgets can be classified on the basis of time. Broadly we can classify them into short term,
medium term, and long-term budget. Long-term budgets are used for assessing the long tem
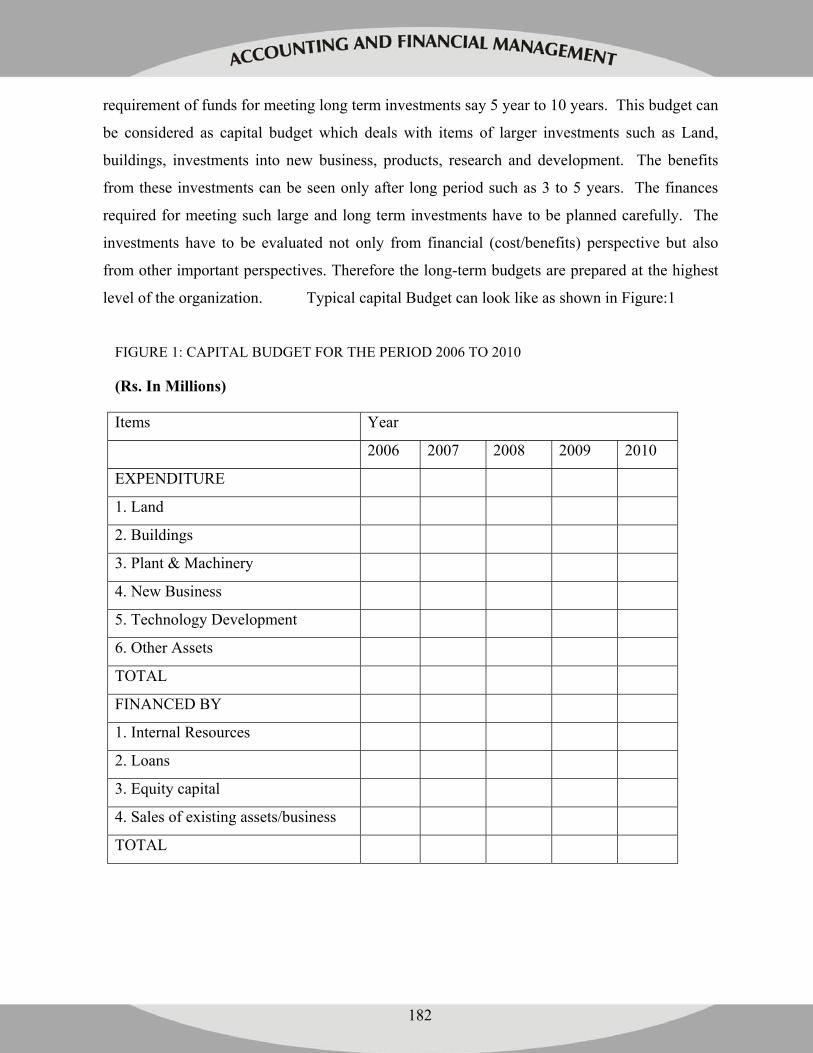
182
requirement of funds for meeting long term investments say 5 year to 10 years. This budget can
be considered as capital budget which deals with items of larger investments such as Land,
buildings, investments into new business, products, research and development. The benefits
from these investments can be seen only after long period such as 3 to 5 years. The finances
required for meeting such large and long term investments have to be planned carefully. The
investments have to be evaluated not only from financial (cost/benefits) perspective but also
from other important perspectives. Therefore the long-term budgets are prepared at the highest
level of the organization. Typical capital Budget can look like as shown in Figure:1
FIGURE 1: CAPITAL BUDGET FOR THE PERIOD 2006 TO 2010
(Rs. In Millions)
Items Year
2006 2007 2008 2009 2010
EXPENDITURE
1. Land
2. Buildings
3. Plant & Machinery
4. New Business
5. Technology Development
6. Other Assets
TOTAL
FINANCED BY
1. Internal Resources
2. Loans
3. Equity capital
4. Sales of existing assets/business
TOTAL
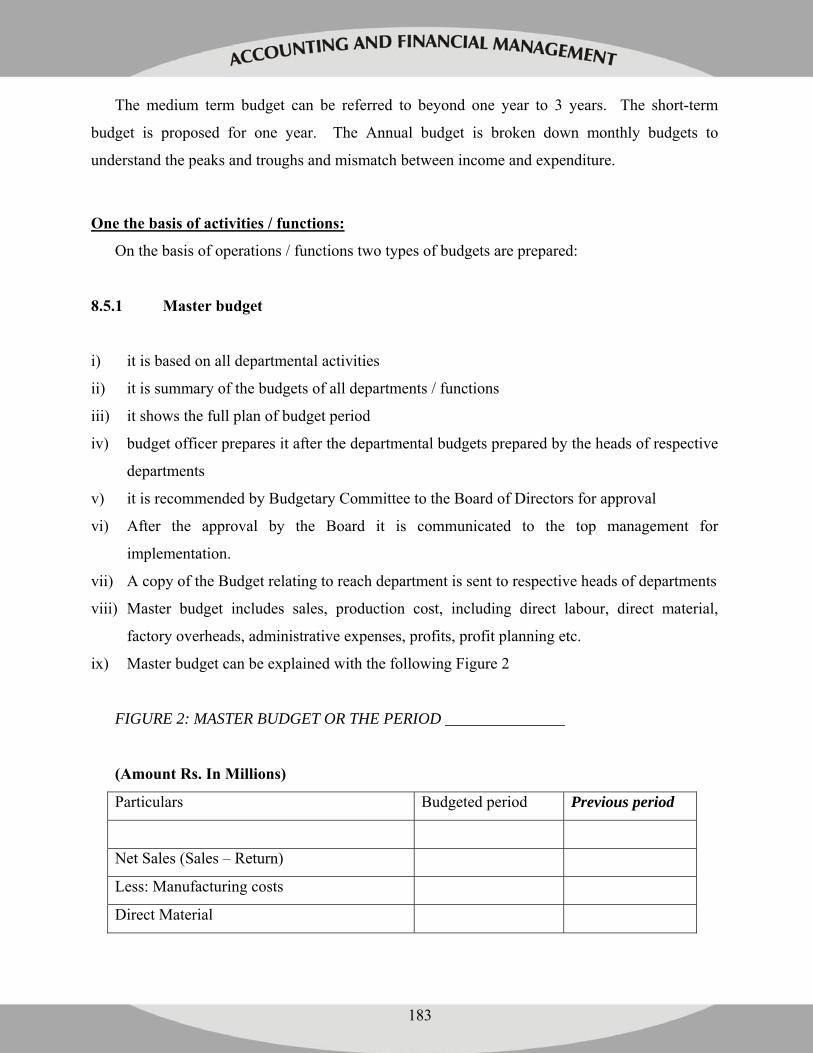
183
The medium term budget can be referred to beyond one year to 3 years. The short-term
budget is proposed for one year. The Annual budget is broken down monthly budgets to
understand the peaks and troughs and mismatch between income and expenditure.
One the basis of activities / functions:
On the basis of operations / functions two types of budgets are prepared:
8.5.1 Master budget
i) it is based on all departmental activities
ii) it is summary of the budgets of all departments / functions
iii) it shows the full plan of budget period
iv) budget officer prepares it after the departmental budgets prepared by the heads of respective
departments
v) it is recommended by Budgetary Committee to the Board of Directors for approval
vi) After the approval by the Board it is communicated to the top management for
implementation.
vii) A copy of the Budget relating to reach department is sent to respective heads of departments
viii) Master budget includes sales, production cost, including direct labour, direct material,
factory overheads, administrative expenses, profits, profit planning etc.
ix) Master budget can be explained with the following Figure 2
FIGURE 2: MASTER BUDGET OR THE PERIOD _______________
(Amount Rs. In Millions)
Particulars Budgeted period Previous period
Net Sales (Sales – Return)
Less: Manufacturing costs
Direct Material
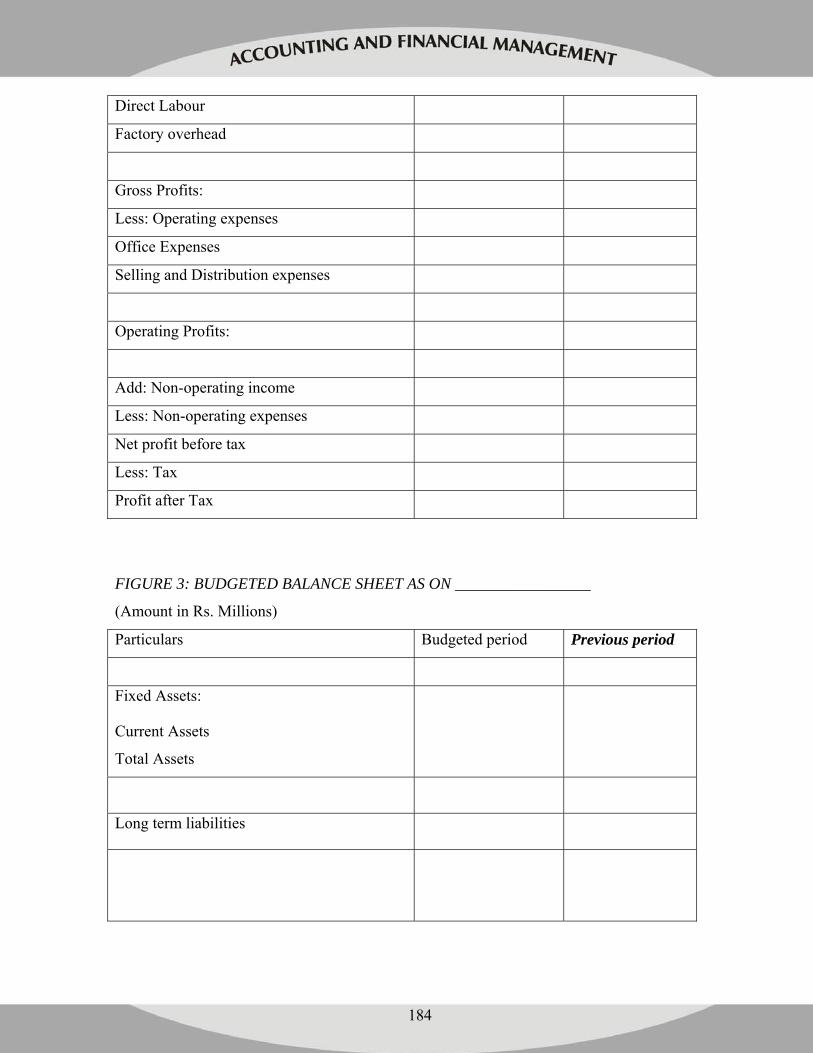
184
Direct Labour
Factory overhead
Gross Profits:
Less: Operating expenses
Office Expenses
Selling and Distribution expenses
Operating Profits:
Add: Non-operating income
Less: Non-operating expenses
Net profit before tax
Less: Tax
Profit after Tax
FIGURE 3: BUDGETED BALANCE SHEET AS ON _________________
(Amount in Rs. Millions)
Particulars Budgeted period Previous period
Fixed Assets:
Current Assets
Total Assets
Long term liabilities
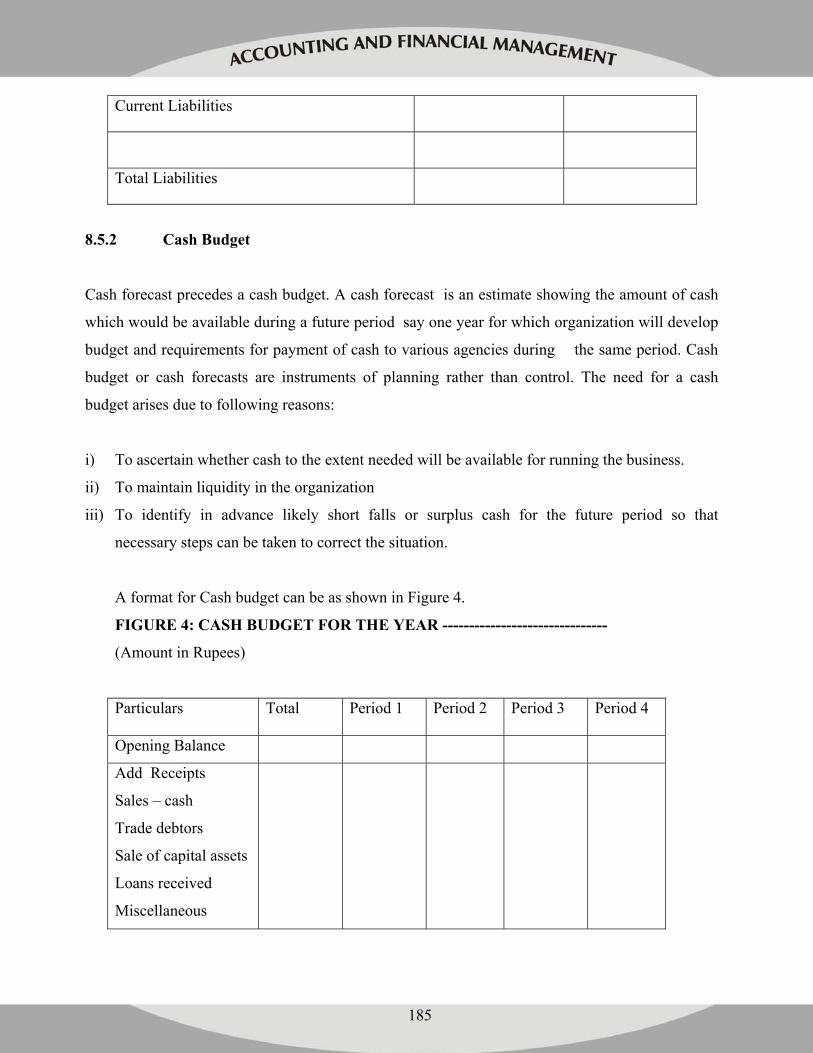
185
Current Liabilities
Total Liabilities
8.5.2 Cash Budget
Cash forecast precedes a cash budget. A cash forecast is an estimate showing the amount of cash
which would be available during a future period say one year for which organization will develop
budget and requirements for payment of cash to various agencies during the same period. Cash
budget or cash forecasts are instruments of planning rather than control. The need for a cash
budget arises due to following reasons:
i) To ascertain whether cash to the extent needed will be available for running the business.
ii) To maintain liquidity in the organization
iii) To identify in advance likely short falls or surplus cash for the future period so that
necessary steps can be taken to correct the situation.
A format for Cash budget can be as shown in Figure 4.
FIGURE 4: CASH BUDGET FOR THE YEAR -------------------------------
(Amount in Rupees)
Particulars
Total Period 1 Period 2 Period 3 Period 4
Opening Balance
Add Receipts
Sales – cash
Trade debtors
Sale of capital assets
Loans received
Miscellaneous
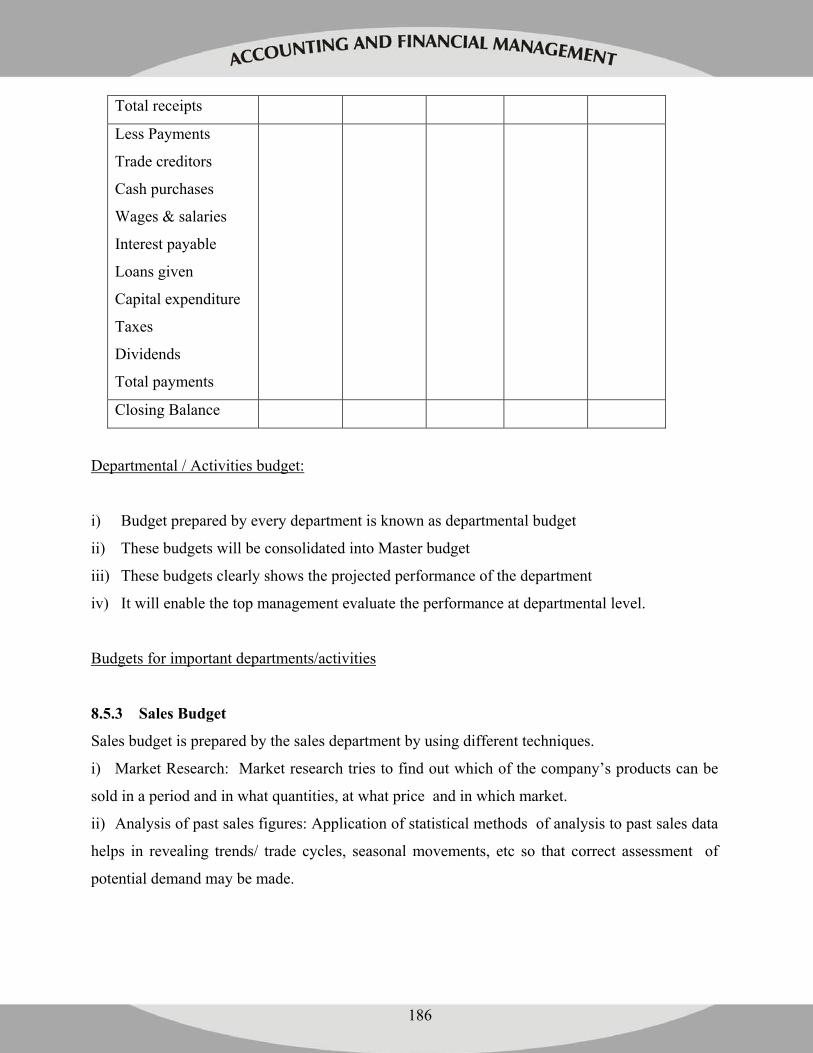
186
Total receipts
Less Payments
Trade creditors
Cash purchases
Wages & salaries
Interest payable
Loans given
Capital expenditure
Taxes
Dividends
Total payments
Closing Balance
Departmental / Activities budget:
i) Budget prepared by every department is known as departmental budget
ii) These budgets will be consolidated into Master budget
iii) These budgets clearly shows the projected performance of the department
iv) It will enable the top management evaluate the performance at departmental level.
Budgets for important departments/activities
8.5.3 Sales Budget
Sales budget is prepared by the sales department by using different techniques.
i) Market Research: Market research tries to find out which of the company’s products can be
sold in a period and in what quantities, at what price and in which market.
ii) Analysis of past sales figures: Application of statistical methods of analysis to past sales data
helps in revealing trends/ trade cycles, seasonal movements, etc so that correct assessment of
potential demand may be made.
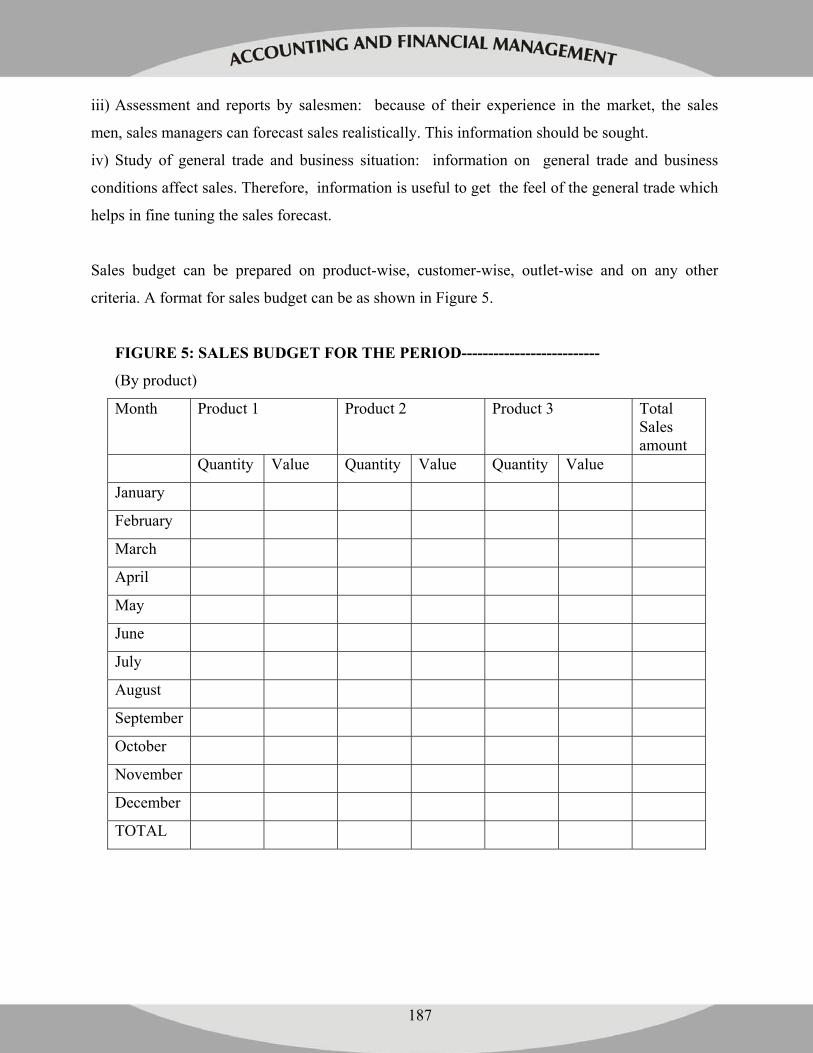
187
iii) Assessment and reports by salesmen: because of their experience in the market, the sales
men, sales managers can forecast sales realistically. This information should be sought.
iv) Study of general trade and business situation: information on general trade and business
conditions affect sales. Therefore, information is useful to get the feel of the general trade which
helps in fine tuning the sales forecast.
Sales budget can be prepared on product-wise, customer-wise, outlet-wise and on any other
criteria. A format for sales budget can be as shown in Figure 5.
FIGURE 5: SALES BUDGET FOR THE PERIOD--------------------------
(By product)
Month Product 1 Product 2 Product 3 Total Sales amount
Quantity Value Quantity Value Quantity Value
January
February
March
April
May
June
July
August
September
October
November
December
TOTAL
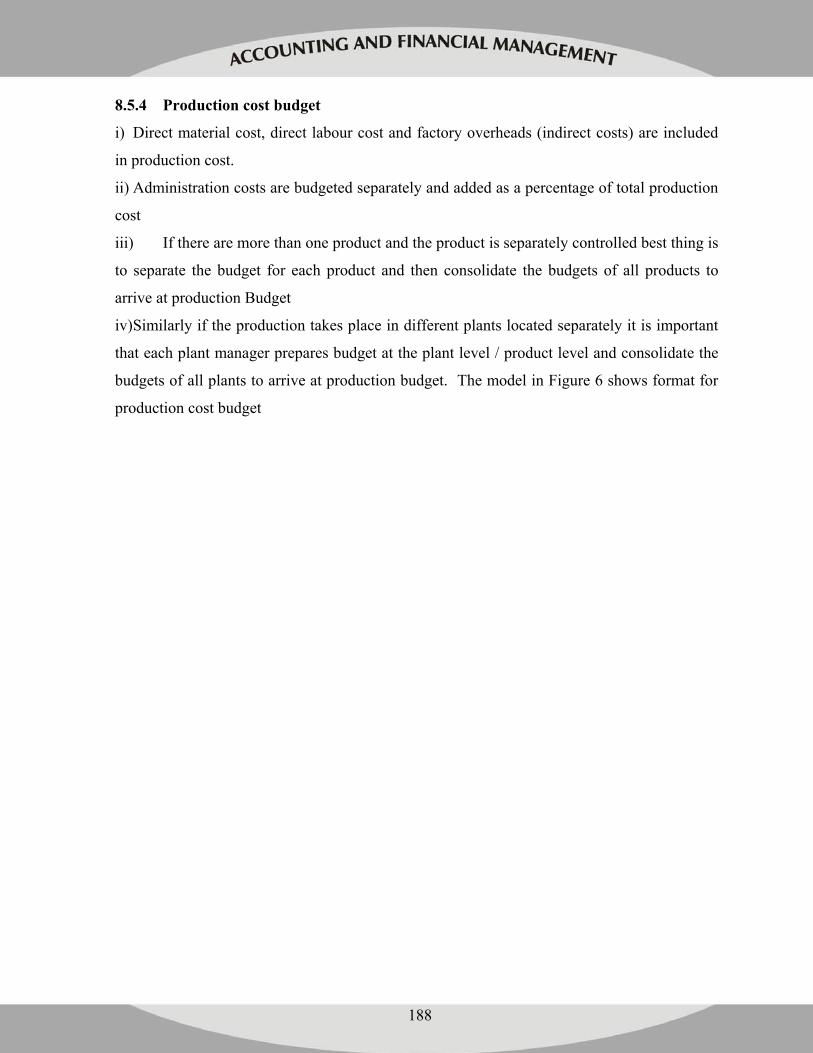
188
8.5.4 Production cost budget
i) Direct material cost, direct labour cost and factory overheads (indirect costs) are included
in production cost.
ii) Administration costs are budgeted separately and added as a percentage of total production
cost
iii) If there are more than one product and the product is separately controlled best thing is
to separate the budget for each product and then consolidate the budgets of all products to
arrive at production Budget
iv) Similarly if the production takes place in different plants located separately it is important
that each plant manager prepares budget at the plant level / product level and consolidate the
budgets of all plants to arrive at production budget. The model in Figure 6 shows format for
production cost budget
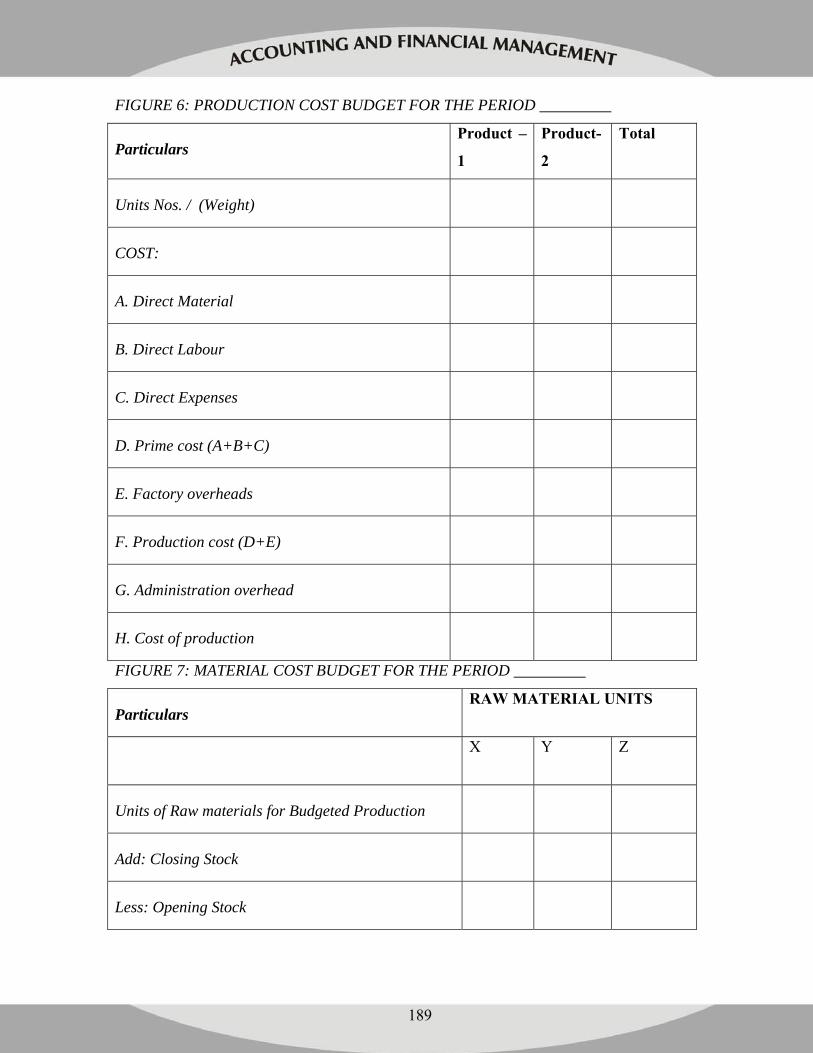
189
FIGURE 6: PRODUCTION COST BUDGET FOR THE PERIOD _________
Particulars Product –
1
Product-
2
Total
Units Nos. / (Weight)
COST:
A. Direct Material
B. Direct Labour
C. Direct Expenses
D. Prime cost (A+B+C)
E. Factory overheads
F. Production cost (D+E)
G. Administration overhead
H. Cost of production
FIGURE 7: MATERIAL COST BUDGET FOR THE PERIOD _________
Particulars RAW MATERIAL UNITS
X Y Z
Units of Raw materials for Budgeted Production
Add: Closing Stock
Less: Opening Stock
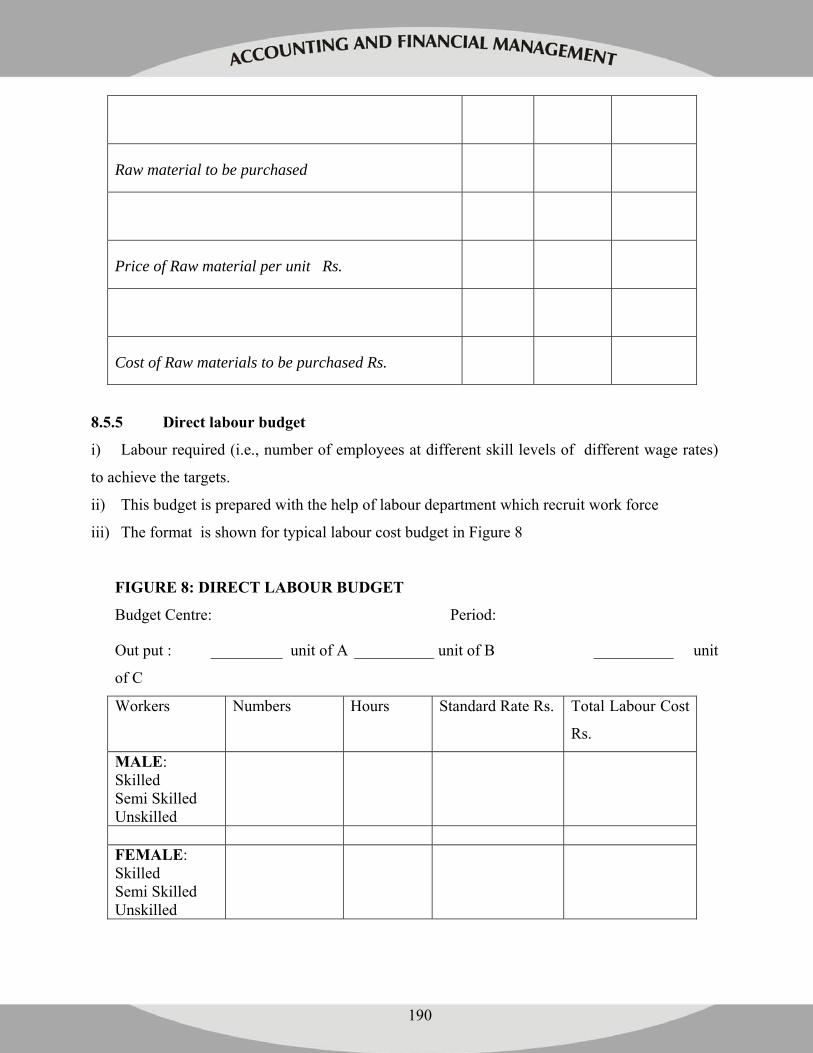
190
Raw material to be purchased
Price of Raw material per unit Rs.
Cost of Raw materials to be purchased Rs.
8.5.5 Direct labour budget
i) Labour required (i.e., number of employees at different skill levels of different wage rates)
to achieve the targets.
ii) This budget is prepared with the help of labour department which recruit work force
iii) The format is shown for typical labour cost budget in Figure 8
FIGURE 8: DIRECT LABOUR BUDGET
Budget Centre: Period:
Out put : _________ unit of A __________ unit of B __________ unit
of C
Workers Numbers Hours Standard Rate Rs. Total Labour Cost
Rs.
MALE: Skilled Semi Skilled Unskilled
FEMALE: Skilled Semi Skilled Unskilled
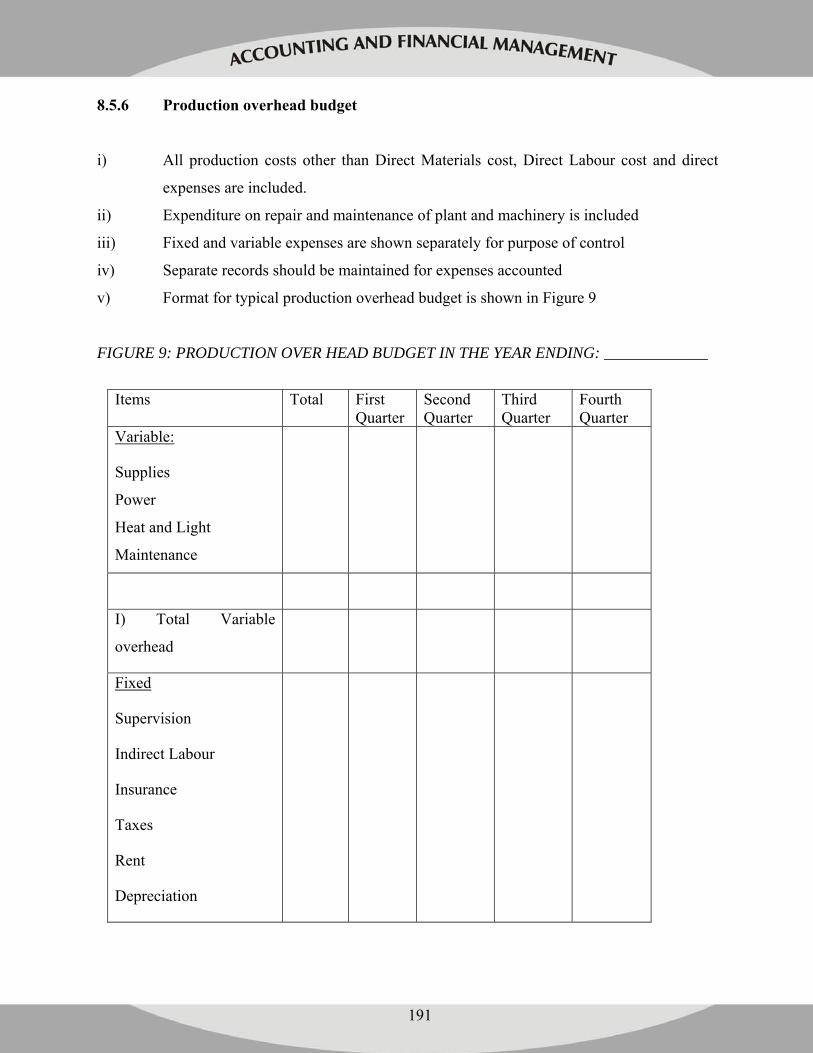
191
8.5.6 Production overhead budget
i) All production costs other than Direct Materials cost, Direct Labour cost and direct
expenses are included.
ii) Expenditure on repair and maintenance of plant and machinery is included
iii) Fixed and variable expenses are shown separately for purpose of control
iv) Separate records should be maintained for expenses accounted
v) Format for typical production overhead budget is shown in Figure 9
FIGURE 9: PRODUCTION OVER HEAD BUDGET IN THE YEAR ENDING: _____________
Items Total First
Quarter Second Quarter
Third Quarter
Fourth Quarter
Variable:
Supplies
Power
Heat and Light
Maintenance
I) Total Variable
overhead
Fixed
Supervision
Indirect Labour
Insurance
Taxes
Rent
Depreciation
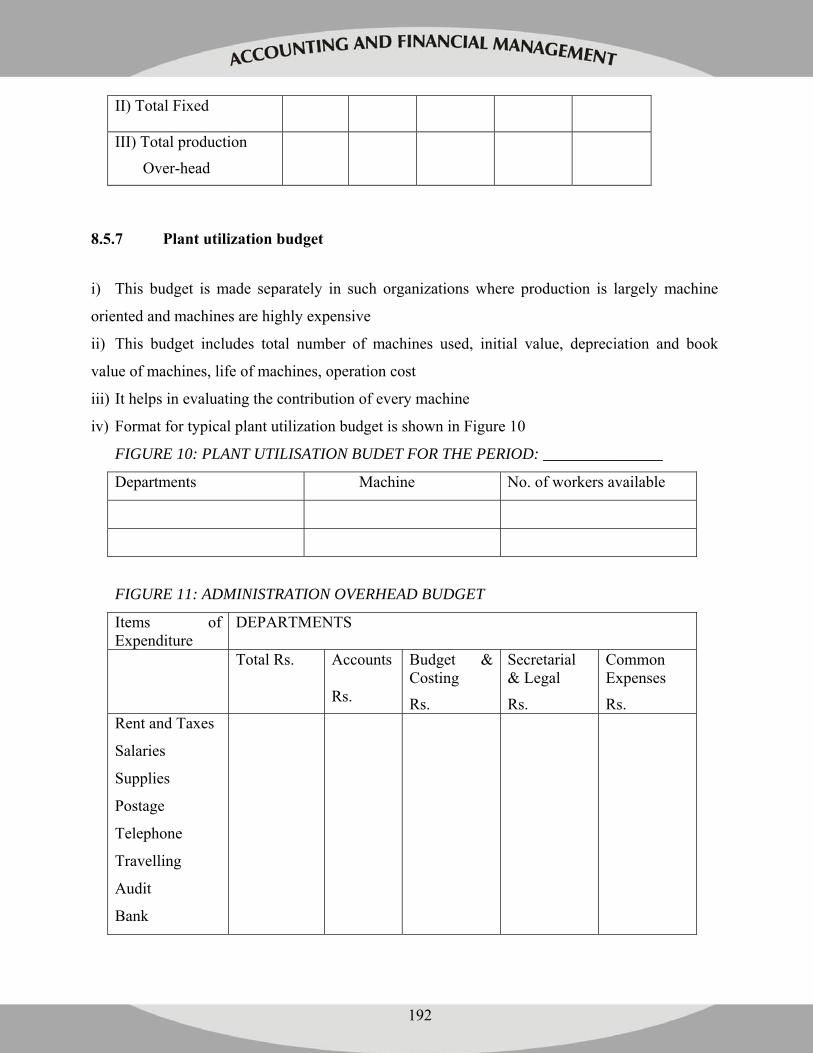
192
II) Total Fixed
III) Total production
Over-head
8.5.7 Plant utilization budget
i) This budget is made separately in such organizations where production is largely machine
oriented and machines are highly expensive
ii) This budget includes total number of machines used, initial value, depreciation and book
value of machines, life of machines, operation cost
iii) It helps in evaluating the contribution of every machine
iv) Format for typical plant utilization budget is shown in Figure 10
FIGURE 10: PLANT UTILISATION BUDET FOR THE PERIOD: _______________
Departments Machine No. of workers available
FIGURE 11: ADMINISTRATION OVERHEAD BUDGET
Items of Expenditure
DEPARTMENTS
Total Rs. Accounts Rs.
Budget & Costing
Rs.
Secretarial & Legal
Rs.
Common Expenses
Rs. Rent and Taxes
Salaries
Supplies
Postage
Telephone
Travelling
Audit
Bank
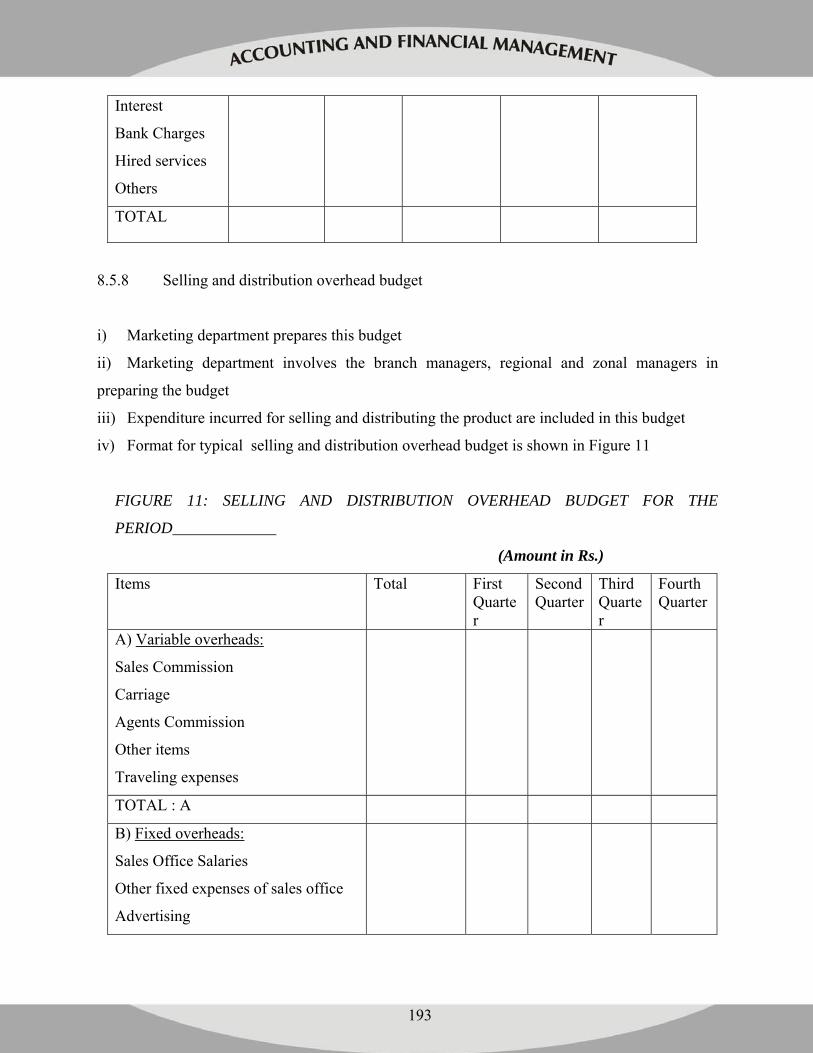
193
Interest
Bank Charges
Hired services
Others
TOTAL
8.5.8 Selling and distribution overhead budget
i) Marketing department prepares this budget
ii) Marketing department involves the branch managers, regional and zonal managers in
preparing the budget
iii) Expenditure incurred for selling and distributing the product are included in this budget
iv) Format for typical selling and distribution overhead budget is shown in Figure 11
FIGURE 11: SELLING AND DISTRIBUTION OVERHEAD BUDGET FOR THE
PERIOD_____________
(Amount in Rs.)
Items Total First Quarter
Second Quarter
Third Quarter
Fourth Quarter
A) Variable overheads:
Sales Commission
Carriage
Agents Commission
Other items
Traveling expenses
TOTAL : A
B) Fixed overheads:
Sales Office Salaries
Other fixed expenses of sales office
Advertising
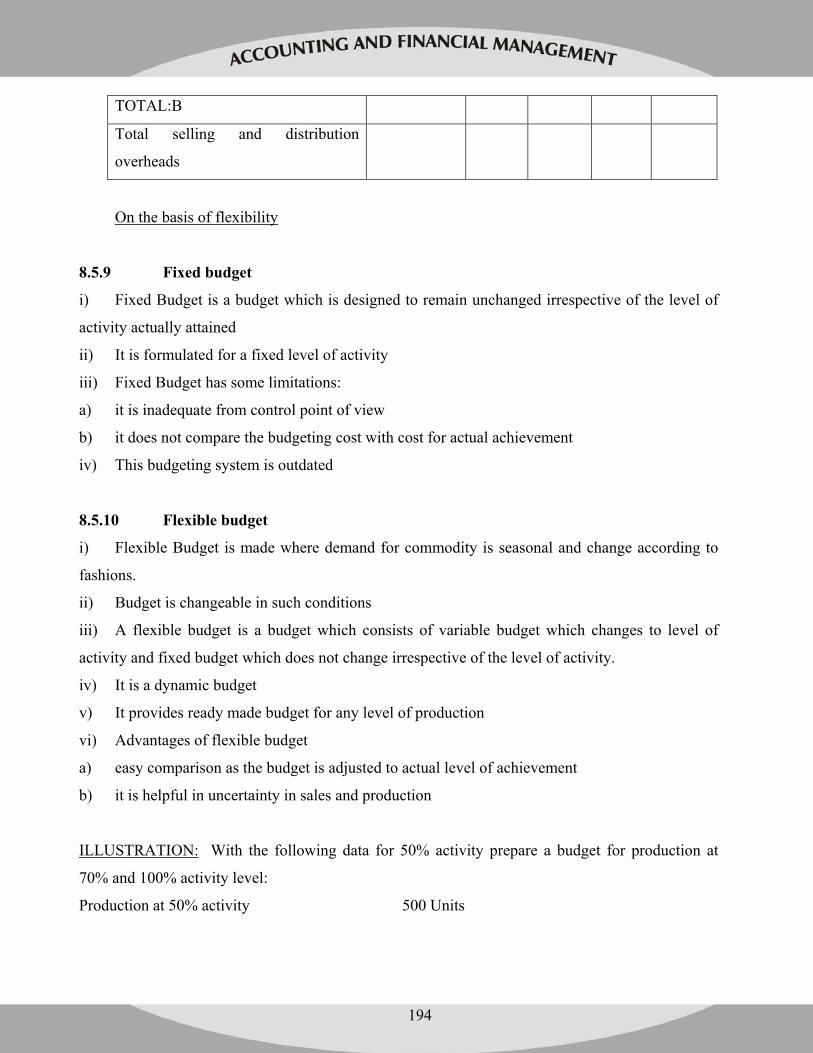
194
TOTAL:B
Total selling and distribution
overheads
On the basis of flexibility
8.5.9 Fixed budget
i) Fixed Budget is a budget which is designed to remain unchanged irrespective of the level of
activity actually attained
ii) It is formulated for a fixed level of activity
iii) Fixed Budget has some limitations:
a) it is inadequate from control point of view
b) it does not compare the budgeting cost with cost for actual achievement
iv) This budgeting system is outdated
8.5.10 Flexible budget
i) Flexible Budget is made where demand for commodity is seasonal and change according to
fashions.
ii) Budget is changeable in such conditions
iii) A flexible budget is a budget which consists of variable budget which changes to level of
activity and fixed budget which does not change irrespective of the level of activity.
iv) It is a dynamic budget
v) It provides ready made budget for any level of production
vi) Advantages of flexible budget
a) easy comparison as the budget is adjusted to actual level of achievement
b) it is helpful in uncertainty in sales and production
ILLUSTRATION: With the following data for 50% activity prepare a budget for production at
70% and 100% activity level:
Production at 50% activity 500 Units
195
Material Rs. 10 per unit
Labour Rs. 10 per unit
Expenses (40% fixed) Rs.40,000
Administration (30% fixed) expenses Rs.30,000
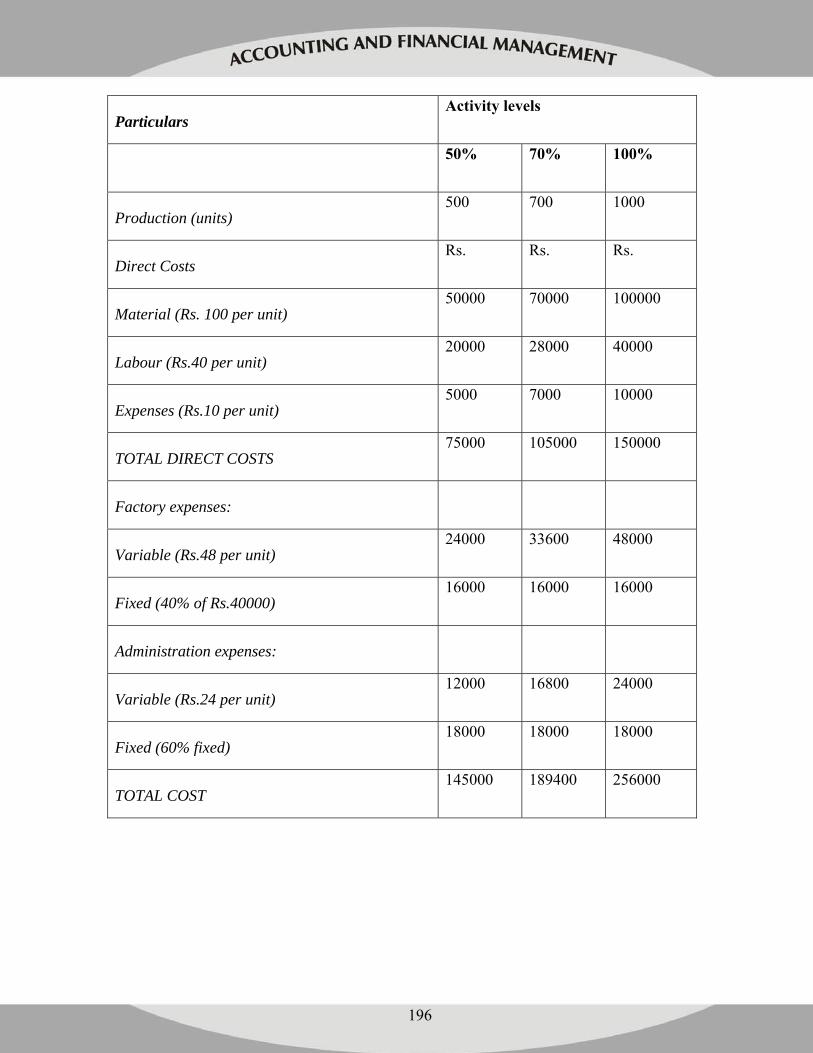
196
Particulars Activity levels
50% 70% 100%
Production (units) 500 700 1000
Direct Costs Rs. Rs. Rs.
Material (Rs. 100 per unit) 50000 70000 100000
Labour (Rs.40 per unit) 20000 28000 40000
Expenses (Rs.10 per unit) 5000 7000 10000
TOTAL DIRECT COSTS 75000 105000 150000
Factory expenses:
Variable (Rs.48 per unit) 24000 33600 48000
Fixed (40% of Rs.40000) 16000 16000 16000
Administration expenses:
Variable (Rs.24 per unit) 12000 16800 24000
Fixed (60% fixed) 18000 18000 18000
TOTAL COST 145000 189400 256000
197
Explanation:
i) Variable Factory overhead 60% of Rs.40000 or Rs.24000 for 500 units., i.e., Rs.48 per unit
ii) Variable Administration overhead – 40% of 30000 i.e., Rs.12000 for 500 units i.e., Rs.24 per
unit.
8.6 TECHNIQUES OF BUDGETS:
There are basically four techniques of budgeting:
1. Appropriation budgeting
2. Performance budgeting
3. Planning, programming, budgeting
4. Zero - base budgeting
These techniques are explained below.
8.6.1. Appropriation budgeting
The traditional budgeting is known as appropriation budgeting where the focus is on
appropriation of resources to various activities. Appropriations are approved allocation of
resources for various items of expenses. The focus of appropriation budgeting is on control of
inputs or resources or expenses. Budget is formulated and controlled on the basis of the nature of
expenses such as salaries, travel, maintenance etc. Therefore this technique is also known as line
item budgeting.
Main features of Appropriation budgeting:
1. The budget is functionally oriented. Budgets are formulated with reference to
functions/departments of the organization.
2. The appropriation is based on the past trends in the expenditure on various items such as
salary and travel with some adjustments for increases due to rise in prices of inputs. This is
otherwise known as incremental budgeting.
3. The control is procedure oriented. Financial control is the main objective of this approach
198
4. The spending agencies should not spend over and above the approved limit. Thus, budgets
were considered upper limits of expenditure.
5. The proprietary audit is conducted to ensure that the funds are not used for the purpose other
than those authorized.
Advantages of Appropriation budgeting:
1. Budgets are developed on departmental basis. Therefore, budgeting prevents one department
from getting funds at the expense of other department.
2. It is easy to prepare as the budget is based on past data and for line items like salary, travel
etc.
3. It is easy to understand as the budgets are prepared for each department on a gross basis. One
can judge the worth of each department.
4. It helps in establishing financial control on the resources. The departments can not spend a
rupee without prior approval. Budget is an instrument of controlling funds.
5. Control is centralised, uniform and comprehensive.
Limitations of Appropriation budgeting:
1. Since budgets are prepared on the basis of past data, it is likely that inefficiencies of the
previous years are carried forward.
2. As the budget allocations are not done on rational basis, they would tend to inflate the budget
amounts.
3. As the budgets are prepared on the past data, the rigorous analysis of alternatives before
finally approving the allocation is absent.
4. The budgeting system does not relate the output / outcome to the inputs. Therefore the
efficiency and economy in utilization of the resources are not taken care of. Consequential control
is thus absent.
5. The activities / programmes are carried on without examining the need to continue them.
199
In view of serious limitations, even the central / state governments which were adopting the
appropriation budgeting techniques, switched over to performance budgeting.
8.6.2 Performance budgeting
In view of serious limitations mentioned above, there was a case to reform the budgeting system
which will ensure allocation of resources on a satisfactory criteria and for controlling the
utilization of resources in the most efficient manner. Performance budgeting system is thus an
improvement over the appropriation budgeting in many ways.
According to Mohinder N Kaura, “Performance budgeting is essentially a multi level and on -
going annual process of management planning and control , which enables an organization to
accomplish its corporate goals by involving people from top to bottom for formulating and
implementing a time bound and realistic action plan”.7
“A performance budget is an operational document which translates the aspirations of an
organization into meaningful and feasible action programmes and activities for realizing the
objectives by integrating financial as well as physical targets of performance on major items of
business or service”. 8 The above definitions do represent the basic characteristics of performance
budgeting system as practical both in industry and government.
Features of Performance Budgeting System:
The main features of the performance budgeting system (PBS) are as follows:
1. It is essentially a performance / output oriented approach. It involves formulating plans,
setting up objectives, laying down policies and relating the proposed activities to the long and
short term objectives.
2. There are three components in PBS; classification of activity, performance measurement and
performance reporting.
3. The main purpose of PBS is to ensure consequential accountability in addition to procedural
accountability.
200
4. The structure of performance budget requires that an organization is identified into various
activity centres, known as “Responsibility Centres”. Objectives are specified, costs and outputs
are determined for each centre. The costs are also cross referenced to standard line item /object.
5. This approach requires the determination of a set of activity output measures, establishment of
relationship between these output measures and the cost of conducting activities.
For example, a budget for a purchase department is prepared after identifying the activity,
performance measures and costs. Input cost is expenditure on salaries of staff and other expenses.
The activity is “placing purchase orders on the vendors”. Performance measure is Purchase
Order. Output is number of purchase orders.
Department : Purchase department
Budget for the year 2006-07
Cost : (Input) Rs. 10,00,000 (Salaries etc.)
Purchase orders to be placed with vendors during the year: Rs. 10000 (Output)
Budget allowance : Rs. 100 per purchase order
Thus each department has to identify input cost and output (performance measure).
6. Performance is monitored through the performance measurement, performance reporting and
review.
Advantages of PBS
The Administrative Reforms Commission of Government of India successively stated the
advantages of PBS. They are:
1. Correlate the physical and financial aspects of every function, programme and activity.
2. Improve the budget formulation review and decision making at all levels of operations.
3. Facilitates better appreciation and review.
201
4. Enable a more effective performance audit and
5. Measure progress towards accomplishment of long term as well as short term goals.
Implementation difficulties of PBS:
The Performance budgeting system as an approach is still in vogue both in the government
and the industry. However there were some implementation difficulties.
1. The classification of organization structure into functions, programmes, and activities.
2. Measurement of productivity in government is difficult
3. Lack of proper classification of accounts to suit the budget formulation and review.
8.6.3 Planning, Programming Budgeting System (PPBS)
Another technique of budgeting, which has been tried out in the tried out in the 60’s in the US is
known as Planning, Programming Budgeting System (PPBS). According to Peter A Pyhrr, “PPB
was developed to provide a rational and systematic approach to identify and evaluate the costs
and consequences of strategic objectives (Planning) translate the strategic objectives into time
phased men and material needs in each organization (programming) and translate time phased
men and material needs into financial requirements (budgeting) PPB was designed to encourage
analysis of major policy issues and to provide a mechanism to identify the trade offs among
programs aimed at similar objectives”.9
Features of PPBs:
PPBS approach is explicitly linked to a prior planning process.
Objectives are set fort the programmes in specific terms.
The multi year costs and not just next year’s costs are estimated. The estimates are made for the
entire period of the programme.
The information is assembled at the programme level and each functional area or division of the
government
202
Consideration is given to alternative means of achieving the objectives
It incorporates techniques of analysis into budgeting by bringing the skills of economists,
engineers, and cost accountants at the decision making level and by moving the budget process
close to control planning and program development function.
PPBs covers total program cost both capital and operating expenditure
The criteria by which one programme alternative will be selected rather than the other will be cost
effectiveness, when output measures are non monetary in nature and cost benefit where output
measures are monitory in nature.
Areas of improvement associated with PPBS:
Carbon identified nine areas of improvement associated PPBs. “These are: 1. Definition of
objectives, 2. Information, 3. Use of analysis in decision making 4. Evaluation of programmes 5.
Management efficiency, 6. Involvement of officials in the budget process, 7. Recognition of the
legitimacy and necessity of analytic argument 8. Comparisons of related programmes in several
agencies, 9. State and local interest.” 10
The PPBS enables the setting up of clear objectives for each programmes; require collection and
display of information on programme inputs and outputs. Thus quality of information is
improved. The use of analytic methods and evaluation of programmes enhances the credibility
of decision making system. Participation of officials in the budgetary process and evaluation of
performance against predetermined programme plans motivate the budgeter in budget
implementation.’
Problems in implementation of PPBS:
a) The experience in implementation of PPBs in the US where it was started was not
encouraging and the implementation became more complex. The main reason is placing over
emphasis on ‘analysis’ rather than on ‘operational cost’.
203
b) The programme structure has become another larger unit in the organization structure.
c) Analytical studies proved to be difficult.
8.6.4 Zero base budgeting
Zero base Budgeting (ZBB) is an approach whereby each manager has to justify the resources
for the activity afresh for the accomplishment of objectives. The procedure to be followed in
ZBB, requires questioning of the current or proposed activities and programmes and evaluation
of these in a rational manner so that resources are used in the most efficient and effective
manner. The use of ZBB as a tool of planning and control evoked interest in 1960s. It was first
used in 1964 in the US Department of Agriculture when it prepared zero-base budgets as a
supplementary exercise to its existing budgets. ZBB was used in its full form first in the private
sector organization, Texas Instruments in the US when it was conceived by Peter A Pyhrr who
was working in that organization at that time as staff engineer.
Need for ZBB:
The government is not able to increase revenues to match with the requirements for various
programmes / activities. Similarly industry is facing serious competition. The enterprises have
to perform well in the face of competition. This calls for use of resources by the government and
industry more efficiently and effectively than ever. In this direction Peter A Pyhn raises the
following two questions that are not answered in the traditional budgeting approach. A) How
efficient and effective are the current operations that were not evaluated? B) Should the current
operations be reduced in order to fund high priority new progreammes or increase profit?
These questions are relevant both for the government and the industry. The answer lies in a
unique approach that would compel us to identify and analyze what we were going to set goals,
make necessary operational decisions by evaluating the alternatives during the budgetary
process. Zero – base technique would respond to these needs.
204
Steps in Zero base Budgeting:
The following steps generally take place while introducing ZBB.
1. Spelling out by the top management of the discrete activities of decision units
2. Construction of decision packages with a specification of corporate objectives, operational
objectives, standards and alternative performance methods to achieve these objectives
3. Priority ranking of the endorsed projects by the lower management level, followed by a
hierarchical review by higher levels of management with continual consolidated re ranking.
4. Allocation of organizational resources to decision units based on the consolidated ranking of
decision packages accepted and projection of available funds.
5. Monitoring the performance of projects on the basis of criteria established in the approved
decision packages.”11
Decision unit:
The first stage in the general structure of ZBB approach is the identification of organization into
decision units. The decision units are defined as “those parts or components of basic program or
organizational entity for which budget requests are prepared and for which managers make
significant decision on the amount of spending and the scope or quality of work to be
performed.”12 Decision units are typically cost centres, functional groups, and such a marketing
sales, secretarial service, projects such as research and development or major capital projects.
Thus decision units can be compared to responsibility centres in performance budgeting.
Decision Package
“A decision package identifies a discrete activity, function or operation in a definitive manner
for management evaluation and comparison with other activities.”13 Decision packages are
developed at the base level to promote detailed identification of activities and alternatives. P A
Pyhrr observes that the development of decision packages by the managers who are familiar with
205
the activities and who will be operationally responsible of the approved budget, will generate
interest in and participation by the managers.
Benefits of ZBB:
1. Identification, justification and evaluation of all activities proposed ensures more effective
allocation of resources.
2. Evaluation of the need for the activity and consideration of alternatives ways of performing
the activity, enables the organization to minimize the costs and strengthens the valve chain.
3. It provides greater flexibility in reallocating the resources.
4. By prioritizing the activities afresh, high priority new programmes can be funded totally or in
part by reducing or eliminating current activities.
5. By identification and logical networking of activities, duplication of effort in the organization
can be eliminated.
6. ZBB is a flexible process. Revisions during budget period can be done without much effort
when the conditions demand as the managers can identify which packages are affected by the
changes in conditions and can revise those specific packages.
7. ZBB requires information at the base activity level for review and evaluation. Collection and
display of information of all activities in the form of decision packages assures the top
management that proper analysis have been done and allows them to take a close look at these
packages.
8. ZBB process requires the managers to identify the activities and evaluate them by cost
/benefit analysis. Normally, the managers are confronted with the decision to choose the best
alternative in conducting the day to day operations. Thus, ZBB provides the opportunity to the
managers acquire and improve the analytical skills.
9. Performance of the managers can be measured in terms of benefits accrued and
accomplishment of goals as stated in decision packages. This can be carried out periodically
during the course of the budget year. These mid course reviews can be taken as a preview to the
planning and budgeting cycle that begin later for the next budgeting year.
206
Problems in implementation of ZBB:
1. Managers are suspicious of any process that forces detailed examination of activities which
would probably expose the managers of their inefficiencies to others.
2. The degree of success of implementing ZBB to certain extent depends upon the
communication system obtained in the organization. The organizational climate wherein the
lower level manages are given an opportunity to express views freely and frankly and the senior
level managers have the tenacity to listen to others and face the critical and close review of
activities is important. Absence of this is a major limitation in successful implementation of
ZBB.
3. Absence of formalized policy and planning assumptions or poor communication of these
across the organization proved to be limiting factors in successful implementation of ZBB.
4. Determining the minimum level effort requires judgement on the part of the activity manager.
Establishing this minimum well below the current operating level is unthinkable to many
managers, who prefer to identify the minimum level at their current operating level or some
times above that level.
5. It is difficult to identify work measures for all the activities for evaluation. It is also difficult t
develop data base for future analysis and evaluation.
6. Higher level managers will face difficulty in evaluating the similar packages.
However this approach has been used in various ways other than in the form in which it was
implemented in the US.
4.7 SUMMARY:
Budgeting is essentially a process of funding the activities needed to achieve the objectives of the
organization, during a definite period of time. Budgeting is essentially a managerial process. A
business budget is a plan covering all phases of operations for a definite period in the future. .
Budget enforces a discipline of planned thinking and action for encompassing entire organization.
Budget serves also serves as a tool of control. Budgets can be classified on the basis of time,
207
activities, approach and variability. There are basically four techniques of budgeting:
Appropriation budgeting, Performance budgeting, Planning, programming, budgeting, Zero - base
budgeting each with its own advantages, disadvantages and suitability to specific situations.
8.8 KEY WORDS:
Budget Capital budget
Master budget Cash budget
Departmental/functional budget Fixed budget
Flexible budget Appropriation budgeting
Performance budgeting Zero-base budgeting
NOTES AND REFERENCES
1. Cutt James, Rittez Richard. Public Non- profit Budgeting: The Evolution and Application
of Zero-Base Budgeting Toronto, The Institute of Public Administration of Canada, 1984, p.1
2. Welsch Glenn A Budgeting Profit Planning and control Englewood Cliffs, New Jersey,
Prentice Hall Inc. 1964
3. Terminology of Cost Accountancy, the Institute of cost and Works Accountants, London,
1966 in Batty J. Eds. Cost and Management Accountancy for students, London Heinemann,
1970.
4. Farmer Richard N. and Richman Barry M. Comparative Management and Economic
Progress Homewood, Illinois, Richard D Irwin Inc, 1965, p.17
5. Terminology of Cost Accountancy, the Institute of cost and Works Accountants, London,
1966 in Batty J. Eds. Cost and Management Accountancy for students, London Heinemann,
1970.
6. Welsch Glenn A Budgeting Profit Planning and control Englewood Cliffs, New Jersey,
Prentice Hall Inc. 1964
7. Kaura Mohinder N. Performance Budgeting System in Government Organisations Lok
Udyog May 1984
208
8. Kaura Mohinder N. Performance Budgeting System in Government Organisations Lok
Udyog May 1984
9. Peter Pyhrr A. Zero Base Budgeting: A Practical Management tool for Evaluating
Expenses New York, John Wiley & sons Inc, 1973 p.142
10. In Peter Pyhrr A. zero –Base Budgeting: A Practical Management tool for Evaluating
Expenses New York, John Wiley & sons Inc, 1973 pp.148-49
11. Kaura Mohinder N. and Mallikharjuna Rao S. Budgeting for Corporate Success: Indian
Practices Calcutta, Indian Accounting Association Research Foundation, 2000
12. General Accounting Office A Glossary of Terms used in Federal Budget office
Washington, March, 1981, p.55
13. Peter Pyhrr A. Zero Base Budgeting: A Practical Management tool for Evaluating
Expenses New York, John Wiley & sons Inc, 1973 p.6
Try yourself:
1. Explain the meaning of budgeting?
2. Explain the importance of budgeting?
3. Discuss the process of budgeting.
4. Explain the following budgets:
a) Master budget b) Sales budget c) Production cost budget d) Flexible budget
5. Write short notes on the following i) Appropriation budgeting ii) Performance
budgeting
iii) Zero-base budgeting
Recommended