A PARTIAL ECONOMIC IMPACT ANALYSIS
OF ARIZONA’S HORSE INDUSTRY
PROJECT COMPLETION REPORT
Project Sponsor: Arizona State Horseman’s Association
Phase I: Pleasure Horse and Racing Impact Update
Phase II: Horse Show Impact
Bruce R. Beattie, Trent Teegerstrom, Jorgen Mortensen, and Eric Monke
Department of Agricultural and Resource Economics
College of Agriculture and Life Sciences
The University of Arizona, Tucson
October 31, 2001
A PARTIAL ECONOMIC IMPACT ANALYSIS OF ARIZONA’S HORSE INDUSTRY ii
TABLE OF CONTENTS
LIST OF FIGURES ..................................................................................................... iv
LIST OF TABLES ....................................................................................................... iv
ACKNOWLEDGMENTS.............................................................................................. v
EXECUTIVE SUMMARY ........................................................................................... vi
Preamble ..................................................................................................................... 1
I. INTRODUCTION.................................................................................................. 2
II. THE STRUCTURE OF ARIZONA’S HORSE INDUSTRY .............................. 4Direct Effects ...................................................................................................... 4Indirect Effects .................................................................................................... 6Induced Effects.................................................................................................... 7Components of Arizona’s Horse Industry Included and Not Included .................. 7
III. GENERAL RESEARCH APPROACH AND PROCEDURES ........................... 9
IV. EXPENDITURES OF ARIZONA RESIDENTS FOR OWNERSHIP
AND CARE OF PLEASURE HORSES.............................................................10Costs of Maintenance and Ownership of a Pleasure Horse.................................10Summary of Per Household Costs of Ownership and Maintenanceof Pleasure Horses .............................................................................................16Direct Economic Impact of Pleasure Horse Ownershipby Arizona Households .....................................................................................17
V. EXPENDITURES OF ARIZONA RESIDENTS AND NON-RESIDENTS
ASSOCIATED WITH HORSE RACING...........................................................20
VI. EXPENDITURES OF ARIZONA RESIDENTS AND NON-RESIDENTS
AS PARTICIPANTS AND SPECTATORS AT NON-RACING EVENTS .....22Questionnaire Survey ........................................................................................23Expenditures According to Surveys ...................................................................23Participant Entry and Stall Fees and Spectator Admission Fees .........................27Summary of Expenditures Related to Four Surveyed Horse Shows....................27Direct Economic Activity at Other Arizona Horse Shows..................................28Arizona Resident Spectators at Rodeos, Gymkhana, and Polo Events ................29
A PARTIAL ECONOMIC IMPACT ANALYSIS OF ARIZONA’S HORSE INDUSTRY iii
VII. CONTRIBUTION OF SUB-SECTORS OF ARIZONA’S HORSE
INDUSTRY TO THE ARIZONA ECONOMY...................................................30 A Word of Caution ............................................................................................ 30
Estimation Methodology ...................................................................................31The Direct, Indirect and Induced, and Total Impact Estimates ...........................31
VIII. HORSE AND HOUSEHOLD NUMBERS AND COMPARISON WITH
OTHER SECTORS............................................................................................33
References ..............................................................................................................36
A PARTIAL ECONOMIC IMPACT ANALYSIS OF ARIZONA’S HORSE INDUSTRY iv
LIST OF FIGURES
Figure 1. Schematic of Arizona Horse Industry by Principal and Related Sectors............ 5
Figure 2. Comparison of Direct Expenditures on Horses to Agricultural CommoditySales and State Government Expenditures on Protection and Safety...............35
LIST OF TABLES
Table 1. Pleasure Horse Summary Budget ................................................................... 11
Table 1a. Commercial Boarding Budget........................................................................12
Table 1b.Owner Care and Maintenance Budget ............................................................ 13
Table 2. Investment and Ownership Costs: Pleasure Horses.........................................14
Table 3. Estimated Expenditures of Various Components of Arizona’sHorse Racing Industry, 2001.......................................................................... 21
Table 4. Estimated Average Daily Lodging Prices during Show Period .......................25
Table 5. Total Direct Economic Activity at Four Surveyed Horse Shows.....................27
Table 6. Estimated Economic Impacts of Arizona’s Horse Industry, 2001 ...................32
Table 7. Projection of Horse Household and Horse Numbers for 2001 from 1990Estimates .......................................................................................................34
A PARTIAL ECONOMIC IMPACT ANALYSIS OF ARIZONA’S HORSE INDUSTRY v
ACKNOWLEDGMENTS
Several individuals and organizations were generous in providing financial support forthis study. Partial funding was provided by individual and organization contributionsthrough the Arizona Horse Lover’s Foundation. The Department of Agricultural andResource Economics, the Cardon Endowment for Agricultural Economics and Policy,and the College of Agriculture and Life Sciences at the University of Arizona alsoprovided financial and other resources in support of the study.
Chuck Lakin, Past-President, Glen Jordan, President, and Rick Johns, Past-President, ofthe Arizona State Horseman’s Association provided invaluable advice and counsel atevery stage of the study. Many horse owners, veterinarians, and other knowledgeablepersons responded to queries regarding the ownership, care, maintenance, and associatedcosts of horses and related infrastructure in Arizona. In particular, we acknowledge theinsightful input of Dr. Jim Sprinkle, Area Livestock Agent (Coconino, Gila, and YavapaiCounties) and Drs. William Schurg and Mark Arns, Equine Specialists in the Departmentof Animal Science at the University of Arizona. Alberta Charney, Research Specialist inEconomic and Business Research at the University of Arizona, provided much adviceand interpretation regarding economic multiplier effects and directed the authors toappropriate research literature and data.
We owe a large debt to Carol Whittaker, Senior Research Specialist in PublicAdministration and Policy at the University of Arizona and a member of the Board ofDirectors of the Arizona Quarter Horse Association. Carol not only assisted greatly withthe design of our horse-show-participant questionnaire, she single handedly took it uponherself to coordinate the data collection effort at four major Arizona horse shows.
Lastly, we are indebted to Nancy Bannister in the Department of Agricultural andResource Economics for design and skillful formatting of the final report, includingtabular and graphic materials.
A PARTIAL ECONOMIC IMPACT ANALYSIS OF ARIZONA’S HORSE INDUSTRY vi
EXECUTIVE SUMMARY
Three major activities make up Arizona’s horse industry—pleasure riding (private andcommercial), participant and spectator events (racing, shows, rodeos, roping, polo), andbreeding. This report provides estimates of Arizona economic activity associated withprivate pleasure horses, horse racing, horse shows, and resident spectators at rodeos,roping, polo, and gymkhana events. Major categories not accounted for includecommercial pleasure riding, participants at rodeo, roping, and polo events, and breedingof horses for export sale (outside Arizona). Despite these omissions, Arizona’s horseindustry exceeds a billion dollars annually in direct, indirect, and inducedexpenditures—between $1.1 to $1.3 Billion.
TOTAL DIRECT EXPENDITURES: Direct expenditures on private pleasure horsemaintenance and ownership, horse racing and horse show activity, and by residentspectators at other horse-related events was estimated to be between $660 to $760Million in 2001.
∑ Arizona Pleasure Horse Owners spend an estimated $500 to $600 Million on thecare and maintenance of pleasure horses and related infrastructure (including theannualized cost of horse, tack, equipment, land and facilities ownership).
∑ Horse Racing in Arizona generates an estimated $108 Million in expenditures.
∑ Horse Show Events contributes an estimated $43 Million in expenditures.
∑ Arizona-Resident Expenditures as Spectators at Other Horse-Related Events(rodeos, roping, polo, gymkhana) come to $9 Million.
INDIRECT AND INDUCED EXPENDITURES: The combined indirect and induced(ripple) effect of the above direct expenditures contributes an additional $444 to $504Million owing to horse-related activity in Arizona.
HOUSEHOLDS AND HORSES: The number of Arizona households owning one ormore pleasure horses or commercially involved in the horse industry falls in the range or48,000 to 64,000. The number of horses in Arizona likely exceeds 170,000 head.
BY WAY OF COMPARISON: Direct expenditures on horses exceed gross salesreceipts of most of the major sub-sectors comprising Arizona’s agricultural industry. Interms of importance to the Arizona economy, direct horse-related expenditures rival stategovernment expenditures on “security and safety.”
A PARTIAL ECONOMIC IMPACT ANALYSISOF ARIZONA’S HORSE INDUSTRY
Phase I: Pleasure Horse and Racing Impact Update
Phase II: Horse Show Impact
Bruce R. Beattie, Trent Teegerstrom, Jorgen Mortensen, and Eric Monke
Preamble
In March of 2000 the authors (sans Mortensen) entered into an agreement with theArizona State Horseman’s Association (ASHA) to update insofar as possible a 1990study by Gum, Archer, Henry, and Carpenter, The Economics of the Horse Industry inArizona, Extension Report #9033, College of Agriculture, University of Arizona(hereafter referred to as the “1990 study”). The 1990 study provided estimates of thedirect, indirect, and induced economic impacts of “pleasure horse,” “spectator,” and“commercial and semi-commercial” segments of Arizona’s horse industry. In addition toupdating economic impact estimates of the 1990 study for the “pleasure” and “spectator”segments, the research proposal called for (1) the inclusion of updated estimates from a1997 study by the Arizona State University, College of Business, The EconomicContributions of the Pari-Mutuel Racing Industry to the Arizona Economy and (2) theestimation of the economic impact of “commercial pleasure riding”—a missingcomponent of the 1990 study.
In December of 2000, at the request of ASHA, the original proposal was revised. Thecommercial pleasure-riding objective was dropped in favor of a horse show objective.The 1990-study update of the “pleasure horse” segment plus a “new” racing component(adapted from the 1997 ASU study) is referred to as Phase I. Phase II presents an updateof the “rodeo, gymkhana, and polo spectators” component of the 1990 study and analysisof the economic contribution of participants at four major horse shows held annually inArizona. In addition, a rough estimate of other shows beyond the four major shows isprovided. This combined Phase I and Phase II report constitutes the completion report forthe project.
A PARTIAL ECONOMIC IMPACT ANALYSIS OF ARIZONA’S HORSE INDUSTRY 2
I. INTRODUCTION
The prominence of horses in Arizona’s historical and cultural heritage is well known.While once primarily utilitarian (transportation, power, and farm and ranch work) the roleof the horse is now largely pleasure and recreational. Arizonans and visitors enjoy horseracing, rodeos, gymkhana, horse shows, and the most popular of all, trail and pleasureriding. Surprisingly, the U.S. horse population is many times what it was in the early partof the 20th century. To partially document the importance of horse ownership and activityin Arizona the Department of Agricultural Economics at the University of Arizona withpartial support from the Arizona State Horseman’s Association undertook a study in 1989and 1990 on the contribution of the horse industry to Arizona’s economy. The researchresults in this report update the principal findings and fill in some of the missingcomponents of the 1990 report.
In updating of the 1990 study, a number of difficulties—some anticipated and somenot anticipated—were encountered. The main difficulty had to do with the so-called“commercial and semi-commercial” segment (pp. 20-26 of the 1990 report). Threeobstacles made updating of the 1990 estimates problematic. First, given that an attemptwas made in the 1990 study to contact every “commercial and semi-commercial” firm inthe State, the response rate was surprisingly low (10% or less). This suggests twopossibilities. Either, turnover in the commercial horse business is greater than for otherbusinesses. Or, people in the commercial horse business are reluctant to revealproprietary economic information. In either case, the 1990 estimates of numbers ofcommercial firms, their economic impact, and their horse numbers likely would not beindicative of the situation in 2001. To simply “update” the fragile 1990 numbers wouldhave been heroic.
A related problem with the 1990 study results was that the kind of detailedinformation obtained from pleasure-horse owners was not collected for the “commercialand semi-commercial” segment because of “failure to obtain cooperation” andinsufficient study budget. Thus the production cost information obtained from“commercial and semi-commercial” firms was less detailed and less reliable than for the“pleasure horse” segment.
A final problem was double counting of economic impact. The preferred way to doimpact analysis is to consider activities in support of final demand as indirect. Finaldemand is the ultimate reason that economic activity takes place—the “end use” activityor the activity at the end of the marketing chain. Final demand examples for the horseindustry include pleasure horse riding and wagering on (or watching) a horse race.Breeding, training, and boarding, on the other hand, represent activities in support of finaldemand. In the jargon of the impact analyst, they are indirect support activities.
We suspect a double counting problem in the 1990 study between the “pleasurehorse” and “commercial and semi-commercial” segments and between “horse racing”and other components of the “commercial and semi-commercial” segment. Commercial
A PARTIAL ECONOMIC IMPACT ANALYSIS OF ARIZONA’S HORSE INDUSTRY 3
business activities included breeding, training, and boarding among other things.Expenditures for breeding, training, and boarding by horse owners should be fullyreflected in the costs of pleasure and race horse care and ownership, and these costsshould only be counted once. It is inappropriate to count the impact of breeding,boarding, and training as direct impact and then once again as part of the indirect impact.
An appropriate place to begin is to discuss the components and linkages that defineArizona’s horse industry. This is the subject of Section II. A brief outline of the researchapproach is provided in Section III. Specific assumptions and other methodologicaldetails are provided in subsequent sections where appropriate. In Section IV the costs ofpleasure horse care and ownership, costs of facilities maintenance and ownership, andestimates of the direct economic impact on the Arizona economy are presented. A similaranalysis of horse racing activity is the subject of Section V. Section VI presents estimatesof expenditures of Arizona residents and non-residents as participants and spectators athorse shows and as resident spectators at other non-show and non-racing events. SectionVII discusses the indirect and total economic impacts on the Arizona economy emanatingfrom the direct components discussed in Sections IV, V and VI. An update of theestimated number or horse households and horses in Arizona, together with a briefcomparison of direct horse industry expenditures versus other selected sectors, constitutesSection VIII. A brief summary of findings, conclusions, and recounting of unaccountedcomponents is the topic of the Executive Summary at the front of the report.
A PARTIAL ECONOMIC IMPACT ANALYSIS OF ARIZONA’S HORSE INDUSTRY 4
II. THE STRUCTURE OF ARIZONA’S HORSE INDUSTRY
Arizona’s horse industry includes many diverse interests and activities. Horse relatedactivity requires inputs from a variety of businesses and individuals, such as farriers,veterinarians, and fence and building supply firms. In turn, these businesses andindividuals buy various goods and services from yet other suppliers. The purchases ofhorse owners and users are known as direct effects of the industry. The ripple effectsthroughout the economy, kicked-off by expenditures of “end users” are called indirecteffects and induced effects of the industry.
Figure 1 is a schematic of the horse industry final demand (end use) categories andtheir linkage to other economic sectors. The schematic assists in several ways. First, ithelps explain the connection between various parts of Arizona’s horse industry. Second,it provides a framework (taxonomy) for developing and reporting the economic impact ofthose components. Last, it makes clear which components have been counted and whichcomponents remain unaccounted for in this study.
In doing economic impact analysis, it is helpful to think in terms of three main effects—direct, indirect, and induced. Each of these is discussed with reference to Figure 1,starting with the direct effects of Arizona’s horse industry.
Direct Effects
In Figure 1 the first three rows of blocks represent the primary components (segments) ofArizona’s horse industry. They are the final demand components (the primary sub-sectorsof the industry). These components (“end uses of horses in Arizona”) give rise to thedirect economic impact. The direct impact is usually expressed in terms of output orexpenditures in the economy of interest—in this case, the Arizona economy.
The first block of Figure 1 includes pleasure and trail riding by household horseowners and Arizona-based commercial firms that provide such services (dude ranches,resort hotels, others). Household owners are primarily Arizona residents (Column # 1)and non-resident visitors who bring their horse(s) with them to Arizona (Column # 2).The users of commercial pleasure and trail riding services are primarily out-of-statevisitors (Column # 4) and Arizona residents who enjoy riding but who do not own orotherwise (through friends and relatives) have access to a horse (Column # 3). In Column# 5 are Arizona households who own race horses or frequent racetracks.
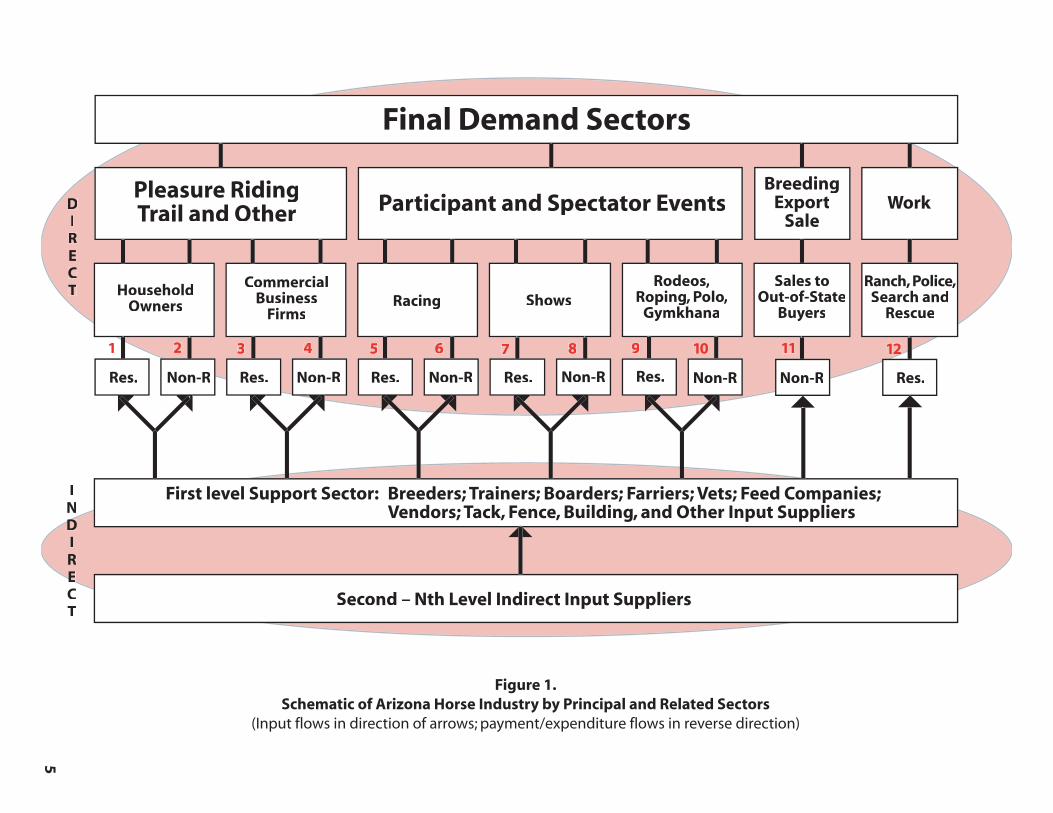
Figure 1. Schematic of Arizona Horse Industry by Principal and Related Sectors
(Input flows in direction of arrows; payment/expenditure flows in reverse direction)
Res. Non-R Res. Res. Res. Res. Res.Non-RNon-R Non-R Non-R Non-R
First level Support Sector: Breeders; Trainers; Boarders; Farriers; Vets; Feed Companies;Vendors; Tack, Fence, Building, and Other Input Suppliers
Second – Nth Level Indirect Input Suppliers
Final Demand Sectors
Pleasure RidingTrail and Other Participant and Spectator Events
BreedingExport
SaleWork
HouseholdOwners
CommercialBusiness
FirmsRacing Shows
Rodeos,Roping, Polo,
Gymkhana
Sales toOut-of-State
Buyers
Ranch, Police,Search and
Rescue
DIRECT
INDDDIREEECT
1 2 3 4 5 6 7 8 9 10 11 122
5
A PARTIAL ECONOMIC IMPACT ANALYSIS OF ARIZONA’S HORSE INDUSTRY 6
Column # 6 represents non-resident owners who race their horses in Arizona and non-resident visitors who frequent racetracks. Columns # 7 and # 8 and Columns # 9 and # 10have analogous interpretation for horse shows and for other events (such as rodeos,roping, polo).
Not withstanding the earlier discussion of support sectors and the need to avoiddouble counting, there is an important aspect of horse breeding that is appropriatelyconsidered a final demand sector of the Arizona horse industry. That aspect is thebreeding of horses for export sale—for sale to individuals and firms not located inArizona (Column # 11). The last final demand sector (Column # 12) is Arizona-basedhorses employed in work-related activities (ranching, sheriffs’ posses, search and rescue).
Indirect Effects
A final demand sub-sector, like pleasure horse riding in Arizona, is linked to other sectorsof the economy. Linkages among input suppliers give rise to economic ripples (indirecteffects) throughout the local (Arizona) and larger (U.S.) economies. In the first row of theindirect effect section of Figure 1 are the indirect service sectors that provide inputs to thefinal demand sectors of Arizona’s horse industry. These sectors include a myriad ofindividual entrepreneurs and business firms that supply inputs to the “pleasure riding,”“participant and spectator events,” “export sale breeding,” and “work” sectors. Examplesinclude trainers, farriers, veterinarians, feed companies, and tack, building and other inputsuppliers. These “1st level support sector” businesses sell inputs to individuals and firmsrepresented among the many final demand components. The arrows from the “1st levelsupport” block to the direct effect blocks depict this flow of inputs. The flow of funds(payments for inputs) not shown on the diagram is, of course, in the opposite direction.
The second row of the indirect block pools many sub-rows. The feed company in the“1st level support” row purchases its inputs (e.g., feed ingredients, delivery vehicles, fueland lubricants) from other sectors further down the input chain. Accordingly, the indirecteffects of a final demand industry (a business that services end users like the Arizonahorse industry) are “backward-linked” support sectors. Another example would be a foodand beverage vendor at a horse show. The vendor would be a “1st level support” personfor spectators and exhibitors attending the show. In turn, that vendor would purchasefood and beverage inputs from his/her vendor (a 2nd level supplier) who in turn purchasesfrom other vendors, and so on, creating a backward ripple in the economy.
The extent of the indirect effect depends on the size of the “local” economy—in thiscase Arizona. Once the linkage involves importation of goods or services from outsidethe state, then the indirect effect chain is broken as far as the impact on the Arizonaeconomy is concerned. Consider again our horse feed example. If one of the necessaryingredients in the local feed company’s ration is purchased from an out-of-state supplier,then the Arizona indirect impact of that transaction, except for some in-statetransportation, stops at the level of the “1st support supplier,” the local feed company.Obviously, the less comprehensive the “within economy” input supply chain, the smaller
A PARTIAL ECONOMIC IMPACT ANALYSIS OF ARIZONA’S HORSE INDUSTRY 7
will be the local area ripple effect. This is one of the reasons that the “indirect or ripple”effect is so often over-stated in impact analyses (Beattie and Leones). This often-ignoredissue is called leakage. The less self-contained an economy, the greater the leakage andthe smaller the local economy indirect effect. Conversely, the larger and more integratedthe local economy, the greater the indirect effect. Because of leakage, the indirect effectof Arizona’s horse industry on the U.S. economy is greater than is the Arizona indirecteffect, which in turn is greater than the indirect effect on, say, the Pima County economy.
Induced Effects
The last component of local economy economic impact considered is the induced effectof a change in economic output associated with a final demand sector. All levels of aninterrelated (input-supply-linked) industry involve entrepreneurs (business firms) and theemployment of labor. Business owners and workers earn profit and wages, respectively.When these employees and business owners reside in the local economy, again in ourcase Arizona, they do what all households do—they consume. When they spend fromearnings (profits or wages) for food, housing, local area vacations, and so forth, that toocontributes to the ripple effect in the local economy.
Like indirect effects discussed above, induced effects are generally overstated and forthe same reason—leakage. Estimation of the indirect and induced linkage effects isgenerally accomplished in tandem, using what is commonly called economic multipliers.This study reports combined indirect and induced effects using Type-II multipliers. AType-II multiplier accounts for both indirect and induced effects. In contrast, a Type-Imultiplier accounts only for the input-flow linkages (the indirect effects).
Components of Arizona’s Horse Industry Included and Not Included
Direct, indirect, and induced economic impacts of Arizona’s horse industry on theArizona economy have been estimated for those components identified in Figure 1 thatare listed below. In some instances the estimate for 2001 involved simply updatingprevious estimates by applying an inflation factor and a population adjustment. In othercases, such as for costs of maintaining and owning pleasure horses and related land,buildings, and equipment, the 2001 estimates reflect a completely new approach or newresearch.
∑ Column # 1 – Arizona Household Pleasure Horse Owners∑ Part of Column # 2 – Non-Resident Household Pleasure Horse Owners (A substantial
part, but not all, of Column # 2 has been accounted for. In particular, “long-term”winter visitors who bring their horses with them and are in Arizona long enough toestablish local telephone service could have been included in the 1990 telephonesurvey as Arizona residents.)
∑ Columns # 5 and # 6 – Resident and Non-Resident Participation at Arizona RaceTracks
A PARTIAL ECONOMIC IMPACT ANALYSIS OF ARIZONA’S HORSE INDUSTRY 8
∑ Columns # 7 – Resident Participation at Arizona Horse Shows∑ Column # 8 – Non-Resident Participation at Arizona Horse Shows∑ Part of Column # 9 – Resident Participation at Other Arizona Horse Related Events
[rodeos, roping, polo] (Included spectators, but not participants.)∑ Column #12 – Horses for Work (Most of this category is likely accounted for under
“Arizona Household Pleasure Horse Owners” [Col. #1]. The pleasure horse ownercategory included all persons who listed pleasure as either the first or second reasonfor horse ownership. Given the current limited use of horses for work, it seems safe toassume that most “horses for work” double primarily or secondarily as pleasurehorses.)
Components missing in the 1990 study that remain unaccounted for include:
∑ Part of Column # 2 – Non-Resident Household Pleasure Horse Owners (In particular,short-term winter visitors who bring their horses, but who do not stay sufficientlylong to obtain Arizona telephone service in their own name.)
∑ Columns # 3 and # 4 – Commercial Pleasure and Trail Riding (dude ranches, resorts,other commercial pleasure-riding providers)
∑ Part of Column #9 – Resident Participation at Other Arizona Horse Related Events[rodeos, roping, polo] (The participant component is missing.)
∑ Column # 10 – Non-Resident Participants and Spectators at Other Arizona HorseRelated Events [rodeos, roping, polo]
∑ Column # 11 – Horse Breeding in Arizona for Out-of-State Sales (including studservice)
The missing components are, to varying degree, significant omissions. Accordingly, theappropriate context in which to interpret the results of this study is as the titlesuggests—a partial economic analysis of the economic impact of the horse industry inArizona.
Despite the missing components, the largest components (in terms of number ofhorses and economic impact) have been accounted for in this study—in particular,Arizona pleasure horse owners and Arizona and non-resident participants and spectatorsat horse shows and racing events. The impact of Arizona resident spectators at rodeo,roping, and polo events also has been accounted for. Missing in this regard are the “short-stay” non-resident participants and spectators and the participation cost of Arizonaresident pleasure horse owners. The other two important missing pieces are the out-of-state sales of Arizona-based breeding firms and commercial pleasure and trail-ridingservice providers. Filling in these four missing components would be high priority forfurther research to complete the full picture of the contribution of the horse industry toArizona’s economy.
A PARTIAL ECONOMIC IMPACT ANALYSIS OF ARIZONA’S HORSE INDUSTRY 9
III. GENERAL RESEARCH APPROACH AND PROCEDURES
This study takes some base data and several assumptions from the 1990 study as astarting point. For the “pleasure horse” and “spectator” segments, the 1989-90 data werebased on a statistically valid survey to determine the percentage of Arizona householdsthat owned one or more pleasure horses or whose family member(s) participated in horse-related spectator events. That survey also elicited information on household expendituresfor horse and facilities ownership and maintenance and for event participation asspectators or as participants. The 1990 study also gathered aggregate “cost of production”(operation, maintenance, and capital investment) data from commercial and semi-commercial business firms involved in the horse industry. However, that effort wasfraught with pragmatic and conceptual difficulties.
The Arizona-resident pleasure horse component of this study uses the 1989-90findings for resident participation rates and horses per household, and two alternativeassumptions about the number of pleasure-horse households in Arizona in 2001. Forpleasure horse and facilities ownership, operation, and maintenance costs a differentapproach from that of the 1990 study was taken. In this study we developed original“cost-of-production” budgets for the maintenance, operation, ownership, and relatedexpenses associated with horse ownership and maintenance. These budgets, like “cost-and-return” budgets for representative crop and livestock operations, are based on widelyaccepted principles and standards and solicited opinions from knowledgeable persons inthe industry. A number of questions raised concerning the reported costs in the 1990study were remedied including the handling of land and facilities investment costs andfarrier and other routine horse maintenance costs.
Estimates for components of the horse racing sector were obtained from the 1997ASU study and adjusted for inflation to reflect 2001 dollars.
The economic contribution of participants at four major annual Arizona horse showsand other “less major” shows, as well as an update of expenditures by Arizona-residentspectators at other non-racing events, were also included. Expenditure estimates for bothresident and non-resident horse show exhibitors were based on a survey questionnaire ofparticipants during the 2000-01 show season. The aggregate economic impact, includingthe indirect and induced effect, of the major components of Arizona’s horse industrywere calculated using inter-industry (input-output) multipliers for Arizona. Specificmethodological details are included in Section VII.
A PARTIAL ECONOMIC IMPACT ANALYSIS OF ARIZONA’S HORSE INDUSTRY 10
IV. EXPENDITURES OF ARIZONA RESIDENTS FOR OWNERSHIPAND CARE OF PLEASURE HORSES
Discussion of expenditures of Arizona residents for ownership and care of pleasurehorses is organized as follows. First, estimated costs of maintaining and owning apleasure horse and the requisite infrastucture (tack, equipment, buildings and facilities,and land) are presented and interpreted. Next, an estimate of the direct impact of pleasurehorse ownership and use on the Arizona economy is presented. In terms of Figure 1,direct impact findings for Column # 1—pleasure horse use and ownership by Arizonahouseholds—is the focus of this section.
Costs of Maintenance and Ownership of a Pleasure Horse
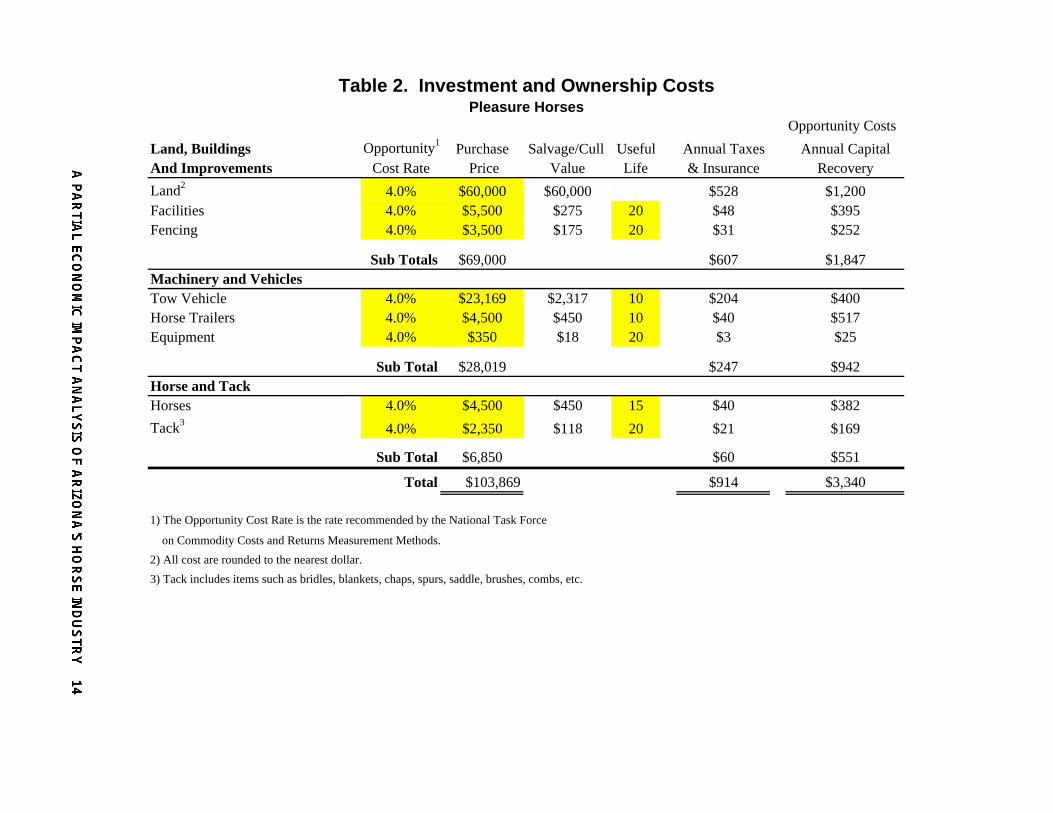
Costs of maintaining and owning a pleasure horse are summarized in three tables, the“pleasure horse summary budget” (Table 1), the “commercial boarding budget” (Table1a), and the “owner care and maintenance budget” (Table 1b). The three budgets aresupported by the information in Table 2—Investment and Ownership Costs: PleasureHorses. The costs from Table 2 are utilized in summary form in the budget tables (1, 1a,and 1b) to reflect the annualized costs of pleasure horse ownership and related supportfacilities and equipment—land, buildings, vehicles, and other durable inputs (inputs withan expected life of more than one year).
The Pleasure Horse Summary Budget (Table 1), compiled from Tables 1a and 1b,depicts the annual average cost of owning a single pleasure horse for a representativeArizona household. This is the principal source of information used in estimating thedirect economic impact of resident pleasure-horse ownership and use. The cost numbersreported in the table represent the average of the annualized “high cost” and “low cost”estimates from the commercial boarding and owner care budgets, Tables 1a and 1b,respectively.
The Commercial Boarding and Owner Care and Maintenance Budgets (Tables 1a and1b) as well as the Table 2 data were based on personal interviews of expertsknowledgeable about typical expenditures associated with owning and maintainingpleasure horses—both with and without boarding. The commercial boarding scenariopresumes horse, tack, trailer, and tow vehicle ownership with hired care, feed, andlodging of the horse(s). The owner care and maintenance scenario presumes care, feed,and lodging by the owner or family on land and facilities owned (or rented) by the horseowner.
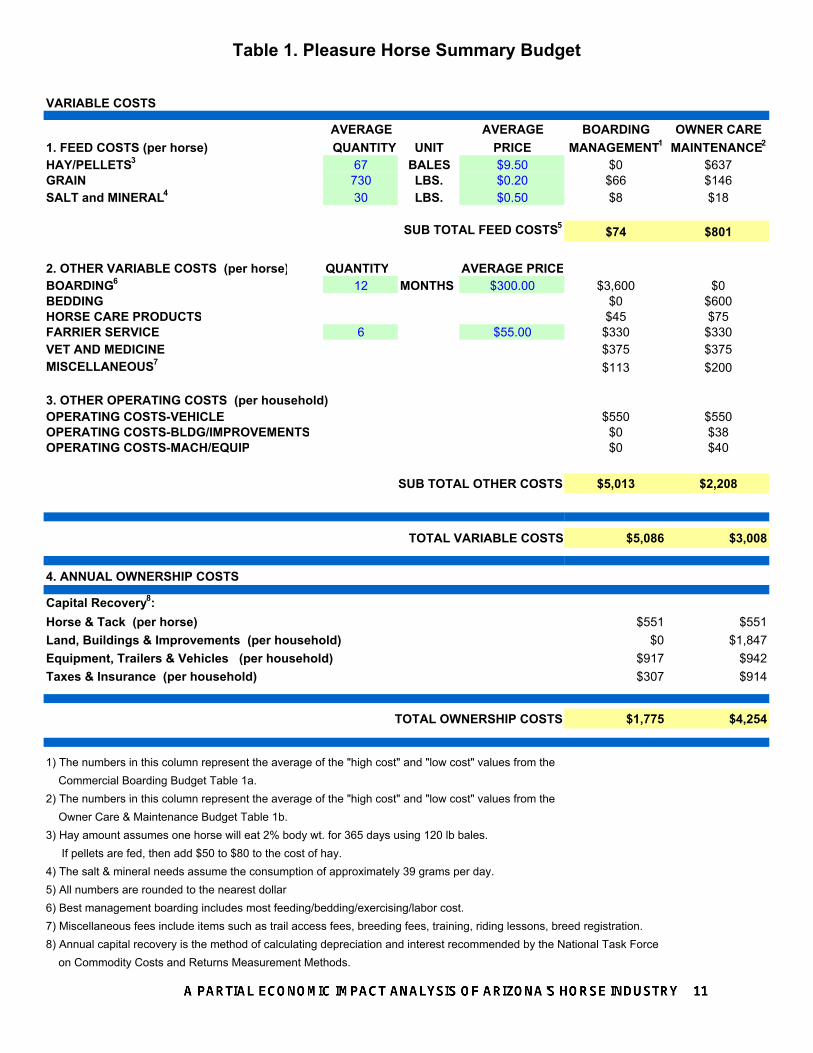
Table 1. Pleasure Horse Summary Budget
VARIABLE COSTS
AVERAGE AVERAGE BOARDING OWNER CARE1. FEED COSTS (per horse) QUANTITY UNIT PRICE MANAGEMENT1 MAINTENANCE2
HAY/PELLETS3 67 BALES $9.50 $0 $637GRAIN 730 LBS. $0.20 $66 $146SALT and MINERAL4 30 LBS. $0.50 $8 $18
SUB TOTAL FEED COSTS5 $74 $801
2. OTHER VARIABLE COSTS (per horse) QUANTITY AVERAGE PRICEBOARDING6 12 MONTHS $300.00 $3,600 $0BEDDING $0 $600HORSE CARE PRODUCTS $45 $75FARRIER SERVICE 6 $55.00 $330 $330VET AND MEDICINE $375 $375MISCELLANEOUS7 $113 $200
3. OTHER OPERATING COSTS (per household)OPERATING COSTS-VEHICLE $550 $550OPERATING COSTS-BLDG/IMPROVEMENTS $0 $38OPERATING COSTS-MACH/EQUIP $0 $40
SUB TOTAL OTHER COSTS $5,013 $2,208
TOTAL VARIABLE COSTS $5,086 $3,008
4. ANNUAL OWNERSHIP COSTS
Capital Recovery8:Horse & Tack (per horse) $551 $551Land, Buildings & Improvements (per household) $0 $1,847Equipment, Trailers & Vehicles (per household) $917 $942Taxes & Insurance (per household) $307 $914
TOTAL OWNERSHIP COSTS $1,775 $4,254
1) The numbers in this column represent the average of the "high cost" and "low cost" values from the Commercial Boarding Budget Table 1a.2) The numbers in this column represent the average of the "high cost" and "low cost" values from the Owner Care & Maintenance Budget Table 1b.3) Hay amount assumes one horse will eat 2% body wt. for 365 days using 120 lb bales. If pellets are fed, then add $50 to $80 to the cost of hay.4) The salt & mineral needs assume the consumption of approximately 39 grams per day.5) All numbers are rounded to the nearest dollar6) Best management boarding includes most feeding/bedding/exercising/labor cost.7) Miscellaneous fees include items such as trail access fees, breeding fees, training, riding lessons, breed registration.8) Annual capital recovery is the method of calculating depreciation and interest recommended by the National Task Force on Commodity Costs and Returns Measurement Methods.
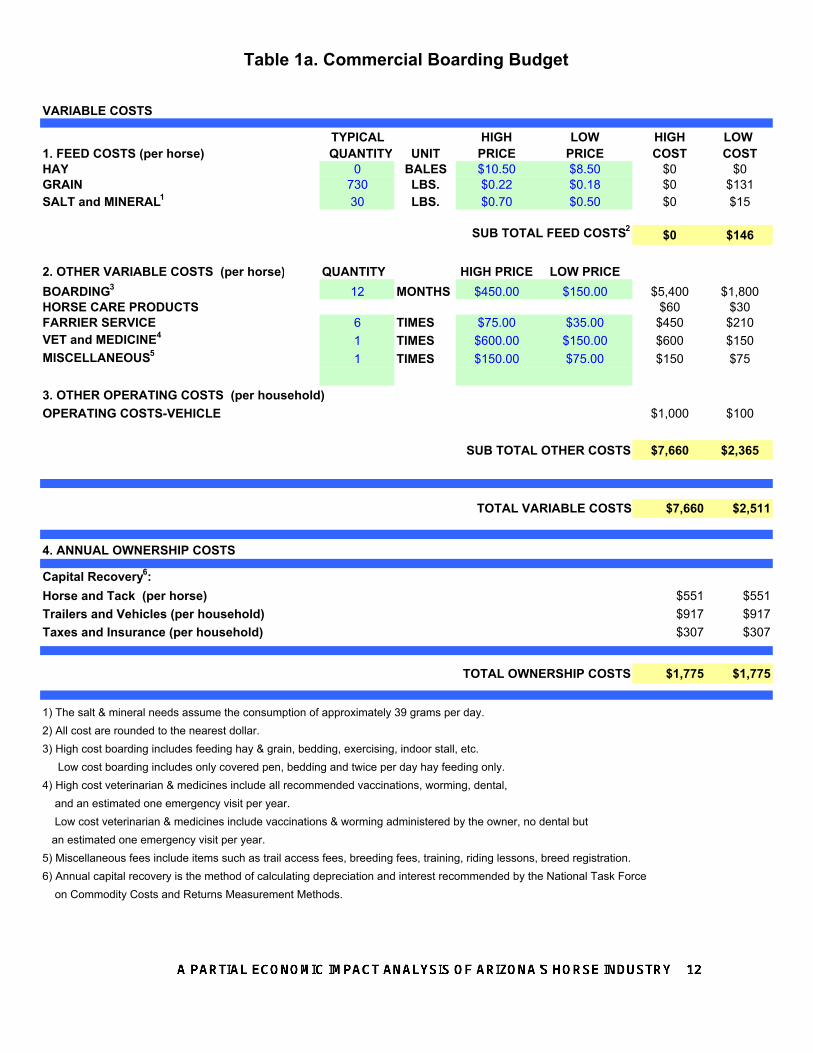
Table 1a. Commercial Boarding Budget
VARIABLE COSTS
TYPICAL HIGH LOW HIGH LOW 1. FEED COSTS (per horse) QUANTITY UNIT PRICE PRICE COST COSTHAY 0 BALES $10.50 $8.50 $0 $0GRAIN 730 LBS. $0.22 $0.18 $0 $131SALT and MINERAL1 30 LBS. $0.70 $0.50 $0 $15
SUB TOTAL FEED COSTS2 $0 $146
2. OTHER VARIABLE COSTS (per horse) QUANTITY HIGH PRICE LOW PRICEBOARDING3 12 MONTHS $450.00 $150.00 $5,400 $1,800HORSE CARE PRODUCTS $60 $30FARRIER SERVICE 6 TIMES $75.00 $35.00 $450 $210VET and MEDICINE4 1 TIMES $600.00 $150.00 $600 $150MISCELLANEOUS5 1 TIMES $150.00 $75.00 $150 $75
3. OTHER OPERATING COSTS (per household)OPERATING COSTS-VEHICLE $1,000 $100
SUB TOTAL OTHER COSTS $7,660 $2,365
TOTAL VARIABLE COSTS $7,660 $2,511
4. ANNUAL OWNERSHIP COSTS
Capital Recovery6:Horse and Tack (per horse) $551 $551Trailers and Vehicles (per household) $917 $917Taxes and Insurance (per household) $307 $307
TOTAL OWNERSHIP COSTS $1,775 $1,775
1) The salt & mineral needs assume the consumption of approximately 39 grams per day.2) All cost are rounded to the nearest dollar.3) High cost boarding includes feeding hay & grain, bedding, exercising, indoor stall, etc. Low cost boarding includes only covered pen, bedding and twice per day hay feeding only.4) High cost veterinarian & medicines include all recommended vaccinations, worming, dental, and an estimated one emergency visit per year. Low cost veterinarian & medicines include vaccinations & worming administered by the owner, no dental but an estimated one emergency visit per year.5) Miscellaneous fees include items such as trail access fees, breeding fees, training, riding lessons, breed registration.6) Annual capital recovery is the method of calculating depreciation and interest recommended by the National Task Force on Commodity Costs and Returns Measurement Methods.
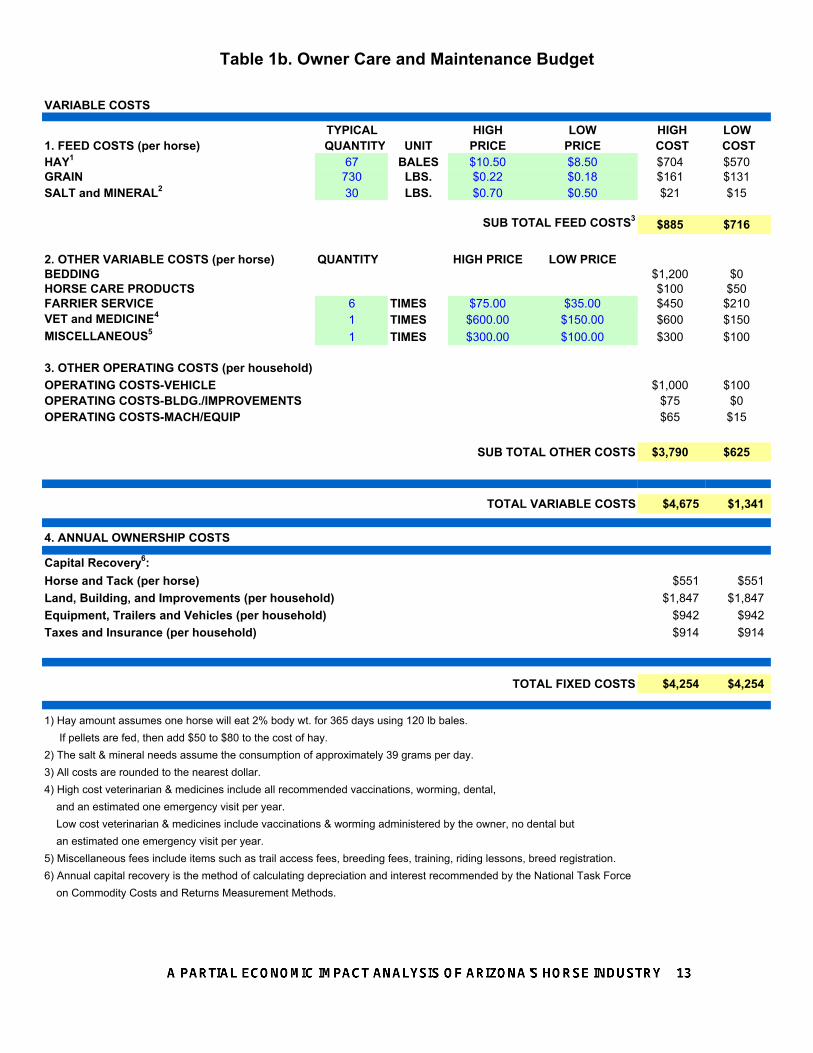
Table 1b. Owner Care and Maintenance Budget
VARIABLE COSTS
TYPICAL HIGH LOW HIGH LOW 1. FEED COSTS (per horse) QUANTITY UNIT PRICE PRICE COST COSTHAY1 67 BALES $10.50 $8.50 $704 $570GRAIN 730 LBS. $0.22 $0.18 $161 $131SALT and MINERAL2 30 LBS. $0.70 $0.50 $21 $15
SUB TOTAL FEED COSTS3 $885 $716
2. OTHER VARIABLE COSTS (per horse) QUANTITY HIGH PRICE LOW PRICEBEDDING $1,200 $0HORSE CARE PRODUCTS $100 $50FARRIER SERVICE 6 TIMES $75.00 $35.00 $450 $210VET and MEDICINE4 1 TIMES $600.00 $150.00 $600 $150MISCELLANEOUS5 1 TIMES $300.00 $100.00 $300 $100
3. OTHER OPERATING COSTS (per household)OPERATING COSTS-VEHICLE $1,000 $100OPERATING COSTS-BLDG./IMPROVEMENTS $75 $0OPERATING COSTS-MACH/EQUIP $65 $15
SUB TOTAL OTHER COSTS $3,790 $625
TOTAL VARIABLE COSTS $4,675 $1,341
4. ANNUAL OWNERSHIP COSTS
Capital Recovery6:Horse and Tack (per horse) $551 $551Land, Building, and Improvements (per household) $1,847 $1,847Equipment, Trailers and Vehicles (per household) $942 $942Taxes and Insurance (per household) $914 $914
TOTAL FIXED COSTS $4,254 $4,254
1) Hay amount assumes one horse will eat 2% body wt. for 365 days using 120 lb bales. If pellets are fed, then add $50 to $80 to the cost of hay.2) The salt & mineral needs assume the consumption of approximately 39 grams per day.3) All costs are rounded to the nearest dollar.4) High cost veterinarian & medicines include all recommended vaccinations, worming, dental, and an estimated one emergency visit per year. Low cost veterinarian & medicines include vaccinations & worming administered by the owner, no dental but an estimated one emergency visit per year.5) Miscellaneous fees include items such as trail access fees, breeding fees, training, riding lessons, breed registration.6) Annual capital recovery is the method of calculating depreciation and interest recommended by the National Task Force on Commodity Costs and Returns Measurement Methods.
Opportunity CostsLand, Buildings Opportunity1 Purchase Salvage/Cull Useful Annual Taxes Annual CapitalAnd Improvements Cost Rate Price Value Life & Insurance RecoveryLand2 4.0% $60,000 $60,000 $528 $1,200Facilities 4.0% $5,500 $275 20 $48 $395Fencing 4.0% $3,500 $175 20 $31 $252
Sub Totals $69,000 $607 $1,847Machinery and VehiclesTow Vehicle 4.0% $23,169 $2,317 10 $204 $400Horse Trailers 4.0% $4,500 $450 10 $40 $517Equipment 4.0% $350 $18 20 $3 $25
Sub Total $28,019 $247 $942Horse and TackHorses 4.0% $4,500 $450 15 $40 $382Tack3 4.0% $2,350 $118 20 $21 $169
Sub Total $6,850 $60 $551
Total $103,869 $914 $3,340
1) The Opportunity Cost Rate is the rate recommended by the National Task Force
on Commodity Costs and Returns Measurement Methods.2) All cost are rounded to the nearest dollar.3) Tack includes items such as bridles, blankets, chaps, spurs, saddle, brushes, combs, etc.
Table 2. Investment and Ownership CostsPleasure Horses
A PARTIAL ECONOMIC IMPACT ANALYSIS OF ARIZONA’S HORSE INDUSTRY 15
All three budget tables include variable costs (such as feed, boarding, fence repair,and equipment operation) and ownership costs taken from Table 2. The cost estimatesunder the commercial boarding scenario (Table 1a) and under the owner care andmaintenance scenario (Table 1b) assume a “high” and a “low” cost range, representingdifferent levels or quality of horse care and maintenance.
Variable Costs. Variable costs are expenses that vary annually, depending on inputprices and the number of horses. For the budgets, variable costs are on a per horse basis,except for operating costs of buildings and improvements, machinery and equipment, andvehicles, which are on a per household basis. Variable costs are outlined under three sub-categories, feed costs, other variable costs, and other operating costs.
a) Feed costs include hay, grain, and salt and mineral. All feed costs are based on thetotal consumption per year for a light-duty, 1200-pound, horse.
b) Other variable costs include items such as boarding, bedding, horse care products,farrier services, veterinary services, medicine, and miscellaneous.
c) Other operating costs included buildings and improvements, machinery andequipment, and vehicles expenses.
Annual Ownership Costs. Ownership or fixed costs are costs that typically do notchange in a given year. Ownership costs represent the annualized value of investment indurable assets. Table 2 lists the assets typically associated with pleasure horse ownership.The annualized ownership cost estimates in Table 2 are the same for all three budgettables, except that the commercial boarding scenario (Table 1a) presumes a lesserinvestment in land, buildings, and facilities on the part of the horse-owning household.
Ownership cost estimates were developed using the capital recovery method.1 Assetsin Table 2 are divided into three categories: a) land, buildings, and improvements, b)vehicle, trailer, and equipment, and c) horse and tack. All asset values reflect currentreplacement values. Horse and tack are on a per horse basis; all other assets are on a perhousehold basis and presume 2.07 horses per household (the average number of horsesfound per Arizona pleasure-horse household in the 1989-90 survey).
a) Land, buildings, and improvements. The amount and value of privately-ownedacreage associated with the representative horse property is highly variable andsubject to local conditions and surrounding land use. Whatever number is chosen willbe subject to legitimate criticism. Ideally the figure should be “representative” ofArizona—a formidable task when thinking of horse property in Scottsdale in contrastto rural Cochise County. The difficulty in choosing a land value is exacerbatedbecause one does not want to include the value of dwellings and improvementsattached to the property. The desired value represents horse-related land value only.
1 Annual capital recovery is the method of calculating depreciation and interest recommended by theNational Task Force on Commodity Costs and Returns Measurement Methods.
A PARTIAL ECONOMIC IMPACT ANALYSIS OF ARIZONA’S HORSE INDUSTRY 16
Facilities and fencing values (reported separately from land) represents the averageinvestment needed to provide shelter, feeding area, and containment forapproximately two horses.
b) Machinery and Equipment. Machinery and vehicles include the replacement value ofa typical truck and horse trailer needed to safely transport horses. Equipment valueincludes the value of items such as wheelbarrows, rakes, pitchforks, fencing pliers,and other items needed to maintain horse-housing facilities, tack, etc. Truck cost isadjusted to reflect an estimated 15% use related to horse activity. Most Arizonapleasure-horse households use their trailer-tow vehicle for a host of other purposes inaddition to towing their horse trailer or hauling feed, or other horse-related activity.
c) Horse and Tack. The value of an Arizona pleasure horse was estimated atapproximately $4,500. The typical horse assumed in this study is defined as a horsethat is well broke and used for pleasure activities such as trail riding, parades, or 4-Hactivities.2 Tack includes items such as bridles, blankets, chaps, spurs, saddle,brushes, and combs needed for the riding and care of a horse.
Summary of Per Household Costs of Ownership and Maintenance of Pleasure Horses
The 1989-90 survey found that the average number of horses per Arizona pleasure-horsehousehold was 2.07. Assuming the same number of horses per household in 2001 andusing the cost estimates in Tables 1 and 2, the annual per household expenditure/cost forthe ownership and maintenance of horses and associated infrastructure can besummarized as follows:
Self-Housed and Self-Boarded Horses:
∑ Investment in horses and tack (including taxes and insurance)—$611 x 2.07 = $1,265∑ Investment in land, buildings, and improvements (including taxes and
insurance)—$2,454∑ Investment in equipment, trailers, and vehicles (including taxes and
insurance)—$1,189∑ Cost of feed—$801 x 2.07 = $1,658∑ Other variable costs (bedding, horse care products, farrier services, vet and medicine,
miscellaneous) excluding operating costs of buildings and improvements, machineryand equipment, and vehicles—$1580 x 2.07 = $3,271
∑ Operating costs of buildings and improvements, machinery and equipment, andvehicles—$628
∑ Total Annual Cost per Pleasure-Horse Household—$10,465
2 By assuming a well-broke horse, the value of the investment in that horse implicitly assumes appropriateprior investment in training of the horse.
A PARTIAL ECONOMIC IMPACT ANALYSIS OF ARIZONA’S HORSE INDUSTRY 17
Commercially-Boarded Horses:
∑ Investment in horses and tack (including taxes and insurance)—$611 x 2.07 = $1,265∑ Investment in equipment, trailers, and vehicles (including taxes and
insurance)—$1,189∑ Cost of incidental feed—$74 x 2.07 = $153∑ Cost of boarding—$3,600 x 2.07 = $7,452∑ Other variable costs (horse care products, farrier services, vet and medicine,
miscellaneous)—$863 x 2.07 = $1,786∑ Vehicle operating costs—$550∑ Total Annual Cost per Pleasure-Horse Household—$12,395
According to the 1990 study survey of Arizona households, 36% of Arizona pleasure-horse households board their horse(s)—19% board one horse, 11% board two horses, 3%board three horses, 2% board four horses, and 1% board five or more horses. Assumingsix horses for the last category and calculating a weighted average of this percentagedistribution based on 2.07 horses per household, suggests that 31% of Arizona-householdpleasure horses are boarded.
Finally, taking a weighted average of “Self-Housed and Self-Boarded” and“Commercially-Boarded” categories results in an Average Total Cost per Pleasure-Horse Household of $11,063 per Year for the care and ownership of pleasure horses.
Direct Economic Impact of Pleasure Horse Ownership by Arizona Households
An estimate of the number of pleasure-horse households is needed to complete our task.To determine the total impact on the Arizona economy we need to multiply $11,063 bythe number of pleasure-horse households, unfortunately an unknown number. Making agood guess is problematic. The 1990 study found that 3.16% of Arizona householdsowned one or more pleasure horses. Based on that percentage, the 1990 researchersestimated that there were 41,505 Arizona pleasure-horse households owning 85,884pleasure horses.
So what would be a reasonable way to estimate the number of Arizona pleasure-horsehouseholds in 2001? We offer two approaches—one that we believe to be conservativeand a second that is less conservative, but plausible. We briefly present the twoapproaches, discuss the pros and cons of each, and then present a range of plausible totalexpenditure estimates based on the two alternative approaches.
A Conservative Approach:
A conservative approach would be to assume the same number of pleasure-horsehouseholds (and the same number of pleasure horses) in 2001 as was the case in 1990.That is, 41,505 pleasure-horse households with 2.07 horses per household or 85,884
A PARTIAL ECONOMIC IMPACT ANALYSIS OF ARIZONA’S HORSE INDUSTRY 18
horses. This approach presumes a decline in the percentage of pleasure-horse householdsfrom 3.16% in 1990 to 2.1% in 2001, a 33.5% decline. This seems too large a decrease.Yet it is not unreasonable to believe that the percentage has dropped over the past decadegiven the very large increase in the total number of Arizona households. Between 1990and 2001 the number of Arizona households increased from about 1.3 million to nearly 2million—about a 50% increase.
An Optimistic Approach:
A considerably less conservative approach would be to assume that as Arizona’spopulation and household income have grown, so has interest in pleasure horses.However, Arizona’s population growth has not been proportionately distributed across allage strata. Further, the age distribution in pleasure-horse households differs from that ofall households. The 1990 study found that the age distribution for the average 3.21 personpleasure-horse household had 0.38 persons less than age 7, 0.40 persons from age 7 to 12,0.33 persons from age 13 to 18, 0.70 persons from age 19 to 30, 1.31 persons from age 31to 60, 0.05 persons from age 61 to 70, and .04 persons over age 70. Assuming the sameage distribution of residents of Arizona pleasure-horse households in 2001 as in 1990 andknowing Arizona’s population growth by age strata (Arizona Department of EconomicSecurity), an age-weighted estimate of the number of Arizona pleasure-horse householdsfor 2001 is 57,000 households. This is in contrast to the 41,505 households used underthe “conservative approach.” For this “less conservative” approach, the impliedpercentage of 2001 Arizona pleasure-horse households is 2.9% in contrast to 2.1% for the“conservative approach” and in contrast to 3.16% in 1990.
Arguments For and Against Each Approach:
Arguments favoring the first approach (no more horses than in 1990) are that Arizona’spopulation growth over the past decade has several characteristics working againsthorses. The state has experienced rapid urbanization. The population is becoming moreelderly, more distant from rural and traditional western roots, and less tolerant of some ofthe perceived “negative effects of horses in the neighborhood.” Finally, horse propertyhas become more scarce and costly.
Arguments favoring the second approach (more horses than in 1990, but less than inproportion to overall population growth) are that Arizona’s population has increased andtherefore there has been an increase in the potential number of persons interested in horseownership. Not only has population increased, but so too has household income. Pleasurehorse ownership tends to be associated with higher-income households. Finally, part ofArizona’s attractiveness to in-migrants is its warm and dry climate and historical westernculture conducive to year around horse-related activities.
Pleasure-Horse Impact Estimates:
The actual number of Arizona pleasure-horse households is probably somewhere betweenthe “conservative” and “less conservative” estimates. The “conservative approach” yields
A PARTIAL ECONOMIC IMPACT ANALYSIS OF ARIZONA’S HORSE INDUSTRY 19
an estimate of the direct expenditure impact on the Arizona economy of resident-ownedpleasure horses of $459.2 Million annually. That is, 41,505 x $11,063 = $459,169,815.The “optimistic approach” yields an estimate of $630.6 Million (57,000 x $11,063 =$630,591,000). On balance, we are comfortable with an estimate of the direct impact onthe Arizona economy of resident-owned pleasure horses in the range of $500 to $600Million in annual expenditures.
A PARTIAL ECONOMIC IMPACT ANALYSIS OF ARIZONA’S HORSE INDUSTRY 20
V. EXPENDITURES OF ARIZONA RESIDENTS AND NON-
RESIDENTS ASSOCIATED WITH HORSE RACING
This section presents updated estimates of components of Arizona’s horse racingindustry. We draw extensively on the 1997 Arizona State University report, “TheEconomic Contribution of the Pari-Mutuel Racing Industry to the Arizona Economy.”That study presents the direct impact of six components of horse and dog racing activityin Arizona—1) race tracks, 2) training and maintenance of racing animals, 3) visitorexpenditures by out-of-state owners, 4) breeding of racing animals, 5) off-track betting,and 6) spending by out-of-state race fans. Fortunately the estimates provided in the ASUreport enable the separation of horse racing activity from dog racing activity. Table 3 atthe end of this section presents the ASU estimates for the horse racing components,adjusted for inflation. That is, the values reported in Table 3 are updated to 2001 toreflect the increase in the Consumer Price Index. No adjustment was made for Arizonapopulation change because a comparison of the attendance and participation data, asreported in the FY 2000 Arizona Annual Report of the Arizona Department of Racing,revealed no appreciable increases in participation, neither attendance nor betting, from1996 to 2000.
Arizona has three commercial horse tracks. Attendance at the tracks was about359,000 in 1999-2000 (Arizona Department of Racing). Total on- and off-trackattendance was 840,000. Total betting was $134 Million during the 2000 season. All ofArizona counties also hold County Fair races. Attendance totaled more than 184,000 andtotal wagers surpassed $20 Million. These numbers have remained fairly stable over theprevious five years. In the future, some expansion seems plausible. The facility atPrescott has grown, and there seems a good chance that some of the events currently heldin states to the north could move to Arizona. These events also should increase thenumber of out-of-state visitors.
Retained earnings of the racetrack industry were about $27 Million in 1999-2000(Arizona Department of Racing). Additional revenues accrue from competitor fees,concessions, and gate receipts. These sources of revenue probably are small. Off trackbetting retail activity generated $7.3 Million in 1996, for example. Profits accruing to theracetracks were only a small share of this total. Admission fees are only a few dollars perperson.
Total revenues must cover expenses for the racetracks (ASU, 1997). Direct purchasesof goods and services by the industry were $11.1 Million in 1996. The tracks employedabout 900 workers with an annual payroll of $6.2 Million. Off-track betting retail activitywas composed of $4.6 Million in expenditures for goods and services and $2.3 Million inlabor cost to 230 workers.
Expenditures on goods and services for maintenance of racehorses totaled $26.6Million in 1996. The sector employed about 1000 workers with a wage bill of $12.2
A PARTIAL ECONOMIC IMPACT ANALYSIS OF ARIZONA’S HORSE INDUSTRY 21
Million. These costs were well in excess of revenues. Winnings were only $12 Million.Racehorses do not seem a very profitable undertaking, although some further revenuesmay be raised from selling breeding stock and additional activities. Similar results werefound in a Maryland study. Losses are channeled more to owners of the horses than tobreeders. Breeding costs for local horses were estimated to be $9.2 Million, composed ofpurchases of goods and services for $6.3 Million and labor payments of $2.9 Million.
In addition, the industry receives economic input from out-of-state participants.Expenditures on visits by out-of-state horse owners (800) were estimated to be $5.9Million. Out-of-state fans make up a prominent share of horse racing attendance. Forexample, they make up nearly a third of the attendees at the track in Phoenix. Theirexpenditure was estimated at about $15 Million.
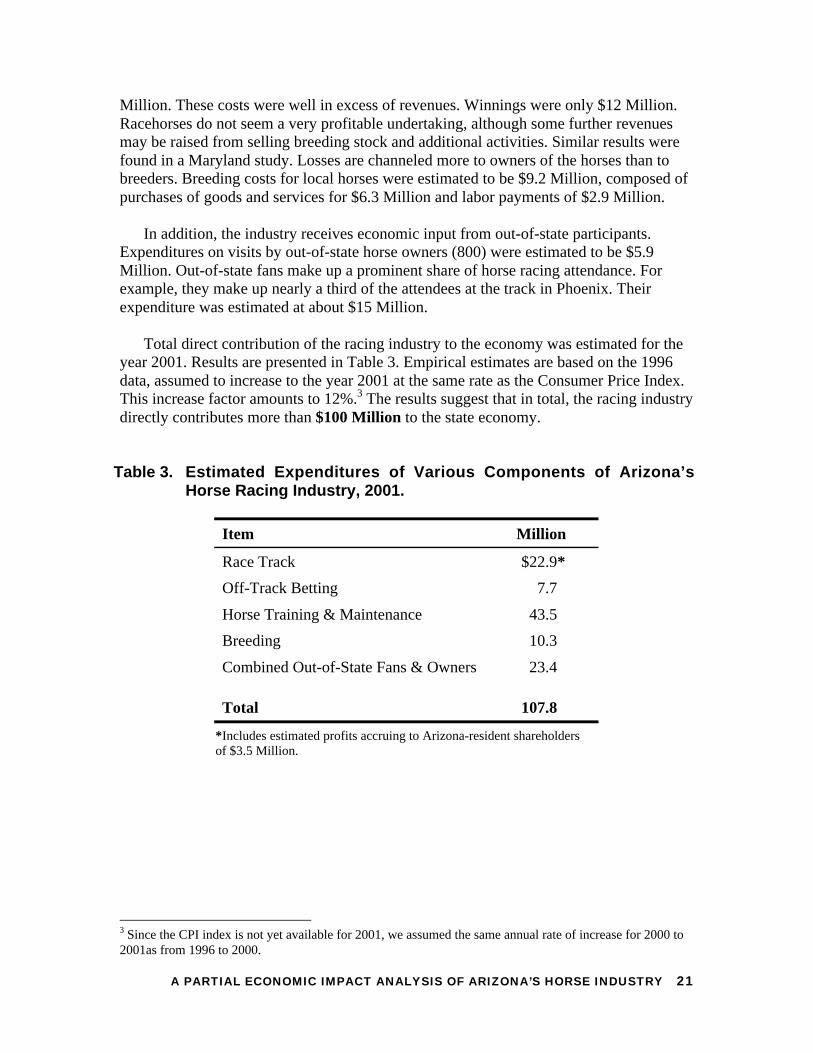
Total direct contribution of the racing industry to the economy was estimated for theyear 2001. Results are presented in Table 3. Empirical estimates are based on the 1996data, assumed to increase to the year 2001 at the same rate as the Consumer Price Index.This increase factor amounts to 12%.3 The results suggest that in total, the racing industrydirectly contributes more than $100 Million to the state economy.
Table 3. Estimated Expenditures of Various Components of Arizona’sHorse Racing Industry, 2001.
Item Million
Race Track $22.9*
Off-Track Betting 7.7
Horse Training & Maintenance 43.5
Breeding 10.3
Combined Out-of-State Fans & Owners 23.4
Total 107.8
*Includes estimated profits accruing to Arizona-resident shareholdersof $3.5 Million.
3 Since the CPI index is not yet available for 2001, we assumed the same annual rate of increase for 2000 to2001as from 1996 to 2000.
A PARTIAL ECONOMIC IMPACT ANALYSIS OF ARIZONA’S HORSE INDUSTRY 22
VI. EXPENDITURES OF ARIZONA RESIDENTS AND
NON-RESIDENTS AS PARTICPANTS AND SPECTATORSAT NON-RACING EVENTS
This section presents estimates of the economic activity related to annual Arizona-basedhorse show events. In the winter and spring months of 2001, 2,750 exhibitors, about twothirds of which were from out-of-state, and 4118 entered horses were involved in fourmajor shows. Two shows—The Copper Country Paint Show and the Hunter/JumperShow—are held at the Pima County Fairgrounds, Tucson. The other two shows—the SunCircuit Quarter Horse Show and the Arabian Show—take place at WestWorld,Scottsdale. Participant information was collected at each show using a questionnairesurvey of exhibitors. The sample survey results were converted to total activity figuresusing data obtained from the show management on exhibitors and horse numbers andfrom the facility management of each of the four shows. Show and facility managementalso supplied information about items not included in the questionnaires. To respectconfidentiality, results are shown only in the form of aggregate figures for the four majorshows. Following the reporting of expenditures at the major horse shows an estimate ismade of the activity associated with other Arizona-based horse shows beyond the foursurveyed shows. The section concludes with an updated estimate from the 1990 study ofexpenditures of Arizona residents as spectators at rodeo, gymkhana, and polo events.
The direct economic activity accruing from the four major horse shows is measuredin terms of participant costs and expenditures on the following items:
Transportation (people and horses)Lodging (hotels, motels, campsites)Food and drinkGifts, souvenirs, clothing, etc.Recreation and entertainmentParticipation and admission feesFeed and beddingTack and other horse suppliesStall fees
Expenditures on stall fees and participation and admission fees were obtained asaggregate figures from show and facility management. The other items were estimatedfrom the sample survey, in some cases supplemented with information from show andfacility authorities. Where relevant, spectator admission fees were added to the estimatedexpenditures, whereas other spectator expenditures at the shows were disregarded. Wagesand salaries to paid assistants—predominantly trainers—were not included in the survey.For trainers employed by out-of-state exhibitors the economic base is outside Arizonaand should not be counted here. For in-state exhibitors, there might be a case forassigning a certain share of annual wage costs to the particular show. However, inSection IV it was assumed that the value of horses included training costs. Prior
A PARTIAL ECONOMIC IMPACT ANALYSIS OF ARIZONA’S HORSE INDUSTRY 23
investment in appropriate training of horses thus was taken into account in the pleasurehorse section.
Questionnaire Survey
A questionnaire was distributed to exhibitors at the four shows. The questionnaire wasdesigned in cooperation with Carol Whittaker, Senior Research Specialist at School ofPublic Administration and Policy, University of Arizona. Whittaker also distributed andcollected the questionnaires. Completed questionnaires were dropped off anonymouslywithout personal contact with the surveyor. A follow-up could therefore not be arrangedin relation to non-respondents and respondents who experienced difficulties in replying tocertain questions. The relatively large sample—13 percent of participants in the fourshows—and close scrutiny of each returned questionnaire hopefully mitigated samplingbias and measurement error.
To determine whether the four sample surveys were representative, an evaluation wasconducted based on the number of entered horses per exhibitor. Data on entered horsesper exhibitor were available from the surveys and the aggregate data from show andfacility management. For three of the four shows there was a close correspondence. Forthe fourth show a significant discrepancy appeared because exhibitors with few enteredhorses were underrepresented in the survey sample. Fortunately, in this case, a total list ofexhibitors and their horses was available. Stratification of the questionnaire sampleaccording to the total list yielded a weighted sample average very close to the aggregateaverage figure of horses per exhibitor. Consequently, for this show all averages wereweighted based on the stratified survey sample, whereas simple survey averages wereused for the other three shows.
Processing of data from the returned questionnaires yielded average figures perexhibitor (respondent) at each show regarding party size, number of horses, days spent atthe locality, number of vehicles, miles traveled, mode of lodging, value of purchasedsouvenirs, gifts, tack, etc. These results were combined with non-sample information ontypical lodging rates, daily expenditures on food and drinks, fuel prices, and mileageperformance by type of vehicle to establish survey average expenditures for each show.Averages were raised to totals by multiplying by the number of exhibitors at each show.
Expenditures According to Surveys
Transportation Costs. Costs of transportation are the sum of the following items:
∑ Calculated costs of round trip road transport of horses and persons in exhibitor’sparty from residence for Arizona residents, and from pertinent Arizona bordercrossing for non-residents, to show site
∑ Expenditures on car rental during show∑ Calculated costs on local transport during show
A PARTIAL ECONOMIC IMPACT ANALYSIS OF ARIZONA’S HORSE INDUSTRY 24
Length of road transport to the pertinent show site and back was based on location ofresidence (city or town) in Arizona as stated in the returned questionnaires. For out-of-state residents the distance to the show site was measured from the most obvious of sixArizona border crossings for each respondent. It was decided only to consider the cost offuel using an average fuel price of $1.50 per gallon. Depreciation, repairs and service,and capital remuneration were disregarded. For out-of-state residents, these items wouldnormally represent economic impact at the point of residence and they should thereforebe excluded. For Arizona residents, a case might be made for assigning a full costs figureper mile because the full costs would normally represent in-state economic activity.However, it could also be argued that participation in a particular show would onlymarginally affect length of life, repair costs, or other items. Further, maintenance andownership cost of horse trailers and tow vehicles have already been accounted for inSection IV for Arizona based pleasure horse owners. So, this would only be an issue forpassenger cars and RVs. For these reasons, transportation costs were limited to fuel costsfor both in-state and out-of-state participants.
Three types of vehicles were considered: tow trucks pulling horse trailers, passengercars, and RVs. Average fuel consumption per mile was based on inquiries to car and RVdealerships. For cars, a figure of 20 mpg was applied, and for tow trucks and RVs, thefigures were 10 and 7.5 mpg, respectively. The estimated fuel costs per mile is 7.5, 15,and 20 cents for passenger cars, tow trucks, and RVs, respectively. These average figuresconceal a significant variation depending on types and makes of vehicles and drivinghabits.
The number of tow trucks per exhibitor was established on the basis of the number ofhorses conveyed to and from the show assuming a maximum of five horses per horsetrailer. Where RV or trailer camping was indicated, it was assumed that only one RV wasused. In a few cases, the number of persons lodging at RV or trailer campsites exceededthe capacity of one camper unit. It was assumed that the resulting underestimation wasbalanced by the fact that the daily cost of hook-up was based on the RV fee, which couldbe higher than the fees for certain other types of camping. The number of own passengercars used by each party was established as the total number of vehicles, excluding towtrucks, minus one unit where lodging at campsite was indicated.
The costs of road transport for each party to and from the show site was found bycombining the above elements. In cases where the respondents transported one or morehorses for other exhibitors, towing costs were reduced proportionally. Costs of car rentaland other paid transport during the show were based on replies to the questionnaire.
Fuel costs using own or rented vehicles for local transport during the show periodaccounts for commuting between place of lodging, meals, and show site. Estimates wereestablished based on the following: reported size of party and days at the location, anassumed maximum of three persons per vehicle, a daily average of 30 miles per vehicle,the average fuel performance for passenger cars, and a fuel price of $1.50 per gallon.When paid trainers also assisted other exhibitors, the fuel cost calculation was prorated
A PARTIAL ECONOMIC IMPACT ANALYSIS OF ARIZONA’S HORSE INDUSTRY 25
based on the number of horses in care for the respondent and for other exhibitors,respectively.
The estimated aggregate transportation cost in Arizona for all four shows was$1,520,600.
Lodging. Replies to the questionnaire revealed how many days that each partyattended the show. Further, replies gave information about the accommodation ofindividual party members by type of lodging: 1) with relatives in the area, 2) atresorts/hotels with full service, 3) at other hotels/motels, 4) at RV or trailer campsite, and5) “with the horses.”
The show management and fairground facility management provided informationabout the costs of lodging at the show site “with the horses.” Other lodging expenditureswere calculated on the basis of information given in the returned questionnaires andestimated daily rates by type of lodging.
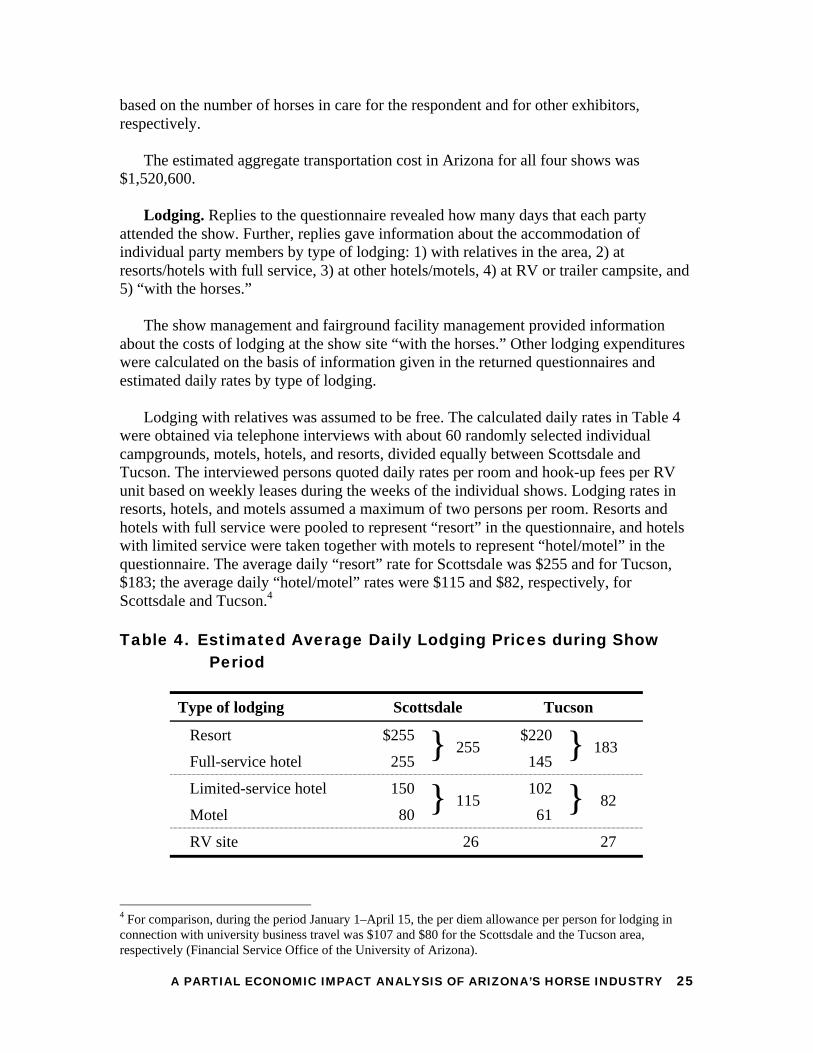
Lodging with relatives was assumed to be free. The calculated daily rates in Table 4were obtained via telephone interviews with about 60 randomly selected individualcampgrounds, motels, hotels, and resorts, divided equally between Scottsdale andTucson. The interviewed persons quoted daily rates per room and hook-up fees per RVunit based on weekly leases during the weeks of the individual shows. Lodging rates inresorts, hotels, and motels assumed a maximum of two persons per room. Resorts andhotels with full service were pooled to represent “resort” in the questionnaire, and hotelswith limited service were taken together with motels to represent “hotel/motel” in thequestionnaire. The average daily “resort” rate for Scottsdale was $255 and for Tucson,$183; the average daily “hotel/motel” rates were $115 and $82, respectively, forScottsdale and Tucson.4
Table 4. Estimated Average Daily Lodging Prices during ShowPeriod
Type of lodging Scottsdale Tucson
Resort $255 $220
Full-service hotel 255} 255
145} 183
Limited-service hotel 150 102
Motel 80} 115
61} 82
RV site 26 27
4 For comparison, during the period January 1–April 15, the per diem allowance per person for lodging inconnection with university business travel was $107 and $80 for the Scottsdale and the Tucson area,respectively (Financial Service Office of the University of Arizona).
A PARTIAL ECONOMIC IMPACT ANALYSIS OF ARIZONA’S HORSE INDUSTRY 26
Lodging costs for participants in the four shows were found by combining the aboveinformation about number of persons by length of stay and type of lodging with theestimated daily lodging costs in Table 4. Adding the costs of fairground lodging, totallodging costs came to $12,175,000.
Food and Drink. Food and drink expenditures were estimated on the basis ofinformation in returned questionnaires about number of persons in exhibitors’ parties,days of stay in connection with the show, and a daily rate of $35 per person. The $35 rateis a little higher than, for example, the official university per diem allowance. Theslightly higher rate was used to allow for drinks and snacks between meals. The rate wasused for all participants without deduction of normal daily costs of living for Arizonaresidents. Spectator expenditures for food and drink were not included.
For participants staying with friends or relatives, these rates may not reflect the costsof home cooking. On the other hand, in these situations eating out may often take placeand at additional costs if the visitors treat their hosts as a sort of payment for free lodging.
Actual daily expenditures per person no doubt vary significantly among showparticipants. Some participants may frequent fast food facilities at rates well below theaverage rate of $35. Others may spend considerably more.
For participants at the four shows, total food and drink expenditures were estimated tobe $6,910,200.
Feed and Bedding. Participants who did not bring sufficient amounts of own feedand bedding for their horses acquired these items from services available at the shows.The calculation of total expenditures, according to the surveys, was supported withinformation from show and facility management about total sales of feed and beddingwhen available.
The total feed and bedding expenditures for the four shows came to $729,200.
Other Expenditures. The questionnaire surveys also explored the extent of otherhorse-related expenditures and spending on leisure and recreation during the showperiods. The calculated total expenditures were as follows:
Tack and other horse supplies $1,125,400Souvenirs, gifts, clothing, etc. 2,578,200Recreation and entertainment 767,900
Tack and other horse supplies included purchase of horse trailers in the amount of$351,700. A few horses, worth $150,000 were also traded at the shows. This item was notincluded because no economic activity is created when horses change hands amongparticipants at a show. To the extent Arizonans sell horses to out-of-state individuals thetransactions would be captured when considering export breeding sales as a final demandsector (see Section II).
A PARTIAL ECONOMIC IMPACT ANALYSIS OF ARIZONA’S HORSE INDUSTRY 27
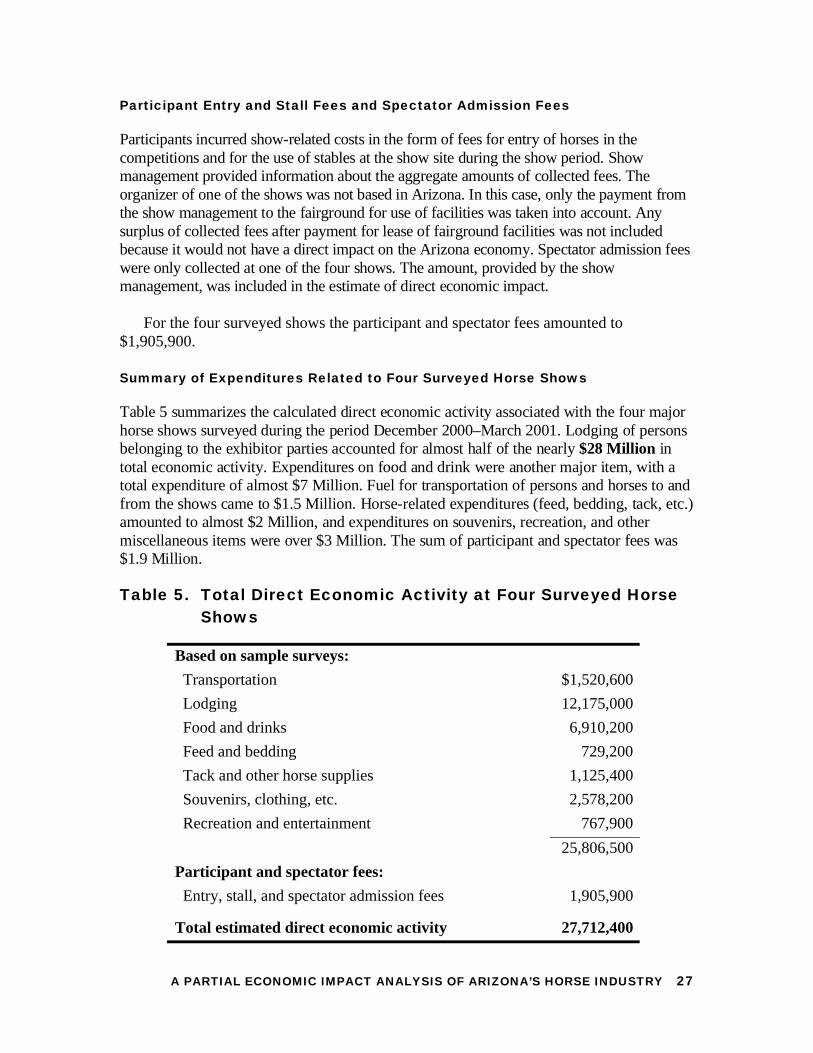
Participant Entry and Stall Fees and Spectator Admission Fees
Par ticipants incurred show- related cost s in t he for m of f ees for entr y of horses in thecom petiti ons and for the use of stables at the show site during the show period. Showmanagement provided i nformation about t he aggregate amounts of collected fees. Theorganizer of one of t he shows was not based i n Arizona. I n this case, only the payment fromthe show management t o the fairgr ound f or use of faciliti es was taken into account. Anysur plus of coll ected fees after payment for l ease of fair ground facil ities was not incl udedbecause i t woul d not have a direct impact on the Ar izona econom y. Spectator admission f eeswer e only collected at one of the four shows. The amount, provi ded by the showmanagement, was included in the estimat e of direct econom ic impact.
For the four surveyed shows the participant and spectator fees amounted to$1,905,900.
Summary of Expenditures Related to Four Surveyed Horse Shows
T able 5 summ ari zes the calcul at ed di r ect economi c act ivi ty associ at ed wi t h the four maj or hor se shows sur veyed dur i ng t he peri od Decem ber 2000–Mar ch 2001. Lodgi ng of per sonsbel ongi ng to the exhibit or part i es accounted f or al most half of t he near l y $28 Mil l ion int ot al econom i c acti vit y. Expendi tures on food and dri nk were anot her m aj or it em , wit h at ot al expendi ture of alm ost $7 Mil li on. F uel f or tr ansport at i on of per sons and hor ses t o andf rom the shows came to $1.5 Mil l ion. Horse- r el at ed expendi tur es ( feed, bedding, tack, etc.) amounted t o alm ost $2 Mi l li on, and expendit ures on souveni rs, r ecreati on, and ot herm iscell aneous i tems were over $3 Mil l ion. T he sum of par ti ci pant and spectator fees was$1. 9 Mi l li on.
Table 5. Total Direct Economic Activity at Four Surveyed HorseShows
Based on sample surveys:
Transportation $1,520,600
Lodging 12,175,000
Food and drinks 6,910,200
Feed and bedding 729,200
Tack and other horse supplies 1,125,400
Souvenirs, clothing, etc. 2,578,200
Recreation and entertainment 767,900
25,806,500
Participant and spectator fees:
Entry, stall, and spectator admission fees 1,905,900
Total estimated direct economic activity 27,712,400
A PARTIAL ECONOMIC IMPACT ANALYSIS OF ARIZONA’S HORSE INDUSTRY 28
Direct Economic Activity at Other Arizona Horse Shows
Each year, significant activity takes place at other Arizona horse shows beyond the fourmajor shows surveyed. Other shows vary in size, length of show period, and attraction ofparticipants from outside the local area. A detailed analysis of the economic impactowing to these other shows was beyond the scope of this study.
However, an informed judgement of the potential impact was made based oninformation and estimates provided by experts within the different horse organizations.Some key elements were considered and compared with information from the foursurveyed shows:
Number of horses entered in other shows per yearApproximate average length of stay at other showsLevel of expenditures per entered horse at other shows
It was assumed for “other shows” that the average number of horses per exhibitor andthe size of exhibitor party were the same as for the four surveyed shows. The first stepwas to compare the total number of show days at other shows—number of entered horsestimes average length of time that horses, exhibitors, and their parties stayed at thedifferent shows—with the same information and total expenditures at the four surveyedshows. In the group of other shows, some attract participants from across Arizona andfrom other states. Others attract predominantly local participants. To extrapolateexpenditures from the major shows to other shows based only on the number of enteredhorses and average length of show would therefore tend to overestimate economicactivity at other shows, especially transportation and lodging expenditures.
For all “other shows” lodging was calculated assuming a 25 per cent lower daily ratethan for the four surveyed shows reflecting that many other shows take place outside theprime tourist season. A further 25 per cent reduction was made for shows held outsidehigh-cost metropolitan areas.
Lodging costs were further reduced assuming that only half of participants at localshows utilize out-of-home accommodation. Also, no road transport costs were calculatedfor “local participants.” For the remaining participants at other shows, mileage wasassumed to be the same as for Arizona residents attending the surveyed shows.
Using these assumptions, it was estimated that the direct economic activity inconnection with other shows amounts to $16 Million. Clearly, these calculations are onlywhat one might call rough guesses. However, we have purposefully tried to err on theconservative side.
For all Arizona shows—Paint, Quarter Horse, Arabian, and Hunter/Jumper, bothmajor and other—the estimated total annual direct economic activity is $43 Million. Thisfigure excludes horse racing, rodeos, polo, and roping events.
A PARTIAL ECONOMIC IMPACT ANALYSIS OF ARIZONA’S HORSE INDUSTRY 29
Arizona Resident Spectators at Rodeo, Gymkhana, and Polo Events
Based on the telephone survey of a random sample of Arizona residents, the 1990 studyestimated spectator expenditures to attend horse racing, horse show, rodeo, gymkhana,and polo events. Horse racing and show events have been accounted for elsewhere in thisreport (Section V and this section). According to the 1990 report, the total expenditure ofArizona residents as spectators at rodeo, gymkhana, and polo events was $5,837,000 in1990 dollars. Updating this number to 2001 dollars and adjusting to reflect a reasonableincrease between 1990 and 2001 in the number of Arizona households attending rodeo,gymkhana, and polo events yields an estimate of $9.3 Million.
This estimate was reached by first multiplying the 1990 total dollar amount of $5.837Million by 1.35 to convert to 2001 dollars.5 This number was then multiplied by 1.18 toreflect the number of additional Arizona households that might likely attend such eventsin 2001 in contrast to 1990. Choice of the factor 1.18 follows the logic outlined in SectionIV. That is, we assume the same proportional increase in Arizona resident spectators atrodeo, gymkhana, and polo events as the average estimated increase in pleasure-horsehouseholds under our “conservative” and “optimistic” approaches (see pp. 17–18).
5 Since the CPI index is not yet available for 2001, we assumed the same annual rate of increase for 2000 to2001as from 1996 to 2000.
A PARTIAL ECONOMIC IMPACT ANALYSIS OF ARIZONA’S HORSE INDUSTRY 30
VII. CONTRIBUTION OF SUB-SECTORS OF ARIZONA’S HORSE
INDUSTRY TO THE ARIZONA ECONOMY
This section presents estimates of the indirect and induced effects of the directexpenditures in Sections IV (Pleasure Horses), V (Racing), and VI (Selected OtherEvents). Those impacts are summarized in Table 6. Before turning to the results, a wordof caution is given about proper interpretation of indirect and induced effects, followedby a brief discussion of procedures used.
A Word of Caution
Two common mistakes are made in considering indirect and induced impacts. Bothmistakes involve claiming more indirect and induced impact than is appropriate (Beattieand Leones). First, is failure to acknowledge that the part of the ripple effect that occursbeyond the boundaries of the economy of interest should not be counted as part of theimpact on that local economy—in the context of this study, the Arizona economy. Thiscommon mistake has to do with failure to understand or account for leakage (see SectionII).6
A second mistake is failure to recognize that all sectors have ripple effects and thatmost input supply sectors are not dependent on supplying inputs to a single final demandsector. Most support sectors will expand service to other sectors if demand wanes in anexisting part of their market. For example, suppliers of building materials sell to all kindsof “end users” and “intermediate goods and services providers” throughout the Arizonaeconomy—just one part of which is buildings and corrals for stabling horses. The indirecteconomic impact of building materials sales, or how much it expands or contracts due toincreased or reduced pleasure horse activity, depends on whether resources in the localeconomy are fully employed and on the ability to attract additional resources fromoutside the local economy. If resources are fully employed and new resources are notattracted to an economy from outside, then an increase in economic activity in one areawill result in reduced activity in another area. The net effect in that case is negligible. Theupshot is that indirect (and induced) effects are generally overstated.
6 The problem of leakage, in fact, goes beyond just indirect and induced effect considerations. It is an issuethat requires close attention when accounting direct expenditures as well. We are confident that we haveavoided the overcounting problem with regards to our calculations of indirect and induced effects by usingIMPLAN rather than RIMS multipliers (see “Estimation Methodology, this section). We cannot be certain,however, that all direct expenditures on the part of Arizona horse household are exclusively purchases fromArizona-based suppliers.
A PARTIAL ECONOMIC IMPACT ANALYSIS OF ARIZONA’S HORSE INDUSTRY 31
Estimation Methodology
Estimates of the indirect and induced effects of Arizona’s horse industry are based on themost commonly used approach—interindustry economic multipliers. Table 6 presents theestimates of combined indirect and induced effects using Type II multipliers from theArizona IMPLAN interindustry model. The Arizona IMPLAN model is the model usedby the Economic and Business Research Program at the University of Arizona. The U.S.IMPLAN model, from which many state and local models, including the “Arizonamodel,” are derived, was developed by the Forest Service (U.S. Department ofAgriculture). The other commonly used model is the RIMS model maintained by the U.S.Department of Commerce. RIMS multipliers are generally larger than IMPLANmultipliers. This study uses the IMPLAN model because the procedure used to “scaledown” from the U.S. model to state and local area models accounts more carefully for“cross haul and leakage” effects than does the RIMS modeling procedure (Richardson).
The 1990 study also used an Arizona IMPLAN model. The implicit Type-II outputmultipliers used in that study were 1.6 for the “pleasure segment,” 1.7 for the“commercial/semi-commercial segment,” and 1.9 for the “spectator segment.” In the1990 study, the expenditure categories and amounts from each direct segment wereassigned to related indirect economic sectors in the model to ascertain the indirect andinduced effects. This laborious approach was used because no sectors in the IMPLANmodel correspond exactly to the horse industry sub-sectors of interest. The IMPLANmodel has a single racing sector that includes horse, dog, and auto racing. Interestingly,the output multiplier for that sector is 1.9, the same as the “spectator segment” implicitoutput multiplier in the 1990 study. The IMPLAN model also has an “agriculturalservices” sector, the closest thing to the 1990 “commercial pleasure horse” sector, withan output multiplier of 1.7. There is no “private pleasure horse” sector in the IMPLANmodel. Yet there is the close correspondence of the “racing” and “agricultural services”sector multipliers with the “spectator” and “commercial/semi-commercial” outputmultiplier implicit7 in the 1990 study. Accordingly, the 1990 study multipliers are usedfor pleasure horses as well as for racing and other horse-related spectator events.
The Direct, Indirect and Induced, and Total Impact Estimates
Estimates of the direct, indirect and induced, and total impacts of the various componentsof Arizona’s horse industry are summarized in Table 6.
7 Because of the creative and careful way in which the indirect and induced effects were calculated in the1990 study the multipliers per se are implicit rather than explicit. However, the implicit multipliers arereadily determined from the reported direct, indirect, and induced impacts in Table 36, on p. 36 of the 1990report.
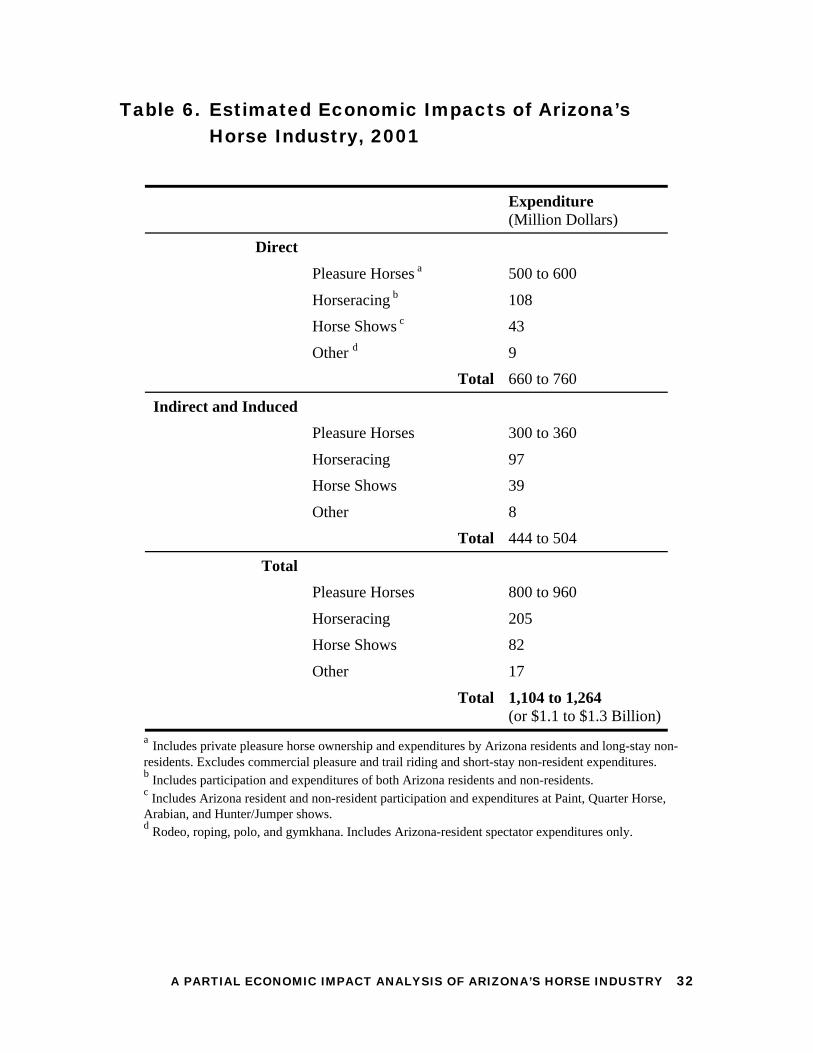
A PARTIAL ECONOMIC IMPACT ANALYSIS OF ARIZONA’S HORSE INDUSTRY 32
Table 6. Estimated Economic Impacts of Arizona’s
Horse Industry, 2001
Expenditure(Million Dollars)
Direct
Pleasure Horses a 500 to 600
Horseracing b 108
Horse Shows c 43
Other d 9
Total 660 to 760
Indirect and Induced
Pleasure Horses 300 to 360
Horseracing 97
Horse Shows 39
Other 8
Total 444 to 504
Total
Pleasure Horses 800 to 960
Horseracing 205
Horse Shows 82
Other 17
Total 1,104 to 1,264(or $1.1 to $1.3 Billion)
a Includes private pleasure horse ownership and expenditures by Arizona residents and long-stay non-residents. Excludes commercial pleasure and trail riding and short-stay non-resident expenditures.b Includes participation and expenditures of both Arizona residents and non-residents.c Includes Arizona resident and non-resident participation and expenditures at Paint, Quarter Horse,Arabian, and Hunter/Jumper shows.d Rodeo, roping, polo, and gymkhana. Includes Arizona-resident spectator expenditures only.
A PARTIAL ECONOMIC IMPACT ANALYSIS OF ARIZONA’S HORSE INDUSTRY 33
VIII. HORSE AND HOUSEHOLD NUMBERS AND COMPARISONWITH OTHER SECTORS
This section touches briefly on two topics. First, Table 7 provides an updated estimate(projection) of the plausible number of horses in Arizona and a plausible number ofArizona households having direct involvement in the horse industry either throughpleasure horse ownership or through commercial or semi-commercial horse-basedbusinesses. The updated numbers for 2001 are based on findings from the 1990 study.Assumptions upon which the 2001 projected numbers are based are enumerated in thenotes to Table 7.
A final point of interest is to place the estimated direct expenditures on horses inArizona (a measure of the relative contribution or “importance” of horses to the Arizonaeconomy) in perspective. Figure 2 does this in compact, visual terms by comparing directexpenditures on horses against gross sales from selected agricultural sectors8 and againststate government expenditures on “protection and safety” in Arizona. The figure revealsthat direct expenditures on horses and those horse-related activities included in this studyexceed that of most of the major sub-sectors comprising Arizona’s agricultural industryand rival what the state government spends annually on law enforcement, the nationalguard, state prisons, and the like.
The “bottom-line” results of Tables 6 and 7 and Figure 2 are summarized in a one-page Executive Summary at the front of this report (see p. vi).
8 While at first it may seem a bit curious, comparison of expenditures to gross sales is appropriate under theassumption of a perfectly competitive industry. When markets are highly competitive, as is generally thecase in agricultural markets, and when costs of production (expenditures) include an accounting for a“normal” rate of return on investment and payment of an opportunity cost wage to business owners/managers in the industry, then zero economic profit is the expected long-run equilibrium outcome. Sinceprofit equals gross sales less costs of production, then when profit (after appropriate payment for investedcapital and owner-family labor is made) is zero, gross sales will equal expenditures.
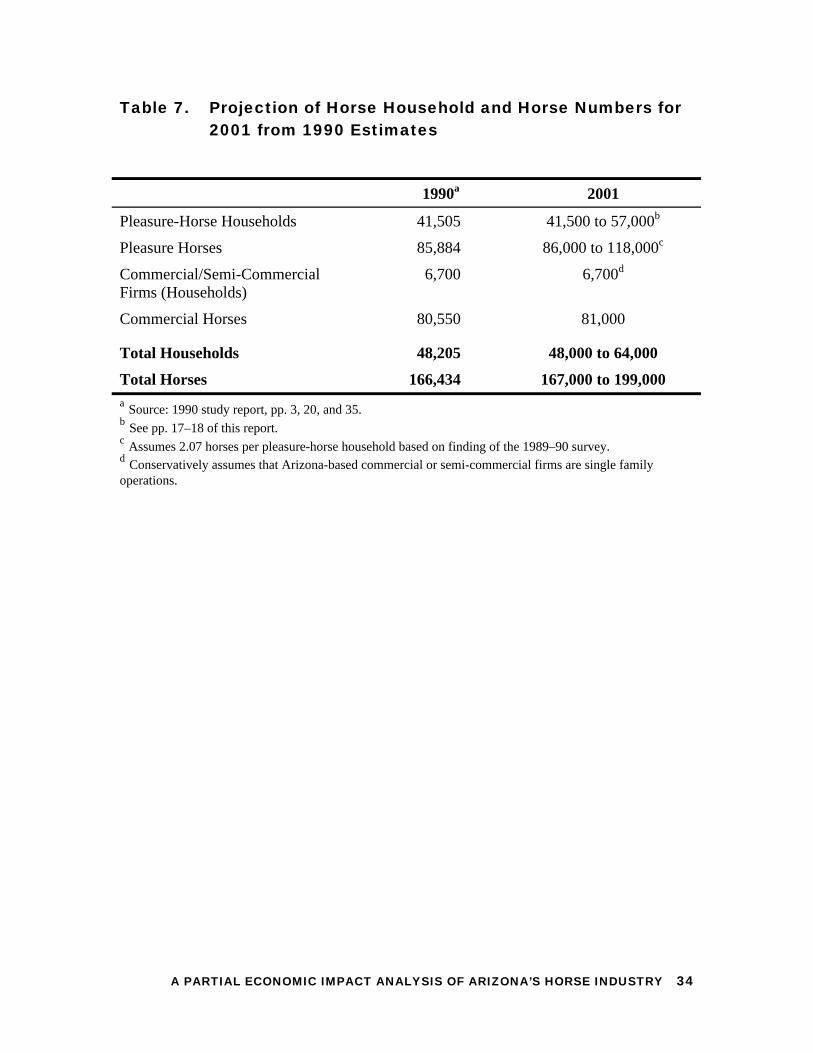
A PARTIAL ECONOMIC IMPACT ANALYSIS OF ARIZONA’S HORSE INDUSTRY 34
Table 7. Projection of Horse Household and Horse Numbers for2001 from 1990 Estimates
1990a 2001
Pleasure-Horse Households 41,505 41,500 to 57,000b
Pleasure Horses 85,884 86,000 to 118,000c
Commercial/Semi-CommercialFirms (Households)
6,700 6,700d
Commercial Horses 80,550 81,000
Total Households 48,205 48,000 to 64,000
Total Horses 166,434 167,000 to 199,000a Source: 1990 study report, pp. 3, 20, and 35.b See pp. 17–18 of this report.c Assumes 2.07 horses per pleasure-horse household based on finding of the 1989–90 survey.d Conservatively assumes that Arizona-based commercial or semi-commercial firms are single familyoperations.
All Melons Cotton Dairy Lettuce & Broccoli
Cattle & Calves
Horses Protection & Safety*
0
100
200
300
400
500
600
700
800Millions ($)
79
156
350410
620
700 719
Figure 2.Comparison of Direct Expenditures on Horses to Agricultural Commodity Sales
and State Government Expenditures on Protection and Safety
2000Agricultural Sales
2001Direct Horse
Expenditures
2000Expendituresfrom ArizonaGeneral Fund
* Protection and Saf ety includes law enf orcement, military , custody and related serv ices prov ided to the general public.
A PARTIAL ECONOMIC IMPACT ANALYSIS OF ARIZONA’S HORSE INDUSTRY 36
References
Arizona Agricultural Statistics Service. 2000. http://www.nass.usda.gov/az
Arizona Chapter of the American Society of Farm Managers and Rural Appraisers.February 25, 2000. “The Spring Agricultural Outlook Forum Proceedings.”
Arizona Department of Economic Security: Division of Employee Services and Support.2000. http://www.de.state.az.us
Arizona Department of Racing. 2000. “51st Annual Report, FY 2000.” Phoenix, Arizona.
Beattie, Bruce R. and J.P. Leones. 1993. “Uses and Abuses of Economic Multiplers.”Community Development Issues 1(2):1–5. Department of Agricultural and ResourceEconomics, The University of Arizona, Tucson.
Center for Business Research. 1997. “The Economic Contributions of the Pari-MutuelRacing Industry to the Arizona Economy.” L. William Seidman Research Institute,College of Business, Arizona State University, Tempe. 22 pp.
Council of Economic Advisers. 2001. “The Annual Report of the Council of EconomicAdvisers.” In: Economic Report of the President. Washington: U.S. GovernmentPrinting Office.
Gum, Russell, et al. 1990. “The Economics of the Horse Industry in Arizona.” ExtensionReport #9033, College of Agriculture, The University of Arizona, Tucson.
Musser, Wesley N., et al. 1999. “Economic Impact of Horse Racing in Maryland.” PolicyAnalysis Report No. 99-01, Center for Agricultural and Natural Resource Policy,University of Maryland, College Park.
National Task Force on Commodity Costs and Returns Measurement Methods. 1998.Commodity Costs and Returns Estimation Handbook: A Report of the AmericanAgricultural Economics Association Task Force on Commodity Costs and Returns.Ames, Iowa State University Press.
Richardson, Harry W. 1985. “Input-Output and Economic Base Multipliers: LookingBackward and Forward.” Journal of Regional Science 25(4):607–661.
State of Arizona. 2000. “The Comprehensive Annual Financial Report for the Fiscal YearEnded June 30, 2000.” Department of Administration, Financial Services Division,Financial Reporting Section, and General Accounting Office, Phoenix.
Teegerstrom, Trent. 2000. “2000-2001 Arizona Farm Machinery Costs.” CooperativeExtension Bulletin No. AZ1163. The University of Arizona, Tucson.
A PARTIAL ECONOMIC IMPACT ANALYSIS OF ARIZONA’S HORSE INDUSTRY 37
U.S. Census Bureau: Population Division. 2000. “U.S. Census 2000.”http://www.census.gov/population
U.S. Department of Agriculture. 1992. Micro IMPLAN User’s Guide: Version 91-F.Forest Service, Land Management Planning Systems Group, Ft. Collins, CO
U.S. Department of Agriculture. Various Years. Agricultural Statistics. National Agri.Statistics Service, U.S. Government Printing Office, Washington, D.C.
U.S. Department of Commerce. 2001. “Regional Multipliers from the Regional Input-Output Modeling System (RIMS II): A Brief Description.”http://www.bea..doc.gov/bea/regional/rims/brfdesc.htm
Recommended