
A/B Testing(Hypothesis Testing)
CS57300 - Data MiningSpring 2016
Instructor: Bruno Ribeiro
© 2016 Bruno Ribeiro
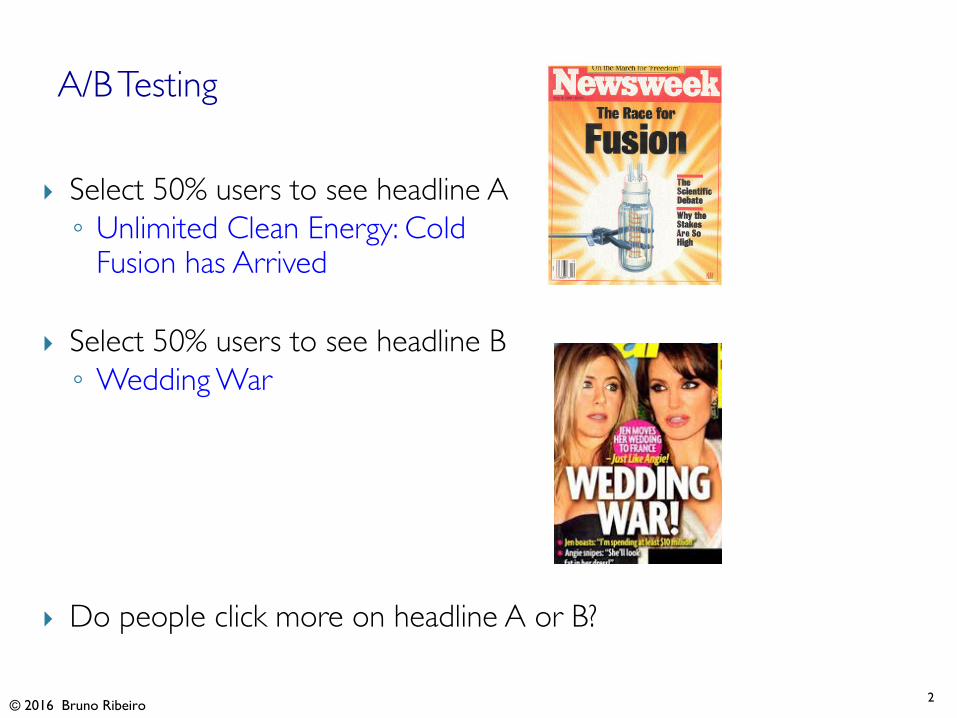
} Select 50% users to see headline A◦ Unlimited Clean Energy: Cold
Fusion has Arrived
} Select 50% users to see headline B◦ Wedding War
} Do people click more on headline A or B?
A/B Testing
2© 2016 Bruno Ribeiro
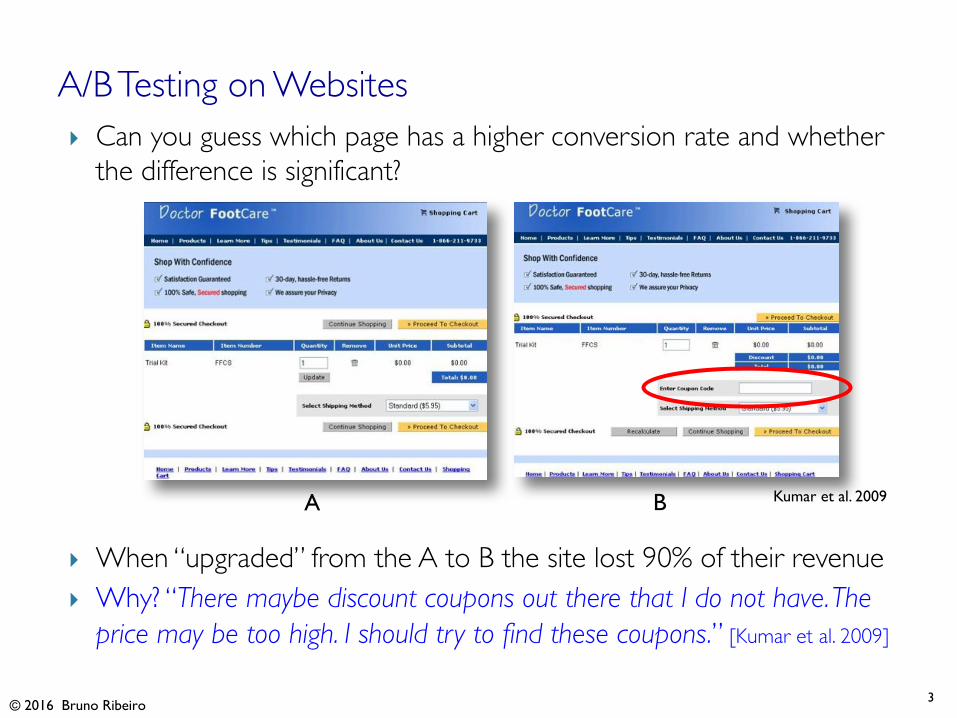
} Can you guess which page has a higher conversion rate and whether the difference is significant?
} When “upgraded” from the A to B the site lost 90% of their revenue} Why? “There maybe discount coupons out there that I do not have. The
price may be too high. I should try to find these coupons.” [Kumar et al. 2009]
3
A/B Testing on Websites
A B Kumar et al. 2009
© 2016 Bruno Ribeiro
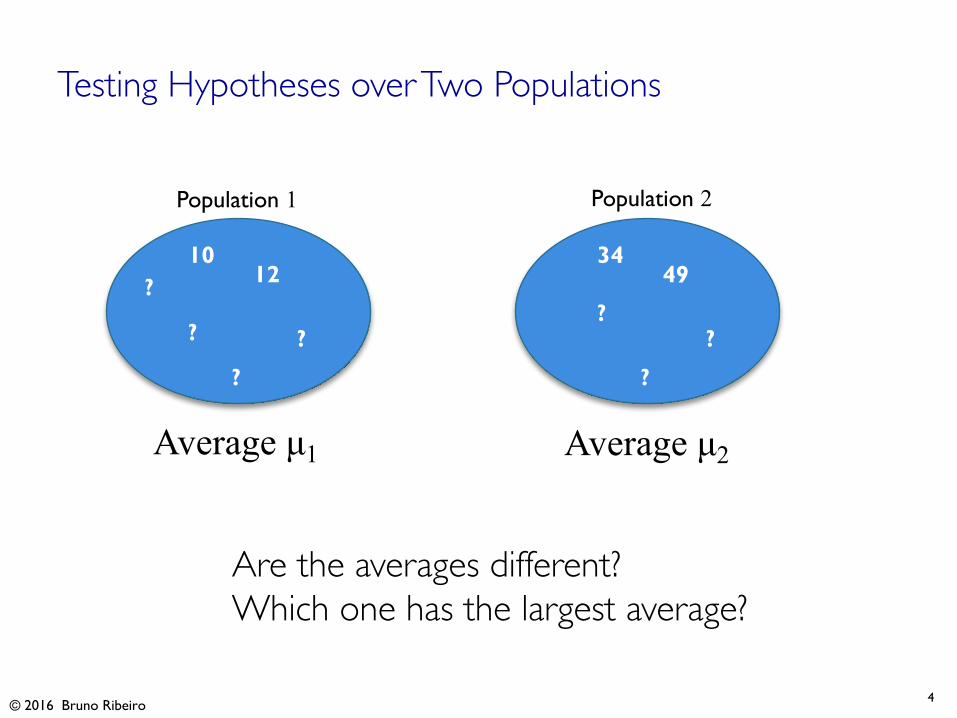
Testing Hypotheses over Two Populations
12
?
?
1049
?
?
34
?
Are the averages different?Which one has the largest average?
?
?
4
Average µ1 Average µ2
Population 2Population 1
© 2016 Bruno Ribeiro
The two-sample t-test
Is difference in averages between two groups more than we would expect based on chance alone?
PS: Same as alien identification problem: we don’t know how to model “average is different”
5© 2016 Bruno Ribeiro
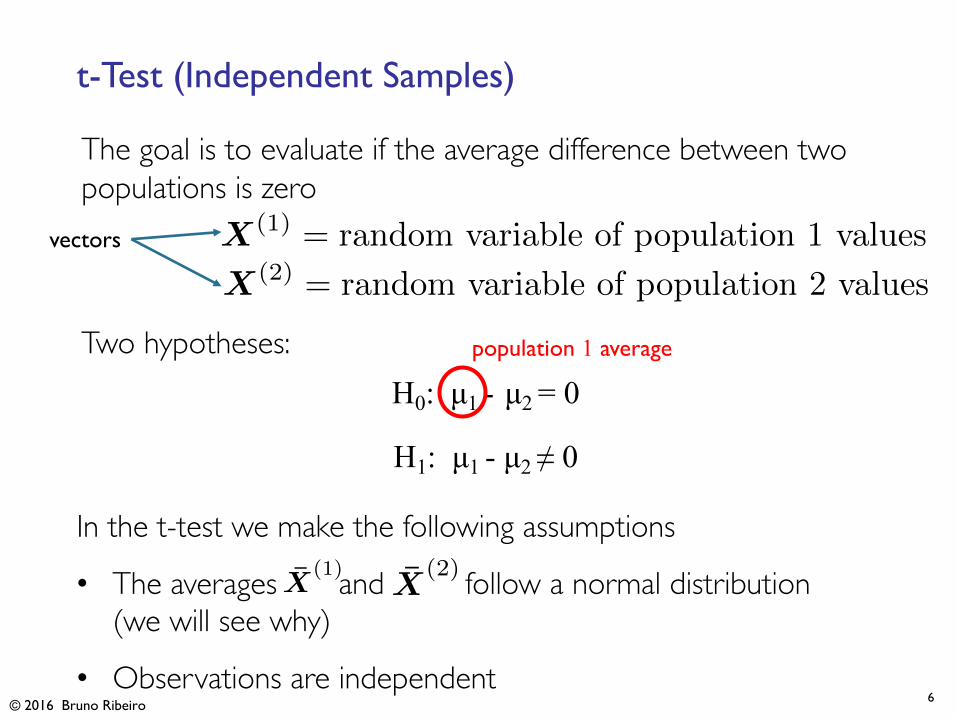
t-Test (Independent Samples)
H0: µ1 - µ2 = 0
H1: µ1 - µ2 ≠ 0
The goal is to evaluate if the average difference between two populations is zero
In the t-test we make the following assumptions
• The averages and follow a normal distribution (we will see why)
• Observations are independent
Two hypotheses:
6
population 1 average
vectors
© 2016 Bruno Ribeiro
X(1)= random variable of population 1 values
X(2)= random variable of population 2 values
X̄(1)
X̄(2)
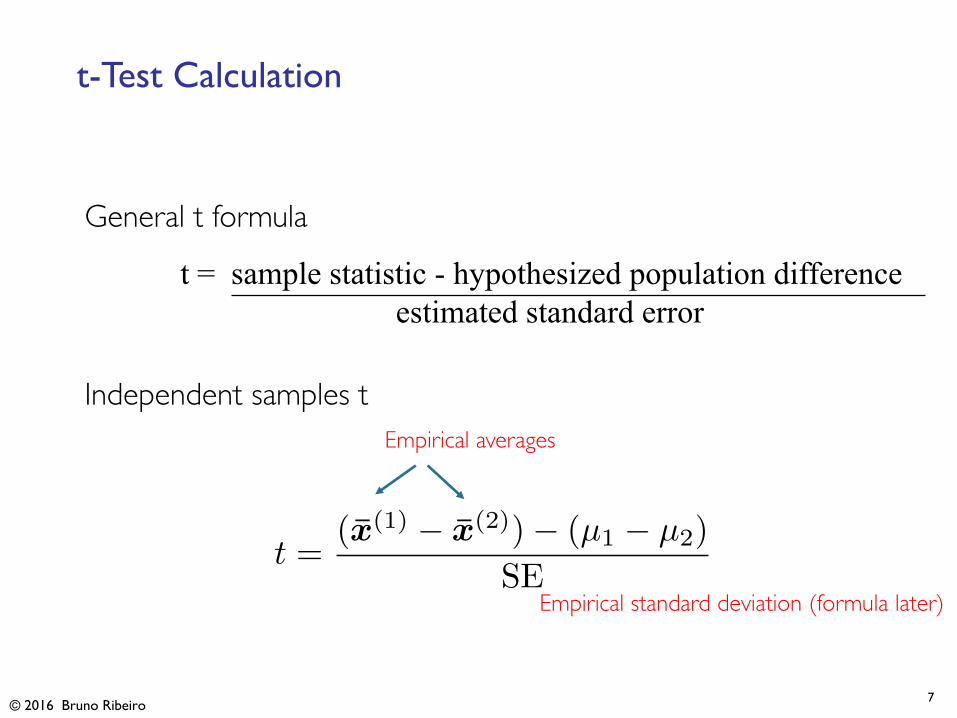
General t formula
t = sample statistic - hypothesized population differenceestimated standard error
Independent samples tEmpirical averages
Empirical standard deviation (formula later)
t-Test Calculation
7© 2016 Bruno Ribeiro
t =(x̄(1) � x̄
(2))� (µ1 � µ2)
SE
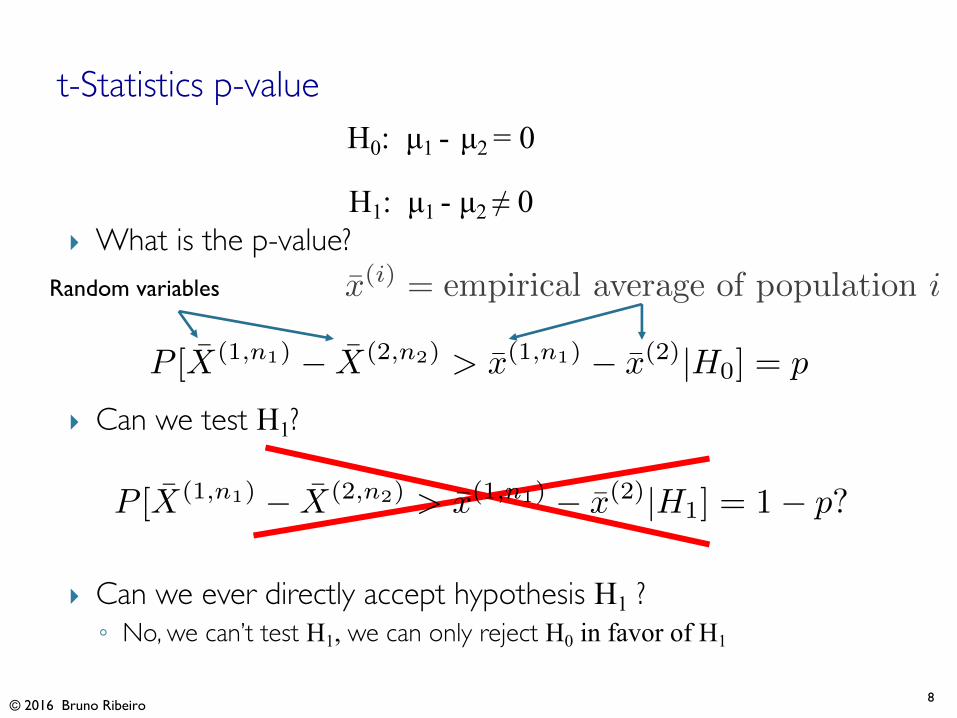
} What is the p-value?
} Can we test H1?
} Can we ever directly accept hypothesis H1 ?◦ No, we can’t test H1, we can only reject H0 in favor of H1
8
t-Statistics p-valueH0: µ1 - µ2 = 0
H1: µ1 - µ2 ≠ 0
© 2016 Bruno Ribeiro
P [X̄(1,n1) � X̄(2,n2) > x̄(1,n1) � x̄(2)|H0] = p
x̄
(i)= empirical average of population i
P [X̄(1,n1) � X̄(2,n2) > x̄(1,n1) � x̄(2)|H1] = 1� p?
Random variables
9
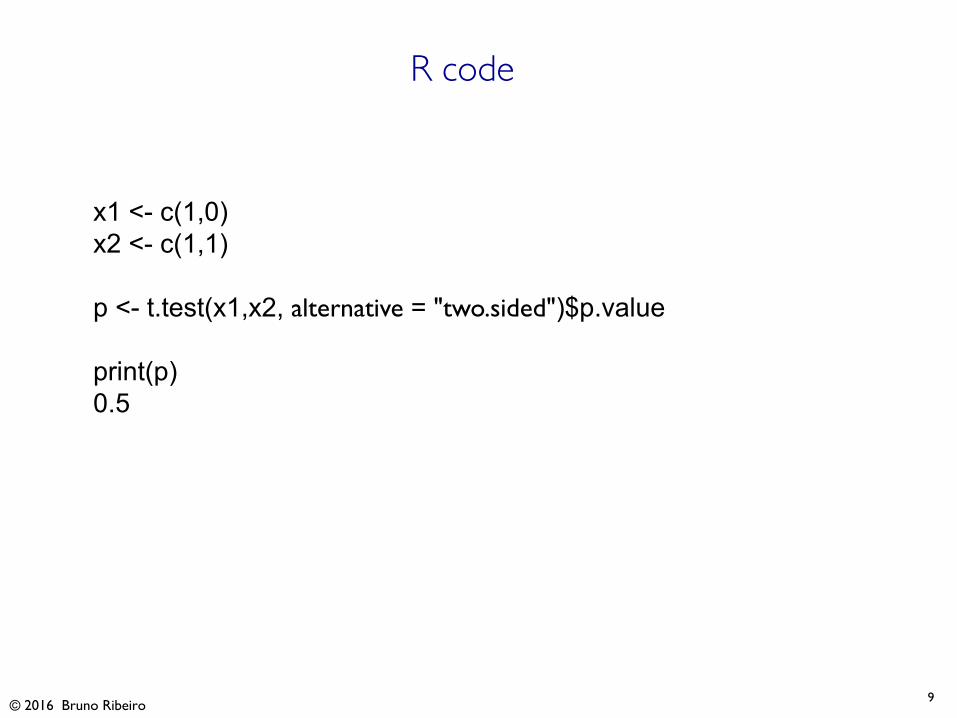
R code
x1 <- c(1,0)x2 <- c(1,1)
p <- t.test(x1,x2, alternative = "two.sided")$p.value
print(p)0.5
© 2016 Bruno Ribeiro
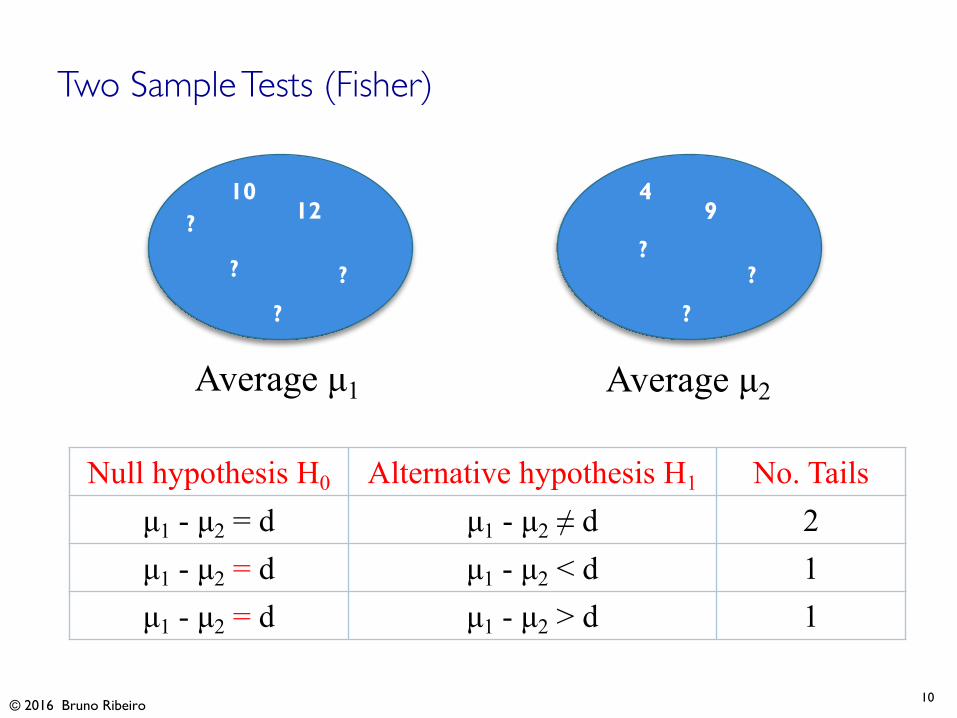
Null hypothesis H0 Alternative hypothesis H1 No. Tailsµ1 - µ2 = d µ1 - µ2 ≠ d 2µ1 - µ2 = d µ1 - µ2 < d 1µ1 - µ2 = d µ1 - µ2 > d 1
10
Two Sample Tests (Fisher)
12
?
?
109
?
?
4
??
?
Average µ1 Average µ2
© 2016 Bruno Ribeiro
} E.g. software updates◦ Perform incremental A/B testing before rolling ANY big system
change on a website that should have no effect on users(even if users don’t directly see the change)� What is the hypothesis we want to test?� H0 = no difference in [engagement, purchases, delay, transaction
time,…]
◦ How?� Start with 0.1% of visitors (machines) and
grow until 50% of visitors (machines)� If at any time H0 is rejected, stop the roll out� Must account for testing multiple hypotheses (next class)
(more precisely, this is sequential analysis)
11
Less Obvious Applications
© 2016 Bruno Ribeiro
} How to stop experiment early if hypothesis seems true◦ Stopping criteria often needs to be decided before experiment starts◦ More next class
12
Sequential Analysis (Sequential Hypothesis Test)
© 2016 Bruno Ribeiro
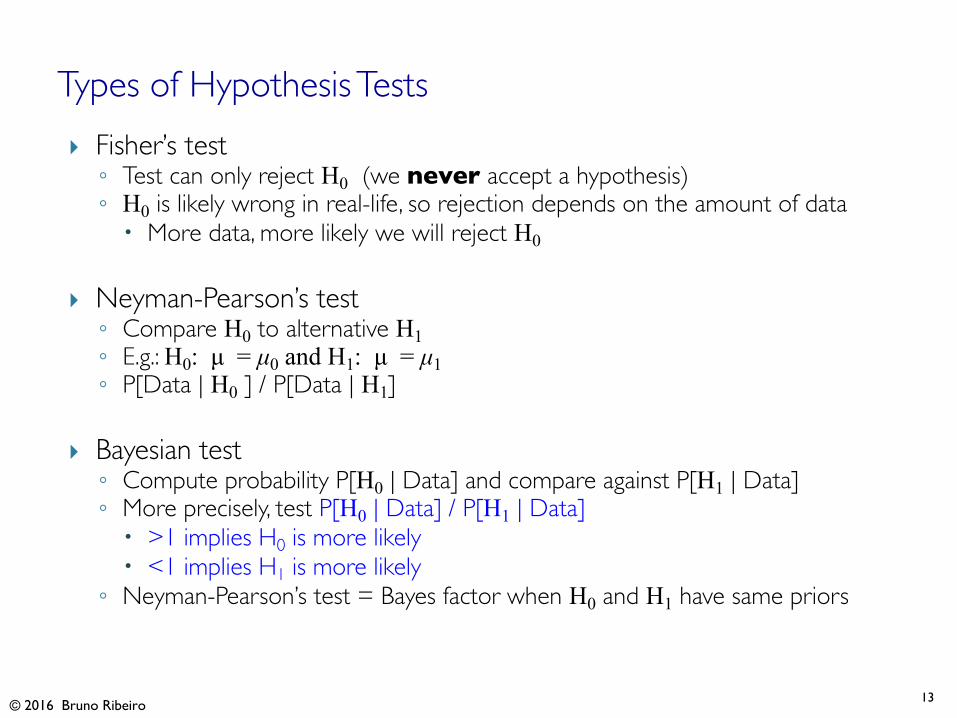
} Fisher’s test◦ Test can only reject H0 (we never accept a hypothesis)◦ H0 is likely wrong in real-life, so rejection depends on the amount of data� More data, more likely we will reject H0
} Neyman-Pearson’s test◦ Compare H0 to alternative H1◦ E.g.: H0: µ = µ0 and H1: µ = µ1◦ P[Data | H0 ] / P[Data | H1]
} Bayesian test◦ Compute probability P[H0 | Data] and compare against P[H1 | Data]◦ More precisely, test P[H0 | Data] / P[H1 | Data]� >1 implies H0 is more likely� <1 implies H1 is more likely◦ Neyman-Pearson’s test = Bayes factor when H0 and H1 have same priors
13
Types of Hypothesis Tests
© 2016 Bruno Ribeiro

14
Back to Fisher’s test(no priors)
© 2016 Bruno Ribeiro
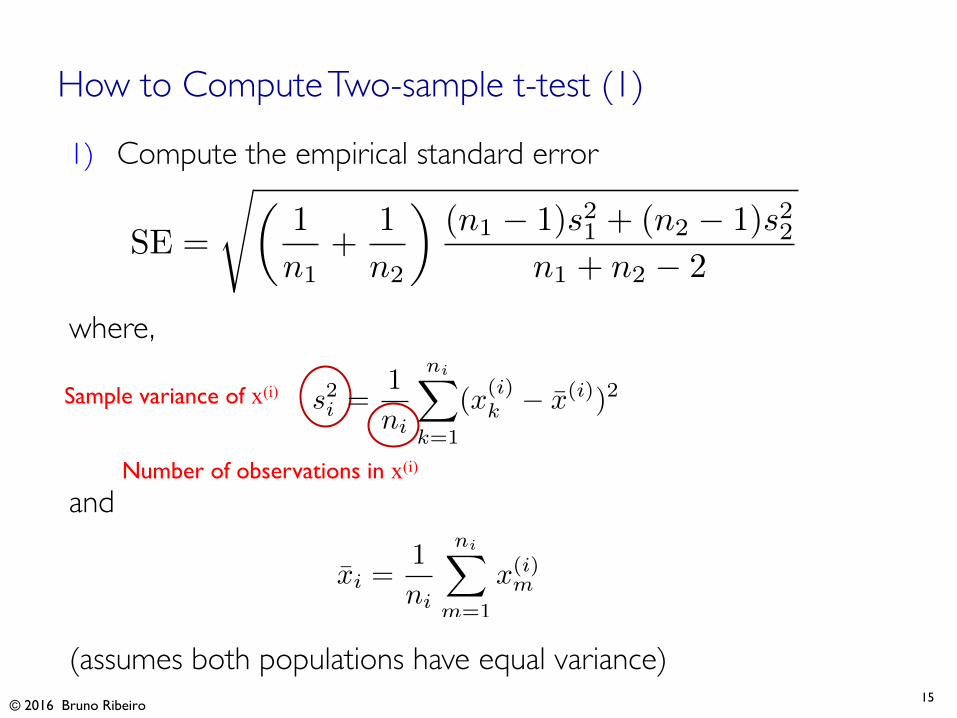
1) Compute the empirical standard error
where,
and
(assumes both populations have equal variance)15
How to Compute Two-sample t-test (1)
Sample variance of x(i)
Number of observations in x(i)
s
2i =
1
ni
niX
k=1
(x(i)k � x̄
(i))2
© 2016 Bruno Ribeiro
x̄i =1
ni
niX
m=1
x
(i)m
SE =
s✓1
n1+
1
n2
◆(n1 � 1)s21 + (n2 � 1)s22
n1 + n2 � 2
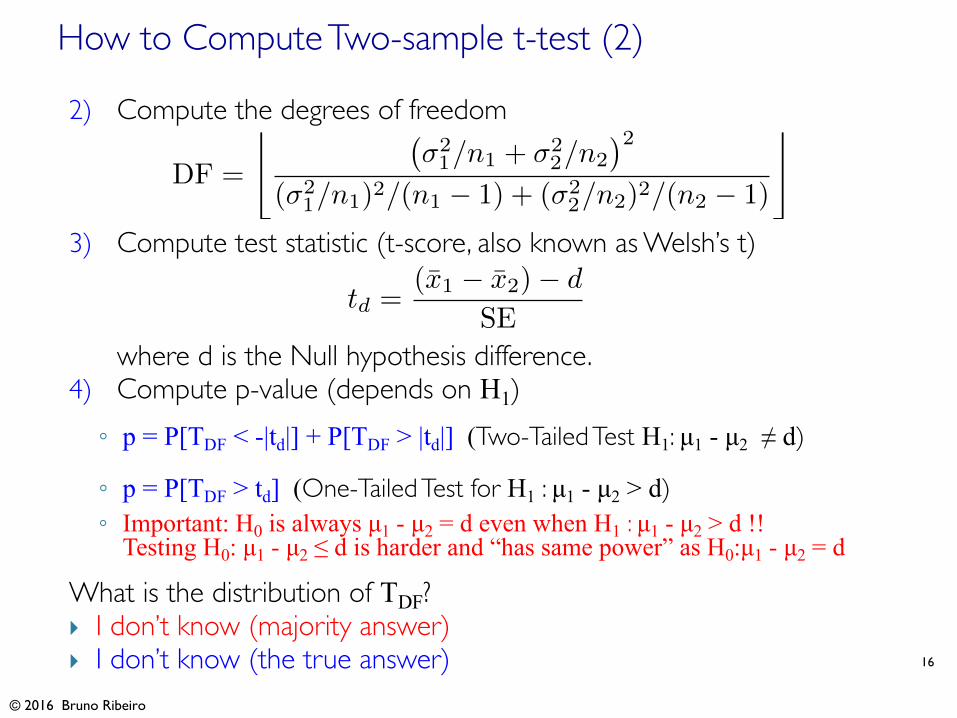
2) Compute the degrees of freedom
3) Compute test statistic (t-score, also known as Welsh’s t)
where d is the Null hypothesis difference.4) Compute p-value (depends on H1)◦ p = P[TDF < -|td|] + P[TDF > |td|] (Two-Tailed Test H1: µ1 - µ2 ≠ d)
◦ p = P[TDF > td] (One-Tailed Test for H1 : µ1 - µ2 > d)◦ Important: H0 is always µ1 - µ2 = d even when H1 : µ1 - µ2 > d !!
Testing H0: µ1 - µ2 ≤ d is harder and “has same power” as H0:µ1 - µ2 = d
What is the distribution of TDF?} I don’t know (majority answer)} I don’t know (the true answer) 16
How to Compute Two-sample t-test (2)
DF =
$ ��21/n1 + �2
2/n2
�2
(�21/n1)2/(n1 � 1) + (�2
2/n2)2/(n2 � 1)
%
td =(x̄1 � x̄2)� d
SE
© 2016 Bruno Ribeiro
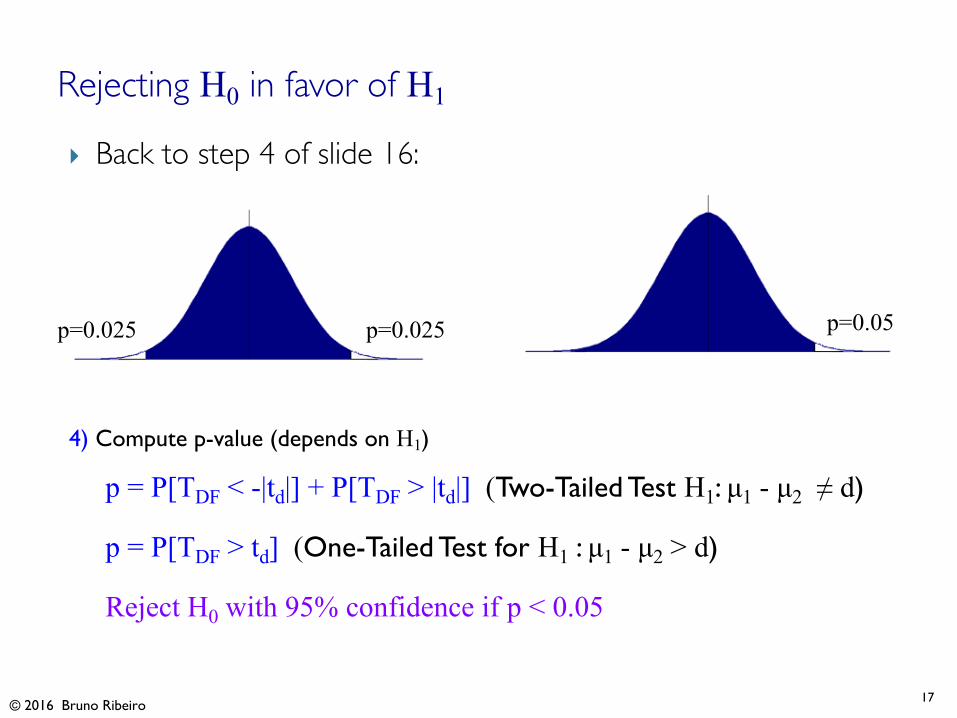
} Back to step 4 of slide 16:
17
Rejecting H0 in favor of H1
4) Compute p-value (depends on H1)
p = P[TDF < -|td|] + P[TDF > |td|] (Two-Tailed Test H1: µ1 - µ2 ≠ d)
p = P[TDF > td] (One-Tailed Test for H1 : µ1 - µ2 > d)
Reject H0 with 95% confidence if p < 0.05
p=0.025 p=0.025 p=0.05
© 2016 Bruno Ribeiro
}
}
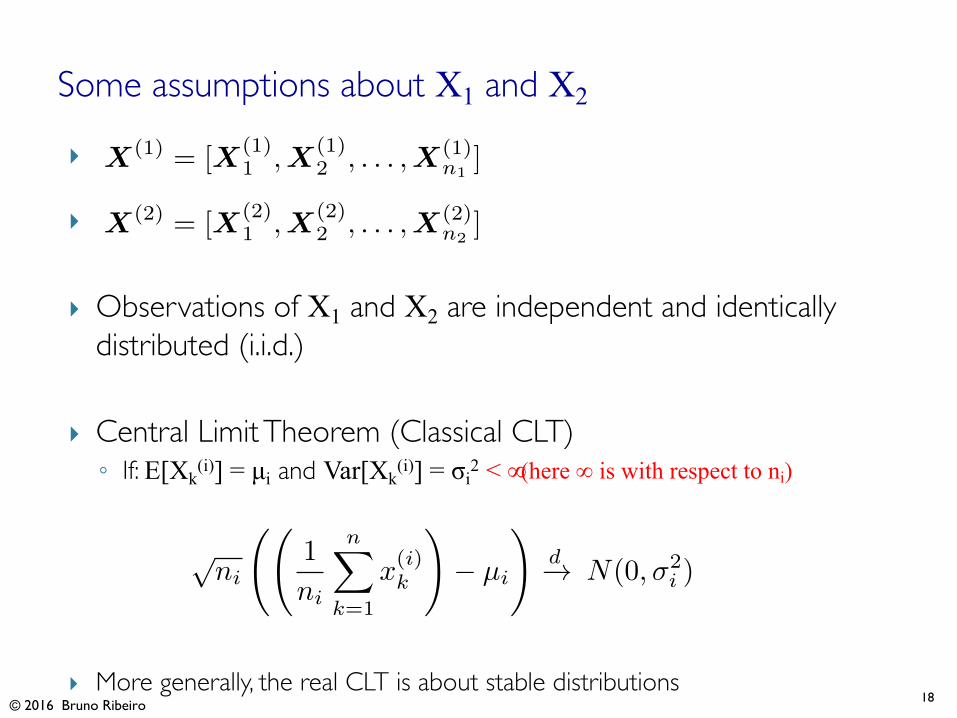
} Observations of X1 and X2 are independent and identically distributed (i.i.d.)
} Central Limit Theorem (Classical CLT)◦ If: E[Xk
(i)] = µi and Var[Xk(i)] = σi
2 < ∞
} More generally, the real CLT is about stable distributions18
Some assumptions about X1 and X2
(here ∞ is with respect to ni)
pni
1
ni
nX
k=1
x
(i)k
!� µi
!d�! N(0,�2
i )
© 2016 Bruno Ribeiro
X(2) = [X(2)1 ,X(2)
2 , . . . ,X(2)n2
]
X(1) = [X(1)1 ,X(1)
2 , . . . ,X(1)n1
]
19
CLT: If we have enough independent observations with small variance we can approximate the distribution of their average with a normal distribution
© 2016 Bruno Ribeiro
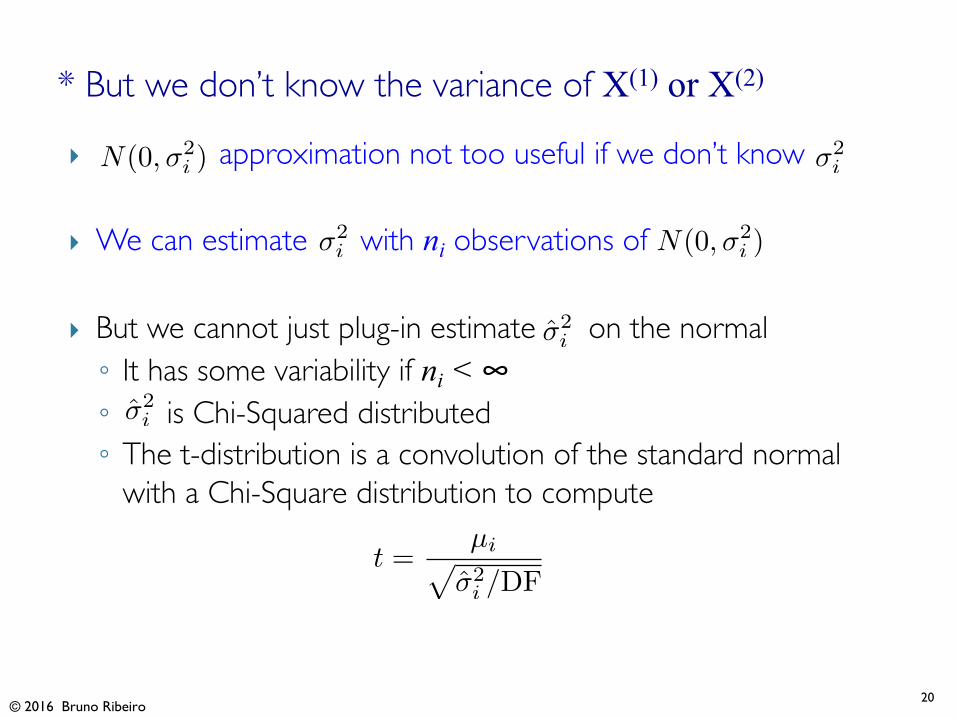
} approximation not too useful if we don’t know
} We can estimate with ni observations of
} But we cannot just plug-in estimate on the normal◦ It has some variability if ni < ∞◦ is Chi-Squared distributed◦ The t-distribution is a convolution of the standard normal
with a Chi-Square distribution to compute
20
* But we don’t know the variance of X(1) or X(2)
N(0,�2i ) �2
i
�2i N(0,�2
i )
�̂2i
�̂2i
t =µip
�̂2i /DF
© 2016 Bruno Ribeiro
} If results are 0 or 1 (buy, not buy) we can use Bernoulli random variables rather than the Normal approximation
21
For small samples we can use the Binomial distribution
© 2016 Bruno Ribeiro
22
What about false positives and
false negatives of a test?
© 2016 Bruno Ribeiro
23
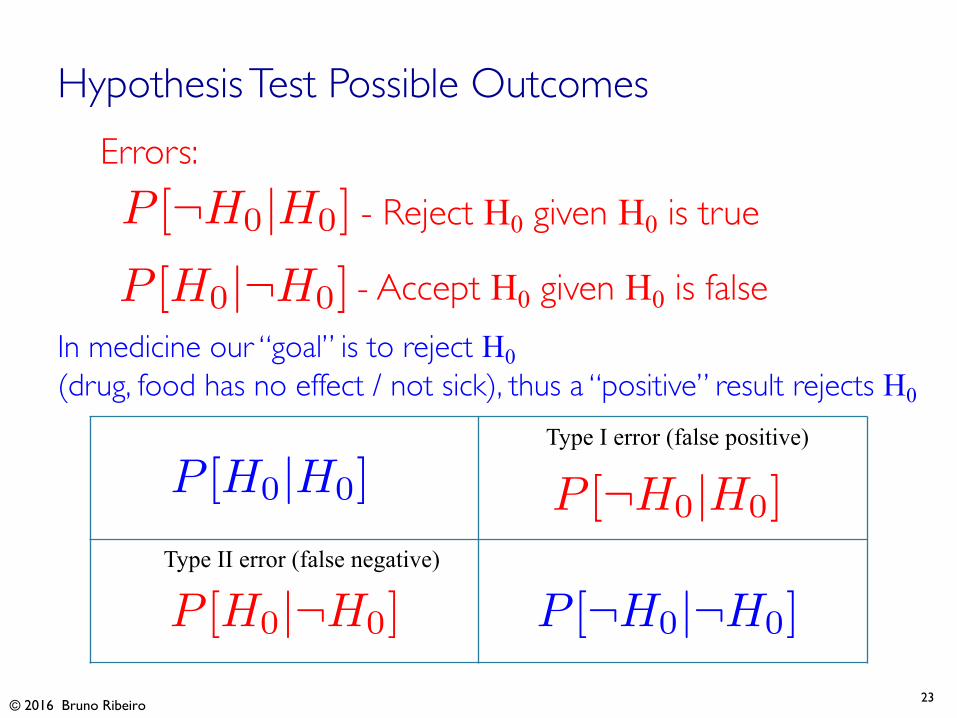
Hypothesis Test Possible Outcomes
Type I error (false positive)
P [H0|H0] P [¬H0|H0]
P [H0|¬H0]Type II error (false negative)
P [¬H0|¬H0]
P [¬H0|H0] - Reject H0 given H0 is true
P [H0|¬H0] - Accept H0 given H0 is false
Errors:
In medicine our “goal” is to reject H0(drug, food has no effect / not sick), thus a “positive” result rejects H0
© 2016 Bruno Ribeiro
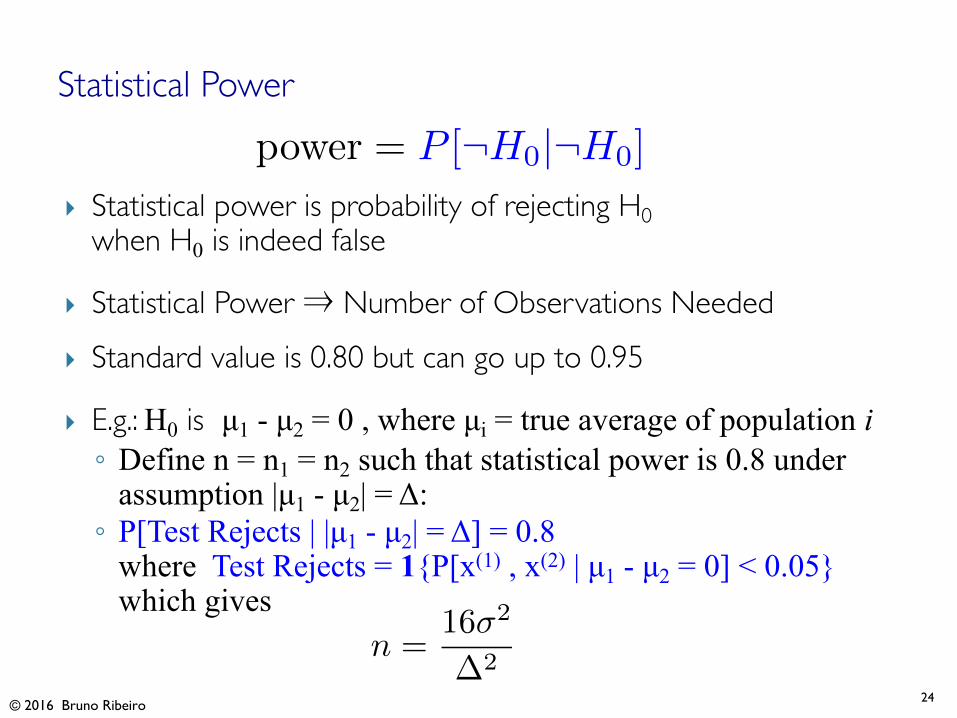
} Statistical power is probability of rejecting H0when H0 is indeed false
} Statistical Power ⇒ Number of Observations Needed} Standard value is 0.80 but can go up to 0.95
} E.g.: H0 is µ1 - µ2 = 0 , where µi = true average of population i◦ Define n = n1 = n2 such that statistical power is 0.8 under
assumption |µ1 - µ2| = Δ: ◦ P[Test Rejects | |µ1 - µ2| = Δ] = 0.8
where Test Rejects = 1{P[x(1) , x(2) | µ1 - µ2 = 0] < 0.05}which gives
24
Statistical Powerpower = P [¬H0|¬H0]
n =16�2
�2
© 2016 Bruno Ribeiro
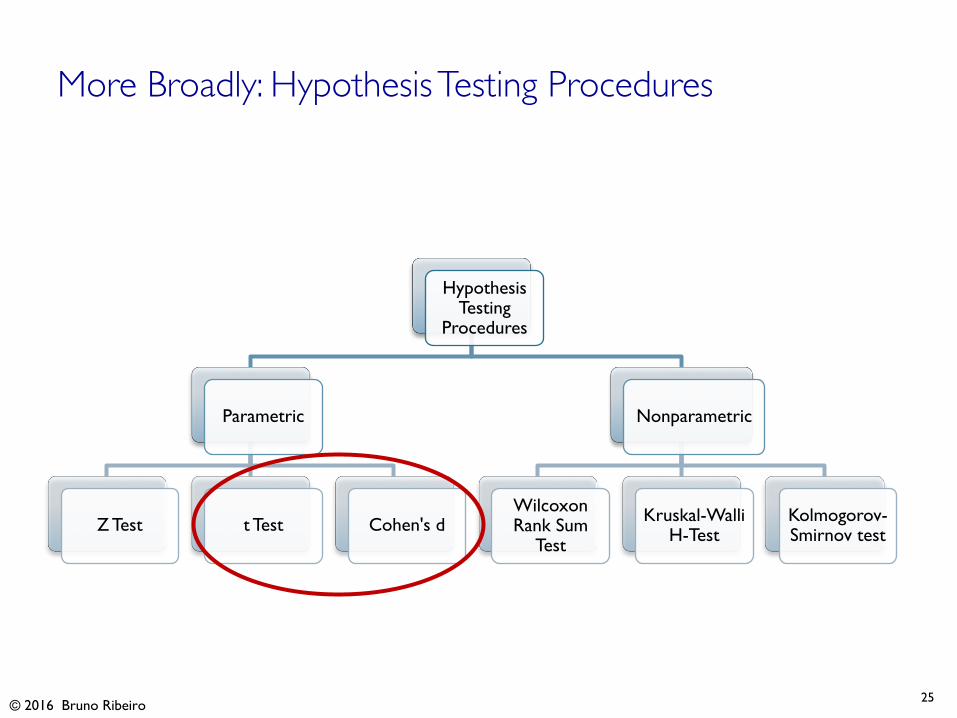
More Broadly: Hypothesis Testing Procedures
Hypothesis Testing
Procedures
Parametric
Z Test t Test Cohen's d
Nonparametric
Wilcoxon Rank Sum
Test
Kruskal-WalliH-Test
Kolmogorov-Smirnov test
25© 2016 Bruno Ribeiro

Parametric Test Procedures
} Tests Population Parameters (e.g. Mean)
} Distribution Assumptions (e.g. Normal distribution)
} Examples: Z Test, t-Test, c2 Test, F test
26© 2016 Bruno Ribeiro

27© 2016 Bruno Ribeiro
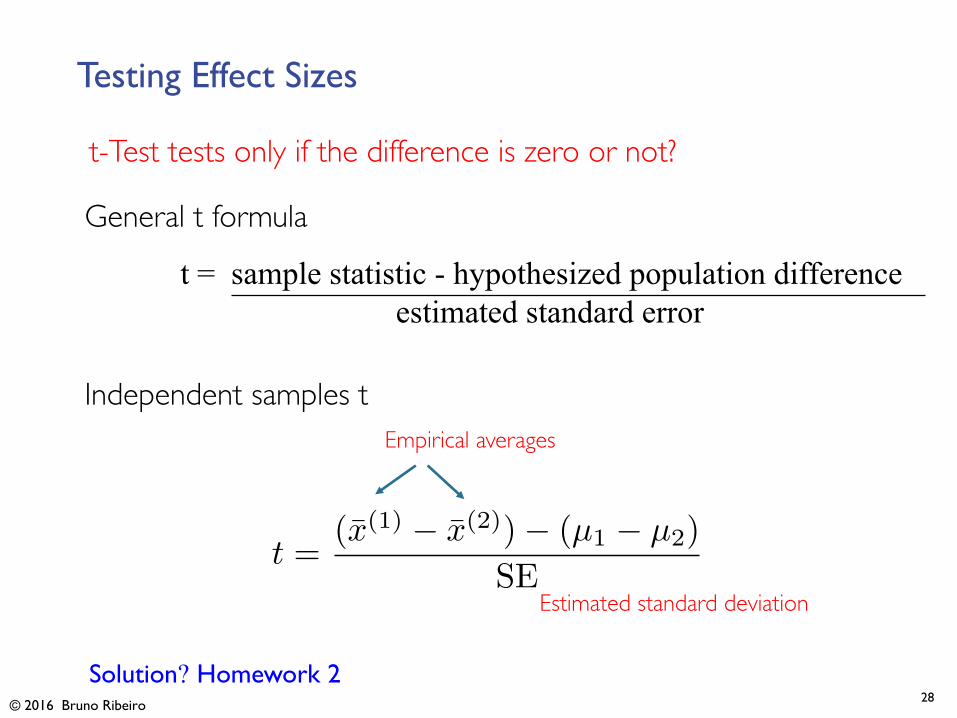
General t formula
t = sample statistic - hypothesized population differenceestimated standard error
Independent samples tEmpirical averages
Estimated standard deviation
Testing Effect Sizes
28
t =(x̄(1) � x̄
(2))� (µ1 � µ2)
SE
t-Test tests only if the difference is zero or not?
Solution? Homework 2© 2016 Bruno Ribeiro
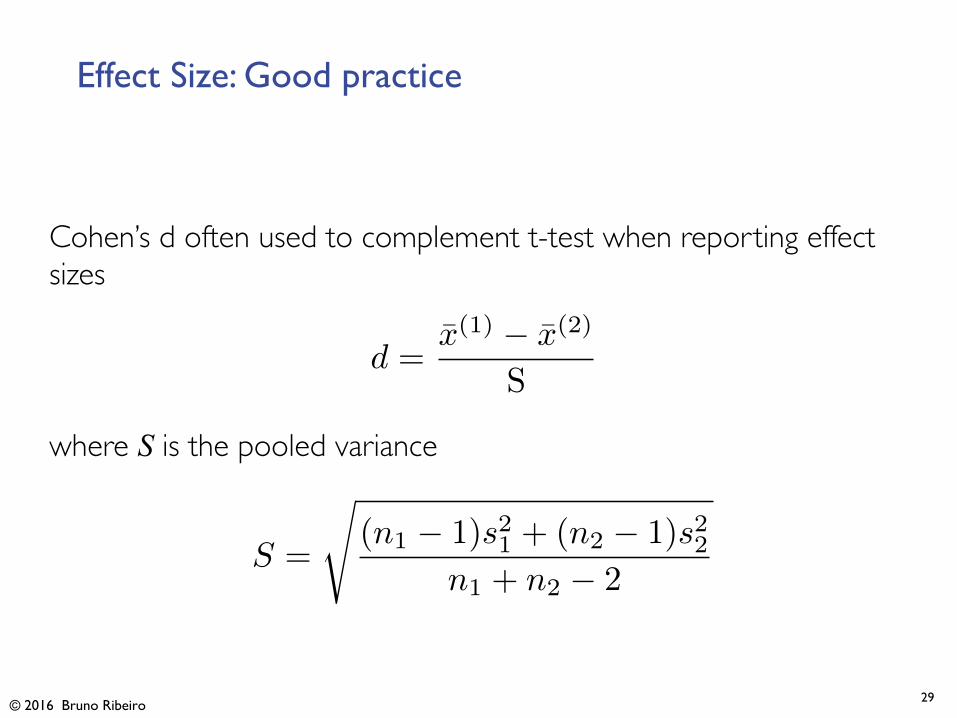
Cohen’s d often used to complement t-test when reporting effect sizes
where S is the pooled variance
Effect Size: Good practice
29
d =x̄
(1) � x̄
(2)
S
S =
s(n1 � 1)s21 + (n2 � 1)s22
n1 + n2 � 2
© 2016 Bruno Ribeiro

30
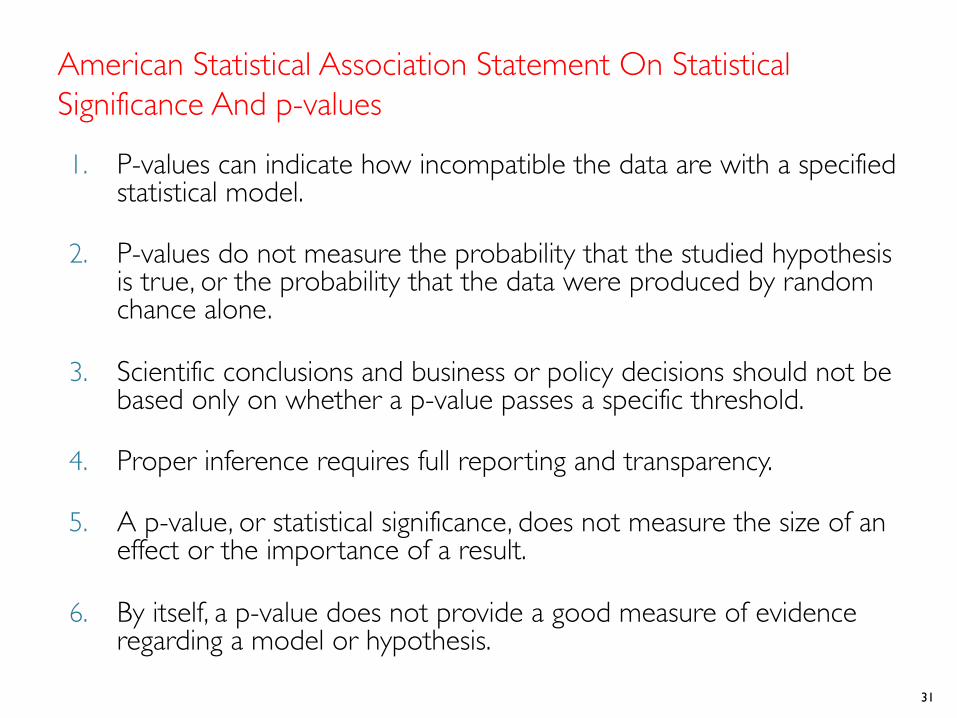
1. P-values can indicate how incompatible the data are with a specified statistical model.
2. P-values do not measure the probability that the studied hypothesis is true, or the probability that the data were produced by random chance alone.
3. Scientific conclusions and business or policy decisions should not be based only on whether a p-value passes a specific threshold.
4. Proper inference requires full reporting and transparency.
5. A p-value, or statistical significance, does not measure the size of an effect or the importance of a result.
6. By itself, a p-value does not provide a good measure of evidence regarding a model or hypothesis.
31
American Statistical Association Statement On Statistical Significance And p-values
32© 2016 Bruno Ribeiro
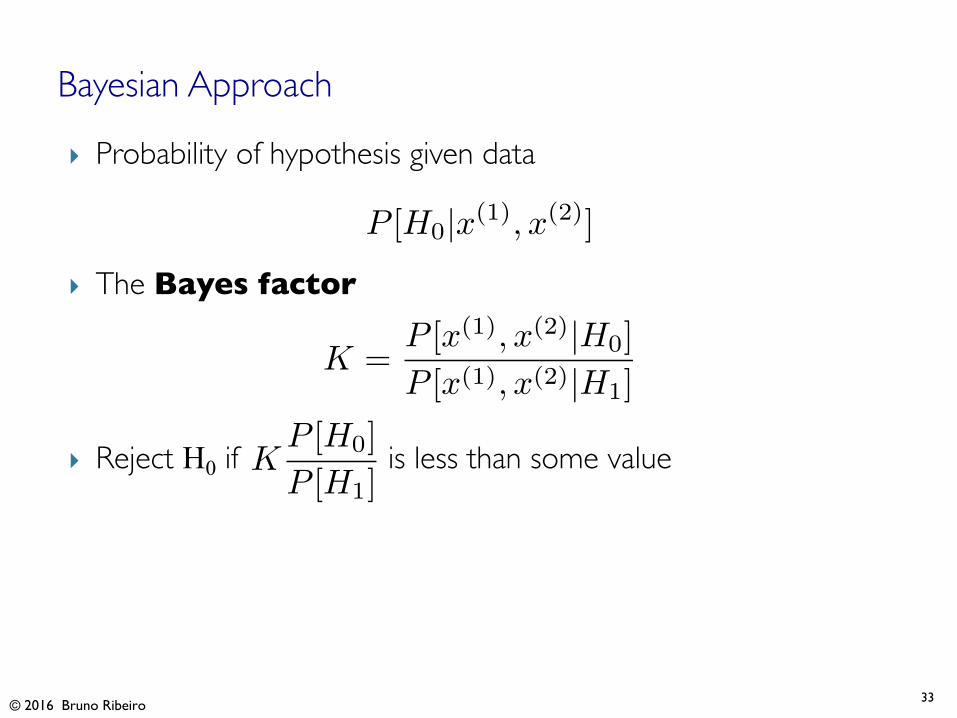
} Probability of hypothesis given data
} The Bayes factor
} Reject H0 if is less than some value
33
Bayesian Approach
P [H0|x(1), x(2)]
© 2016 Bruno Ribeiro
K =P [x(1), x(2)|H0]
P [x(1), x(2)|H1]
KP [H0]
P [H1]
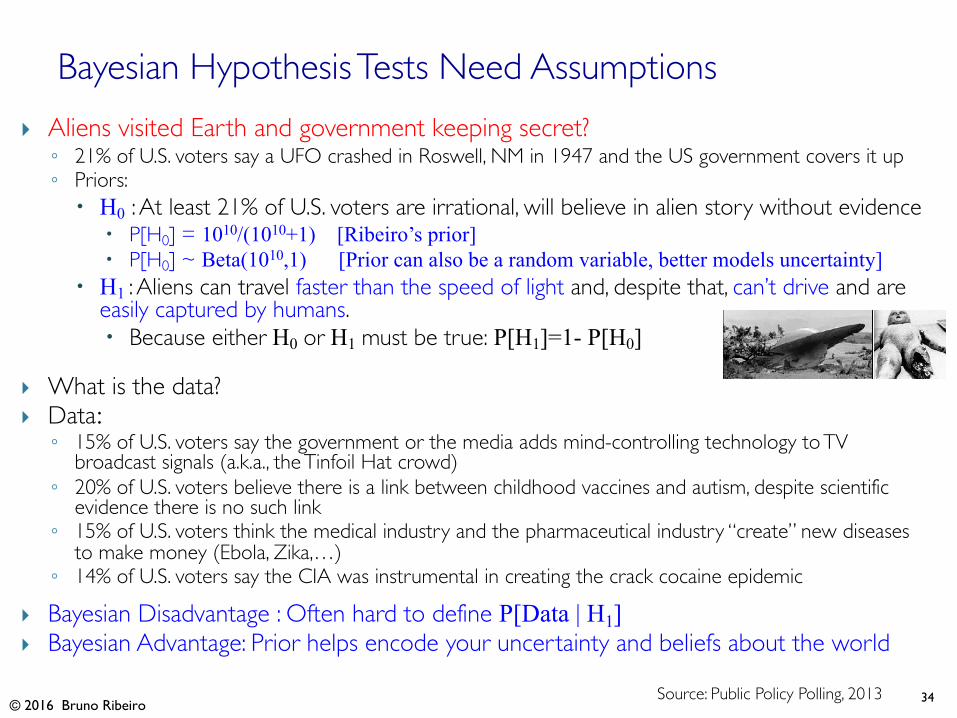
} Aliens visited Earth and government keeping secret?◦ 21% of U.S. voters say a UFO crashed in Roswell, NM in 1947 and the US government covers it up◦ Priors:
� H0 : At least 21% of U.S. voters are irrational, will believe in alien story without evidence� P[H0] = 1010/(1010+1) [Ribeiro’s prior]� P[H0] ~ Beta(1010,1) [Prior can also be a random variable, better models uncertainty]
� H1 : Aliens can travel faster than the speed of light and, despite that, can’t drive and are easily captured by humans.� Because either H0 or H1 must be true: P[H1]=1- P[H0]
} What is the data?} Data:◦ 15% of U.S. voters say the government or the media adds mind-controlling technology to TV
broadcast signals (a.k.a., the Tinfoil Hat crowd)◦ 20% of U.S. voters believe there is a link between childhood vaccines and autism, despite scientific
evidence there is no such link◦ 15% of U.S. voters think the medical industry and the pharmaceutical industry “create” new diseases
to make money (Ebola, Zika,…)◦ 14% of U.S. voters say the CIA was instrumental in creating the crack cocaine epidemic
} Bayesian Disadvantage : Often hard to define P[Data | H1]} Bayesian Advantage: Prior helps encode your uncertainty and beliefs about the world
34
Bayesian Hypothesis Tests Need Assumptions
Source: Public Policy Polling, 2013© 2016 Bruno Ribeiro
35
Next Two Classes:
Non-parametric TestsIndependence TestsTesting Multiple Hypotheses Sequential AnalysisMulti-armed Bandits
© 2016 Bruno Ribeiro
Nonparametric Test Procedures
} Not Related to Population ParametersExample: Probability Distributions, Independence
} Data Values not Directly UsedUses Ordering of Data
Examples: Wilcoxon Rank Sum Test , Komogorov-Smirnov Test
36© 2016 Bruno Ribeiro

37© 2016 Bruno Ribeiro
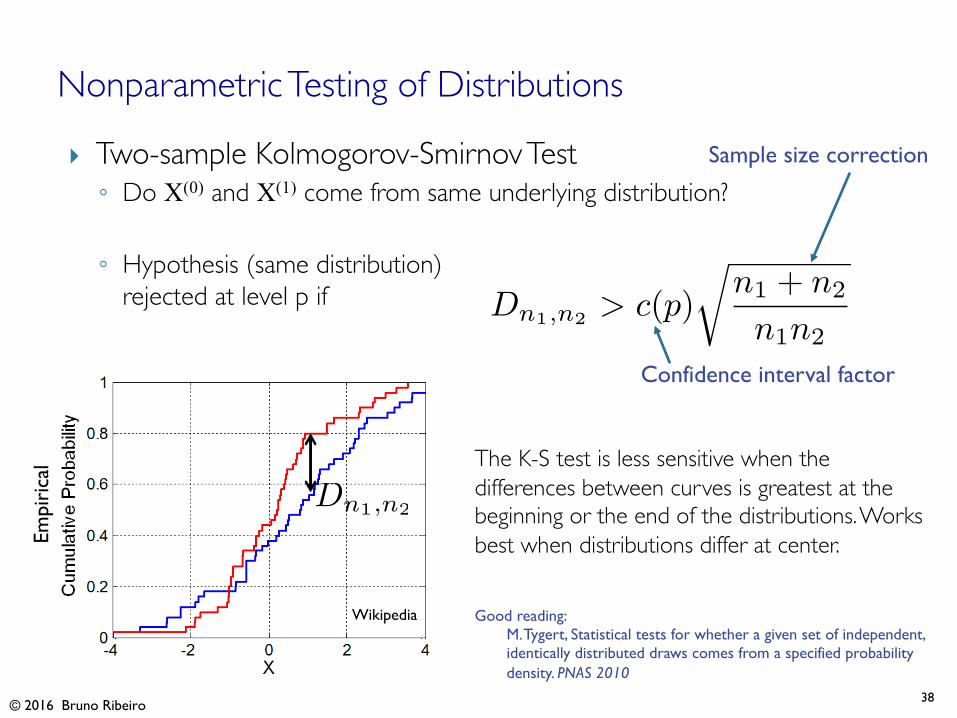
} Two-sample Kolmogorov-Smirnov Test◦ Do X(0) and X(1) come from same underlying distribution?
◦ Hypothesis (same distribution)rejected at level p if
38
Nonparametric Testing of Distributions
Wikipedia
Empi
rica
l
Confidence interval factor
Sample size correction
The K-S test is less sensitive when the differences between curves is greatest at the beginning or the end of the distributions. Works best when distributions differ at center.
Good reading: M. Tygert, Statistical tests for whether a given set of independent, identically distributed draws comes from a specified probability density. PNAS 2010
© 2016 Bruno Ribeiro
39© 2016 Bruno Ribeiro
} Twitter users can have gender and number of tweets.
} We want to determine whether gender is related to number of tweets.
} Use chi-square test for independence
Chi-Squared Test
40© 2016 Bruno Ribeiro
} When to use chi-square test for independence:◦ Uniform sampling design◦ Categorical features◦ Population is significantly larger than sample
} State the hypotheses:◦ H0 ?◦ H1 ?
When to use Chi-Squared test
41© 2016 Bruno Ribeiro
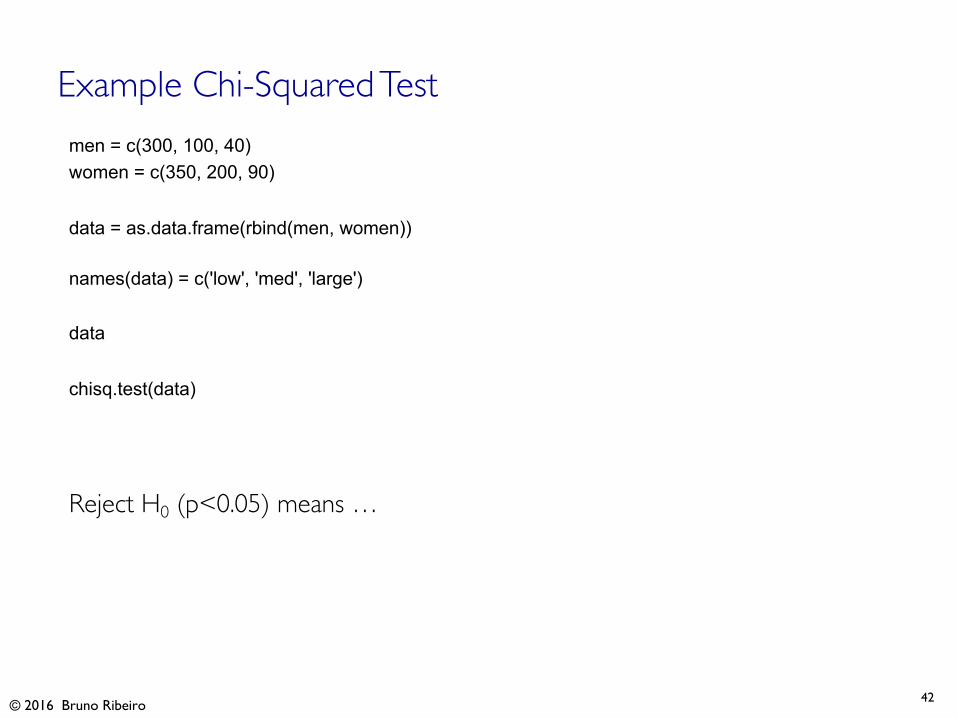
men = c(300, 100, 40) women = c(350, 200, 90)
data = as.data.frame(rbind(men, women))
names(data) = c('low', 'med', 'large')
data
chisq.test(data)
Reject H0 (p<0.05) means …
Example Chi-Squared Test
42© 2016 Bruno Ribeiro

43© 2016 Bruno Ribeiro
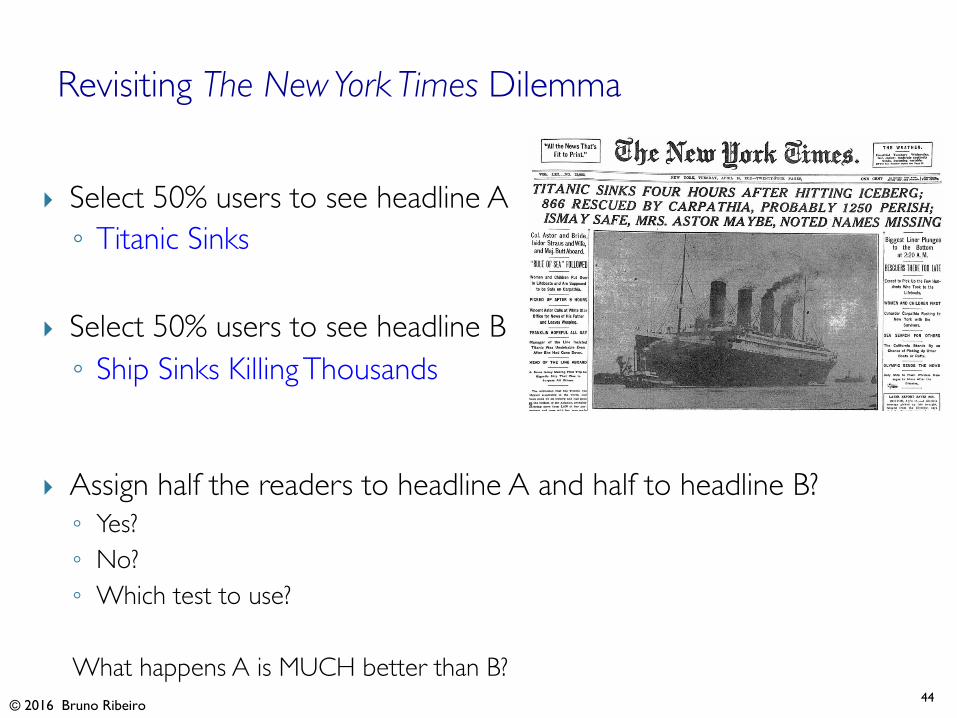
} Select 50% users to see headline A◦ Titanic Sinks
} Select 50% users to see headline B◦ Ship Sinks Killing Thousands
} Assign half the readers to headline A and half to headline B?◦ Yes?◦ No?◦ Which test to use?
What happens A is MUCH better than B?
Revisiting The New York Times Dilemma
44© 2016 Bruno Ribeiro
Recommended


