Journal of Fish Biology (2001) 59, 197–242doi:10.1006/jfbi.2001.1668, available online at http://www.idealibrary.com on
REVIEW PAPER
Accuracy, precision and quality control in agedetermination, including a review of the use and abuse of
age validation methods
S. E. C
Marine Fish Division, Bedford Institute of Oceanography, P.O. Box 1006, Dartmouth,Nova Scotia, Canada B2Y 4A2
(Received 6 March 2001, Accepted 21 May 2001)
Many calcified structures produce periodic growth increments useful for age determination atthe annual or daily scale. However, age determination is invariably accompanied by varioussources of error, some of which can have a serious effect on age-structured calculations. Thisreview highlights the best available methods for insuring ageing accuracy and quantifyingageing precision, whether in support of large-scale production ageing or a small-scale researchproject. Included in this review is a critical overview of methods used to initiate and pursue anaccurate and controlled ageing program, including (but not limited to) validation of an ageingmethod. The distinction between validation of absolute age and increment periodicity isemphasized, as is the importance of determining the age of first increment formation. Based onan analysis of 372 papers reporting age validation since 1983, considerable progress has beenmade in age validation efforts in recent years. Nevertheless, several of the age validationmethods which have been used routinely are of dubious value, particularly marginal incrementanalysis. The two major measures of precision, average percent error and coefficient ofvariation, are shown to be functionally equivalent, and a conversion factor relating the two ispresented. Through use of quality control monitoring, ageing errors are readily detected andquantified; reference collections are the key to both quality control and reduction of costs.Although some level of random ageing error is unavoidable, such error can often be correctedafter the fact using statistical (‘ digital sharpening ’) methods.
Key words: age determination; otolith; accuracy; precision; quality; validation.
Tel.: +1902 426 3233; fax: +1902 426 9710; email: [email protected]
INTRODUCTION
Age information forms the basis for calculations of growth rate, mortality rateand productivity, ranking it among the most influential of biological variables.Calculations as simple as that of growth rate, or as complex as that of virtualpopulation analysis, all require age data, since any rate calculation requires anage or elapsed time term. Radiochemical decay rates (Bennett et al., 1982),lipofuscin accumulation rates (Hammer & Braum, 1988) and amino acidracemization rates (Goodfriend, 1992) are sometimes used to infer the age of astructure or organism, but in most cases, periodic growth increments are countedto estimate the age. Tree rings are the archetypal ageing structure, and havebeen used not only to determine age and date of formation, but throughcross correlation with other trees, have been used to develop biochronologies
197
0022–1112/01/080197+46 $35.00/0
198 . .
extending over thousands of years (Kuniholm et al., 1996). Annual varves in icecores, sediments and stalagmites have been used to similar advantage (Bakeret al., 1993; Petterson et al., 1999; Rittenour et al., 2000). In the animalkingdom, annual or daily growth increments are used to estimate age andreconstruct growth rate in organisms and structures as diverse as bivalve shells(Lutz & Rhoads, 1980), coral skeletons (Dodge & Thomson, 1974), polychaetejaws (Olive, 1980), squid statoliths (Arkhipkin, 1997), cricket exoskeletons (Zuk,1987), jellyfish statoliths (Ueno et al., 1995), mammalian teeth (Goren et al.,1987), brittlestar skeletons (Gage, 1990) and tortoise scutes (Germano, 1998).Where the growth increments have formed in calcified structures, environmentalreconstruction based on incorporated trace elements and isotopes is also possible(Chivas et al., 1985; Holmden et al., 1997).
Several calcified structures produce periodic growth increments useful for agedetermination in fish. Scales (Robillard & Marsden, 1996), vertebrae (Brown &Gruber, 1988), fin rays (Cass & Beamish, 1983), cleithra (Casselman, 1990) andopercula (Baker & Timmons, 1991) have all been used to determine annual age,although it is the otolith which is applied over the broadest age range in manyspecies (Secor et al., 1995a). Campana & Thorrold (2001) estimated that wellover 1 million fish were aged worldwide in 1999, most of those using scales andotoliths. Such efforts dwarf those routinely applied to non-fish species, andhighlight the importance attributed to age-structured information in fisheriesscience.
Age determinations in fish can occur at one of two scales. Annual ageing isoften used in support of harvest calculations and population studies, and can bebased on any bony structure in the fish, although scales and otoliths are thestructures most frequently used (Casselman, 1987). In contrast, daily ageingbased on the otolith microstructure tends to be targeted more at recruitmentquestions and studies of young fish (Pannella, 1971; Campana & Neilson, 1985).Despite the difference in time scale, application and mode of formation, bothannual and daily age data are governed by similar rules of analysis, and aresusceptible to similar sources of error.
If growth increments in fish formed with the same consistency and clarity asthose in temperate trees, and if the basis for fish growth was as clearlyunderstood, population dynamics studies of fishes would be far more accuratethan is now the case. Unfortunately, the process of estimating fish ageincorporates two major sources of error: (a) a process error associated with thestructure being examined; not all bony structures in fish form a complete growthsequence throughout the lifetime of the animal, nor do all axes within a givenstructure show a complete growth record (Beamish, 1979). This type of error isusually biased towards under- or over-ageing; and (b) error due to the element ofsubjectivity required of all age estimations. This subjectivity originates with thepreparation and interpretation of the periodic features in the calcified structures,which can vary markedly among age readers and laboratories (Boehlert, 1985;Campana & Moksness, 1991). Interpretation error can be either biased orrandom. In combination, process and interpretation error can result in ageestimates that differ by as much as a factor of three among investigators (Parrish,1958; Campana et al., 1990; Nedreaas, 1990; Donald et al., 1992). Given thepresence of such errors, the use of the term ‘ age determination ’ rather than ‘ age
199
estimation ’ would appear to be a bit of a misnomer. Nevertheless, the formerterm is in broad use around the world, and we will continue to use it here for thesake of familiarity.
The prevalence and impact of inaccurate age determinations on the accuracyof population dynamics studies cannot be overstated (Lai & Gunderson, 1987;Rivard & Foy, 1987; Tyler et al., 1989; Bradford, 1991; Richards et al., 1992;Morison et al., 1998a). There are many instances in which ageing error hascontributed to the serious overexploitation of a population or species. Theproblem is often one of age underestimation (rather than overestimation),resulting in overly optimistic estimates of growth and mortality rate. Examplesinclude the orange roughy (Hoplostethus atlanticus Collett) off New Zealand thatwas fished intensively on the basis of a presumed longevity of 20–30 years (vanden Broek, 1983). It is now suspected of living to over 100 years with anextremely slow growth rate (Smith et al., 1995), but has already been fishedalmost to the point of population collapse. Similar problems plagued theSebastes spp fisheries off eastern and western Canada, which are only nowknown to reach ages of over 75 years (Chilton & Beamish, 1982; Campana et al.,1990), and thus less capable of supporting an intensive fishery. Ageing errorsmay also have contributed to errors in the population assessment of walleyepollock (Theragra chalcogramma Pallas) in the central Bering Sea, whose catchessubsequently declined from 1 400 000 tons to 10 000 tons in less than a decade(Beamish & McFarlane, 1995). While the above-cited disasters are among themost visible examples of ageing inaccuracies, there are literally dozens of otherscited in the literature which have resulted in serious scientific error (Summerfelt& Hall, 1987; Secor et al., 1995a).
A number of authors have outlined methods through which ageing accuracyand/or objectivity can be improved, both at the daily (Brothers, 1979; Campana& Neilson, 1985; Geffen, 1987; Baillon, 1992) and yearly level (Blacker, 1974;Boehlert, 1985; Casselman, 1987; Cailliet, 1990). The past decade in particularhas seen significant improvements in age determination protocols. At least someof these improvements can be attributed to Beamish & McFarlane’s (1983) pleafor age validation, in which they noted that only 66% of 500 publicationsreporting fish age estimates even attempted to corroborate the accuracy of theirages. A mere 3·4% were successful in doing so over the entire age range of thefish. The majority of published studies apparently assumed ageing accuracy,despite the fact that there was little basis for such an assumption.
Ageing error can be of two forms: error that affects accuracy, or thecloseness of the age estimate to the true value, and error that affects precision,or the reproducibility of repeated measurements on a given structure (Kalishet al., 1995). The two forms of error are not necessarily linked. For example,consistent underageing of a sample by one year can yield the same measureof precision as a sample that is, on average, aged accurately. In practice,the accuracy of a particular ageing methodology may be known (‘ agevalidation ’), but the accuracy of a particular set of age estimates is seldomknown. For these ‘ real world ’ samples, often consisting of large numbersof age determinations carried out at regular intervals [the ‘ production ageing ’of Morison et al. (1998b)], relative accuracy may be just as important asabsolute accuracy. For this reason, quality control monitoring is an important
200 . .
component of any large-scale ageing program (Campana et al., 1995; Morisonet al., 1998b).
The objective of this review is to highlight the best available methods forquantifying ageing accuracy and precision, whether in support of large-scaleproduction ageing or a small-scale research program. Included in this review isa critical overview of methods used to initiate an accurate and controlled ageingprogram, including (but not limited to) validation of an ageing method. Theoverview will not consider the strategy or protocol for collecting age data; thistopic has been well covered elsewhere (Chilton & Beamish, 1982; Morison et al.,1998b). Rather, the focus will be on a series of protocols for quality control,primarily involving reference collections, so that any errors in ageing are quicklydetected and corrected. The paper will then conclude with some statisticalapproaches for removing ageing error, and thus improving the quality of existingdata.
ACCURACY AND AGE VALIDATION
The term ‘ age validation ’ has been used misleadingly in many past papers.Although the absolute age of the fish is the goal of validation studies, seldom isthe age of the fish itself ever confirmed. Rather, it is the frequency of formationof a typical growth increment which is validated. The distinction betweenvalidating the periodicity of growth increment formation and absolute age isimportant. Beamish & McFarlane (1983) equated the validation of annulusperiodicity with age validation, but then went on to state that all age groups mustbe validated before ageing accuracy can be accepted. If implemented rigorously,validation of annulus formation in each and every age group would be equivalentto validation of absolute age. However, such rigour has seldom (ever?) beendisplayed. In a recent glossary of otolith terminology, Kalish et al. (1995) werecareful to note that age validation refers to validation of the method rather thanthe age, and that determining increment periodicity is only one part of themethod. Nevertheless, the vast majority of published works equate confirmationof increment periodicity with age validation. Indeed, of 372 papers reporting agevalidation since the year of Beamish & McFarlane’s (1983) paper, only 15%actually validated the absolute age of wild fish. More than 50% validated growthincrement periodicity for only a single group of ages, leaving increment period-icity unexamined for the most problematic groups: the oldest and/or youngestage groups. Yet it is the youngest and oldest fish which are often the mostdifficult to age accurately, and are most influential in estimates of growth,mortality or longevity.
Validation of an absolute age is equivalent to determining the accuracy of anage estimate. Determining the frequency of formation of a growth increment fora sample of fish is a necessary, but insufficient, step towards the verificationof that age estimate. To illustrate this insufficiency, consider the followingexamples. Steffensen (1980) used otolith microstructure examination to infer theage of juvenile cod (Gadus morhua L.). Daily growth increment formation hadalready been validated in cod, so the frequency of increment formation was notin question. However, Steffensen did not confirm the age of formation of thefirst visible increment, and because of methodological problems, failed to
201
observe the first 90 increments. The result was a mean age which was about 50%of the actual age, despite the fact that he used a ‘ validated ’ method. In a secondexample, Pratt & Casey (1983) used various methods to infer growth incrementperiodicity on the vertebrae of mako sharks (Isurus oxyrinchus Rafinesque).Data were limited, but were consistent with the view that two increments formedeach year in the vertebrae of the youngest sharks. Their subsequent examin-ations of the remaining mako vertebrae were thus based on the presumption ofbiannual increment formation, resulting in rapid apparent growth and lowlongevity for the oldest sharks, despite the fact that the validation was limited tothe youngest age groups. We now know that the interpretation of vertebraein young sharks is often problematic, and unlikely to be representative ofsubsequent growth (Natanson et al., 2001). Yet the approach they used wasconsidered (at the time) to have been validated.
Absolute age should be the preferred goal of any age validation study. Wherethis is not possible (and it often is not), two steps are recommended:
(1) Determine the age of first increment formation. In many cases, this willrequire knowledge of the early life history of the fish, and will seldom bepossible with the same experiment used to determine the frequency ofincrement periodicity. Even absolute age estimates are unlikely to providesufficient precision to unequivocally identify the first annual (daily)increment.
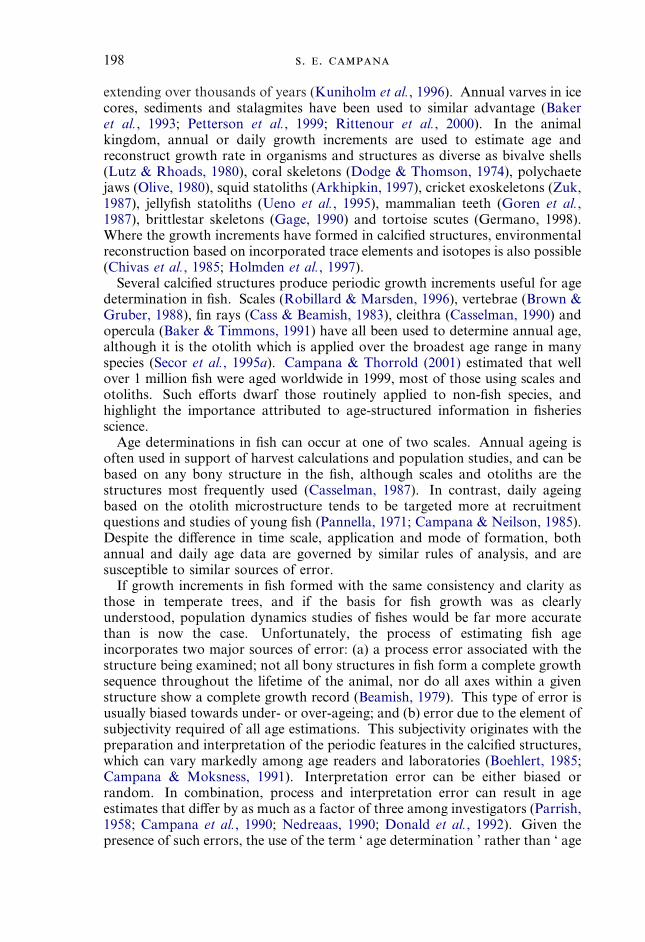
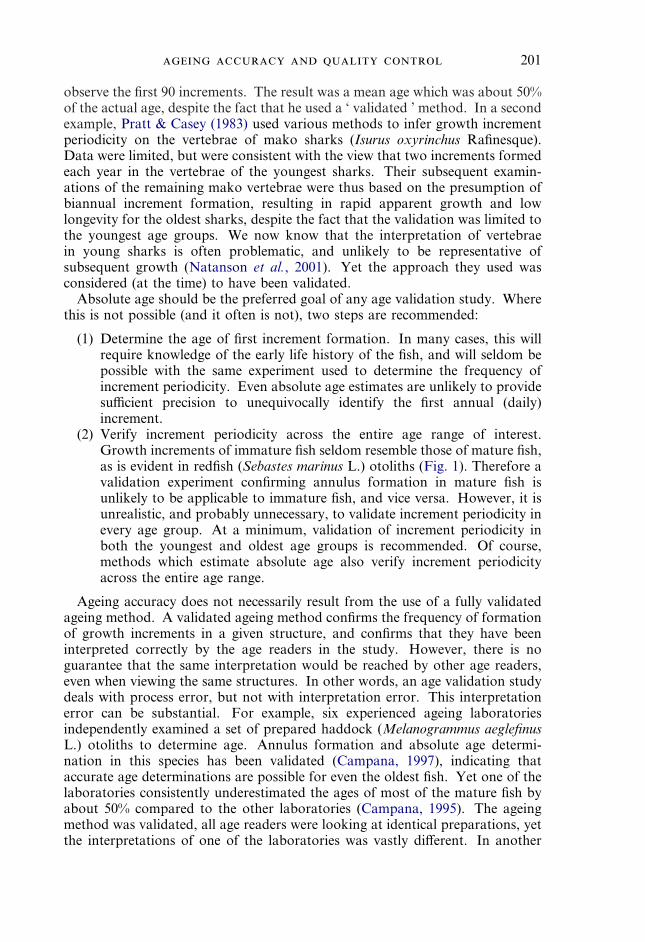
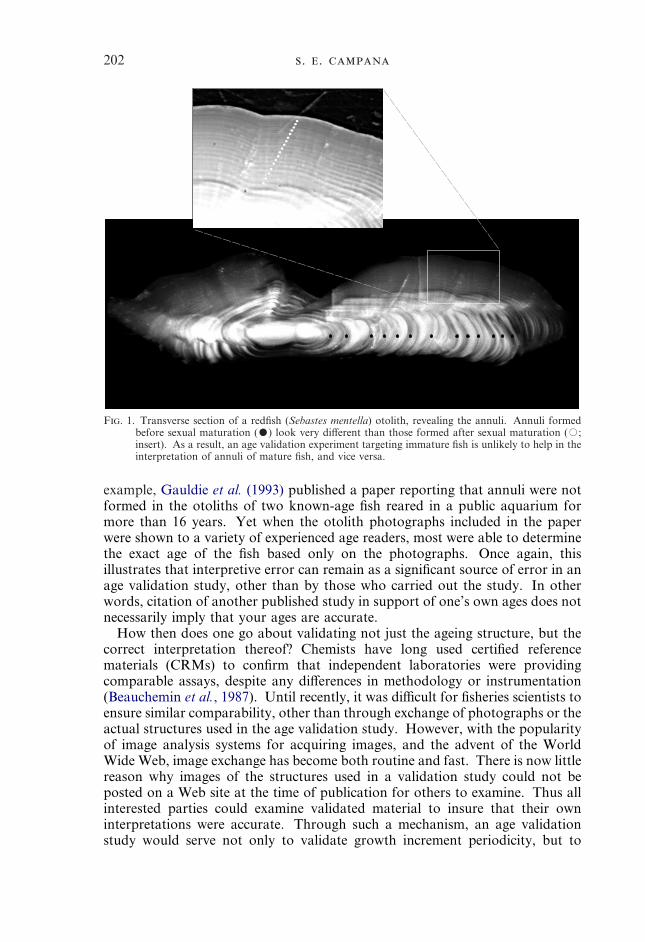
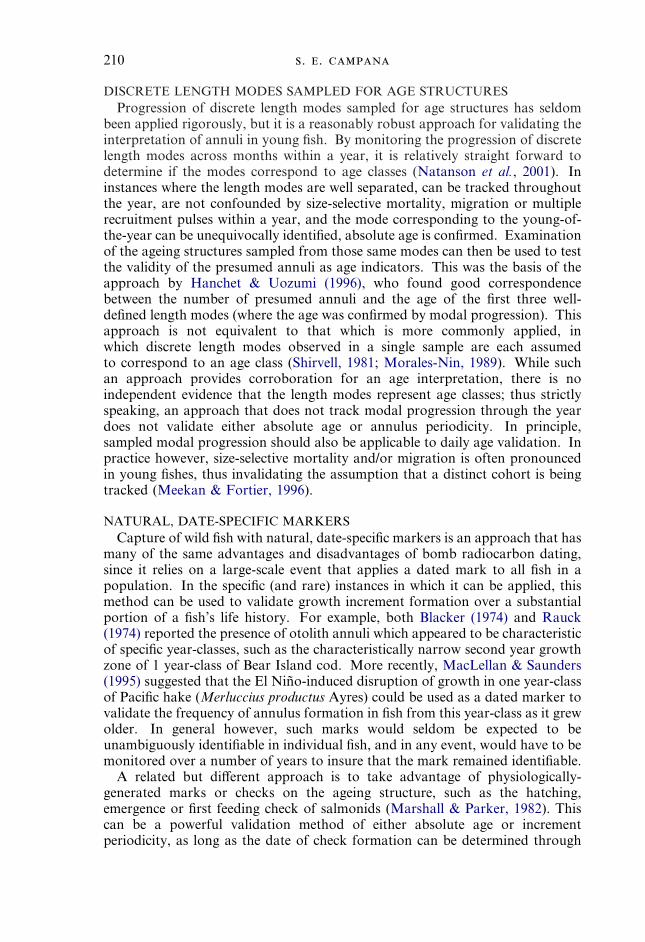
(2) Verify increment periodicity across the entire age range of interest.Growth increments of immature fish seldom resemble those of mature fish,as is evident in redfish (Sebastes marinus L.) otoliths (Fig. 1). Therefore avalidation experiment confirming annulus formation in mature fish isunlikely to be applicable to immature fish, and vice versa. However, it isunrealistic, and probably unnecessary, to validate increment periodicity inevery age group. At a minimum, validation of increment periodicity inboth the youngest and oldest age groups is recommended. Of course,methods which estimate absolute age also verify increment periodicityacross the entire age range.
Ageing accuracy does not necessarily result from the use of a fully validatedageing method. A validated ageing method confirms the frequency of formationof growth increments in a given structure, and confirms that they have beeninterpreted correctly by the age readers in the study. However, there is noguarantee that the same interpretation would be reached by other age readers,even when viewing the same structures. In other words, an age validation studydeals with process error, but not with interpretation error. This interpretationerror can be substantial. For example, six experienced ageing laboratoriesindependently examined a set of prepared haddock (Melanogrammus aeglefinusL.) otoliths to determine age. Annulus formation and absolute age determi-nation in this species has been validated (Campana, 1997), indicating thataccurate age determinations are possible for even the oldest fish. Yet one of thelaboratories consistently underestimated the ages of most of the mature fish byabout 50% compared to the other laboratories (Campana, 1995). The ageingmethod was validated, all age readers were looking at identical preparations, yetthe interpretations of one of the laboratories was vastly different. In another
202 . .
F. 1. Transverse section of a redfish (Sebastes mentella) otolith, revealing the annuli. Annuli formedbefore sexual maturation (�) look very different than those formed after sexual maturation (�;insert). As a result, an age validation experiment targeting immature fish is unlikely to help in theinterpretation of annuli of mature fish, and vice versa.
example, Gauldie et al. (1993) published a paper reporting that annuli were notformed in the otoliths of two known-age fish reared in a public aquarium formore than 16 years. Yet when the otolith photographs included in the paperwere shown to a variety of experienced age readers, most were able to determinethe exact age of the fish based only on the photographs. Once again, thisillustrates that interpretive error can remain as a significant source of error in anage validation study, other than by those who carried out the study. In otherwords, citation of another published study in support of one’s own ages does notnecessarily imply that your ages are accurate.
How then does one go about validating not just the ageing structure, but thecorrect interpretation thereof? Chemists have long used certified referencematerials (CRMs) to confirm that independent laboratories were providingcomparable assays, despite any differences in methodology or instrumentation(Beauchemin et al., 1987). Until recently, it was difficult for fisheries scientists toensure similar comparability, other than through exchange of photographs or theactual structures used in the age validation study. However, with the popularityof image analysis systems for acquiring images, and the advent of the WorldWide Web, image exchange has become both routine and fast. There is now littlereason why images of the structures used in a validation study could not beposted on a Web site at the time of publication for others to examine. Thus allinterested parties could examine validated material to insure that their owninterpretations were accurate. Through such a mechanism, an age validationstudy would serve not only to validate growth increment periodicity, but to
203
validate the interpretation of any and all age readers. The Web-posted imageswould then become the equivalent of an image CRM, and would do much toimprove ageing accuracy around the world.
AGE VALIDATION METHODS
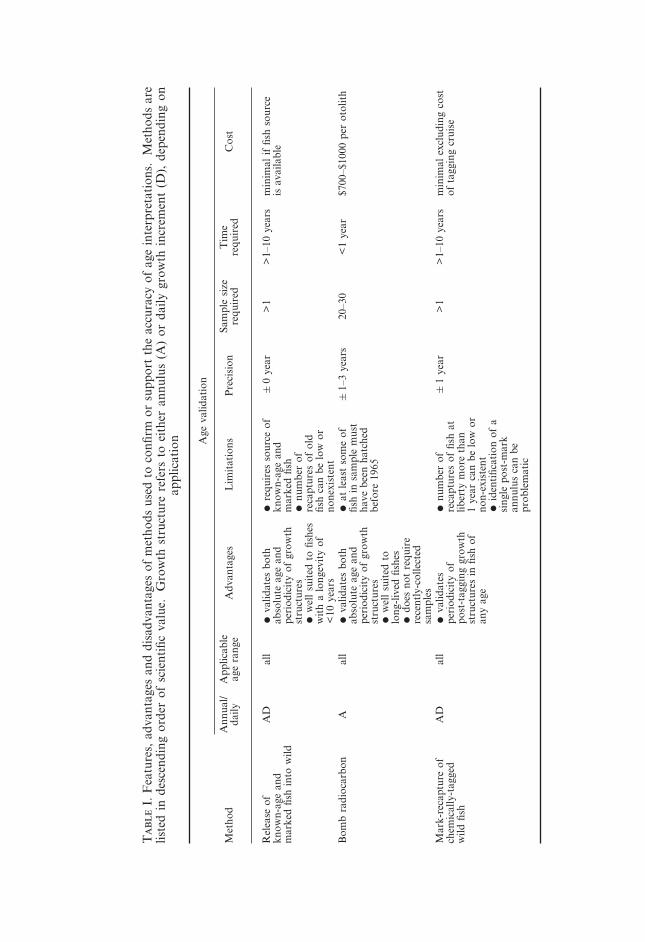
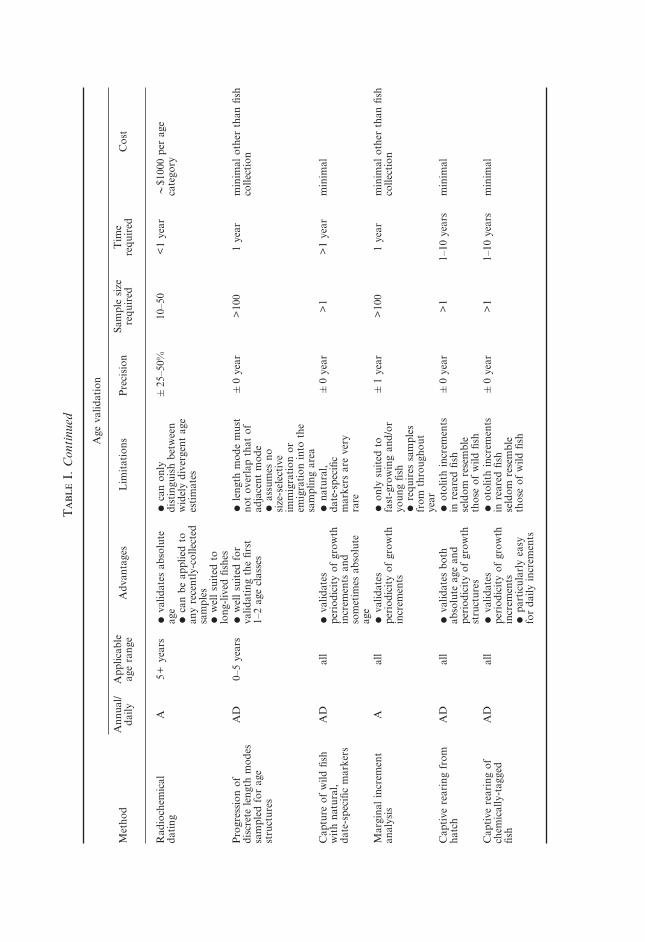
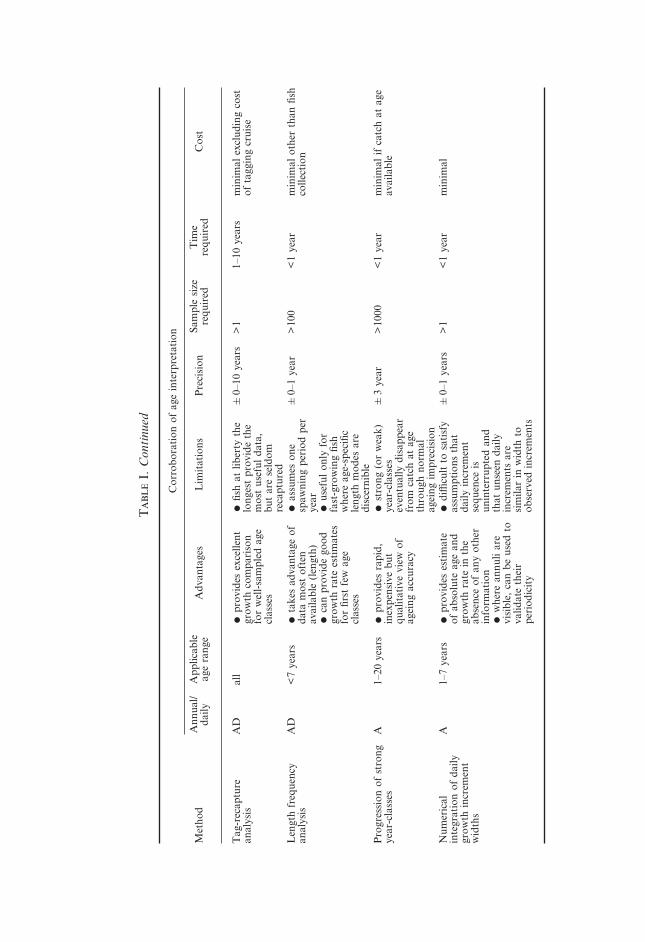
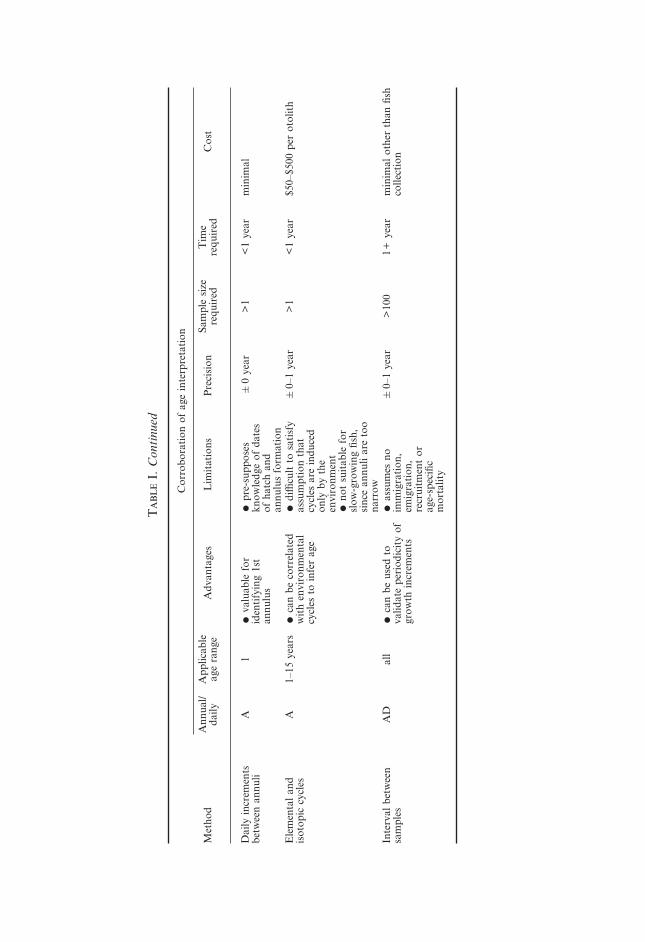
A variety of methods exist through which age interpretations can be validated(Table I). Although the distinction has often been blurred in the literature,methods can be classified as either validating absolute age, validating theperiodicity of growth increment formation, or of corroborating (but not validat-ing) an existing set of age estimates. Several reviews of age validation techniquessuitable for annual (Blacker, 1974; Bagenal & Tesch, 1978; Casselman, 1983,1987; Cailliet et al., 1986; Beamish & McFarlane, 1987; Baillon, 1992; Campana,1999) and daily ages (Brothers, 1979; Campana & Neilson, 1985; Jones, 1986;Geffen, 1987, 1992) have been published. Below is presented a critical appraisalof the various approaches, ordered (subjectively) by scientific value, withsuggestions for enhancing scientific rigour.
RELEASE OF KNOWN AGE AND MARKED FISHRelease of known age and marked fish into the wild is probably the most
rigorous of the age validation methods for many species, since the absolute ageof the recaptured fish is known without error. Since the released fish aregenerally less than 1 year old, recaptured fish will have spent the majority of theirlives in natural surroundings. Fish can be marked either externally, as in the caseof salmon with coded wire tags (Quinn et al., 1991), or immersion mass-markedusing temperature fluctuations (Volk et al., 1999) or chemicals (Campana, 1999)so as to leave a permanent mark on the bony structures used for ageing. Thisapproach is not well suited to long-lived species, since recapture rates of old fishtend to be minimal. Nor can this method be used on species which cannot bereared in captivity prior to release. Nevertheless, this method has been used withsuccess to confirm absolute age and growth increment formation at both thedaily (Tsukamoto & Kajihara, 1987; Secor et al., 1995b) and the yearly scale(Fitzgerald et al., 1997; Svedang et al., 1998).
There are two variations on this method which make it more widely availableat the expense of relatively minor assumptions. The first variation involves scaleremoval at the time of tagging and release of wild fish. Where tagging has beenrestricted to relatively young fish, and where scale annuli have been found to bereliable indicators of age at that young age, the removed scale can be used toestimate the age at tagging, and subsequently be added to the time at liberty toestimate the absolute age of the fish. Where the age at tagging is short comparedto the time at liberty, the advantage of this approach is that the wild tagged fisheffectively become known age at release and thus need not be reared in captivity(e.g. Matlock et al., 1993). A second variation on this theme involves the taggingof young fish where age can reasonably be approximated by size. This approachwas used by Lee & Prince (1995) in their study of bluefin tuna (Thunnus thynnusL.), whereby tuna estimated to be 1–3 years old at the time of tagging weresubsequently recaptured up to 15 years later. Although there was a �1 year
T
I.F
eatu
res,
adva
ntag
esan
ddi
sadv
anta
ges
ofm
etho
dsus
edto
confi
rmor
supp
ort
the
accu
racy
ofag
ein
terp
reta
tion
s.M
etho
dsar
elis
ted
inde
scen
ding
orde
rof
scie
ntifi
cva
lue.
Gro
wth
stru
ctur
ere
fers
toei
ther
annu
lus
(A)
orda
ilygr
owth
incr
emen
t(D
),de
pend
ing
onap
plic
atio
n Age
valid
atio
n
Met
hod
Ann
ual/
daily
App
licab
leag
era
nge
Adv
anta
ges
Lim
itat
ions
Pre
cisi
onSa
mpl
esi
zere
quir
edT
ime
requ
ired
Cos
t
Rel
ease
ofkn
own-
age
and
mar
ked
fish
into
wild
AD
all
�va
lidat
esbo
thab
solu
teag
ean
dpe
riod
icit
yof
grow
thst
ruct
ures
�w
ell
suit
edto
fishe
sw
ith
alo
ngev
ity
of<
10ye
ars
�re
quir
esso
urce
ofkn
own-
age
and
mar
ked
fish
�nu
mbe
rof
reca
ptur
esof
old
fish
can
belo
wor
none
xist
ent
�0
year
>1
>1–
10ye
ars
min
imal
iffis
hso
urce
isav
aila
ble
Bom
bra
dioc
arbo
nA
all
�va
lidat
esbo
thab
solu
teag
ean
dpe
riod
icit
yof
grow
thst
ruct
ures
�w
ell
suit
edto
long
-liv
edfis
hes
�do
esno
tre
quir
ere
cent
ly-c
olle
cted
sam
ples
�at
leas
tso
me
offis
hin
sam
ple
mus
tha
vebe
enha
tche
dbe
fore
1965
�1–
3ye
ars
20–3
0<
1ye
ar$7
00–$
1000
per
otol
ith
Mar
k-re
capt
ure
ofch
emic
ally
-tag
ged
wild
fish
AD
all
�va
lidat
espe
riod
icit
yof
post
-tag
ging
grow
thst
ruct
ures
infis
hof
any
age
�nu
mbe
rof
reca
ptur
esof
fish
atlib
erty
mor
eth
an1
year
can
belo
wor
non-
exis
tent
�id
enti
ficat
ion
ofa
sing
lepo
st-m
ark
annu
lus
can
bepr
oble
mat
ic
�1
year
>1
>1–
10ye
ars
min
imal
excl
udin
gco
stof
tagg
ing
crui
se
T
I.C
onti
nued
Age
valid
atio
n
Met
hod
Ann
ual/
daily
App
licab
leag
era
nge
Adv
anta
ges
Lim
itat
ions
Pre
cisi
onSa
mpl
esi
zere
quir
edT
ime
requ
ired
Cos
t
Rad
ioch
emic
alda
ting
A5
+ye
ars
�va
lidat
esab
solu
teag
e�
can
beap
plie
dto
any
rece
ntly
-col
lect
edsa
mpl
es�
wel
lsu
ited
tolo
ng-l
ived
fishe
s
�ca
non
lydi
stin
guis
hbe
twee
nw
idel
ydi
verg
ent
age
esti
mat
es
�25
–50%
10–5
0<
1ye
ar�
$100
0pe
rag
eca
tego
ry
Pro
gres
sion
ofdi
scre
tele
ngth
mod
essa
mpl
edfo
rag
est
ruct
ures
AD
0–5
year
s�
wel
lsu
ited
for
valid
atin
gth
efir
st1–
2ag
ecl
asse
s
�le
ngth
mod
em
ust
not
over
lap
that
ofad
jace
ntm
ode
�as
sum
esno
size
-sel
ecti
veim
mig
rati
onor
emig
rati
onin
toth
esa
mpl
ing
area
�0
year
>10
01
year
min
imal
othe
rth
anfis
hco
llect
ion
Cap
ture
ofw
ildfis
hw
ith
natu
ral,
date
-spe
cific
mar
kers
AD
all
�va
lidat
espe
riod
icit
yof
grow
thin
crem
ents
and
som
etim
esab
solu
teag
e
�na
tura
l,da
te-s
peci
ficm
arke
rsar
eve
ryra
re
�0
year
>1
>1
year
min
imal
Mar
gina
lin
crem
ent
anal
ysis
Aal
l�
valid
ates
peri
odic
ity
ofgr
owth
incr
emen
ts
�on
lysu
ited
tofa
st-g
row
ing
and/
oryo
ung
fish
�re
quir
essa
mpl
esfr
omth
roug
hout
year
�1
year
>10
01
year
min
imal
othe
rth
anfis
hco
llect
ion
Cap
tive
rear
ing
from
hatc
hA
Dal
l�
valid
ates
both
abso
lute
age
and
peri
odic
ity
ofgr
owth
stru
ctur
es
�ot
olit
hin
crem
ents
inre
ared
fish
seld
omre
sem
ble
thos
eof
wild
fish
�0
year
>1
1–10
year
sm
inim
al
Cap
tive
rear
ing
ofch
emic
ally
-tag
ged
fish
AD
all
�va
lidat
espe
riod
icit
yof
grow
thin
crem
ents
�pa
rtic
ular
lyea
syfo
rda
ilyin
crem
ents
�ot
olit
hin
crem
ents
inre
ared
fish
seld
omre
sem
ble
thos
eof
wild
fish
�0
year
>1
1–10
year
sm
inim
al
T
I.C
onti
nued
Cor
robo
rati
onof
age
inte
rpre
tati
on
Met
hod
Ann
ual/
daily
App
licab
leag
era
nge
Adv
anta
ges
Lim
itat
ions
Pre
cisi
onSa
mpl
esi
zere
quir
edT
ime
requ
ired
Cos
t
Tag
-rec
aptu
rean
alys
isA
Dal
l�
prov
ides
exce
llent
grow
thco
mpa
riso
nfo
rw
ell-
sam
pled
age
clas
ses
�fis
hat
liber
tyth
elo
nges
tpr
ovid
eth
em
ost
usef
ulda
ta,
but
are
seld
omre
capt
ured
�0–
10ye
ars
>1
1–10
year
sm
inim
alex
clud
ing
cost
ofta
ggin
gcr
uise
Len
gth
freq
uenc
yan
alys
isA
D<
7ye
ars
�ta
kes
adva
ntag
eof
data
mos
tof
ten
avai
labl
e(l
engt
h)�
can
prov
ide
good
grow
thra
tees
tim
ates
for
first
few
age
clas
ses
�as
sum
eson
esp
awni
ngpe
riod
per
year
�us
eful
only
for
fast
-gro
win
gfis
hw
here
age-
spec
ific
leng
thm
odes
are
disc
erni
ble
�0–
1ye
ar>
100
<1
year
min
imal
othe
rth
anfis
hco
llect
ion
Pro
gres
sion
ofst
rong
year
-cla
sses
A1–
20ye
ars
�pr
ovid
esra
pid,
inex
pens
ive
but
qual
itat
ive
view
ofag
eing
accu
racy
�st
rong
(or
wea
k)ye
ar-c
lass
esev
entu
ally
disa
ppea
rfr
omca
tch
atag
eth
roug
hno
rmal
agei
ngim
prec
isio
n
�3
year
>10
00<
1ye
arm
inim
alif
catc
hat
age
avai
labl
e
Num
eric
alin
tegr
atio
nof
daily
grow
thin
crem
ent
wid
ths
A1–
7ye
ars
�pr
ovid
eses
tim
ate
ofab
solu
teag
ean
dgr
owth
rate
inth
eab
senc
eof
any
othe
rin
form
atio
n�
whe
rean
nuli
are
visi
ble,
can
beus
edto
valid
ate
thei
rpe
riod
icit
y
�di
fficu
ltto
sati
sfy
assu
mpt
ions
that
daily
incr
emen
tse
quen
ceis
unin
terr
upte
dan
dth
atun
seen
daily
incr
emen
tsar
esi
mila
rin
wid
thto
obse
rved
incr
emen
ts
�0–
1ye
ars
>1
<1
year
min
imal
T
I.C
onti
nued
Cor
robo
rati
onof
age
inte
rpre
tati
on
Met
hod
Ann
ual/
daily
App
licab
leag
era
nge
Adv
anta
ges
Lim
itat
ions
Pre
cisi
onSa
mpl
esi
zere
quir
edT
ime
requ
ired
Cos
t
Dai
lyin
crem
ents
betw
een
annu
liA
1�
valu
able
for
iden
tify
ing
1st
annu
lus
�pr
e-su
ppos
eskn
owle
dge
ofda
tes
ofha
tch
and
annu
lus
form
atio
n
�0
year
>1
<1
year
min
imal
Ele
men
tal
and
isot
opic
cycl
esA
1–15
year
s�
can
beco
rrel
ated
wit
hen
viro
nmen
tal
cycl
esto
infe
rag
e
�di
fficu
ltto
sati
sfy
assu
mpt
ion
that
cycl
esar
ein
duce
don
lyby
the
envi
ronm
ent
�no
tsu
itab
lefo
rsl
ow-g
row
ing
fish,
sinc
ean
nuli
are
too
narr
ow
�0–
1ye
ar>
1<
1ye
ar$5
0–$5
00pe
rot
olit
h
Inte
rval
betw
een
sam
ples
AD
all
�ca
nbe
used
tova
lidat
epe
riod
icit
yof
grow
thin
crem
ents
�as
sum
esno
imm
igra
tion
,em
igra
tion
,re
crui
tmen
tor
age-
spec
ific
mor
talit
y
�0–
1ye
ar>
100
1+
year
min
imal
othe
rth
anfis
hco
llect
ion

208 . .
margin of error around the age estimate at the time of tagging, that margin wastoo small to change the conclusion that vertebral growth marks were formedannually after tagging.
BOMB RADIOCARBONBomb derived radiocarbon from nuclear testing provides one of the best age
validation approaches available for long-lived fishes (Kalish, 1993, 1995a, b;Kalish et al., 1996, 1997; Campana, 1997, 1999; Campana & Jones, 1998). Theonset of nuclear testing in the late 1950s resulted in an abrupt increase inatmospheric 14C, which was soon incorporated into corals, bivalves, fish andother organisms that were growing at the time. Thus the period is analogous toa large-scale chemical tagging experiment, wherein all otolith cores of fishhatched before 1958 contain relatively little 14C and all those hatched after 1968contain elevated levels. Fish born in the transition period contain intermediatelevels. As a result, the interpretation of the 14C chronology in a sample of otolithcores is relatively simple; the otolith-based 14C chronology spanning the 1960sshould match other published 14C chronologies for the region (whether fromotoliths or other calcified organisms) as long as the annular age assignments(=year-class) are correct. Any under-ageing would phase shift the otolith 14Cchronology towards more recent years, while over-ageing would phase shift ittowards earlier years. Otolith contamination with material of more recent origincan only increase the �14C value, not decrease it. Thus the otolith �14C valuesets a minimum age to the sample, and the years 1958–1965 become the mostsensitive years for �14C-based ageing. For fish born during this time period,bomb radiocarbon can be used to confirm the accuracy of more traditionalageing approaches with an accuracy of at least �1–3 years; the discriminatorypower of samples born before or after this period is more than an order ofmagnitude lower. Since the 14C signal recorded in deepsea and freshwaterenvironments is different from that of surface marine waters (deepsea=delayed;fresh water=advanced), reference 14C chronologies appropriate to the environ-ment experienced during the period of otolith core formation must be used(Kalish, 1995b; Campana & Jones, 1998). Clearly, this approach is not wellsuited to studies of short-lived (<5 years) species, in instances where thepresumed hatch dates do not span the 1960s, or in environments whereappropriate reference chronologies are not available. On the other hand, the lowradioactive decay rate of 14C implies that both archived and recent collectionsare appropriate for assay.
MARK-RECAPTURE OF CHEMICALLY-TAGGED FISHMark-recapture of chemically-tagged (OTC) wild fish is one of the best
methods available for validating the periodicity of growth increment formation.The method is based on rapid incorporation of calcium-binding chemicals suchas oxytetracyline, alizarin, calcein or strontium, applied at the time of tagging,into bones, scales, spines and otoliths (Campana, 1999). Application is throughimmersion, injection or feeding, although injection is the most practical methodfor tagging studies of wild fish (Geffen, 1982; Foreman, 1987; Francis et al.,1992; Oliveira, 1996). The result is a permanent mark, visible under fluorescentlight (except strontium), in the growth increment being formed at the time of
209
tagging. The number of growth increments formed distal to the chemical markis then compared to the time at liberty after tagging. This approach has beenused to validate annulus formation in a wide variety of structures and species,including sablefish otoliths (Beamish & Chilton, 1982), shark vertebrae (Brown& Gruber, 1988), pike cleithra (Casselman, 1974), spiny dogfish spines (Beamish& McFarlane, 1985), and coral reef fish otoliths (Fowler, 1990). The approachhas also been used successfully at the microstructural level, validating dailyincrement formation in a variety of tuna species (Wild & Foreman, 1980; Laurset al., 1985). A major advantage of this approach is that the growth incrementsbeing validated are formed while the fish is growing in a natural environment.Experiments in which fish are chemically-tagged and then reared in the labora-tory or an outside enclosure (Campana & Neilson, 1982; Schmitt, 1984) are lessoptimal, although they are logistically easier to carry out. A disadvantage of thechemical tagging approach is that the number of increments formed after taggingis often low, resulting in a potentially large relative error if one of the increments(such as that at the growing edge) is misinterpreted. For example, misinterpre-tation of a single growth zone in a fish at liberty 2 years would result in a 50%error, whereas the same misinterpretation in a fish at liberty 10 years would onlyproduce a 10% error. This effect was highlighted in a recent study in whichlong-term mark-recaptures detected problems with annulus identification thatwere not evident from short-term recaptures in the same study (Beamish &McFarlane, 2000). For this reason, fish tagged at a young age and recaptured atan old age provide the most robust validation results (Natanson et al., 2001).Notwithstanding the caveat that this method only validates growth incrementformation for the size/age of fish tagged, this is a powerful method, and one ofthe few readily applied to adult wild fishes.
RADIOCHEMICAL DATING
Radiochemical dating of otoliths is based on the radioactive decay of naturallyoccurring radioisotopes which are incorporated into the otolith during itsgrowth. Once incorporated into the otolith, the radioisotopes decay intoradioactive daughter products, which are themselves retained within the acellularcrystalline structure. Since the half-lives of the parent and daughter isotopes areknown (and fixed), the ratio between them is an index of elapsed time sinceincorporation of the parent isotope into the otolith. By restricting the assay tothe extracted otolith core (as opposed to the whole otolith), objective, accurateestimates of absolute age are possible (Bennett et al., 1982; Campana et al., 1990,1993; Fenton et al., 1990, 1991; Smith et al., 1991; Kastelle et al., 1994; Miltonet al., 1995; Burton et al., 1999; Campana, 1999). The isotopic concentrationsrequiring measurement are exceedingly low, resulting in assay precisions whichare often less than optimal, although recent methodological changes havesubstantially improved precision (Andrews et al., 1999). Current discriminatorypower is on the order of 5 years for 210Pb : 226Ra and 1–2 years for 228Th : 228Ra,over age ranges of 0–40 and 0–8 years, respectively. Therefore, this approach isbest suited to long-lived species where the candidate age interpretations arewidely divergent, such as in Sebastes or Hoplostethus (Campana et al., 1990;Fenton et al., 1991).
210 . .
DISCRETE LENGTH MODES SAMPLED FOR AGE STRUCTURESProgression of discrete length modes sampled for age structures has seldom
been applied rigorously, but it is a reasonably robust approach for validating theinterpretation of annuli in young fish. By monitoring the progression of discretelength modes across months within a year, it is relatively straight forward todetermine if the modes correspond to age classes (Natanson et al., 2001). Ininstances where the length modes are well separated, can be tracked throughoutthe year, are not confounded by size-selective mortality, migration or multiplerecruitment pulses within a year, and the mode corresponding to the young-of-the-year can be unequivocally identified, absolute age is confirmed. Examinationof the ageing structures sampled from those same modes can then be used to testthe validity of the presumed annuli as age indicators. This was the basis of theapproach by Hanchet & Uozumi (1996), who found good correspondencebetween the number of presumed annuli and the age of the first three well-defined length modes (where the age was confirmed by modal progression). Thisapproach is not equivalent to that which is more commonly applied, inwhich discrete length modes observed in a single sample are each assumedto correspond to an age class (Shirvell, 1981; Morales-Nin, 1989). While suchan approach provides corroboration for an age interpretation, there is noindependent evidence that the length modes represent age classes; thus strictlyspeaking, an approach that does not track modal progression through the yeardoes not validate either absolute age or annulus periodicity. In principle,sampled modal progression should also be applicable to daily age validation. Inpractice however, size-selective mortality and/or migration is often pronouncedin young fishes, thus invalidating the assumption that a distinct cohort is beingtracked (Meekan & Fortier, 1996).
NATURAL, DATE-SPECIFIC MARKERSCapture of wild fish with natural, date-specific markers is an approach that has
many of the same advantages and disadvantages of bomb radiocarbon dating,since it relies on a large-scale event that applies a dated mark to all fish in apopulation. In the specific (and rare) instances in which it can be applied, thismethod can be used to validate growth increment formation over a substantialportion of a fish’s life history. For example, both Blacker (1974) and Rauck(1974) reported the presence of otolith annuli which appeared to be characteristicof specific year-classes, such as the characteristically narrow second year growthzone of 1 year-class of Bear Island cod. More recently, MacLellan & Saunders(1995) suggested that the El Nino-induced disruption of growth in one year-classof Pacific hake (Merluccius productus Ayres) could be used as a dated marker tovalidate the frequency of annulus formation in fish from this year-class as it grewolder. In general however, such marks would seldom be expected to beunambiguously identifiable in individual fish, and in any event, would have to bemonitored over a number of years to insure that the mark remained identifiable.
A related but different approach is to take advantage of physiologically-generated marks or checks on the ageing structure, such as the hatching,emergence or first feeding check of salmonids (Marshall & Parker, 1982). Thiscan be a powerful validation method of either absolute age or incrementperiodicity, as long as the date of check formation can be determined through
211
independent observation, and as long as the identity of the check is unambigu-ous. In the salmonid example above, once an observer had noted the date ofemergence of a specific fish from the gravel, the emergence check had become adated mark on the otolith of that fish that could then be used to validate both theabsolute age and the frequency of formation of the daily increments formed untilthe date of capture. This method is probably better suited to daily incrementvalidation than to annulus validation, since hatch checks (Campana & Neilson,1985) and settlement marks (Wilson & McCormick, 1997) are common in somegroups of fishes. Nevertheless, analogous marks do exist in many older fish, suchas the otolith transition zone associated with the onset of sexual maturity(Francis & Horn, 1997). In all cases however, a key requirement is theindependent observation of the date of the physiological event, since without it,the check is associated with an age, but not a date of formation.
MARGINAL INCREMENT ANALYSISMarginal increment analysis (MIA) is the most commonly used, and the
most likely to be abused, of the validation methods. The underlying premise asa method for validating increment periodicity is sound: if a growth incrementis formed on a yearly (daily) cycle, the average state of completion of theoutermost increment should display a yearly (daily) sinusoidal cycle whenplotted against season (time of day) (e.g. Hyndes et al., 1992; Fowler & Short,1998; Morales-Nin et al., 1998; Carlson et al., 1999). The popularity of thismethod can be attributed to its modest sampling requirements and low cost.However, in many ways, this is one of the most difficult validation methods tocarry out properly, due to the technical difficulties associated with viewing apartial increment affected by variable light refraction through an edge whichbecomes increasingly thin as the margin is approached, as well as light reflectionoff the curved surface of the edge. The absence of an objective means ofinterpreting the data further complicates the situation. In their review of annulusseasonality studies, Beckman & Wilson (1995) interpreted the results of 104 MIAstudies, concluding that about 30% of the species from a given region formedannuli at times different than that of the other species. It is possible that annulidid not form in all of these species, or that the time of opaque zone formationvaried widely among species. Indeed, Beckman & Wilson (1995) highlighted thecurrent lack of understanding of the mechanisms underlying annulus formation.However, a more likely explanation is that the MIA technique itself was of lowresolving power. Even more problematic are studies which attempt to validatedaily increment formation with MIA, working near the resolution limit of light,and confounded by the presence of subdaily increments. Although daily MIAbased on transmission electron microscopy (Zhang & Runham, 1992) or usingotoliths with unusually broad increments (Jenkins & Davis, 1990) has somemerit, MIA studies of daily increments are, in general, of questionable value.
Marginal increment analysis is sometimes differentiated from edge analysis,but when used as a validation method, has similar properties. The marginalincrement is usually calculated as a proportional state of completion, rangingfrom near zero (an increment is just beginning to form) to one (a completeincrement has formed) as well as all values in between. When plotted as afunction of month or season, the mean marginal increment should describe
212 . .
a sinusoidal cycle with a frequency of one year in true annuli (Lehodey &Grandperrin, 1996; Vilizzi & Walker, 1999). Edge analysis does not assign astate of completion to the marginal increment, but rather records its presenceas either an opaque or translucent zone (van der Walt & Beckley, 1997;Labropoulou & Papaconstantinou, 2000). It is the change in relative frequencyof each edge zone which is plotted across months or seasons, but as with MIA,the cycle frequency should equal one year in true annuli. In both MIA and edgeanalysis, a yearly cycle of formation can be difficult to distinguish from otherfrequencies, contributing to their poor performance as validation methods.Changes in the seasonal timing of the marginal increment with age or locationundoubtedly contribute to the problem; significant and unexplained differencesamong years have also been noted (Pearson, 1996; Cappo et al., 2000). Despitethe problems inherent in their use for age validation, both MIA and edgeanalysis are well suited for determining the month or season of formation of theopaque or translucent zone once annulus formation has been validated throughindependent means (Pearson, 1996; Natanson et al., 2001).
There are several reasons why MIA may provide misleading results.Prominent among these is the fact that the marginal increment is most easilydiscerned in young, fast-growing fish, a life history stage where the marginalincrement may accurately confirm the formation of annual increments. Theproblem arises when the ‘ validation results ’ are later applied to older fish,contrary to the assumptions of all age validation methods. Many studies havereported age validation based on MIA of young fish, but noted that the sameageing structure and/or approach provided incorrect ages in older fish(Campana, 1984; Hyndes et al., 1992; Lowerre-Barbieri et al., 1994). Moretroublesome are the instances where age validation based on MIA of young fishlater evolved to form the basis for routine ageing of the species across all agegroups. For example, MIA of scales in young snapper (Pagrus auratus Blochand Schneider) quickly evolved to become the basis for all scale ageing of thespecies in several countries; OTC mark-recapture results later showed that scaleages underestimated true age in older fish (Francis et al., 1992). A nearlyidentical situation took place in the north-east Pacific, where all routine ageing ofsablefish (Anoplopoma fimbria Pallas) by several countries was based on scalesvalidated with MIA. It wasn’t until otolith OTC mark-recapture studies werecompleted that it was realized that scale ages were underestimating the age ofolder fish by up to a factor of four (McFarlane & Beamish, 1995). Note howeverthat MIA misuse is not restricted to scale ageing. Annuli in whole otoliths ofredfish (Sebastes spp.) were validated using MIA, and subsequently became anaccepted procedure of many organizations for ageing these long-lived fishes;subsequent validations have demonstrated that whole otoliths grossly under-estimate age in older fish (Campana et al., 1990). The conclusion is clear: whenproper age validation studies are lacking, researchers will often seize upon anyavailable studies which can corroborate their age interpretations. And sinceMIA is one of the few validation methods which is restricted to young,fast-growing fish, it is also the most likely to lead to serious ageing error whenapplied blind.
It is difficult to recommend the use of a technique where the data can beso subjectively interpreted. Nonetheless, the approach is valid if done with
213
sufficient rigour. Four aspects of a rigorous protocol appear to be important:(1) samples must be completely randomized before examination, with noindication to the examiner when the sample was collected; (2) a minimum of twocomplete cycles needs to be examined, in accordance with accepted methods fordetecting cycles; (3) the results must be interpreted objectively, extending wellbeyond the ‘ looks like a cycle to me ’ interpretation that is so commonly used.It is difficult to recommend one statistical test that would apply in all circum-stances, although a variety of useful options have been offered (Vilizzi & Walker,1999; Cappo et al., 2000). At a minimum however, there should be significantdifferences among some or all of the seasonal groups in each of the cyclesexamined; and (4) the MIA should be restricted to only a few age groups at atime, ideally only one. As noted by Hyndes et al. (1992) in a study of wholeotoliths, examination of a sample which includes young, annulus-producing fishand older, non-annulus producing fish can easily result in a significant annualcycle for the sample as a whole, despite the fact that the older fish by themselveswould not show such a cycle. In other words, the validation results should beconsidered to be age-specific.
CAPTIVE REARINGCaptive rearing is generally discounted as a reliable means of validating
annulus formation, but maintains some utility at the daily level. Laboratoryenvironments are seldom able to mimic natural environments, due to theirartificial photoperiods, temperature cycles, feeding schedules and limited spacefor diurnal vertical migrations. Since annulus formation is strongly influencedby the environment (Schramm, 1989; Beckman & Wilson, 1995), an artificialenvironment is likely to produce artificial annuli. Daily growth increments aremuch less affected by environmental conditions, due to the endocrine-drivenendogenous rhythm which controls their formation (Campana & Neilson, 1985).While laboratory environments are well known for resulting in daily incre-ments of altered appearance, the frequency of their formation is not generallyan issue unless the rate of growth is unnaturally low. For this reason,laboratory experiments to confirm daily increment formation of known-age orchemically-marked fish are common (Geffen, 1992).
Mesocosms, ocean pens and outside enclosures provide improved and morenatural rearing environments for validation studies than do indoor locations.For otolith microstructure studies in particular, outdoor rearing can be expectedto produce daily increments which are quasi-natural in appearance and fre-quency, although growth rates can be artificially high in hatchery operations(Campana & Neilson, 1982; Folkvord et al., 1997). At the annual level, outdoorrearing can also be expected to produce more natural-looking growth structures,although it has not yet been determined if annuli produced under suchconditions are equivalent to those of wild fish (Schramm, 1989).
FREQUENCY OF USE OF AGE VALIDATION METHODS
Each age validation method has advantages and disadvantages (Table I) whichwould be expected to influence the frequency of their use. Perhaps not
214 . .
0
Lab
-OT
C
120(b)
Kn
own
100
80
60
40
20
OT
C
Mod
es
MIA
0
60(a)
50
40
30
20
10
Nu
mbe
r of
stu
dies
Bom
b
Rad
io
Nat
ura
l
Lab
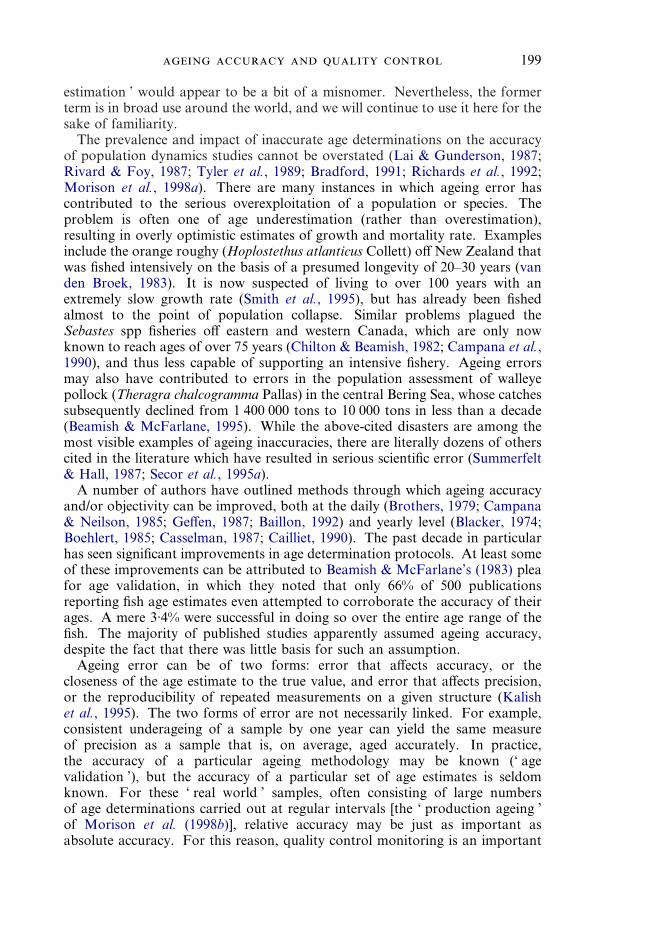
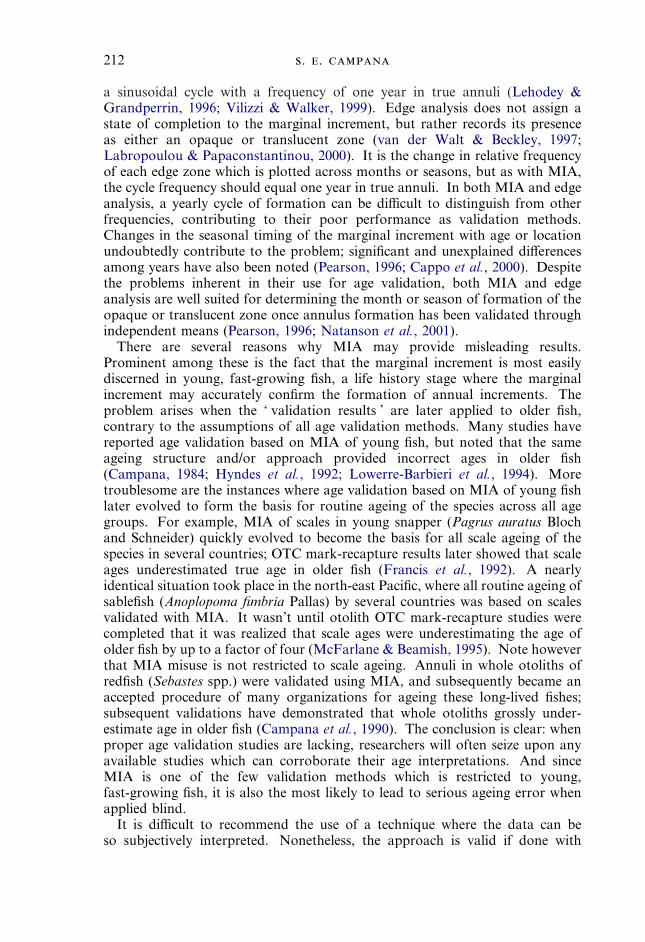
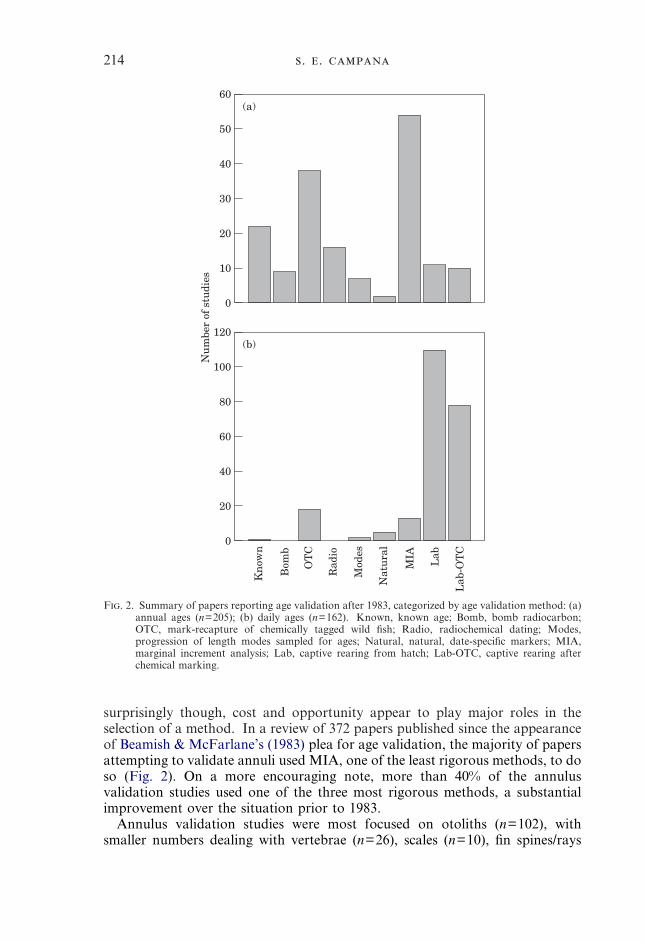
F. 2. Summary of papers reporting age validation after 1983, categorized by age validation method: (a)annual ages (n=205); (b) daily ages (n=162). Known, known age; Bomb, bomb radiocarbon;OTC, mark-recapture of chemically tagged wild fish; Radio, radiochemical dating; Modes,progression of length modes sampled for ages; Natural, natural, date-specific markers; MIA,marginal increment analysis; Lab, captive rearing from hatch; Lab-OTC, captive rearing afterchemical marking.
surprisingly though, cost and opportunity appear to play major roles in theselection of a method. In a review of 372 papers published since the appearanceof Beamish & McFarlane’s (1983) plea for age validation, the majority of papersattempting to validate annuli used MIA, one of the least rigorous methods, to doso (Fig. 2). On a more encouraging note, more than 40% of the annulusvalidation studies used one of the three most rigorous methods, a substantialimprovement over the situation prior to 1983.
Annulus validation studies were most focused on otoliths (n=102), withsmaller numbers dealing with vertebrae (n=26), scales (n=10), fin spines/rays
215
(n=9), bivalves (n=7), and others (n=13). However, validation methods werenot equitably distributed among ageing structures. More than 44% of the otolithannulus studies used MIA for validation, while only 17% of the studies on otherageing structures did so. Scale validation studies in particular tended to use veryrigorous techniques (known age, OTC mark-recapture), presumably because oftheir well documented failures in some species in the past (Beamish &McFarlane, 1987; Casselman, 1987).
Validation methods for daily growth increments require different approachesthan do those for annuli, so the selection of method would also be expected todiffer. More than 90% of the reported studies reared organisms in captivity tovalidate daily increment formation, either from hatch or after chemical marking(Fig. 2). As noted earlier, captive rearing is of greater scientific rigour in dailyincrement validation studies than in those on annuli, due to the lesser influenceof the environment on frequency of formation (Campana & Neilson, 1985).Nevertheless, the relative scarcity of validation studies on wild fish was some-what surprising. Otolith papers made up the bulk of the studies (n=186), butstudies on daily increments in squid statoliths (n=16), bivalves (n=2) and scales(n=1) used similar approaches. MIA was seldom used (6%), and then primarilyin otoliths.
With greater scientific quality, it is perhaps not surprising that some recentage validation results appeared to contradict earlier, less rigorous results.For example, Beamish & McFarlane (2000) reevaluated annulus formationon sablefish otoliths after extended periods at liberty after OTC tagging,and reported that annulus formation was not necessarily as clearcut ashad been reported earlier (McFarlane & Beamish, 1995). The differ-ence in interpretation was apparently due to the relatively short period afterrecapture in the earlier study, resulting in poor sensitivity. In a secondstudy, Wild et al. (1995) reported that daily increment formation becameinconsistent in large skipjack tuna (Katsuwonus pelamis L.), despite theresults of an earlier validation study (Uchiyama & Struhsaker, 1981). The1981 study was based on young, lab-reared tuna, while the 1995 report wasbased on a much more rigorous study of older, OTC-marked fish in the wild.Campana (1983) also reported non-daily increment formation in some starryflounder (Platichthys stellatus Pallas) otoliths, apparently contradicting anearlier report of daily increment validation (Campana & Neilson, 1982). Inthis case however, the difference in results was not due to a change inscientific rigour but to tests on starved fish. Nevertheless, these three setsof studies highlight the fact that not all age validation studies are createdequal, and that increased scientific rigour will always produce more reliableresults.
In summary, considerable progress appears to have been made since Beamish& McFarlane’s (1983) paper in attempts to validate age interpretations. Theincreased frequency of studies to validate absolute annual age and use chemicalmark-recapture are particularly encouraging. Nevertheless, additional work isclearly required. The heavy reliance and apparent abuse of MIA, particularly inthe otolith world, is disturbing. With respect to daily increment studies,additional studies using known age and chemically marked fish in their naturalenvironment appear to be needed.
216 . .
CORROBORATION OF AGE INTERPRETATIONS
Methods for age corroboration are not equivalent to those for age validation,since corroboratory methods support or are correlated with a particular methodof ageing, but are not directly or logically linked. As a result, it is entirelypossible to have an age corroboration method which reinforces an incorrect ageinterpretation. Nevertheless, a well designed corroboratory study can providevaluable support for a proper age validation study in confirming the accuracy ofan age estimate or method. The following briefly summarizes the major agecorroboration methods that are currently available, some of which have pre-viously been called (incorrectly) age validation methods. Advantages anddisadvantages of each approach are also shown in Table I.
TAG-RECAPTURE ANALYSISTag-recapture analysis, along with length frequency analysis, is a member of a
suite of methods which provides growth rate estimates which can be comparedwith those derived from annulus counts. The growth comparison is by inference,since none of the recaptured fish are of known age. Nonetheless, if sufficient tagreturns are available, and particularly if the capture and release sizes werecarefully measured, the resulting growth rate estimate is an important check onthe accuracy of the age determination method. The traditional method ofGulland & Holt (1959) uses a graph of annualized growth rate after taggingplotted against average length between tagging and recapture to calculate thevon Bertalanffy growth parameters, L� and K. This method has been widelyused (e.g. Thorson & Lacy, 1982; Natanson et al., 1999), but assumes vonBertalanffy growth, no measurement error and no seasonal variability in growthrate. A more rigorous approach is the GROTAG analysis of Francis (1988),which uses maximum likelihood methods to estimate growth rate, growthvariability and measurement error at two lengths. The approach properlydifferentiates between growth at length and growth at age, and produces reliablegrowth estimates, but at the cost of considerable recapture data (e.g. Francis &Francis, 1992; Natanson et al., 2001).
LENGTH FREQUENCY ANALYSISLength frequency analysis subsumes a variety of different length-based
methods, all of which produce estimates of growth rate. The corroborationoccurs when the resulting growth estimate is compared to that of the agedetermination method. Monitoring of the progression of length frequencymodes through time is one of the most basic of the length frequency analyseswhich is possible, and can be a reliable form of age corroboration in young,fast-growing fish (e.g. Morales-Nin & Aldebert, 1997). If monitoring occursthroughout the year, the results can be used to verify the annual frequency of thelength modes, even if the corresponding age structures are not sampled. Thesubsequent comparisons of length at age or growth rate between length-andage-based methods must then be considered reasonably robust. Substantiallyless robust is the simple observation of the position of length modes in a singlesample; in this approach, there is no confirmation that the modes actuallycorrespond to any age classes, let alone the identity of that age class (e.g. Shirvell,
217
1981). At a more advanced level, methods such as Multifan fit a von Bertalanffygrowth curve to multiple length frequency samples using maximum likelihoodestimation (Fournier et al., 1990). In instances where monthly length samplesare available throughout the year, this method is a valuable approach forintegrating multiple samples to produce estimates of growth rate (Francis &Francis, 1992). However, here as with the other length-based methods, theapproach is most suited for young, fast-growing fish where the length modes foreach age group are easily distinguished; Multifan will use the well-defined lengthmodes of the younger fish to fit a growth model to all fish, even if the lengthfrequency of the older fish is nonsensical. Size-selective migration into or out ofthe study area is not an allowable assumption of this, or any other length-basedmethod.
SAMPLING OF RECRUITMENT PULSESPeriodic sampling of recruitment pulses has proven valuable in annulus studies
of some long-lived fishes, although considerably less so at the daily level. Alsotermed ‘ progression of strong year-classes ’, the method compares the intervalbetween periodic (e.g. yearly) samples and the increase in the apparent modal ageof a recruitment pulse as determined through annulus counts. Where therecruitment pulses are sufficiently well-defined and there is no appreciableage-structured migration, mortality or age reader expectations (Beamish &McFarlane, 1995), the method can provide a strong, albeit qualitative, confir-mation of growth increment periodicity (Donald et al., 1992). For example,Morison et al. (1998a) clearly showed the otolith age-based modal progression oftwo strong year-classes over a 4 year sampling period, thus supporting thevalidity of the otolith-based ageing method. The method has also been usedat the daily level (Uozumi & Ohara, 1993), although the likelihood of age-structured mortality distorting the apparent hatch date of the recruitment pulseis higher in young-of-the-year fishes (Campana & Jones, 1992). Comparison ofthe collection interval between samples and the difference in mean ages of thosesame samples is a variation on the same theme, but without the advantage of awell-defined recruitment pulse. Comparison of observed hatch dates with thoseestimated from the otolith microstructure of young-of-the-year (Morales-Ninet al., 1999) is not a comparable measure of ageing accuracy, since it makes thedifficult assumption of no age- or date-specific mortality.
NUMERICAL INTEGRATION OF DAILY INCREMENT WIDTHSWhen the underlying assumptions are met, numerical integration of daily
increment widths is an ingenious method for estimating (or even validating)annual age in species for which annular growth increment counts are problematic(Ralston & Miyamoto, 1983; Ralston & Williams, 1989; Smith & Kostlan, 1991).The method is based on a random sample of daily increment widths along anuninterrupted growth axis of the otolith which, when integrated over theobserved length of the growth radius, must yield the daily age of the otolith andfish. However, the difficulty arises in assessing the validity of the underlyingassumptions. If the daily increment sequence is anything other than continuous,or if the measured (and presumably clear) increment widths are not represen-tative of the unmeasured (unclear) increments, the integration will fail, usually in
218 . .
the form of underageing. While these assumptions have been ignored bysome (Gauldie, 1994), it is difficult to overstate their importance. In general,daily increment sequences become increasingly likely to become interrupted infish older than 1 year (Campana & Neilson, 1985), rendering the numericalintegration method more useful for age corroboration than for validation.
DAILY INCREMENT COUNTSDaily increment counts between presumed annuli can provide strong
corroboration of the frequency of formation of the annuli, subject to the sameassumptions of the numerical integration method. In this method however, allincrements are examined and counted, making the assumptions of the approachsomewhat easier to test. Daily increment formation must also be assumed, butthis assumption is reasonably safe compared to that of sequence continuity. Incases where approximately 365 daily increments are counted between presumedannuli, a conclusion of annulus formation seems reasonably sound (e.g.Morales-Nin, 1988; Wilson, 1988). However, no conclusions can be drawn fromotoliths in which markedly more or fewer increments are counted, since the resultcould reflect either the formation of non-annuli, misinterpretation of the dailyincrements, or an interrupted growth increment sequence.
ELEMENTAL AND ISOTOPIC CYCLESElemental and isotopic cycles have sometimes been observed in association
with presumed annuli (Casselman, 1983; Cailliet et al., 1986; Stevenson & Secor,1999), but as a form of age corroboration, they are purely correlative. Regularfluctuations in calcium, phosphorus or oxygen isotopes may well be reflectingenvironmental fluctuation, but whether they do so on an annual basis is subjectto conjecture. It is generally accepted that annulus formation reflects annularvariations in growth rate, but the frequent presence of pseudoannuli in manycalcified structures indicates that those growth variations need not be annual.Since growth rate may also influence the deposition of some elements andisotopes (Campana, 1999), it is reasonable to expect that chemical cycles wouldmirror observed growth increments, whether or not those increments are formedannually. As a result, chemical cycles would appear useful for confirming thepresence of visually-observed growth increments, but of limited value forinferring the periodicity of those increments.
OTHER METHODSMethods which are neither validation nor corroboration are sometimes
reported as such in the literature, but may actually serve some other purpose.For example, back-calculated lengths are useful for reducing the effect ofsize-selective sampling bias on the length estimates for the youngest fish in thesample, inferring the diameter of the first annulus, and providing a continuoussequence of lengths for a growth curve (e.g. Wintner & Cliff, 1999). However,the similarity of back-calculated lengths across several ageing structures in noway validates or corroborates any age interpretation; it merely shows consistencyin the interpretation of the sequence of growth increments, independent ofwhether or not the interpretation is correct. Similarly, if the radius of a givengrowth increment is shown to form consistently at a particular ‘ age ’ (e.g.
219
Collins et al., 1989; Morales-Nin, 2000), those results indicate that the incrementis probably biologically meaningful (e.g. perhaps an annulus, perhaps a settlingcheck), but its identity as an annulus remains unknown.
Comparison of multiple ageing structures within each fish is also a form of agenon-corroboration. While structure comparisons are very useful during theselection of a preferred ageing method, consistency among within-fish growthstructures is the rule rather than the exception. This is not surprising given thatthe growth of all structures within a given fish tends to be influenced by the sameenvironmental and physiological factors.
VALIDATION OF THE FIRST GROWTH INCREMENT
Identification of the first, or innermost, growth increment is an importantcomponent of any age validation study. In studies which have validatedincrement periodicity rather than absolute age (as in chemical tagging studies),validation of the first increment is a mandatory adjunct to age determination;without a correctly defined starting point, age determinations will be consistentlywrong by a constant amount. For example, uncertainty over the identification ofthe first vertebral annulus in porbeagle shark (Lamna nasus Bonnaterre) in twoindependent studies resulted in size at age estimates which consistently differedby one year (Francis & Stevens, 2000; Natanson et al., 2001). Even in caseswhere absolute age has been validated, reliable identification of the firstincrement can substantially increase the precision of any individual age determi-nation. Increased precision is particularly important for age determinations ofyoung fish, where a random error of 1 year can introduce unacceptable error intoall individual age estimates, even though the mean is still correct. Identificationof the first annulus is often more problematic than that of the first daily growthincrement, since the latter is often clearly visible as a hatch check (Campana &Neilson, 1985).
In principle, identification and validation of the first growth increment canproceed using any of the age validation methods described earlier. In practicethough, only a subset of the available methods possess the necessary precision.Release of known age or chemically-marked young-of-the-year (YOY) fish iswell suited to this type of application (Ferrell et al., 1992; Fitzgerald et al., 1997).For annulus studies, modal progression with age subsampling is also straightforward and accurate; monitoring the modal length of the presumed YOY (forexample, through periodic research surveys) confirms their identity as YOY,while inspection of the marginal increment in those same YOY in the season ofannulus formation confirms the formation of the presumed first annulus (Ferrellet al., 1992). Since the marginal increment in YOY fish can sometimes bedifficult to distinguish from false checks, a practical alternative is to measure thediameter of the YOY ageing structure (along the axis used for ageing) at the timeof annulus formation to determine the expected diameter of the first annulus(Natanson et al., 2001). Clearly, this approach requires independent knowledgeof the season of annulus formation in that species and location, although thatinformation can be gained from MIA of older fish (Beckman & Wilson, 1995).Validation of the first daily growth increment is even more straight forward,

220 . .
���
��
������� ������
������ �� ���� �������
� �� �
����
�����
�
��
��
������������
���� ��� ����������� �
�
�� ��!�"���#
$���
%�%
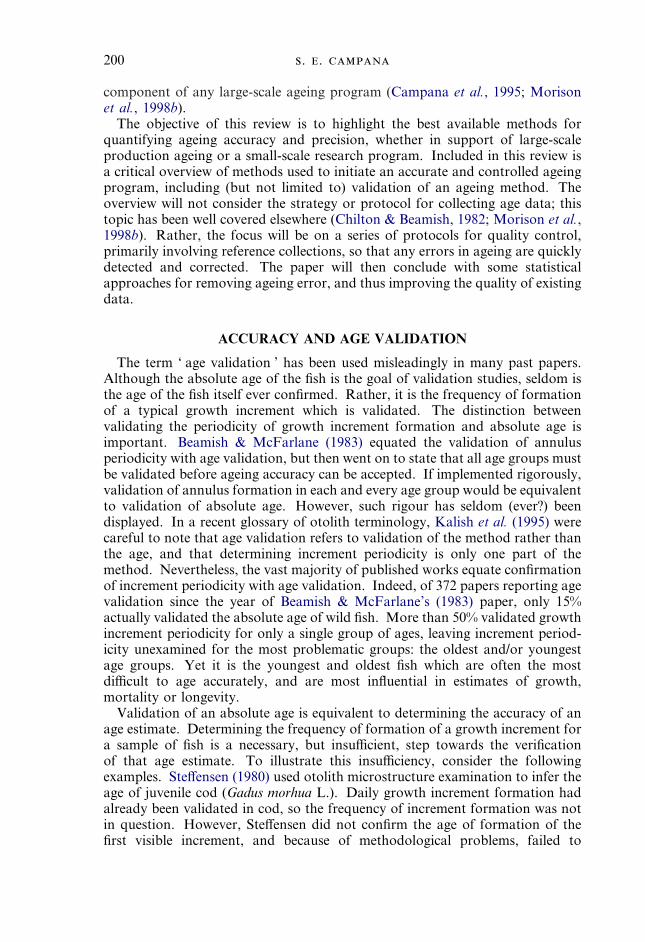
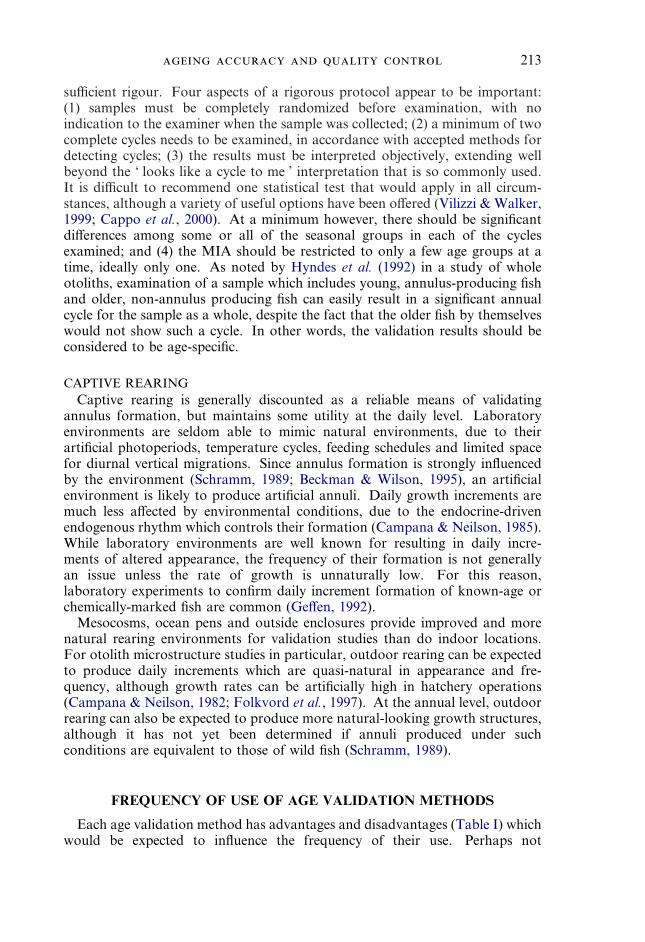
F. 3. Schematic diagram of an approach to validate the identity of the first annulus. Using the modecorresponding to the young-of-year (YOY) fish in a length-frequency sample collected around thetime of annulus formation, annulus diameter is predicted on the basis of a fish length-otolith lengthregression (determined using the same or different samples). Predicted annulus diameter is thenoverlayed onto a series of otoliths to identify the growth increment which most closely correspondsin diameter.
requiring only samples of larvae hatched in captivity to identify the hatch orfirst-feeding check (Campana, 1989; Moksness, 1992).
In instances where ageing structures cannot be collected from YOY in theseason when their first annulus is being formed, a variation on the modalprogression validation approach is possible. This approach requires an estimateof mean YOY fish length in the season of annulus formation (e.g. around thefirst birthday). When this estimate is inserted into a fish length-otolith lengthregression, the mean expected diameter of the first annulus can be predicted(Fig. 3). It then becomes a simple matter to overlay the expected annulusdiameter on probable first annuli in the otolith. This approach has been used tovalidate the position of the first annulus in both anchovy (Sardinops sagaxJenyns) (Spratt, 1975) and haddock otoliths (Campana, 1997).
In species with a clearly interpretable otolith microstructure, daily incrementcounts can often be used to confirm the identity of the first annulus (Waldron,1994; Griffiths, 1996; Lehodey & Grandperrin, 1996). Since the incrementcounts need not be made with great accuracy, this is a robust approach as longas the approximate dates of hatch and annulus formation are known. Theunderlying assumption of an uninterrupted growth sequence must be satisfied,but daily increment formation is usually continuous during the first 6 months oflife (Campana & Neilson, 1985). Since daily increments often become unresolv-able during the winter months (Francis et al., 1992), this method is most suitedto the identification of the beginning of the winter growth zone, rather than itsend.
Taking advantage of the fact that otoliths first appear in the embryonic stageof the fish, Morison et al. (1998a) used an otolith weight-age regression todetermine if the first annulus had been correctly identified; a regression intercept
221
closest to zero was considered most consistent with accurate ageing. However,the basis for this method was not well established, and it was not at all clearthat the method was sufficiently sensitive to detect anything other than grosserrors.
INTERPRETATION OF THE MARGINAL GROWTH INCREMENT
Correct interpretation of the edge type influences ageing accuracy at the yearlylevel, since an annulus on the margin of a structure collected just after theassigned birthday can be given a different age assignment than the same structurecollected just before the birthday. Although it has been suggested that edge typeidentification is a component of age validation (Francis et al., 1992), themarginal increment does not require validation independent of that of any of theother growth increments. Thus it is more correct to say that the age assignmentof a fish is a function not only of annulus count, but of edge type in relation todate of collection and assigned birth date. The protocols for handling edge typein relation to growth axis and collection date are more fully discussed elsewhere(Morison et al., 1998a; Cappo et al., 2000), as is the need to consider edge typeon a stock-specific basis (Pearson, 1996). Casselman (1990) has automated thecalculation of age from annulus count, edge type and collection date, so as toremove the possibility of calculation error from the age reader.
AGEING PRECISION
Precision is defined as the reproducibility of repeated measurements on a givenstructure, whether or not those measurements (age readings) are accurate. It isnot unusual for inaccurate age readings to be highly reproducible (in otherwords, precisely wrong) or to show no relationship between accuracy andprecision (Campana et al., 1990; Campana & Moksness, 1991; Campana, 1995).Therefore, precision cannot be used as a proxy for accuracy. Nevertheless, ameasure of precision is a valuable means of assessing the relative ease ofdetermining the age of a particular structure, of assessing the reproducibility ofan individual’s age determinations, or of comparing the skill level of one agerrelative to that of others.
There are two widely used and statistically sound measures of ageing precision:average percent error (APE) and coefficient of variation (CV). Although percentagreement is the traditional index of ageing precision, many authors havepointed out its inadequacies (Beamish & Fournier, 1981; Chang, 1982; Kimura& Lyons, 1991; Campana et al., 1995). The failure of percent agreement as ameasure of precision is largely due to the fact that it varies so widely both amongspecies and among ages within a species. Beamish & Fournier (1981) illustratedthis point by noting that 95% agreement to within one year between two agereaders of Pacific cod Gadus macrocephalus Tilesius constituted poor precision,given the few yearclasses in the fishery. On the other hand, 95% agreement towithin 5 years would constitute good precision for spiny dogfish Squalusacanthias L., given its 60 year longevity. Thus, Beamish & Fournier (1981)recommended the use of average per cent error (APE), defined as:
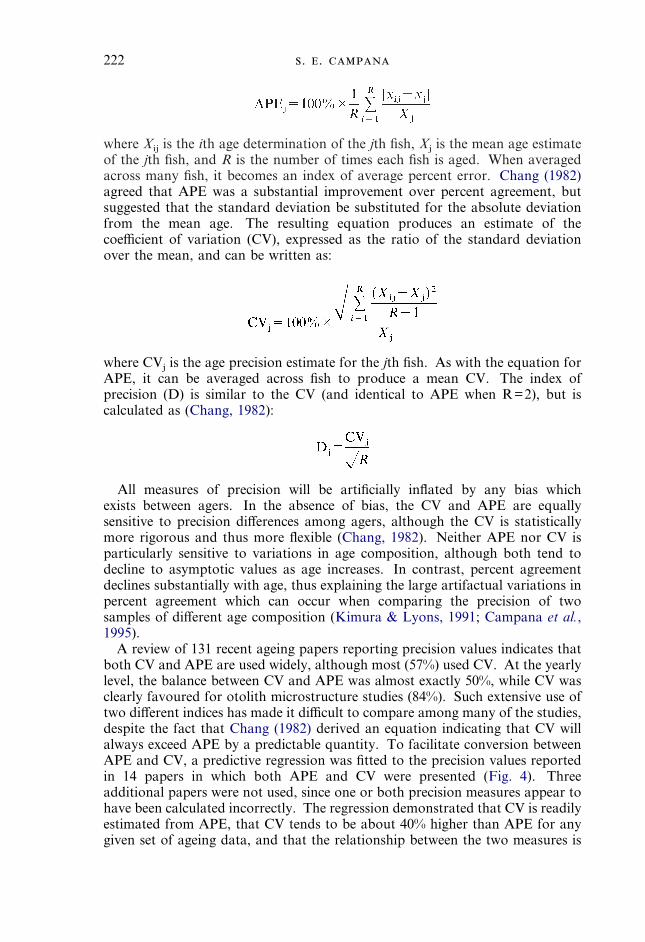
222 . .
where Xij is the ith age determination of the jth fish, Xj is the mean age estimateof the jth fish, and R is the number of times each fish is aged. When averagedacross many fish, it becomes an index of average percent error. Chang (1982)agreed that APE was a substantial improvement over percent agreement, butsuggested that the standard deviation be substituted for the absolute deviationfrom the mean age. The resulting equation produces an estimate of thecoefficient of variation (CV), expressed as the ratio of the standard deviationover the mean, and can be written as:
where CVj is the age precision estimate for the jth fish. As with the equation forAPE, it can be averaged across fish to produce a mean CV. The index ofprecision (D) is similar to the CV (and identical to APE when R=2), but iscalculated as (Chang, 1982):
All measures of precision will be artificially inflated by any bias whichexists between agers. In the absence of bias, the CV and APE are equallysensitive to precision differences among agers, although the CV is statisticallymore rigorous and thus more flexible (Chang, 1982). Neither APE nor CV isparticularly sensitive to variations in age composition, although both tend todecline to asymptotic values as age increases. In contrast, percent agreementdeclines substantially with age, thus explaining the large artifactual variations inpercent agreement which can occur when comparing the precision of twosamples of different age composition (Kimura & Lyons, 1991; Campana et al.,1995).
A review of 131 recent ageing papers reporting precision values indicates thatboth CV and APE are used widely, although most (57%) used CV. At the yearlylevel, the balance between CV and APE was almost exactly 50%, while CV wasclearly favoured for otolith microstructure studies (84%). Such extensive use oftwo different indices has made it difficult to compare among many of the studies,despite the fact that Chang (1982) derived an equation indicating that CV willalways exceed APE by a predictable quantity. To facilitate conversion betweenAPE and CV, a predictive regression was fitted to the precision values reportedin 14 papers in which both APE and CV were presented (Fig. 4). Threeadditional papers were not used, since one or both precision measures appear tohave been calculated incorrectly. The regression demonstrated that CV is readilyestimated from APE, that CV tends to be about 40% higher than APE for anygiven set of ageing data, and that the relationship between the two measures is
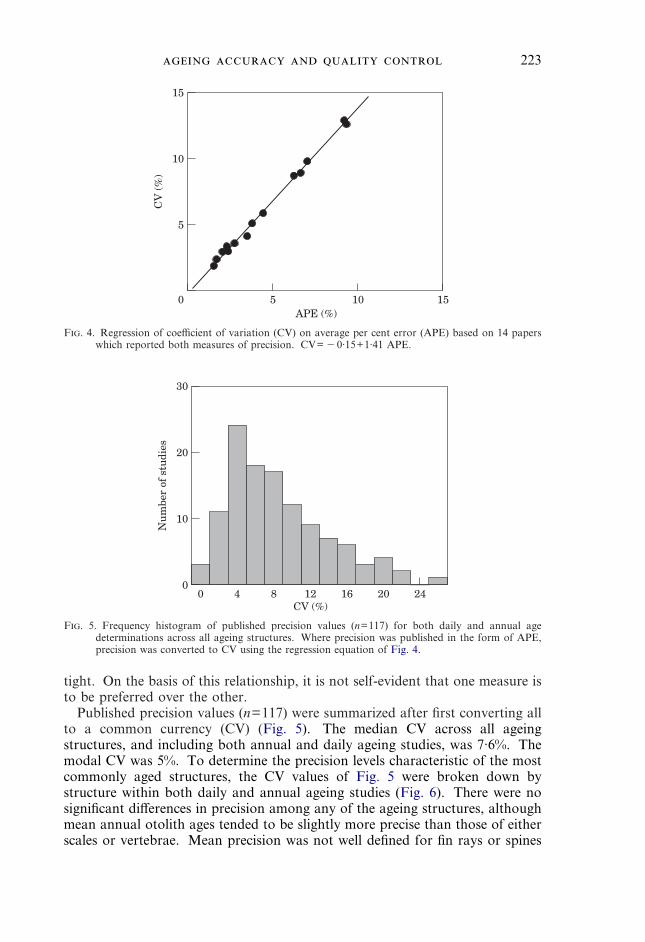
223
15
15
CV
(%
)10
1050
5
APE (%)
F. 4. Regression of coefficient of variation (CV) on average per cent error (APE) based on 14 paperswhich reported both measures of precision. CV= �0·15+1·41 APE.
024
30
Nu
mbe
r of
stu
dies
0
20
10
20161284CV (%)
F. 5. Frequency histogram of published precision values (n=117) for both daily and annual agedeterminations across all ageing structures. Where precision was published in the form of APE,precision was converted to CV using the regression equation of Fig. 4.
tight. On the basis of this relationship, it is not self-evident that one measure isto be preferred over the other.
Published precision values (n=117) were summarized after first converting allto a common currency (CV) (Fig. 5). The median CV across all ageingstructures, and including both annual and daily ageing studies, was 7·6%. Themodal CV was 5%. To determine the precision levels characteristic of the mostcommonly aged structures, the CV values of Fig. 5 were broken down bystructure within both daily and annual ageing studies (Fig. 6). There were nosignificant differences in precision among any of the ageing structures, althoughmean annual otolith ages tended to be slightly more precise than those of eitherscales or vertebrae. Mean precision was not well defined for fin rays or spines
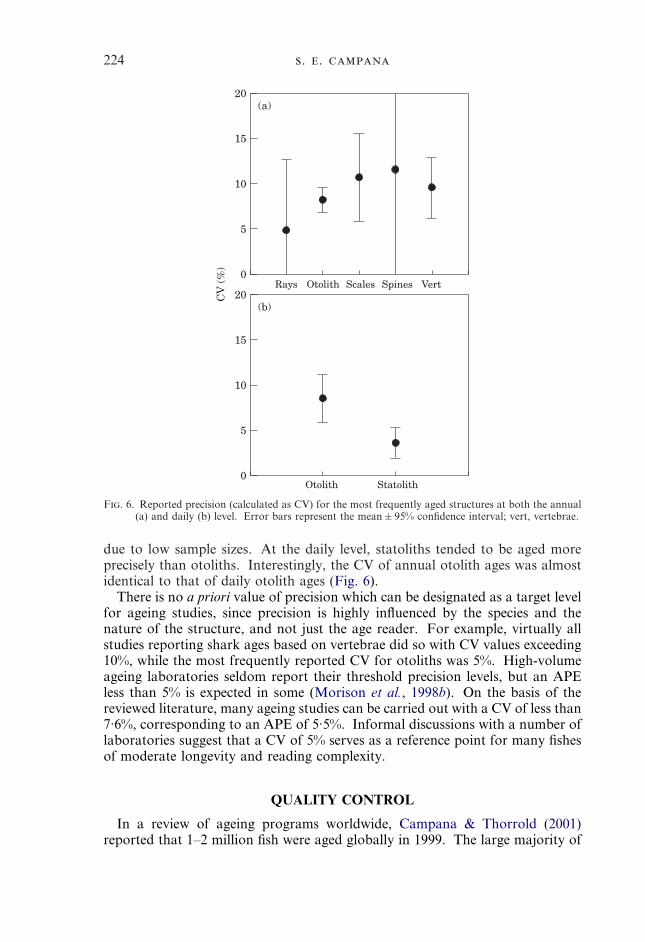
224 . .
due to low sample sizes. At the daily level, statoliths tended to be aged moreprecisely than otoliths. Interestingly, the CV of annual otolith ages was almostidentical to that of daily otolith ages (Fig. 6).
There is no a priori value of precision which can be designated as a target levelfor ageing studies, since precision is highly influenced by the species and thenature of the structure, and not just the age reader. For example, virtually allstudies reporting shark ages based on vertebrae did so with CV values exceeding10%, while the most frequently reported CV for otoliths was 5%. High-volumeageing laboratories seldom report their threshold precision levels, but an APEless than 5% is expected in some (Morison et al., 1998b). On the basis of thereviewed literature, many ageing studies can be carried out with a CV of less than7·6%, corresponding to an APE of 5·5%. Informal discussions with a number oflaboratories suggest that a CV of 5% serves as a reference point for many fishesof moderate longevity and reading complexity.
0
20(b)
15
10
5
0
20(a)
15
10
5C
V (
%)
Otolith Scales Spines VertRays
Otolith Statolith
F. 6. Reported precision (calculated as CV) for the most frequently aged structures at both the annual(a) and daily (b) level. Error bars represent the mean�95% confidence interval; vert, vertebrae.
QUALITY CONTROL
In a review of ageing programs worldwide, Campana & Thorrold (2001)reported that 1–2 million fish were aged globally in 1999. The large majority of
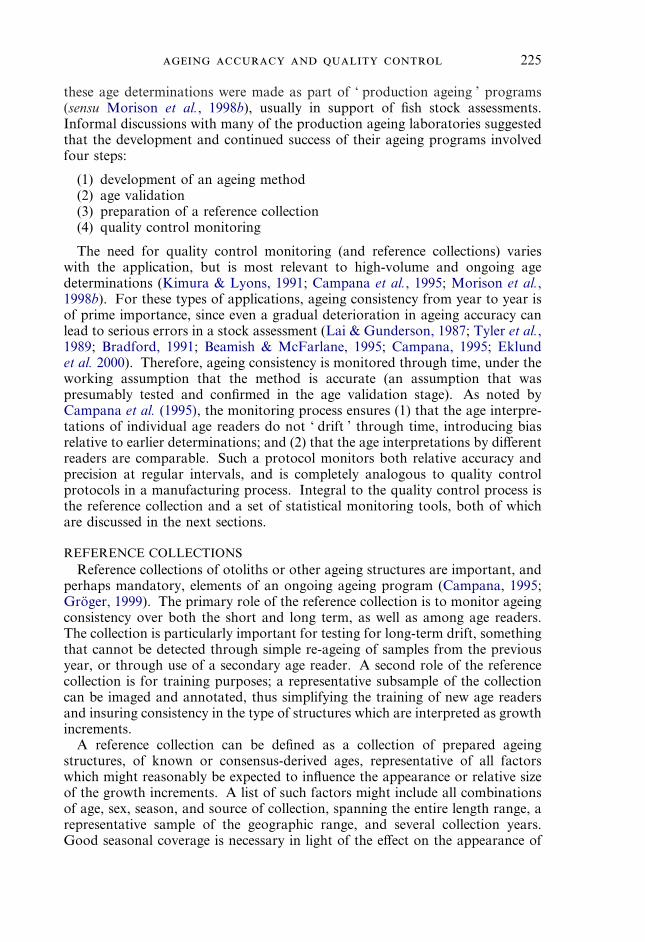
225
these age determinations were made as part of ‘ production ageing ’ programs(sensu Morison et al., 1998b), usually in support of fish stock assessments.Informal discussions with many of the production ageing laboratories suggestedthat the development and continued success of their ageing programs involvedfour steps:
(1) development of an ageing method(2) age validation(3) preparation of a reference collection(4) quality control monitoring
The need for quality control monitoring (and reference collections) varieswith the application, but is most relevant to high-volume and ongoing agedeterminations (Kimura & Lyons, 1991; Campana et al., 1995; Morison et al.,1998b). For these types of applications, ageing consistency from year to year isof prime importance, since even a gradual deterioration in ageing accuracy canlead to serious errors in a stock assessment (Lai & Gunderson, 1987; Tyler et al.,1989; Bradford, 1991; Beamish & McFarlane, 1995; Campana, 1995; Eklundet al. 2000). Therefore, ageing consistency is monitored through time, under theworking assumption that the method is accurate (an assumption that waspresumably tested and confirmed in the age validation stage). As noted byCampana et al. (1995), the monitoring process ensures (1) that the age interpre-tations of individual age readers do not ‘ drift ’ through time, introducing biasrelative to earlier determinations; and (2) that the age interpretations by differentreaders are comparable. Such a protocol monitors both relative accuracy andprecision at regular intervals, and is completely analogous to quality controlprotocols in a manufacturing process. Integral to the quality control process isthe reference collection and a set of statistical monitoring tools, both of whichare discussed in the next sections.
REFERENCE COLLECTIONSReference collections of otoliths or other ageing structures are important, and
perhaps mandatory, elements of an ongoing ageing program (Campana, 1995;Groger, 1999). The primary role of the reference collection is to monitor ageingconsistency over both the short and long term, as well as among age readers.The collection is particularly important for testing for long-term drift, somethingthat cannot be detected through simple re-ageing of samples from the previousyear, or through use of a secondary age reader. A second role of the referencecollection is for training purposes; a representative subsample of the collectioncan be imaged and annotated, thus simplifying the training of new age readersand insuring consistency in the type of structures which are interpreted as growthincrements.
A reference collection can be defined as a collection of prepared ageingstructures, of known or consensus-derived ages, representative of all factorswhich might reasonably be expected to influence the appearance or relative sizeof the growth increments. A list of such factors might include all combinationsof age, sex, season, and source of collection, spanning the entire length range, arepresentative sample of the geographic range, and several collection years.Good seasonal coverage is necessary in light of the effect on the appearance of
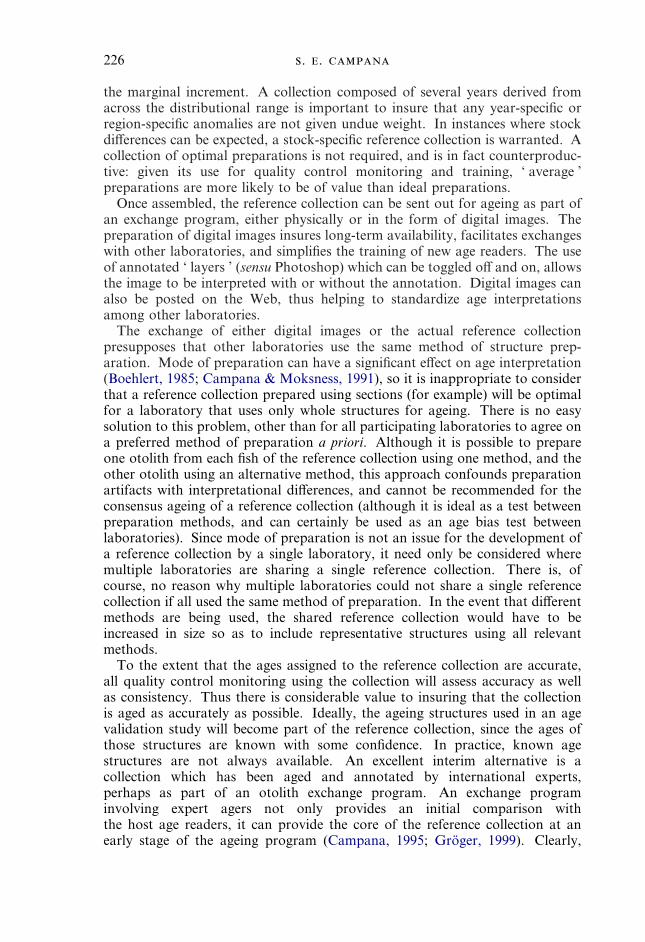
226 . .
the marginal increment. A collection composed of several years derived fromacross the distributional range is important to insure that any year-specific orregion-specific anomalies are not given undue weight. In instances where stockdifferences can be expected, a stock-specific reference collection is warranted. Acollection of optimal preparations is not required, and is in fact counterproduc-tive: given its use for quality control monitoring and training, ‘ average ’preparations are more likely to be of value than ideal preparations.
Once assembled, the reference collection can be sent out for ageing as part ofan exchange program, either physically or in the form of digital images. Thepreparation of digital images insures long-term availability, facilitates exchangeswith other laboratories, and simplifies the training of new age readers. The useof annotated ‘ layers ’ (sensu Photoshop) which can be toggled off and on, allowsthe image to be interpreted with or without the annotation. Digital images canalso be posted on the Web, thus helping to standardize age interpretationsamong other laboratories.
The exchange of either digital images or the actual reference collectionpresupposes that other laboratories use the same method of structure prep-aration. Mode of preparation can have a significant effect on age interpretation(Boehlert, 1985; Campana & Moksness, 1991), so it is inappropriate to considerthat a reference collection prepared using sections (for example) will be optimalfor a laboratory that uses only whole structures for ageing. There is no easysolution to this problem, other than for all participating laboratories to agree ona preferred method of preparation a priori. Although it is possible to prepareone otolith from each fish of the reference collection using one method, and theother otolith using an alternative method, this approach confounds preparationartifacts with interpretational differences, and cannot be recommended for theconsensus ageing of a reference collection (although it is ideal as a test betweenpreparation methods, and can certainly be used as an age bias test betweenlaboratories). Since mode of preparation is not an issue for the development ofa reference collection by a single laboratory, it need only be considered wheremultiple laboratories are sharing a single reference collection. There is, ofcourse, no reason why multiple laboratories could not share a single referencecollection if all used the same method of preparation. In the event that differentmethods are being used, the shared reference collection would have to beincreased in size so as to include representative structures using all relevantmethods.
To the extent that the ages assigned to the reference collection are accurate,all quality control monitoring using the collection will assess accuracy as wellas consistency. Thus there is considerable value to insuring that the collectionis aged as accurately as possible. Ideally, the ageing structures used in an agevalidation study will become part of the reference collection, since the ages ofthose structures are known with some confidence. In practice, known agestructures are not always available. An excellent interim alternative is acollection which has been aged and annotated by international experts,perhaps as part of an otolith exchange program. An exchange programinvolving expert agers not only provides an initial comparison withthe host age readers, it can provide the core of the reference collection at anearly stage of the ageing program (Campana, 1995; Groger, 1999). Clearly,
227
consensus-derived ages, even by experts, are not necessarily accurate. How-ever, they are more likely to be so than those of an inexperienced ager, makingthe exchange of a reference collection an efficient and cost-effective approachof beginning an ageing program, with the basis for quality control already inplace. The requirement for age validation is not removed however; in fact,validation becomes even more pressing once routine quality control monitor-ing is initiated.
The number of ageing structures required of a reference collection is somewhatarbitrary, but practical guidelines are possible. A minimum number for qualitycontrol monitoring would appear to be about 200, but even then, memorizationof individual otoliths by experienced age readers is possible after several years. Anumber closer to 500 is preferable, where possible. If sent out as part of anexchange, it may be impractical to ask other laboratories to age the entirecollection of 500, in which case a sub-sample of 200 or so could be exchanged.Structures used for training could make up a subset (n�100) of the collection,carefully selected so as to demonstrate the key features. It is also important tonote that the reference collection need not remain static through time; indeed,there is some advantage to adding a subsample of ageing structures (those usedfor monitoring tests each year) to the collection, thus allowing it to grow throughtime.
Permanent storage of otolith reference collections is important, but is notalways possible. Otoliths are chemically stable if stored dry (Campana, 1999),but preparation for ageing may allow gradual deterioration through time.Mounted otolith thin sections appear to be durable, although some mountingmedia may crack or yellow with age. Charred otoliths may eventually losecontrast, although they can always be re-burnt (Chilton & Beamish, 1982).More problematic are whole otoliths stored in glycerine to enhance clearing.While over-clearing can sometimes be partially reversed, and while damage canoften be delayed by removal of otoliths from the glycerine in between examin-ations, permanent storage of otoliths in glycerine often leads to irreversibleclearing. For all modes of preparation, frequent handling of reference materialsincreases the probability of loss or damage. For these reasons alone, high qualitydigital images of each reference structure at an appropriate magnification isnecessary to insure long-term availability of the collection. Many laboratoriesageing large numbers of fish routinely use image analysis systems and digitalimages to age their samples (Planes et al., 1991; Estep et al., 1995; Macy, 1995;Morison et al., 1998b). Therefore, imaging of ageing material is already anestablished procedure. In addition to insuring the permanence of the referencecollection, the use of digital images simplifies training and facilitates exchangeamong laboratories.
QUALITY CONTROL MONITORINGQuality control (QC) monitoring can be defined as a process of inspection and
measurement used to detect defects and deficiencies in a timely manner duringthe production of a product. In the case of age determinations, the product is theage interpretation, and the defects are ageing errors or inconsistencies in themanner in which the age is interpreted. Random errors are not usually aconcern, since their extent is usually predictable and correctable using statistical
228 . .
techniques (Richards et al., 1992; Groger, 1999). However, systematic or biasederrors are of great concern, since they can lead to serious errors in populationdynamics calculations (Lai & Gunderson, 1987; Rivard & Foy, 1987; Tyler et al.,1989; Bradford, 1991). The gradual introduction of systematic ageing error overa period of years is in some ways even more serious, due to its more insidiousnature (Campana, 1995). A quality control program monitors short- andlong-term ageing consistency, both within and among age readers, by insuringthat the age interpretation method does not drift through time. Thus, if theageing method is accurate (validated), the monitoring will also assess accuracy.
Quality control programs associated with age determinations are in place inmany laboratories, but have seldom been documented (Morison et al., 1998b).Based on observation and discussion with many of these laboratories, thefollowing QC protocol can be recommended:
(1) early development of a reference collection, preferably consisting ofknown-age or consensus-aged structures;
(2) periodic ageing of a randomly-drawn, blind-labelled subsample of thereference collection, intermixed with a subsample of structures recentlyaged as part of routine ageing. The combination of reference and recentsamples insures that the age readers do not inadvertently change theirageing criteria during the QC test;
(3) use of age bias graphs and CV as tools to evaluate the results of themonitoring (Campana et al., 1995). Although simple to implementand interpret, this combination of graphics and statistics has proveneffective in testing for both short- and long-term ageing consistency andprecision.
In addition to its effectiveness in avoiding unexpected ageing problems, thereare two cost-saving advantages to a QC program based on reference collections.The first advantage is that secondary age readers are not required. A secondaryage reader may well be desired for contingency purposes, particularly if thecontinued availability of the primary age reader is in question. However, asecondary age reader is not needed to insure ageing accuracy or consistency, andmay actually lead to an overly-optimistic view of ageing error (Heifetz et al.,1999). Indeed, if discrepancies between primary and secondary age readers wereto occur, comparisons with a reference collection would still be required todetermine which of the age readers had drifted off course. A second advantageis that periodic exchanges of ageing structures with other laboratories are notrequired, aside from the first exchange used to develop ages for the referencecollection. Once the consensus-derived ages for the reference collection are inplace, there are no advantages to further exchanges, thus saving the timeinvolved in implementing the exchanges.
When evaluating a QC monitoring test result for bias compared to theaccepted reference ages, there are a variety of statistical tests and graphicalmeasures available. Tests of symmetry (Hoenig et al., 1995), ageing errormatrices (Heifetz et al., 1999), and a range of matched pair tests (Kimura &Lyons, 1991; Campana et al., 1995) have all proven effective in detecting bias.The advantage of these tests is that they can be automated, warning the datamanager of test results only if some threshold significance level has been reached.
229
Graphical measures cannot match the statistical rigour of the above tests, butcan provide a more flexible and easily interpreted means of detecting andquantifying bias. Campana et al. (1995) noted that the age bias graph appears tobe the best graphical measure of bias, since it provides an age by age measure ofdeviation away from an accepted, or reference, value. Therefore, it can clearlyshow under-ageing or over-ageing, even if the ageing error is restricted to theyoungest or oldest fish. While a variety of statistical tests continue to be used, areview of the recent literature indicates that the age bias graph has become themost widely used measure of ageing bias.
Quality control monitoring based on a reference collection provides a level oferror detection which cannot be matched by simple re-ageing of the previousyears samples. To illustrate this point, the results of QC monitoring of NovaScotian haddock just before the detection of serious ageing errors (Campana,1995) is shown in Fig. 7. Based only on re-ageing of samples from the previousyear, neither age bias graphs, statistical tests nor any measure of precision wascapable of detecting the gradual, multi-year drift in age interpretation. Precisionremained high, and there was no evidence of inconsistency between the ageinterpretations of the two years. However, when the same age reader aged the‘ known age ’ reference collection, the ageing bias (which had developed over aperiod of seven years) became clearly evident (Fig. 7). Re-ageing of samplesfrom the previous quarter or year is a common QC practice in many labora-tories. However, this practice is essentially the same as measuring precision. Theresults shown here indicate that the practice of re-ageing a recent sample can begrossly inadequate for detecting a gradual shift in interpretation criteria (oraccuracy), whether or not it is carried out by a second age reader. Use of areference collection provides the stable reference point required for age com-parisons, even in instances where multiple age readers gradually shift their ageingcriteria in tandem. In instances where the reference collection is of known age,the test for consistency is also the test for accuracy.
There is little documentation available concerning the logistics of QC moni-toring. Testing against a random subsample of a reference collection appears tobe relatively common, as is the practice of including a subsample from theproduction ageing of the current or most recent year in order to insure that thereference collection is aged using the same criteria as was the production sample(Campana, 1997; Heifetz et al., 1999). If the reference and recent samples arerandomly intermixed by a supervisor, preferably through use of digital images, itbecomes very difficult for an age reader to consciously or unconsciously changehis/her interpretation criteria for the QC test. An age bias graph comparing testversus reference ages for the reference structures would confirm long-term ageingconsistency, while a separate age bias graph comparing test versus original agesfor the production subsample would insure consistency between the most recentproduction run and the QC test. If both tests indicate lack of bias, the sameageing criteria must have been used for both reference and production samples.An additional advantage of this procedure is that the re-aged production samplewill then have been aged twice, and can then be added to the reference collectionfor use in later years. Sample sizes of 100 from the reference collection plus 100from a recent production run is sufficient to insure reasonable statistical powerfor the QC test.

230 . .
2
12(b)
Age
r 1
10
8
6
4
16 11 10 10 52 63 53 8 6 6
'Known' age (years)3 4 5 6 7 8 9 10 11 12
N =
1
7(a)
Age
r 1
in 1
992
6
5
4
3
2 8 20 29 28 8
Ager 1 in 19912 3 4 5 6 7
N =
2
F. 7. Age bias graphs for haddock otoliths being aged in support of a stock assessment, just prior to thediscovery that the ageing method was seriously underageing older fish. Extent of deviation of 95%confidence interval bars from 1 : 1 (——) line indicates extent of ageing bias. (a) Routine qualitycontrol test in which otoliths were re-aged 1 year later. No appreciable ageing bias is evident.Although this type of test is common in many laboratories, it was incapable of detecting the ageingproblem, which developed over the course of 7 years; (b) Quality control test in which the samehaddock ager read a reference collection aged by international experts. The large deviation fromthe 1:1 line indicates that haddock>age 5 were increasingly underaged by Ager 1, resulting inunderageing by as much as 60% at age 12. (a) CV=3·4%; (b) CV=32·4%.
There is little advantage to carrying out more than one QC test per productionrun, since age readers are unlikely to change their ageing criteria in the middle ofan ageing session. After a substantial interlude of non-ageing, or of ageing adifferent species, many experienced age readers re-orient themselves with theageing of a species by re-reading a subsample of the previous year’s productionageing. This is often done informally, and is not assessed as part of QCmonitoring. QC monitoring is best done during or immediately after completionof production ageing. In instances where ageing is continuous, monitoring at afrequency of once per year is likely to be sufficient.
231
Identification of an ‘ ageing problem ’ from QC monitoring can be based onone or more threshold standards, but errors as large as those evident in Fig. 7should never occur when proper quality control is in place. A change inprecision will seldom be a reliable indicator of ageing error, particularly amongexperienced age readers (see Precision section). The age bias graph appears to bethe most sensitive indicator of ageing bias, since it can be interpreted in terms ofthe type and magnitude of the bias, not just the presence/absence indicated bystatistical tests. This is important, since not all bias warrants corrective action.For example, in the upper panel of Fig. 7, the 1992 set of age readings for ages2–6 is higher than those for the same otoliths read in 1991; for some of the ages,the bias is statistically significant (e.g. the 95% confidence intervals do not crossthe 1 : 1 line). Yet the magnitude of the bias, as indicated by the vertical intervalbetween the 1 : 1 line and the data point, is relatively small (<Y year). Thebiological significance of such a small discrepancy is minimal. Similarly, if themean for age 4 in the upper panel of Fig. 7 had happened to be 1 year above the1 : 1 line, it is unlikely that any action would need to be taken; with nosubstantial bias evident for ages above or below age 4, the implications of adiscrepancy at a single age are likely to be negligible. At what point does biasbecome important? A 1 year offset across a series of ages is certainly significant,since it indicates that one ager has counted an extra annulus, starting at the ageat which the offset originated. A divergent trend between the data points and the1 : 1 line, as shown in the lower panel of Fig. 7, is also troublesome, since itindicates that the two age readers are using different criteria to identify annuli.In the case of the lower panel of Fig. 7 for example, Ager 1 may have assumedthat annulus width was constant and disregarded all narrower increments,whereas the international experts interpreted the progressively narrowing incre-ments as annuli. In all cases however, an overlap of any individual error barover the 1 : 1 line is an indication of the variance at that age, but is not a goodcriterion of the importance of any bias; for example, a 1 year offset seen at allages would still indicate significant bias even if the error bars overlapped the 1 : 1line at all ages.
If quality control monitoring identifies an ageing problem, the correctiveaction required will largely depend on the experience of the age reader and thenumber of structures which are being aged. In a production ageing environment,the following steps are often taken:
(1) the ager re-reads the annotated training set to calibrate his/her interpret-ation against correctly identified growth increments;
(2) conducts a blind test against a subsample of the reference collection, usingan age bias graph to determine if the ageing bias is still present; if biasremains, returns to annotated training set for further training;
(3) if bias is absent, re-ages all ageing structures from the point when the biasfirst appeared; in many cases, this point will not be known, requiringre-ageing from the time of the last QC test.
QUANTIFICATION AND CORRECTION OF AGEING ERROR
Ageing errors can be either random or biased, reflecting some combination ofprocess and interpretation error. Although bias can be avoided through
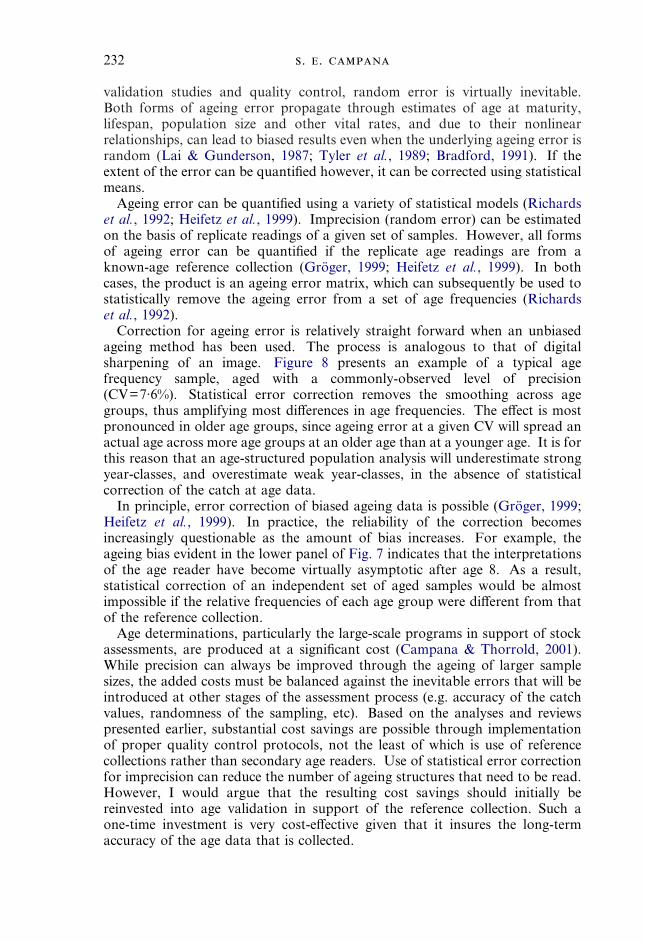
232 . .
validation studies and quality control, random error is virtually inevitable.Both forms of ageing error propagate through estimates of age at maturity,lifespan, population size and other vital rates, and due to their nonlinearrelationships, can lead to biased results even when the underlying ageing error israndom (Lai & Gunderson, 1987; Tyler et al., 1989; Bradford, 1991). If theextent of the error can be quantified however, it can be corrected using statisticalmeans.
Ageing error can be quantified using a variety of statistical models (Richardset al., 1992; Heifetz et al., 1999). Imprecision (random error) can be estimatedon the basis of replicate readings of a given set of samples. However, all formsof ageing error can be quantified if the replicate age readings are from aknown-age reference collection (Groger, 1999; Heifetz et al., 1999). In bothcases, the product is an ageing error matrix, which can subsequently be used tostatistically remove the ageing error from a set of age frequencies (Richardset al., 1992).
Correction for ageing error is relatively straight forward when an unbiasedageing method has been used. The process is analogous to that of digitalsharpening of an image. Figure 8 presents an example of a typical agefrequency sample, aged with a commonly-observed level of precision(CV=7·6%). Statistical error correction removes the smoothing across agegroups, thus amplifying most differences in age frequencies. The effect is mostpronounced in older age groups, since ageing error at a given CV will spread anactual age across more age groups at an older age than at a younger age. It is forthis reason that an age-structured population analysis will underestimate strongyear-classes, and overestimate weak year-classes, in the absence of statisticalcorrection of the catch at age data.
In principle, error correction of biased ageing data is possible (Groger, 1999;Heifetz et al., 1999). In practice, the reliability of the correction becomesincreasingly questionable as the amount of bias increases. For example, theageing bias evident in the lower panel of Fig. 7 indicates that the interpretationsof the age reader have become virtually asymptotic after age 8. As a result,statistical correction of an independent set of aged samples would be almostimpossible if the relative frequencies of each age group were different from thatof the reference collection.
Age determinations, particularly the large-scale programs in support of stockassessments, are produced at a significant cost (Campana & Thorrold, 2001).While precision can always be improved through the ageing of larger samplesizes, the added costs must be balanced against the inevitable errors that will beintroduced at other stages of the assessment process (e.g. accuracy of the catchvalues, randomness of the sampling, etc). Based on the analyses and reviewspresented earlier, substantial cost savings are possible through implementationof proper quality control protocols, not the least of which is use of referencecollections rather than secondary age readers. Use of statistical error correctionfor imprecision can reduce the number of ageing structures that need to be read.However, I would argue that the resulting cost savings should initially bereinvested into age validation in support of the reference collection. Such aone-time investment is very cost-effective given that it insures the long-termaccuracy of the age data that is collected.
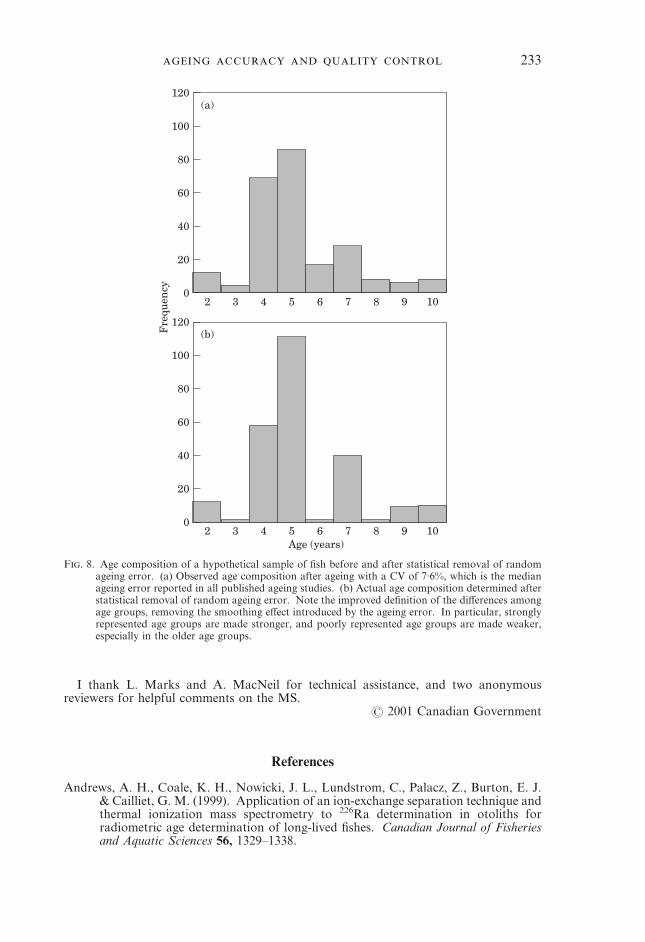
233
I thank L. Marks and A. MacNeil for technical assistance, and two anonymousreviewers for helpful comments on the MS.
� 2001 Canadian Government
02
120(b)
100
3 4 5 6 7 8 9 10
80
60
40
20
02
120(a)
100
3 4 5 6 7 8 9 10
80
60
40
20
Fre
quen
cy
Age (years)
F. 8. Age composition of a hypothetical sample of fish before and after statistical removal of randomageing error. (a) Observed age composition after ageing with a CV of 7·6%, which is the medianageing error reported in all published ageing studies. (b) Actual age composition determined afterstatistical removal of random ageing error. Note the improved definition of the differences amongage groups, removing the smoothing effect introduced by the ageing error. In particular, stronglyrepresented age groups are made stronger, and poorly represented age groups are made weaker,especially in the older age groups.
References
Andrews, A. H., Coale, K. H., Nowicki, J. L., Lundstrom, C., Palacz, Z., Burton, E. J.& Cailliet, G. M. (1999). Application of an ion-exchange separation technique andthermal ionization mass spectrometry to 226Ra determination in otoliths forradiometric age determination of long-lived fishes. Canadian Journal of Fisheriesand Aquatic Sciences 56, 1329–1338.
234 . .
Arkhipkin, A. I. (1997). Age and growth of the mesopelagic squid Ancistrocheiruslesueurii (Oegopsida: Ancistrocheiridae) from the central-east Atlantic based onstatolith microstructure. Marine Biology 129, 103–111.
Bagenal, T. B. & Tesch, F. W. (1978). Age and growth. In Methods for Assessment ofFish Production in Fresh Waters (Bagenal, T., ed.), pp. 101–136. London:Blackwell Scientific.
Baillon, N. (1992). Otolithometrie: revue et problemes. In Tissus durs et age individueldes vertebres (Bagliniere, J. L., Castanet, J., Conand, F. & Meunier, F. J., eds),pp. 21–52. Paris: ORSTOM Editions.
Baker, A., Smart, P. L., Edwards, R. L. & Richards, D. A. (1993). Annual growthbanding in a cave stalagmite. Nature 364, 518–520.
Baker, T. T. & Timmons, L. S. (1991). Precision of ages estimated from five bonystructures of Arctic char (Salvelinus alpinus) from the Wood River System, Alaska.Canadian Journal of Fisheries and Aquatic Sciences 48, 1007–1014.
Beamish, R. J. (1979). New information on the longevity of Pacific ocean perch (Sebastesalutus). Journal of the Fisheries Research Board of Canada 36, 1395–1400.
Beamish, R. J. & Chilton, D. E. (1982). Preliminary evaluation of a method to determinethe age of sablefish (Anoplopoma fimbria). Canadian Journal of Fisheries andAquatic Sciences 39, 277–287.
Beamish, R. J. & Fournier, D. A. (1981). A method for comparing the precision of a setof age determinations. Canadian Journal of Fisheries and Aquatic Sciences 38,982–983.
Beamish, R. J. & McFarlane, G. A. (1983). The forgotten requirement for age validationin fisheries biology. Transactions of the American Fisheries Society 112, 735–743.
Beamish, R. J. & McFarlane, G. A. (1985). Annulus development on the seconddorsal spine of the spiny dogfish (Squalus acanthias) and its validity for agedetermination. Canadian Journal of Fisheries and Aquatic Sciences 42, 1799–1805.
Beamish, R. J. & McFarlane, G. A. (1987). Current trends in age determinationmethodology. In Age and Growth of Fish (Summerfelt, R. C. & Hall, G. E., eds),pp. 15–42. Ames: Iowa State University Press.
Beamish, R. J. & McFarlane, G. A. (1995). A discussion of the importance of agingerrors, and an application to walleye pollock: the world’s largest fishery. In RecentDevelopments in Fish Otolith Research (Secor, D. H., Dean, J. M. & Campana,S. E., eds), pp. 545–565. Columbia: University of South Carolina Press.
Beamish, R. J. & McFarlane, G. A. (2000). Reevaluation of the interpretation of annulifrom otoliths of a long-lived fish, Anoplopoma fimbria. Fisheries Research 46,105–111.
Beauchemin, D., McLaren, J. W., Mykytiuk, A. P. & Berman, S. S. (1987). Determi-nation of trace metals in a river water reference material by inductively coupledplasma mass spectrometry. Analytical Chemistry 59, 778–783.
Beckman, D. W. & Wilson, C. A. (1995). Seasonal timing of opaque zone formation infish otoliths. In Recent Developments in Fish Otolith Research (Secor, D. H., Dean,J. M. & Campana, S. E., eds), pp. 27–43. Columbia: University of South CarolinaPress.
Bennett, J. T., Boehlert, G. W. & Turekian, K. K. (1982). Confirmation of longevity inSebastes diploproa (Pisces: Scorpaenidae) from Pb-210/Ra-226 measurements inotoliths. Marine Biology 71, 209–215.
Blacker, R. W. (1974). Recent advances in otolith studies. In Sea Fisheries Research(Harden Jones, F. R., ed.), pp. 67–90. London: Elek Science.
Boehlert, G. W. (1985). Using objective criteria and multiple regression models for agedetermination in fishes. Fishery Bulletin, U.S. 83, 103–117.
Bradford, M. J. (1991). Effects of ageing errors on recruitment time series estimated fromsequential population analysis. Canadian Journal of Fisheries and Aquatic Sciences48, 555–558.
Brothers, E. B. (1979). Age and growth studies on tropical fishes. In Stock Assessmentfor Tropical Small-Scale Fisheries (Saila, S. B. & Roedel, P. M., eds), pp. 119–136.Kingston: University of Rhode Island.
235
Brown, C. A. & Gruber, S. H. (1988). Age assessment of the lemon shark, Negaprionbrevirostris, using tetracycline validated vertebral centra. Copeia 1988, 747–753.
Burton, E. J., Andrews, A. H., Coale, K. H. & Cailliet, G. M. (1999). Application ofradiometric age determination to three long-lived fishes using 210Pb:226Radisequilibria in calcified structures: a review. American Fisheries SocietySymposium 23, 77–87.
Cailliet, G. M. (1990). Elasmobranch age determination and verification: an updatedreview. National Oceanic and Atmospheric Administration Technical Report 90,157–165.
Cailliet, G. M., Radtke, R. L. & Weldon, B. A. (1986). Elasmobranch age determinationand verification: a review. In Indo-Pacific Fish Biology: Proceedings of the SecondInternational Conference on Indo-Pacific Fishes (Uyeno, T., Arai, R., Taniuchi, T.& Matsuura, K., eds), pp. 345–360. Tokyo: Ichthyological Society of Japan.
Campana, S. E. (1983). Feeding periodicity and the production of daily growthincrements in otoliths of steelhead trout (Salmo gairdneri) and starry flounder(Platichthys stellatus). Canadian Journal of Zoology 61, 1591–1597.
Campana, S. E. (1984). Comparison of age determination methods for the starryflounder. Transactions of the American Fisheries Society 113, 365–369.
Campana, S. E. (1989). Otolith microstructure of three larval gadids in the Gulf ofMaine, with inferences on early life history. Canadian Journal of Zoology 67,1401–1410.
Campana, S. (1995). Expert age determination of 4VW and 4X haddock otoliths bynational and international laboratories. Department of Fisheries and OceansAtlantic Fisheries Research Document 95/120.
Campana, S. E. (1997). Use of radiocarbon from nuclear fallout as a dated marker in theotoliths of haddock, Melanogrammus aeglefinus. Marine Ecology Progress Series150, 49–56.
Campana, S. E. (1999). Chemistry and composition of fish otoliths: pathways,mechanisms and applications. Marine Ecology Progress Series 188, 263–297.
Campana, S. E. & Jones, C. M. (1992). Analysis of otolith microstructure data. InOtolith microstructure examination and analysis (Stevenson, D. K. & Campana,S. E., eds), pp. 73–100. Canadian Special Publication of Fisheries and AquaticSciences 117.
Campana, S. E. & Jones, C. M. (1998). Radiocarbon from nuclear testing appliedto age validation of black drum, Pogonias cromis. Fishery Bulletin, U.S. 96,185–192.
Campana, S. E. & Moksness, E. (1991). Accuracy and precision of age and hatch dateestimates from otolith microstructure examination. ICES Journal of MarineScience 48, 303–316.
Campana, S. E. & Neilson, J. D. (1982). Daily growth increments in otoliths of starryflounder (Platichthys stellatus) and the influence of some environmental variablesin their production. Canadian Journal of Fisheries and Aquatic Sciences 39,937–942.
Campana, S. E. & Neilson, J. D. (1985). Microstructure of fish otoliths. CanadianJournal of Fisheries and Aquatic Sciences 42, 1014–1032.
Campana, S. E. & Thorrold, S. R. (2001). Otoliths, increments and elements: keys to acomprehensive understanding of fish populations? Canadian Journal of Fisheriesand Aquatic Sciences 58, 30–38.
Campana, S. E., Zwanenburg, K. C. T. & Smith, J. N. (1990). 210Pb/226Ra determinationof longevity in redfish. Canadian Journal of Fisheries and Aquatic Sciences 47,163–165.
Campana, S. E., Oxenford, H. A. & Smith, J. N. (1993). Radiochemical determination oflongevity in flyingfish Hirundichthys affinis using Th-228/Ra-228. Marine EcologyProgress Series 100, 211–219.
Campana, S. E., Annand, M. C. & McMillan, J. I. (1995). Graphical and statisticalmethods for determining the consistency of age determinations. Transactions ofthe American Fisheries Society 124, 131–138.
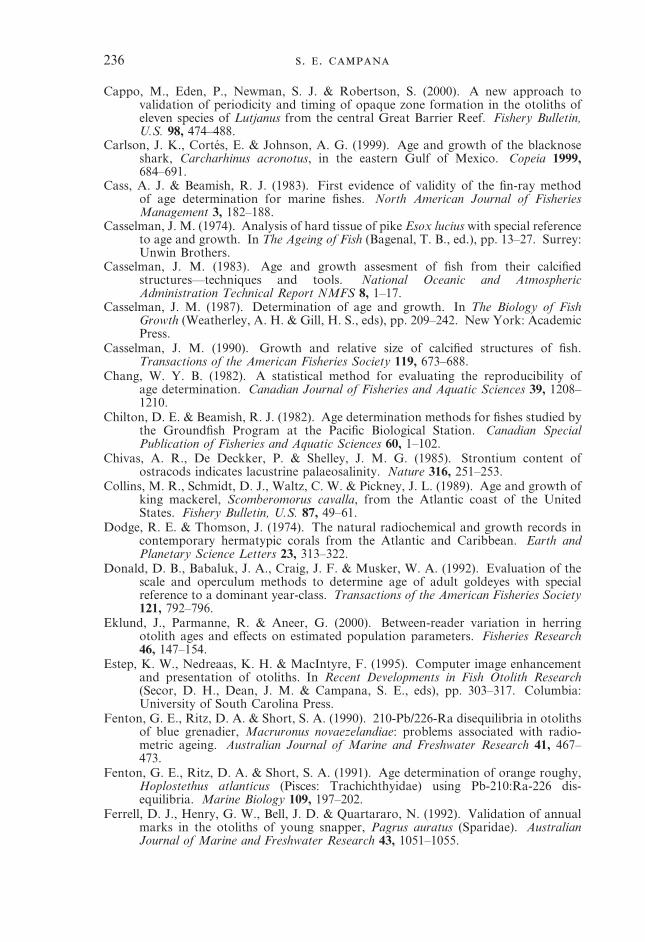
236 . .
Cappo, M., Eden, P., Newman, S. J. & Robertson, S. (2000). A new approach tovalidation of periodicity and timing of opaque zone formation in the otoliths ofeleven species of Lutjanus from the central Great Barrier Reef. Fishery Bulletin,U.S. 98, 474–488.
Carlson, J. K., Cortes, E. & Johnson, A. G. (1999). Age and growth of the blacknoseshark, Carcharhinus acronotus, in the eastern Gulf of Mexico. Copeia 1999,684–691.
Cass, A. J. & Beamish, R. J. (1983). First evidence of validity of the fin-ray methodof age determination for marine fishes. North American Journal of FisheriesManagement 3, 182–188.
Casselman, J. M. (1974). Analysis of hard tissue of pike Esox lucius with special referenceto age and growth. In The Ageing of Fish (Bagenal, T. B., ed.), pp. 13–27. Surrey:Unwin Brothers.
Casselman, J. M. (1983). Age and growth assesment of fish from their calcifiedstructures—techniques and tools. National Oceanic and AtmosphericAdministration Technical Report NMFS 8, 1–17.
Casselman, J. M. (1987). Determination of age and growth. In The Biology of FishGrowth (Weatherley, A. H. & Gill, H. S., eds), pp. 209–242. New York: AcademicPress.
Casselman, J. M. (1990). Growth and relative size of calcified structures of fish.Transactions of the American Fisheries Society 119, 673–688.
Chang, W. Y. B. (1982). A statistical method for evaluating the reproducibility ofage determination. Canadian Journal of Fisheries and Aquatic Sciences 39, 1208–1210.
Chilton, D. E. & Beamish, R. J. (1982). Age determination methods for fishes studied bythe Groundfish Program at the Pacific Biological Station. Canadian SpecialPublication of Fisheries and Aquatic Sciences 60, 1–102.
Chivas, A. R., De Deckker, P. & Shelley, J. M. G. (1985). Strontium content ofostracods indicates lacustrine palaeosalinity. Nature 316, 251–253.
Collins, M. R., Schmidt, D. J., Waltz, C. W. & Pickney, J. L. (1989). Age and growth ofking mackerel, Scomberomorus cavalla, from the Atlantic coast of the UnitedStates. Fishery Bulletin, U.S. 87, 49–61.
Dodge, R. E. & Thomson, J. (1974). The natural radiochemical and growth records incontemporary hermatypic corals from the Atlantic and Caribbean. Earth andPlanetary Science Letters 23, 313–322.
Donald, D. B., Babaluk, J. A., Craig, J. F. & Musker, W. A. (1992). Evaluation of thescale and operculum methods to determine age of adult goldeyes with specialreference to a dominant year-class. Transactions of the American Fisheries Society121, 792–796.
Eklund, J., Parmanne, R. & Aneer, G. (2000). Between-reader variation in herringotolith ages and effects on estimated population parameters. Fisheries Research46, 147–154.
Estep, K. W., Nedreaas, K. H. & MacIntyre, F. (1995). Computer image enhancementand presentation of otoliths. In Recent Developments in Fish Otolith Research(Secor, D. H., Dean, J. M. & Campana, S. E., eds), pp. 303–317. Columbia:University of South Carolina Press.
Fenton, G. E., Ritz, D. A. & Short, S. A. (1990). 210-Pb/226-Ra disequilibria in otolithsof blue grenadier, Macruronus novaezelandiae: problems associated with radio-metric ageing. Australian Journal of Marine and Freshwater Research 41, 467–473.
Fenton, G. E., Ritz, D. A. & Short, S. A. (1991). Age determination of orange roughy,Hoplostethus atlanticus (Pisces: Trachichthyidae) using Pb-210:Ra-226 dis-equilibria. Marine Biology 109, 197–202.
Ferrell, D. J., Henry, G. W., Bell, J. D. & Quartararo, N. (1992). Validation of annualmarks in the otoliths of young snapper, Pagrus auratus (Sparidae). AustralianJournal of Marine and Freshwater Research 43, 1051–1055.
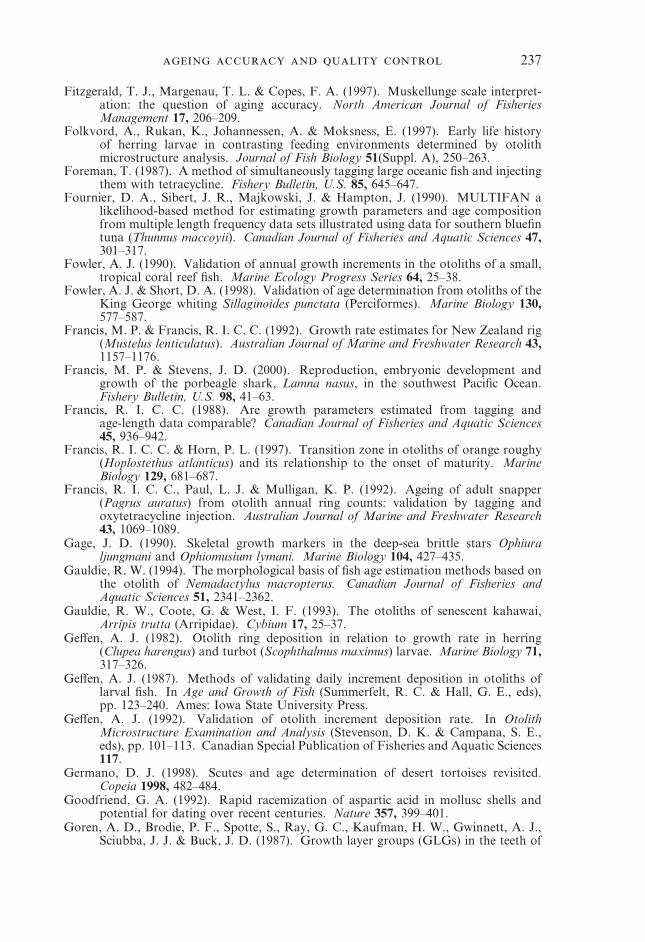
237
Fitzgerald, T. J., Margenau, T. L. & Copes, F. A. (1997). Muskellunge scale interpret-ation: the question of aging accuracy. North American Journal of FisheriesManagement 17, 206–209.
Folkvord, A., Rukan, K., Johannessen, A. & Moksness, E. (1997). Early life historyof herring larvae in contrasting feeding environments determined by otolithmicrostructure analysis. Journal of Fish Biology 51(Suppl. A), 250–263.
Foreman, T. (1987). A method of simultaneously tagging large oceanic fish and injectingthem with tetracycline. Fishery Bulletin, U.S. 85, 645–647.
Fournier, D. A., Sibert, J. R., Majkowski, J. & Hampton, J. (1990). MULTIFAN alikelihood-based method for estimating growth parameters and age compositionfrom multiple length frequency data sets illustrated using data for southern bluefintuna (Thunnus maccoyii). Canadian Journal of Fisheries and Aquatic Sciences 47,301–317.
Fowler, A. J. (1990). Validation of annual growth increments in the otoliths of a small,tropical coral reef fish. Marine Ecology Progress Series 64, 25–38.
Fowler, A. J. & Short, D. A. (1998). Validation of age determination from otoliths of theKing George whiting Sillaginoides punctata (Perciformes). Marine Biology 130,577–587.
Francis, M. P. & Francis, R. I. C. C. (1992). Growth rate estimates for New Zealand rig(Mustelus lenticulatus). Australian Journal of Marine and Freshwater Research 43,1157–1176.
Francis, M. P. & Stevens, J. D. (2000). Reproduction, embryonic development andgrowth of the porbeagle shark, Lamna nasus, in the southwest Pacific Ocean.Fishery Bulletin, U.S. 98, 41–63.
Francis, R. I. C. C. (1988). Are growth parameters estimated from tagging andage-length data comparable? Canadian Journal of Fisheries and Aquatic Sciences45, 936–942.
Francis, R. I. C. C. & Horn, P. L. (1997). Transition zone in otoliths of orange roughy(Hoplostethus atlanticus) and its relationship to the onset of maturity. MarineBiology 129, 681–687.
Francis, R. I. C. C., Paul, L. J. & Mulligan, K. P. (1992). Ageing of adult snapper(Pagrus auratus) from otolith annual ring counts: validation by tagging andoxytetracycline injection. Australian Journal of Marine and Freshwater Research43, 1069–1089.
Gage, J. D. (1990). Skeletal growth markers in the deep-sea brittle stars Ophiuraljungmani and Ophiomusium lymani. Marine Biology 104, 427–435.
Gauldie, R. W. (1994). The morphological basis of fish age estimation methods based onthe otolith of Nemadactylus macropterus. Canadian Journal of Fisheries andAquatic Sciences 51, 2341–2362.
Gauldie, R. W., Coote, G. & West, I. F. (1993). The otoliths of senescent kahawai,Arripis trutta (Arripidae). Cybium 17, 25–37.
Geffen, A. J. (1982). Otolith ring deposition in relation to growth rate in herring(Clupea harengus) and turbot (Scophthalmus maximus) larvae. Marine Biology 71,317–326.
Geffen, A. J. (1987). Methods of validating daily increment deposition in otoliths oflarval fish. In Age and Growth of Fish (Summerfelt, R. C. & Hall, G. E., eds),pp. 123–240. Ames: Iowa State University Press.
Geffen, A. J. (1992). Validation of otolith increment deposition rate. In OtolithMicrostructure Examination and Analysis (Stevenson, D. K. & Campana, S. E.,eds), pp. 101–113. Canadian Special Publication of Fisheries and Aquatic Sciences117.
Germano, D. J. (1998). Scutes and age determination of desert tortoises revisited.Copeia 1998, 482–484.
Goodfriend, G. A. (1992). Rapid racemization of aspartic acid in mollusc shells andpotential for dating over recent centuries. Nature 357, 399–401.
Goren, A. D., Brodie, P. F., Spotte, S., Ray, G. C., Kaufman, H. W., Gwinnett, A. J.,Sciubba, J. J. & Buck, J. D. (1987). Growth layer groups (GLGs) in the teeth of
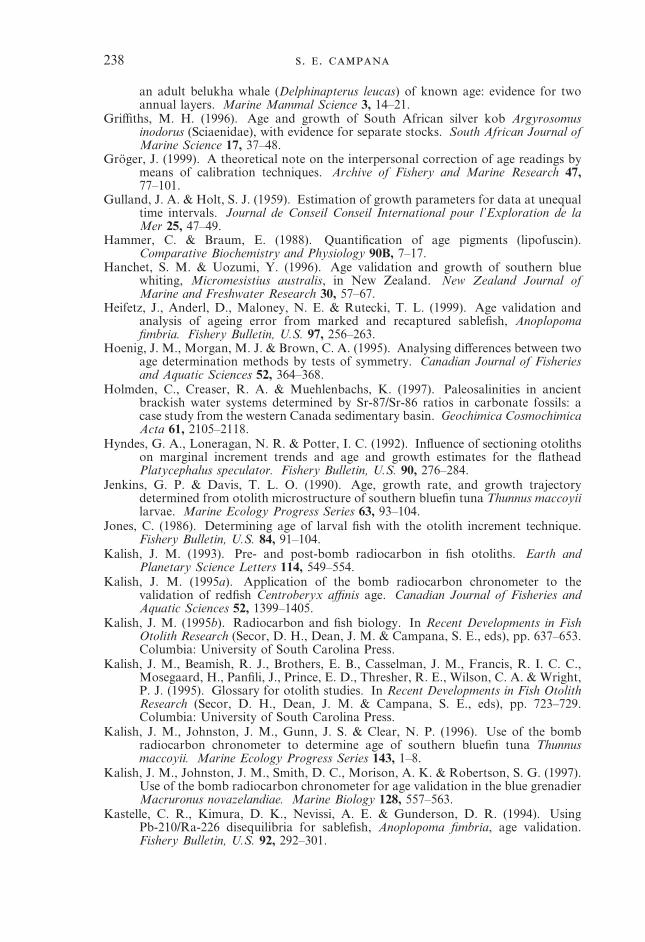
238 . .
an adult belukha whale (Delphinapterus leucas) of known age: evidence for twoannual layers. Marine Mammal Science 3, 14–21.
Griffiths, M. H. (1996). Age and growth of South African silver kob Argyrosomusinodorus (Sciaenidae), with evidence for separate stocks. South African Journal ofMarine Science 17, 37–48.
Groger, J. (1999). A theoretical note on the interpersonal correction of age readings bymeans of calibration techniques. Archive of Fishery and Marine Research 47,77–101.
Gulland, J. A. & Holt, S. J. (1959). Estimation of growth parameters for data at unequaltime intervals. Journal de Conseil Conseil International pour l’Exploration de laMer 25, 47–49.
Hammer, C. & Braum, E. (1988). Quantification of age pigments (lipofuscin).Comparative Biochemistry and Physiology 90B, 7–17.
Hanchet, S. M. & Uozumi, Y. (1996). Age validation and growth of southern bluewhiting, Micromesistius australis, in New Zealand. New Zealand Journal ofMarine and Freshwater Research 30, 57–67.
Heifetz, J., Anderl, D., Maloney, N. E. & Rutecki, T. L. (1999). Age validation andanalysis of ageing error from marked and recaptured sablefish, Anoplopomafimbria. Fishery Bulletin, U.S. 97, 256–263.
Hoenig, J. M., Morgan, M. J. & Brown, C. A. (1995). Analysing differences between twoage determination methods by tests of symmetry. Canadian Journal of Fisheriesand Aquatic Sciences 52, 364–368.
Holmden, C., Creaser, R. A. & Muehlenbachs, K. (1997). Paleosalinities in ancientbrackish water systems determined by Sr-87/Sr-86 ratios in carbonate fossils: acase study from the western Canada sedimentary basin. Geochimica CosmochimicaActa 61, 2105–2118.
Hyndes, G. A., Loneragan, N. R. & Potter, I. C. (1992). Influence of sectioning otolithson marginal increment trends and age and growth estimates for the flatheadPlatycephalus speculator. Fishery Bulletin, U.S. 90, 276–284.
Jenkins, G. P. & Davis, T. L. O. (1990). Age, growth rate, and growth trajectorydetermined from otolith microstructure of southern bluefin tuna Thunnus maccoyiilarvae. Marine Ecology Progress Series 63, 93–104.
Jones, C. (1986). Determining age of larval fish with the otolith increment technique.Fishery Bulletin, U.S. 84, 91–104.
Kalish, J. M. (1993). Pre- and post-bomb radiocarbon in fish otoliths. Earth andPlanetary Science Letters 114, 549–554.
Kalish, J. M. (1995a). Application of the bomb radiocarbon chronometer to thevalidation of redfish Centroberyx affinis age. Canadian Journal of Fisheries andAquatic Sciences 52, 1399–1405.
Kalish, J. M. (1995b). Radiocarbon and fish biology. In Recent Developments in FishOtolith Research (Secor, D. H., Dean, J. M. & Campana, S. E., eds), pp. 637–653.Columbia: University of South Carolina Press.
Kalish, J. M., Beamish, R. J., Brothers, E. B., Casselman, J. M., Francis, R. I. C. C.,Mosegaard, H., Panfili, J., Prince, E. D., Thresher, R. E., Wilson, C. A. & Wright,P. J. (1995). Glossary for otolith studies. In Recent Developments in Fish OtolithResearch (Secor, D. H., Dean, J. M. & Campana, S. E., eds), pp. 723–729.Columbia: University of South Carolina Press.
Kalish, J. M., Johnston, J. M., Gunn, J. S. & Clear, N. P. (1996). Use of the bombradiocarbon chronometer to determine age of southern bluefin tuna Thunnusmaccoyii. Marine Ecology Progress Series 143, 1–8.
Kalish, J. M., Johnston, J. M., Smith, D. C., Morison, A. K. & Robertson, S. G. (1997).Use of the bomb radiocarbon chronometer for age validation in the blue grenadierMacruronus novazelandiae. Marine Biology 128, 557–563.
Kastelle, C. R., Kimura, D. K., Nevissi, A. E. & Gunderson, D. R. (1994). UsingPb-210/Ra-226 disequilibria for sablefish, Anoplopoma fimbria, age validation.Fishery Bulletin, U.S. 92, 292–301.
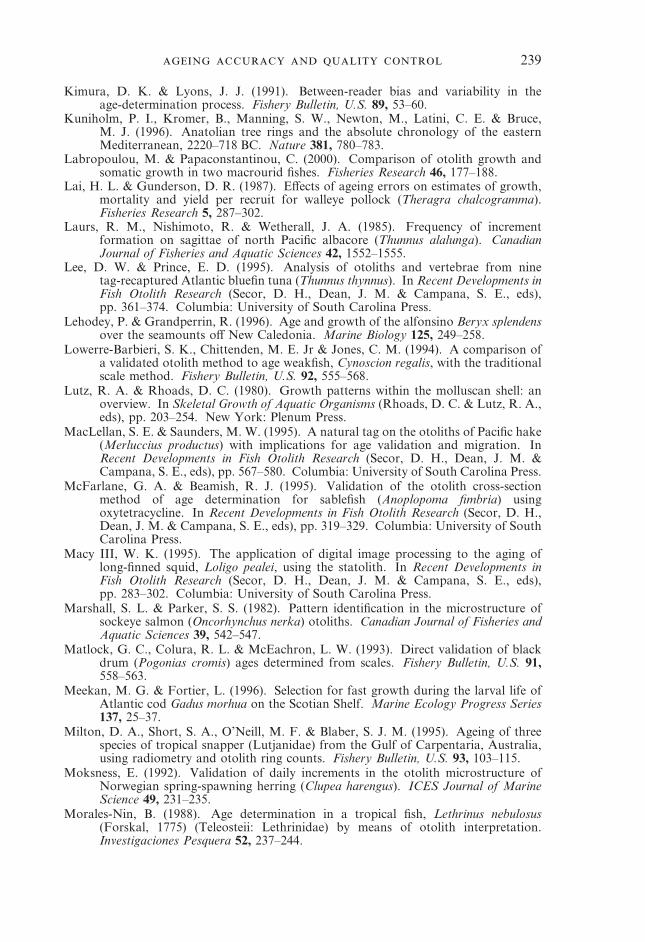
239
Kimura, D. K. & Lyons, J. J. (1991). Between-reader bias and variability in theage-determination process. Fishery Bulletin, U.S. 89, 53–60.
Kuniholm, P. I., Kromer, B., Manning, S. W., Newton, M., Latini, C. E. & Bruce,M. J. (1996). Anatolian tree rings and the absolute chronology of the easternMediterranean, 2220–718 BC. Nature 381, 780–783.
Labropoulou, M. & Papaconstantinou, C. (2000). Comparison of otolith growth andsomatic growth in two macrourid fishes. Fisheries Research 46, 177–188.
Lai, H. L. & Gunderson, D. R. (1987). Effects of ageing errors on estimates of growth,mortality and yield per recruit for walleye pollock (Theragra chalcogramma).Fisheries Research 5, 287–302.
Laurs, R. M., Nishimoto, R. & Wetherall, J. A. (1985). Frequency of incrementformation on sagittae of north Pacific albacore (Thunnus alalunga). CanadianJournal of Fisheries and Aquatic Sciences 42, 1552–1555.
Lee, D. W. & Prince, E. D. (1995). Analysis of otoliths and vertebrae from ninetag-recaptured Atlantic bluefin tuna (Thunnus thynnus). In Recent Developments inFish Otolith Research (Secor, D. H., Dean, J. M. & Campana, S. E., eds),pp. 361–374. Columbia: University of South Carolina Press.
Lehodey, P. & Grandperrin, R. (1996). Age and growth of the alfonsino Beryx splendensover the seamounts off New Caledonia. Marine Biology 125, 249–258.
Lowerre-Barbieri, S. K., Chittenden, M. E. Jr & Jones, C. M. (1994). A comparison ofa validated otolith method to age weakfish, Cynoscion regalis, with the traditionalscale method. Fishery Bulletin, U.S. 92, 555–568.
Lutz, R. A. & Rhoads, D. C. (1980). Growth patterns within the molluscan shell: anoverview. In Skeletal Growth of Aquatic Organisms (Rhoads, D. C. & Lutz, R. A.,eds), pp. 203–254. New York: Plenum Press.
MacLellan, S. E. & Saunders, M. W. (1995). A natural tag on the otoliths of Pacific hake(Merluccius productus) with implications for age validation and migration. InRecent Developments in Fish Otolith Research (Secor, D. H., Dean, J. M. &Campana, S. E., eds), pp. 567–580. Columbia: University of South Carolina Press.
McFarlane, G. A. & Beamish, R. J. (1995). Validation of the otolith cross-sectionmethod of age determination for sablefish (Anoplopoma fimbria) usingoxytetracycline. In Recent Developments in Fish Otolith Research (Secor, D. H.,Dean, J. M. & Campana, S. E., eds), pp. 319–329. Columbia: University of SouthCarolina Press.
Macy III, W. K. (1995). The application of digital image processing to the aging oflong-finned squid, Loligo pealei, using the statolith. In Recent Developments inFish Otolith Research (Secor, D. H., Dean, J. M. & Campana, S. E., eds),pp. 283–302. Columbia: University of South Carolina Press.
Marshall, S. L. & Parker, S. S. (1982). Pattern identification in the microstructure ofsockeye salmon (Oncorhynchus nerka) otoliths. Canadian Journal of Fisheries andAquatic Sciences 39, 542–547.
Matlock, G. C., Colura, R. L. & McEachron, L. W. (1993). Direct validation of blackdrum (Pogonias cromis) ages determined from scales. Fishery Bulletin, U.S. 91,558–563.
Meekan, M. G. & Fortier, L. (1996). Selection for fast growth during the larval life ofAtlantic cod Gadus morhua on the Scotian Shelf. Marine Ecology Progress Series137, 25–37.
Milton, D. A., Short, S. A., O’Neill, M. F. & Blaber, S. J. M. (1995). Ageing of threespecies of tropical snapper (Lutjanidae) from the Gulf of Carpentaria, Australia,using radiometry and otolith ring counts. Fishery Bulletin, U.S. 93, 103–115.
Moksness, E. (1992). Validation of daily increments in the otolith microstructure ofNorwegian spring-spawning herring (Clupea harengus). ICES Journal of MarineScience 49, 231–235.
Morales-Nin, B. (1988). Age determination in a tropical fish, Lethrinus nebulosus(Forskal, 1775) (Teleosteii: Lethrinidae) by means of otolith interpretation.Investigaciones Pesquera 52, 237–244.

240 . .
Morales-Nin, B. (1989). Growth determination of tropical marine fishes by means ofotolith interpretation and length frequency analysis. Aquatic Living Resources 2,241–253.
Morales-Nin, B. (2000). Review of the growth regulation processes of otolith dailyincrement formation. Fisheries Research 46, 53–67.
Morales-Nin, B. & Aldebert, Y. (1997). Growth of juvenile Merluccius merluccius inthe Gulf of Lions (NW Mediterranean) based on otolith microstructure andlength-frequency analysis. Fisheries Research 30, 77–85.
Morales-Nin, B., Torres, G. J., Lombarte, A. & Recasens, L. (1998). Otolith growth andage estimation in the European hake. Journal of Fish Biology 53, 1155–1168.
Morales-Nin, B., di Stefano, M., Potoschi, A., Massuti, E., Rizzo, P. & Gancitano, S.(1999). Differences between the sagitta, lapillus and vertebra in estimating age andgrowth in juvenile Mediterranean dolphinfish (Coryphaena hippurus). ScientiaMarina 63, 327–336.
Morison, A. K., Coutin, P. C. & Robertson, S. G. (1998a). Age determination of blackbream, Acanthopagrus butcheri (Sparidae), from the Gippsland Lakes of south-eastern Australia indicates slow growth and episodic recruitment. Marine andFreshwater Research 49, 491–498.
Morison, A. K., Robertson, S. G. & Smith, D. G. (1998b). An integrated system forproduction fish aging: image analysis and quality assurance. North AmericanJournal of Fisheries Management 18, 587–598.
Natanson, L. J., Casey, J. G., Kohler, N. E. & Colket IV, T. (1999). Growth of the tigershark, Galeocerdo cuvier, in the western North Atlantic based on tag returns andlength frequencies, and a note on the effects of tagging. Fishery Bulletin, U.S. 97,944–953.
Natanson, L. J., Mello, J. J. & Campana, S. E. (2001). Validated age and growth of theporbeagle shark, Lamna nasus, in the western North Atlantic Ocean. FisheryBulletin, U.S., in press.
Nedreaas, K. (1990). Age determination of Northeast Atlantic Sebastes species. Journalde Conseil Conseil International pour l’Exploration de la Mer 47, 208–230.
Olive, P. J. W. (1980). Growth lines in polychaete jaws (teeth). In Skeletal Growth ofAquatic Organisms (Rhoads, D. C. & Lutz, R. A., eds), pp. 561–594. New York:Plenum Press.
Oliveira, K. (1996). Field validation of annular growth rings in the American eel,Anguilla rostrata, using tetracycline-marked otoliths. Fishery Bulletin, U.S. 94,186–189.
Pannella, G. (1971). Fish otoliths: daily growth layers and periodical patterns. Science173, 1124–1127.
Parrish, B. B. (1958). Comparison of European and North American techniques ofmeasuring nets, of reading ages of fish and of studying growth. InternationalCommission for the Northwest Atlantic Fisheries Special Publication 1,113–138.
Pearson, D. E. (1996). Timing of hyaline-zone formation as related to sex, location, andyear of capture in otoliths of the widow rockfish, Sebastes entomelas. FisheryBulletin, U.S. 94, 190–197.
Petterson, G., Odgaard, B. V. & Renberg, I. (1999). Image analysis as a method toquantify sediment components. Journal of Paleolimnology 22, 443–455.
Planes, S., Laval, P. & Lecomte-Finiger, R. (1991). An otolithic image analysis methodfor ageing and estimating growth of larvae and juveniles of sea-bass (Dicentrarchuslabrax): preliminary results. Scientia Marina 55, 591–597.
Pratt, H. L. Jr & Casey, J. G. (1983). Age and growth of the shortfin mako, Isurusoxyrinchus, using four methods. Canadian Journal of Fisheries and AquaticSciences 40, 1944–1957.
Quinn, T. P., Nemeth, R. S. & McIsaac, D. O. (1991). Homing and straying patterns offall chinook salmon in the Lower Columbia River. Transactions of the AmericanFisheries Society 120, 150–156.
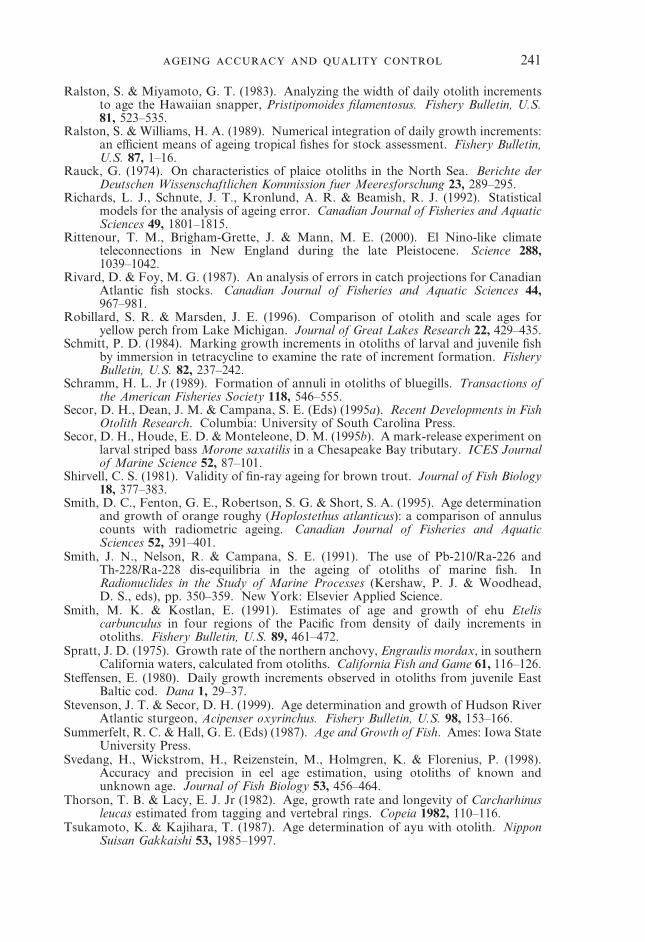
241
Ralston, S. & Miyamoto, G. T. (1983). Analyzing the width of daily otolith incrementsto age the Hawaiian snapper, Pristipomoides filamentosus. Fishery Bulletin, U.S.81, 523–535.
Ralston, S. & Williams, H. A. (1989). Numerical integration of daily growth increments:an efficient means of ageing tropical fishes for stock assessment. Fishery Bulletin,U.S. 87, 1–16.
Rauck, G. (1974). On characteristics of plaice otoliths in the North Sea. Berichte derDeutschen Wissenschaftlichen Kommission fuer Meeresforschung 23, 289–295.
Richards, L. J., Schnute, J. T., Kronlund, A. R. & Beamish, R. J. (1992). Statisticalmodels for the analysis of ageing error. Canadian Journal of Fisheries and AquaticSciences 49, 1801–1815.
Rittenour, T. M., Brigham-Grette, J. & Mann, M. E. (2000). El Nino-like climateteleconnections in New England during the late Pleistocene. Science 288,1039–1042.
Rivard, D. & Foy, M. G. (1987). An analysis of errors in catch projections for CanadianAtlantic fish stocks. Canadian Journal of Fisheries and Aquatic Sciences 44,967–981.
Robillard, S. R. & Marsden, J. E. (1996). Comparison of otolith and scale ages foryellow perch from Lake Michigan. Journal of Great Lakes Research 22, 429–435.
Schmitt, P. D. (1984). Marking growth increments in otoliths of larval and juvenile fishby immersion in tetracycline to examine the rate of increment formation. FisheryBulletin, U.S. 82, 237–242.
Schramm, H. L. Jr (1989). Formation of annuli in otoliths of bluegills. Transactions ofthe American Fisheries Society 118, 546–555.
Secor, D. H., Dean, J. M. & Campana, S. E. (Eds) (1995a). Recent Developments in FishOtolith Research. Columbia: University of South Carolina Press.
Secor, D. H., Houde, E. D. & Monteleone, D. M. (1995b). A mark-release experiment onlarval striped bass Morone saxatilis in a Chesapeake Bay tributary. ICES Journalof Marine Science 52, 87–101.
Shirvell, C. S. (1981). Validity of fin-ray ageing for brown trout. Journal of Fish Biology18, 377–383.
Smith, D. C., Fenton, G. E., Robertson, S. G. & Short, S. A. (1995). Age determinationand growth of orange roughy (Hoplostethus atlanticus): a comparison of annuluscounts with radiometric ageing. Canadian Journal of Fisheries and AquaticSciences 52, 391–401.
Smith, J. N., Nelson, R. & Campana, S. E. (1991). The use of Pb-210/Ra-226 andTh-228/Ra-228 dis-equilibria in the ageing of otoliths of marine fish. InRadionuclides in the Study of Marine Processes (Kershaw, P. J. & Woodhead,D. S., eds), pp. 350–359. New York: Elsevier Applied Science.
Smith, M. K. & Kostlan, E. (1991). Estimates of age and growth of ehu Eteliscarbunculus in four regions of the Pacific from density of daily increments inotoliths. Fishery Bulletin, U.S. 89, 461–472.
Spratt, J. D. (1975). Growth rate of the northern anchovy, Engraulis mordax, in southernCalifornia waters, calculated from otoliths. California Fish and Game 61, 116–126.
Steffensen, E. (1980). Daily growth increments observed in otoliths from juvenile EastBaltic cod. Dana 1, 29–37.
Stevenson, J. T. & Secor, D. H. (1999). Age determination and growth of Hudson RiverAtlantic sturgeon, Acipenser oxyrinchus. Fishery Bulletin, U.S. 98, 153–166.
Summerfelt, R. C. & Hall, G. E. (Eds) (1987). Age and Growth of Fish. Ames: Iowa StateUniversity Press.
Svedang, H., Wickstrom, H., Reizenstein, M., Holmgren, K. & Florenius, P. (1998).Accuracy and precision in eel age estimation, using otoliths of known andunknown age. Journal of Fish Biology 53, 456–464.
Thorson, T. B. & Lacy, E. J. Jr (1982). Age, growth rate and longevity of Carcharhinusleucas estimated from tagging and vertebral rings. Copeia 1982, 110–116.
Tsukamoto, K. & Kajihara, T. (1987). Age determination of ayu with otolith. NipponSuisan Gakkaishi 53, 1985–1997.
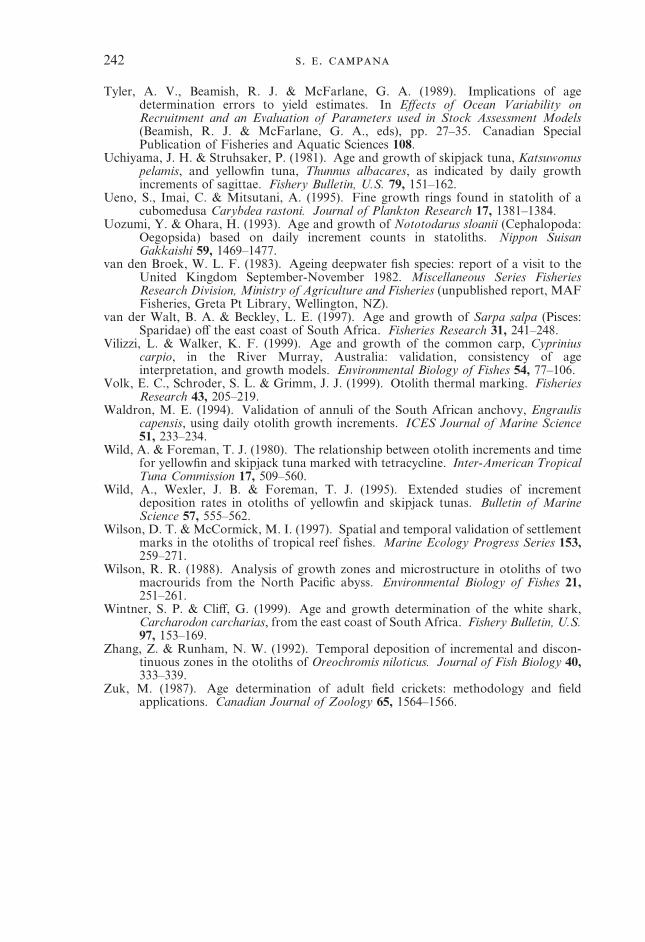
242 . .
Tyler, A. V., Beamish, R. J. & McFarlane, G. A. (1989). Implications of agedetermination errors to yield estimates. In Effects of Ocean Variability onRecruitment and an Evaluation of Parameters used in Stock Assessment Models(Beamish, R. J. & McFarlane, G. A., eds), pp. 27–35. Canadian SpecialPublication of Fisheries and Aquatic Sciences 108.
Uchiyama, J. H. & Struhsaker, P. (1981). Age and growth of skipjack tuna, Katsuwonuspelamis, and yellowfin tuna, Thunnus albacares, as indicated by daily growthincrements of sagittae. Fishery Bulletin, U.S. 79, 151–162.
Ueno, S., Imai, C. & Mitsutani, A. (1995). Fine growth rings found in statolith of acubomedusa Carybdea rastoni. Journal of Plankton Research 17, 1381–1384.
Uozumi, Y. & Ohara, H. (1993). Age and growth of Nototodarus sloanii (Cephalopoda:Oegopsida) based on daily increment counts in statoliths. Nippon SuisanGakkaishi 59, 1469–1477.
van den Broek, W. L. F. (1983). Ageing deepwater fish species: report of a visit to theUnited Kingdom September-November 1982. Miscellaneous Series FisheriesResearch Division, Ministry of Agriculture and Fisheries (unpublished report, MAFFisheries, Greta Pt Library, Wellington, NZ).
van der Walt, B. A. & Beckley, L. E. (1997). Age and growth of Sarpa salpa (Pisces:Sparidae) off the east coast of South Africa. Fisheries Research 31, 241–248.
Vilizzi, L. & Walker, K. F. (1999). Age and growth of the common carp, Cypriniuscarpio, in the River Murray, Australia: validation, consistency of ageinterpretation, and growth models. Environmental Biology of Fishes 54, 77–106.
Volk, E. C., Schroder, S. L. & Grimm, J. J. (1999). Otolith thermal marking. FisheriesResearch 43, 205–219.
Waldron, M. E. (1994). Validation of annuli of the South African anchovy, Engrauliscapensis, using daily otolith growth increments. ICES Journal of Marine Science51, 233–234.
Wild, A. & Foreman, T. J. (1980). The relationship between otolith increments and timefor yellowfin and skipjack tuna marked with tetracycline. Inter-American TropicalTuna Commission 17, 509–560.
Wild, A., Wexler, J. B. & Foreman, T. J. (1995). Extended studies of incrementdeposition rates in otoliths of yellowfin and skipjack tunas. Bulletin of MarineScience 57, 555–562.
Wilson, D. T. & McCormick, M. I. (1997). Spatial and temporal validation of settlementmarks in the otoliths of tropical reef fishes. Marine Ecology Progress Series 153,259–271.
Wilson, R. R. (1988). Analysis of growth zones and microstructure in otoliths of twomacrourids from the North Pacific abyss. Environmental Biology of Fishes 21,251–261.
Wintner, S. P. & Cliff, G. (1999). Age and growth determination of the white shark,Carcharodon carcharias, from the east coast of South Africa. Fishery Bulletin, U.S.97, 153–169.
Zhang, Z. & Runham, N. W. (1992). Temporal deposition of incremental and discon-tinuous zones in the otoliths of Oreochromis niloticus. Journal of Fish Biology 40,333–339.
Zuk, M. (1987). Age determination of adult field crickets: methodology and fieldapplications. Canadian Journal of Zoology 65, 1564–1566.
Recommended