ALUS Benchmark Survey- Norfolk County 2005
Alternative Land Use Services (ALUS)
A benchmark survey of public opinion on the environment in relation to farming and the quality of life in
Norfolk County.
By
Dr. Robert O. Bailey & Loreley Greenslade
Ecometrica Communications Inc.
Prepared on behalf of:
Norfolk Federation of Agriculture Ontario Stewardship (OMNR)
Norfolk Land Stewardship Council Delta Waterfowl Foundation
TD Canada Trust- Friends of the Environment Ontario Federation of Anglers and Hunters
Ontario Wildlife Foundation Norfolk County Soil & Crop Improvement Association
July 18, 2006
Ecometrica Communications Inc.
ALUS Benchmark Survey- Norfolk County 2005 2
EXECUTIVE SUMMARY The Norfolk Federation of Agriculture (NFA) is leading the development of an Alternative Land Use Services or “ALUS” approach to conserving the environment on farmlands in Norfolk County, Ontario. Under ALUS, producers would receive incentives for environmental services, which would provide benefits such as clean air, water and wildlife habitat. Ecometrica Communications Inc. was engaged by ALUS partners to conduct a survey of baseline demographic information in relation to farming and the environment, as part of an ALUS pilot project evaluation. Farm, rural non- farm and urban population segments were surveyed using mail questionnaires in 2005. To qualify for the survey, respondents had to be residents of Norfolk County and at least 18 years of age. A total of 6200 mail questionnaires were forwarded and 731 (11.7%) were sufficiently completed to include in the survey. Of these, 250 were from farm respondents, 211 from rural non- farm and 270 from urban respondents. Profiles of Respondents The average length of residency in Norfolk County for farmers was 45.8 years, which was significantly longer than the rural non- farm group (36.1 years) and the urban residents (33.3 years). The vast majority of all residents intended on remaining in Norfolk County. Two- thirds of respondents were male, with a higher proportion of females responding in the urban audience. The mean age of respondents (56-57) was the same for all three groups. There was little difference in education levels for each group, with the exception that many more university graduates appeared in the non- farm segments. 40% of rural non- farm and urban residents were retired, but only 12.2% of farmers. Farmers, professionals, skilled trades- people and sales- service industry were the occupational categories most reported. Two- thirds of farm respondents reported their incomes had decreased over the past year, while incomes in more than half of the non- farm groups remained the same. More respondents in all groups reported their incomes decreasing than increasing over the past year. Views on the State of the Rural Environment Farm residents viewed the environment in Norfolk County more positively than did rural non-farm and urban residents, suggesting that farmers and non- farm residents may differ in their perspective on what comprises a high quality
Ecometrica Communications Inc.
ALUS Benchmark Survey- Norfolk County 2005 3
environment on farmland. Farm residents were also more likely to feel that farming had a positive impact on the rural environment. Air quality was the most important environmental issue mentioned by half of urban and one- third of farm and rural non- farm respondents. Water quality was the second highest ranking environmental issue for all groups. Several other environmental issues were cited, but at a much lower frequency than air and water quality. Respondent groups were pessimistic about the outlook for the environment in Norfolk County. Few respondents thought that the quality of the environment would improve over the next three years. Appearance of the Rural Countryside in Norfolk County Almost three-quarters (72%) of the survey respondents rated the countryside as somewhat or very attractive and 74% indicated that the appearance of the countryside was very important to them. The Economy in Norfolk County Respondents in all groups agreed that the economic health of Norfolk County was less than ideal. Overall, the same proportion of respondents (39%) indicated that the economy was poor or very poor, or were neutral on the issue (neither poor nor good)(39%). Few residents thought the economy would improve over the next three years, although twice as many urban residents (14%) thought the economy would improve than farmers (7%). Both farmers (56%) and rural non- farm residents (50%) predicted the economy would decline. Urban respondents (58%) were more optimistic, and predicted that the economy would either stay the same or improve. Predictions for the future health of the economy may be driven by changes in personal income in the recent past. Among farm respondents, 40% reported both that their own income had declined over the past year, and they predicted that the economic health of the county would decline. Among the other groups, only 18% of rural non-farm and 11% of urban respondents showed this dual pattern of responses. Social Well-Being in Norfolk County Respondents agreed that social well- being or quality of life in Norfolk County was good. 57% of the respondents rated the quality of life as good or very good, and 33% of respondents felt it was neither good nor poor. Although social well- being is often linked to the economy and income, there were no differences detected among the three groups in their perceptions of social well- being at this time, in spite of significant differences in the direction of personal incomes among the three groups. Approximately three-quarters of the respondents in all residence groups indicated that quality of life was very important to them.
Ecometrica Communications Inc.
ALUS Benchmark Survey- Norfolk County 2005 4
Groups differed in how they predicted quality of life would change over the next few years. A similar proportion in each of the three residence groups predicted no change in quality of life over the next three years, but 42% of farm respondents thought it would decline, compared to only 26% of urban respondents. This mirrors perceptions concerning the health of the economy among the three groups, and suggests that economic health may play a particularly important role in quality of life in the future for those respondents who depend on farming for their livelihood. Alternative Land Use Services (ALUS) The ALUS concept was first introduced into Norfolk County in 2002, and an ALUS workshop was held in the county early in 2003. The Norfolk Federation of Agriculture has continued to develop and promote an ALUS pilot project. At the time of the survey in 2005, little implementation on the ground had taken place. Accordingly, 46% farm respondents indicated some awareness of ALUS, compared to 30% of rural non- farm and 25% of urban residents. Very few respondents were participating in the pilot project in 2005. Farmers were much more likely than those in other groups to be aware of the efforts that farmers are making to maintain the environment on their land. Two- thirds of urban residents and half of rural non- farm respondents were unaware of these efforts. The perceived effectiveness of environmental stewardship efforts undertaken by farmers was naturally affected by awareness. Farm respondents rated these stewardship efforts quite positively, but almost one-half of urban and over one- third of rural non- farm respondents had no opinion, or just didn’t know about the effectiveness of these efforts. The uncertainty of urban and rural non- farm groups about the effectiveness of farmers’ environmental efforts, was the single largest knowledge gap between farmers and other residents of Norfolk County identified in the survey results. Farm respondents believed quite strongly that farmers should be paid to produce environmental services on their land. Farm respondents viewed incentives and compensation as relatively more important to achieving environmental benefits than other groups. A majority of non- farm residents in Norfolk County believed that farmers should be, or possibly could be paid to deliver environmental services. Two- thirds of both urban and rural non- farm residents responded “yes” or “maybe” when asked if they believed farmers should be paid to produce environmental services. 29% of rural non- farm, 23% of urban residents and 6% of farmers did not think farmers should be paid for producing these services. Farm respondents were more aware of the ALUS concept and could identify more positive aspects than the rural non- farm and urban respondents. Farmers
Ecometrica Communications Inc.
ALUS Benchmark Survey- Norfolk County 2005 5
indicated that ALUS incentives would provide recognition for environmental efforts and financial support for farmers who choose to dedicate a portion of their land for conservation. Some farmers felt that such services benefit everyone, and everyone should pay for the services. Lacking awareness, few non- farm respondents could or would identify a positive aspect of initiatives such as ALUS. Non- farm respondents most frequently suggested that ALUS would provide financial support and recognition to farmers for environmental efforts, and benefits to the environment. 52% of all survey respondents did not raise a single concern when asked about paying farmers to provide environmental services under ALUS. No single issue was raised by more than 13% of respondents in any group, and most concerns were mentioned by fewer than 5% of respondents for the entire sample. One in ten farm respondents were concerned about the eligibility requirements for compensation under ALUS, and whether this compensation is dispensed fairly and equally, in amounts that adequately compensate for the loss of farm income. A few farm respondents (8%) voiced concerns about government over-involvement, interference and bureaucracy. A further 6% raised concerns about possible abuse or cheating, and 6% feared that farmers may lose control of their own land if they accept payment from a government. Rural non-farm (13%) and urban (9%) respondents expressed concern about monitoring the program, ensuring compliance and project evaluation. Similarly, 12% of rural non- farm and 8% of urban groups registered concern about potential abuse or cheating the program. Approximately one in ten non- farm respondents raised concerns about where the money was coming from and who is paying and the possibility of tax increases. About the same number of non- farm respondents thought that farmers had a moral obligation to the environment and should provide services without being paid. A majority (71%) of farmers believe they should be compensated for crop or livestock damage caused by wildlife, while 21% suggested the issue may need further consideration. Approximately two- thirds of non- farm audiences responded with “yes” or “maybe” to the notion of compensating farmers for these losses. In contrast, 26% of the non- farm group and 31% of the urban respondents did not believe farmers should be compensated for wildlife damage. The ALUS benchmark survey has demonstrated considerable public support in Norfolk County for the concept of paying farmers to produce environmental benefits on their land. Residents are highly aware of some environmental issues in the county and realize there is a close relationship between farming and the environment. Most residents also believe the environment will remain the same or decline further over the next three years. The environment, like the economy and social well- being, is extremely important to all residents of the county, as a life support system, a contributor to the economy and quality of life, and an outdoor re- creational haven.
Ecometrica Communications Inc.
ALUS Benchmark Survey- Norfolk County 2005 6
While the prospect of delivering ecological goods and services on farmland has a good foundation of public support in Norfolk County, it is important not to overstate this support. If the overall survey sample is weighted to reflect the residential composition of Norfolk County, almost one-quarter (24%) of county residents would be opposed to paying farmers to provide environmental services on their land (see Appendix A). A similar proportion of the population (26.0%) would not feel the need to compensate farmers for crops or livestock damaged by wildlife on their land. However, that leaves a large proportion of the population who either support the concept of paying farmers for environmental services, or who could perhaps be persuaded with proper marketing of the concept and education. On these premises, an effective, well- run and properly communicated ALUS project would most likely receive good support from the majority of Norfolk County residents. Ecometrica Communications Inc.
ALUS Benchmark Survey- Norfolk County 2005 7
TABLE OF CONTENTS Executive Summary………………………………………………..……………...02 Introduction…………………………………………………………………………..10 Background on Norfolk County………………………..……………………….12 SURVEY RESULTS: SECTION ONE- Profiles of Respondents Type of Residence of Survey Respondents………………………………………..13 Gender & Age of Respondents………………………………………………………14 Education Level of Respondents…………………………………………………….15 Occupation of Respondents………………………………………………………….16 Change in Family Income over Past Year…………………………………………..16 SUMMARY SECTION ONE: Profiles of Respondents……………….....17 SURVEY RESULTS: SECTION TWO……………………………….………18 YOU AND THE ENVIRONMENT IN NORFOLK COUNTY Participation in Environment- Related Outdoor Recreation………………………19 Frequency of Participation in Environmental Outdoor Activities………………....20 Rating of the Importance of the Environment in Norfolk County…………………22 SUMMARY: You and the Environment in Norfolk County……………..23 YOUR VIEWS ON THE STATE OF THE RURAL ENVIRONMENT Rating of the Current Quality of Environment by Farm, Rural Non- Farm and Urban Groups…………………………………………………………….24 Perceived Impact of Farming on the Rural Environment in Norfolk County……………………………………………………………………..26 Most Important Environmental Issues that Need to be Resolved in Norfolk County……………………………………………………………………..28 Trend in the Quality of the Environment over the next 3 Years in Norfolk County……………………………………………………………30 SUMMARY: Your Views on the State of the Rural Environment.…...31 Ecometrica Communications Inc.
ALUS Benchmark Survey- Norfolk County 2005 8
APPEARANCE OF THE COUNTRYSIDE IN NORFOLK COUNTY Ratings of the Overall Appearance of the Rural Countryside in Norfolk County……………………………………………………………………..32 Ratings of the Importance of the Appearance of the Countryside in Norfolk County……………………………………………………………………..34 SUMMARY: Appearance of the Rural Countryside in Norfolk County………………………………………………………………….35 THE ECONOMY IN NORFOLK COUNTY Ratings of the Current Overall Economic Health of Norfolk County……………..35 How the Economy will Change over the next 3 Years in Norfolk County……………………………………………………………………...37 Rating of the Importance of the Economy or Economic Health of Norfolk County……………………………………………………………………...38 SUMMARY: The Economy in Norfolk County……………………………..39 SOCIAL WELL- BEING IN NORFOLK COUNTY Rating of the Overall State of Social Well- Being in Norfolk County……………..40 How Social Well- Being will Change over the next 3 Years in Norfolk County……………………………………………………………………...42 Ratings of the Importance of Social Well- Being in Norfolk County……………...43 SUMMARY: Social Well- Being in Norfolk County……………………….44 ALTERNATIVE LAND USE SERVICES (ALUS) Awareness of the ALUS Pilot Project in Norfolk County………………………….45 Current Participation in the ALUS Pilot Project……………………………………46 Awareness of Efforts by Farmers to Maintain the Environment on their Land…………………………………………………………………………..47 Perceived Effectiveness of Stewardship/ Conservation Efforts by Farmers……………………………………………………………………48 Should Farmers be Paid to Produce Environmental Services /Benefits on their Land……………………………………………………………….49 Positive Aspects of the ALUS Concept……………………………………………..50 Concerns about the ALUS Concept………………………………………………....51 Perceived Importance of Incentives to Farmers in Maintaining the Environment on Farmland in Norfolk County……………………………….....52 Should Farmers be Compensated for Crop or Livestock Damage caused by Wildlife on their Land…………………………………………………….53
Ecometrica Communications Inc.
ALUS Benchmark Survey- Norfolk County 2005 9
SUMMARY: Alternative Land Use Services………………………………..54 ACKNOWLEDGEMENTS………………………………………………………..57 SURVEY METHODOLOGY……………………………………………………..57 SURVEY QUESTIONNAIRE APPENDIX A
INTRODUCTION Ecometrica Communications Inc.
ALUS Benchmark Survey- Norfolk County 2005 10
The Norfolk Federation of Agriculture (NFA) is leading the development of an Alternative Land Use Services or “ALUS” approach to conserving the environment on farmlands in Norfolk County, Ontario. ALUS is a landscape conservation concept developed by the grassroots agricultural community in Canada. Under ALUS, producers would receive a variety of incentives to establish and maintain environmental services on their land, which would provide ongoing benefits such as clean air, water and wildlife habitat. The NFA, Delta Waterfowl and a number of Ontario ALUS partners engaged the services of Ecometrica Communications Inc. to conduct a survey of baseline demographic information in relation to farming and the environment in Norfolk County, which will be used to evaluate key aspects of the ALUS pilot project, when the survey is repeated in 3 to 5 years. This survey is only part of a larger ALUS evaluation undertaken by partners in the county. Farm, rural non- farm and urban population segments in Norfolk County (which may also be called “groups” or “audiences” in this report), were surveyed using a series of mail questionnaires between May and October, 2005. The primary purpose was to establish benchmarks of public opinion for the three target groups on the status of the environment, economy and quality of life in the county, in advance of the implementation of the ALUS pilot project. The survey questionnaire is included at the end of the report. Additional survey questions were designed to probe public opinion relevant to the concept of providing incentives to producers for ecological goods and services (EG&S), and to quantify views among target groups on a range of environmental and farming issues, concerns and opportunities arising during ALUS discussions in Norfolk County over the past three years. This information will help scope the depth of these issues within and among the target audiences, and foster public support for ALUS, while informing the implementation approaches used to establish EG&S delivery under the ALUS pilot project. To qualify for the survey, respondents had to be residents of Norfolk County and at least 18 years of age. A total of 6200 mail questionnaires were forwarded to potential respondents and of these, 731 (11.7%) were received and sufficiently completed to include in the survey. Of these, 250 were from farm respondents, 211 from rural non- farm and 270 from urban respondents. More details on survey methodology appear near the end of this report. Survey results are presented in two sections. The first section of the report provides basic demographic information on characteristics of survey respondents in Norfolk County. The second section reports the principal findings of the benchmark survey.
Ecometrica Communications Inc.
ALUS Benchmark Survey- Norfolk County 2005 11
Survey results in section two are introduced with lead- in text and a specific question as it appeared in the mail questionnaire, followed by a compilation of the response data in cross tabulation tables and graphs. Analytical considerations are presented with the response data where needed for clarity. Results are grouped under headings in section two (see below), to address specific areas of interest in the survey, and each of these is concluded with a summary of findings. Survey results are grouped under the following headings: Section One
- Profile of Respondents Section Two
- You and the Environment in Norfolk County - Your Views on the State of the Rural Environment - Appearance of the Countryside in Norfolk County - The Economy in Norfolk County - Social Well- Being in Norfolk County - Alternative Land Use Services
Readers will be most interested in responses quantified for each question within target audiences, such as the farm group, and in comparisons with the rural non- farm and urban segments. Many similarities and differences in opinion among the three groups were remarkably consistent throughout the survey on a range of issues. Where differences observed in the responses are sufficiently greater than those anticipated by chance alone, (the information should be correct at least 19 times out of 20), a statistical notation accompanies the results. Statistical details are included in Appendix A. Information for each target group is presented in tabular or graphical form, or usually both where this may be helpful to the reader. Farm, rural non- farm and urban audiences include all residents of Norfolk County, however the latter two groups significantly out number the farm community. Where appropriate, the graphical information is combined into a “weighted total” for readers who wish to understand public opinion across the entire community, in addition to the individual target audiences. The weighting has been used to account for the differences in size of each target population segment with the number of farmers representing 9.2%, number of rural non-farmers representing 47.5%, and the urban folk representing 43.6% of the total population. And this helps present a “picture” of the data that is more comparable to standard polling information. Please note that “Totals” presented in most cross tabulation tables are not “weighted”, but reflect simple averages unless specifically noted. The Norfolk County benchmark survey may be unique in elucidating the demographics of farm, rural non- farm and urban groups and their relative views on farming, environmental issues and potential solutions at a municipal level in
Ecometrica Communications Inc.
ALUS Benchmark Survey- Norfolk County 2005 12
Canada. The survey shows clear and consistent patterns (including many differences) of opinion among the three groups on the environment and farming, which should be relevant to the development and implementation of ALUS/ EG&S policy and programs in Norfolk County and beyond. BACKGROUND ON NORFOLK COUNTY Norfolk County is located in southwestern Ontario on the corridor between the Greater Toronto Area/ Hamilton, and the Windsor region. The county is approximately 1,628 square kms in size, with a population of 62,000 people. There are 1,651 farms in the county, with 292,703 acres (177,081 ha) of farmed land, averaging 177 acres (71 ha) per farm. The county is a diverse physiographic region supporting a wide range of small grain, field crop and livestock agriculture. The agricultural landscape within Norfolk County still supports a diversity of natural features including Carolinian forest, coldwater streams, abundant groundwater, a rich diversity of flora and fauna, and the largest concentration of species at risk in all of Canada.
Ecometrica Communications Inc.
ALUS Benchmark Survey- Norfolk County 2005 13
SURVEY RESULTS: SECTION ONE Profiles of Respondents
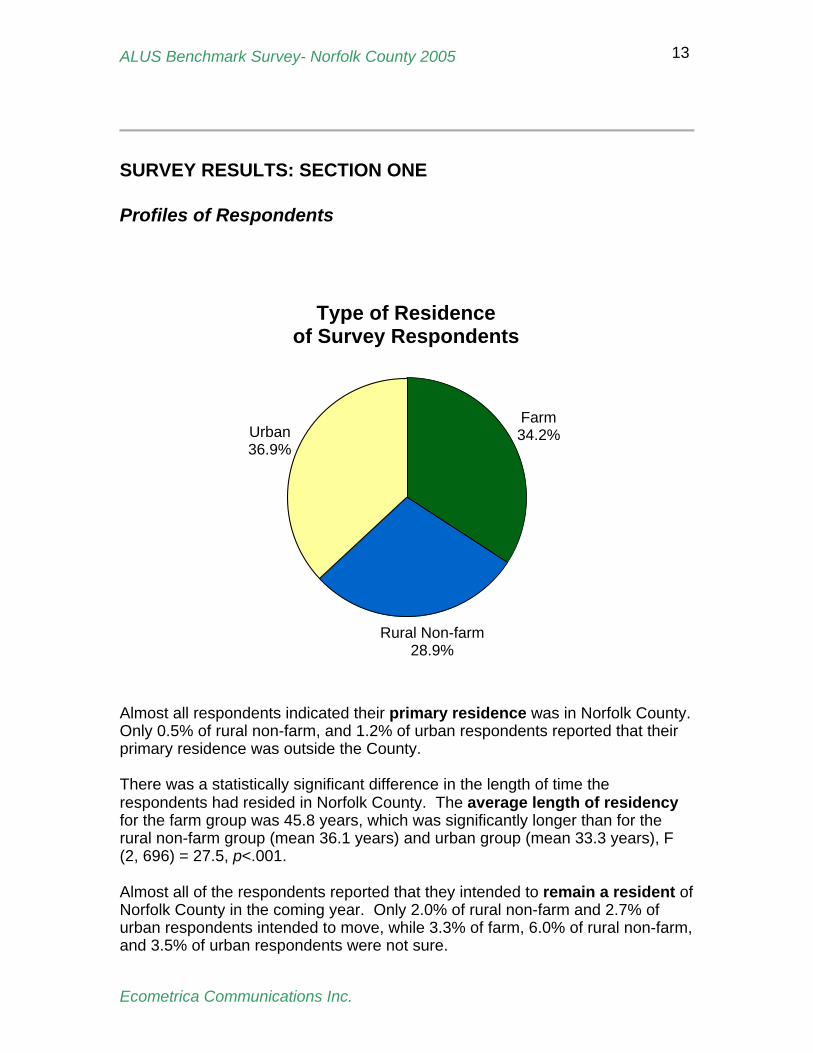
Type of Residence of Survey Respondents
Rural Non-farm28.9%
Urban36.9%
Farm34.2%
Almost all respondents indicated their primary residence was in Norfolk County. Only 0.5% of rural non-farm, and 1.2% of urban respondents reported that their primary residence was outside the County. There was a statistically significant difference in the length of time the respondents had resided in Norfolk County. The average length of residency for the farm group was 45.8 years, which was significantly longer than for the rural non-farm group (mean 36.1 years) and urban group (mean 33.3 years), F (2, 696) = 27.5, p<.001. Almost all of the respondents reported that they intended to remain a resident of Norfolk County in the coming year. Only 2.0% of rural non-farm and 2.7% of urban respondents intended to move, while 3.3% of farm, 6.0% of rural non-farm, and 3.5% of urban respondents were not sure.
Ecometrica Communications Inc.
ALUS Benchmark Survey- Norfolk County 2005 14
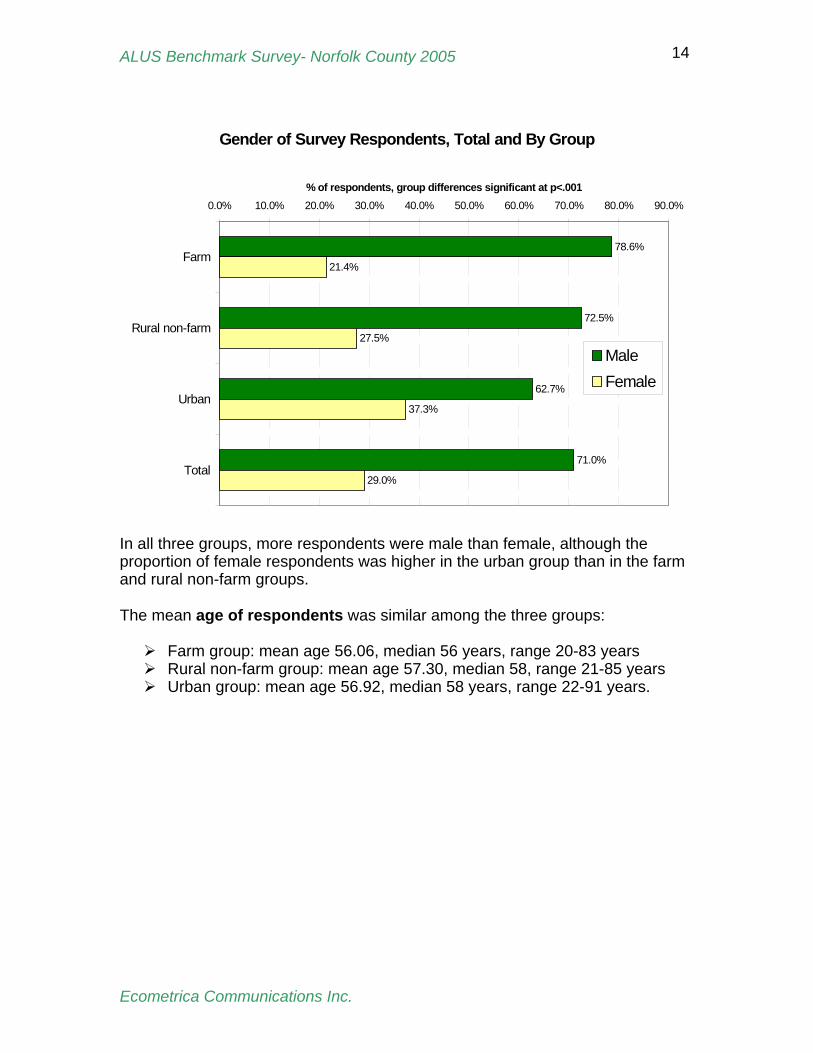
Gender of Survey Respondents, Total and By Group
78.6%
72.5%
62.7%
71.0%
21.4%
27.5%
37.3%
29.0%
0.0% 10.0% 20.0% 30.0% 40.0% 50.0% 60.0% 70.0% 80.0% 90.0%
Farm
Rural non-farm
Urban
Total
% of respondents, group differences significant at p<.001
MaleFemale
In all three groups, more respondents were male than female, although the proportion of female respondents was higher in the urban group than in the farm and rural non-farm groups. The mean age of respondents was similar among the three groups:
Farm group: mean age 56.06, median 56 years, range 20-83 years Rural non-farm group: mean age 57.30, median 58, range 21-85 years Urban group: mean age 56.92, median 58 years, range 22-91 years.
Ecometrica Communications Inc.
ALUS Benchmark Survey- Norfolk County 2005 15
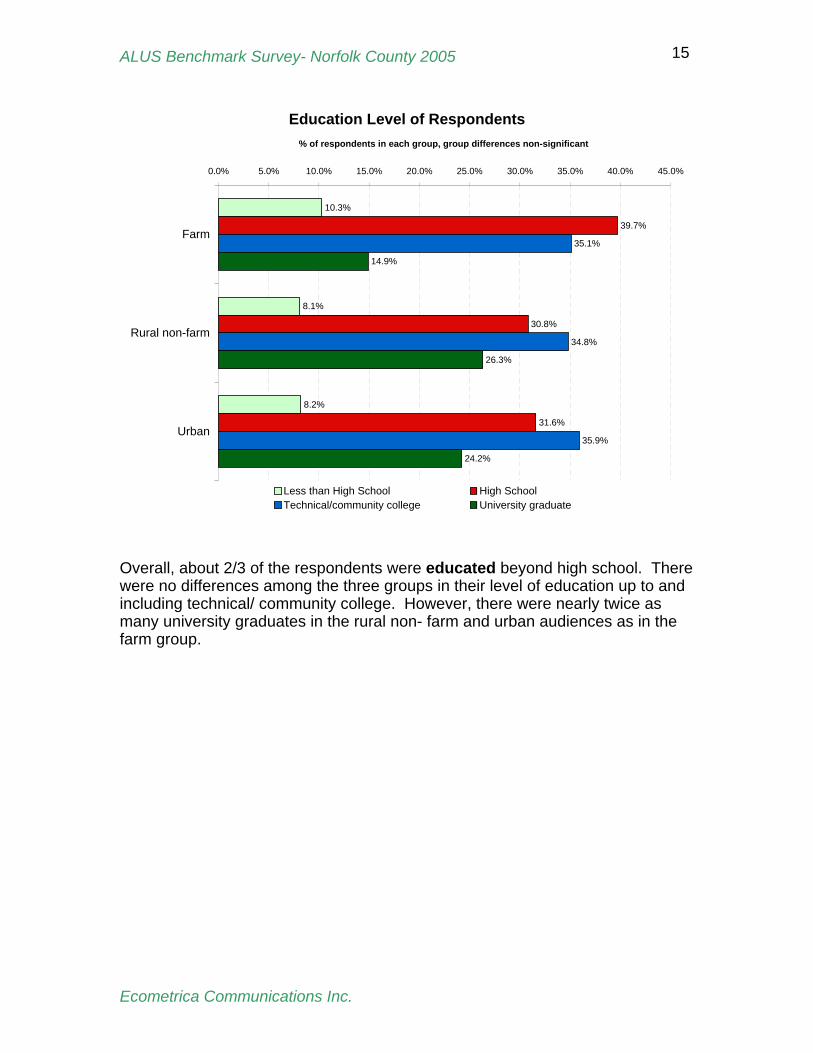
Education Level of Respondents
10.3%
8.1%
8.2%
39.7%
30.8%
31.6%
35.1%
34.8%
35.9%
14.9%
26.3%
24.2%
0.0% 5.0% 10.0% 15.0% 20.0% 25.0% 30.0% 35.0% 40.0% 45.0%
Farm
Rural non-farm
Urban
% of respondents in each group, group differences non-significant
Less than High School High SchoolTechnical/community college University graduate
Overall, about 2/3 of the respondents were educated beyond high school. There were no differences among the three groups in their level of education up to and including technical/ community college. However, there were nearly twice as many university graduates in the rural non- farm and urban audiences as in the farm group.
Ecometrica Communications Inc.
ALUS Benchmark Survey- Norfolk County 2005 16
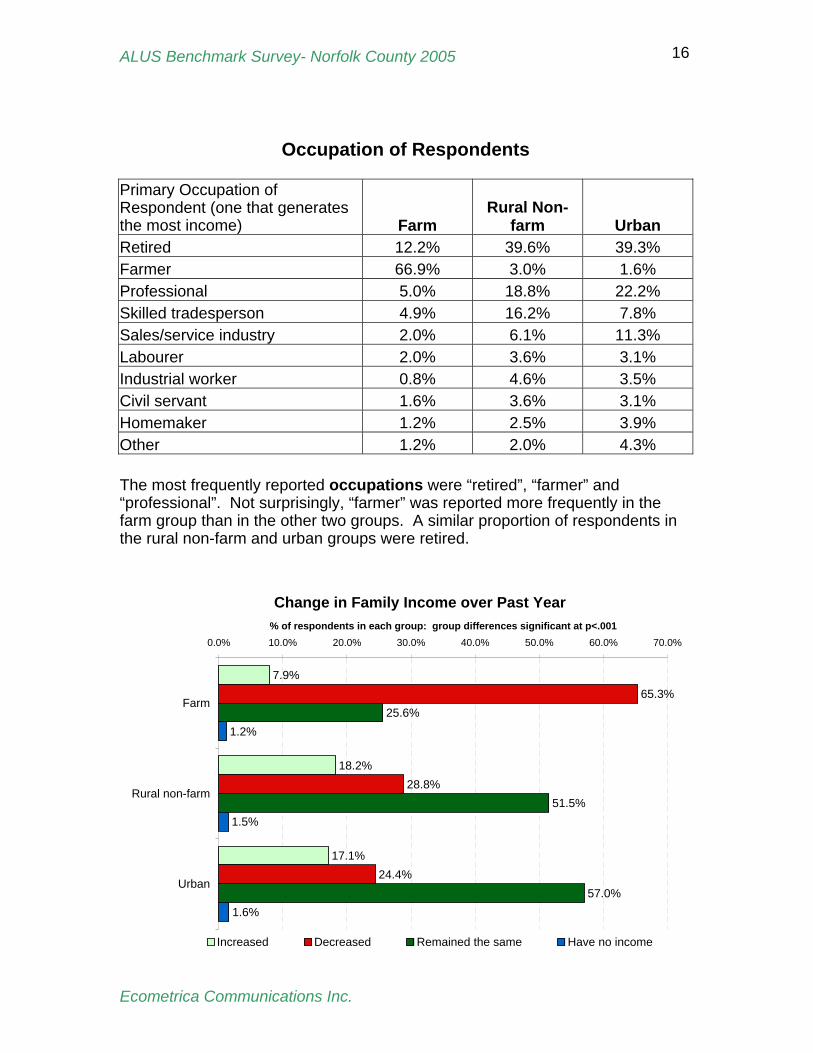
Occupation of Respondents
Primary Occupation of Respondent (one that generates the most income) Farm
Rural Non-farm Urban
Retired 12.2% 39.6% 39.3% Farmer 66.9% 3.0% 1.6% Professional 5.0% 18.8% 22.2% Skilled tradesperson 4.9% 16.2% 7.8% Sales/service industry 2.0% 6.1% 11.3% Labourer 2.0% 3.6% 3.1% Industrial worker 0.8% 4.6% 3.5% Civil servant 1.6% 3.6% 3.1% Homemaker 1.2% 2.5% 3.9% Other 1.2% 2.0% 4.3% The most frequently reported occupations were “retired”, “farmer” and “professional”. Not surprisingly, “farmer” was reported more frequently in the farm group than in the other two groups. A similar proportion of respondents in the rural non-farm and urban groups were retired.
Change in Family Income over Past Year
7.9%
18.2%
17.1%
65.3%
28.8%
24.4%
25.6%
51.5%
57.0%
1.2%
1.5%
1.6%
0.0% 10.0% 20.0% 30.0% 40.0% 50.0% 60.0% 70.0%
Farm
Rural non-farm
Urban
% of respondents in each group: group differences significant at p<.001
Increased Decreased Remained the same Have no income
Ecometrica Communications Inc.
ALUS Benchmark Survey- Norfolk County 2005 17
The direction of change in family income over the previous year differed significantly among the three groups, Chi2 (6, N=696)=102.06, p<.001. While slightly more than one half of the urban and rural non-farm respondents reported that their income had stayed the same over the past year, almost 2/3 of farm respondents indicated that their family income had decreased. Only 7.9% of farm respondents saw their income increase, which is less than half as many rural non-farm and urban respondents who also reported an increase. SUMMARY SECTION ONE: Profiles of Respondents Virtually all respondents had their primary residence in Norfolk County. The average length of residency for farmers was 45.8 years, which was significantly longer than the rural non- farm group (36.1 years) and the urban residents (33.3 years). The vast majority of all residents intended on remaining in Norfolk County. Approximately two- thirds of respondents were male, with a higher proportion of females responding in the urban audience. The mean age of respondents (56-57) was the same for all three groups. Two- thirds of respondents had post- secondary education and there was little difference in education levels for each group, with the exception that many more university graduates appeared in the rural non- farm and urban segments. Almost 40% of rural non- farm and urban residents were retired, but only 12.2% of farmers in the county listed their occupation as retired. Farmers, professionals, skilled trades- people and sales- service industry were the occupational categories most reported. Slightly over 20% of the farm group listed an occupation other than farming as their primary occupation. This is commonplace in the farm community across Canada, as many farmers supplement their income with off- farm employment. One of the greatest differences observed among the three target segments in the survey was the direction of change in family income over the previous year. While more than half of the urban and rural non- farm respondents reported that their income stayed the same, two- thirds of farm respondents indicated that their incomes had decreased over the past year. In total, 33.5% of farm incomes increased or remained the same over the past year, compared to 69.7% for the rural non- farm group and 74.1% for urban residents. It is noteworthy that more respondents in all groups reported their incomes decreasing than increasing over the past year in Norfolk County.
Ecometrica Communications Inc.
ALUS Benchmark Survey- Norfolk County 2005 18
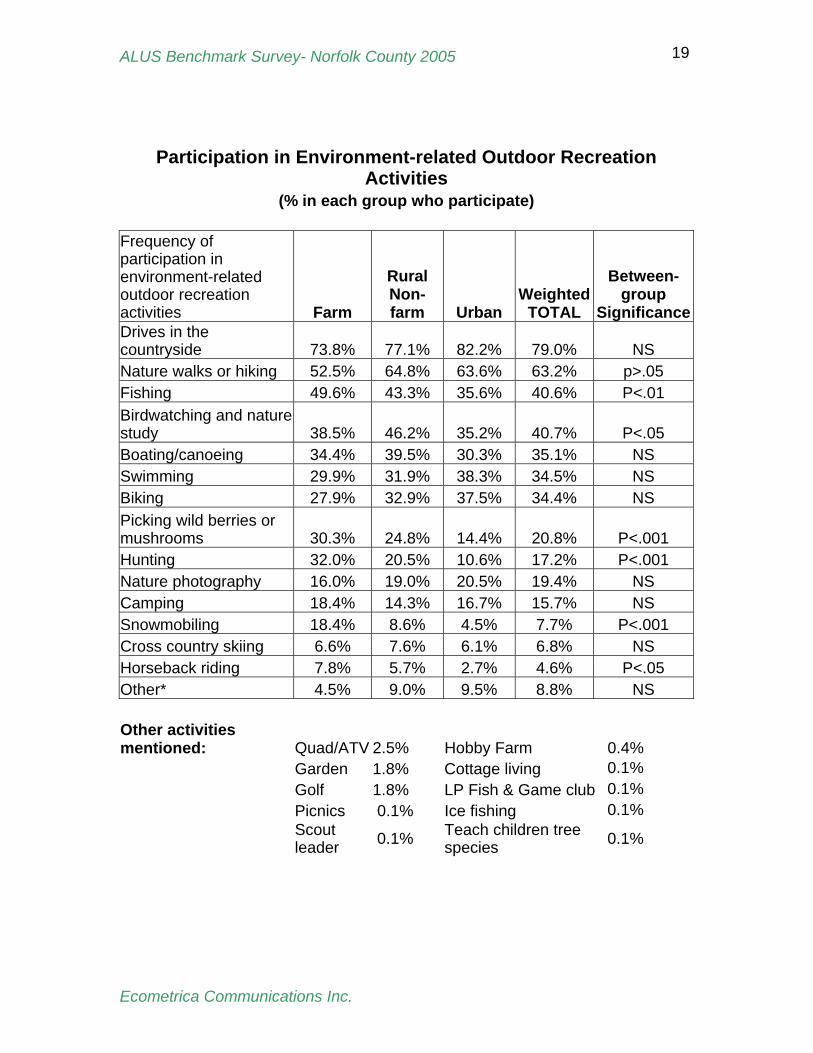
SURVEY RESULTS: SECTION TWO YOU AND THE ENVIRONMENT IN NORFOLK COUNTY: This section of the survey explores your relationship and interest in the environment in Norfolk County. We want to know how important (or unimportant) the environment is to you, and what kinds of nature-related activities (excluding job-related activities like farming or forestry) you may undertake that put you in close contact with the environment. We want to know your positive and negative views about the environment. 1. Did you participate in any of the following environment-related outdoor recreational activities in Norfolk County over the past year? (“Environment-related” means that experiencing nature is an important part of the activity to you. Check all activities that apply.) Frequencies in the table below are presented for each group and for the respondents as a whole. Between group differences are summarized in the right-most column. The activities are listed from the most frequently mentioned (overall) to the least-frequently mentioned activities.
Ecometrica Communications Inc.
ALUS Benchmark Survey- Norfolk County 2005 19
Participation in Environment-related Outdoor Recreation Activities
(% in each group who participate) Frequency of participation in environment-related outdoor recreation activities Farm
Rural Non-farm Urban
Weighted TOTAL
Between-group
SignificanceDrives in the countryside 73.8% 77.1% 82.2% 79.0% NS Nature walks or hiking 52.5% 64.8% 63.6% 63.2% p>.05 Fishing 49.6% 43.3% 35.6% 40.6% P<.01 Birdwatching and nature study 38.5% 46.2% 35.2% 40.7% P<.05 Boating/canoeing 34.4% 39.5% 30.3% 35.1% NS Swimming 29.9% 31.9% 38.3% 34.5% NS Biking 27.9% 32.9% 37.5% 34.4% NS Picking wild berries or mushrooms 30.3% 24.8% 14.4% 20.8% P<.001 Hunting 32.0% 20.5% 10.6% 17.2% P<.001 Nature photography 16.0% 19.0% 20.5% 19.4% NS Camping 18.4% 14.3% 16.7% 15.7% NS Snowmobiling 18.4% 8.6% 4.5% 7.7% P<.001 Cross country skiing 6.6% 7.6% 6.1% 6.8% NS Horseback riding 7.8% 5.7% 2.7% 4.6% P<.05 Other* 4.5% 9.0% 9.5% 8.8% NS Other activities mentioned: Quad/ATV 2.5% Hobby Farm 0.4% Garden 1.8% Cottage living 0.1% Golf 1.8% LP Fish & Game club 0.1% Picnics 0.1% Ice fishing 0.1%
Scout leader 0.1% Teach children tree
species 0.1%
Ecometrica Communications Inc.
ALUS Benchmark Survey- Norfolk County 2005 20
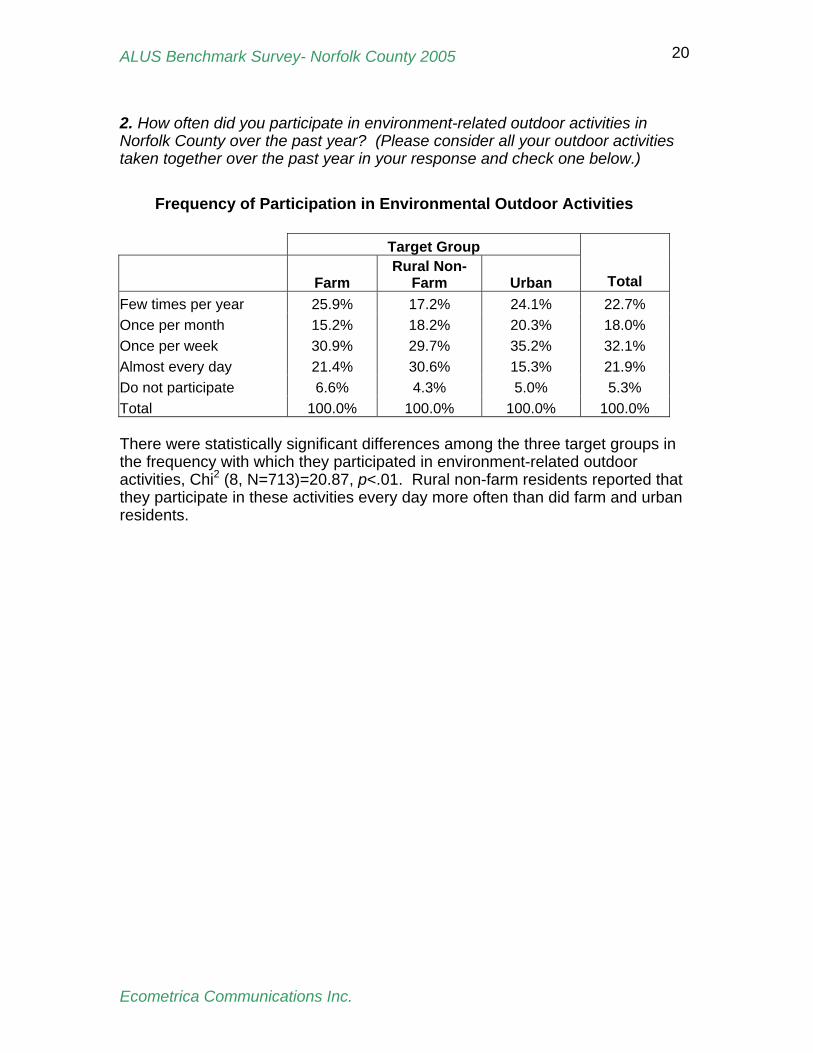
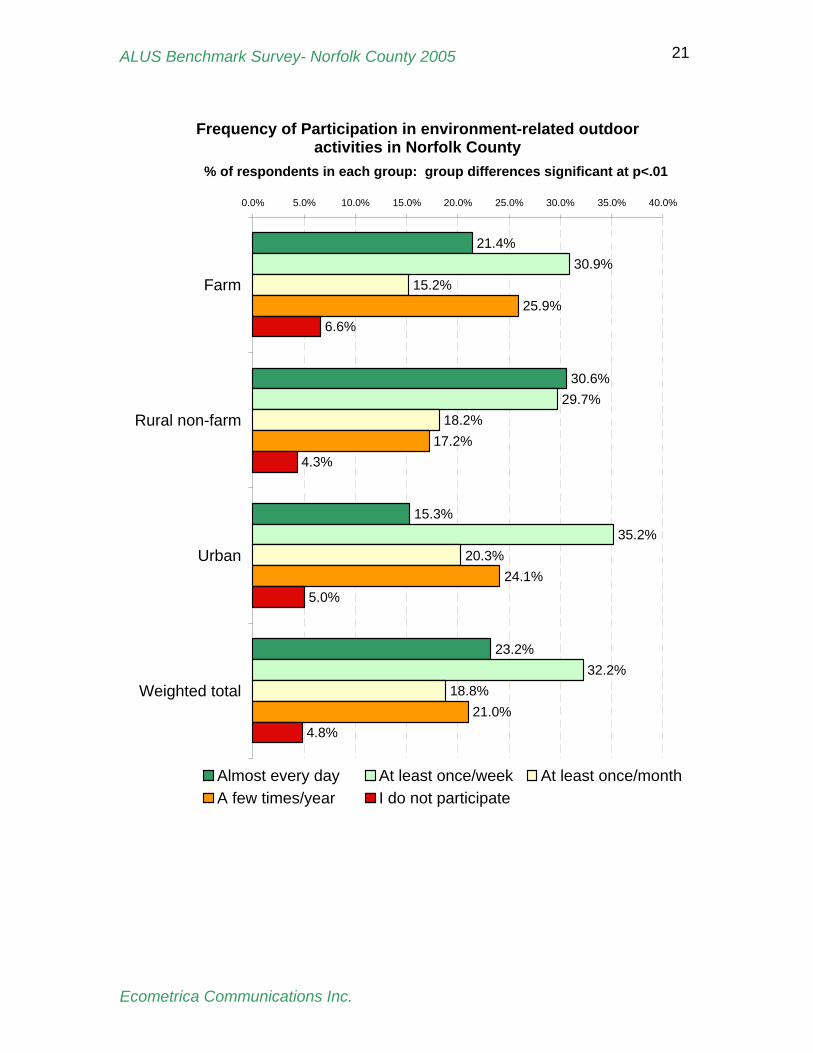
2. How often did you participate in environment-related outdoor activities in Norfolk County over the past year? (Please consider all your outdoor activities taken together over the past year in your response and check one below.)
Frequency of Participation in Environmental Outdoor Activities Target Group
Farm Rural Non-
Farm Urban Total Few times per year 25.9% 17.2% 24.1% 22.7% Once per month 15.2% 18.2% 20.3% 18.0% Once per week 30.9% 29.7% 35.2% 32.1% Almost every day 21.4% 30.6% 15.3% 21.9% Do not participate 6.6% 4.3% 5.0% 5.3% Total 100.0% 100.0% 100.0% 100.0% There were statistically significant differences among the three target groups in the frequency with which they participated in environment-related outdoor activities, Chi2 (8, N=713)=20.87, p<.01. Rural non-farm residents reported that they participate in these activities every day more often than did farm and urban residents.
Ecometrica Communications Inc.
ALUS Benchmark Survey- Norfolk County 2005 21
Frequency of Participation in environment-related outdoor activities in Norfolk County
21.4%
30.6%
15.3%
23.2%
30.9%
29.7%
35.2%
32.2%
15.2%
18.2%
20.3%
18.8%
25.9%
17.2%
24.1%
21.0%
6.6%
4.3%
5.0%
4.8%
0.0% 5.0% 10.0% 15.0% 20.0% 25.0% 30.0% 35.0% 40.0%
Farm
Rural non-farm
Urban
Weighted total
% of respondents in each group: group differences significant at p<.01
Almost every day At least once/week At least once/monthA few times/year I do not participate
Ecometrica Communications Inc.
ALUS Benchmark Survey- Norfolk County 2005 22
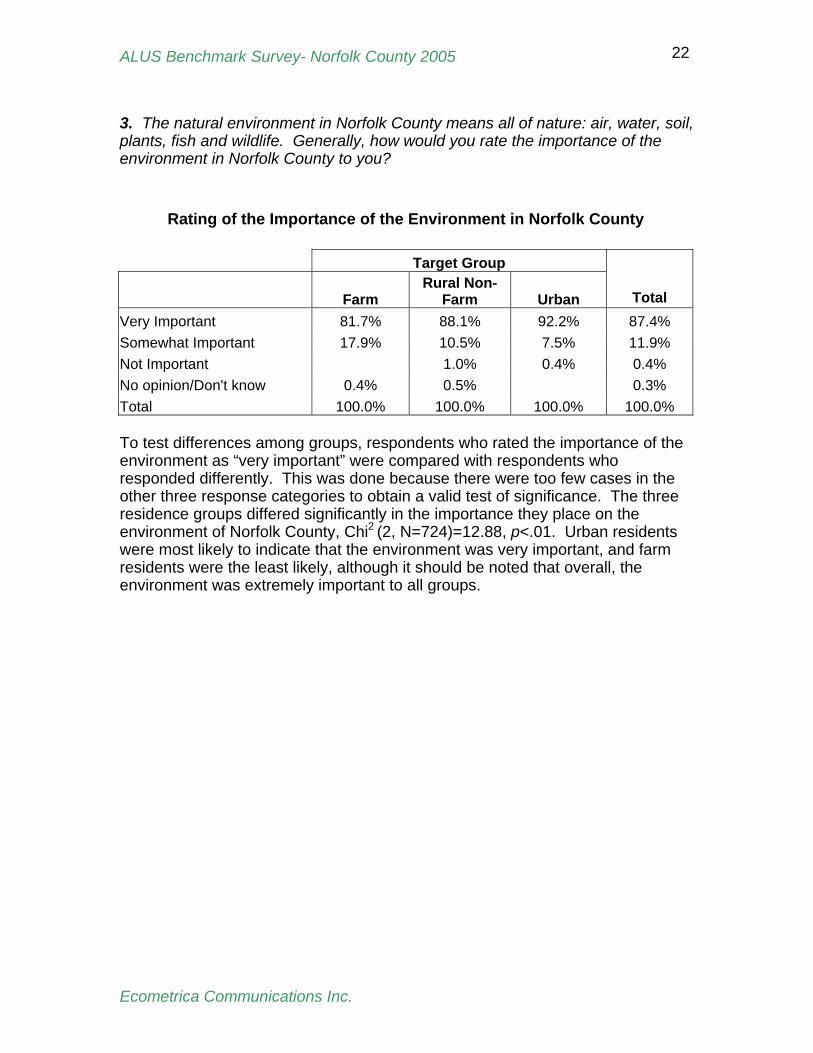
3. The natural environment in Norfolk County means all of nature: air, water, soil, plants, fish and wildlife. Generally, how would you rate the importance of the environment in Norfolk County to you?
Rating of the Importance of the Environment in Norfolk County Target Group
Farm Rural Non-
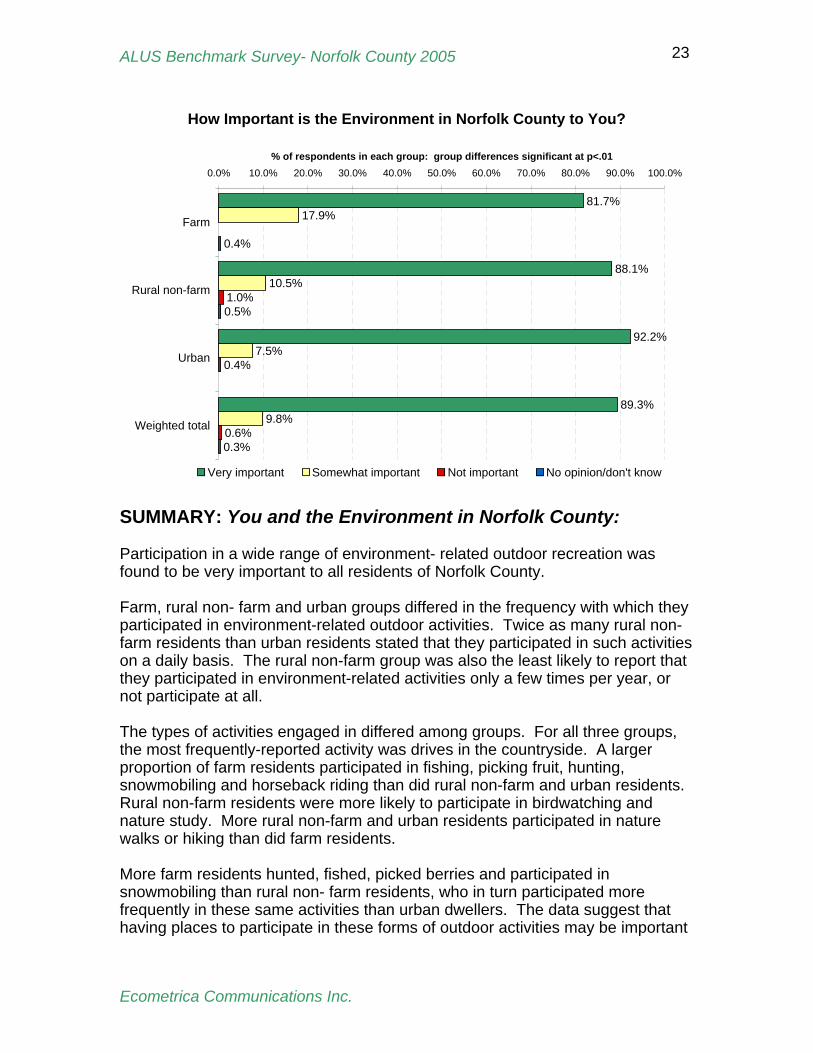
Farm Urban Total Very Important 81.7% 88.1% 92.2% 87.4% Somewhat Important 17.9% 10.5% 7.5% 11.9% Not Important 1.0% 0.4% 0.4% No opinion/Don't know 0.4% 0.5% 0.3% Total 100.0% 100.0% 100.0% 100.0% To test differences among groups, respondents who rated the importance of the environment as “very important” were compared with respondents who responded differently. This was done because there were too few cases in the other three response categories to obtain a valid test of significance. The three residence groups differed significantly in the importance they place on the environment of Norfolk County, Chi2 (2, N=724)=12.88, p<.01. Urban residents were most likely to indicate that the environment was very important, and farm residents were the least likely, although it should be noted that overall, the environment was extremely important to all groups.
Ecometrica Communications Inc.
ALUS Benchmark Survey- Norfolk County 2005 23
How Important is the Environment in Norfolk County to You?
81.7%
88.1%
92.2%
89.3%
17.9%
10.5%
7.5%
9.8%
1.0%
0.4%
0.6%
0.4%
0.5%
0.3%
0.0% 10.0% 20.0% 30.0% 40.0% 50.0% 60.0% 70.0% 80.0% 90.0% 100.0%
Farm
Rural non-farm
Urban
Weighted total
% of respondents in each group: group differences significant at p<.01
Very important Somewhat important Not important No opinion/don't know
SUMMARY: You and the Environment in Norfolk County: Participation in a wide range of environment- related outdoor recreation was found to be very important to all residents of Norfolk County. Farm, rural non- farm and urban groups differed in the frequency with which they participated in environment-related outdoor activities. Twice as many rural non-farm residents than urban residents stated that they participated in such activities on a daily basis. The rural non-farm group was also the least likely to report that they participated in environment-related activities only a few times per year, or not participate at all. The types of activities engaged in differed among groups. For all three groups, the most frequently-reported activity was drives in the countryside. A larger proportion of farm residents participated in fishing, picking fruit, hunting, snowmobiling and horseback riding than did rural non-farm and urban residents. Rural non-farm residents were more likely to participate in birdwatching and nature study. More rural non-farm and urban residents participated in nature walks or hiking than did farm residents. More farm residents hunted, fished, picked berries and participated in snowmobiling than rural non- farm residents, who in turn participated more frequently in these same activities than urban dwellers. The data suggest that having places to participate in these forms of outdoor activities may be important
Ecometrica Communications Inc.
ALUS Benchmark Survey- Norfolk County 2005 24
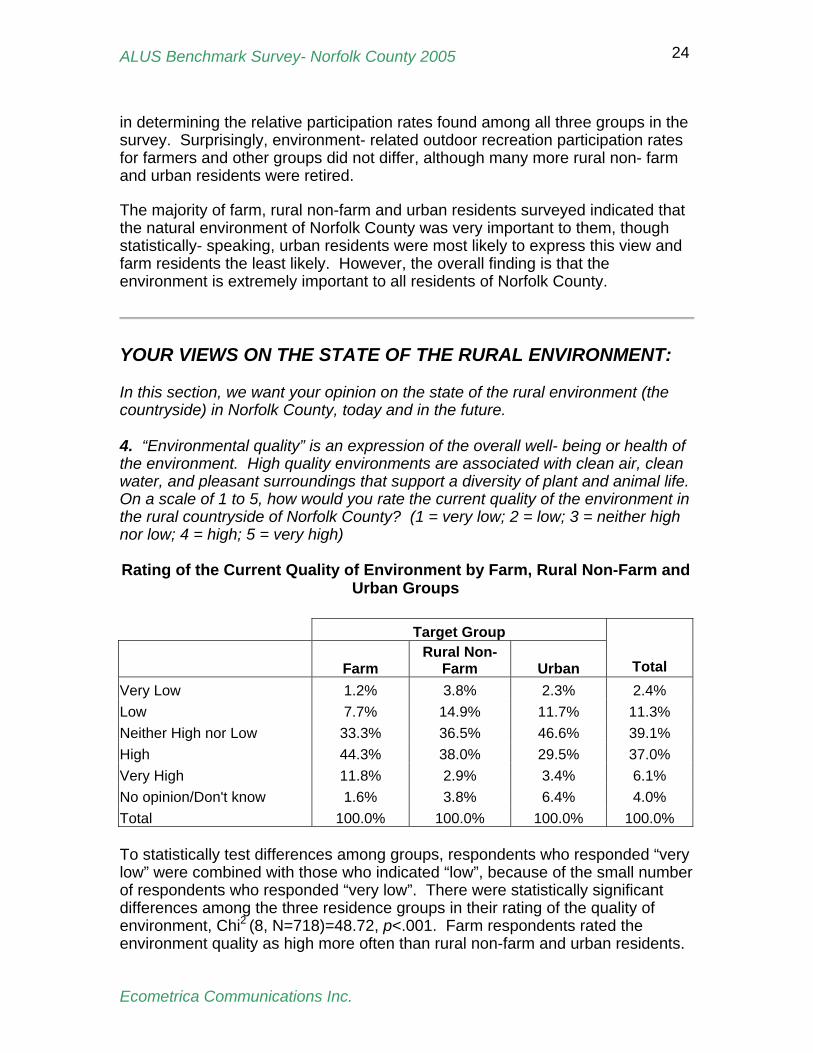
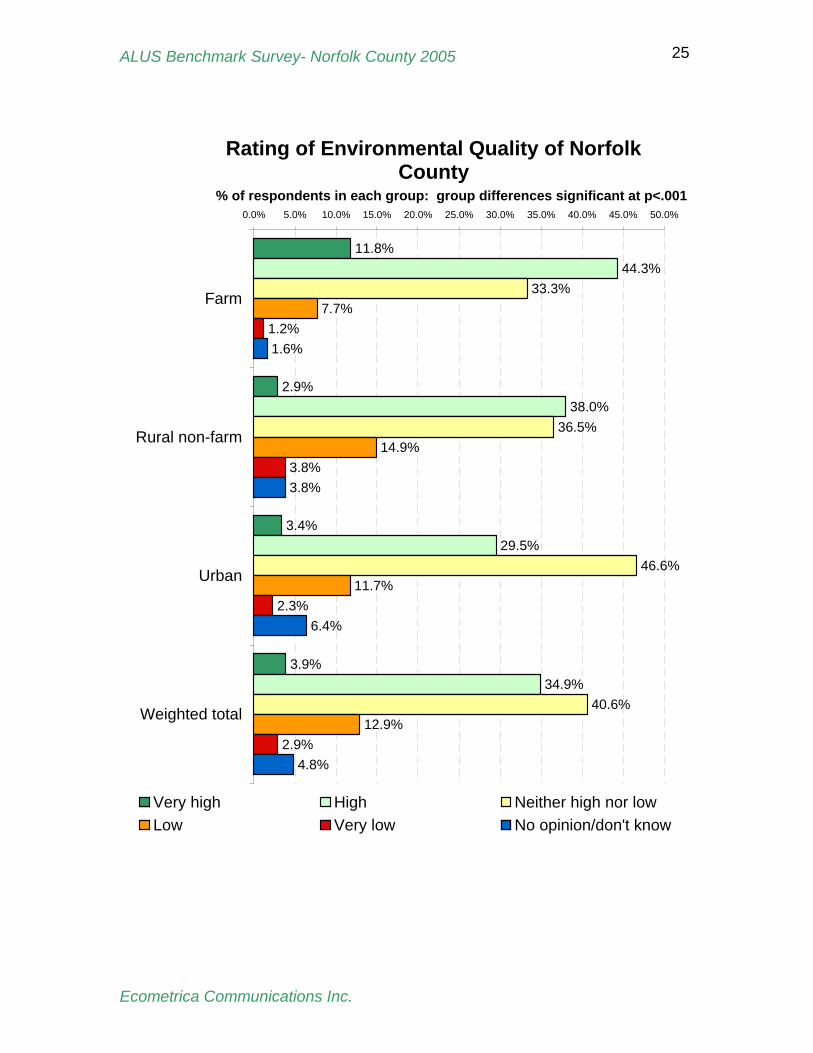
in determining the relative participation rates found among all three groups in the survey. Surprisingly, environment- related outdoor recreation participation rates for farmers and other groups did not differ, although many more rural non- farm and urban residents were retired. The majority of farm, rural non-farm and urban residents surveyed indicated that the natural environment of Norfolk County was very important to them, though statistically- speaking, urban residents were most likely to express this view and farm residents the least likely. However, the overall finding is that the environment is extremely important to all residents of Norfolk County. YOUR VIEWS ON THE STATE OF THE RURAL ENVIRONMENT: In this section, we want your opinion on the state of the rural environment (the countryside) in Norfolk County, today and in the future. 4. “Environmental quality” is an expression of the overall well- being or health of the environment. High quality environments are associated with clean air, clean water, and pleasant surroundings that support a diversity of plant and animal life. On a scale of 1 to 5, how would you rate the current quality of the environment in the rural countryside of Norfolk County? (1 = very low; 2 = low; 3 = neither high nor low; 4 = high; 5 = very high) Rating of the Current Quality of Environment by Farm, Rural Non-Farm and
Urban Groups Target Group
Farm Rural Non-
Farm Urban Total Very Low 1.2% 3.8% 2.3% 2.4% Low 7.7% 14.9% 11.7% 11.3% Neither High nor Low 33.3% 36.5% 46.6% 39.1% High 44.3% 38.0% 29.5% 37.0% Very High 11.8% 2.9% 3.4% 6.1% No opinion/Don't know 1.6% 3.8% 6.4% 4.0% Total 100.0% 100.0% 100.0% 100.0% To statistically test differences among groups, respondents who responded “very low” were combined with those who indicated “low”, because of the small number of respondents who responded “very low”. There were statistically significant differences among the three residence groups in their rating of the quality of environment, Chi2 (8, N=718)=48.72, p<.001. Farm respondents rated the environment quality as high more often than rural non-farm and urban residents.
Ecometrica Communications Inc.
ALUS Benchmark Survey- Norfolk County 2005 25
Rating of Environmental Quality of Norfolk County
11.8%
2.9%
3.4%
3.9%
44.3%
38.0%
29.5%
34.9%
33.3%
36.5%
46.6%
40.6%
7.7%
14.9%
11.7%
12.9%
1.2%
3.8%
2.3%
2.9%
1.6%
3.8%
6.4%
4.8%
0.0% 5.0% 10.0% 15.0% 20.0% 25.0% 30.0% 35.0% 40.0% 45.0% 50.0%
Farm
Rural non-farm
Urban
Weighted total
% of respondents in each group: group differences significant at p<.001
Very high High Neither high nor lowLow Very low No opinion/don't know
Ecometrica Communications Inc.
ALUS Benchmark Survey- Norfolk County 2005 26
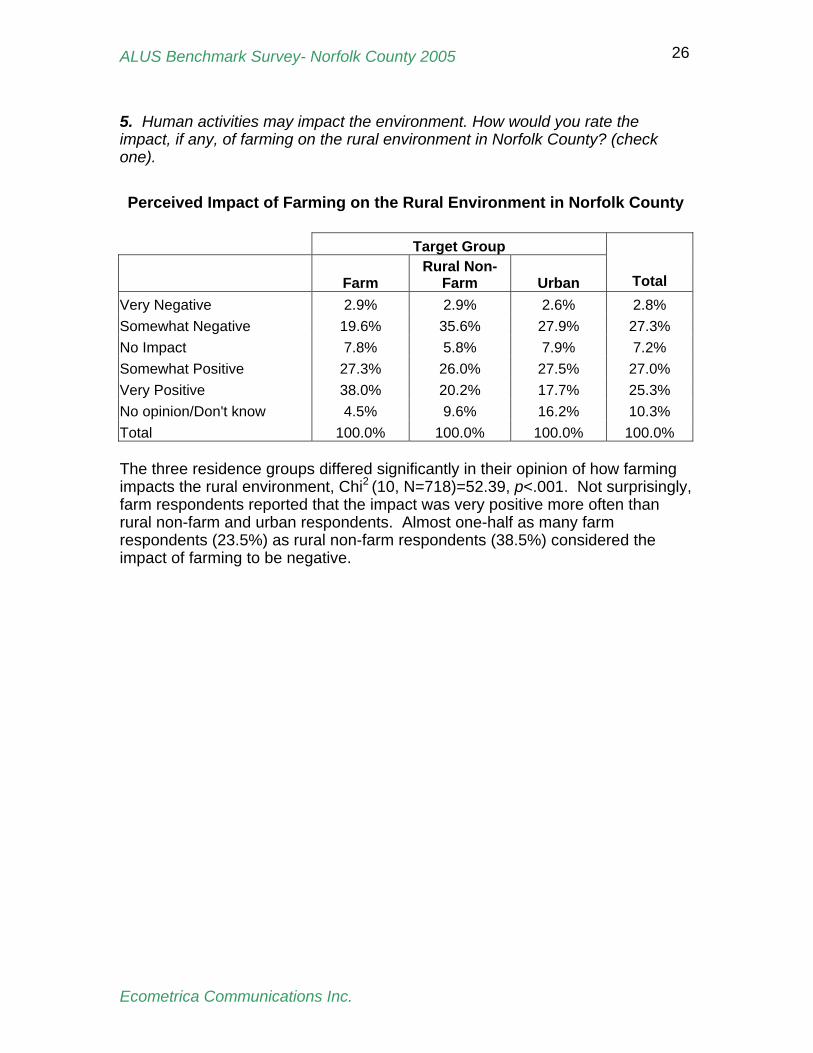
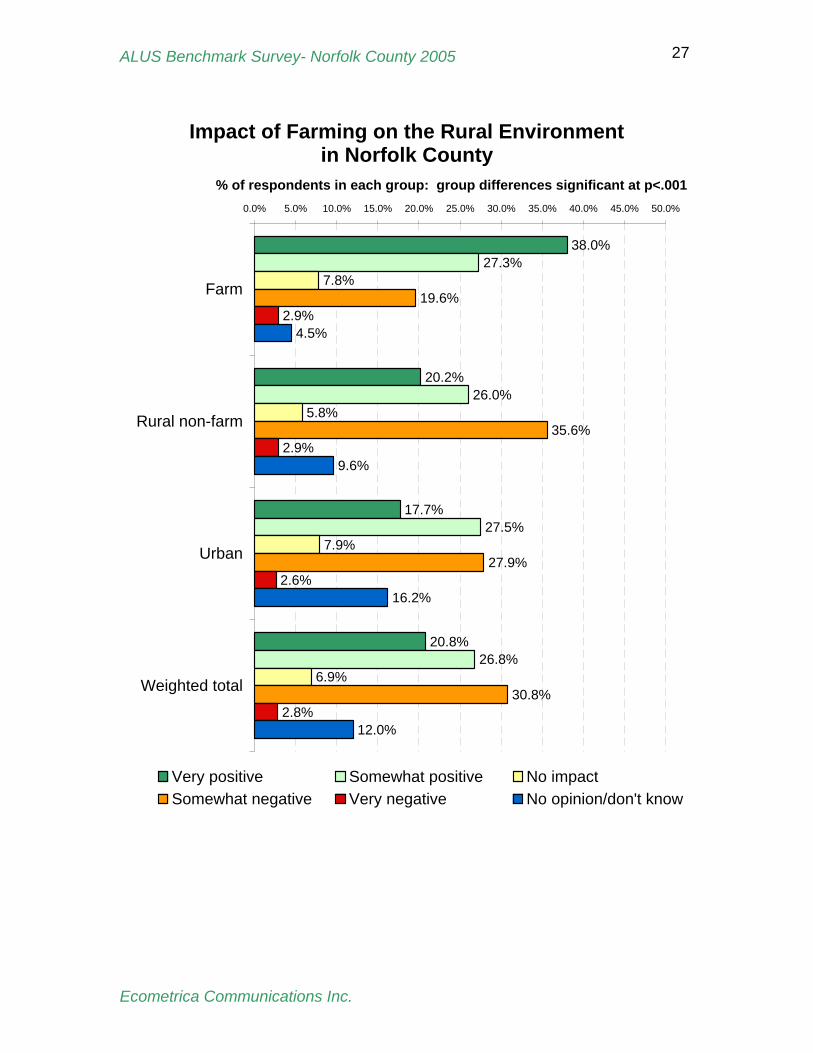
5. Human activities may impact the environment. How would you rate the impact, if any, of farming on the rural environment in Norfolk County? (check one).
Perceived Impact of Farming on the Rural Environment in Norfolk County Target Group
Farm Rural Non-
Farm Urban Total Very Negative 2.9% 2.9% 2.6% 2.8% Somewhat Negative 19.6% 35.6% 27.9% 27.3% No Impact 7.8% 5.8% 7.9% 7.2% Somewhat Positive 27.3% 26.0% 27.5% 27.0% Very Positive 38.0% 20.2% 17.7% 25.3% No opinion/Don't know 4.5% 9.6% 16.2% 10.3% Total 100.0% 100.0% 100.0% 100.0% The three residence groups differed significantly in their opinion of how farming impacts the rural environment, Chi2 (10, N=718)=52.39, p<.001. Not surprisingly, farm respondents reported that the impact was very positive more often than rural non-farm and urban respondents. Almost one-half as many farm respondents (23.5%) as rural non-farm respondents (38.5%) considered the impact of farming to be negative.
Ecometrica Communications Inc.
ALUS Benchmark Survey- Norfolk County 2005 27
Impact of Farming on the Rural Environment in Norfolk County
38.0%
20.2%
17.7%
20.8%
27.3%
26.0%
27.5%
26.8%
7.8%
5.8%
7.9%
6.9%
19.6%
35.6%
27.9%
30.8%
2.9%
2.9%
2.6%
2.8%
4.5%
9.6%
16.2%
12.0%
0.0% 5.0% 10.0% 15.0% 20.0% 25.0% 30.0% 35.0% 40.0% 45.0% 50.0%
Farm
Rural non-farm
Urban
Weighted total
% of respondents in each group: group differences significant at p<.001
Very positive Somewhat positive No impactSomewhat negative Very negative No opinion/don't know
Ecometrica Communications Inc.
ALUS Benchmark Survey- Norfolk County 2005 28
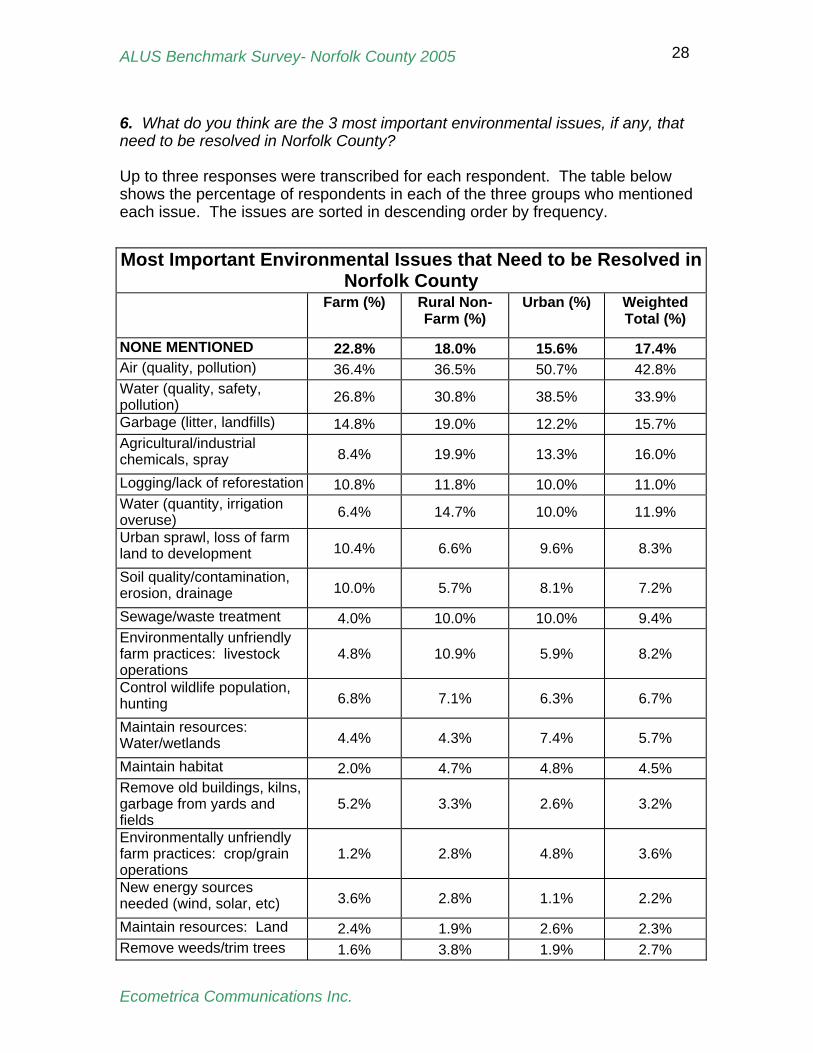
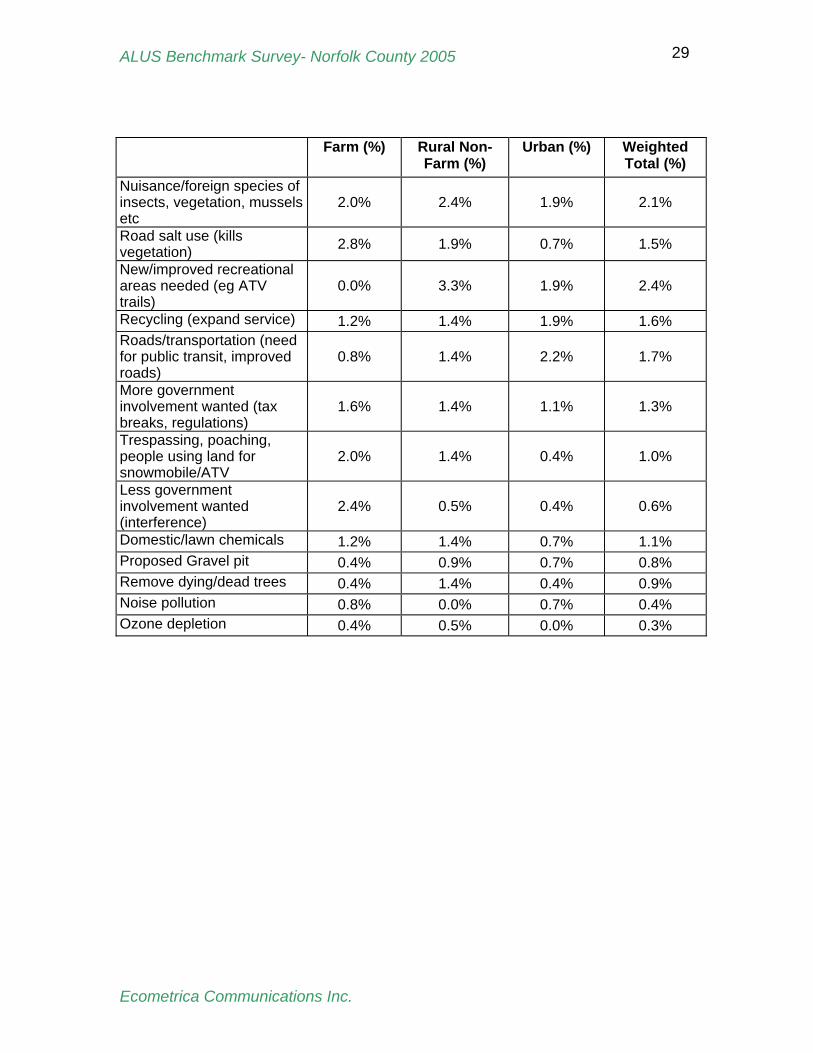
6. What do you think are the 3 most important environmental issues, if any, that need to be resolved in Norfolk County? Up to three responses were transcribed for each respondent. The table below shows the percentage of respondents in each of the three groups who mentioned each issue. The issues are sorted in descending order by frequency. Most Important Environmental Issues that Need to be Resolved in
Norfolk County Farm (%) Rural Non-
Farm (%) Urban (%) Weighted
Total (%)
NONE MENTIONED 22.8% 18.0% 15.6% 17.4% Air (quality, pollution) 36.4% 36.5% 50.7% 42.8% Water (quality, safety, pollution) 26.8% 30.8% 38.5% 33.9%
Garbage (litter, landfills) 14.8% 19.0% 12.2% 15.7% Agricultural/industrial chemicals, spray 8.4% 19.9% 13.3% 16.0%
Logging/lack of reforestation 10.8% 11.8% 10.0% 11.0% Water (quantity, irrigation overuse) 6.4% 14.7% 10.0% 11.9%
Urban sprawl, loss of farm land to development 10.4% 6.6% 9.6% 8.3%
Soil quality/contamination, erosion, drainage 10.0% 5.7% 8.1% 7.2%
Sewage/waste treatment 4.0% 10.0% 10.0% 9.4% Environmentally unfriendly farm practices: livestock operations
4.8% 10.9% 5.9% 8.2%
Control wildlife population, hunting 6.8% 7.1% 6.3% 6.7%
Maintain resources: Water/wetlands 4.4% 4.3% 7.4% 5.7%
Maintain habitat 2.0% 4.7% 4.8% 4.5% Remove old buildings, kilns, garbage from yards and fields
5.2% 3.3% 2.6% 3.2%
Environmentally unfriendly farm practices: crop/grain operations
1.2% 2.8% 4.8% 3.6%
New energy sources needed (wind, solar, etc) 3.6% 2.8% 1.1% 2.2%
Maintain resources: Land 2.4% 1.9% 2.6% 2.3% Remove weeds/trim trees 1.6% 3.8% 1.9% 2.7%
Ecometrica Communications Inc.
ALUS Benchmark Survey- Norfolk County 2005 29
Farm (%) Rural Non-
Farm (%) Urban (%) Weighted
Total (%) Nuisance/foreign species of insects, vegetation, mussels etc
2.0% 2.4% 1.9% 2.1%
Road salt use (kills vegetation) 2.8% 1.9% 0.7% 1.5%
New/improved recreational areas needed (eg ATV trails)
0.0% 3.3% 1.9% 2.4%
Recycling (expand service) 1.2% 1.4% 1.9% 1.6% Roads/transportation (need for public transit, improved roads)
0.8% 1.4% 2.2% 1.7%
More government involvement wanted (tax breaks, regulations)
1.6% 1.4% 1.1% 1.3%
Trespassing, poaching, people using land for snowmobile/ATV
2.0% 1.4% 0.4% 1.0%
Less government involvement wanted (interference)
2.4% 0.5% 0.4% 0.6%
Domestic/lawn chemicals 1.2% 1.4% 0.7% 1.1% Proposed Gravel pit 0.4% 0.9% 0.7% 0.8% Remove dying/dead trees 0.4% 1.4% 0.4% 0.9% Noise pollution 0.8% 0.0% 0.7% 0.4% Ozone depletion 0.4% 0.5% 0.0% 0.3%
Ecometrica Communications Inc.
ALUS Benchmark Survey- Norfolk County 2005 30
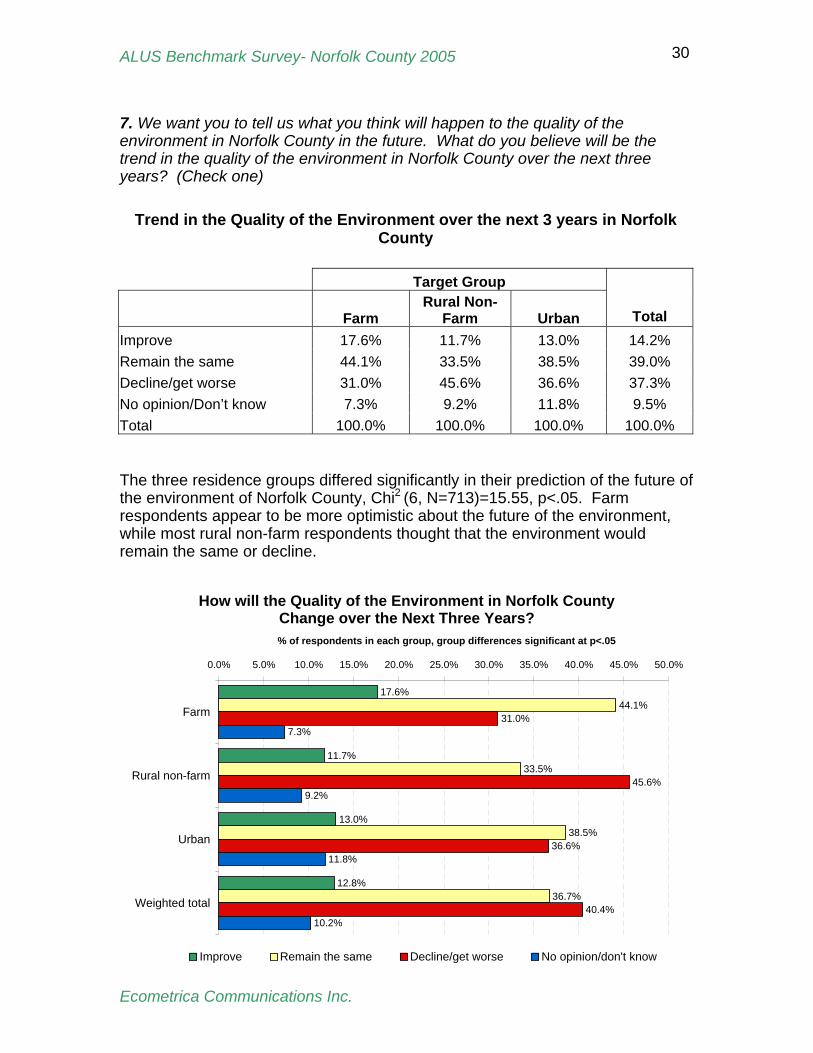
7. We want you to tell us what you think will happen to the quality of the environment in Norfolk County in the future. What do you believe will be the trend in the quality of the environment in Norfolk County over the next three years? (Check one)
Trend in the Quality of the Environment over the next 3 years in Norfolk County
Target Group
Farm Rural Non-
Farm Urban Total Improve 17.6% 11.7% 13.0% 14.2% Remain the same 44.1% 33.5% 38.5% 39.0% Decline/get worse 31.0% 45.6% 36.6% 37.3% No opinion/Don’t know 7.3% 9.2% 11.8% 9.5% Total 100.0% 100.0% 100.0% 100.0% The three residence groups differed significantly in their prediction of the future of the environment of Norfolk County, Chi2 (6, N=713)=15.55, p<.05. Farm respondents appear to be more optimistic about the future of the environment, while most rural non-farm respondents thought that the environment would remain the same or decline.
How will the Quality of the Environment in Norfolk County Change over the Next Three Years?
17.6%
11.7%
13.0%
12.8%
44.1%
33.5%
38.5%
36.7%
31.0%
45.6%
36.6%
40.4%
7.3%
9.2%
11.8%
10.2%
0.0% 5.0% 10.0% 15.0% 20.0% 25.0% 30.0% 35.0% 40.0% 45.0% 50.0%
Farm
Rural non-farm
Urban
Weighted total
% of respondents in each group, group differences significant at p<.05
Improve Remain the same Decline/get worse No opinion/don't know
Ecometrica Communications Inc.
ALUS Benchmark Survey- Norfolk County 2005 31
SUMMARY: Your Views on the State of the Rural Environment Farm residents viewed the current state of the quality of the environment in Norfolk County more positively than did rural non-farm and urban residents. Over one-half of the farmers (56%) rated the quality of the environment as high or very high, compared with only 33% of urban residents and 41% of rural non-farm residents. These results suggest that farmers and non- farm residents may differ in their definition of what comprises a high quality environment on farmland. Farm residents were also more likely to feel that farming had a positive impact on the rural environment. Over twice as many farm residents (38%) than urban residents (18%) indicated that farming had a very positive impact on the environment. Conversely, nearly twice as many rural non- farm respondents (39%) than farmers (23%) indicated that farming has a somewhat or very negative impact on the environment. About one in three urban respondents felt that farming has a somewhat to very negative impact on the environment, although 16% were uncertain about impacts. Fundamental differences may exist between the perceptions of farm and non- farm respondents on what comprises good land stewardship for agriculture and good stewardship for the environment. Air quality was the most important environmental issue mentioned by all respondent groups. Half of urban respondents and about one- third of farm and rural non- farm participants mentioned air quality. This finding is a significant “top of mind” response, as survey respondents did not choose environmental issues from a list on the questionnaire. Water quality was the second highest ranking environmental issue for all groups, although more urban and rural non- farm respondents than farmers indicated that water quality is an environmental issue that needs to be resolved in Norfolk County. Littering, landfill sites, agricultural/ industrial chemicals, urban sprawl, sewage disposal and logging or lack of reforestation were the remaining issues cited, but at a much lower frequency than concern expressed for air and water quality. Respondents suggested a wide range of environmental issues for Norfolk County, but most of these appeared at a very low frequency in the survey. Several issues such as lawn chemicals, recycling, nuisance wildlife or invasive species, new energy sources, and conserving wetlands have been topical in many communities in the past, and have received a considerable amount of publicity from governments and environmental groups, yet they have not achieved a top of mind position among the residents of Norfolk County. All respondent groups were pessimistic about the outlook for the environment in Norfolk County. Few respondents thought that the quality of the environment would improve over the next three years. Farm residents were most likely to indicate that the environment would remain the same, while the majority of rural non-farm residents thought that the quality of environment would decline. A similar proportion of urban residents indicated that the environment would likely remain the same as did those who felt it would decline.
Ecometrica Communications Inc.
ALUS Benchmark Survey- Norfolk County 2005 32
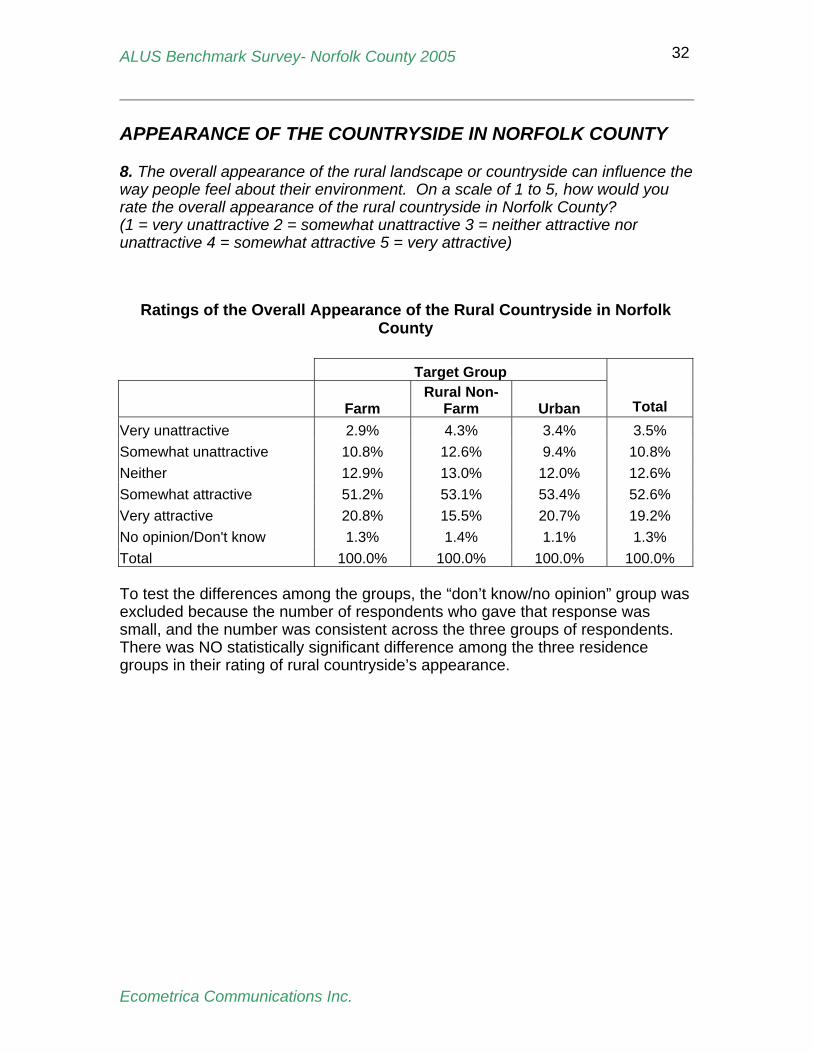
APPEARANCE OF THE COUNTRYSIDE IN NORFOLK COUNTY 8. The overall appearance of the rural landscape or countryside can influence the way people feel about their environment. On a scale of 1 to 5, how would you rate the overall appearance of the rural countryside in Norfolk County? (1 = very unattractive 2 = somewhat unattractive 3 = neither attractive nor unattractive 4 = somewhat attractive 5 = very attractive)
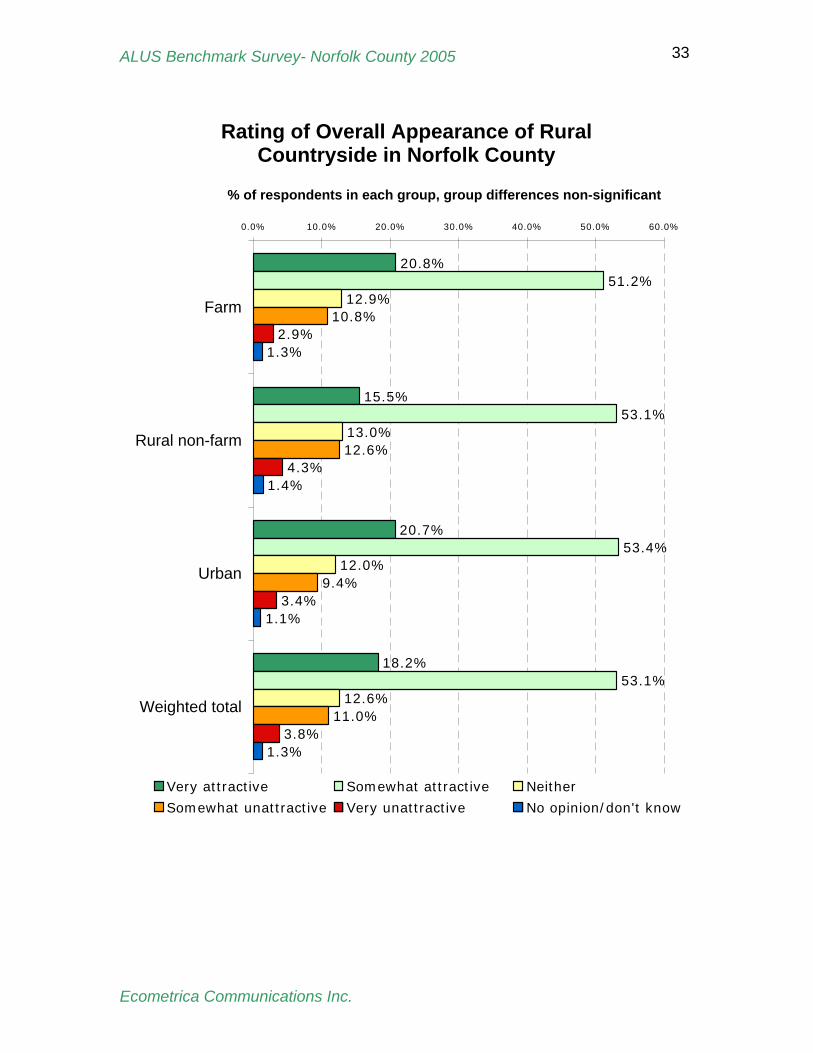
Ratings of the Overall Appearance of the Rural Countryside in Norfolk County
Target Group
Farm Rural Non-
Farm Urban Total Very unattractive 2.9% 4.3% 3.4% 3.5% Somewhat unattractive 10.8% 12.6% 9.4% 10.8% Neither 12.9% 13.0% 12.0% 12.6% Somewhat attractive 51.2% 53.1% 53.4% 52.6% Very attractive 20.8% 15.5% 20.7% 19.2% No opinion/Don't know 1.3% 1.4% 1.1% 1.3% Total 100.0% 100.0% 100.0% 100.0% To test the differences among the groups, the “don’t know/no opinion” group was excluded because the number of respondents who gave that response was small, and the number was consistent across the three groups of respondents. There was NO statistically significant difference among the three residence groups in their rating of rural countryside’s appearance.
Ecometrica Communications Inc.
ALUS Benchmark Survey- Norfolk County 2005 33
Rating of Overall Appearance of Rural Countryside in Norfolk County
20.8%
15.5%
20.7%
18.2%
51.2%
53.1%
53.4%
53.1%
12.9%
13.0%
12.0%
12.6%
10.8%
12.6%
9.4%
11.0%
2.9%
4.3%
3.4%
3.8%
1.3%
1.4%
1.1%
1.3%
0.0% 10.0% 20.0% 30.0% 40.0% 50.0% 60.0%
Farm
Rural non-farm
Urban
Weighted total
% of respondents in each group, group differences non-significant
Very attractive Somewhat attractive Neither
Somewhat unattractive Very unattractive No opinion/don't know
Ecometrica Communications Inc.
ALUS Benchmark Survey- Norfolk County 2005 34
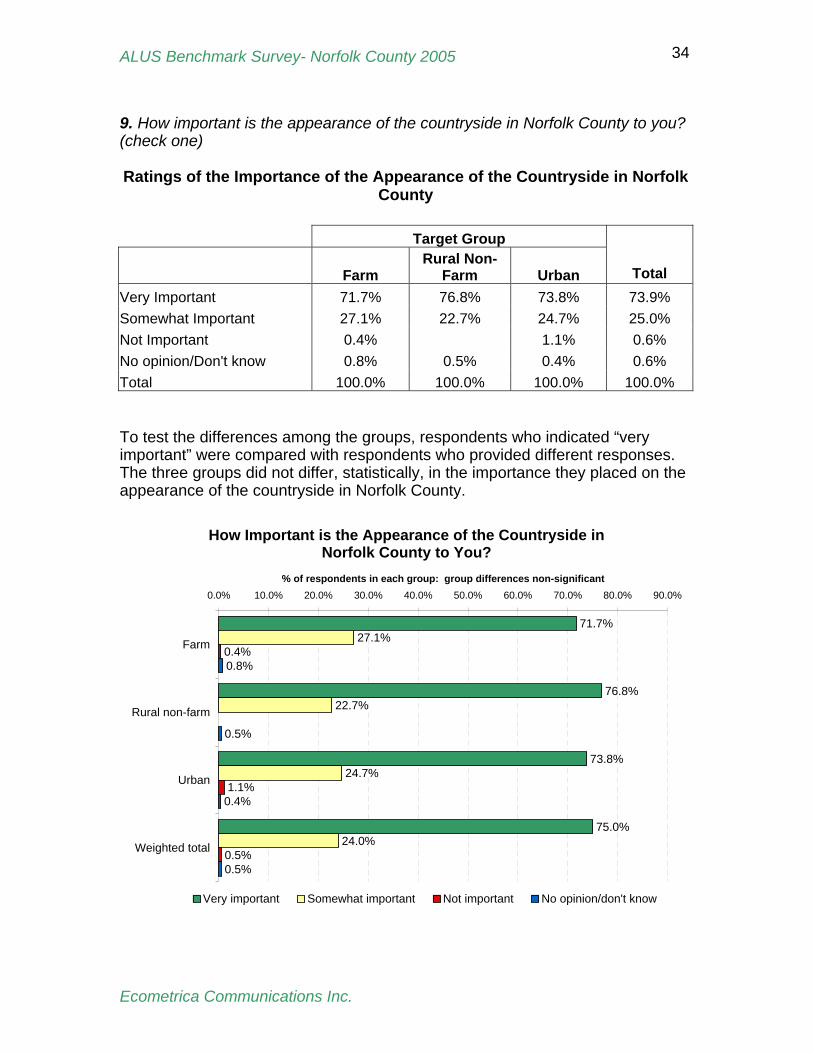
9. How important is the appearance of the countryside in Norfolk County to you? (check one) Ratings of the Importance of the Appearance of the Countryside in Norfolk
County Target Group
Farm Rural Non-
Farm Urban Total Very Important 71.7% 76.8% 73.8% 73.9% Somewhat Important 27.1% 22.7% 24.7% 25.0% Not Important 0.4% 1.1% 0.6% No opinion/Don't know 0.8% 0.5% 0.4% 0.6% Total 100.0% 100.0% 100.0% 100.0% To test the differences among the groups, respondents who indicated “very important” were compared with respondents who provided different responses. The three groups did not differ, statistically, in the importance they placed on the appearance of the countryside in Norfolk County.
How Important is the Appearance of the Countryside in Norfolk County to You?
71.7%
76.8%
73.8%
75.0%
27.1%
22.7%
24.7%
24.0%
0.4%
1.1%
0.5%
0.8%
0.5%
0.4%
0.5%
0.0% 10.0% 20.0% 30.0% 40.0% 50.0% 60.0% 70.0% 80.0% 90.0%
Farm
Rural non-farm
Urban
Weighted total
% of respondents in each group: group differences non-significant
Very important Somewhat important Not important No opinion/don't know
Ecometrica Communications Inc.
ALUS Benchmark Survey- Norfolk County 2005 35
SUMMARY: Appearance of the Rural Countryside in Norfolk County Although the three residence groups differed in the opinion on of the quality and future of the environment, as seen in the previous section, the groups were similar in their perception of the appearance of the countryside, and in the importance they place on it. Respondents in all three groups thought that the rural countryside in the county was attractive. Overall, almost three-quarters (71.8%) of the survey respondents rated the countryside as somewhat or very attractive. A similar proportion of the respondents (73.9% overall) indicated that the appearance of the countryside was very important. Almost none of the respondents thought that the appearance was not important at all.
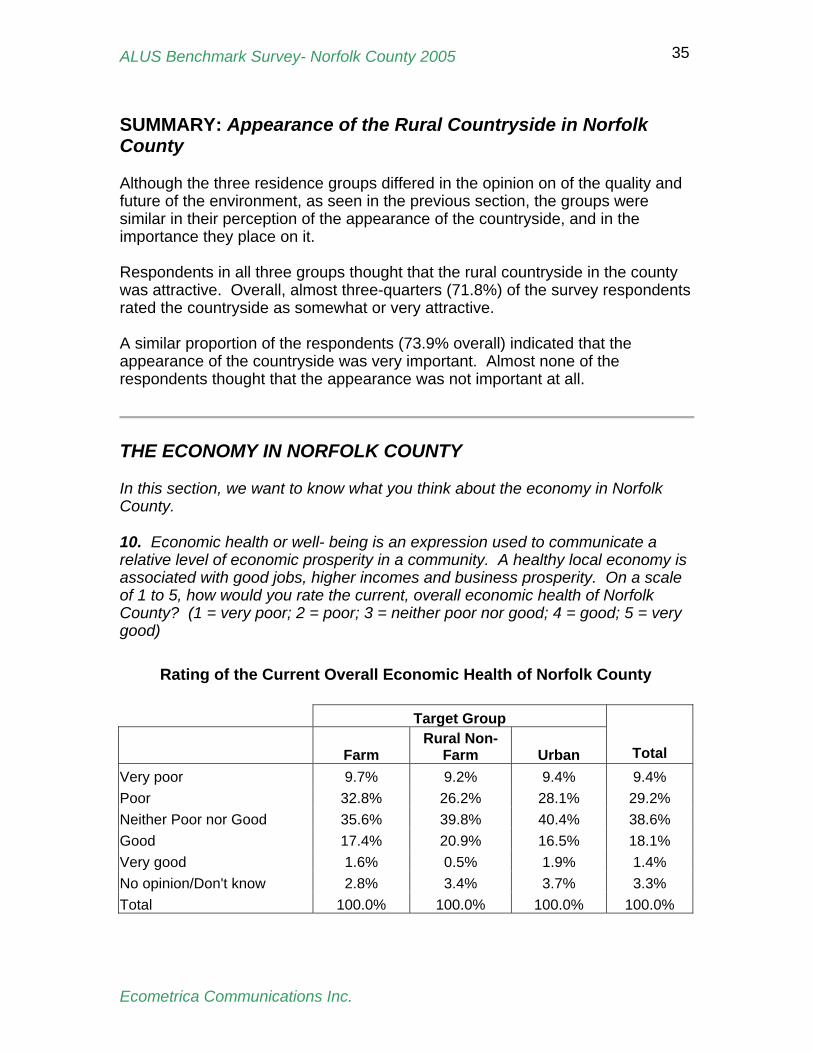
THE ECONOMY IN NORFOLK COUNTY In this section, we want to know what you think about the economy in Norfolk County. 10. Economic health or well- being is an expression used to communicate a relative level of economic prosperity in a community. A healthy local economy is associated with good jobs, higher incomes and business prosperity. On a scale of 1 to 5, how would you rate the current, overall economic health of Norfolk County? (1 = very poor; 2 = poor; 3 = neither poor nor good; 4 = good; 5 = very good)
Rating of the Current Overall Economic Health of Norfolk County Target Group
Farm Rural Non-
Farm Urban Total Very poor 9.7% 9.2% 9.4% 9.4% Poor 32.8% 26.2% 28.1% 29.2% Neither Poor nor Good 35.6% 39.8% 40.4% 38.6% Good 17.4% 20.9% 16.5% 18.1% Very good 1.6% 0.5% 1.9% 1.4% No opinion/Don't know 2.8% 3.4% 3.7% 3.3% Total 100.0% 100.0% 100.0% 100.0%
Ecometrica Communications Inc.
ALUS Benchmark Survey- Norfolk County 2005 36
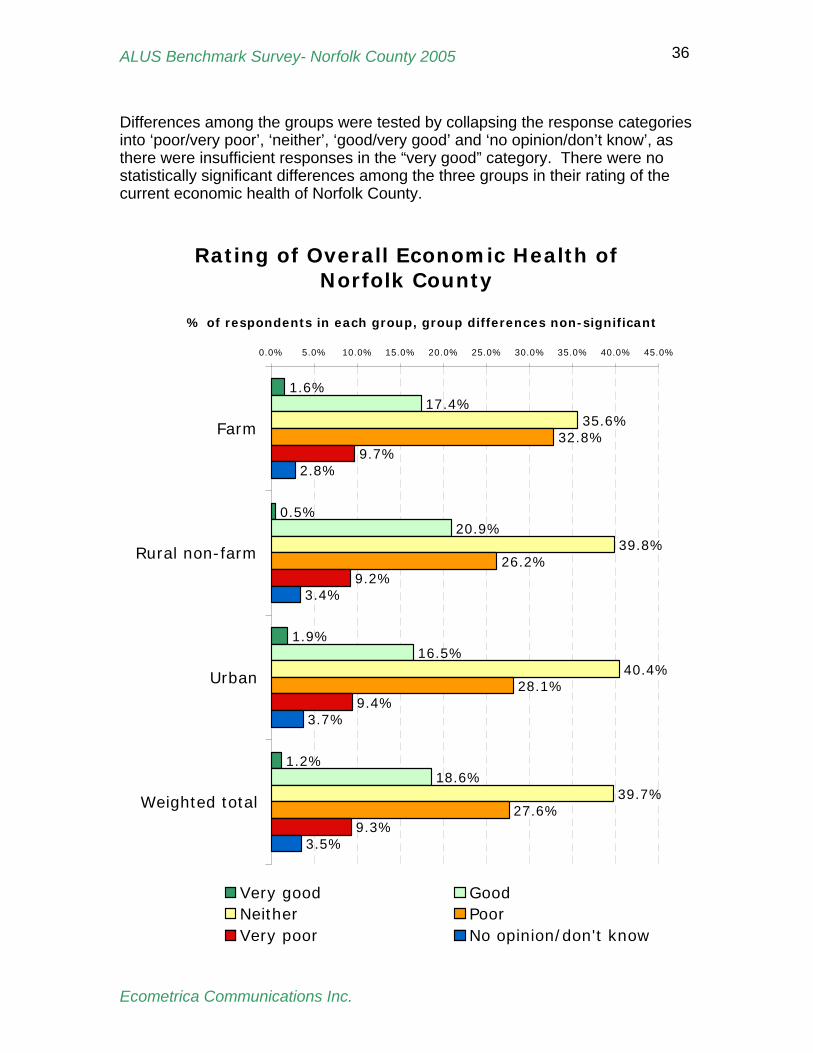
Differences among the groups were tested by collapsing the response categories into ‘poor/very poor’, ‘neither’, ‘good/very good’ and ‘no opinion/don’t know’, as there were insufficient responses in the “very good” category. There were no statistically significant differences among the three groups in their rating of the current economic health of Norfolk County.
Rating of Overall Economic Health of Norfolk County
1.6%
0.5%
1.9%
1.2%
17.4%
20.9%
16.5%
18.6%
35.6%
39.8%
40.4%
39.7%
32.8%
26.2%
28.1%
27.6%
9.7%
9.2%
9.4%
9.3%
2.8%
3.4%
3.7%
3.5%
0.0% 5.0% 10.0% 15.0% 20.0% 25.0% 30.0% 35.0% 40.0% 45.0%
Farm
Rural non-farm
Urban
Weighted total
% of respondents in each group, group differences non-significant
Very good GoodNeither PoorVery poor No opinion/don't know
Ecometrica Communications Inc.
ALUS Benchmark Survey- Norfolk County 2005 37
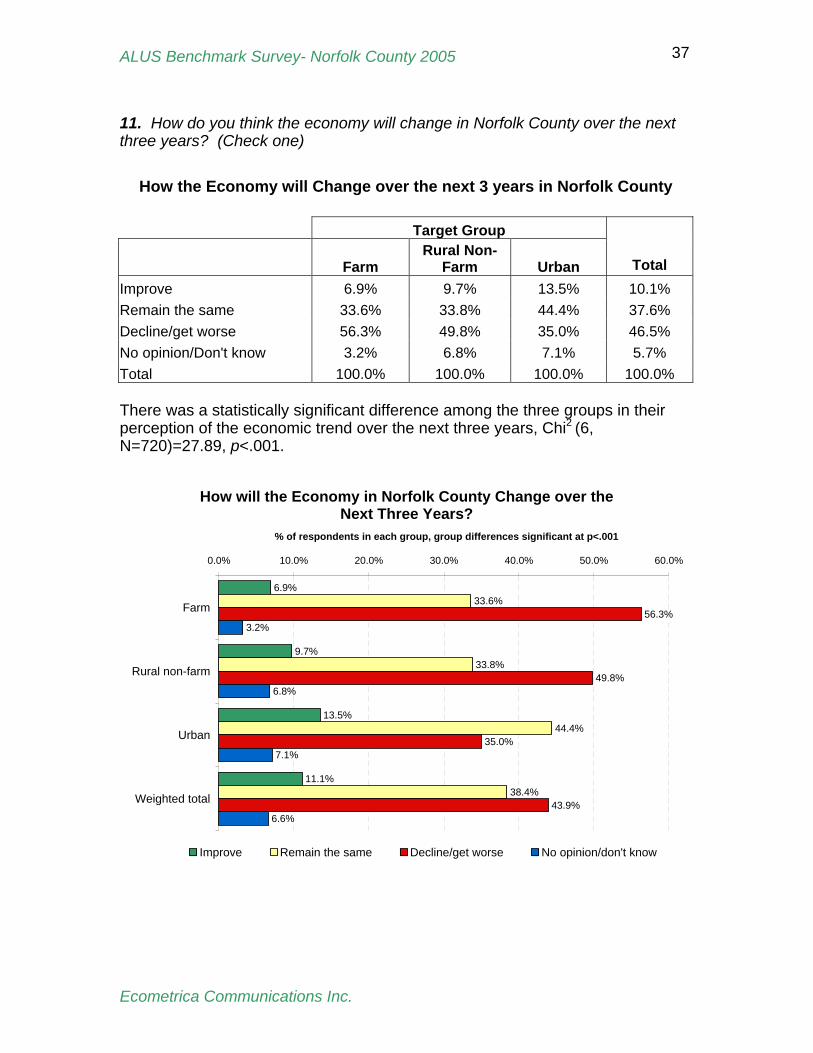
11. How do you think the economy will change in Norfolk County over the next three years? (Check one)
How the Economy will Change over the next 3 years in Norfolk County Target Group
Farm Rural Non-
Farm Urban Total Improve 6.9% 9.7% 13.5% 10.1% Remain the same 33.6% 33.8% 44.4% 37.6% Decline/get worse 56.3% 49.8% 35.0% 46.5% No opinion/Don't know 3.2% 6.8% 7.1% 5.7% Total 100.0% 100.0% 100.0% 100.0% There was a statistically significant difference among the three groups in their perception of the economic trend over the next three years, Chi2 (6, N=720)=27.89, p<.001.
How will the Economy in Norfolk County Change over the Next Three Years?
6.9%
9.7%
13.5%
11.1%
33.6%
33.8%
44.4%
38.4%
56.3%
49.8%
35.0%
43.9%
3.2%
6.8%
7.1%
6.6%
0.0% 10.0% 20.0% 30.0% 40.0% 50.0% 60.0%
Farm
Rural non-farm
Urban
Weighted total
% of respondents in each group, group differences significant at p<.001
Improve Remain the same Decline/get worse No opinion/don't know
Ecometrica Communications Inc.
ALUS Benchmark Survey- Norfolk County 2005 38
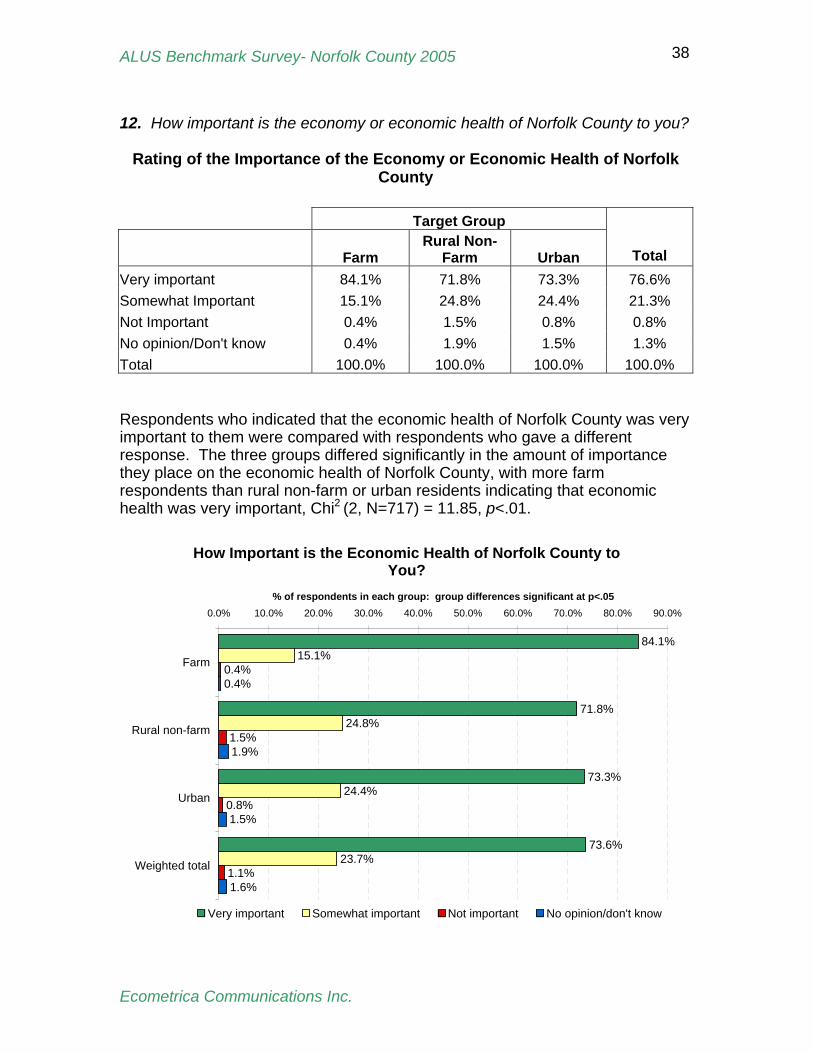
12. How important is the economy or economic health of Norfolk County to you?
Rating of the Importance of the Economy or Economic Health of Norfolk County
Target Group
Farm Rural Non-
Farm Urban Total Very important 84.1% 71.8% 73.3% 76.6% Somewhat Important 15.1% 24.8% 24.4% 21.3% Not Important 0.4% 1.5% 0.8% 0.8% No opinion/Don't know 0.4% 1.9% 1.5% 1.3% Total 100.0% 100.0% 100.0% 100.0% Respondents who indicated that the economic health of Norfolk County was very important to them were compared with respondents who gave a different response. The three groups differed significantly in the amount of importance they place on the economic health of Norfolk County, with more farm respondents than rural non-farm or urban residents indicating that economic health was very important, Chi2 (2, N=717) = 11.85, p<.01.
How Important is the Economic Health of Norfolk County to You?
84.1%
71.8%
73.3%
73.6%
15.1%
24.8%
24.4%
23.7%
0.4%
1.5%
0.8%
1.1%
0.4%
1.9%
1.5%
1.6%
0.0% 10.0% 20.0% 30.0% 40.0% 50.0% 60.0% 70.0% 80.0% 90.0%
Farm
Rural non-farm
Urban
Weighted total
% of respondents in each group: group differences significant at p<.05
Very important Somewhat important Not important No opinion/don't know Ecometrica Communications Inc.
ALUS Benchmark Survey- Norfolk County 2005 39
SUMMARY: The Economy in Norfolk County Respondents in all groups agreed that the economic health of Norfolk County was less than ideal. Overall, the same proportion of respondents indicated that the economy and economic health was poor or very poor (38.6%), and neutral (neither poor nor good) (38.6%). It is noteworthy that in spite of declining farm incomes reported earlier, farmers did not rate the current state of the economy in the county lower than other residents. However, groups disagreed on how the economic health of the county would change over the next few years. Overall, few residents thought the economy would improve over the next three years, although twice as many urban residents (14%) thought the economy would improve than farmers (7%). Both farmers (56%) and rural non- farm residents (50%) predicted the economy would decline. Urban respondents (58%) were more optimistic, and predicted that the economy would either stay the same or improve. Predictions for the future health of the economy may be driven by the change in personal income in the recent past. Among farm respondents, 40% reported both that their own income had declined over the past year, and they predicted that the economic health of the county would decline. Among the other groups, only 18% of rural non-farm and 11% of urban respondents showed this dual pattern of responses. Despite their pessimistic outlook, more farm respondents than rural non- farm and urban respondents indicated that the economic health of the county was very important to them. Presumably, this reflects the reliance that farm respondents have on the county to support their business. Rural non-farm and urban respondents were more likely than farm respondents to be retired, or to be professionals or trades/service workers and may also work outside the county.
Ecometrica Communications Inc.
ALUS Benchmark Survey- Norfolk County 2005 40
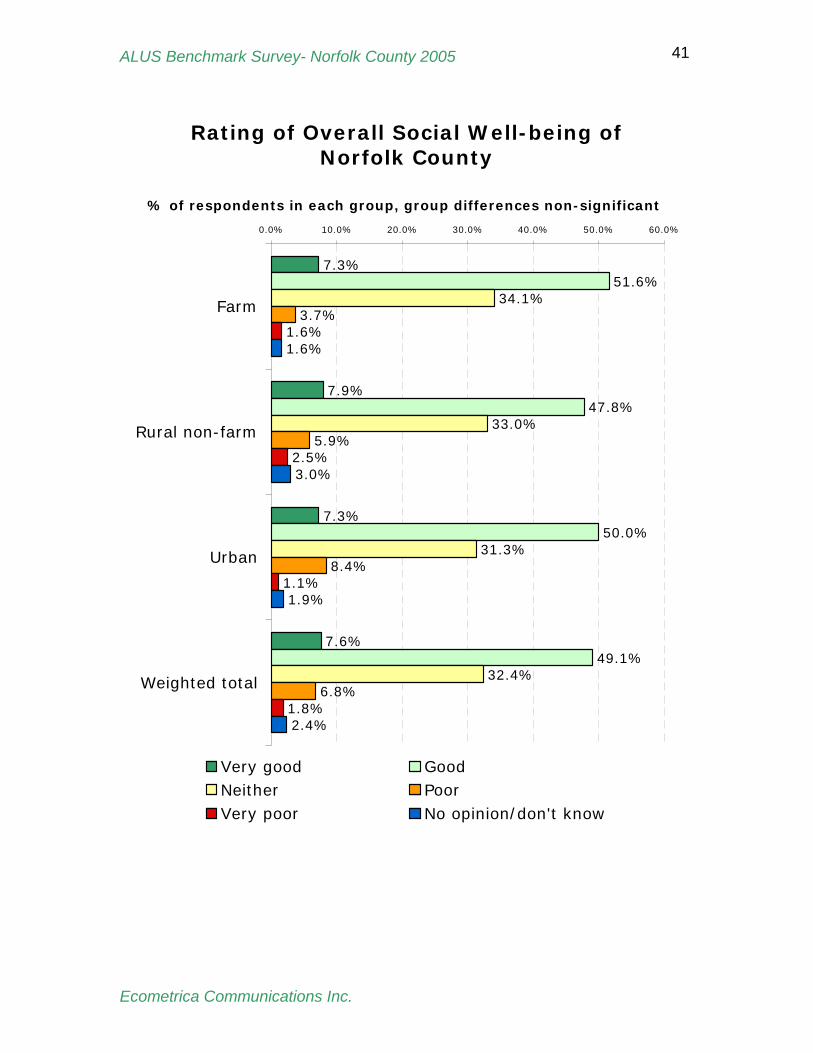
SOCIAL WELL- BEING IN NORFOLK COUNTY The social health or well- being of a community is a reflection of the social “quality of life” in the community. Social well- being depends on the human or social environment, and is influenced by such things as accessibility to good schools, social clubs, recreational facilities and opportunities, entertainment, opportunities for youth and seniors, shopping, and having low crime rates, good neighbours and friendly people in the community. Social well- being is also linked to the economic health of the community. 13. On a scale of 1 to 5 how would you rate the overall state of social well- being or “quality of life” in Norfolk County? (1 = very poor; 2 = poor; 3 = neither poor nor good; 4 = good; 5 = very good)
Rating of the Overall State of Social Well-being in Norfolk County Target Group
Farm Rural Non-
Farm Urban Total Very poor 1.6% 2.5% 1.1% 1.7% Poor 3.7% 5.9% 8.4% 6.0% Neither poor nor good 34.1% 33.0% 31.3% 32.8% Good 51.6% 47.8% 50.0% 49.9% Very good 7.3% 7.9% 7.3% 7.5% No opinion/Don't know 1.6% 3.0% 1.9% 2.1% Total 100.0% 100.0% 100.0% 100.0% To compare the responses among the three groups, the response categories were collapsed into ‘poor/very poor, ‘neither’, and ‘good/very good’. Those who did not have an opinion were excluded from analyses. The responses were similar among the three groups, when tests of statistical significance were conducted.
Ecometrica Communications Inc.
ALUS Benchmark Survey- Norfolk County 2005 41
Rating of Overall Social Well-being of Norfolk County
7.3%
7.9%
7.3%
7.6%
51.6%
47.8%
50.0%
49.1%
34.1%
33.0%
31.3%
32.4%
3.7%
5.9%
8.4%
6.8%
1.6%
2.5%
1.1%
1.8%
1.6%
3.0%
1.9%
2.4%
0.0% 10.0% 20.0% 30.0% 40.0% 50.0% 60.0%
Farm
Rural non-farm
Urban
Weighted total
% of respondents in each group, group differences non-significant
Very good GoodNeither PoorVery poor No opinion/don't know
Ecometrica Communications Inc.
ALUS Benchmark Survey- Norfolk County 2005 42
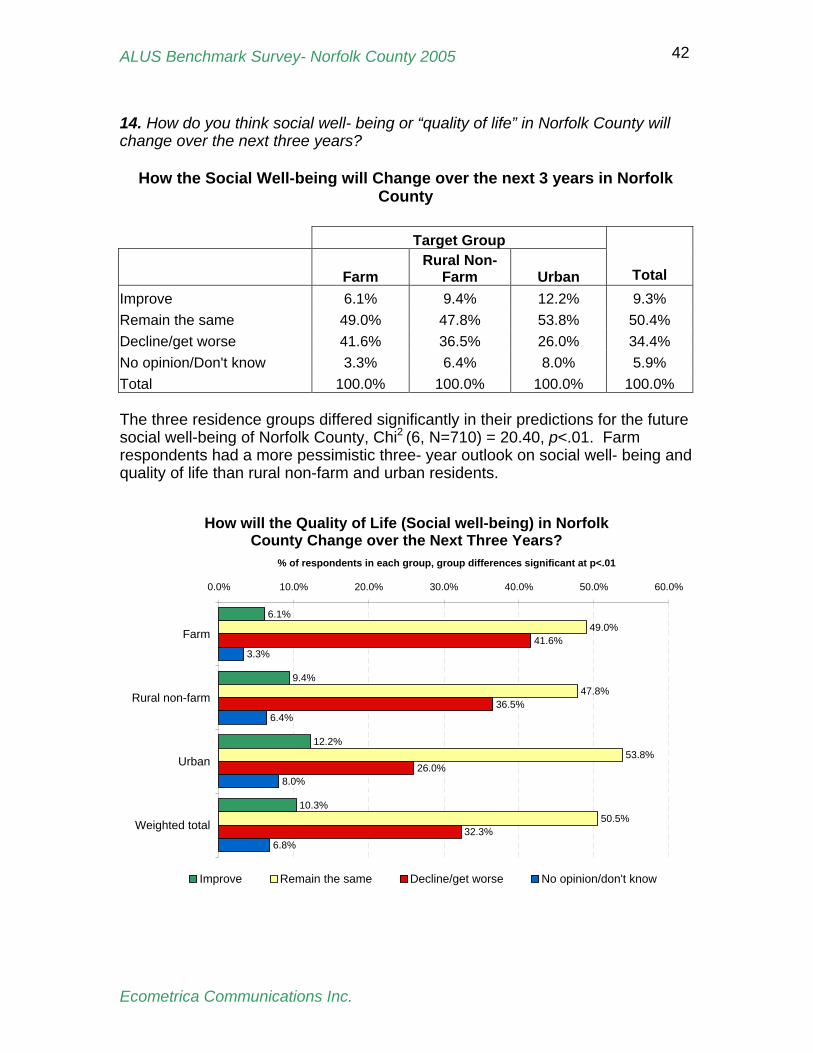
14. How do you think social well- being or “quality of life” in Norfolk County will change over the next three years?
How the Social Well-being will Change over the next 3 years in Norfolk County
Target Group
Farm Rural Non-
Farm Urban Total Improve 6.1% 9.4% 12.2% 9.3% Remain the same 49.0% 47.8% 53.8% 50.4% Decline/get worse 41.6% 36.5% 26.0% 34.4% No opinion/Don't know 3.3% 6.4% 8.0% 5.9% Total 100.0% 100.0% 100.0% 100.0% The three residence groups differed significantly in their predictions for the future social well-being of Norfolk County, Chi2 (6, N=710) = 20.40, p<.01. Farm respondents had a more pessimistic three- year outlook on social well- being and quality of life than rural non-farm and urban residents.
How will the Quality of Life (Social well-being) in Norfolk County Change over the Next Three Years?
6.1%
9.4%
12.2%
10.3%
49.0%
47.8%
53.8%
50.5%
41.6%
36.5%
26.0%
32.3%
3.3%
6.4%
8.0%
6.8%
0.0% 10.0% 20.0% 30.0% 40.0% 50.0% 60.0%
Farm
Rural non-farm
Urban
Weighted total
% of respondents in each group, group differences significant at p<.01
Improve Remain the same Decline/get worse No opinion/don't know
Ecometrica Communications Inc.
ALUS Benchmark Survey- Norfolk County 2005 43
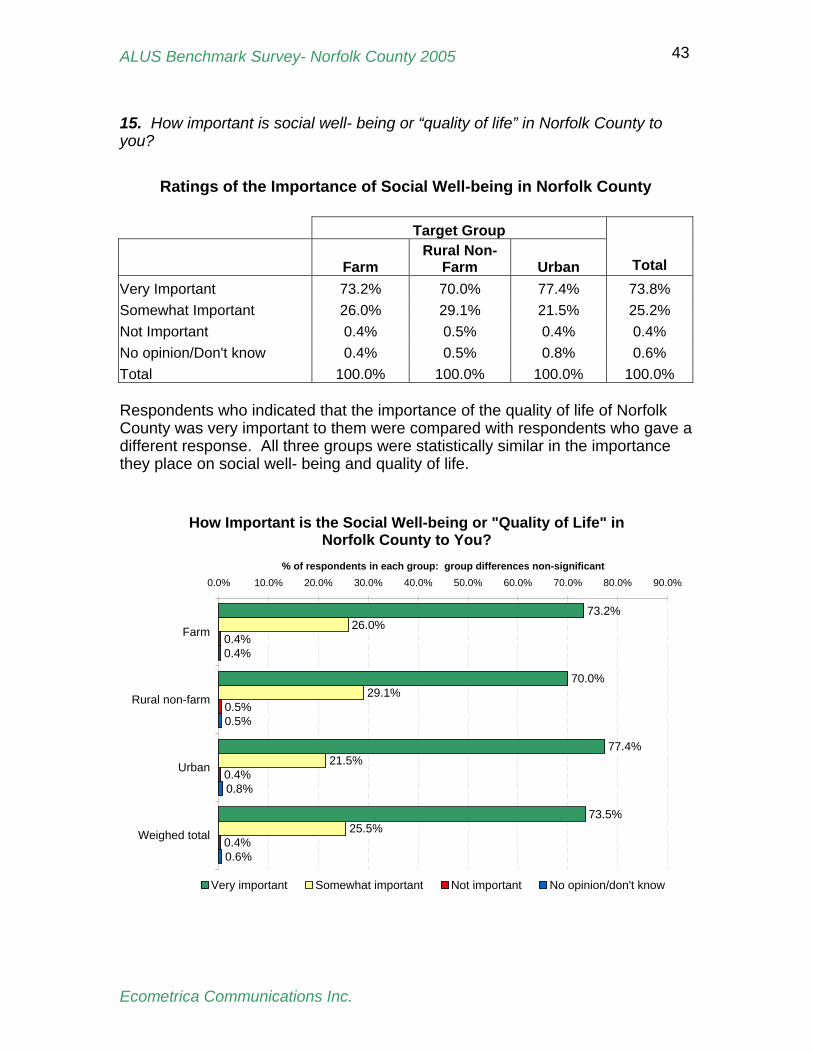
15. How important is social well- being or “quality of life” in Norfolk County to you?
Ratings of the Importance of Social Well-being in Norfolk County Target Group
Farm Rural Non-
Farm Urban Total Very Important 73.2% 70.0% 77.4% 73.8% Somewhat Important 26.0% 29.1% 21.5% 25.2% Not Important 0.4% 0.5% 0.4% 0.4% No opinion/Don't know 0.4% 0.5% 0.8% 0.6% Total 100.0% 100.0% 100.0% 100.0% Respondents who indicated that the importance of the quality of life of Norfolk County was very important to them were compared with respondents who gave a different response. All three groups were statistically similar in the importance they place on social well- being and quality of life.
How Important is the Social Well-being or "Quality of Life" in Norfolk County to You?
73.2%
70.0%
77.4%
73.5%
26.0%
29.1%
21.5%
25.5%
0.4%
0.5%
0.4%
0.4%
0.4%
0.5%
0.8%
0.6%
0.0% 10.0% 20.0% 30.0% 40.0% 50.0% 60.0% 70.0% 80.0% 90.0%
Farm
Rural non-farm
Urban
Weighed total
% of respondents in each group: group differences non-significant
Very important Somewhat important Not important No opinion/don't know
Ecometrica Communications Inc.
ALUS Benchmark Survey- Norfolk County 2005 44
SUMMARY: Social Well-Being in Norfolk County Most of the respondents agreed that the social well- being or quality of life in Norfolk County was good. Overall, 57% of the respondents rated the quality of life as good or very good, and 33% of respondents felt it was neither good nor poor. Although social well- being is often linked to the economy and income, it is noteworthy that there were no differences detected among the three groups in their perceptions of social well- being at this time, in spite of significant differences in the direction of personal incomes and economic conditions. Approximately three-quarters of the respondents in all residence groups stated that quality of life was very important to them. However, the groups did differ in how they predicted quality of life would change over the next few years. A similar proportion in each of the three residence groups predicted no change in quality of life over the next three years, but 42% of farm respondents thought it would decline, compared to only 26% of urban respondents. This mirrors the perception of the health of the economy among the three groups, and suggests that economic health may play a particularly important role in quality of life in the future for those respondents who depend on farming for their livelihood.
Ecometrica Communications Inc.
ALUS Benchmark Survey- Norfolk County 2005 45
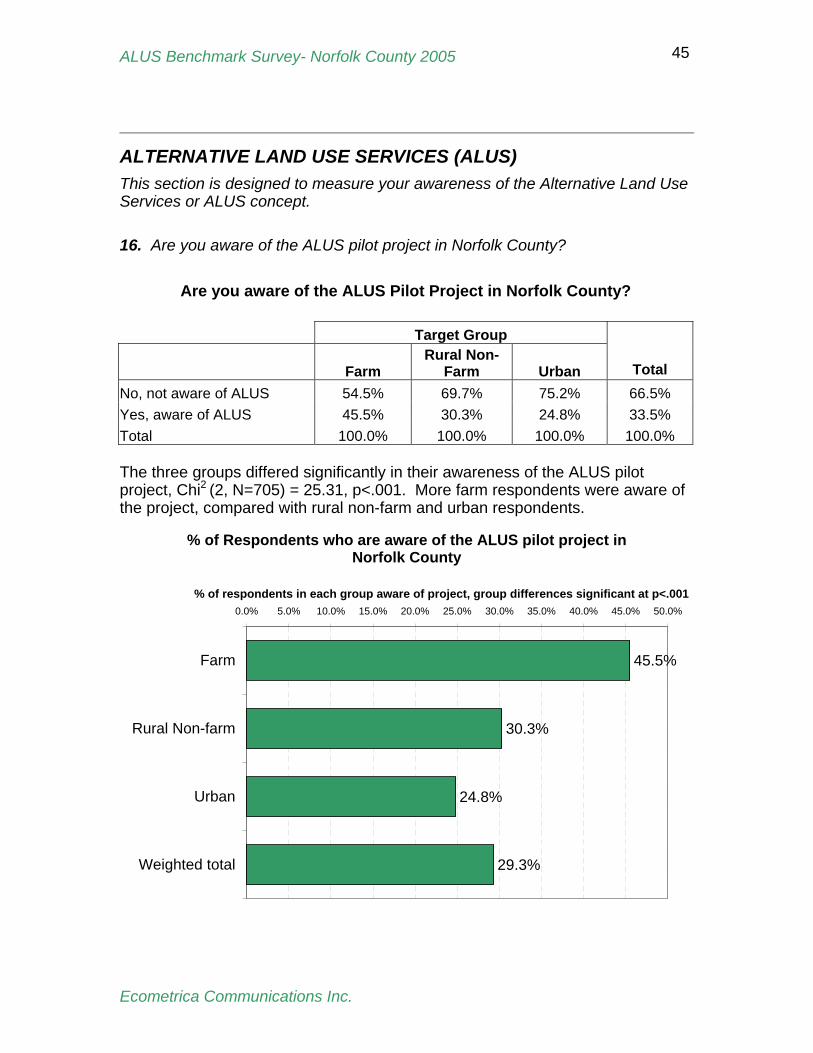
ALTERNATIVE LAND USE SERVICES (ALUS) This section is designed to measure your awareness of the Alternative Land Use Services or ALUS concept. 16. Are you aware of the ALUS pilot project in Norfolk County?
Are you aware of the ALUS Pilot Project in Norfolk County? Target Group
Farm Rural Non-
Farm Urban Total No, not aware of ALUS 54.5% 69.7% 75.2% 66.5% Yes, aware of ALUS 45.5% 30.3% 24.8% 33.5% Total 100.0% 100.0% 100.0% 100.0% The three groups differed significantly in their awareness of the ALUS pilot project, Chi2 (2, N=705) = 25.31, p<.001. More farm respondents were aware of the project, compared with rural non-farm and urban respondents.
% of Respondents who are aware of the ALUS pilot project in Norfolk County
45.5%
30.3%
24.8%
29.3%
0.0% 5.0% 10.0% 15.0% 20.0% 25.0% 30.0% 35.0% 40.0% 45.0% 50.0%
Farm
Rural Non-farm
Urban
Weighted total
% of respondents in each group aware of project, group differences significant at p<.001
Ecometrica Communications Inc.
ALUS Benchmark Survey- Norfolk County 2005 46
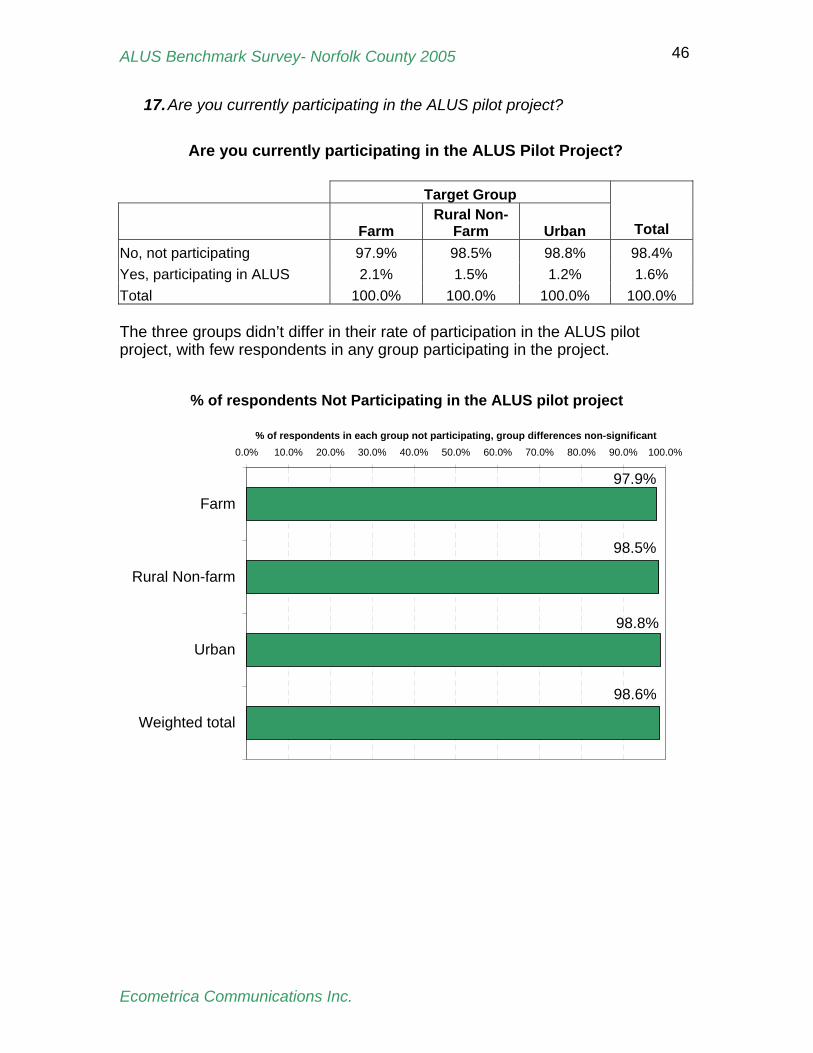
17. Are you currently participating in the ALUS pilot project?
Are you currently participating in the ALUS Pilot Project? Target Group
Farm Rural Non-
Farm Urban Total No, not participating 97.9% 98.5% 98.8% 98.4% Yes, participating in ALUS 2.1% 1.5% 1.2% 1.6% Total 100.0% 100.0% 100.0% 100.0% The three groups didn’t differ in their rate of participation in the ALUS pilot project, with few respondents in any group participating in the project.
% of respondents Not Participating in the ALUS pilot project
98.6%
98.8%
98.5%
97.9%
0.0% 10.0% 20.0% 30.0% 40.0% 50.0% 60.0% 70.0% 80.0% 90.0% 100.0%
Farm
Rural Non-farm
Urban
Weighted total
% of respondents in each group not participating, group differences non-significant
Ecometrica Communications Inc.
ALUS Benchmark Survey- Norfolk County 2005 47
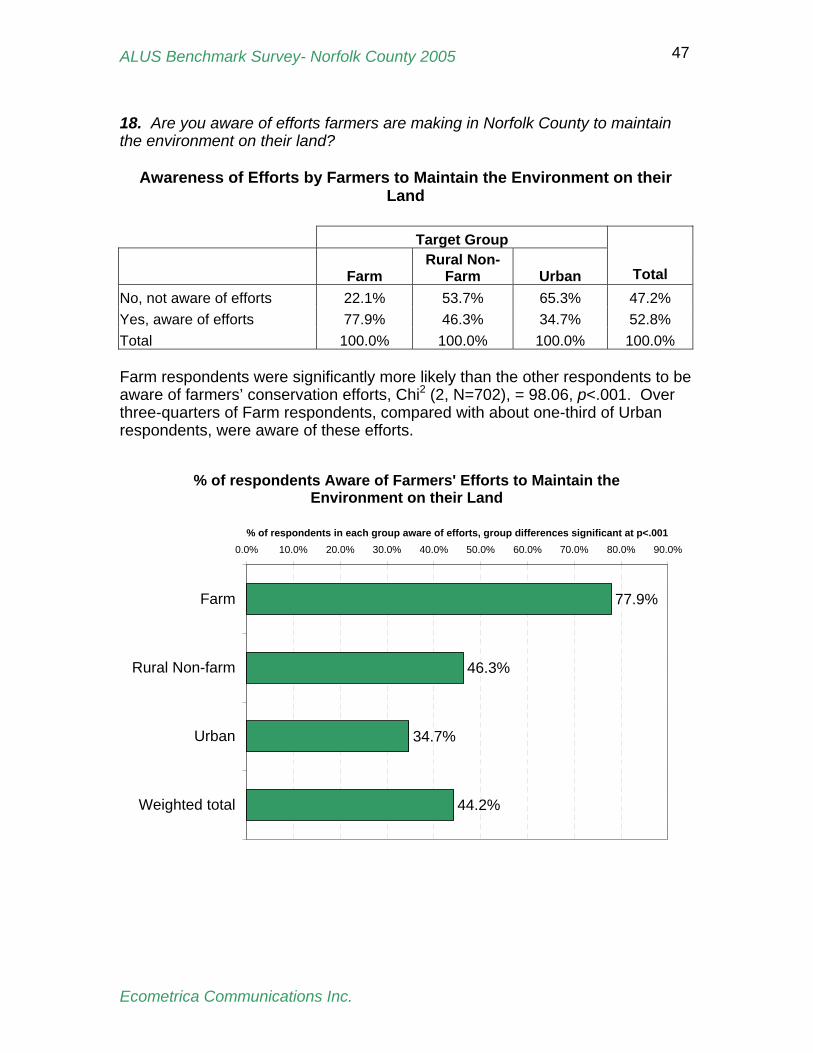
18. Are you aware of efforts farmers are making in Norfolk County to maintain the environment on their land?
Awareness of Efforts by Farmers to Maintain the Environment on their Land
Target Group
Farm Rural Non-
Farm Urban Total No, not aware of efforts 22.1% 53.7% 65.3% 47.2% Yes, aware of efforts 77.9% 46.3% 34.7% 52.8% Total 100.0% 100.0% 100.0% 100.0% Farm respondents were significantly more likely than the other respondents to be aware of farmers’ conservation efforts, Chi2 (2, N=702), = 98.06, p<.001. Over three-quarters of Farm respondents, compared with about one-third of Urban respondents, were aware of these efforts.
% of respondents Aware of Farmers' Efforts to Maintain the Environment on their Land
77.9%
46.3%
34.7%
44.2%
0.0% 10.0% 20.0% 30.0% 40.0% 50.0% 60.0% 70.0% 80.0% 90.0%
Farm
Rural Non-farm
Urban
Weighted total
% of respondents in each group aware of efforts, group differences significant at p<.001
Ecometrica Communications Inc.
ALUS Benchmark Survey- Norfolk County 2005 48
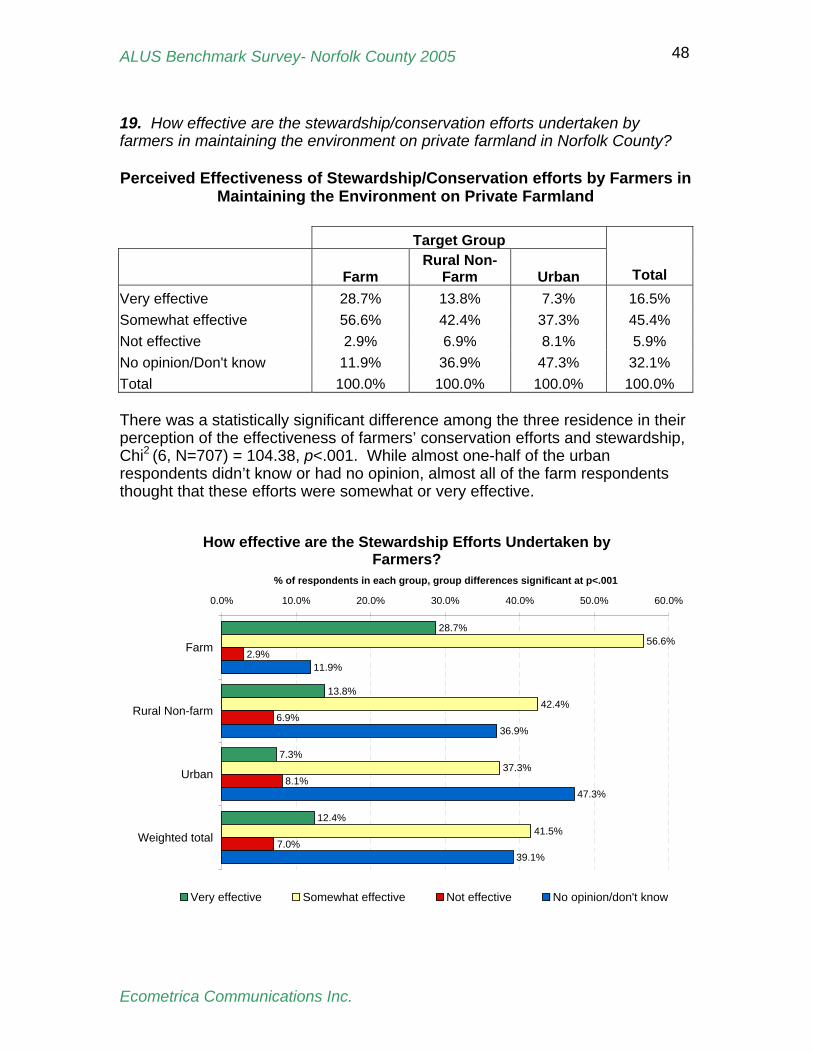
19. How effective are the stewardship/conservation efforts undertaken by farmers in maintaining the environment on private farmland in Norfolk County? Perceived Effectiveness of Stewardship/Conservation efforts by Farmers in
Maintaining the Environment on Private Farmland Target Group
Farm Rural Non-
Farm Urban Total Very effective 28.7% 13.8% 7.3% 16.5% Somewhat effective 56.6% 42.4% 37.3% 45.4% Not effective 2.9% 6.9% 8.1% 5.9% No opinion/Don't know 11.9% 36.9% 47.3% 32.1% Total 100.0% 100.0% 100.0% 100.0% There was a statistically significant difference among the three residence in their perception of the effectiveness of farmers’ conservation efforts and stewardship, Chi2 (6, N=707) = 104.38, p<.001. While almost one-half of the urban respondents didn’t know or had no opinion, almost all of the farm respondents thought that these efforts were somewhat or very effective.
How effective are the Stewardship Efforts Undertaken by Farmers?
28.7%
13.8%
7.3%
12.4%
56.6%
42.4%
37.3%
41.5%
2.9%
6.9%
8.1%
7.0%
11.9%
36.9%
47.3%
39.1%
0.0% 10.0% 20.0% 30.0% 40.0% 50.0% 60.0%
Farm
Rural Non-farm
Urban
Weighted total
% of respondents in each group, group differences significant at p<.001
Very effective Somewhat effective Not effective No opinion/don't know
Ecometrica Communications Inc.
ALUS Benchmark Survey- Norfolk County 2005 49
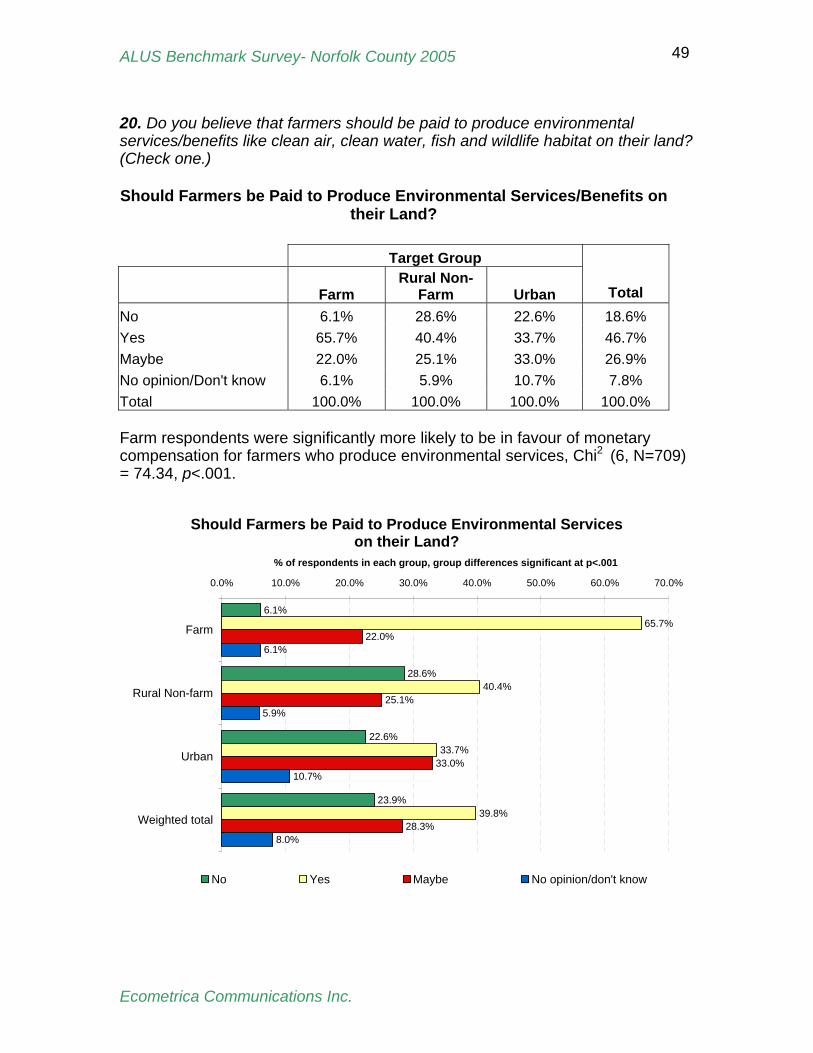
20. Do you believe that farmers should be paid to produce environmental services/benefits like clean air, clean water, fish and wildlife habitat on their land? (Check one.) Should Farmers be Paid to Produce Environmental Services/Benefits on
their Land? Target Group
Farm Rural Non-
Farm Urban Total No 6.1% 28.6% 22.6% 18.6% Yes 65.7% 40.4% 33.7% 46.7% Maybe 22.0% 25.1% 33.0% 26.9% No opinion/Don't know 6.1% 5.9% 10.7% 7.8% Total 100.0% 100.0% 100.0% 100.0% Farm respondents were significantly more likely to be in favour of monetary compensation for farmers who produce environmental services, Chi2 (6, N=709) = 74.34, p<.001.
Should Farmers be Paid to Produce Environmental Services on their Land?
6.1%
28.6%
22.6%
23.9%
65.7%
40.4%
33.7%
39.8%
22.0%
25.1%
33.0%
28.3%
6.1%
5.9%
10.7%
8.0%
0.0% 10.0% 20.0% 30.0% 40.0% 50.0% 60.0% 70.0%
Farm
Rural Non-farm
Urban
Weighted total
% of respondents in each group, group differences significant at p<.001
No Yes Maybe No opinion/don't know
Ecometrica Communications Inc.
ALUS Benchmark Survey- Norfolk County 2005 50
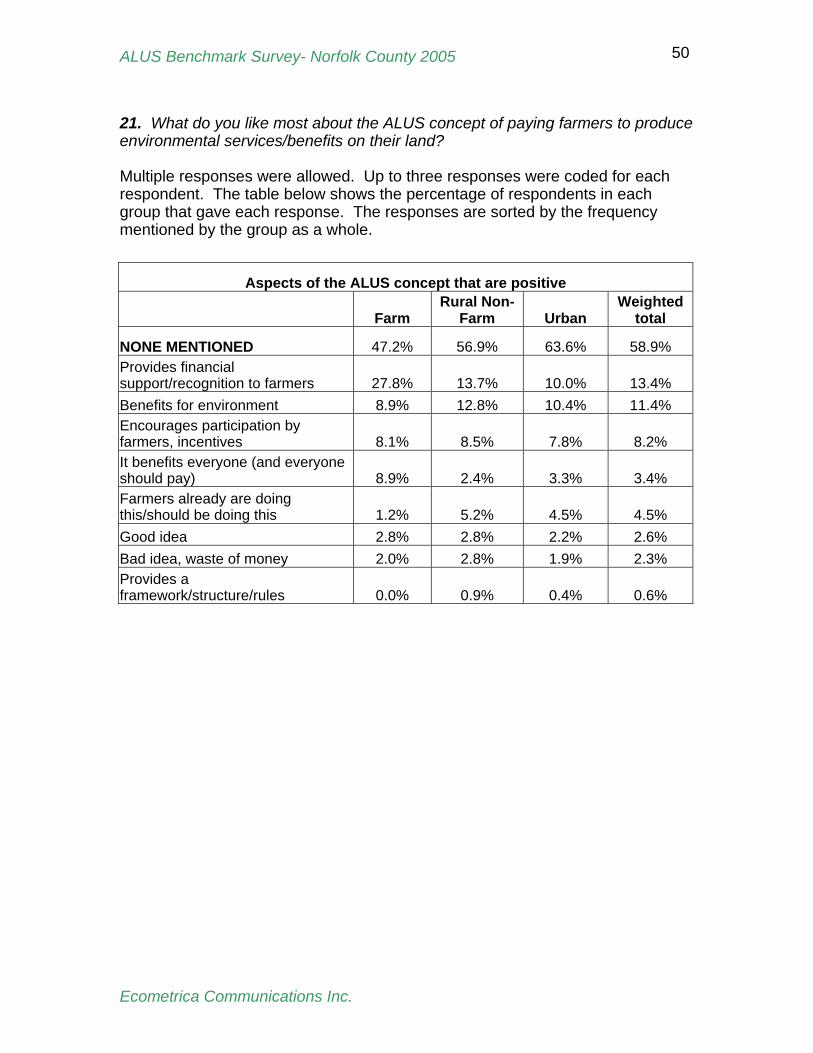
21. What do you like most about the ALUS concept of paying farmers to produce environmental services/benefits on their land? Multiple responses were allowed. Up to three responses were coded for each respondent. The table below shows the percentage of respondents in each group that gave each response. The responses are sorted by the frequency mentioned by the group as a whole.
Aspects of the ALUS concept that are positive
Farm Rural Non-
Farm Urban Weighted
total
NONE MENTIONED 47.2% 56.9% 63.6% 58.9% Provides financial support/recognition to farmers 27.8% 13.7% 10.0% 13.4% Benefits for environment 8.9% 12.8% 10.4% 11.4% Encourages participation by farmers, incentives 8.1% 8.5% 7.8% 8.2% It benefits everyone (and everyone should pay) 8.9% 2.4% 3.3% 3.4% Farmers already are doing this/should be doing this 1.2% 5.2% 4.5% 4.5% Good idea 2.8% 2.8% 2.2% 2.6% Bad idea, waste of money 2.0% 2.8% 1.9% 2.3% Provides a framework/structure/rules 0.0% 0.9% 0.4% 0.6%
Ecometrica Communications Inc.
ALUS Benchmark Survey- Norfolk County 2005 51
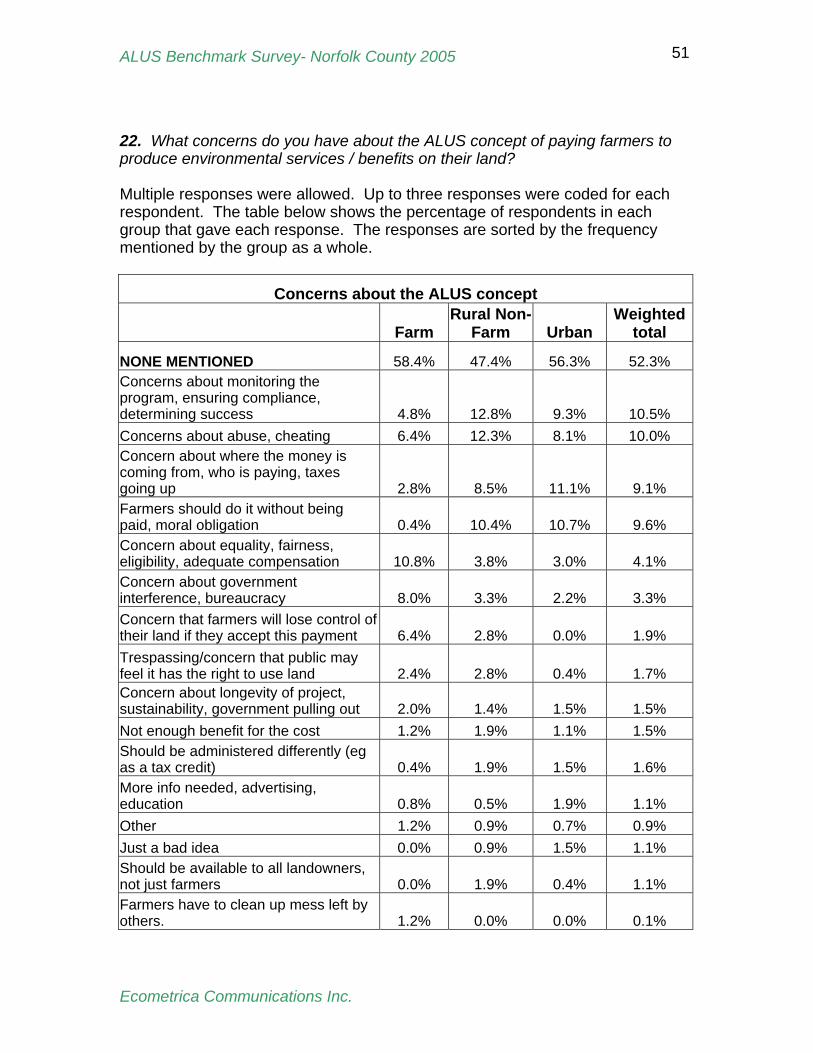
22. What concerns do you have about the ALUS concept of paying farmers to produce environmental services / benefits on their land? Multiple responses were allowed. Up to three responses were coded for each respondent. The table below shows the percentage of respondents in each group that gave each response. The responses are sorted by the frequency mentioned by the group as a whole.
Concerns about the ALUS concept
Farm Rural Non-
Farm Urban Weighted
total
NONE MENTIONED 58.4% 47.4% 56.3% 52.3% Concerns about monitoring the program, ensuring compliance, determining success 4.8% 12.8% 9.3% 10.5% Concerns about abuse, cheating 6.4% 12.3% 8.1% 10.0% Concern about where the money is coming from, who is paying, taxes going up 2.8% 8.5% 11.1% 9.1% Farmers should do it without being paid, moral obligation 0.4% 10.4% 10.7% 9.6% Concern about equality, fairness, eligibility, adequate compensation 10.8% 3.8% 3.0% 4.1% Concern about government interference, bureaucracy 8.0% 3.3% 2.2% 3.3% Concern that farmers will lose control of their land if they accept this payment 6.4% 2.8% 0.0% 1.9% Trespassing/concern that public may feel it has the right to use land 2.4% 2.8% 0.4% 1.7% Concern about longevity of project, sustainability, government pulling out 2.0% 1.4% 1.5% 1.5% Not enough benefit for the cost 1.2% 1.9% 1.1% 1.5% Should be administered differently (eg as a tax credit) 0.4% 1.9% 1.5% 1.6% More info needed, advertising, education 0.8% 0.5% 1.9% 1.1% Other 1.2% 0.9% 0.7% 0.9% Just a bad idea 0.0% 0.9% 1.5% 1.1% Should be available to all landowners, not just farmers 0.0% 1.9% 0.4% 1.1% Farmers have to clean up mess left by others. 1.2% 0.0% 0.0% 0.1%
Ecometrica Communications Inc.
ALUS Benchmark Survey- Norfolk County 2005 52
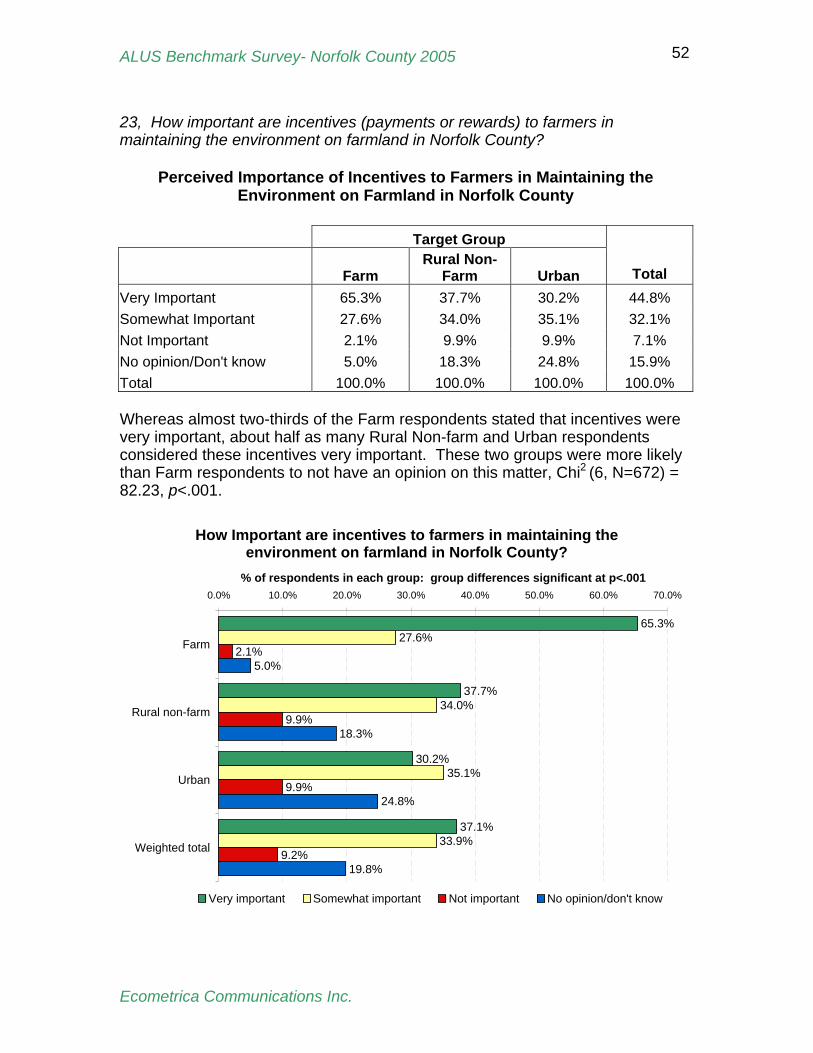
23, How important are incentives (payments or rewards) to farmers in maintaining the environment on farmland in Norfolk County?
Perceived Importance of Incentives to Farmers in Maintaining the Environment on Farmland in Norfolk County
Target Group
Farm Rural Non-
Farm Urban Total Very Important 65.3% 37.7% 30.2% 44.8% Somewhat Important 27.6% 34.0% 35.1% 32.1% Not Important 2.1% 9.9% 9.9% 7.1% No opinion/Don't know 5.0% 18.3% 24.8% 15.9% Total 100.0% 100.0% 100.0% 100.0% Whereas almost two-thirds of the Farm respondents stated that incentives were very important, about half as many Rural Non-farm and Urban respondents considered these incentives very important. These two groups were more likely than Farm respondents to not have an opinion on this matter, Chi2 (6, N=672) = 82.23, p<.001.
How Important are incentives to farmers in maintaining the environment on farmland in Norfolk County?
65.3%
37.7%
30.2%
37.1%
27.6%
34.0%
35.1%
33.9%
2.1%
9.9%
9.9%
9.2%
5.0%
18.3%
24.8%
19.8%
0.0% 10.0% 20.0% 30.0% 40.0% 50.0% 60.0% 70.0%
Farm
Rural non-farm
Urban
Weighted total
% of respondents in each group: group differences significant at p<.001
Very important Somewhat important Not important No opinion/don't know
Ecometrica Communications Inc.
ALUS Benchmark Survey- Norfolk County 2005 53
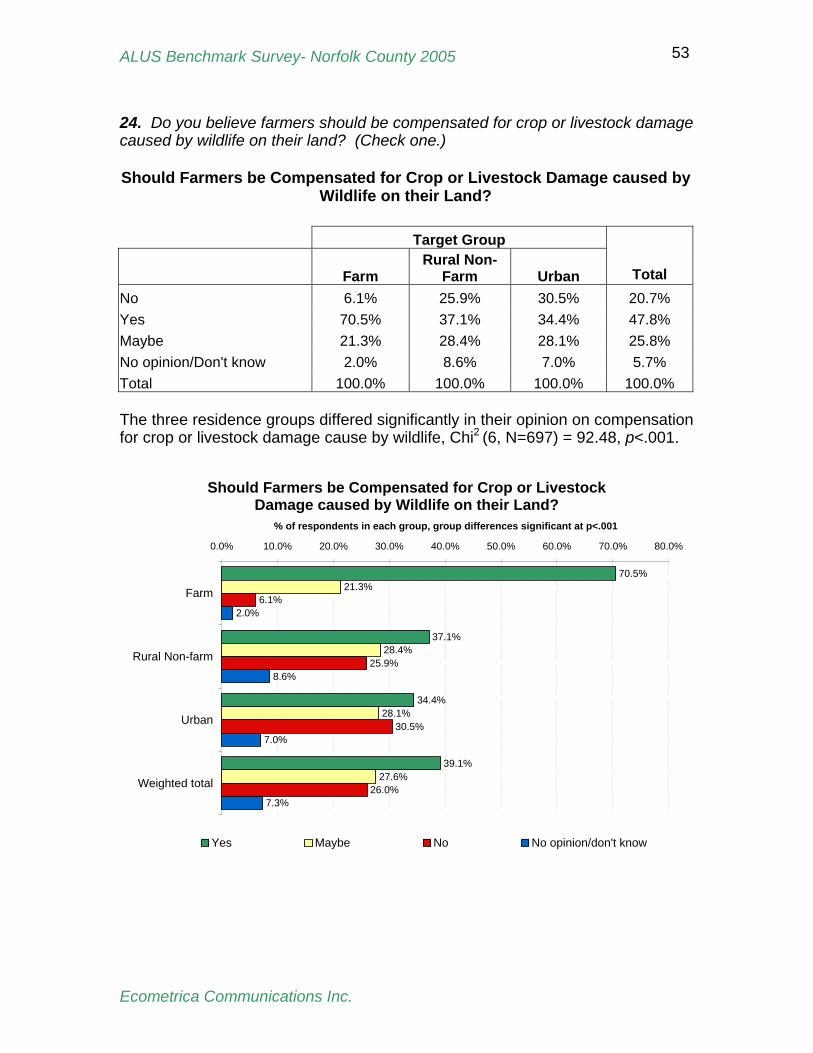
24. Do you believe farmers should be compensated for crop or livestock damage caused by wildlife on their land? (Check one.) Should Farmers be Compensated for Crop or Livestock Damage caused by
Wildlife on their Land? Target Group
Farm Rural Non-
Farm Urban Total No 6.1% 25.9% 30.5% 20.7% Yes 70.5% 37.1% 34.4% 47.8% Maybe 21.3% 28.4% 28.1% 25.8% No opinion/Don't know 2.0% 8.6% 7.0% 5.7% Total 100.0% 100.0% 100.0% 100.0% The three residence groups differed significantly in their opinion on compensation for crop or livestock damage cause by wildlife, Chi2 (6, N=697) = 92.48, p<.001.
Should Farmers be Compensated for Crop or Livestock Damage caused by Wildlife on their Land?
70.5%
37.1%
34.4%
39.1%
21.3%
28.4%
28.1%
27.6%
6.1%
25.9%
30.5%
26.0%
2.0%
8.6%
7.0%
7.3%
0.0% 10.0% 20.0% 30.0% 40.0% 50.0% 60.0% 70.0% 80.0%
Farm
Rural Non-farm
Urban
Weighted total
% of respondents in each group, group differences significant at p<.001
Yes Maybe No No opinion/don't know
Ecometrica Communications Inc.
ALUS Benchmark Survey- Norfolk County 2005 54
SUMMARY: Alternative Land Use Services (ALUS) The ALUS concept was first introduced into Norfolk County in a meeting with the Norfolk Land Stewardship Council, Delta Waterfowl and Keystone Agricultural Producers from Manitoba in 2002. In 2003, an ALUS workshop was held in the county, attended by 53 people from 30 organizations across the country. One or two local newspaper articles on ALUS in Norfolk County have appeared each year since the workshop, and the Norfolk Federation of Agriculture has continued to participate in development of the project and report progress to county farmers. At the time of the survey in 2005, discussions to establish ALUS demonstration farms had begun, but little implementation on the ground had taken place. Accordingly, farm respondents were much more likely than those in other groups to be aware of the ALUS pilot project. Nevertheless, only 46% of the farmers were aware of the pilot project in 2005. As agriculture is an important industry in the county, 30% of rural non- farm and 25% urban residents also had some awareness of ALUS. Very few respondents were participating in the pilot project. Farmers were much more likely than those in other groups to be aware of the efforts that farmers were making to maintain the environment on their land. Although 78% of farmers claimed to be aware of these efforts, one in five (22%) of farmers did not. Two- thirds of urban residents and half of rural non- farm respondents were unaware of the efforts farmers are making to maintain the environment on their land. Taking the sample as a whole, just over one-half of the respondents (53%) stated that they knew about farmers’ efforts to conserve the environment on their farmland. However, when these responses are weighted to reflect the residential composition of Norfolk County, overall awareness of farmers’ environmental efforts drops to 44%. The perceived effectiveness of environmental stewardship efforts undertaken by farmers was naturally affected by awareness. Farm respondents rated these stewardship efforts quite positively; over 85% of the farm respondents thought that the efforts were somewhat or very effective. In contrast, almost one-half of urban respondents and over one- third of rural non- farm respondents had no opinion or just didn’t know about the effectiveness of these efforts, although those who did have an opinion were likely to rate them as at least somewhat effective. The uncertainty of urban and rural non- farm groups about the effectiveness of farmers’ environmental efforts, was the single largest knowledge gap between farmers and other residents identified in the survey results. Farm respondents believed quite strongly that farmers should be paid to produce environmental services on their land. Farm respondents viewed incentives and compensation as relatively more important to achieving environmental benefits than other groups.
Ecometrica Communications Inc.
ALUS Benchmark Survey- Norfolk County 2005 55
A majority of non- farm residents in Norfolk County believed that farmers should be, or possibly could be paid to deliver environmental services. Two- thirds of both urban and rural non- farm residents responded “yes” or “maybe” when asked if they believed farmers should be paid to produce environmental services, that provide benefits like clean air, water and wildlife habitat. In contrast, 29% of rural non- farm, 23% of urban residents and 6% of farmers did not believe farmers should be paid for producing these services. 11% of urban residents were uncertain. Farm respondents were more aware of the ALUS concept and could identify more positive aspects than the rural non- farm and urban respondents. Farmers indicated that initiatives such as ALUS provide financial support for farmers, who dedicate a portion of their land for habitat and conservation. Incentives are seen as recognition for the good environmental services farmers can provide. They feel that such services benefit everyone, rural and urban alike, and as such, everyone should be responsible for paying for the services. A similar pattern of responses were observed among rural non- farm and urban groups when asked what they liked most about the ALUS concept, however, lacking awareness, few non- farm respondents could or would identify a positive aspect of initiatives such as ALUS. Non- farm respondents who did volunteer an opinion, most frequently suggested that ALUS would provide financial support and recognition to farmers for environmental efforts, and benefits to the environment. Incentives would also encourage participation in these kinds of programs. More than half (52%) of the survey respondents did not list any concerns about the ALUS concept when asked, although a wide range of concerns were recorded. One in ten farm respondents were concerned about the eligibility requirements for compensation, and whether this compensation is dispensed fairly and equally, in amounts that adequately compensate for the loss of farm income. A few farm respondents (8%) voiced concerns about government over-involvement, interference and bureaucracy. A further 6% raised concerns about possible abuse or cheating, and 6% feared that farmers may lose control of their own land if they accept payment from a government. Rural non-farm (13%) and urban (9%) respondents expressed concern about monitoring the program, ensuring compliance and project evaluation. Similarly, 12% of rural non- farm and 8% of urban groups registered concern about potential abuse or cheating the program. Approximately one in ten non- farm respondents raised concerns about where the money was coming from and who is paying and the possibility of tax increases. About the same number of non- farm respondents thought that farmers had a moral obligation to the environment and should provide services without being paid. 52% of all survey respondents did not raise a single concern when asked about paying farmers to provide environmental services under ALUS. Overall, no single issue was raised by more than 13% of respondents in any group, and most concerns were shared by fewer than 5% of respondents for the entire
Ecometrica Communications Inc.
ALUS Benchmark Survey- Norfolk County 2005 56
sample. Concerns recorded in this survey are “top of mind” as respondents were not prompted, nor given a list of potential issues to select a response. A lack of awareness of ALUS may have limited the number of concerns raised by non- farm respondents, however fewer issues were raised by farmers, who were much more aware of ALUS. The benchmark survey also helps to quantify the depth of concern in the farm and non- farm community in the county, in regard to a number of issues, which have been raised during the course of ALUS planning meetings and during the workshop in 2003. Some of these issues include for example, a concern that ALUS might encourage trespassing because the public may feel they have a right to use environmental service lands, and concern about losing control of the land. The data indicates that these concerns and several others listed occur at a very low frequency in the farm and non- farm community. A majority (71%) of farmers believe they should be compensated for crop or livestock damage caused by wildlife, while 21% suggested the issue may need further consideration. Approximately two- thirds of non- farm audiences responded with “yes” or “maybe” to the notion of compensating farmers for these losses. In contrast, 26% of the non- farm group and 31% of the urban respondents did not believe farmers should be compensated for wildlife damage. These results mirror the survey findings on the question of paying farmers to deliver environmental services. The ALUS benchmark survey has demonstrated considerable public support may exist in Norfolk County for the concept of paying farmers to produce environmental benefits on their land. Residents in all population segments are highly aware of some environmental issues in the county and realize there is a close relationship between farming and the environment. Most residents also believe the environment will remain the same or decline further over the next three years. The environment, like the economy and social well- being, is extremely important to all residents of the county, as a life support system, a contributor to the economy and quality of life, and an outdoor re- creational haven. While the prospect of delivering ecological goods and services on farmland has a good foundation of public support in Norfolk County, it is important not to overstate this support. If the overall survey sample is weighted to reflect the residential composition of Norfolk County, almost one-quarter (24%) of county residents would be opposed to paying farmers to provide environmental services on their land (see Appendix A). A similar proportion of the population (26.0%) would not feel the need to compensate farmers for crop or livestock damaged by wildlife on their land. However, that leaves a large proportion of the population who either support the concept of paying farmers for environmental services, or who could perhaps be persuaded with proper marketing of the concept and education. On these premises, an effective, well- run and properly communicated ALUS project would most likely receive good support from the majority of Norfolk County residents. Ecometrica Communications Inc.
ALUS Benchmark Survey- Norfolk County 2005 57
ACKNOWLEDGEMENTS The Norfolk Federation of Agriculture played a key role in the development and implementation of the survey, and also contributed staff time and other resources to the project. We thank Bauke Vogelszang, Vic Janulis, Fred Judd and particularly Shelia White for their work and assistance in planning and delivering many important aspects of the survey field- work with farmers. Dave Reid of the Norfolk Land Stewardship Council coordinated the survey project, raised money and organized the project partners, and provided invaluable encouragement and assistance. Delta Waterfowl Foundation contributed staff time and financial resources to ensure this project reached completion. We thank the ALUS Partner Advisory Committee and staff of several organizations who contributed their interest, help and advice to the survey team. Timely assistance from Amy Eberlee got the survey off to a great start and Katie Nolan helped complete the field- work with rural non- farm and urban audiences. Second Avenue Printing provided reliable, professional service on our printing needs. Several organizations contributed financial assistance to the survey. We thank Delta Waterfowl Foundation, Ontario Stewardship of the Ontario Ministry of Natural Resources, the Norfolk Land Stewardship Council, TD Friends of the Environment Foundation, the Head Office and Zone J of the Ontario Federation of Anglers and Hunters, the Ontario Wildlife Foundation, and the Norfolk Soil and Crop Improvement Association.
SURVEY METHODOLOGY Information needs and the survey questionnaire were developed in consultation with the ALUS Partner Advisory Committee overseeing the implementation of the ALUS pilot project. The survey design, questions and analysis was developed in consultation with Mr. Hew Gough, Senior Statistical Consultant, Statistics Canada. A direct mail approach was chosen as finances for the project were limited and much of the material preparation and field- work could be assisted by the Norfolk Federation of Agriculture. The Norfolk Telephone Directory was used as the sample frame for the rural non- farm and urban groups. Names and addresses were chosen at random, postal codes were retrieved from online sources and verified on maps to ascertain residency. A survey question was also included to cross- check on respondent residency. The Ontario Federation of Agriculture membership list was used by the Norfolk Federation of Agriculture to identify farmers in the county. At the time of the survey, more than 95% of county farmers belonged to the NFA and were on the list. The NFA handled the mailing of most surveys, received the responses and forwarded surveys and compiled information on the farm group for analysis. A total of 6200 survey questionnaires were mailed to all groups between May
Ecometrica Communications Inc.
ALUS Benchmark Survey- Norfolk County 2005 58
and September, 2005, and of these 731 (11.7%) were received and sufficiently completed to include in the survey. The total sample included: 250 surveys from farm respondents; 211 from rural non- farm and 270 from urban respondents. Surveys were assigned to one of three residence groups (farm, rural non-farm, and urban) based on original ID number, self-report data, or both. Where discrepancies were present between assigned ID and self-report data, self-report data was used to categorize the survey. Quantitative data was entered using a DOS-based SPSS (Statistical Package for Social Sciences) Data Entry program, which was coded to prohibit out-of-range values. These files were converted into SPSS 11 for Mac OS-X for analyses. Qualitative data was transcribed verbatim onto an Excel spreadsheet. Once codes were created, these codes were entered onto the same spreadsheet, and the ID and numeric codes were converted into an SPSS file to match with the quantitative data. Analyses of quantitative data involved running frequencies and cross- tabulations using the Multiple Response option. Statistical tests of differences among the three groups were conducted using principally Chi- square analysis. Relevant test results are summarized following the cross- tabulation tables in the text, and the full statistical output can be seen in Appendix A. For purposes of comparisons with standard polling information, relevant data was weighted based on the proportion of farm, rural non-farm and urban residents in Norfolk County (9.2% farm, 47.5% rural non-farm, and 43.6% urban). Weighted frequencies are shown in comparison to the group frequencies on charts and in some tables. SURVEY QUESTIONNAIRE (attached) APPENDIX A (attached)
Ecometrica Communications Inc.
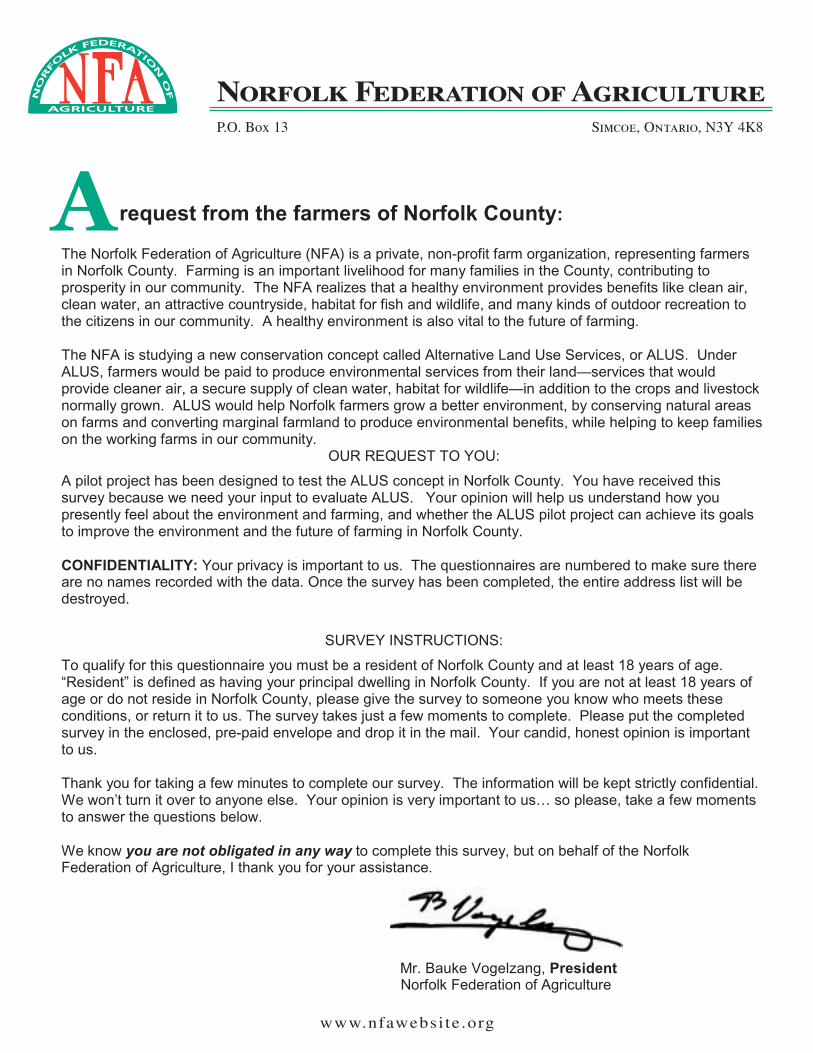
The Norfolk Federation of Agriculture (NFA) is a private, non-profit farm organization, representing farmers in Norfolk County. Farming is an important livelihood for many families in the County, contributing to prosperity in our community. The NFA realizes that a healthy environment provides benefits like clean air, clean water, an attractive countryside, habitat for fish and wildlife, and many kinds of outdoor recreation to the citizens in our community. A healthy environment is also vital to the future of farming.
The NFA is studying a new conservation concept called Alternative Land Use Services, or ALUS. Under ALUS, farmers would be paid to produce environmental services from their land—services that would provide cleaner air, a secure supply of clean water, habitat for wildlife—in addition to the crops and livestock normally grown. ALUS would help Norfolk farmers grow a better environment, by conserving natural areas on farms and converting marginal farmland to produce environmental benefits, while helping to keep families on the working farms in our community.
OUR REQUEST TO YOU:
A pilot project has been designed to test the ALUS concept in Norfolk County. You have received this survey because we need your input to evaluate ALUS. Your opinion will help us understand how you presently feel about the environment and farming, and whether the ALUS pilot project can achieve its goals to improve the environment and the future of farming in Norfolk County.
CONFIDENTIALITY: Your privacy is important to us. The questionnaires are numbered to make sure there are no names recorded with the data. Once the survey has been completed, the entire address list will be destroyed.
SURVEY INSTRUCTIONS:
To qualify for this questionnaire you must be a resident of Norfolk County and at least 18 years of age. “Resident” is defined as having your principal dwelling in Norfolk County. If you are not at least 18 years of age or do not reside in Norfolk County, please give the survey to someone you know who meets these conditions, or return it to us. The survey takes just a few moments to complete. Please put the completed survey in the enclosed, pre-paid envelope and drop it in the mail. Your candid, honest opinion is important to us.
Thank you for taking a few minutes to complete our survey. The information will be kept strictly confidential. We won’t turn it over to anyone else. Your opinion is very important to us… so please, take a few moments to answer the questions below.
We know you are not obligated in any way to complete this survey, but on behalf of the Norfolk Federation of Agriculture, I thank you for your assistance.
Mr. Bauke Vogelzang, President Norfolk Federation of Agriculture
A request from the farmers of Norfolk County:
Norfolk Federation of AgricultureP.O. Box 13 Simcoe, Ontario, N3Y 4K8
www.nfawebsi te .org
Help Farmers Grow A Better Environment in Norfolk County
A survey of public opinion on the environment in relation to farming and the quality of life in
Norfolk County.
A survey of public opinion on the environment in relation to farming and the quality of life in
Norfolk County.
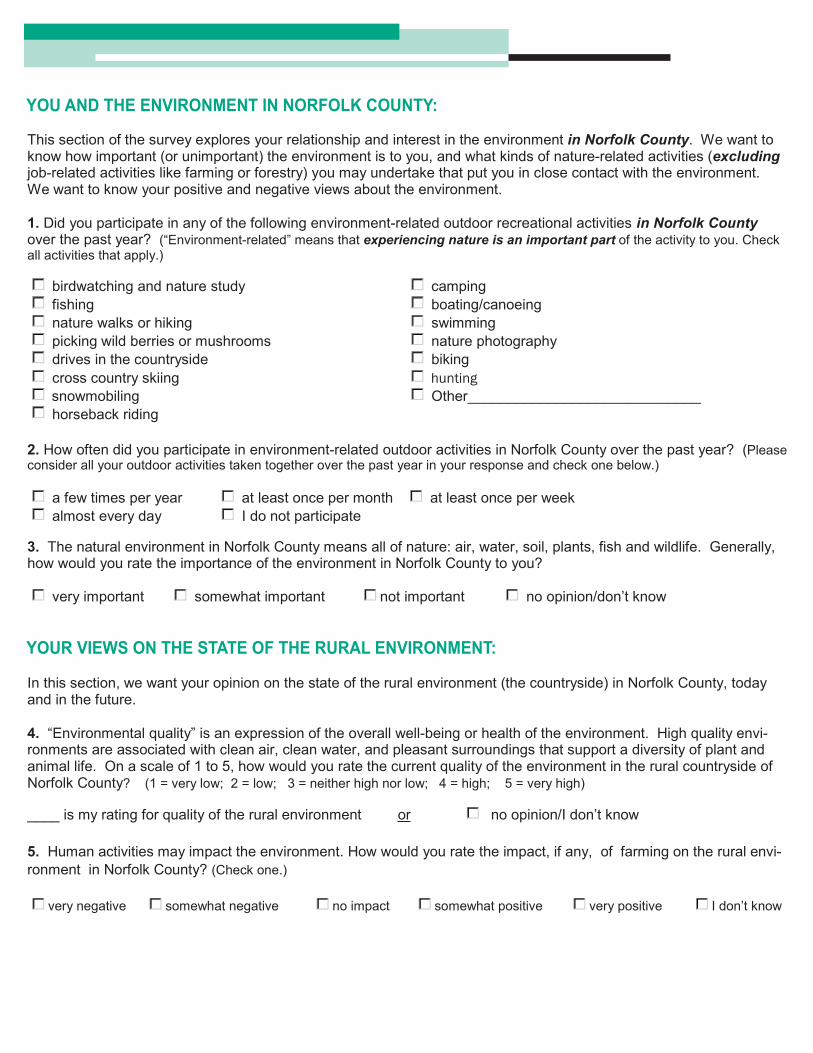
YOU AND THE ENVIRONMENT IN NORFOLK COUNTY:
This section of the survey explores your relationship and interest in the environment in Norfolk County. We want to know how important (or unimportant) the environment is to you, and what kinds of nature-related activities (excludingjob-related activities like farming or forestry) you may undertake that put you in close contact with the environment. We want to know your positive and negative views about the environment.
1. Did you participate in any of the following environment-related outdoor recreational activities in Norfolk County over the past year? (“Environment-related” means that experiencing nature is an important part of the activity to you. Check all activities that apply.)
birdwatching and nature study camping fishing boating/canoeing nature walks or hiking swimming picking wild berries or mushrooms nature photography drives in the countryside biking cross country skiing huntingsnowmobiling Other_____________________________ horseback riding
2. How often did you participate in environment-related outdoor activities in Norfolk County over the past year? (Pleaseconsider all your outdoor activities taken together over the past year in your response and check one below.)
a few times per year at least once per month at least once per week almost every day I do not participate
3. The natural environment in Norfolk County means all of nature: air, water, soil, plants, fish and wildlife. Generally, how would you rate the importance of the environment in Norfolk County to you?
very important somewhat important not important no opinion/don’t know
YOUR VIEWS ON THE STATE OF THE RURAL ENVIRONMENT:
In this section, we want your opinion on the state of the rural environment (the countryside) in Norfolk County, today and in the future.
4. “Environmental quality” is an expression of the overall well-being or health of the environment. High quality envi-ronments are associated with clean air, clean water, and pleasant surroundings that support a diversity of plant and animal life. On a scale of 1 to 5, how would you rate the current quality of the environment in the rural countryside of Norfolk County? (1 = very low; 2 = low; 3 = neither high nor low; 4 = high; 5 = very high)
____ is my rating for quality of the rural environment or no opinion/I don’t know
5. Human activities may impact the environment. How would you rate the impact, if any, of farming on the rural envi-ronment in Norfolk County? (Check one.)
very negative somewhat negative no impact somewhat positive very positive I don’t know
YOU AND THE ENVIRONMENT IN NORFOLK COUNTY:
YOUR VIEWS ON THE STATE OF THE RURAL ENVIRONMENT:
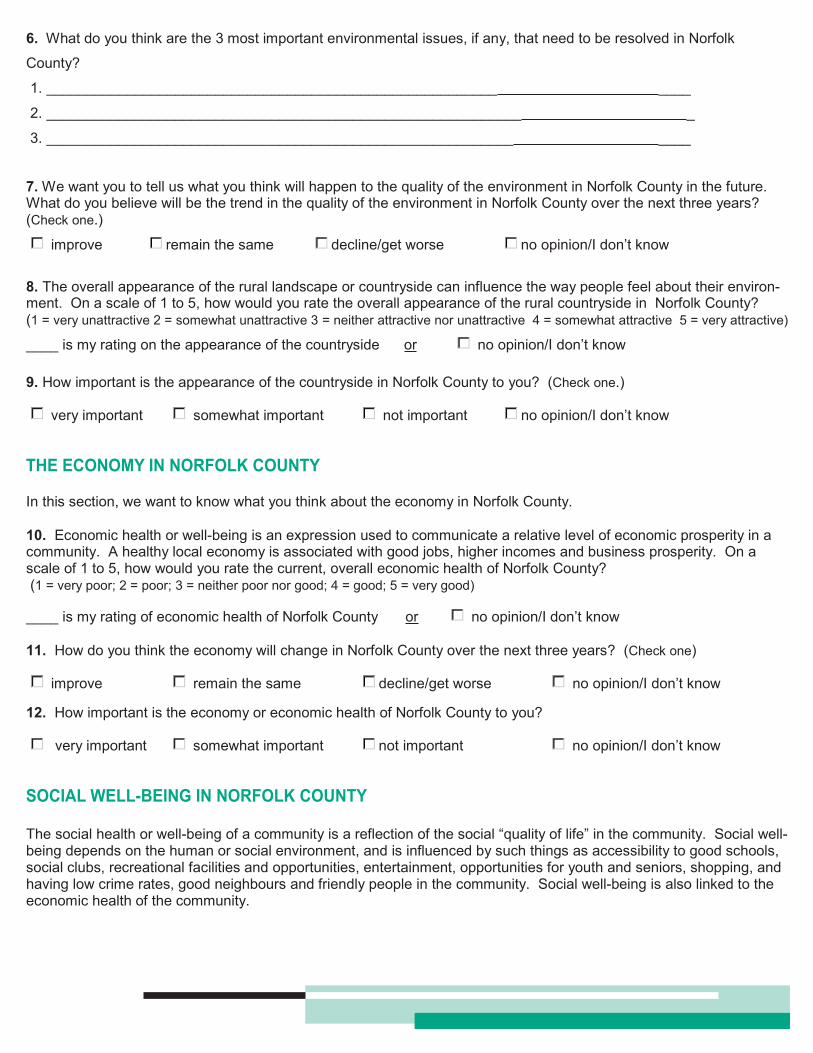
6. What do you think are the 3 most important environmental issues, if any, that need to be resolved in Norfolk
County?
1. ________________________________________________________ ____
2. ___________________________________________________________ _
3. __________________________________________________________ ____
7. We want you to tell us what you think will happen to the quality of the environment in Norfolk County in the future. What do you believe will be the trend in the quality of the environment in Norfolk County over the next three years? (Check one.)
improve remain the same decline/get worse no opinion/I don’t know
8. The overall appearance of the rural landscape or countryside can influence the way people feel about their environ-ment. On a scale of 1 to 5, how would you rate the overall appearance of the rural countryside in Norfolk County? (1 = very unattractive 2 = somewhat unattractive 3 = neither attractive nor unattractive 4 = somewhat attractive 5 = very attractive)
____ is my rating on the appearance of the countryside or no opinion/I don’t know
9. How important is the appearance of the countryside in Norfolk County to you? (Check one.)
very important somewhat important not important no opinion/I don’t know
THE ECONOMY IN NORFOLK COUNTY
In this section, we want to know what you think about the economy in Norfolk County.
10. Economic health or well-being is an expression used to communicate a relative level of economic prosperity in a community. A healthy local economy is associated with good jobs, higher incomes and business prosperity. On a scale of 1 to 5, how would you rate the current, overall economic health of Norfolk County? (1 = very poor; 2 = poor; 3 = neither poor nor good; 4 = good; 5 = very good)
____ is my rating of economic health of Norfolk County or no opinion/I don’t know
11. How do you think the economy will change in Norfolk County over the next three years? (Check one)
improve remain the same decline/get worse no opinion/I don’t know
12. How important is the economy or economic health of Norfolk County to you?
very important somewhat important not important no opinion/I don’t know
SOCIAL WELL- BEING IN NORFOLK COUNTY
The social health or well-being of a community is a reflection of the social “quality of life” in the community. Social well-being depends on the human or social environment, and is influenced by such things as accessibility to good schools, social clubs, recreational facilities and opportunities, entertainment, opportunities for youth and seniors, shopping, and having low crime rates, good neighbours and friendly people in the community. Social well-being is also linked to the economic health of the community.
THE ECONOMY IN NORFOLK COUNTY
SOCIAL WELL-BEING IN NORFOLK COUNTY
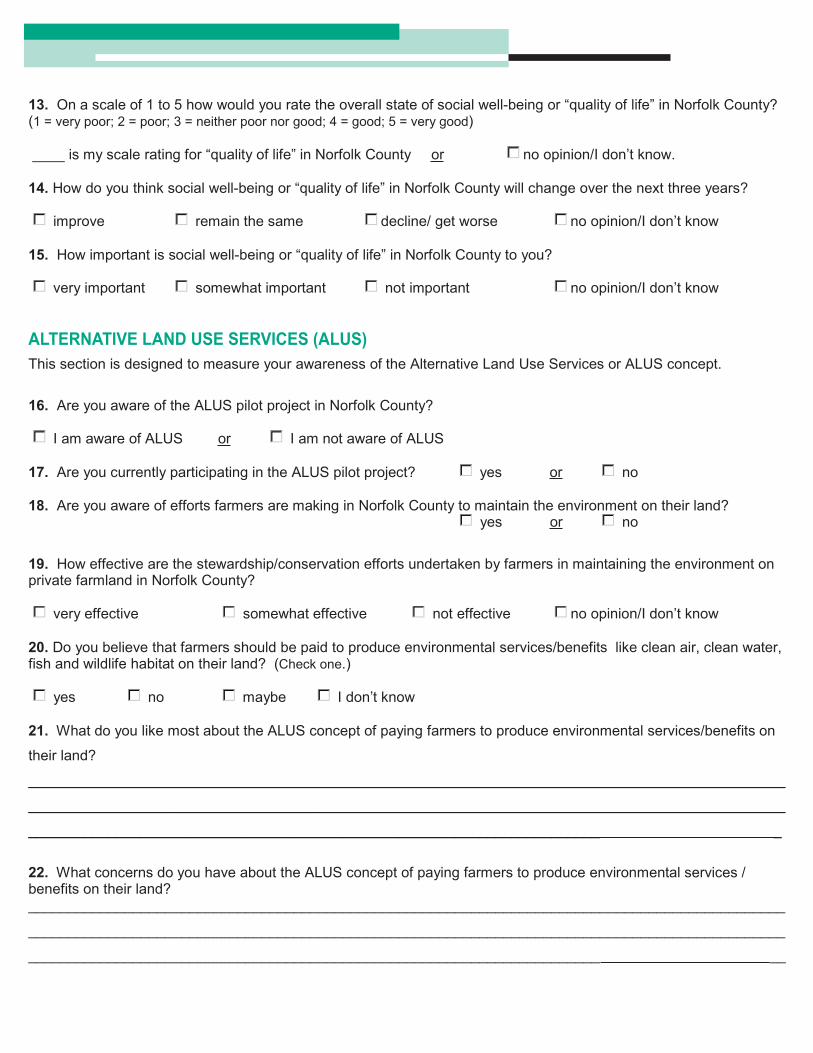
13. On a scale of 1 to 5 how would you rate the overall state of social well-being or “quality of life” in Norfolk County? (1 = very poor; 2 = poor; 3 = neither poor nor good; 4 = good; 5 = very good)
____ is my scale rating for “quality of life” in Norfolk County or no opinion/I don’t know.
14. How do you think social well-being or “quality of life” in Norfolk County will change over the next three years?
improve remain the same decline/ get worse no opinion/I don’t know
15. How important is social well-being or “quality of life” in Norfolk County to you?
very important somewhat important not important no opinion/I don’t know
ALTERNATIVE LAND USE SERVICES (ALUS) This section is designed to measure your awareness of the Alternative Land Use Services or ALUS concept.
16. Are you aware of the ALUS pilot project in Norfolk County?
I am aware of ALUS or I am not aware of ALUS
17. Are you currently participating in the ALUS pilot project? yes or no
18. Are you aware of efforts farmers are making in Norfolk County to maintain the environment on their land? yes or no
19. How effective are the stewardship/conservation efforts undertaken by farmers in maintaining the environment on private farmland in Norfolk County?
very effective somewhat effective not effective no opinion/I don’t know
20. Do you believe that farmers should be paid to produce environmental services/benefits like clean air, clean water, fish and wildlife habitat on their land? (Check one.)
yes no maybe I don’t know
21. What do you like most about the ALUS concept of paying farmers to produce environmental services/benefits on
their land?
______________________________________________________________________________________________
______________________________________________________________________________________________
_______________________________________________________________________ _
22. What concerns do you have about the ALUS concept of paying farmers to produce environmental services / benefits on their land? ______________________________________________________________________________________________
______________________________________________________________________________________________
_______________________________________________________________________ __
ALTERNATIVE LAND USE SERVICES (ALUS)
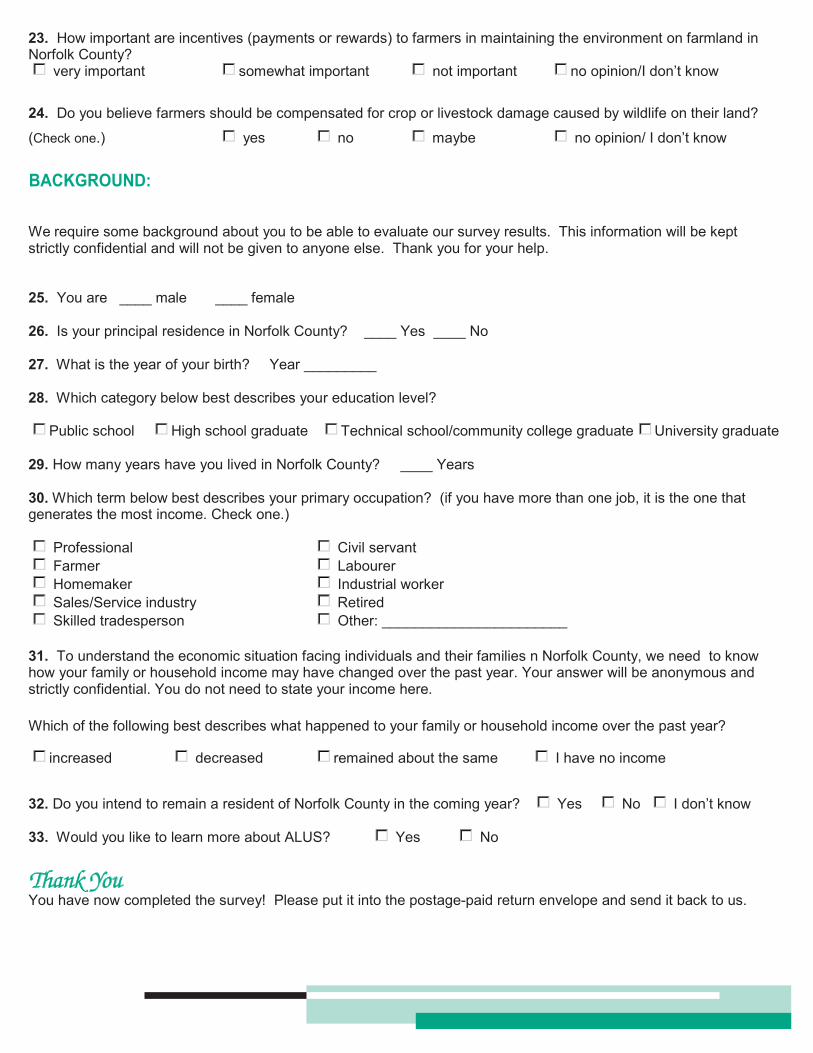
23. How important are incentives (payments or rewards) to farmers in maintaining the environment on farmland in Norfolk County?
very important somewhat important not important no opinion/I don’t know
24. Do you believe farmers should be compensated for crop or livestock damage caused by wildlife on their land?
(Check one.) yes no maybe no opinion/ I don’t know
BACKGROUND:
We require some background about you to be able to evaluate our survey results. This information will be kept strictly confidential and will not be given to anyone else. Thank you for your help.
25. You are ____ male ____ female
26. Is your principal residence in Norfolk County? ____ Yes ____ No
27. What is the year of your birth? Year _________
28. Which category below best describes your education level?
Public school High school graduate Technical school/community college graduate University graduate
29. How many years have you lived in Norfolk County? ____ Years
30. Which term below best describes your primary occupation? (if you have more than one job, it is the one that generates the most income. Check one.)
Professional Civil servant Farmer Labourer Homemaker Industrial worker Sales/Service industry Retired Skilled tradesperson Other: _______________________
31. To understand the economic situation facing individuals and their families n Norfolk County, we need to know how your family or household income may have changed over the past year. Your answer will be anonymous and strictly confidential. You do not need to state your income here.
Which of the following best describes what happened to your family or household income over the past year?
increased decreased remained about the same I have no income
32. Do you intend to remain a resident of Norfolk County in the coming year? Yes No I don’t know
33. Would you like to learn more about ALUS? Yes No
Thank YouYou have now completed the survey! Please put it into the postage-paid return envelope and send it back to us.
BACKGROUND:
Thank You
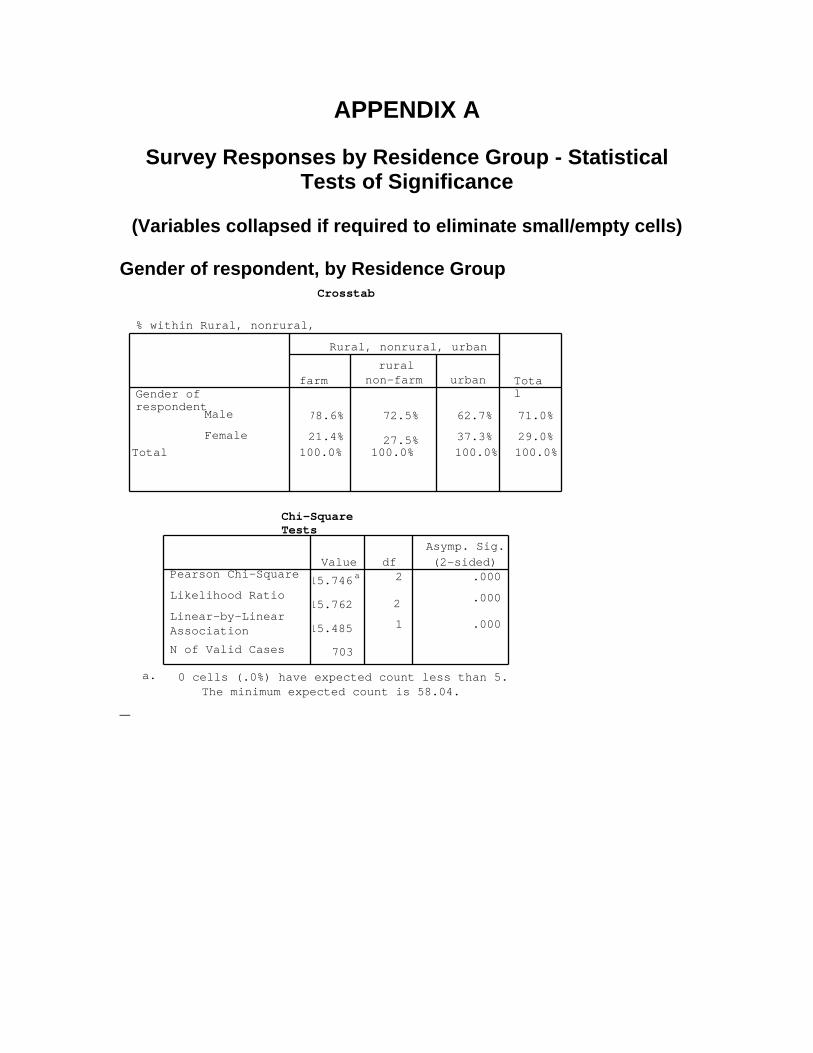
APPENDIX A
Survey Responses by Residence Group - Statistical Tests of Significance
(Variables collapsed if required to eliminate small/empty cells)
Gender of respondent, by Residence Group
_
Crosstab
% within Rural, nonrural, urban
78.6% 72.5% 62.7% 71.0%
21.4% 27.5% 37.3% 29.0%100.0% 100.0% 100.0% 100.0%
Male Female
Gender of respondent
Total
farmrural
non-farm urban
Rural, nonrural, urban
Total
Chi-Square Tests
15.746a 2 .000
15.762 2 .000
15.485 1 .000
703
Asymp. Sig.Value df (2-sided)
Pearson Chi-Square Likelihood Ratio Linear-by-Linear Association N of Valid Cases
0 cells (.0%) have expected count less than 5.The minimum expected count is 58.04.
a.
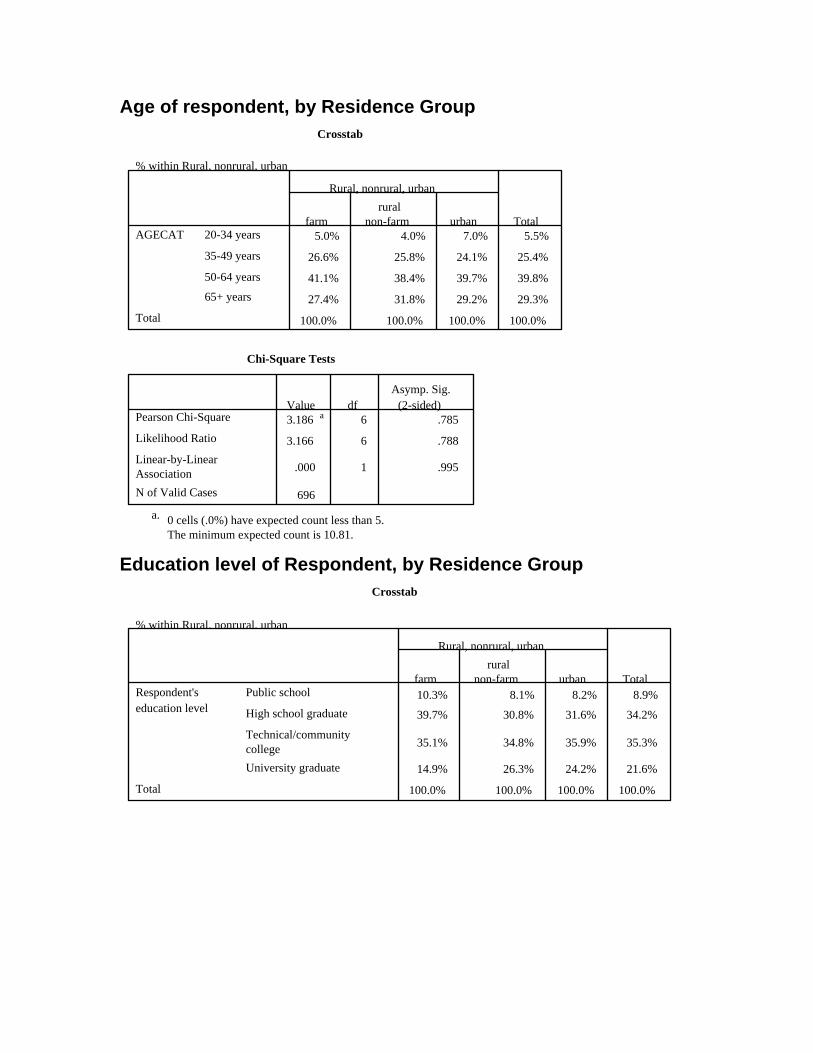
Age of respondent, by Residence Group Crosstab
% within Rural, nonrural, urban
5.0% 4.0% 7.0% 5.5%
26.6% 25.8% 24.1% 25.4%
41.1% 38.4% 39.7% 39.8%
27.4% 31.8% 29.2% 29.3%
100.0% 100.0% 100.0% 100.0%
20-34 years
35-49 years
50-64 years
65+ years
AGECAT
Total
farmrural
non-farm urban
Rural, nonrural, urban
Total
Chi-Square Tests
3.186 a 6 .785
3.166 6 .788
.000 1 .995
696
Pearson Chi-Square
Likelihood Ratio
Linear-by-LinearAssociationN of Valid Cases
Value dfAsymp. Sig.
(2-sided)
0 cells (.0%) have expected count less than 5.The minimum expected count is 10.81.
a.
Education level of Respondent, by Residence Group
Crosstab
% within Rural, nonrural, urban
10.3% 8.1% 8.2% 8.9%
39.7% 30.8% 31.6% 34.2%
35.1% 34.8% 35.9% 35.3%
14.9% 26.3% 24.2% 21.6%
100.0% 100.0% 100.0% 100.0%
Public school
High school graduate
Technical/communitycollegeUniversity graduate
Respondent'seducation level
Total
farmrural
non-farm urban
Rural, nonrural, urban
Total
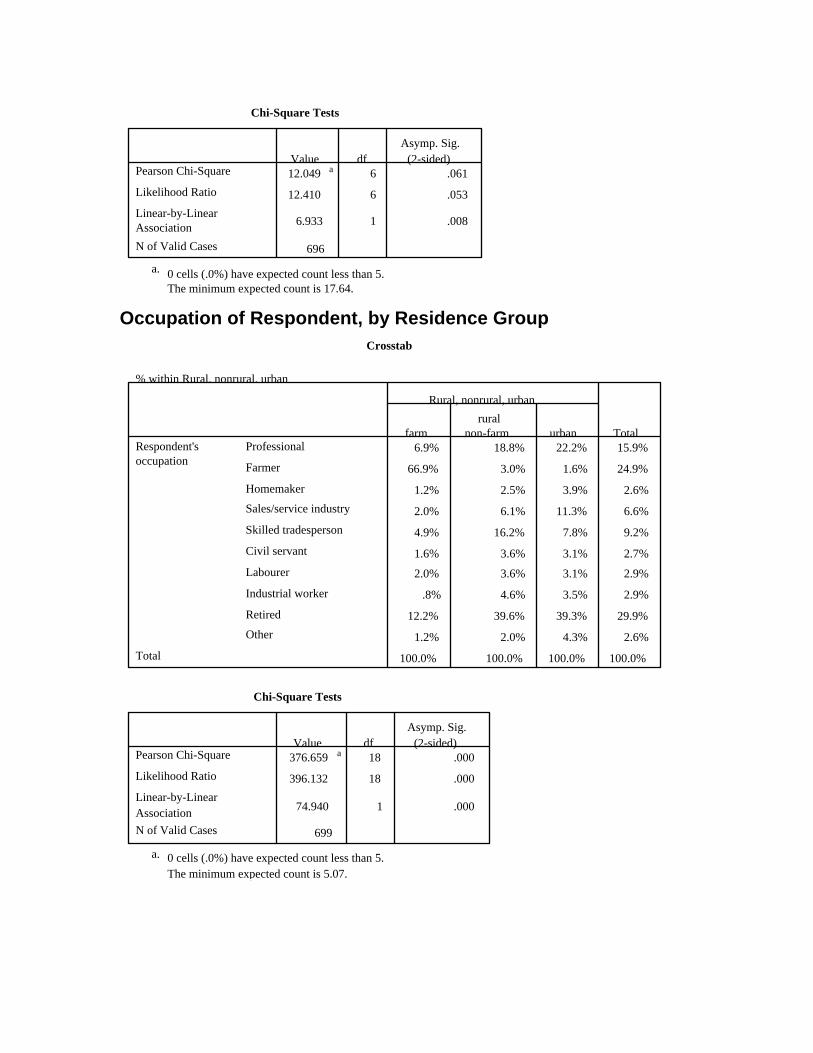
Chi-Square Tests
12.049 a 6 .061
12.410 6 .053
6.933 1 .008
696
Pearson Chi-Square
Likelihood Ratio
Linear-by-LinearAssociationN of Valid Cases
Value dfAsymp. Sig.
(2-sided)
0 cells (.0%) have expected count less than 5.The minimum expected count is 17.64.
a.
Occupation of Respondent, by Residence Group
Crosstab
% within Rural, nonrural, urban
6.9% 18.8% 22.2% 15.9%
66.9% 3.0% 1.6% 24.9%
1.2% 2.5% 3.9% 2.6%
2.0% 6.1% 11.3% 6.6%
4.9% 16.2% 7.8% 9.2%
1.6% 3.6% 3.1% 2.7%
2.0% 3.6% 3.1% 2.9%
.8% 4.6% 3.5% 2.9%
12.2% 39.6% 39.3% 29.9%
1.2% 2.0% 4.3% 2.6%
100.0% 100.0% 100.0% 100.0%
Professional
Farmer
Homemaker
Sales/service industry
Skilled tradesperson
Civil servant
Labourer
Industrial worker
Retired
Other
Respondent'soccupation
Total
farmrural
non-farm urban
Rural, nonrural, urban
Total
Chi-Square Tests
376.659 a 18 .000
396.132 18 .000
74.940 1 .000
699
Pearson Chi-Square
Likelihood Ratio
Linear-by-LinearAssociationN of Valid Cases
Value dfAsymp. Sig.
(2-sided)
0 cells (.0%) have expected count less than 5.The minimum expected count is 5.07.
a.
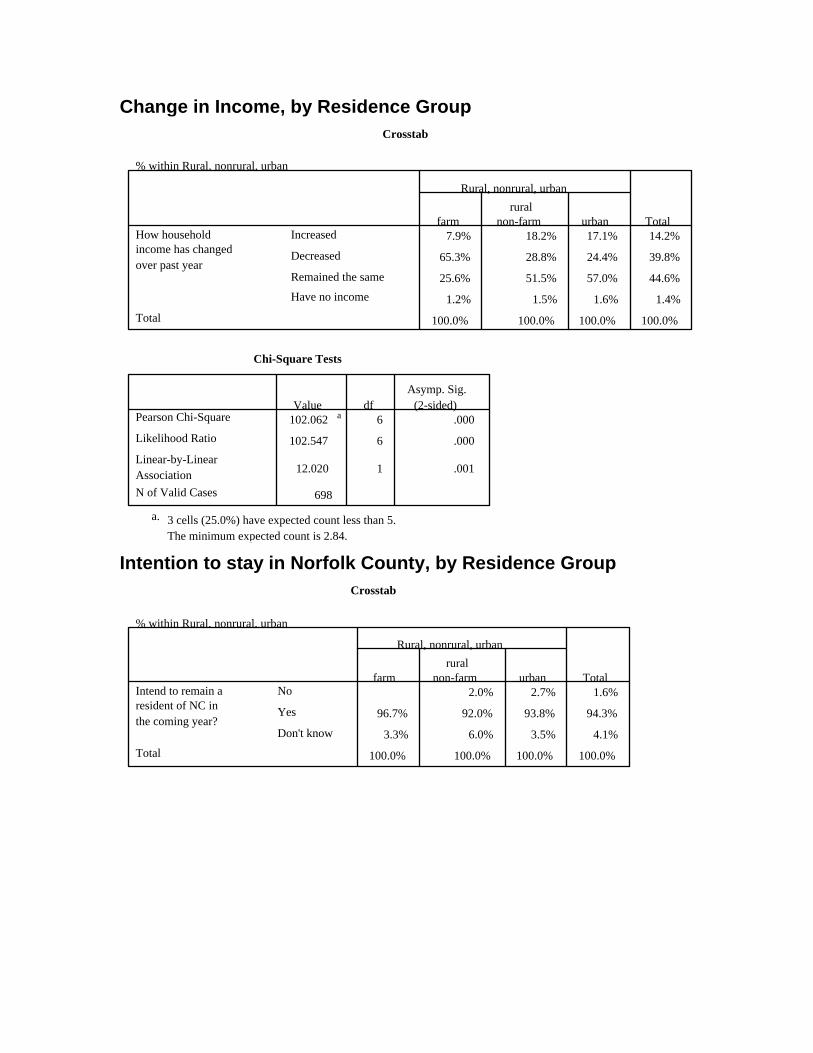
Change in Income, by Residence Group Crosstab
% within Rural, nonrural, urban
7.9% 18.2% 17.1% 14.2%
65.3% 28.8% 24.4% 39.8%
25.6% 51.5% 57.0% 44.6%
1.2% 1.5% 1.6% 1.4%
100.0% 100.0% 100.0% 100.0%
Increased
Decreased
Remained the same
Have no income
How householdincome has changedover past year
Total
farmrural
non-farm urban
Rural, nonrural, urban
Total
Chi-Square Tests
102.062 a 6 .000
102.547 6 .000
12.020 1 .001
698
Pearson Chi-Square
Likelihood Ratio
Linear-by-LinearAssociationN of Valid Cases
Value dfAsymp. Sig.
(2-sided)
3 cells (25.0%) have expected count less than 5.The minimum expected count is 2.84.
a.
Intention to stay in Norfolk County, by Residence Group
Crosstab
% within Rural, nonrural, urban
2.0% 2.7% 1.6%
96.7% 92.0% 93.8% 94.3%
3.3% 6.0% 3.5% 4.1%
100.0% 100.0% 100.0% 100.0%
No
Yes
Don't know
Intend to remain aresident of NC inthe coming year?
Total
farmrural
non-farm urban
Rural, nonrural, urban
Total
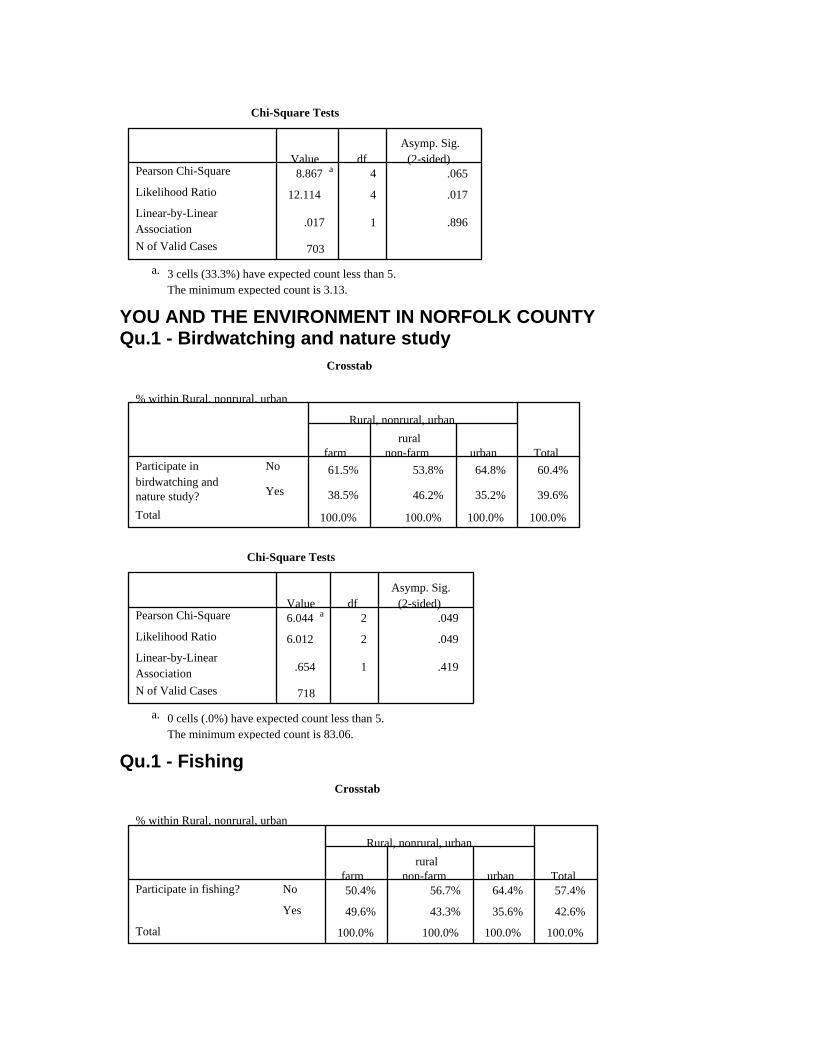
Chi-Square Tests
8.867 a 4 .065
12.114 4 .017
.017 1 .896
703
Pearson Chi-Square
Likelihood Ratio
Linear-by-LinearAssociationN of Valid Cases
Value dfAsymp. Sig.
(2-sided)
3 cells (33.3%) have expected count less than 5.The minimum expected count is 3.13.
a.
YOU AND THE ENVIRONMENT IN NORFOLK COUNTY Qu.1 - Birdwatching and nature study
Crosstab
% within Rural, nonrural, urban
61.5% 53.8% 64.8% 60.4%
38.5% 46.2% 35.2% 39.6%
100.0% 100.0% 100.0% 100.0%
No
Yes
Participate inbirdwatching andnature study?Total
farmrural
non-farm urban
Rural, nonrural, urban
Total
Chi-Square Tests
6.044 a 2 .049
6.012 2 .049
.654 1 .419
718
Pearson Chi-Square
Likelihood Ratio
Linear-by-LinearAssociationN of Valid Cases
Value dfAsymp. Sig.
(2-sided)
0 cells (.0%) have expected count less than 5.The minimum expected count is 83.06.
a.
Qu.1 - Fishing
Crosstab
% within Rural, nonrural, urban
50.4% 56.7% 64.4% 57.4%
49.6% 43.3% 35.6% 42.6%
100.0% 100.0% 100.0% 100.0%
No
Yes
Participate in fishing?
Total
farmrural
non-farm urban
Rural, nonrural, urban
Total
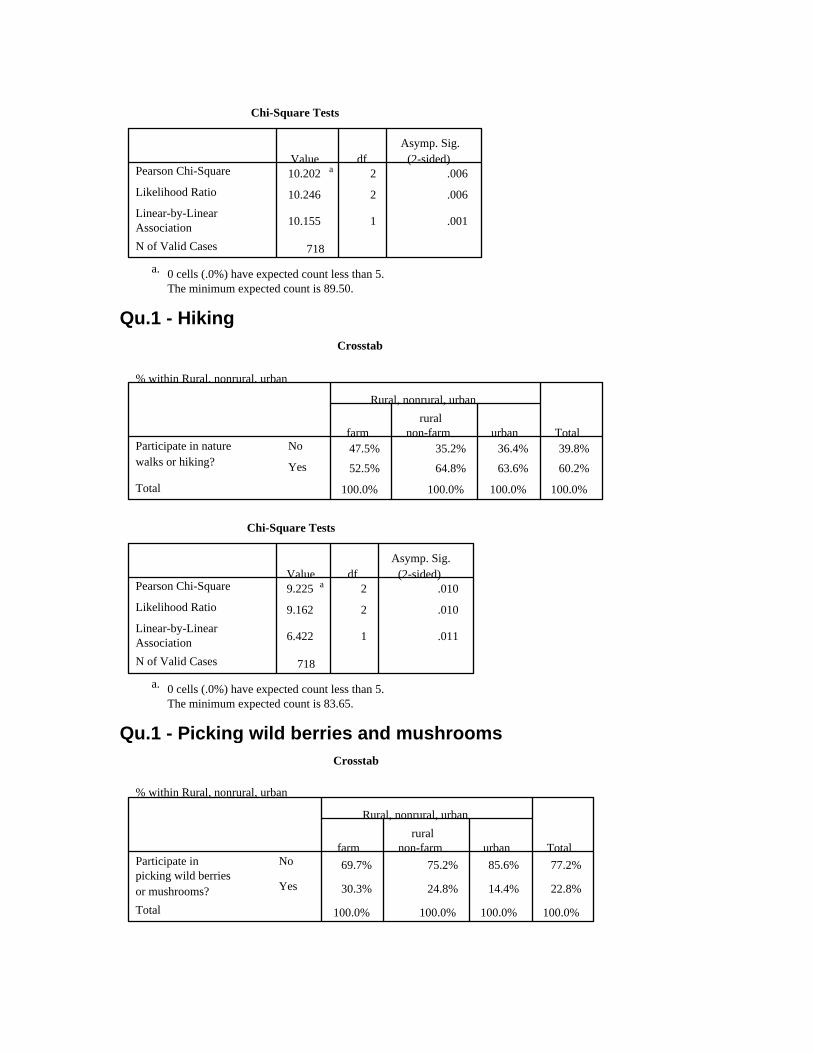
Chi-Square Tests
10.202 a 2 .006
10.246 2 .006
10.155 1 .001
718
Pearson Chi-Square
Likelihood Ratio
Linear-by-LinearAssociationN of Valid Cases
Value dfAsymp. Sig.
(2-sided)
0 cells (.0%) have expected count less than 5.The minimum expected count is 89.50.
a.
Qu.1 - Hiking
Crosstab
% within Rural, nonrural, urban
47.5% 35.2% 36.4% 39.8%
52.5% 64.8% 63.6% 60.2%
100.0% 100.0% 100.0% 100.0%
No
Yes
Participate in naturewalks or hiking?
Total
farmrural
non-farm urban
Rural, nonrural, urban
Total
Chi-Square Tests
9.225 a 2 .010
9.162 2 .010
6.422 1 .011
718
Pearson Chi-Square
Likelihood Ratio
Linear-by-LinearAssociationN of Valid Cases
Value dfAsymp. Sig.
(2-sided)
0 cells (.0%) have expected count less than 5.The minimum expected count is 83.65.
a.
Qu.1 - Picking wild berries and mushrooms
Crosstab
% within Rural, nonrural, urban
69.7% 75.2% 85.6% 77.2%
30.3% 24.8% 14.4% 22.8%
100.0% 100.0% 100.0% 100.0%
No
Yes
Participate inpicking wild berriesor mushrooms?Total
farmrural
non-farm urban
Rural, nonrural, urban
Total
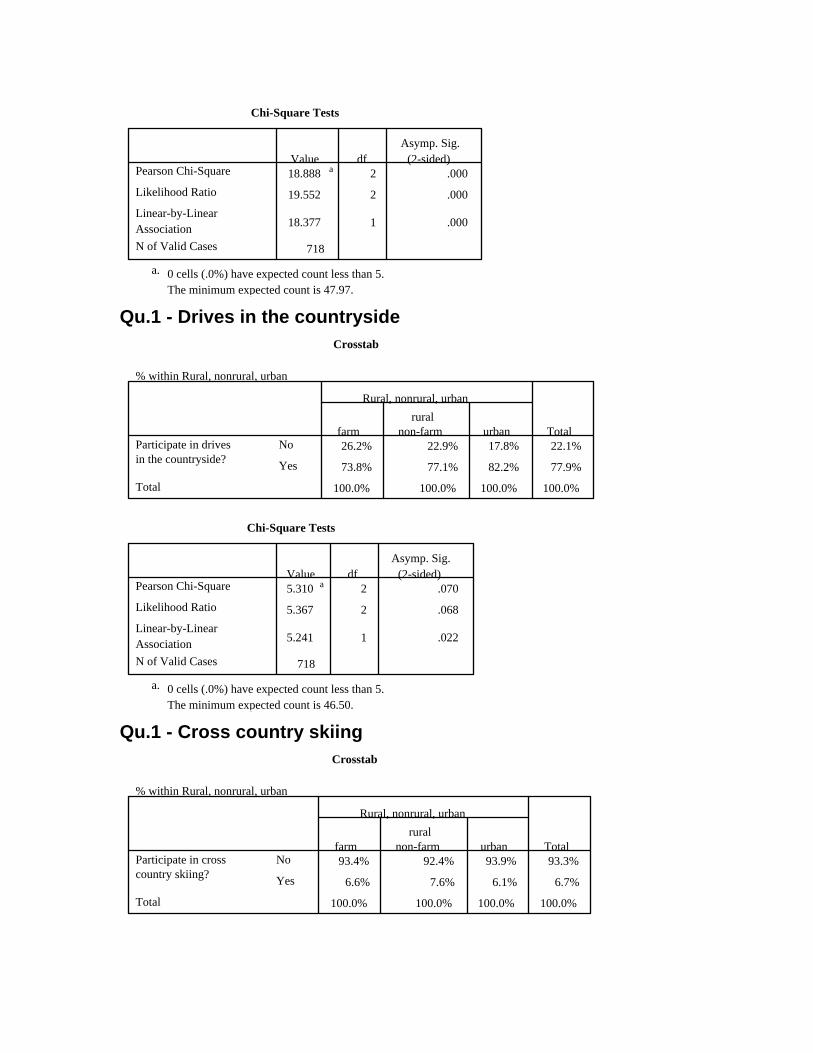
Chi-Square Tests
18.888 a 2 .000
19.552 2 .000
18.377 1 .000
718
Pearson Chi-Square
Likelihood Ratio
Linear-by-LinearAssociationN of Valid Cases
Value dfAsymp. Sig.
(2-sided)
0 cells (.0%) have expected count less than 5.The minimum expected count is 47.97.
a.
Qu.1 - Drives in the countryside
Crosstab
% within Rural, nonrural, urban
26.2% 22.9% 17.8% 22.1%
73.8% 77.1% 82.2% 77.9%
100.0% 100.0% 100.0% 100.0%
No
Yes
Participate in drivesin the countryside?
Total
farmrural
non-farm urban
Rural, nonrural, urban
Total
Chi-Square Tests
5.310 a 2 .070
5.367 2 .068
5.241 1 .022
718
Pearson Chi-Square
Likelihood Ratio
Linear-by-LinearAssociationN of Valid Cases
Value dfAsymp. Sig.
(2-sided)
0 cells (.0%) have expected count less than 5.The minimum expected count is 46.50.
a.
Qu.1 - Cross country skiing
Crosstab
% within Rural, nonrural, urban
93.4% 92.4% 93.9% 93.3%
6.6% 7.6% 6.1% 6.7%
100.0% 100.0% 100.0% 100.0%
No
Yes
Participate in crosscountry skiing?
Total
farmrural
non-farm urban
Rural, nonrural, urban
Total
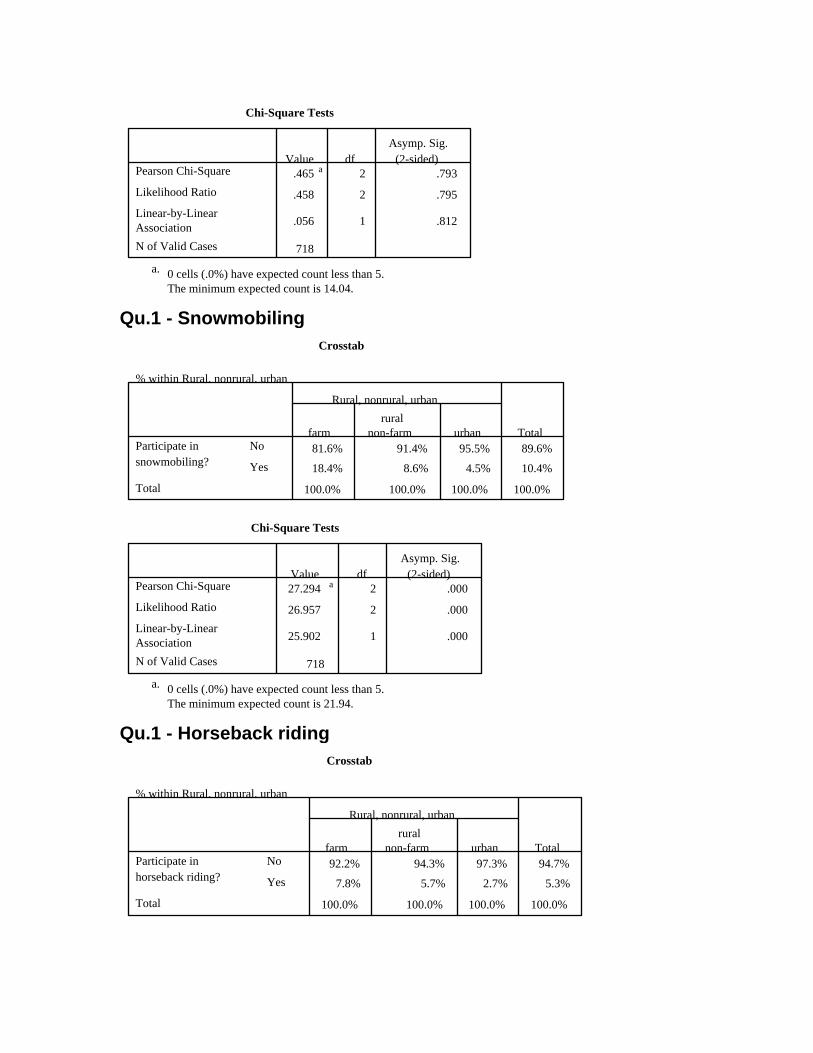
Chi-Square Tests
.465 a 2 .793
.458 2 .795
.056 1 .812
718
Pearson Chi-Square
Likelihood Ratio
Linear-by-LinearAssociationN of Valid Cases
Value dfAsymp. Sig.
(2-sided)
0 cells (.0%) have expected count less than 5.The minimum expected count is 14.04.
a.
Qu.1 - Snowmobiling
Crosstab
% within Rural, nonrural, urban
81.6% 91.4% 95.5% 89.6%
18.4% 8.6% 4.5% 10.4%
100.0% 100.0% 100.0% 100.0%
No
Yes
Participate insnowmobiling?
Total
farmrural
non-farm urban
Rural, nonrural, urban
Total
Chi-Square Tests
27.294 a 2 .000
26.957 2 .000
25.902 1 .000
718
Pearson Chi-Square
Likelihood Ratio
Linear-by-LinearAssociationN of Valid Cases
Value dfAsymp. Sig.
(2-sided)
0 cells (.0%) have expected count less than 5.The minimum expected count is 21.94.
a.
Qu.1 - Horseback riding
Crosstab
% within Rural, nonrural, urban
92.2% 94.3% 97.3% 94.7%
7.8% 5.7% 2.7% 5.3%
100.0% 100.0% 100.0% 100.0%
No
Yes
Participate inhorseback riding?
Total
farmrural
non-farm urban
Rural, nonrural, urban
Total
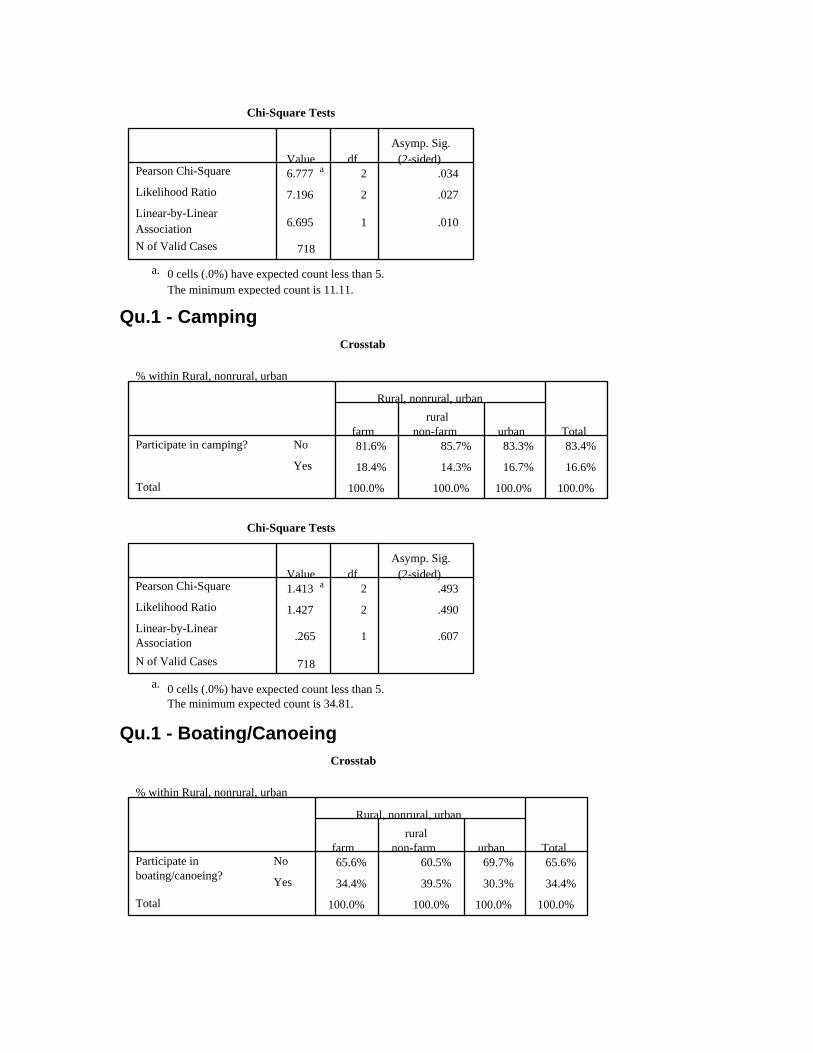
Chi-Square Tests
6.777 a 2 .034
7.196 2 .027
6.695 1 .010
718
Pearson Chi-Square
Likelihood Ratio
Linear-by-LinearAssociationN of Valid Cases
Value dfAsymp. Sig.
(2-sided)
0 cells (.0%) have expected count less than 5.The minimum expected count is 11.11.
a.
Qu.1 - Camping
Crosstab
% within Rural, nonrural, urban
81.6% 85.7% 83.3% 83.4%
18.4% 14.3% 16.7% 16.6%
100.0% 100.0% 100.0% 100.0%
No
Yes
Participate in camping?
Total
farmrural
non-farm urban
Rural, nonrural, urban
Total
Chi-Square Tests
1.413 a 2 .493
1.427 2 .490
.265 1 .607
718
Pearson Chi-Square
Likelihood Ratio
Linear-by-LinearAssociationN of Valid Cases
Value dfAsymp. Sig.
(2-sided)
0 cells (.0%) have expected count less than 5.The minimum expected count is 34.81.
a.
Qu.1 - Boating/Canoeing
Crosstab
% within Rural, nonrural, urban
65.6% 60.5% 69.7% 65.6%
34.4% 39.5% 30.3% 34.4%
100.0% 100.0% 100.0% 100.0%
No
Yes
Participate inboating/canoeing?
Total
farmrural
non-farm urban
Rural, nonrural, urban
Total
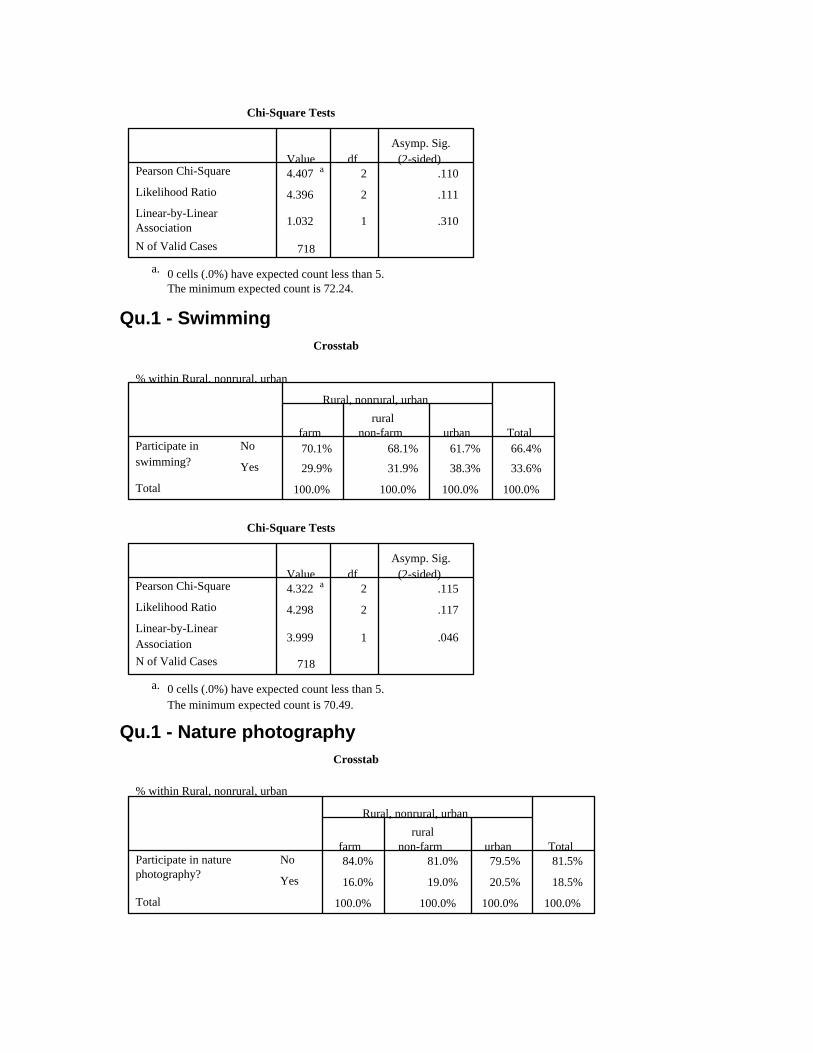
Chi-Square Tests
4.407 a 2 .110
4.396 2 .111
1.032 1 .310
718
Pearson Chi-Square
Likelihood Ratio
Linear-by-LinearAssociationN of Valid Cases
Value dfAsymp. Sig.
(2-sided)
0 cells (.0%) have expected count less than 5.The minimum expected count is 72.24.
a.
Qu.1 - Swimming
Crosstab
% within Rural, nonrural, urban
70.1% 68.1% 61.7% 66.4%
29.9% 31.9% 38.3% 33.6%
100.0% 100.0% 100.0% 100.0%
No
Yes
Participate inswimming?
Total
farmrural
non-farm urban
Rural, nonrural, urban
Total
Chi-Square Tests
4.322 a 2 .115
4.298 2 .117
3.999 1 .046
718
Pearson Chi-Square
Likelihood Ratio
Linear-by-LinearAssociationN of Valid Cases
Value dfAsymp. Sig.
(2-sided)
0 cells (.0%) have expected count less than 5.The minimum expected count is 70.49.
a.
Qu.1 - Nature photography
Crosstab
% within Rural, nonrural, urban
84.0% 81.0% 79.5% 81.5%
16.0% 19.0% 20.5% 18.5%
100.0% 100.0% 100.0% 100.0%
No
Yes
Participate in naturephotography?
Total
farmrural
non-farm urban
Rural, nonrural, urban
Total
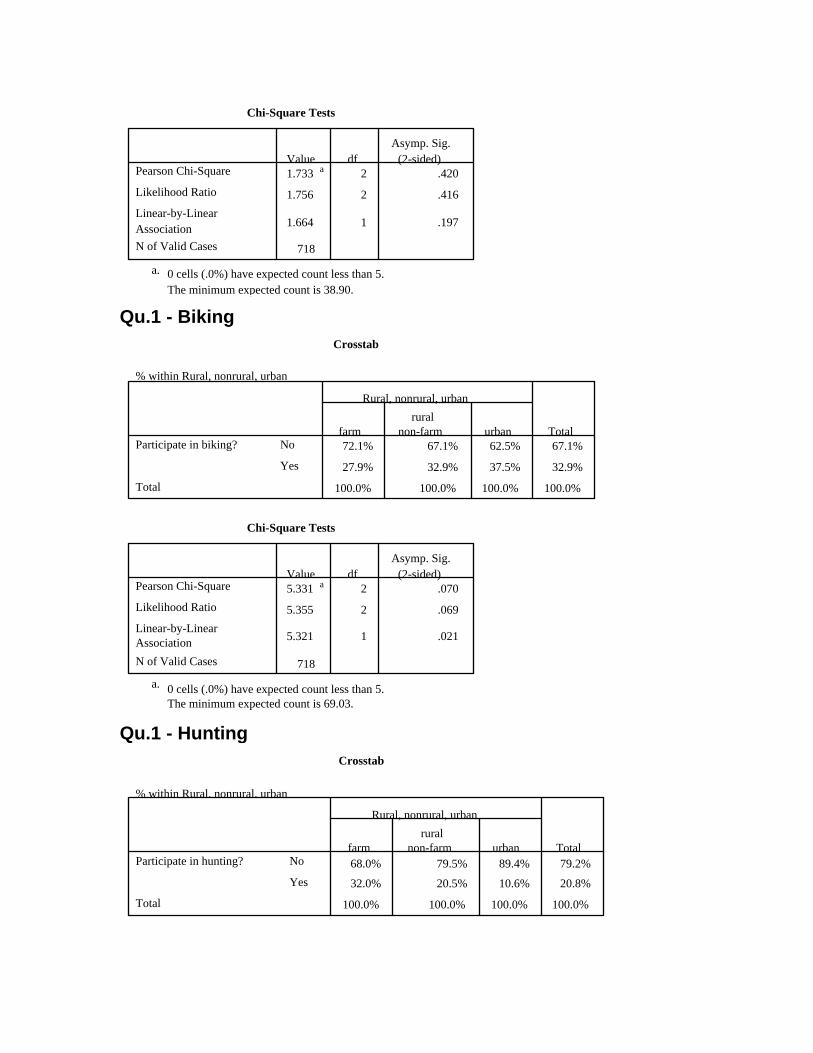
Chi-Square Tests
1.733 a 2 .420
1.756 2 .416
1.664 1 .197
718
Pearson Chi-Square
Likelihood Ratio
Linear-by-LinearAssociationN of Valid Cases
Value dfAsymp. Sig.
(2-sided)
0 cells (.0%) have expected count less than 5.The minimum expected count is 38.90.
a.
Qu.1 - Biking
Crosstab
% within Rural, nonrural, urban
72.1% 67.1% 62.5% 67.1%
27.9% 32.9% 37.5% 32.9%
100.0% 100.0% 100.0% 100.0%
No
Yes
Participate in biking?
Total
farmrural
non-farm urban
Rural, nonrural, urban
Total
Chi-Square Tests
5.331 a 2 .070
5.355 2 .069
5.321 1 .021
718
Pearson Chi-Square
Likelihood Ratio
Linear-by-LinearAssociationN of Valid Cases
Value dfAsymp. Sig.
(2-sided)
0 cells (.0%) have expected count less than 5.The minimum expected count is 69.03.
a.
Qu.1 - Hunting
Crosstab
% within Rural, nonrural, urban
68.0% 79.5% 89.4% 79.2%
32.0% 20.5% 10.6% 20.8%
100.0% 100.0% 100.0% 100.0%
No
Yes
Participate in hunting?
Total
farmrural
non-farm urban
Rural, nonrural, urban
Total
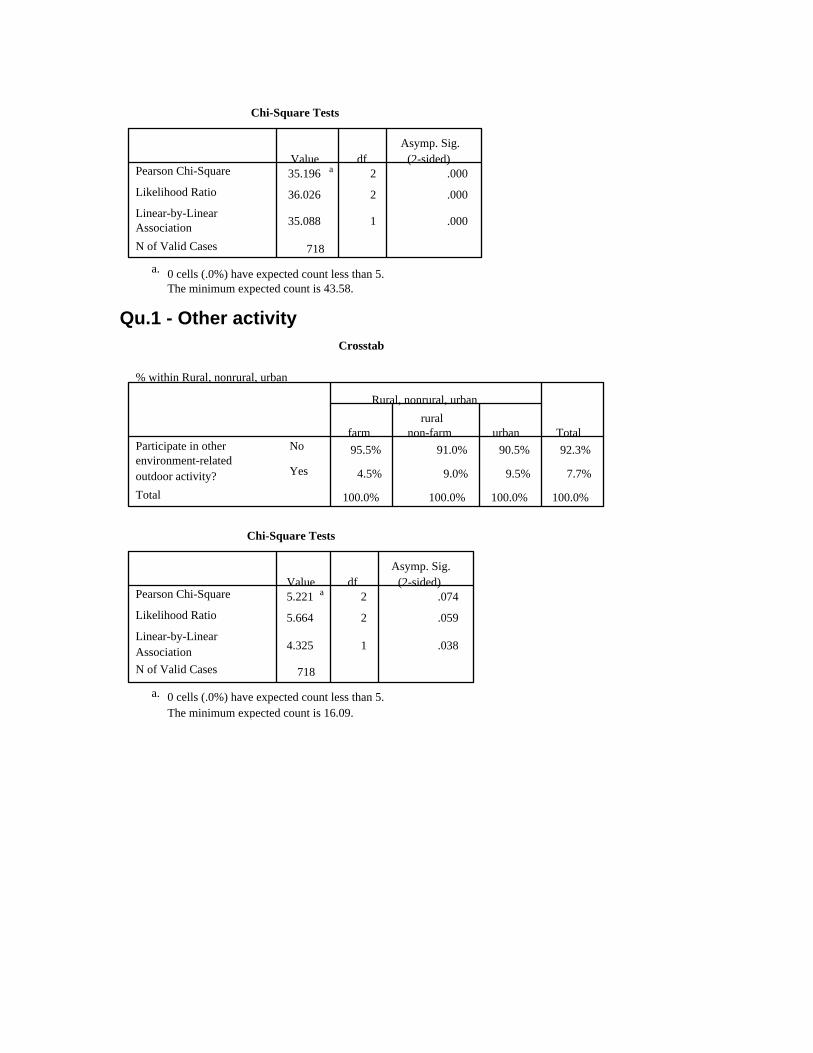
Chi-Square Tests
35.196 a 2 .000
36.026 2 .000
35.088 1 .000
718
Pearson Chi-Square
Likelihood Ratio
Linear-by-LinearAssociationN of Valid Cases
Value dfAsymp. Sig.
(2-sided)
0 cells (.0%) have expected count less than 5.The minimum expected count is 43.58.
a.
Qu.1 - Other activity
Crosstab
% within Rural, nonrural, urban
95.5% 91.0% 90.5% 92.3%
4.5% 9.0% 9.5% 7.7%
100.0% 100.0% 100.0% 100.0%
No
Yes
Participate in otherenvironment-relatedoutdoor activity?Total
farmrural
non-farm urban
Rural, nonrural, urban
Total
Chi-Square Tests
5.221 a 2 .074
5.664 2 .059
4.325 1 .038
718
Pearson Chi-Square
Likelihood Ratio
Linear-by-LinearAssociationN of Valid Cases
Value dfAsymp. Sig.
(2-sided)
0 cells (.0%) have expected count less than 5.The minimum expected count is 16.09.
a.
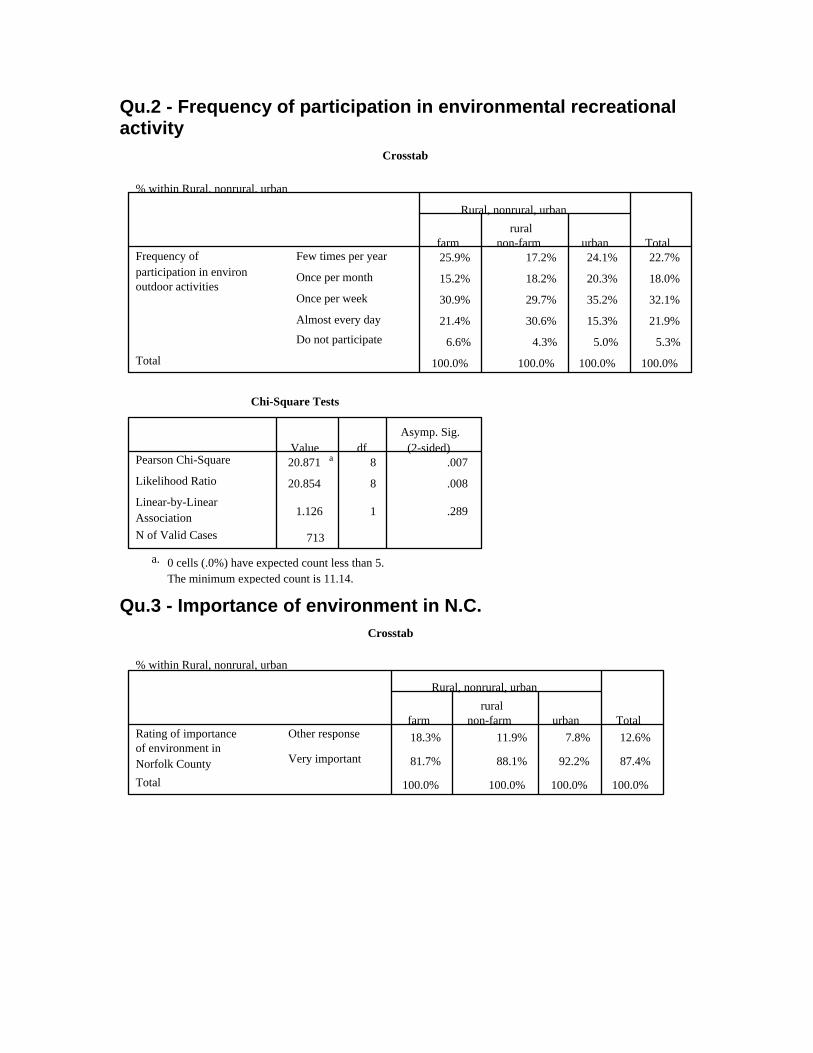
Qu.2 - Frequency of participation in environmental recreational activity
Crosstab
% within Rural, nonrural, urban
25.9% 17.2% 24.1% 22.7%
15.2% 18.2% 20.3% 18.0%
30.9% 29.7% 35.2% 32.1%
21.4% 30.6% 15.3% 21.9%
6.6% 4.3% 5.0% 5.3%
100.0% 100.0% 100.0% 100.0%
Few times per year
Once per month
Once per week
Almost every day
Do not participate
Frequency ofparticipation in environoutdoor activities
Total
farmrural
non-farm urban
Rural, nonrural, urban
Total
Chi-Square Tests
20.871 a 8 .007
20.854 8 .008
1.126 1 .289
713
Pearson Chi-Square
Likelihood Ratio
Linear-by-LinearAssociationN of Valid Cases
Value dfAsymp. Sig.
(2-sided)
0 cells (.0%) have expected count less than 5.The minimum expected count is 11.14.
a.
Qu.3 - Importance of environment in N.C.
Crosstab
% within Rural, nonrural, urban
18.3% 11.9% 7.8% 12.6%
81.7% 88.1% 92.2% 87.4%
100.0% 100.0% 100.0% 100.0%
Other response
Very important
Rating of importanceof environment inNorfolk CountyTotal
farmrural
non-farm urban
Rural, nonrural, urban
Total
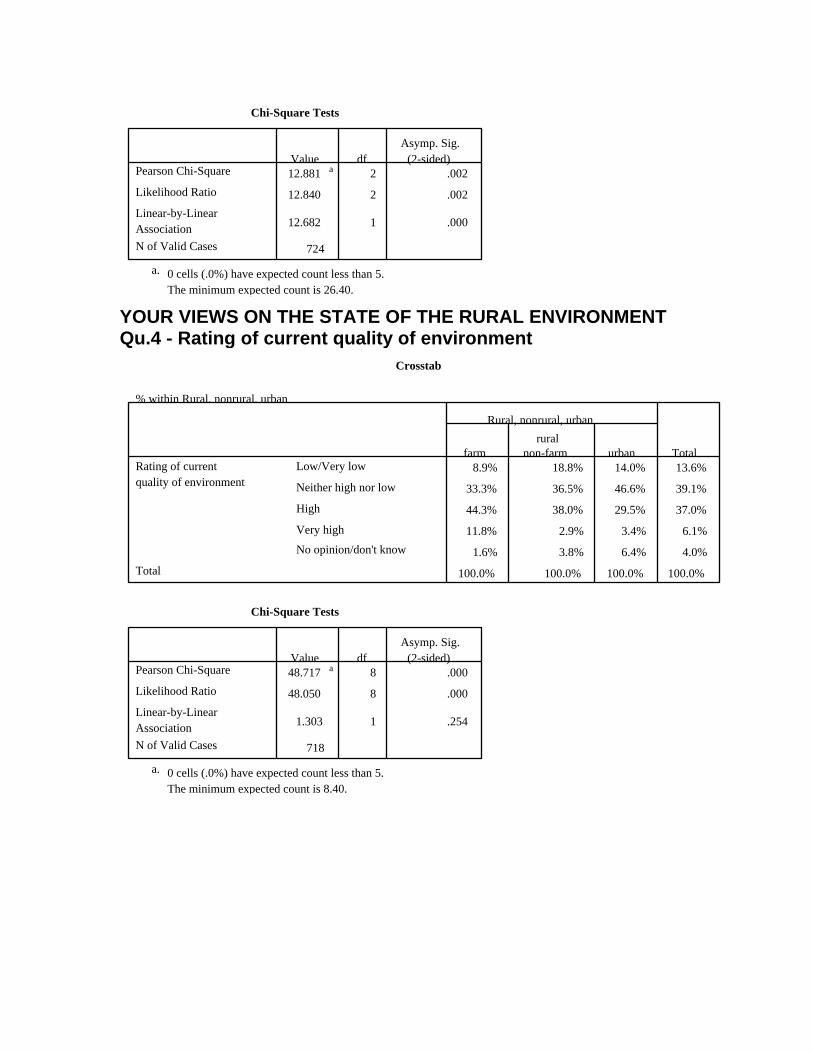
Chi-Square Tests
12.881 a 2 .002
12.840 2 .002
12.682 1 .000
724
Pearson Chi-Square
Likelihood Ratio
Linear-by-LinearAssociationN of Valid Cases
Value dfAsymp. Sig.
(2-sided)
0 cells (.0%) have expected count less than 5.The minimum expected count is 26.40.
a.
YOUR VIEWS ON THE STATE OF THE RURAL ENVIRONMENT Qu.4 - Rating of current quality of environment
Crosstab
% within Rural, nonrural, urban
8.9% 18.8% 14.0% 13.6%
33.3% 36.5% 46.6% 39.1%
44.3% 38.0% 29.5% 37.0%
11.8% 2.9% 3.4% 6.1%
1.6% 3.8% 6.4% 4.0%
100.0% 100.0% 100.0% 100.0%
Low/Very low
Neither high nor low
High
Very high
No opinion/don't know
Rating of currentquality of environment
Total
farmrural
non-farm urban
Rural, nonrural, urban
Total
Chi-Square Tests
48.717 a 8 .000
48.050 8 .000
1.303 1 .254
718
Pearson Chi-Square
Likelihood Ratio
Linear-by-LinearAssociationN of Valid Cases
Value dfAsymp. Sig.
(2-sided)
0 cells (.0%) have expected count less than 5.The minimum expected count is 8.40.
a.
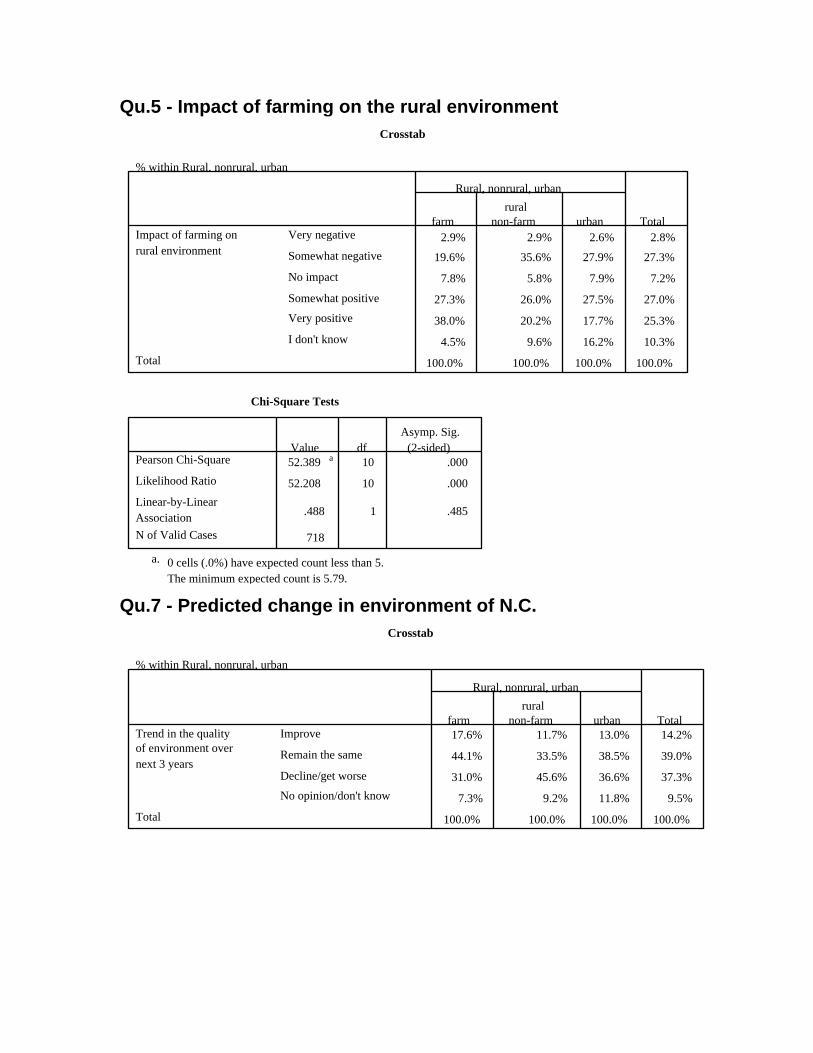
Qu.5 - Impact of farming on the rural environment Crosstab
% within Rural, nonrural, urban
2.9% 2.9% 2.6% 2.8%
19.6% 35.6% 27.9% 27.3%
7.8% 5.8% 7.9% 7.2%
27.3% 26.0% 27.5% 27.0%
38.0% 20.2% 17.7% 25.3%
4.5% 9.6% 16.2% 10.3%
100.0% 100.0% 100.0% 100.0%
Very negative
Somewhat negative
No impact
Somewhat positive
Very positive
I don't know
Impact of farming onrural environment
Total
farmrural
non-farm urban
Rural, nonrural, urban
Total
Chi-Square Tests
52.389 a 10 .000
52.208 10 .000
.488 1 .485
718
Pearson Chi-Square
Likelihood Ratio
Linear-by-LinearAssociationN of Valid Cases
Value dfAsymp. Sig.
(2-sided)
0 cells (.0%) have expected count less than 5.The minimum expected count is 5.79.
a.
Qu.7 - Predicted change in environment of N.C.
Crosstab
% within Rural, nonrural, urban
17.6% 11.7% 13.0% 14.2%
44.1% 33.5% 38.5% 39.0%
31.0% 45.6% 36.6% 37.3%
7.3% 9.2% 11.8% 9.5%
100.0% 100.0% 100.0% 100.0%
Improve
Remain the same
Decline/get worse
No opinion/don't know
Trend in the qualityof environment overnext 3 years
Total
farmrural
non-farm urban
Rural, nonrural, urban
Total
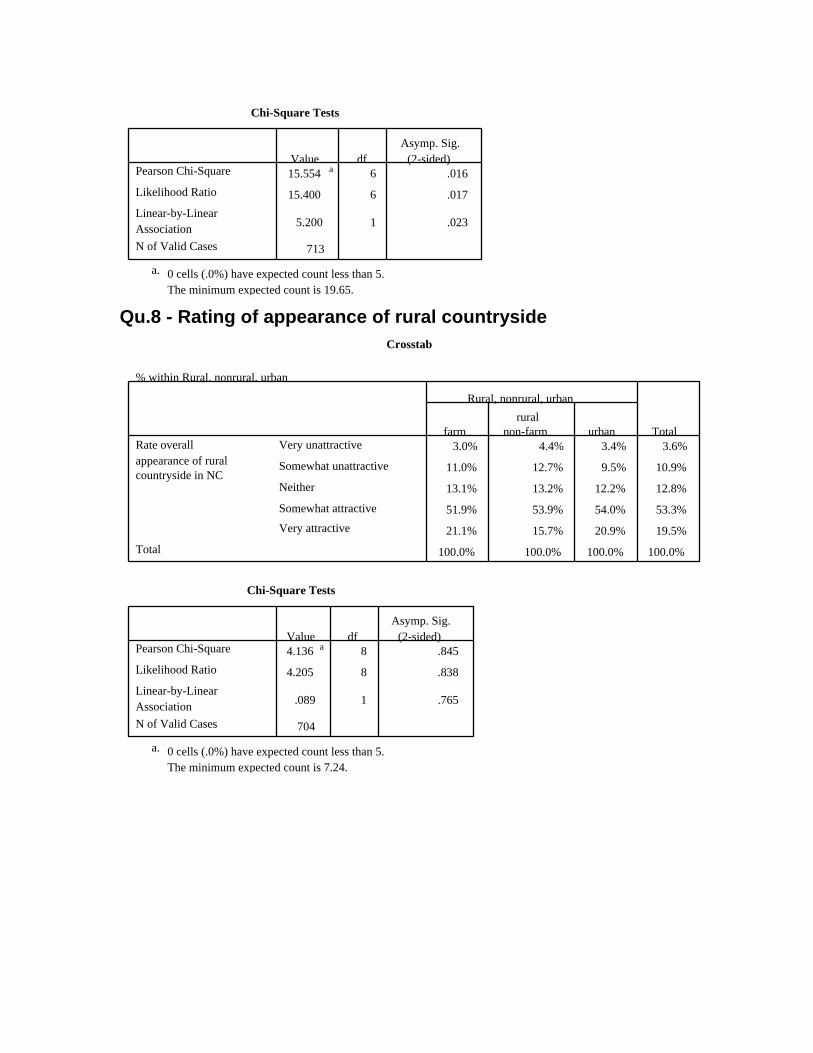
Chi-Square Tests
15.554 a 6 .016
15.400 6 .017
5.200 1 .023
713
Pearson Chi-Square
Likelihood Ratio
Linear-by-LinearAssociationN of Valid Cases
Value dfAsymp. Sig.
(2-sided)
0 cells (.0%) have expected count less than 5.The minimum expected count is 19.65.
a.
Qu.8 - Rating of appearance of rural countryside
Crosstab
% within Rural, nonrural, urban
3.0% 4.4% 3.4% 3.6%
11.0% 12.7% 9.5% 10.9%
13.1% 13.2% 12.2% 12.8%
51.9% 53.9% 54.0% 53.3%
21.1% 15.7% 20.9% 19.5%
100.0% 100.0% 100.0% 100.0%
Very unattractive
Somewhat unattractive
Neither
Somewhat attractive
Very attractive
Rate overallappearance of ruralcountryside in NC
Total
farmrural
non-farm urban
Rural, nonrural, urban
Total
Chi-Square Tests
4.136 a 8 .845
4.205 8 .838
.089 1 .765
704
Pearson Chi-Square
Likelihood Ratio
Linear-by-LinearAssociationN of Valid Cases
Value dfAsymp. Sig.
(2-sided)
0 cells (.0%) have expected count less than 5.The minimum expected count is 7.24.
a.
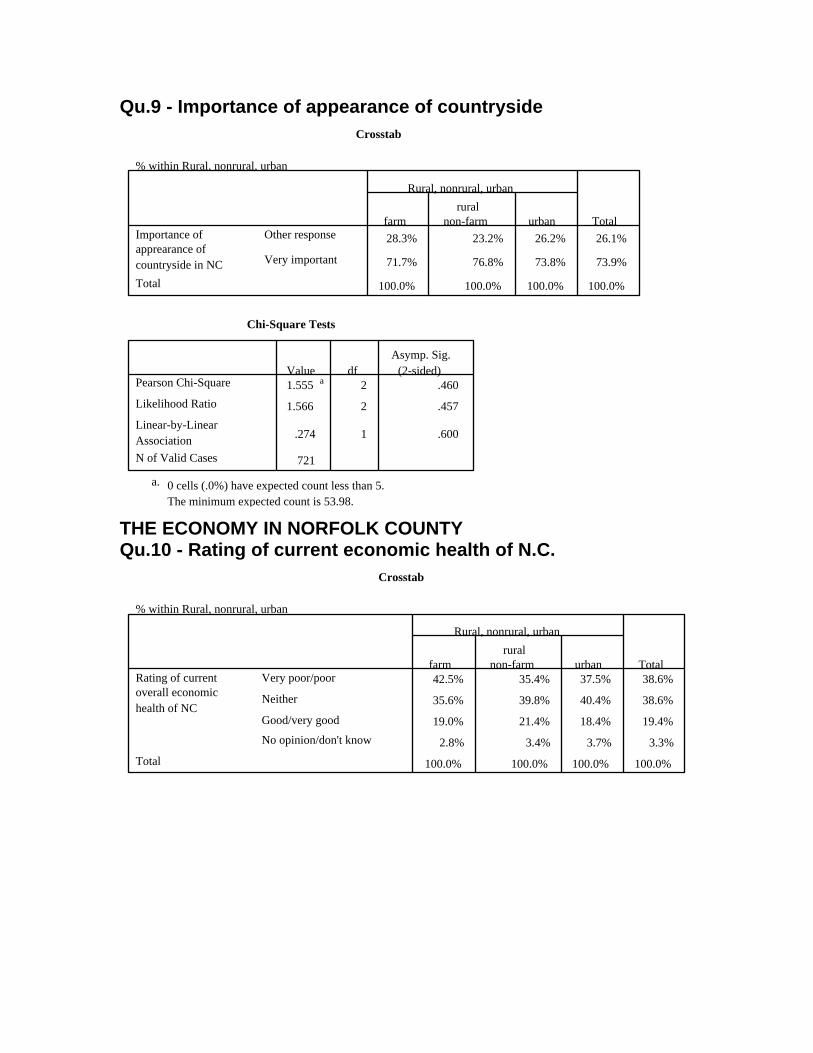
Qu.9 - Importance of appearance of countryside Crosstab
% within Rural, nonrural, urban
28.3% 23.2% 26.2% 26.1%
71.7% 76.8% 73.8% 73.9%
100.0% 100.0% 100.0% 100.0%
Other response
Very important
Importance ofapprearance ofcountryside in NCTotal
farmrural
non-farm urban
Rural, nonrural, urban
Total
Chi-Square Tests
1.555 a 2 .460
1.566 2 .457
.274 1 .600
721
Pearson Chi-Square
Likelihood Ratio
Linear-by-LinearAssociationN of Valid Cases
Value dfAsymp. Sig.
(2-sided)
0 cells (.0%) have expected count less than 5.The minimum expected count is 53.98.
a.
THE ECONOMY IN NORFOLK COUNTY Qu.10 - Rating of current economic health of N.C.
Crosstab
% within Rural, nonrural, urban
42.5% 35.4% 37.5% 38.6%
35.6% 39.8% 40.4% 38.6%
19.0% 21.4% 18.4% 19.4%
2.8% 3.4% 3.7% 3.3%
100.0% 100.0% 100.0% 100.0%
Very poor/poor
Neither
Good/very good
No opinion/don't know
Rating of currentoverall economichealth of NC
Total
farmrural
non-farm urban
Rural, nonrural, urban
Total
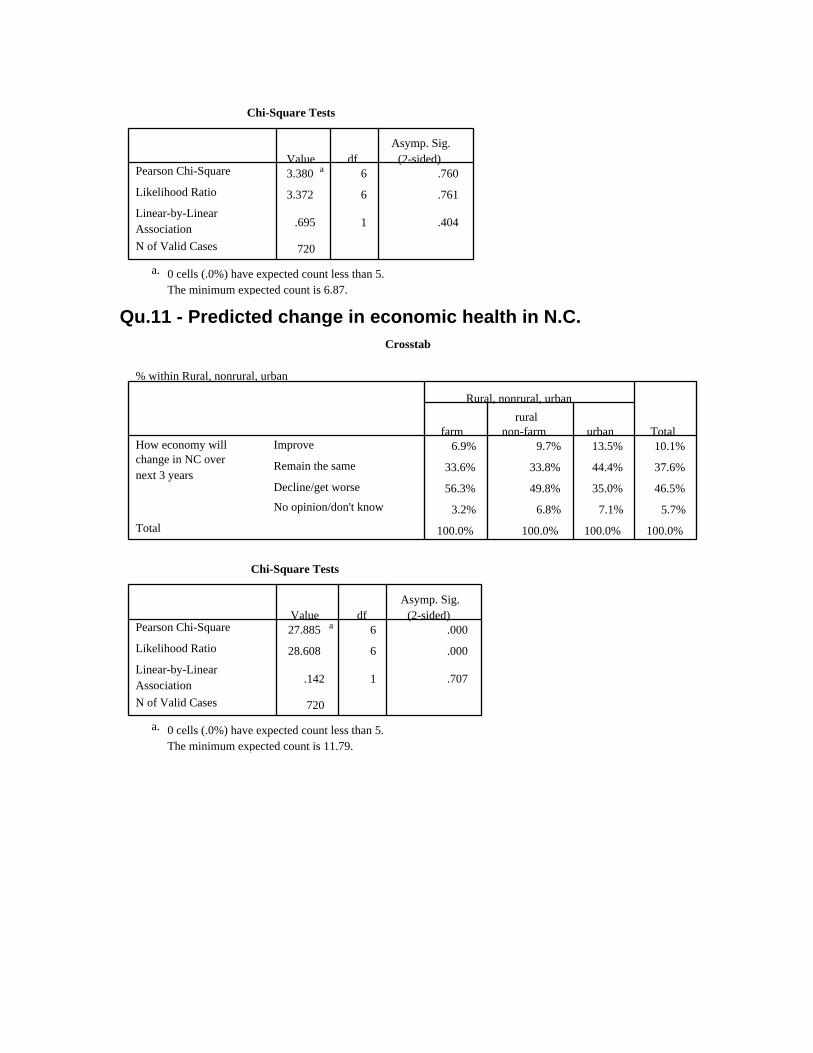
Chi-Square Tests
3.380 a 6 .760
3.372 6 .761
.695 1 .404
720
Pearson Chi-Square
Likelihood Ratio
Linear-by-LinearAssociationN of Valid Cases
Value dfAsymp. Sig.
(2-sided)
0 cells (.0%) have expected count less than 5.The minimum expected count is 6.87.
a.
Qu.11 - Predicted change in economic health in N.C.
Crosstab
% within Rural, nonrural, urban
6.9% 9.7% 13.5% 10.1%
33.6% 33.8% 44.4% 37.6%
56.3% 49.8% 35.0% 46.5%
3.2% 6.8% 7.1% 5.7%
100.0% 100.0% 100.0% 100.0%
Improve
Remain the same
Decline/get worse
No opinion/don't know
How economy willchange in NC overnext 3 years
Total
farmrural
non-farm urban
Rural, nonrural, urban
Total
Chi-Square Tests
27.885 a 6 .000
28.608 6 .000
.142 1 .707
720
Pearson Chi-Square
Likelihood Ratio
Linear-by-LinearAssociationN of Valid Cases
Value dfAsymp. Sig.
(2-sided)
0 cells (.0%) have expected count less than 5.The minimum expected count is 11.79.
a.
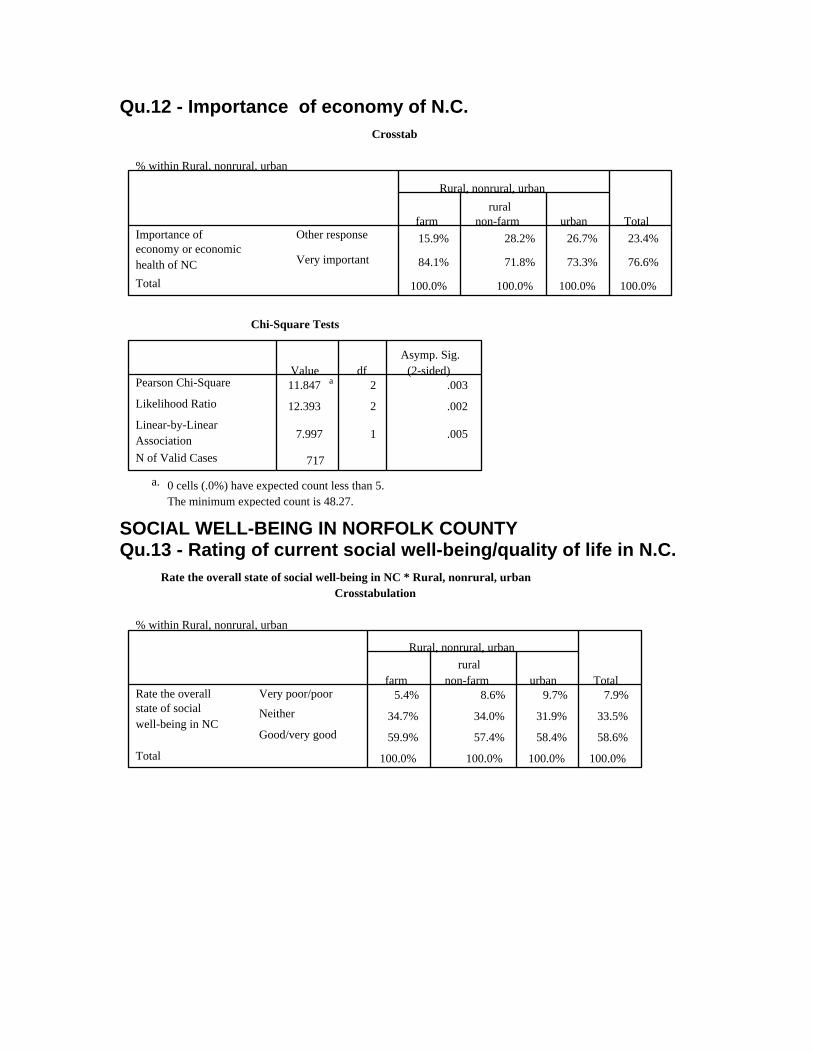
Qu.12 - Importance of economy of N.C. Crosstab
% within Rural, nonrural, urban
15.9% 28.2% 26.7% 23.4%
84.1% 71.8% 73.3% 76.6%
100.0% 100.0% 100.0% 100.0%
Other response
Very important
Importance ofeconomy or economichealth of NCTotal
farmrural
non-farm urban
Rural, nonrural, urban
Total
Chi-Square Tests
11.847 a 2 .003
12.393 2 .002
7.997 1 .005
717
Pearson Chi-Square
Likelihood Ratio
Linear-by-LinearAssociationN of Valid Cases
Value dfAsymp. Sig.
(2-sided)
0 cells (.0%) have expected count less than 5.The minimum expected count is 48.27.
a.
SOCIAL WELL-BEING IN NORFOLK COUNTY Qu.13 - Rating of current social well-being/quality of life in N.C.
Rate the overall state of social well-being in NC * Rural, nonrural, urbanCrosstabulation
% within Rural, nonrural, urban
5.4% 8.6% 9.7% 7.9%
34.7% 34.0% 31.9% 33.5%
59.9% 57.4% 58.4% 58.6%
100.0% 100.0% 100.0% 100.0%
Very poor/poor
Neither
Good/very good
Rate the overallstate of socialwell-being in NC
Total
farmrural
non-farm urban
Rural, nonrural, urban
Total
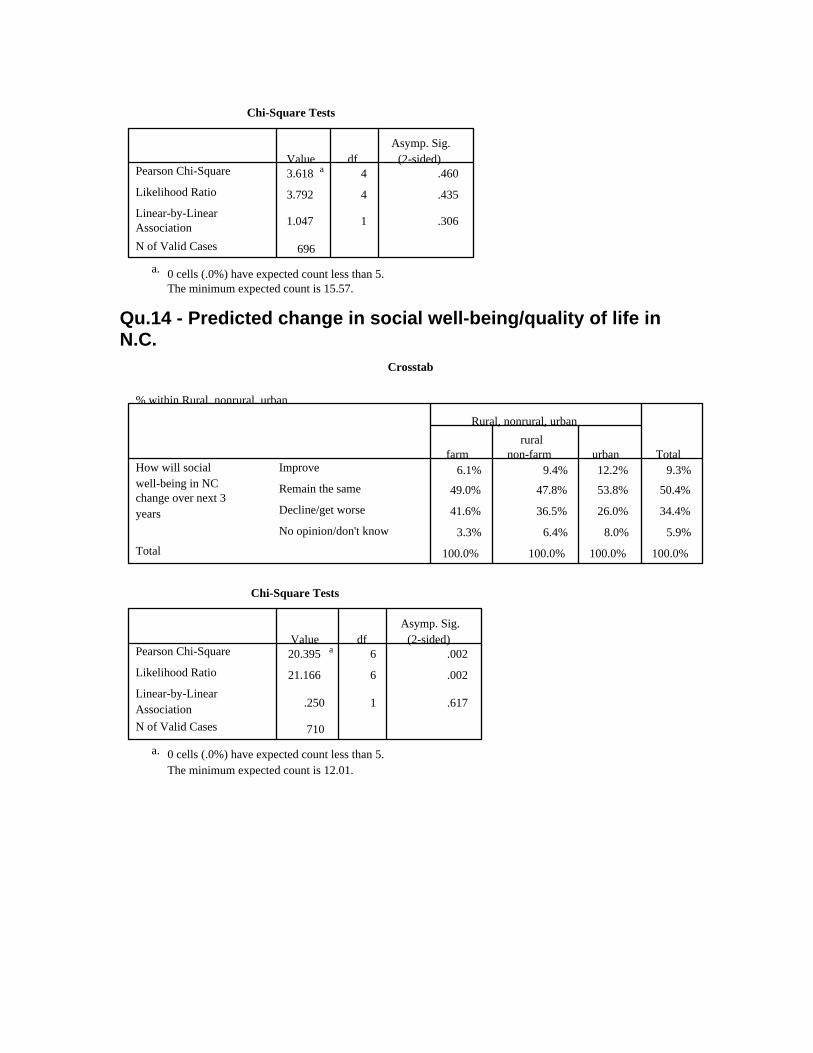
Chi-Square Tests
3.618 a 4 .460
3.792 4 .435
1.047 1 .306
696
Pearson Chi-Square
Likelihood Ratio
Linear-by-LinearAssociationN of Valid Cases
Value dfAsymp. Sig.
(2-sided)
0 cells (.0%) have expected count less than 5.The minimum expected count is 15.57.
a.
Qu.14 - Predicted change in social well-being/quality of life in N.C.
Crosstab
% within Rural, nonrural, urban
6.1% 9.4% 12.2% 9.3%
49.0% 47.8% 53.8% 50.4%
41.6% 36.5% 26.0% 34.4%
3.3% 6.4% 8.0% 5.9%
100.0% 100.0% 100.0% 100.0%
Improve
Remain the same
Decline/get worse
No opinion/don't know
How will socialwell-being in NCchange over next 3years
Total
farmrural
non-farm urban
Rural, nonrural, urban
Total
Chi-Square Tests
20.395 a 6 .002
21.166 6 .002
.250 1 .617
710
Pearson Chi-Square
Likelihood Ratio
Linear-by-LinearAssociationN of Valid Cases
Value dfAsymp. Sig.
(2-sided)
0 cells (.0%) have expected count less than 5.The minimum expected count is 12.01.
a.
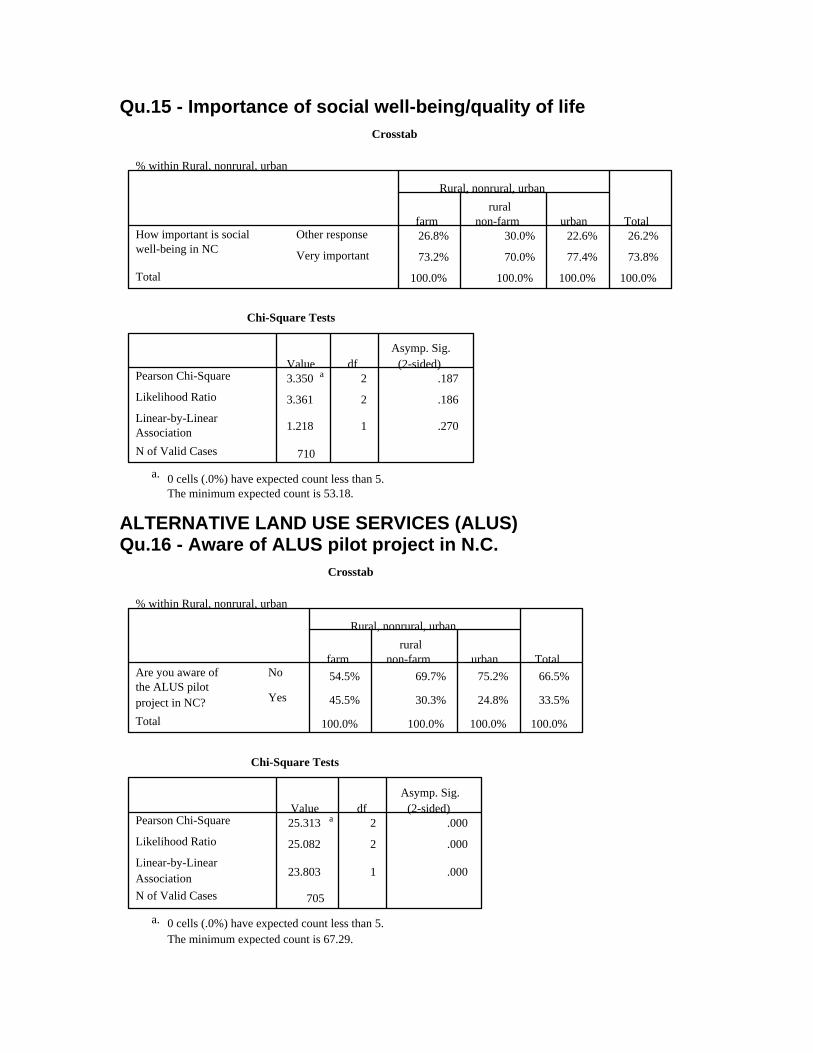
Qu.15 - Importance of social well-being/quality of life Crosstab
% within Rural, nonrural, urban
26.8% 30.0% 22.6% 26.2%
73.2% 70.0% 77.4% 73.8%
100.0% 100.0% 100.0% 100.0%
Other response
Very important
How important is socialwell-being in NC
Total
farmrural
non-farm urban
Rural, nonrural, urban
Total
Chi-Square Tests
3.350 a 2 .187
3.361 2 .186
1.218 1 .270
710
Pearson Chi-Square
Likelihood Ratio
Linear-by-LinearAssociationN of Valid Cases
Value dfAsymp. Sig.
(2-sided)
0 cells (.0%) have expected count less than 5.The minimum expected count is 53.18.
a.
ALTERNATIVE LAND USE SERVICES (ALUS) Qu.16 - Aware of ALUS pilot project in N.C.
Crosstab
% within Rural, nonrural, urban
54.5% 69.7% 75.2% 66.5%
45.5% 30.3% 24.8% 33.5%
100.0% 100.0% 100.0% 100.0%
No
Yes
Are you aware ofthe ALUS pilotproject in NC?Total
farmrural
non-farm urban
Rural, nonrural, urban
Total
Chi-Square Tests
25.313 a 2 .000
25.082 2 .000
23.803 1 .000
705
Pearson Chi-Square
Likelihood Ratio
Linear-by-LinearAssociationN of Valid Cases
Value dfAsymp. Sig.
(2-sided)
0 cells (.0%) have expected count less than 5.The minimum expected count is 67.29.
a.
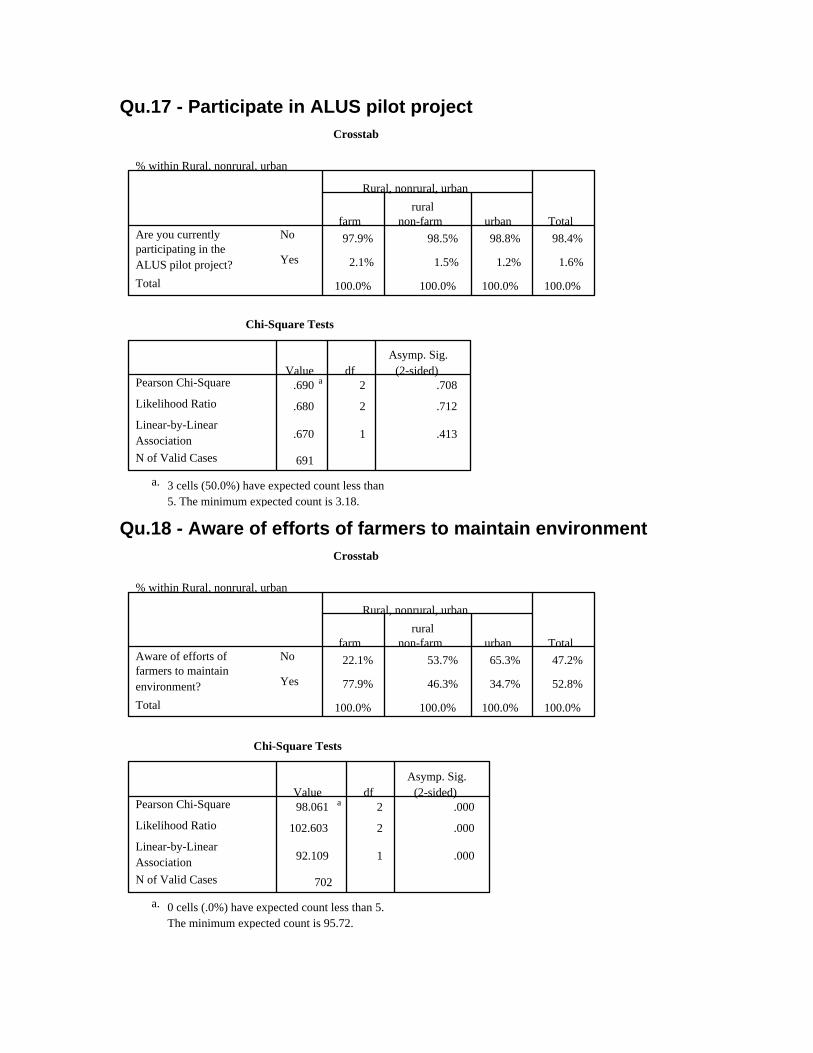
Qu.17 - Participate in ALUS pilot project Crosstab
% within Rural, nonrural, urban
97.9% 98.5% 98.8% 98.4%
2.1% 1.5% 1.2% 1.6%
100.0% 100.0% 100.0% 100.0%
No
Yes
Are you currentlyparticipating in theALUS pilot project?Total
farmrural
non-farm urban
Rural, nonrural, urban
Total
Chi-Square Tests
.690 a 2 .708
.680 2 .712
.670 1 .413
691
Pearson Chi-Square
Likelihood Ratio
Linear-by-LinearAssociationN of Valid Cases
Value dfAsymp. Sig.
(2-sided)
3 cells (50.0%) have expected count less than5. The minimum expected count is 3.18.
a.
Qu.18 - Aware of efforts of farmers to maintain environment
Crosstab
% within Rural, nonrural, urban
22.1% 53.7% 65.3% 47.2%
77.9% 46.3% 34.7% 52.8%
100.0% 100.0% 100.0% 100.0%
No
Yes
Aware of efforts offarmers to maintainenvironment?Total
farmrural
non-farm urban
Rural, nonrural, urban
Total
Chi-Square Tests
98.061 a 2 .000
102.603 2 .000
92.109 1 .000
702
Pearson Chi-Square
Likelihood Ratio
Linear-by-LinearAssociationN of Valid Cases
Value dfAsymp. Sig.
(2-sided)
0 cells (.0%) have expected count less than 5.The minimum expected count is 95.72.
a.
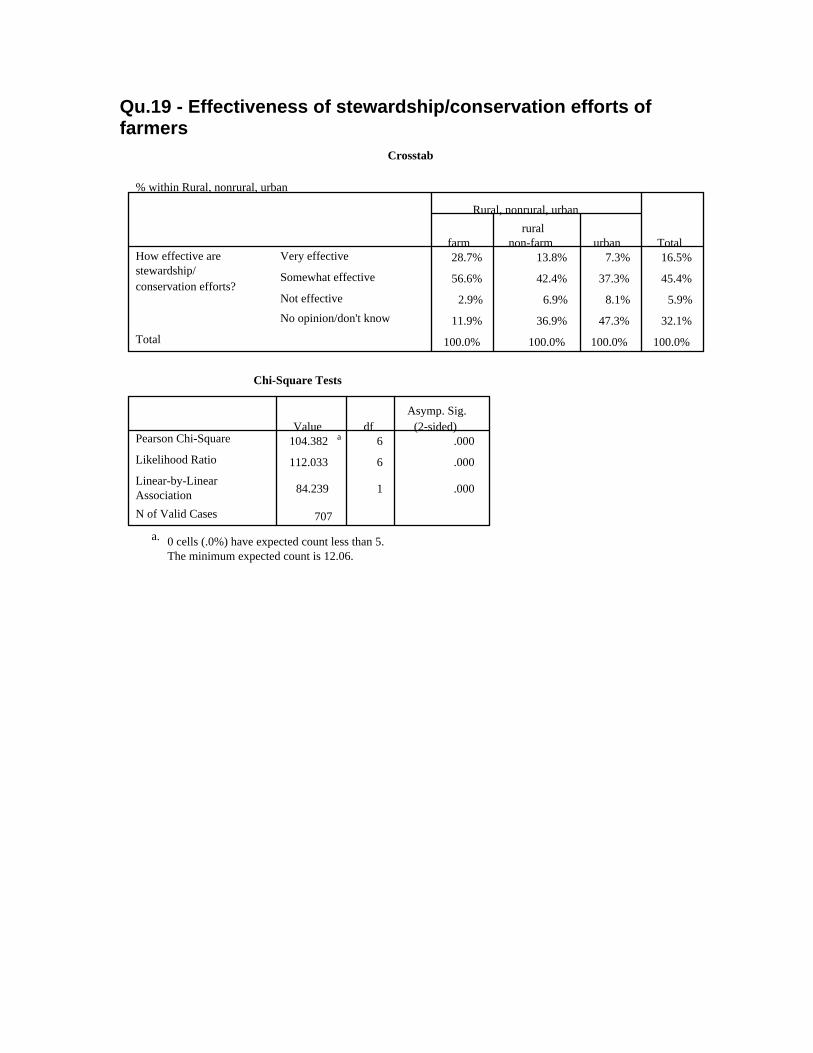
Qu.19 - Effectiveness of stewardship/conservation efforts of farmers
Crosstab
% within Rural, nonrural, urban
28.7% 13.8% 7.3% 16.5%
56.6% 42.4% 37.3% 45.4%
2.9% 6.9% 8.1% 5.9%
11.9% 36.9% 47.3% 32.1%
100.0% 100.0% 100.0% 100.0%
Very effective
Somewhat effective
Not effective
No opinion/don't know
How effective arestewardship/conservation efforts?
Total
farmrural
non-farm urban
Rural, nonrural, urban
Total
Chi-Square Tests
104.382 a 6 .000
112.033 6 .000
84.239 1 .000
707
Pearson Chi-Square
Likelihood Ratio
Linear-by-LinearAssociationN of Valid Cases
Value dfAsymp. Sig.
(2-sided)
0 cells (.0%) have expected count less than 5.The minimum expected count is 12.06.
a.
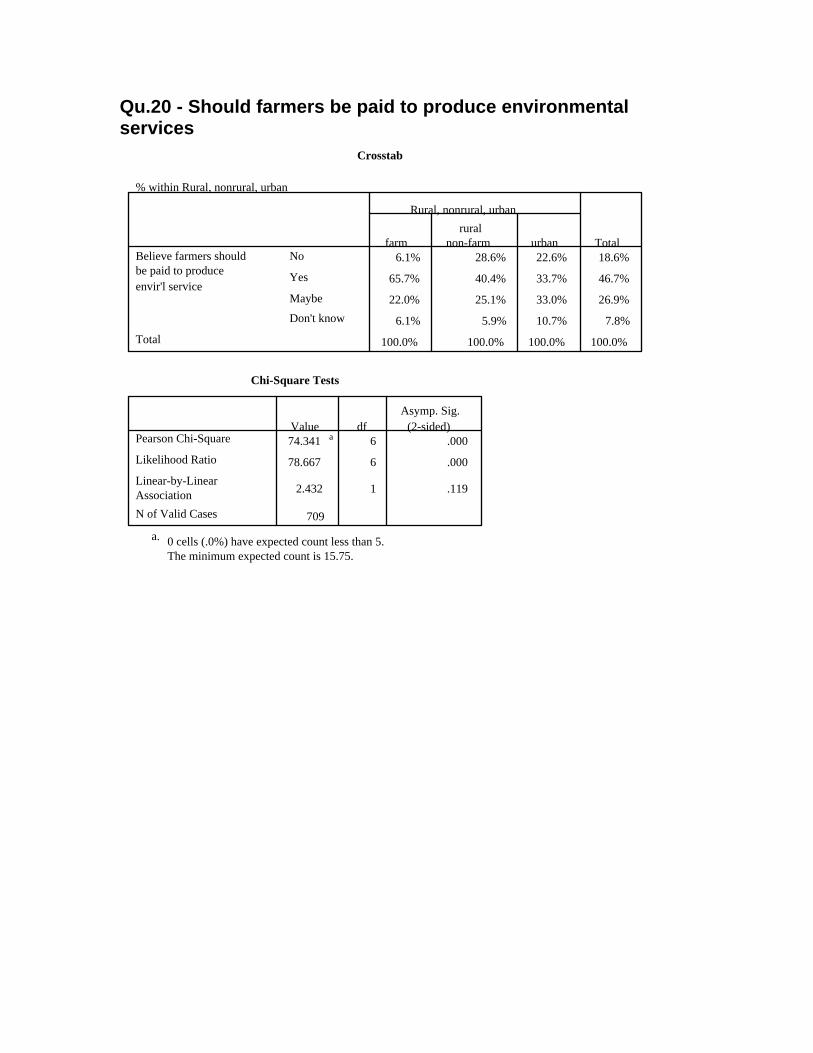
Qu.20 - Should farmers be paid to produce environmental services
Crosstab
% within Rural, nonrural, urban
6.1% 28.6% 22.6% 18.6%
65.7% 40.4% 33.7% 46.7%
22.0% 25.1% 33.0% 26.9%
6.1% 5.9% 10.7% 7.8%
100.0% 100.0% 100.0% 100.0%
No
Yes
Maybe
Don't know
Believe farmers shouldbe paid to produceenvir'l service
Total
farmrural
non-farm urban
Rural, nonrural, urban
Total
Chi-Square Tests
74.341 a 6 .000
78.667 6 .000
2.432 1 .119
709
Pearson Chi-Square
Likelihood Ratio
Linear-by-LinearAssociationN of Valid Cases
Value dfAsymp. Sig.
(2-sided)
0 cells (.0%) have expected count less than 5.The minimum expected count is 15.75.
a.
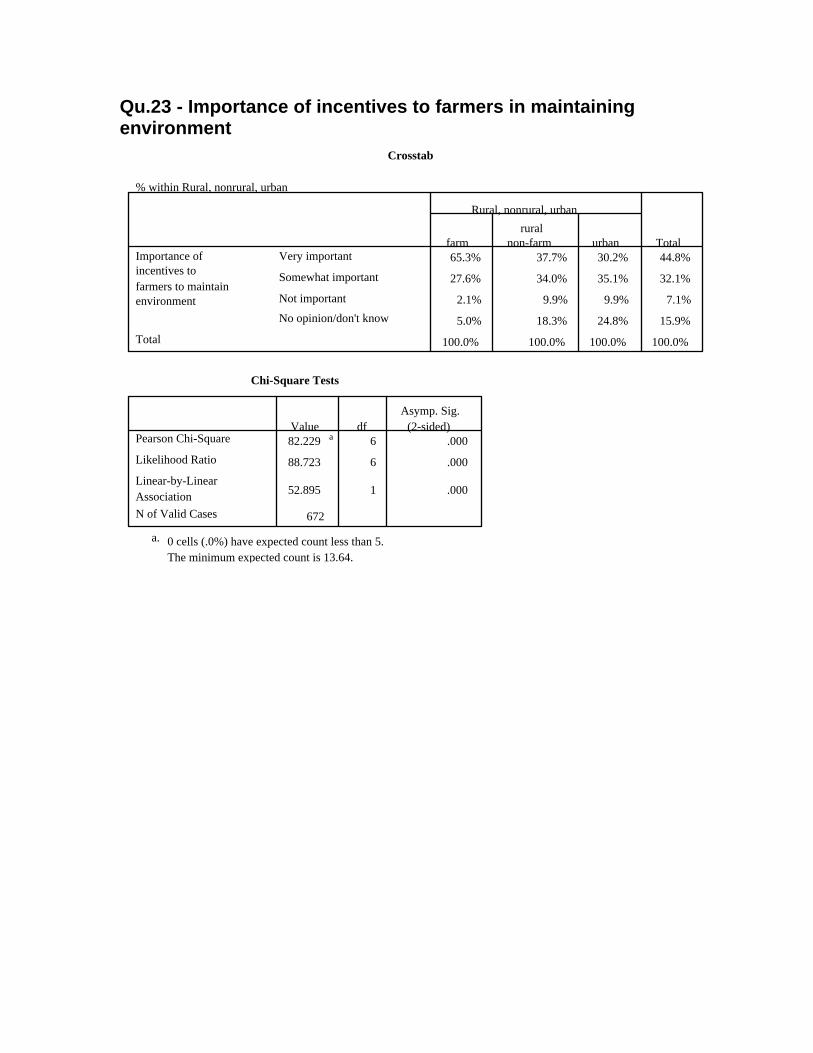
Qu.23 - Importance of incentives to farmers in maintaining environment
Crosstab
% within Rural, nonrural, urban
65.3% 37.7% 30.2% 44.8%
27.6% 34.0% 35.1% 32.1%
2.1% 9.9% 9.9% 7.1%
5.0% 18.3% 24.8% 15.9%
100.0% 100.0% 100.0% 100.0%
Very important
Somewhat important
Not important
No opinion/don't know
Importance ofincentives tofarmers to maintainenvironment
Total
farmrural
non-farm urban
Rural, nonrural, urban
Total
Chi-Square Tests
82.229 a 6 .000
88.723 6 .000
52.895 1 .000
672
Pearson Chi-Square
Likelihood Ratio
Linear-by-LinearAssociationN of Valid Cases
Value dfAsymp. Sig.
(2-sided)
0 cells (.0%) have expected count less than 5.The minimum expected count is 13.64.
a.
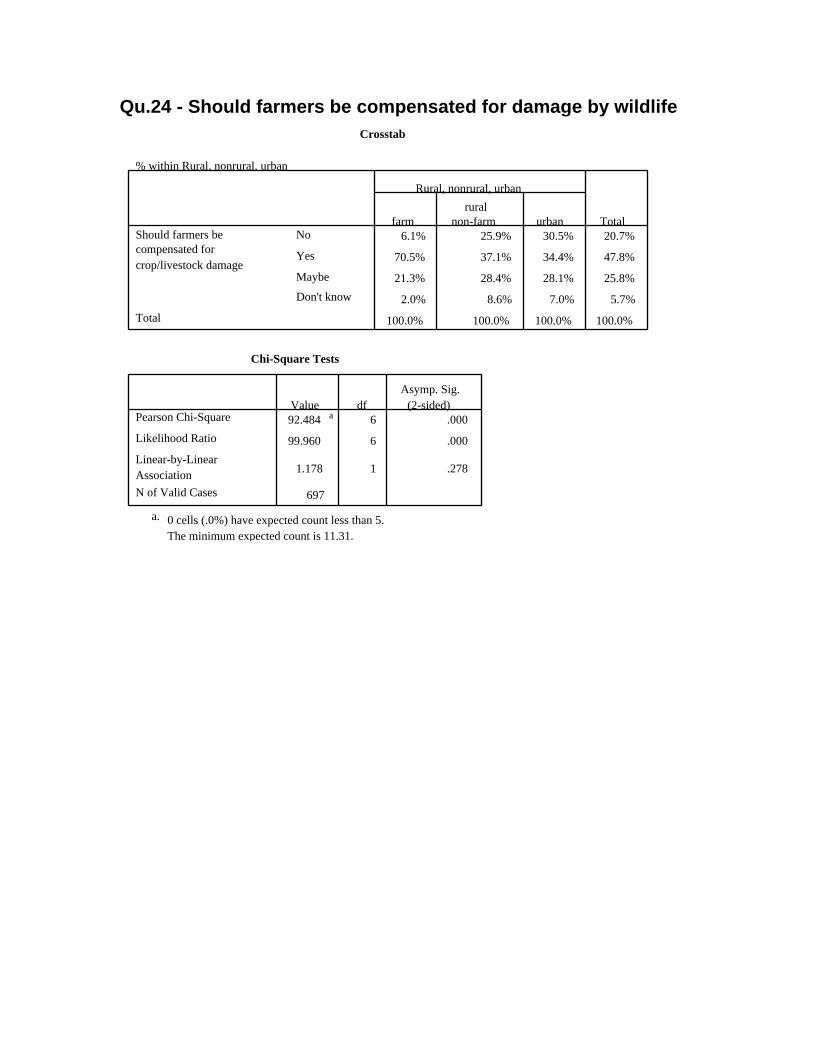
Qu.24 - Should farmers be compensated for damage by wildlife Crosstab
% within Rural, nonrural, urban
6.1% 25.9% 30.5% 20.7%
70.5% 37.1% 34.4% 47.8%
21.3% 28.4% 28.1% 25.8%
2.0% 8.6% 7.0% 5.7%
100.0% 100.0% 100.0% 100.0%
No
Yes
Maybe
Don't know
Should farmers becompensated forcrop/livestock damage
Total
farmrural
non-farm urban
Rural, nonrural, urban
Total
Chi-Square Tests
92.484 a 6 .000
99.960 6 .000
1.178 1 .278
697
Pearson Chi-Square
Likelihood Ratio
Linear-by-LinearAssociationN of Valid Cases
Value dfAsymp. Sig.
(2-sided)
0 cells (.0%) have expected count less than 5.The minimum expected count is 11.31.
a.
Recommended