An Efficacy Study of the English 3 Program (Standard Setting) Florida Virtual School
Report 492, September 2014
Advisory Board: Michael Beck, President Beck Evaluation & Testing Associates, Inc. Jennifer M. Conner, Assistant Professor Indiana University
Keith Cruse, Former Managing Director Texas Assessment Program
Educational Research Institute of America
1
Contents
Executive Summary ......................................................................................................................... 2
Analyzing Student Assessment Performance ................................................................................. 4
Assessments Used for Standard Setting ..................................................................................... 4
Standard Setting Process ............................................................................................................ 5
Determining Cut-Scores .............................................................................................................. 6
Standard Setting Panelists .......................................................................................................... 7
Standard Setting Results ............................................................................................................... 8
Performance Level Descriptors and Cut Scores .......................................................................... 8
Student Performance Results Using the Standard Setting Criteria .......................................... 10
Demographic Characteristics of the Student Population ......................................................... 10
Conclusions ................................................................................................................................... 12
Educational Research Institute of America
2
Executive Summary
Florida Virtual School® (FLVS®) contracted with the Educational Research Institute of America
(ERIA) to conduct a study to analyze the end-of-course test score data for students enrolled in
the English 3 course to determine if adequate levels of success are achieved. The FLVS English 3
course is designed to meet the Florida Standards.
The English 3 course was designed by FLVS, an established leader in developing and providing
virtual kindergarten through grade 12 education solutions to students worldwide. A nationally
recognized e-learning model, FLVS, founded in 1997, was the country's first statewide Internet-
based public high school. In 2000, the Florida Legislature established FLVS as an independent
educational entity with a gubernatorial appointed board. FLVS funding is tied directly to student
performance.
Each FLVS course has a real-time teacher who guides each student through the coursework,
which is organized by modules and segments. As a student works through the modules of a
course, he or she will connect with the teacher to take exams online and receive discussion-
based assessments over the phone. Students do the work at their own pace and on their own
time, but they interact with their teachers in multiple ways – -including Live Lessons, phone
calls, chat, texting, email—throughout the course.
This study utilized a standard setting process to establish cut-scores for students’ combined
scores on the two segment assessments, mentioned throughout this report as the end-of-course
exam. The standard setting process was conducted by an independent moderator and
employed the Bookmarking method of arranging test items from easiest to most difficult to
assist committee members in determining cut scores.
The performance groups were previously established by FLVS. These included:
Needs Improvement
Novice
Capable
Advanced
The English 3 course is divided into two segments. An assessment for each segment is
administered to students at the end of each segment. Both assessments were utilized to set
test scores. Each student took a 41-item test for Segment 1 and a 35-item test for Segment 2.
The standard setting test included the same number of items as students were administered for
a total of 76 items.
Educational Research Institute of America
3
Using the established cut scores, the student performance data was analyzed. Those cut scores
were then applied to the test score data for students who had completed the English 3 course
and both end-of-segment assessments. A committee of seven educators met for about six
hours over three days to review the 76 test items and establish the cut scores for four
performance groups. The results indicated high student performance with the majority of
students scoring at the Capable level and above.
Educational Research Institute of America
4
Analyzing Student Assessment Performance
Carefully constructed studies are needed to determine the efficacy of online courses as these
courses continue to expand and provide an important education opportunity to students who
cannot otherwise attend regular school programs. In addition, the enrichment of a student’s
educational opportunities through online courses can help to prepare students for the
demands of post-secondary education and the workplace. FLVS has developed a unique
approach to online course instruction which combines excellent online resources accompanied
by significant support and guidance from teachers.
A study was undertaken to determine whether English 3 students had achieved an
understanding of the skills and strategies taught in the course. A standard setting approach was
used to determine the achievement level students had achieved in the course.
A standard setting process is one in which a group of educators, as well as some non-educators,
who are knowledgeable about a course reviews the content of a test and determines scores
that would reflect various levels of understanding. These levels are called Performance Level
Descriptors (PLDs). This process does not evaluate students’ scores rather it reviews test items
to determine which items should be answered correctly by students who are administered the
assessment. After the standards have been set, the standards are then applied to students’
scores to determine each student’s performance level.
Assessments Used for Standard Setting
There were two major assessments administered to students during the English 3 course. The
first of these two tests, Segment 1 test, was administered to a student when he or she had
completed the first segment of the English 3 course. A second test, Segment 2 test, was
administered when a student had completed the second segment of the English 3 course. The
number of items for each of these tests is described in Table 1.
The English 3 Segment 1 and Segment 2 assessments are designed to gauge a student's
achievement of the content standards for the course. Each multiple-choice item consisted of
three or four answer options and was scored as right or wrong with one point for each item. A
student's score on these tests, when combined with other assessment results and other direct
and indirect measures of accomplishment of course goals, is used to determine the student's
final grade in the course.
Each of the tests was made up of a number of test item groups. Each item group was developed
to measure specific course standards. The item groups each consisted of various numbers of
Educational Research Institute of America
5
items ranging from as few as 3 test items to as many as 16 items. Students were administered
1, 2, 3, or 4 test items from each group depending on the number of items in the group. The
items were selected randomly from each group for each student by a computer test design
program.
Table 1 Number of Item Groups, Number of Items within each Group and
Number of Items Selected to be Administered to Students
Assessments Number of Item Groups Total Number of Items
Number of Items Administered to Each
Student
Segment 1 22* 164 41
Segment 2 24* 140 35
Totals 46 304 76
*One of the item groups for the Segment 1 assessment and 2 items groups for the Segment 2 assessment consisted
of essay questions and those were not included as part of the standard setting process.
Standard Setting Process
FLVS determined that it would be helpful to provide criterion-referenced indication of student
performance on the Segment 1 and 2 exams. FLVS had previously developed Performance Level
Descriptors which were used as descriptors for other FLVS courses. Since these descriptors
seemed to work quite well for the other courses and for reasons of consistency, FLVS concluded
it would be best to continue to use the same descriptors for the English 3 course.
The standard setting performance level descriptors include four levels and are described as
follows:
Level 1- Needs Improvement: The student did not meet most standards, and significant
instructional intervention is needed.
Level 2 - Novice: The student meets some standards but needs instructional intervention to
achieve a level of competence.
Level 3 - Capable: The student meets most standards and demonstrates competency.
Level 4 - Advanced: The student has mastered the standards and demonstrates exceptional
ability.
The test items were then reviewed to determine the cut scores that would indicate each
student’s level of performance. These cut scores could then be applied to each student’s actual
performance on the assessments.
Educational Research Institute of America
6
Standard setting was carried out using a modification of the widely used and extensively
researched item-mapping, originally titled the Bookmark method, for determining standards.
This method was selected for two reasons. First, it is the most commonly applied methodology
used in determining student performance standards for educational assessment in the United
States. Second, it is a procedure that appeared to lend itself to carrying out the activities
virtually—that is, by conducting the necessary panel sessions via telephone and presentations
shared via various screen sharing programs.
Determining Cut-Scores
A standard-setting study is a study conducted by an organization that uses assessments as one
measure of student performance in a course. In kindergarten-grade 12 educational
achievement testing, the concept of content standards is well established and serves as the
design structure for course instruction and assessment. Student test performance is designed
to be interpreted in terms of the content standards that the student, given his or her test score,
has attained.
A cut-score cannot be arbitrarily determined, it must be empirically justified. For example, the
organization cannot merely decide that the cut-score will be 70 percent correct will be used to
separate competent from incompetent performance. Instead, a study is conducted to
determine what score best differentiates the classifications of examinees, such as competent
vs. incompetent.
In the early history of educational assessments, cut-scores were based on accepted
percentages correct somewhere between 60 and 75 percent. Conceptually, these percentages
correct can be considered the proportion of perfection a minimally proficient examinee, for
example, must achieve. Since then, however, there have been many systematic methods
proposed and implemented that involve experts making decisions or judgments based on the
items included on the exam or the examinees actually taking the exam.
Rather than relying on what experts simply think is a reasonable percentage correct to justify,
for example, minimal proficiency, the standard setting method requires a standard setting
panelist to judge each item individually as to whether or not he/she would expect a minimally
proficient examinee to answer it correctly. It is the aggregation of these item judgments by a
panel of curriculum experts that result in a cut score.
In summary, standard setting is the methodology used to define levels of achievement or
proficiency and the cut scores corresponding to those levels. A cut score is simply the score that
serves to classify the students whose score is below the cut score into one level and the
students whose score is at or above the cut score into the next and higher level.
Educational Research Institute of America
7
Standard Setting Panelists
It is not correct to assume that the panelists in a standard setting process actually set
standards. The panelists are responsible to the program administrators; in this case to the
administrators of Florida Virtual School. FLVS has the authority for setting standards. The
panelists recommend standard setting cut-scores to the FLVS administration.
The selection of panelists in standard setting is of great importance. Panelists must be:
Experts in the related field of examination
Familiar with the examination methods being used
Good problem solvers and able to work within a group
Familiar with levels of student performance
Have a good understanding of education, particularly for the age/grade levels of the
course being studied
Panelists who are not part of the instructional staff for the assessment being studied should be
included on the panel that recommends standards. External panelists offer insights, experience,
and ideas that may not have arisen otherwise and which usually improve the quality of the
standard-setting procedures and the defensibility of the results. The external panelists provide
greater validity to the process and that validity is essential to the standard setting process.
It is important to include panelists who are familiar with the content of the course for which
standards are being set. English 3 is a somewhat common course offered in secondary schools
and teachers who had taught or helped to develop the English 3 course for FLVS were
important to include on the panel. In addition, several teachers who were familiar with the
content of the English 3 course but had not taught the FLVS version of the course were invited
to participate. A total of seven panelists agreed to participate.
The actual standard setting was conducted virtually on August 18, 19, and 20, 2014. Sessions
were held for a combined total of approximately six hours on these three days. This did not
include the time the panel members spent independently reviewing the test items and
analyzing the items through three rounds of standard setting.
The item-mapping procedure was chosen primarily due to its overwhelming popularity for
determining performance standards for educational tests of this type and its ease of use by
panelists. Consistent with typical applications of the procedures, panelists had three
opportunities to recommend standards. Following each round of judgments, panelists had an
opportunity to share their perspectives and—as desired—individual recommendations with
Educational Research Institute of America
8
their peer judges. Panelists were shown the recommendations of their peers following each
round. Extensive discussions of individual test items, especially those around the interim cut-
score recommendations, took place. As is typically the case with item-mapping applications,
panelists made their first recommendations without the benefit of seeing student performance
data; these results, presented in terms of item-difficulty (p-value) data, were shared between
the first and second rounds of judgments and were available for panelists to consider when
they made Rounds 2 and 3 recommendations.
The English 3 test that is actually administered to each student at the completion of the course
segment is assembled automatically and randomly from an extensive item pool assessing each
of 76 slots on the test blueprint. Thus, each student is presented with a somewhat-unique set
of 76 items which, as a set, assess the identical test blueprint as the test administered to any
other student. For making their judgments, panelists used an item difficulty ordered booklet.
This booklet was composed of 76 items arranged in an increasingly difficult sequence. The
items chosen for use in the ordered-item booklet were those that were closest in difficulty to
the mean of the items assessing each of these 76 test-blueprint slots.
Standard Setting Results
The results are presented in two sections. The first describes the results of the standard setting
process and the cut-scores determined by the panelists and endorsed by the administration of
FLVS. The second describes the performance of the FLVS English 3 students by applying the cut
scores to each student’s test performance.
Performance Level Descriptors and Cut Scores
Table 2 presents a summary of the results of the session. As is typical of standard-setting
activities – judges varied somewhat significantly among themselves across all three rounds of
the process, although they agreed somewhat more in Round 3 than in the first round. Similarly,
while individual judges changed their recommendations between rounds, often fairly
significantly, the overall central tendency of the recommendations remained fairly constant.
The table also provides standard errors (SE) of the mean panel recommendations; these data
indicate that the degree of statistical error in the mean panel recommendations is on the order
of only one raw-score point.
The median judgments in the table are considered to be the best representation of the judges’
recommendations. Medians are typically preferred over means for such work as medians are
less affected by extreme or “outlier” recommendations. In the present case, of course,
medians do not differ significantly from means as the tabled data demonstrate.
Educational Research Institute of America
9
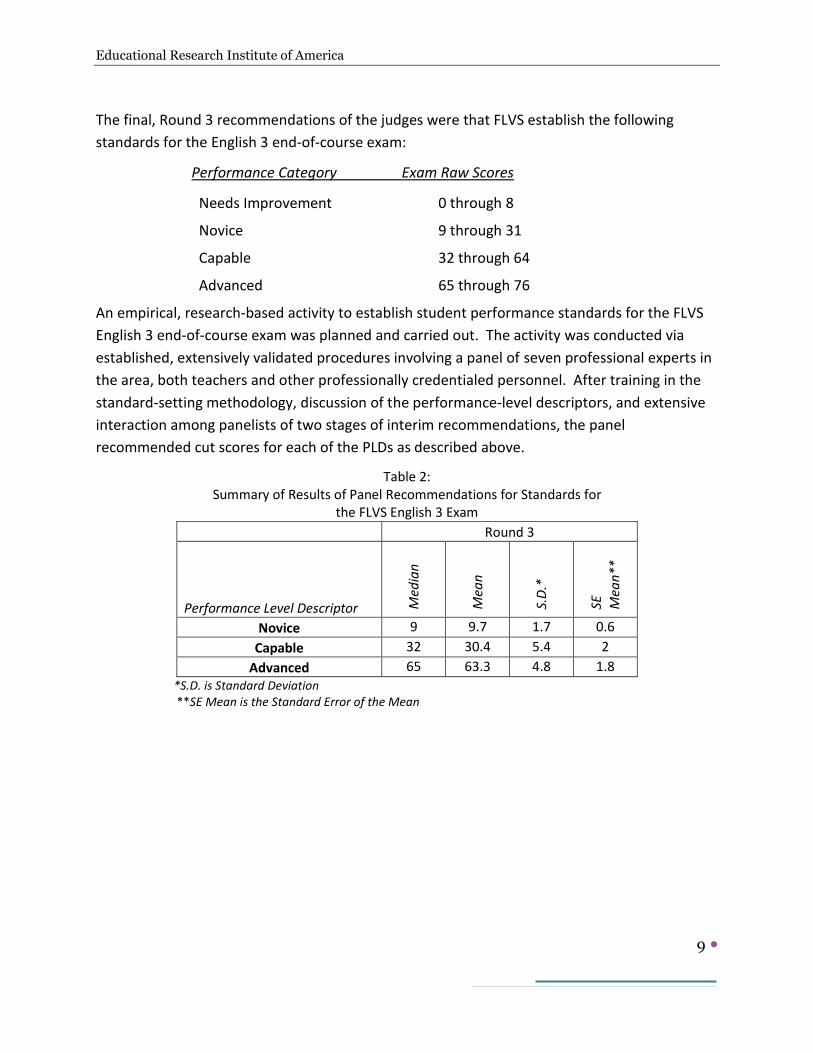
The final, Round 3 recommendations of the judges were that FLVS establish the following
standards for the English 3 end-of-course exam:
Performance Category Exam Raw Scores
Needs Improvement 0 through 8
Novice 9 through 31
Capable 32 through 64
Advanced 65 through 76
An empirical, research-based activity to establish student performance standards for the FLVS
English 3 end-of-course exam was planned and carried out. The activity was conducted via
established, extensively validated procedures involving a panel of seven professional experts in
the area, both teachers and other professionally credentialed personnel. After training in the
standard-setting methodology, discussion of the performance-level descriptors, and extensive
interaction among panelists of two stages of interim recommendations, the panel
recommended cut scores for each of the PLDs as described above.
Table 2: Summary of Results of Panel Recommendations for Standards for
the FLVS English 3 Exam
Round 3
Performance Level Descriptor Med
ian
Mea
n
S.D
.*
SE
Mea
n**
Novice 9 9.7 1.7 0.6
Capable 32 30.4 5.4 2
Advanced 65 63.3 4.8 1.8
*S.D. is Standard Deviation **SE Mean is the Standard Error of the Mean
Educational Research Institute of America
10
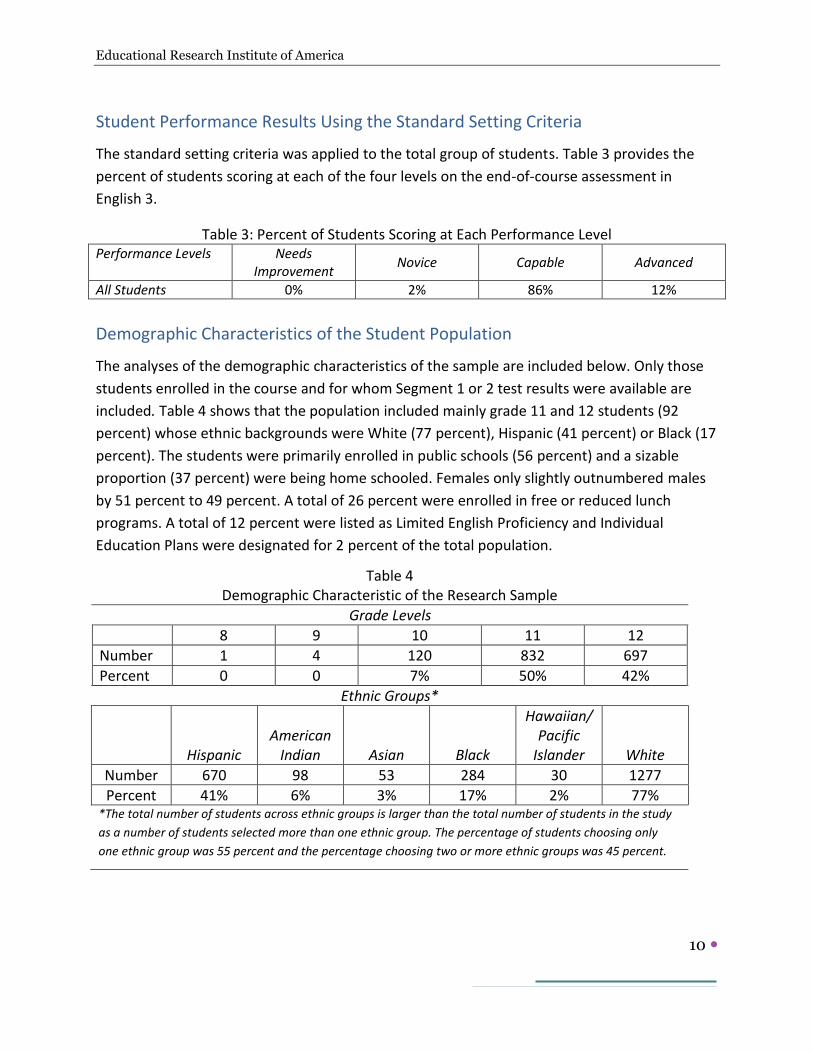
Student Performance Results Using the Standard Setting Criteria
The standard setting criteria was applied to the total group of students. Table 3 provides the
percent of students scoring at each of the four levels on the end-of-course assessment in
English 3.
Table 3: Percent of Students Scoring at Each Performance Level Performance Levels Needs
Improvement Novice Capable Advanced
All Students 0% 2% 86% 12%
Demographic Characteristics of the Student Population
The analyses of the demographic characteristics of the sample are included below. Only those
students enrolled in the course and for whom Segment 1 or 2 test results were available are
included. Table 4 shows that the population included mainly grade 11 and 12 students (92
percent) whose ethnic backgrounds were White (77 percent), Hispanic (41 percent) or Black (17
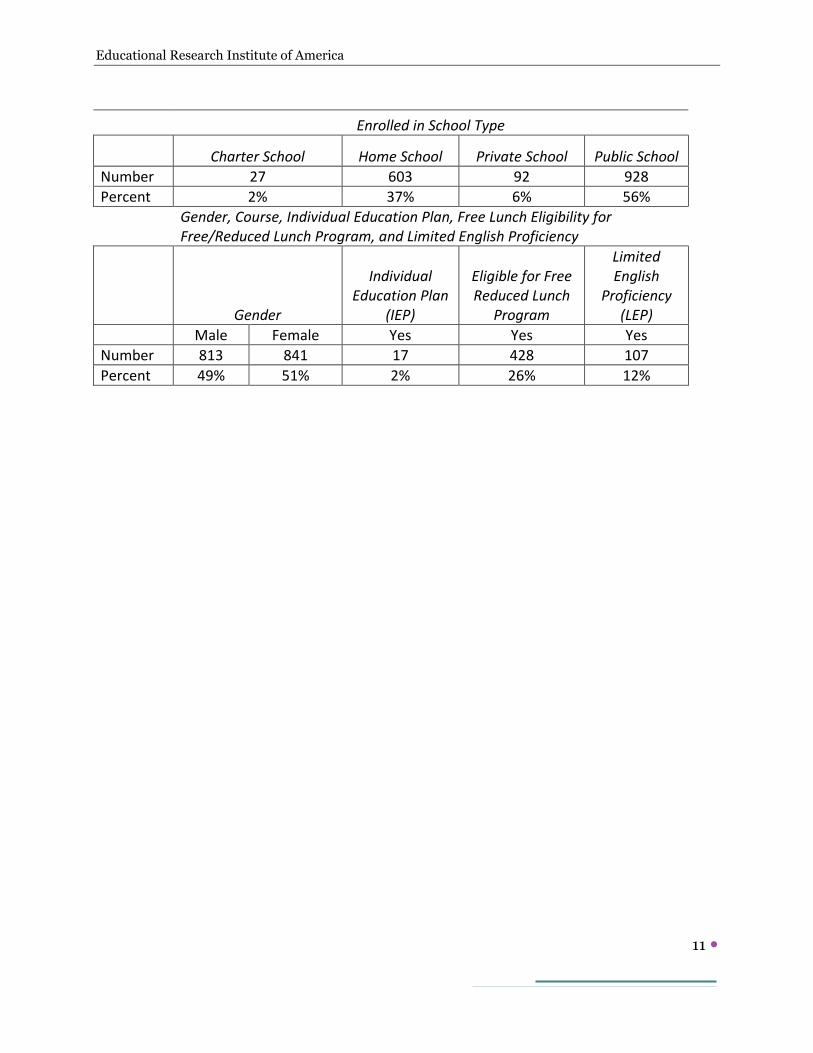
percent). The students were primarily enrolled in public schools (56 percent) and a sizable
proportion (37 percent) were being home schooled. Females only slightly outnumbered males
by 51 percent to 49 percent. A total of 26 percent were enrolled in free or reduced lunch
programs. A total of 12 percent were listed as Limited English Proficiency and Individual
Education Plans were designated for 2 percent of the total population.
Table 4 Demographic Characteristic of the Research Sample
Grade Levels
8 9 10 11 12
Number 1 4 120 832 697
Percent 0 0 7% 50% 42%
Ethnic Groups*
Hispanic
American Indian Asian Black
Hawaiian/ Pacific
Islander White
Number 670 98 53 284 30 1277
Percent 41% 6% 3% 17% 2% 77% *The total number of students across ethnic groups is larger than the total number of students in the study
as a number of students selected more than one ethnic group. The percentage of students choosing only
one ethnic group was 55 percent and the percentage choosing two or more ethnic groups was 45 percent.
Educational Research Institute of America
11
Enrolled in School Type
Charter School Home School Private School Public School
Number 27 603 92 928
Percent 2% 37% 6% 56%
Gender, Course, Individual Education Plan, Free Lunch Eligibility for Free/Reduced Lunch Program, and Limited English Proficiency
Gender
Individual Education Plan
(IEP)
Eligible for Free Reduced Lunch
Program
Limited English
Proficiency (LEP)
Male Female Yes Yes Yes
Number 813 841 17 428 107
Percent 49% 51% 2% 26% 12%
Educational Research Institute of America
12
Conclusions
There are two major conclusions to the study. First, the process of developing curriculum valid
cut-scores to determine levels of performance was very successful. The panel of English 3
curriculum experts was able to come to consensus on the levels of performance needed to
achieve each of the performance levels. The expertise of the panel in terms of their
understanding of the English 3 curriculum and their understanding of student performance
guided the panel to make specific recommendations regarding the cut scores.
The second conclusion is that the cut scores could then be used to determine student success
on the end-of-course assessments. The results of that analysis are presented in response to the
question that guided the study.
Do students enrolled in the Florida Virtual School English 3 course achieve success as
assessed by their end-of-course test scores?
The results show that no students scored at the Needs Improvement level and 86 percent of the
students scored at the second highest level, Capable. In addition, 12 percent of the students
scored at the Advanced level.
In summary, the study demonstrates the effective use of a standard setting process with a FLVS
end-of-course assessment and the effectiveness of the use of the Performance Level Descriptors
to assess student success on the end-of-course assessments. The results indicate high student
performance with the majority of students scoring at or above the Capable level.
Recommended