Smart TSO-DSO interaction schemes, market architectures and ICT Solutions for the integration of
ancillary services from demand side management and distributed generation
Ancillary service provision by RES and DSM
connected at distribution level in the future
power system
D1.1
Authors:
Julia Merino (TECNALIA), Inés Gómez (TECNALIA), Elena Turienzo (TECNALIA), Carlos Madina
(TECNALIA), Iñigo Cobelo (TECNALIA), Andrei Morch (SINTEF), Hanne Saele (SINTEF), Koen Verpoorten
(KU Leuven/EnergyVille), Enrique Rivero Puente (VITO/EnergyVille), Seppo Häninnen (VTT), Pekka
Koponen (VTT), Corentin Evens (VTT), Niina Helistö (VTT), Alessandro Zani (RSE) and Dario Siface (RSE).
Distribution Level PU
Responsible Partner TECNALIA
Checked by WP leader Date: 21/12/2016 – Daan Six (VITO)
Verified by the appointed
Reviewers
Date: 12/12/2016 – Loui Algren (Energinet)
Date: 14/12/2016 – Marco Rossi (RSE)
Approved by Project
Coordinator
Date: 21/12/2016 – Gianluigi Migliavacca (RSE)
This project has received funding from the European Union’s
Horizon 2020 research and innovation programme under
grant agreement No 691405
Issue Record
Planned delivery date 30/09/2016
Actual date of delivery 21/12/2016
Status and version Final
Version Date Author(s) Notes
1.0 10/11/2016 TECNALIA/T1.1. partners First version for internal review
1.1 13/12/2016 TECNALIA Reviewed version with comments from Loui Algren addressed
1.2 20/12/2016 TECNALIA Reviewed version with comments from Marco Rossi addressed
Copyright 2016 SmartNetD1.1 - Ancillary service provision by RES and DSM connected at distribution level in the future power system
Page 1
About SmartNet
The project SmartNet (http://smartnet-project.eu) aims at providing architectures for optimized interaction between TSOs and
DSOs in managing the exchange of information for monitoring, acquiring and operating ancillary services (frequency
control, frequency restoration, congestion management and voltage regulation) both at local and national level, taking into account
the European context. Local needs for ancillary services in distribution systems should be able to co-exist with system needs for
balancing and congestion management. Resources located in distribution systems, like demand side management and distributed
generation, are supposed to participate to the provision of ancillary services both locally and for the entire power system in the
context of competitive ancillary services markets.
Within SmartNet, answers are sought for to the following questions:
• Which ancillary services could be provided from distribution grid level to the whole power system?
• How should the coordination between TSOs and DSOs be organized to optimize the processes of procurement and
activation of flexibility by system operators?
• How should the architectures of the real time markets (in particular the markets for frequency restoration and
congestion management) be consequently revised?
• What information has to be exchanged between system operators and how should the communication (ICT) be
organized to guarantee observability and control of distributed generation, flexible demand and storage systems?
The objective is to develop an ad hoc simulation platform able to model physical network, market and ICT in order to analyse
three national cases (Italy, Denmark, Spain). Different TSO-DSO coordination schemes are compared with reference to three
selected national cases (Italian, Danish, Spanish).
The simulation platform is then scaled up to a full replica lab, where the performance of real controller devices is tested.
In addition, three physical pilots are developed for the same national cases testing specific technological solutions regarding:
• monitoring of generators in distribution networks while enabling them to participate to frequency and voltage
regulation,
• capability of flexible demand to provide ancillary services for the system (thermal inertia of indoor swimming pools,
distributed storage of base stations for telecommunication).
Partners
Copyright 2016 SmartNetD1.1 - Ancillary service provision by RES and DSM connected at distribution level in the future power system
Page 2
Table of Contents
About SmartNet ....................................................................................................................................................................................... 1
Table of Contents ..................................................................................................................................................................................... 2
List of Abbreviations and Acronyms .............................................................................................................................................. 5
Executive Summary ................................................................................................................................................................................ 7
1 Introduction ........................................................................................................................................................................................ 11
1.1 Scope of the document ......................................................................................................................................... 11
1.2 Deliverable structure ............................................................................................................................................ 11
2 Review of existing ancillary services and market structures ....................................................................................... 13
2.1 Overview of ancillary services .......................................................................................................................... 13
Ancillary services for frequency control ................................................................................................ 14 2.1.1
Ancillary services for voltage control ...................................................................................................... 16 2.1.2
Other ancillary services .................................................................................................................................. 18 2.1.3
Comparative analysis among several EU-countries .......................................................................... 19 2.1.4
2.2 Overview of electricity markets ....................................................................................................................... 24
2.2.1 Market rules ........................................................................................................................................................ 26
2.2.2 Electricity market – Denmark ..................................................................................................................... 26
2.2.3 Electricity market – Italy ............................................................................................................................... 29
2.2.4 Electricity market – Spain ............................................................................................................................. 33
3 Identification of future needs of ancillary services ........................................................................................................... 37
3.1 The SmartNet framework: expected trends in power systems up to 2030 .................................. 37
3.1.1 Electricity generation mix ............................................................................................................................. 37
3.1.2 Electricity consumption mix ........................................................................................................................ 38
3.1.3 Energy storage ................................................................................................................................................... 41
3.1.4 Inertia reduction and increase of frequency deviations .................................................................. 43
3.1.5 Increased flexibility.......................................................................................................................................... 45
3.1.6 Demand response ............................................................................................................................................. 46
3.1.7 Enhancement of cross-border interconnections ................................................................................ 48
3.2 SmartNet high-level scenario ............................................................................................................................ 51
3.2.1 Introduction to scenario design ................................................................................................................. 51
3.2.2 Generation of SmartNet high-level scenarios ....................................................................................... 53
3.2.3 Selection of scenarios of interest ............................................................................................................... 57
3.3 Mapping of the scenarios to the pilot countries ........................................................................................ 64
3.4 The evolution of the ancillary services in the 2030 horizon ............................................................... 67
3.4.1 Novel ancillary services ................................................................................................................................. 67
3.4.2 New requirements to the existing ancillary services ........................................................................ 68
Copyright 2016 SmartNetD1.1 - Ancillary service provision by RES and DSM connected at distribution level in the future power system
Page 3
4 Evaluation of the future needs for reserves ......................................................................................................................... 73
4.1 Approaches to reserves sizing .......................................................................................................................... 73
4.1.1 Frequency reserves .......................................................................................................................................... 73
4.1.2 Voltage control reserves ................................................................................................................................ 75
4.2 Current practises in estimating the reserves needs in Europe .......................................................... 76
4.2.1 Frequency reserves .......................................................................................................................................... 76
4.2.2 Voltage control reserves ................................................................................................................................ 77
4.3 Overview in current reserves needs in Europe ......................................................................................... 78
4.3.1 FCR........................................................................................................................................................................... 78
4.3.2 Automatic FRR (aFRR).................................................................................................................................... 78
4.3.3 Manual FRR (mFRR) + RR ............................................................................................................................. 80
4.4 Assessment of reserves needs in 2030 ......................................................................................................... 81
4.4.1 Frequency control reserves.......................................................................................................................... 82
4.4.2 Voltage control reserves ................................................................................................................................ 87
5 Summary and conclusions ............................................................................................................................................................ 91
6 References ........................................................................................................................................................................................... 94
7 Appendix A: Current status of ancillary services provision in some European countries ............................103
7.1 Austria........................................................................................................................................................................103
7.2 Belgium......................................................................................................................................................................108
7.3 Denmark ...................................................................................................................................................................114
7.4 Finland .......................................................................................................................................................................119
7.5 Italy .............................................................................................................................................................................123
7.6 Norway ......................................................................................................................................................................126
7.7 Spain ...........................................................................................................................................................................129
8 Appendix B: Market rules – Other countries ......................................................................................................................144
8.1 Electricity market - Belgium ............................................................................................................................144
8.2 Electricity market - Finland..............................................................................................................................146
9 Appendix C: Literature review/Methodology approaches to high-level scenario design .............................150
9.1 Overview ...................................................................................................................................................................150
9.2 Scenario Outlook and Adequacy Forecast 2014-2030” (ENTSO-E) ...............................................150
9.3 FOR-LEARN Online Foresight Guide for “Scenario building” (JRC-IPTS) ....................................151
9.4 “Scenario Planning: A Tool for Strategic Thinking” ...............................................................................152
9.5 “Definition of a Limited but Representative Number of Future Scenarios” (EvolvDSO
project) 153
9.6 “Structuring of uncertainties, options and boundary conditions for the implementation of
Electricity Highways System” (e-Highway 2050 project) ..........................................................................................154
9.7 The Gridtech project ............................................................................................................................................156
Copyright 2016 SmartNetD1.1 - Ancillary service provision by RES and DSM connected at distribution level in the future power system
Page 4
10 Appendix D: Future ancillary services ...............................................................................................................................158
10.1 Ancillary services for frequency control ....................................................................................................158
10.2 Ancillary services for voltage control ..........................................................................................................160
10.3 Ancillary services for power quality improvement ...............................................................................163
10.4 Other ancillary services (for other purposes or for combined f/V control) ...............................166
10.5 Plans for further improvement of ancillary services in Norway (2016-2021) .........................167
11 Glossary ............................................................................................................................................................................................171
Copyright 2016 SmartNetD1.1 - Ancillary service provision by RES and DSM connected at distribution level in the future power system
Page 5
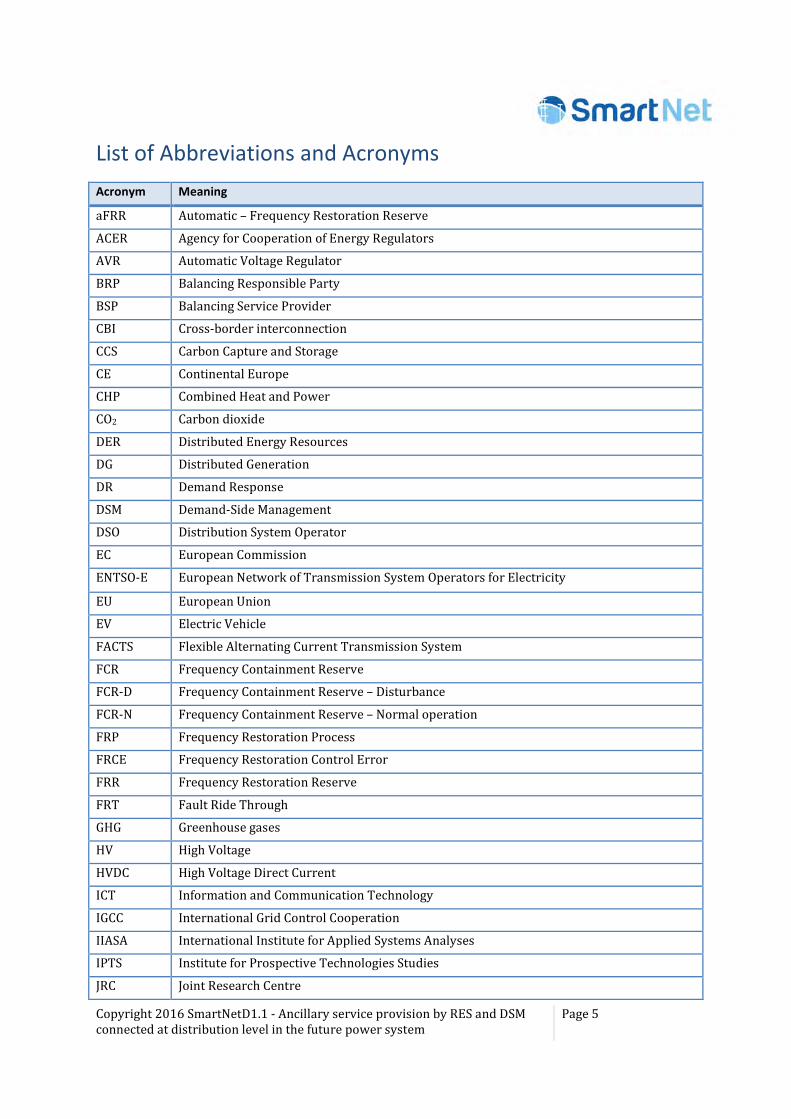
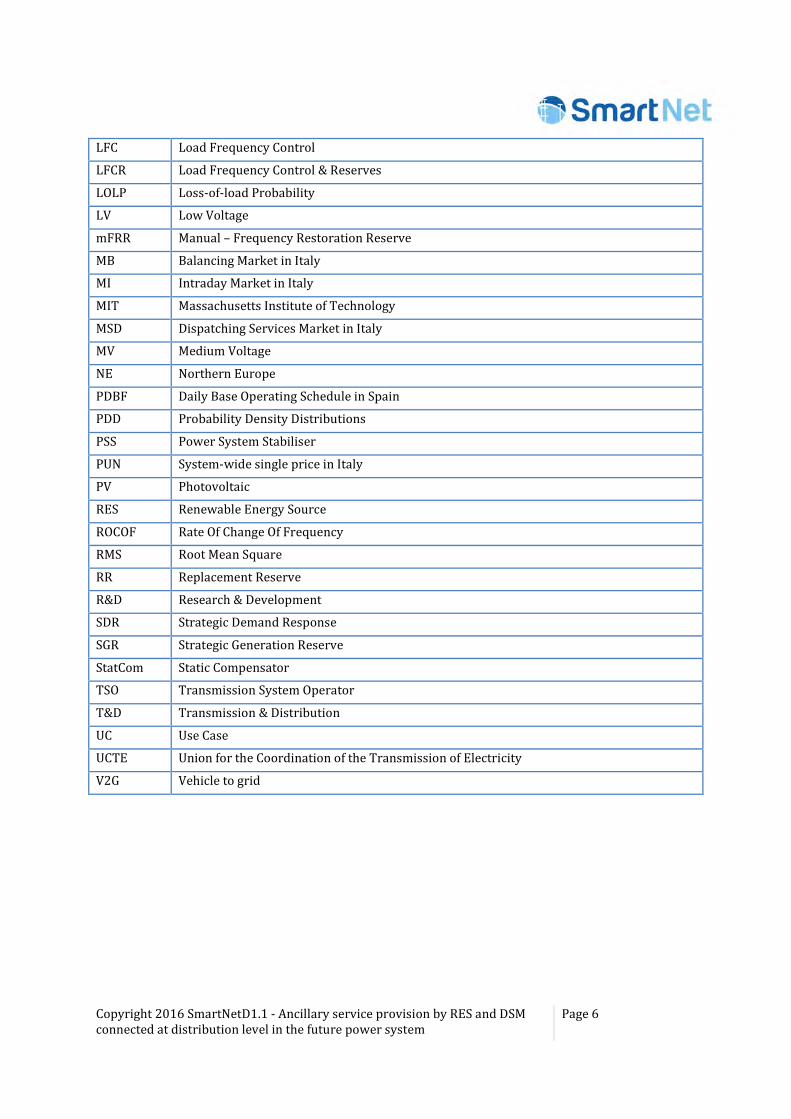
List of Abbreviations and Acronyms
Acronym Meaning
aFRR Automatic – Frequency Restoration Reserve
ACER Agency for Cooperation of Energy Regulators
AVR Automatic Voltage Regulator
BRP Balancing Responsible Party
BSP Balancing Service Provider
CBI Cross-border interconnection
CCS Carbon Capture and Storage
CE Continental Europe
CHP Combined Heat and Power
CO2 Carbon dioxide
DER Distributed Energy Resources
DG Distributed Generation
DR Demand Response
DSM Demand-Side Management
DSO Distribution System Operator
EC European Commission
ENTSO-E European Network of Transmission System Operators for Electricity
EU European Union
EV Electric Vehicle
FACTS Flexible Alternating Current Transmission System
FCR Frequency Containment Reserve
FCR-D Frequency Containment Reserve – Disturbance
FCR-N Frequency Containment Reserve – Normal operation
FRP Frequency Restoration Process
FRCE Frequency Restoration Control Error
FRR Frequency Restoration Reserve
FRT Fault Ride Through
GHG Greenhouse gases
HV High Voltage
HVDC High Voltage Direct Current
ICT Information and Communication Technology
IGCC International Grid Control Cooperation
IIASA International Institute for Applied Systems Analyses
IPTS Institute for Prospective Technologies Studies
JRC Joint Research Centre
Copyright 2016 SmartNetD1.1 - Ancillary service provision by RES and DSM connected at distribution level in the future power system
Page 6
LFC Load Frequency Control
LFCR Load Frequency Control & Reserves
LOLP Loss-of-load Probability
LV Low Voltage
mFRR Manual – Frequency Restoration Reserve
MB Balancing Market in Italy
MI Intraday Market in Italy
MIT Massachusetts Institute of Technology
MSD Dispatching Services Market in Italy
MV Medium Voltage
NE Northern Europe
PDBF Daily Base Operating Schedule in Spain
PDD Probability Density Distributions
PSS Power System Stabiliser
PUN System-wide single price in Italy
PV Photovoltaic
RES Renewable Energy Source
ROCOF Rate Of Change Of Frequency
RMS Root Mean Square
RR Replacement Reserve
R&D Research & Development
SDR Strategic Demand Response
SGR Strategic Generation Reserve
StatCom Static Compensator
TSO Transmission System Operator
T&D Transmission & Distribution
UC Use Case
UCTE Union for the Coordination of the Transmission of Electricity
V2G Vehicle to grid
Copyright 2016 SmartNetD1.1 - Ancillary service provision by RES and DSM connected at distribution level in the future power system
Page 7
Executive Summary
An ancillary service is a service necessary for the operation of a transmission or distribution system.
The ancillary services are required in the system to keep the security and guarantee the power supply
with high quality standards. They are needed in normal operating conditions, but also during
disturbances, and have been traditionally provided by big generation units connected at transmission
level. However, by 2030, which is the reference year for SmartNet project, a big part of the generation is
expected to be displaced from transmission to distribution, renewable energy sources (RES) are expected
to play an important role and new actors, such as aggregators, are expected to appear into the system to
compete with traditional providers of ancillary services, by offering flexibility from demand side
management (DSM) and other distributed energy resources (DER)1.
The goal of this deliverable is to provide a view on the need for ancillary services within the future
European power system, separated by products. Special attention has been given to the three countries
where the SmartNet pilots are going to be deployed: Denmark, Italy and Spain. For that purpose, three
main steps can be distinguished, which summarise and group the content of this deliverable:
• Analysis of current status: study of the existing products for the provision of ancillary services in
Europe and the associated rules for the ancillary services market.
• Description of the expected changes by 2030: definition of high-level scenarios which describe the
expected evolution of the existing ancillary services and the novel services/functionalities. The
countries where the pilots will be implemented are also mapped into these scenarios.
• Reserves dimensioning: description of current methodologies for reserves sizing, estimation of
needs at a European level and quantification of the future reserve needs.
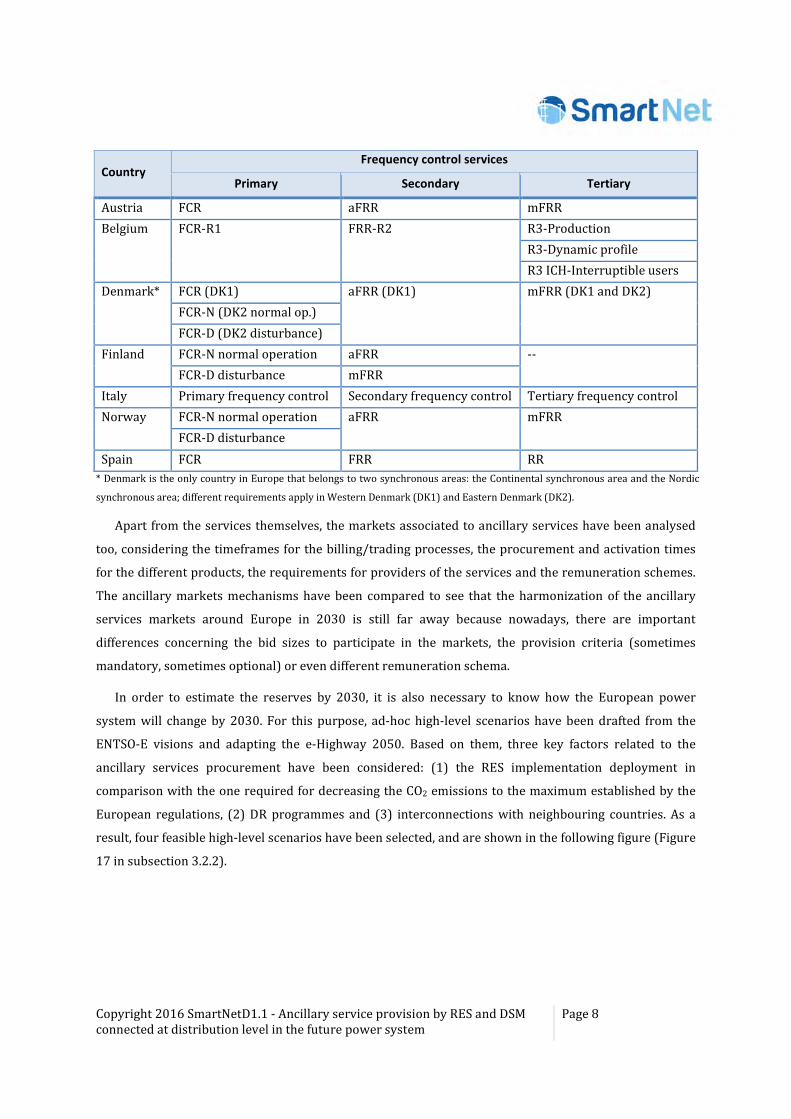
In the first part of the deliverable, a detailed analysis of the current regulations in the European power
systems has been accomplished. It gives a complete overview of the status of diverse ancillary services
across Europe, by establishing the comparison about the existing frequency regulation, voltage control
and other ancillary services, such as the black start capability or the interruptible load services. As an
example, the comparative results from the analysis of existing frequency control services in some
European countries are shown in the table below (same table as Table 2.1).
1 The broader term DER encompasses generation resources, such as distributed generation (DG), storage resources and consumption resources. In this deliverable, the terms demand side management (DSM) and demand response (DR) are used interchangeably to refer to flexibility available from consumption resources.
Copyright 2016 SmartNetD1.1 - Ancillary service provision by RES and DSM connected at distribution level in the future power system
Page 8
Country Frequency control services
Primary Secondary Tertiary
Austria FCR aFRR mFRR
Belgium FCR-R1 FRR-R2 R3-Production
R3-Dynamic profile
R3 ICH-Interruptible users
Denmark* FCR (DK1) aFRR (DK1) mFRR (DK1 and DK2)
FCR-N (DK2 normal op.)
FCR-D (DK2 disturbance)
Finland FCR-N normal operation aFRR --
FCR-D disturbance mFRR
Italy Primary frequency control Secondary frequency control Tertiary frequency control
Norway FCR-N normal operation aFRR mFRR
FCR-D disturbance
Spain FCR FRR RR * Denmark is the only country in Europe that belongs to two synchronous areas: the Continental synchronous area and the Nordic
synchronous area; different requirements apply in Western Denmark (DK1) and Eastern Denmark (DK2).
Apart from the services themselves, the markets associated to ancillary services have been analysed
too, considering the timeframes for the billing/trading processes, the procurement and activation times
for the different products, the requirements for providers of the services and the remuneration schemes.
The ancillary markets mechanisms have been compared to see that the harmonization of the ancillary
services markets around Europe in 2030 is still far away because nowadays, there are important
differences concerning the bid sizes to participate in the markets, the provision criteria (sometimes
mandatory, sometimes optional) or even different remuneration schema.
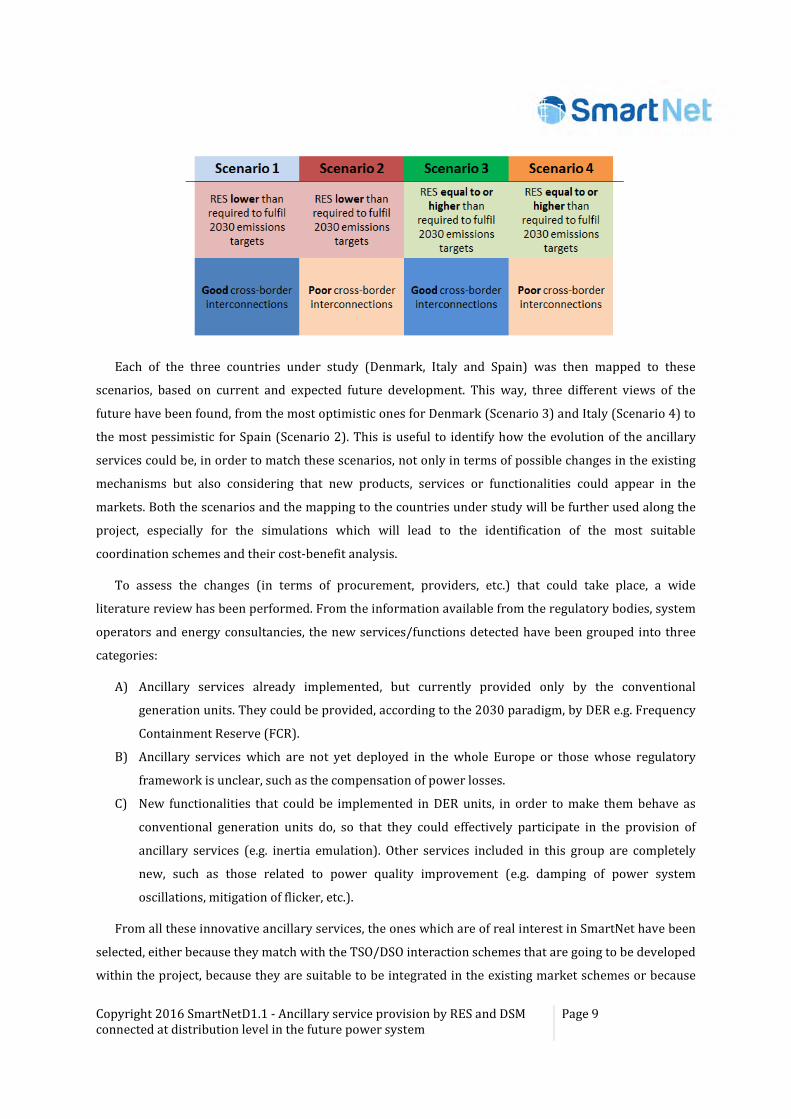
In order to estimate the reserves by 2030, it is also necessary to know how the European power
system will change by 2030. For this purpose, ad-hoc high-level scenarios have been drafted from the
ENTSO-E visions and adapting the e-Highway 2050. Based on them, three key factors related to the
ancillary services procurement have been considered: (1) the RES implementation deployment in
comparison with the one required for decreasing the CO2 emissions to the maximum established by the
European regulations, (2) DR programmes and (3) interconnections with neighbouring countries. As a
result, four feasible high-level scenarios have been selected, and are shown in the following figure (Figure
17 in subsection 3.2.2).
Copyright 2016 SmartNetD1.1 - Ancillary service provision by RES and DSM connected at distribution level in the future power system
Page 9
Each of the three countries under study (Denmark, Italy and Spain) was then mapped to these
scenarios, based on current and expected future development. This way, three different views of the
future have been found, from the most optimistic ones for Denmark (Scenario 3) and Italy (Scenario 4) to
the most pessimistic for Spain (Scenario 2). This is useful to identify how the evolution of the ancillary
services could be, in order to match these scenarios, not only in terms of possible changes in the existing
mechanisms but also considering that new products, services or functionalities could appear in the
markets. Both the scenarios and the mapping to the countries under study will be further used along the
project, especially for the simulations which will lead to the identification of the most suitable
coordination schemes and their cost-benefit analysis.
To assess the changes (in terms of procurement, providers, etc.) that could take place, a wide
literature review has been performed. From the information available from the regulatory bodies, system
operators and energy consultancies, the new services/functions detected have been grouped into three
categories:
A) Ancillary services already implemented, but currently provided only by the conventional
generation units. They could be provided, according to the 2030 paradigm, by DER e.g. Frequency
Containment Reserve (FCR).
B) Ancillary services which are not yet deployed in the whole Europe or those whose regulatory
framework is unclear, such as the compensation of power losses.
C) New functionalities that could be implemented in DER units, in order to make them behave as
conventional generation units do, so that they could effectively participate in the provision of
ancillary services (e.g. inertia emulation). Other services included in this group are completely
new, such as those related to power quality improvement (e.g. damping of power system
oscillations, mitigation of flicker, etc.).
From all these innovative ancillary services, the ones which are of real interest in SmartNet have been
selected, either because they match with the TSO/DSO interaction schemes that are going to be developed
within the project, because they are suitable to be integrated in the existing market schemes or because
Copyright 2016 SmartNetD1.1 - Ancillary service provision by RES and DSM connected at distribution level in the future power system
Page 10
their implementation does not imply disruptive changes for the system/market operators that would be
unlikely to happen in the short-term horizon.
Eventually, in order to calculate the future reserves’ needs, the current forecasts by the system
operators, together with the methodologies they applied, have been explored. This knowledge was used
as the basis for projecting the evolution of reserves needs in the SmartNet horizon through a Reserves
Dimensioning Tool. This tool takes into consideration the system imbalances, as well as the variability of
the two main RES installed in Europe (wind and PV) and has been designed to be country-independent.
As an example, the application of the tool to Denmark, Italy and Spain is also shown in this deliverable. It
must be noted that calculation methods strongly depend on the grid topology, historical data, the
generation mix, etc. and, thus, each TSO and DSO must use some coefficients to adjust the theoretical
values to their real implementation. It is not the aim of this application to provide exact figures for each
TSO/DSO, but rather to provide an example of the application of the tool, together with a rough estimate
of the likely reserve needs in the future.
Copyright 2016 SmartNetD1.1 - Ancillary service provision by RES and DSM connected at distribution level in the future power system
Page 11
1 Introduction
1.1 Scope of the document
This document aims at identifying the needs for ancillary services2 in the SmartNet horizon (2030+),
considering which innovative services can be provided by the resources connected at distribution level,
especially distributed generation (DG) and demand side management (DSM)3 actions, based on the
reserve needs that will be required at that horizon. With that purpose, current market structures for
existing ancillary services mechanisms are taken into account from the regulatory, economic and
technical perspective, in order to foresee how these markets should evolve to cope with these novel
services. For the achievement of these targets, three main subtasks have been carried out:
• Analysis of the state of the art in current regulations for ancillary services provision, as well as
the foreseen or required changes that would be necessary in the medium-term horizon (up to
2030) to introduce those new services in the electricity markets.
• Definition of the future scenarios and the relationship between those scenarios and the countries
where the pilots are going to operate (Italy, Denmark, Spain). This has been made by the
adoption of a proper methodology, based on the one by ENTSO-E, and considering the key factors
that impact over SmartNet.
• Development of a dedicated tool for the estimation of needs for ancillary services reserves, as
well as its application to the pilot countries.
1.2 Deliverable structure
The document has been divided into different chapters to present the results of the different steps
taken to identify the future needs for ancillary services.
Chapter 2 provides a revision of the state of the art in current ancillary services for several European
countries (those countries with partners involved in the task) and the comparison between them. The
market regulations in several European regions are analysed too.
2 An ancillary service is a service necessary for the operation of a transmission or distribution system Errore. L'origine riferimento non è stata trovata..
3 The broader term distributed energy resources (DER) encompasses generation resources, such as distributed generation (DG), storage resources and consumption resources. In this deliverable, the terms demand side management (DSM) and demand response (DR) are used interchangeably to refer to flexibility available from consumption resources.

Copyright 2016 SmartNetD1.1 - Ancillary service provision by RES and DSM connected at distribution level in the future power system
Page 12
Chapter 3 gives a view about novel ancillary services that could exist in the future. It also drafts the
new requirements to the current services in order to match with the expected trends by 2030 in terms of
generation and consumption mix, inertia reduction, deployment of storage, etc. The methodology used to
create the SmartNet high level scenarios, as well as the match between the scenarios and the future
situations in the pilot countries, is also shown.
Chapter 4 focuses on the reserve needs that will be necessary in 2030. It starts by reviewing both the
current methodologies used by system operators (SOs) for reserves sizing and the present needs for
ancillary services across Europe, both separated by products and for every country. Also the development
of a Reserves Dimensioning Tool to estimate the future reserves needs and its application to the pilot
countries is shown.
Chapter 0 shows the conclusions and the future steps to be carried out in SmartNet, on the grounds of
the results presented in this deliverable.
There are also three additional appendices. Appendix A collects the detailed information of the
current schemes of ancillary services provision in the different countries. In order to harmonise, as much
as possible, the information provided from the partners, an ad-hoc template was designed for this
purpose. Appendix B includes the market mechanism of several countries, apart from the pilot countries
analysed in detail in section 2.2. Appendix C reviews the most important methodologies dealing with
scenario design used in other European projects or by some international regulatory agents. Appendix D
details the information about the ancillary services that could exist in future power grids.
Copyright 2016 SmartNetD1.1 - Ancillary service provision by RES and DSM connected at distribution level in the future power system
Page 13
2 Review of existing ancillary services and market structures
Different electricity markets are executed in a sequential order, so that electricity and ancillary
services are traded in periods which range from some years (futures) to real-time operation (balancing),
as shown e.g. in Figure 3 and Figure 4. In general, generators compete in the wholesale electricity markets
to sell electricity to large industrial consumers and to electricity suppliers; whereas suppliers compete in
the retail electricity markets to sell electricity to final consumers. The main characteristics of a well-
functioning wholesale market are accessibility and liquidity to ensure competition, in order to guarantee
the long-term security of supply, economic competitiveness and environmental sustainability for current
and future consumers.
The price for wholesale electricity can be pre-determined by a buyer and seller through a bilateral
contract (a contract in which a mutual agreement has been made between the parties) or it can be set by
organised wholesale markets in which a market operator establishes the electricity price by matching
supply (what generators want to sell) and demand (what suppliers and customers want to buy).
The wholesale markets are based on the principle of market participants balancing their own physical
and traded positions, so, this is the primary mechanism by which the electricity systems are balanced.
Subsequently, system operators need to solve any imbalance and locational issues that remain after the
market closure (i. e. forecasting errors, incidents) [2]. To that end, transmission system operators (TSOs)
may contract ancillary services, which help balance the transmission system during the whole electricity
route, from generating sources to ultimate consumers. Distribution system operators (DSOs) could use a
similar approach when the regulation allows them to do so.
One of the main duties of TSOs and DSOs is to guarantee the security of supply with high quality
standards in their transmission or distribution systems. Therefore, they are continuously monitoring the
grid to keep the frequency and voltage within their respective safe bands and to push them back to their
normal range after an incident [1]. In order to bring these magnitudes back to their nominal ranges,
system operators use ancillary services.
A number of ancillary services are currently available in European Union (EU) countries. The
restructuring and introduction of competition in the electricity markets made it necessary that these
services are clearly defined and monetised [3]. Sections 2.1 and 2.2 provide a wide and detailed overview
on how ancillary services and market mechanisms are currently in force in several European countries.
2.1 Overview of ancillary services
According to ENTSO-E, TSOs must act to ensure that demand is equal to supply (balancing) in and
near real-time. Efficient balancing markets should ensure security of supply at the least cost, while
guaranteeing the achievement of environmental benefits by reducing the need for back-up generation.
Copyright 2016 SmartNetD1.1 - Ancillary service provision by RES and DSM connected at distribution level in the future power system
Page 14
With that purpose, there is a desire to increase harmonisation of the rules for balancing and for using
ancillary services across Europe, in order to extend effective pan-European competition in these markets.
Consequently, the access to a broad range of services from a wide range of providers (generators, storage
and flexible loads) would give TSOs flexible options, allowing them to make more efficient decisions. At
present, there is no uniform or standardised categorisation of current ancillary services within European
countries, so that they can be classified according to different criteria. In particular, for this review of
ancillary services, they have been grouped into three main categories:
• Services supporting frequency control (section 2.1.1).
• Services supporting voltage control (section 2.1.2).
• Other ancillary services (section 2.1.3). The services for power quality, combined
frequency/voltage control, restoration services, etc. available at each country are included.
Ancillary services for frequency control 2.1.1
According to the ENTSO-E definition, the frequency control is the capability of a power generating
module or high-voltage direct current (HVDC) system to adjust its active power output in response to a
measured deviation of system frequency from a set point, in order to maintain stable system frequency
[4]. There are three control layers:
1) Primary frequency control. It maintains the balance between generation and demand in the
network by using the turbine speed governors and other fast activation devices. Primary control
is an automatic function of the turbine governor that adjusts the generator output of a unit as a
consequence of a frequency deviation / offset in the synchronous area. By the joint action of all
the interconnected undertakings, primary control ensures the operational reliability in the
synchronous area. For primary frequency control the Frequency Containment Reserve (FCR) is
used. FCR typically includes operating reserves with an activation time up to 30 seconds. In
several systems, such as the Nordic, the FCR is divided into two categories: Frequency controlled
normal operation reserve (FCR-N) and Frequency controlled disturbance reserve (FCR-D).
2) Secondary frequency control. It is a centralised automatic function to regulate the generation in a
control area based on activation of secondary control reserves in order to maintain the power
flow interchanges with all other control areas. At the same time, it has to restore the frequency in
case of a frequency deviation within the control area to its set-point value in order to free the
capacity needed by the primary control and to restore the primary control reserves. The reserve
used for this secondary control is the Frequency Restoration Reserve (FRR) which is an operating
reserve necessary to restore the frequency to the nominal value after a sudden disturbance and
to replace FCR if the frequency deviation lasts longer than 30 seconds. This category includes
operating reserves with an activation time typically between 30 seconds up to 15 minutes. The
Copyright 2016 SmartNetD1.1 - Ancillary service provision by RES and DSM connected at distribution level in the future power system
Page 15
function of secondary control is also to restore power cross-border exchanges to their
programmed set-point values [5]. Operating reserves of this category are typically activated
centrally and can be activated automatically (aFRR) or manually (mFRR).
3) Tertiary frequency control is any (automatic or) manual change in the operation set-points of the
generators (mainly by re-scheduling), in order to restore an adequate secondary control reserve
(FRR) at the right time. The reserves used for the tertiary control are the Replacement Reserves
(RR). Tertiary reserves have an activation time from several minutes up to hours.
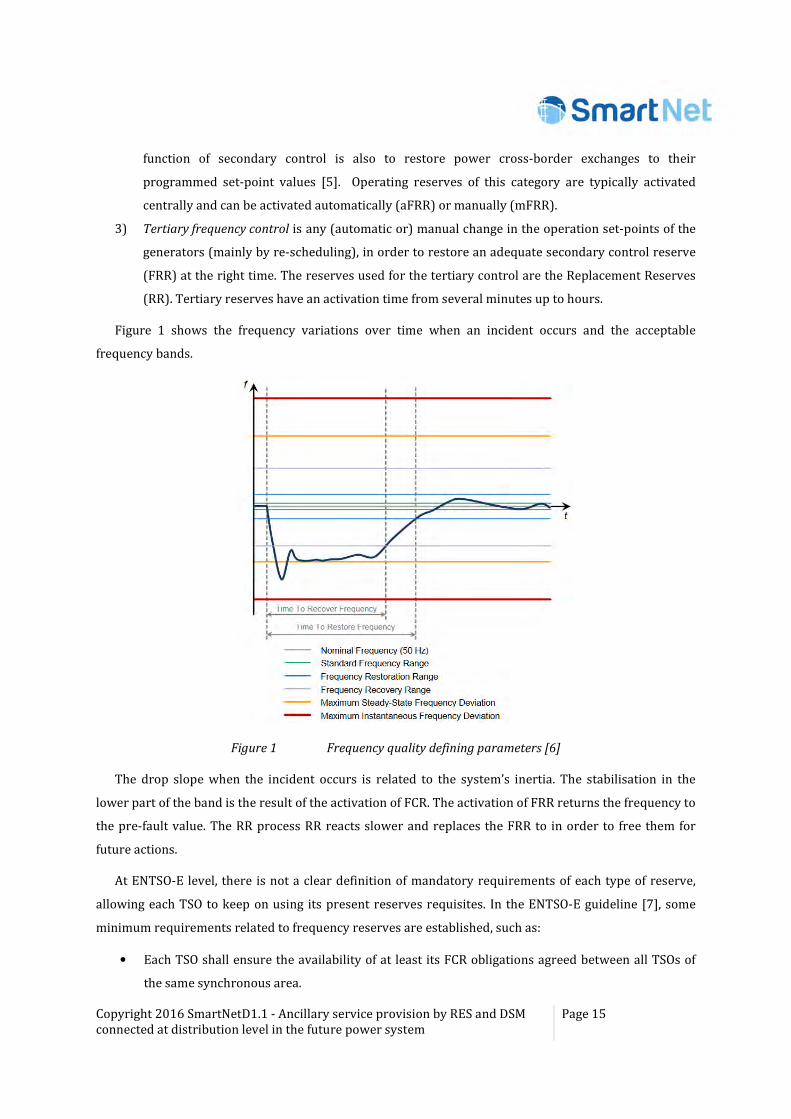
Figure 1 shows the frequency variations over time when an incident occurs and the acceptable
frequency bands.
Figure 1 Frequency quality defining parameters [6]
The drop slope when the incident occurs is related to the system’s inertia. The stabilisation in the
lower part of the band is the result of the activation of FCR. The activation of FRR returns the frequency to
the pre-fault value. The RR process RR reacts slower and replaces the FRR to in order to free them for
future actions.
At ENTSO-E level, there is not a clear definition of mandatory requirements of each type of reserve,
allowing each TSO to keep on using its present reserves requisites. In the ENTSO-E guideline [7], some
minimum requirements related to frequency reserves are established, such as:
• Each TSO shall ensure the availability of at least its FCR obligations agreed between all TSOs of
the same synchronous area.
Copyright 2016 SmartNetD1.1 - Ancillary service provision by RES and DSM connected at distribution level in the future power system
Page 16
• Each TSO of each continental Europe (CE) and Nordic load frequency control area shall
implement an aFRR process and a mFRR process.
• All TSOs of a synchronous area shall have the right to implement a RR process.
In the case of FRR (aFRR/mFRR) and RR, the main differences between countries refer to the naming
and the time horizons considered for each reserve. The only time specification is that FCR must be active
for at least 15 minutes and that aFRR must be activated within 30 seconds. This has made it difficult the
comparison of frequency control services within SmartNet.
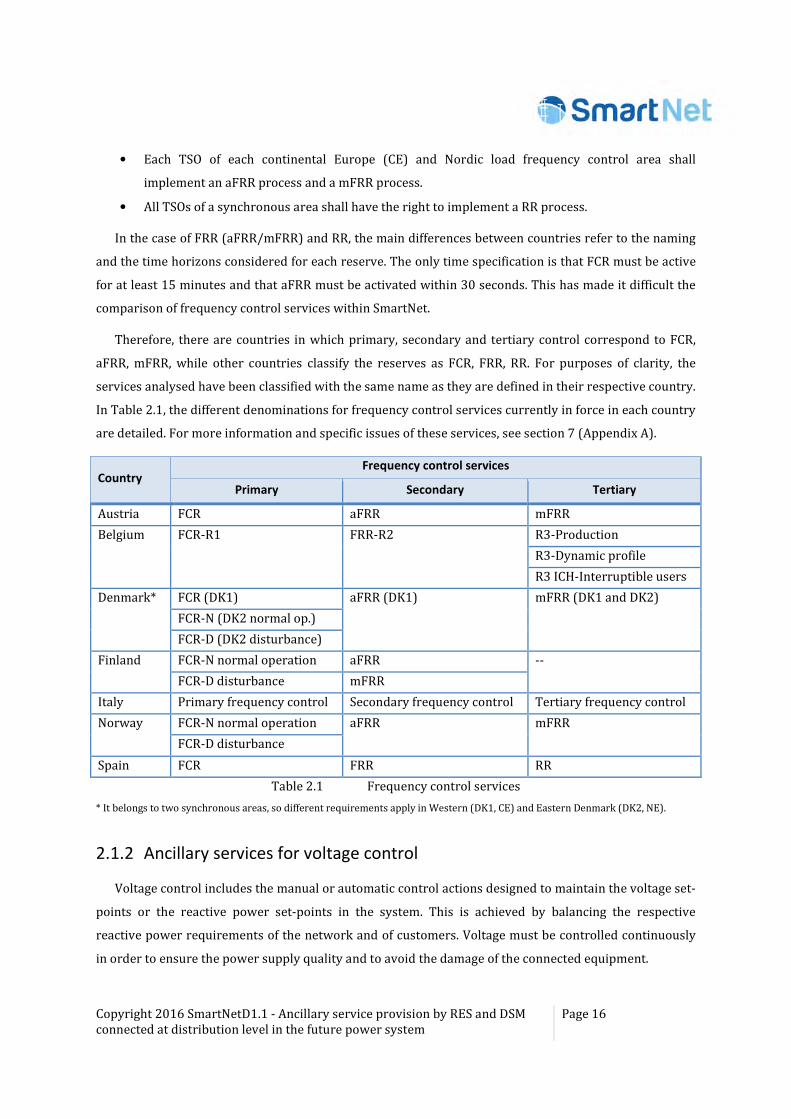
Therefore, there are countries in which primary, secondary and tertiary control correspond to FCR,
aFRR, mFRR, while other countries classify the reserves as FCR, FRR, RR. For purposes of clarity, the
services analysed have been classified with the same name as they are defined in their respective country.
In Table 2.1, the different denominations for frequency control services currently in force in each country
are detailed. For more information and specific issues of these services, see section 7 (Appendix A).
Country Frequency control services
Primary Secondary Tertiary
Austria FCR aFRR mFRR
Belgium FCR-R1 FRR-R2 R3-Production
R3-Dynamic profile
R3 ICH-Interruptible users
Denmark* FCR (DK1) aFRR (DK1) mFRR (DK1 and DK2)
FCR-N (DK2 normal op.)
FCR-D (DK2 disturbance)
Finland FCR-N normal operation aFRR --
FCR-D disturbance mFRR
Italy Primary frequency control Secondary frequency control Tertiary frequency control
Norway FCR-N normal operation aFRR mFRR
FCR-D disturbance
Spain FCR FRR RR
Table 2.1 Frequency control services
* It belongs to two synchronous areas, so different requirements apply in Western (DK1, CE) and Eastern Denmark (DK2, NE).
Ancillary services for voltage control 2.1.2
Voltage control includes the manual or automatic control actions designed to maintain the voltage set-
points or the reactive power set-points in the system. This is achieved by balancing the respective
reactive power requirements of the network and of customers. Voltage must be controlled continuously
in order to ensure the power supply quality and to avoid the damage of the connected equipment.
Copyright 2016 SmartNetD1.1 - Ancillary service provision by RES and DSM connected at distribution level in the future power system
Page 17
Reactive power cannot be transmitted over long distances since it would require a large voltage
gradient [8]. Therefore, voltage control has a local character. Additionally, the foreseen increase of DER
penetration will lead to wider voltage variations, so DSOs will need to procure larger volumes of voltage
control reserves.
Three different control layers are considered for voltage control, depending on the activation time:
1) Primary voltage control is the automatic local control performed in the range of milliseconds
when a deviation of the voltage respect to the set-point is detected. This control maintains the
voltage at the point of common coupling of the fast reacting devices close to their reference value
by means of the automatic voltage regulators (AVRs). These values are fixed on the grounds of
several criteria, such as the maximum reactive power to be provided by each device, security
criterion, voltage drops, etc. The primary voltage control can last up to one minute.
2) Secondary voltage control maintains the voltage at given pilot nodes through the coordination of
various regional reactive power resources. When the voltage at these buses is out of range, the
operator changes the set-points of the voltage regulators in order to recover a voltage profile.
The time of response of the voltage secondary control goes up to one minute and can be
maintained for several minutes.
3) Tertiary voltage control acts on a system-wide basis and in a time scale of 10-30 minutes. Its
objective is the optimisation of the network operation by minimising losses, maintaining the
required voltage, and the replacement of reactive reserves. It also provides the reference set-
point values of the secondary voltage control.
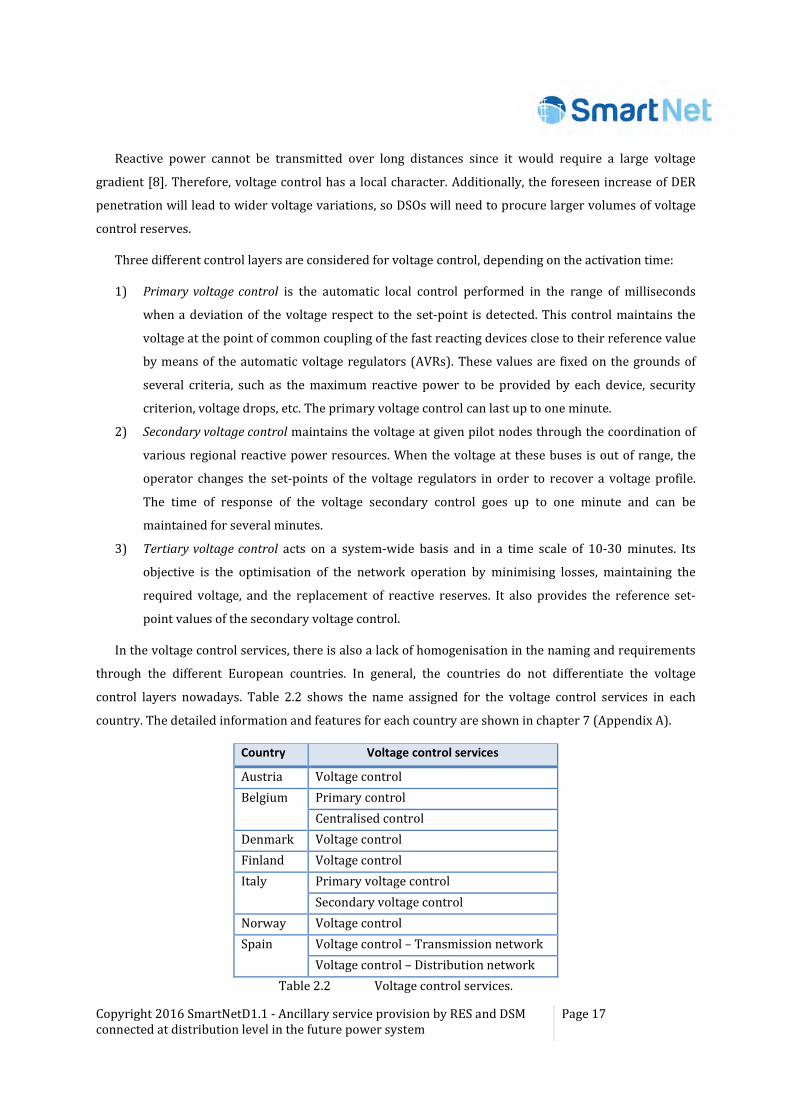
In the voltage control services, there is also a lack of homogenisation in the naming and requirements
through the different European countries. In general, the countries do not differentiate the voltage
control layers nowadays. Table 2.2 shows the name assigned for the voltage control services in each
country. The detailed information and features for each country are shown in chapter 7 (Appendix A).
Country Voltage control services
Austria Voltage control
Belgium Primary control
Centralised control
Denmark Voltage control
Finland Voltage control
Italy Primary voltage control
Secondary voltage control
Norway Voltage control
Spain Voltage control – Transmission network
Voltage control – Distribution network
Table 2.2 Voltage control services.
Copyright 2016 SmartNetD1.1 - Ancillary service provision by RES and DSM connected at distribution level in the future power system
Page 18
Other ancillary services 2.1.3
Additional ancillary services used in several countries are briefly described below:
• Interruptible load service (Belgium, Italy, Norway, Spain): It is a demand management tool
operated by the TSO. Large consumers who purchase energy through the electricity market could
establish bilateral contracts with the system operators to reduce their consumption to balance
the system in exchange of some remuneration (discounts in their electricity bills or payments for
the provision of the service). The regulation considers aspects such as the notice period, the
duration and the number of disconnections per year. In Belgium this service is considered as
part of the tertiary frequency control service. In Spain, the service is provided in a competitive
environment, so that, once they have been pre-qualified, service providers compete with each
other to provide the service to the TSO. More details about the provision of this service can be
found in section 3.1.6.
• Black start (Belgium, Denmark, Italy, Spain): It is to provide the required service to execute the
procedure to recover from a total or partial shutdown. Most power stations cannot restart
without an extra external supply, so the ability of some station to perform a black start is
necessary to achieve the reestablishment of the power supply. Once these power stations have
been started, they can be connected to the rest of the network in order to assist and restore the
stations with no black start capability. Although the black start capability is rarely used, the
existence of black start providers is very important for the security of the system. Currently, this
service exists in the majority of countries but it is seldom clearly defined, provided and
remunerated as an ancillary service.
• Grid losses compensation (Austria, Belgium): During the transmission of electric power through
the network, energy is lost due to several reasons, such as the heating of conductors or the
windings in transformers, etc. In some countries, system operators are responsible for
compensating these losses and, hence, they have already developed specific market mechanisms
to purchase this extra energy (e.g. as Austria and Belgium).
• Strategic reserve (Belgium)/Peak load capacity reserve (Finland): This service consists of
organising a strategic reserve mechanism to cover the structural shortages in generation in the
winter period. It secures the electricity supply in situations where the planned electricity
procurement is not sufficient to cover the expected electricity consumption [9]. The strategic
reserve makes use of load shedding and market generation units. In Finland, the load capacity
can consist of both power plants and facilities capable of providing DR.
• Resolution of technical restrictions (Spain): This is a mechanism integrated in the electricity
market carried out by the TSO consisting in the resolution of the identified technical restrictions
Copyright 2016 SmartNetD1.1 - Ancillary service provision by RES and DSM connected at distribution level in the future power system
Page 19
by means of changes in the schedules of the programmed units and the subsequent process of re-
balancing. This process is performed on a daily, an intraday and a real-time basis.
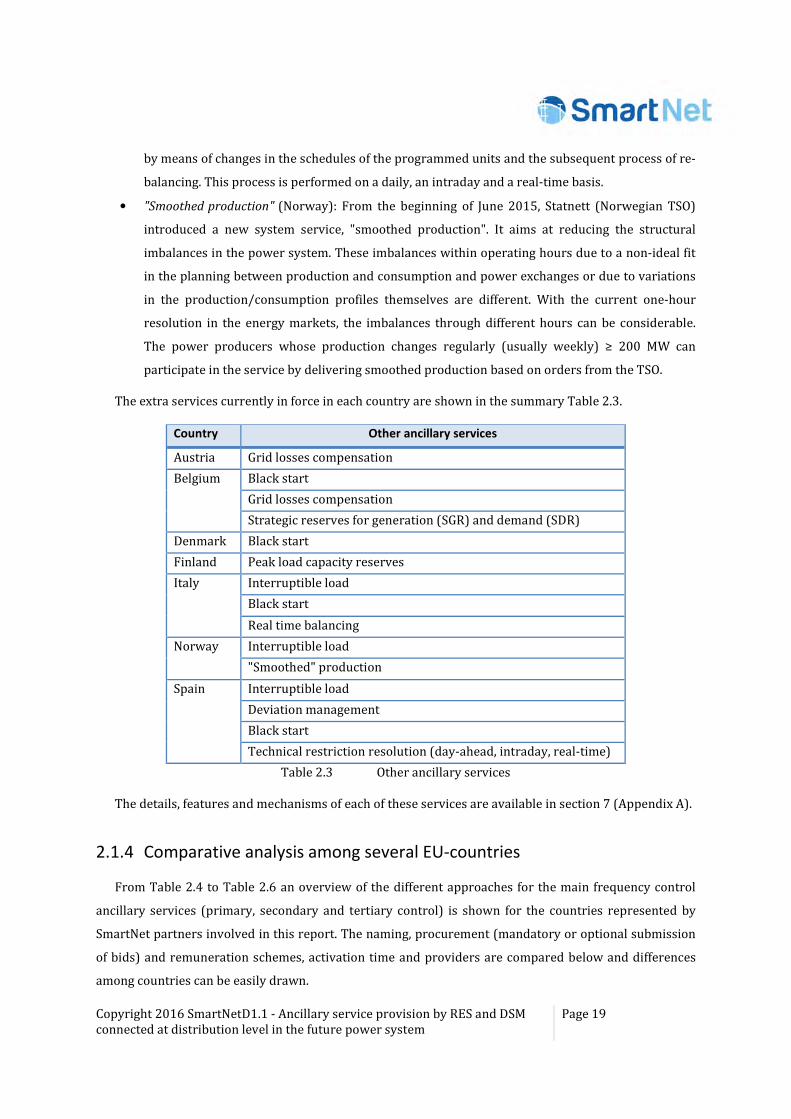
• "Smoothed production" (Norway): From the beginning of June 2015, Statnett (Norwegian TSO)
introduced a new system service, "smoothed production". It aims at reducing the structural
imbalances in the power system. These imbalances within operating hours due to a non-ideal fit
in the planning between production and consumption and power exchanges or due to variations
in the production/consumption profiles themselves are different. With the current one-hour
resolution in the energy markets, the imbalances through different hours can be considerable.
The power producers whose production changes regularly (usually weekly) ≥ 200 MW can
participate in the service by delivering smoothed production based on orders from the TSO.
The extra services currently in force in each country are shown in the summary Table 2.3.
Country Other ancillary services
Austria Grid losses compensation
Belgium Black start
Grid losses compensation
Strategic reserves for generation (SGR) and demand (SDR)
Denmark Black start
Finland Peak load capacity reserves
Italy Interruptible load
Black start
Real time balancing
Norway Interruptible load
"Smoothed" production
Spain Interruptible load
Deviation management
Black start
Technical restriction resolution (day-ahead, intraday, real-time)
Table 2.3 Other ancillary services
The details, features and mechanisms of each of these services are available in section 7 (Appendix A).
Comparative analysis among several EU-countries 2.1.4
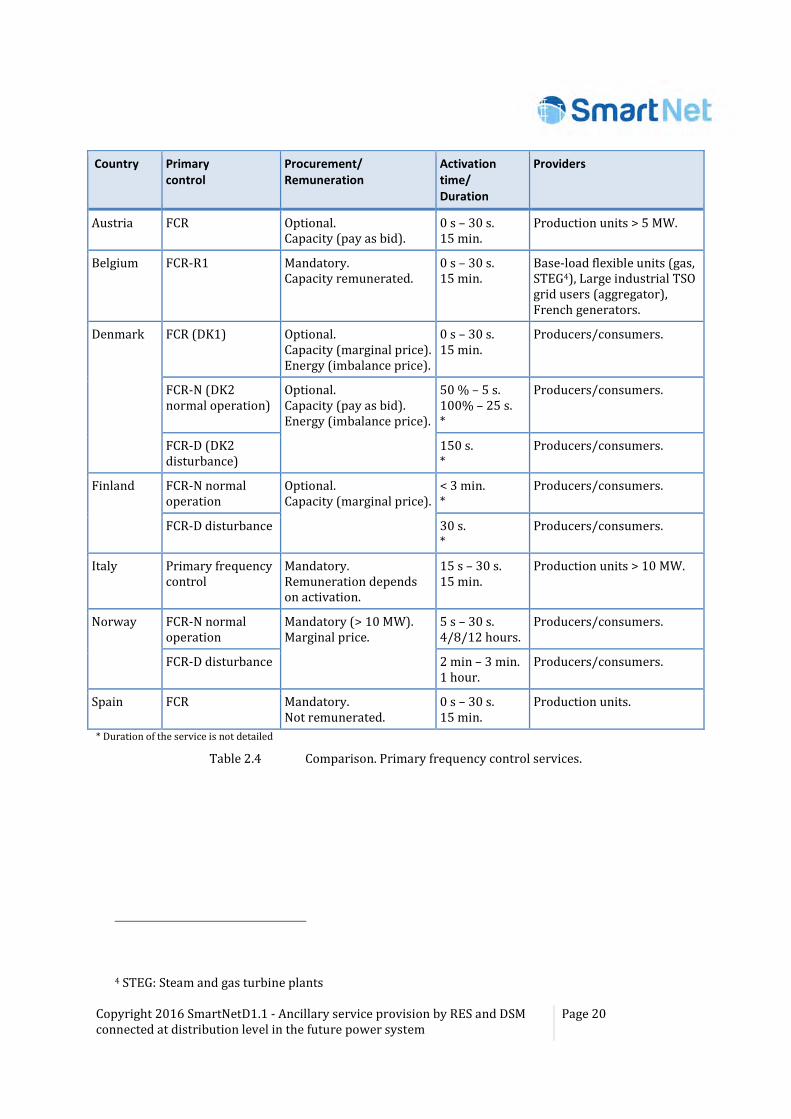
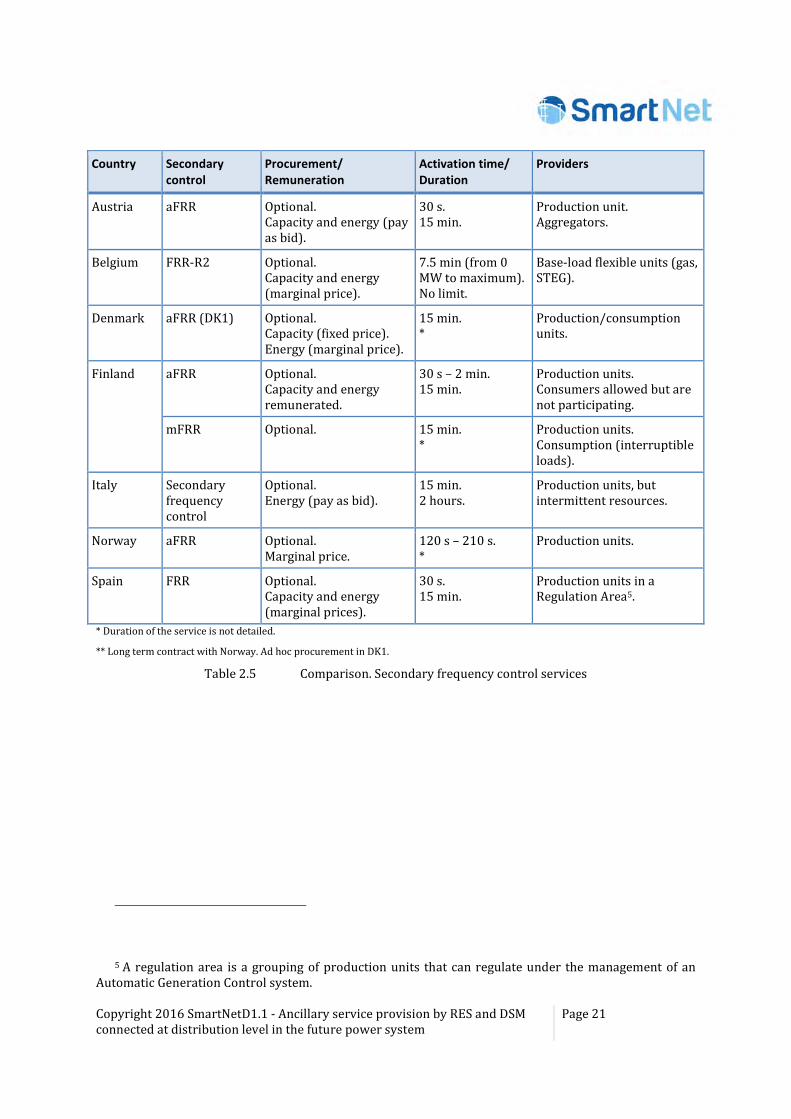
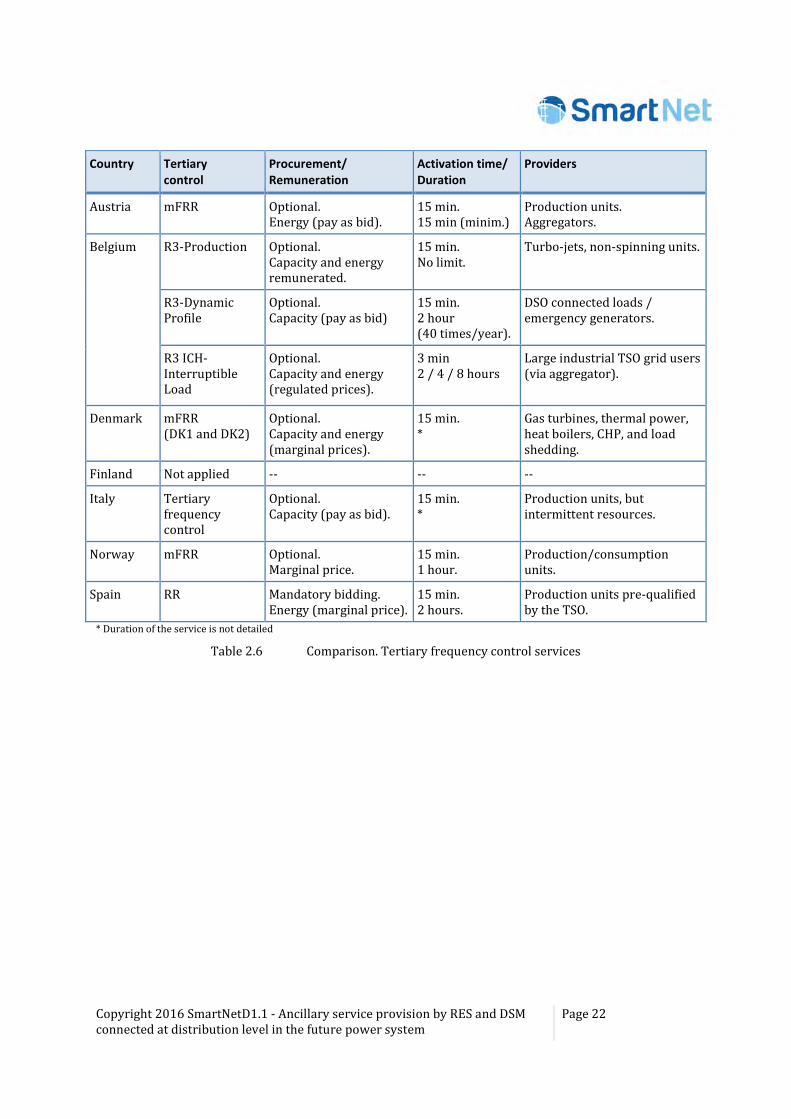
From Table 2.4 to Table 2.6 an overview of the different approaches for the main frequency control
ancillary services (primary, secondary and tertiary control) is shown for the countries represented by
SmartNet partners involved in this report. The naming, procurement (mandatory or optional submission
of bids) and remuneration schemes, activation time and providers are compared below and differences
among countries can be easily drawn.
Copyright 2016 SmartNetD1.1 - Ancillary service provision by RES and DSM connected at distribution level in the future power system
Page 20
Country Primary
control
Procurement/
Remuneration
Activation
time/
Duration
Providers
Austria FCR Optional. Capacity (pay as bid).
0 s – 30 s. 15 min.
Production units > 5 MW.
Belgium FCR-R1 Mandatory. Capacity remunerated.
0 s – 30 s. 15 min.
Base-load flexible units (gas, STEG4), Large industrial TSO grid users (aggregator), French generators.
Denmark FCR (DK1) Optional. Capacity (marginal price). Energy (imbalance price).
0 s – 30 s. 15 min.
Producers/consumers.
FCR-N (DK2 normal operation)
Optional. Capacity (pay as bid). Energy (imbalance price).
50 % – 5 s. 100% – 25 s. *
Producers/consumers.
FCR-D (DK2 disturbance)
150 s. *
Producers/consumers.
Finland FCR-N normal operation
Optional. Capacity (marginal price).
< 3 min. *
Producers/consumers.
FCR-D disturbance 30 s. *
Producers/consumers.
Italy Primary frequency control
Mandatory. Remuneration depends on activation.
15 s – 30 s. 15 min.
Production units > 10 MW.
Norway FCR-N normal operation
Mandatory (> 10 MW). Marginal price.
5 s – 30 s. 4/8/12 hours.
Producers/consumers.
FCR-D disturbance 2 min – 3 min. 1 hour.
Producers/consumers.
Spain FCR Mandatory. Not remunerated.
0 s – 30 s. 15 min.
Production units.
* Duration of the service is not detailed
Table 2.4 Comparison. Primary frequency control services.
4 STEG: Steam and gas turbine plants
Copyright 2016 SmartNetD1.1 - Ancillary service provision by RES and DSM connected at distribution level in the future power system
Page 21
Country Secondary control
Procurement/ Remuneration
Activation time/ Duration
Providers
Austria aFRR Optional. Capacity and energy (pay as bid).
30 s. 15 min.
Production unit. Aggregators.
Belgium FRR-R2 Optional. Capacity and energy (marginal price).
7.5 min (from 0 MW to maximum). No limit.
Base-load flexible units (gas, STEG).
Denmark aFRR (DK1) Optional. Capacity (fixed price). Energy (marginal price).
15 min. *
Production/consumption units.
Finland aFRR Optional. Capacity and energy remunerated.
30 s – 2 min. 15 min.
Production units. Consumers allowed but are not participating.
mFRR
Optional. 15 min. *
Production units. Consumption (interruptible loads).
Italy Secondary frequency control
Optional. Energy (pay as bid).
15 min. 2 hours.
Production units, but intermittent resources.
Norway aFRR Optional. Marginal price.
120 s – 210 s. *
Production units.
Spain FRR Optional. Capacity and energy (marginal prices).
30 s. 15 min.
Production units in a Regulation Area5.
* Duration of the service is not detailed.
** Long term contract with Norway. Ad hoc procurement in DK1.
Table 2.5 Comparison. Secondary frequency control services
5 A regulation area is a grouping of production units that can regulate under the management of an Automatic Generation Control system.
Copyright 2016 SmartNetD1.1 - Ancillary service provision by RES and DSM connected at distribution level in the future power system
Page 22
Country Tertiary control
Procurement/ Remuneration
Activation time/ Duration
Providers
Austria mFRR Optional. Energy (pay as bid).
15 min. 15 min (minim.)
Production units. Aggregators.
Belgium R3-Production Optional. Capacity and energy remunerated.
15 min. No limit.
Turbo-jets, non-spinning units.
R3-Dynamic Profile
Optional. Capacity (pay as bid)
15 min. 2 hour (40 times/year).
DSO connected loads / emergency generators.
R3 ICH- Interruptible Load
Optional. Capacity and energy (regulated prices).
3 min 2 / 4 / 8 hours
Large industrial TSO grid users (via aggregator).
Denmark mFRR (DK1 and DK2)
Optional. Capacity and energy (marginal prices).
15 min. *
Gas turbines, thermal power, heat boilers, CHP, and load shedding.
Finland Not applied -- -- --
Italy Tertiary frequency control
Optional. Capacity (pay as bid).
15 min. *
Production units, but intermittent resources.
Norway mFRR Optional. Marginal price.
15 min. 1 hour.
Production/consumption units.
Spain RR Mandatory bidding. Energy (marginal price).
15 min. 2 hours.
Production units pre-qualified by the TSO.
* Duration of the service is not detailed
Table 2.6 Comparison. Tertiary frequency control services
Copyright 2016 SmartNetD1.1 - Ancillary service provision by RES and DSM connected at distribution level in the future power system
Page 23
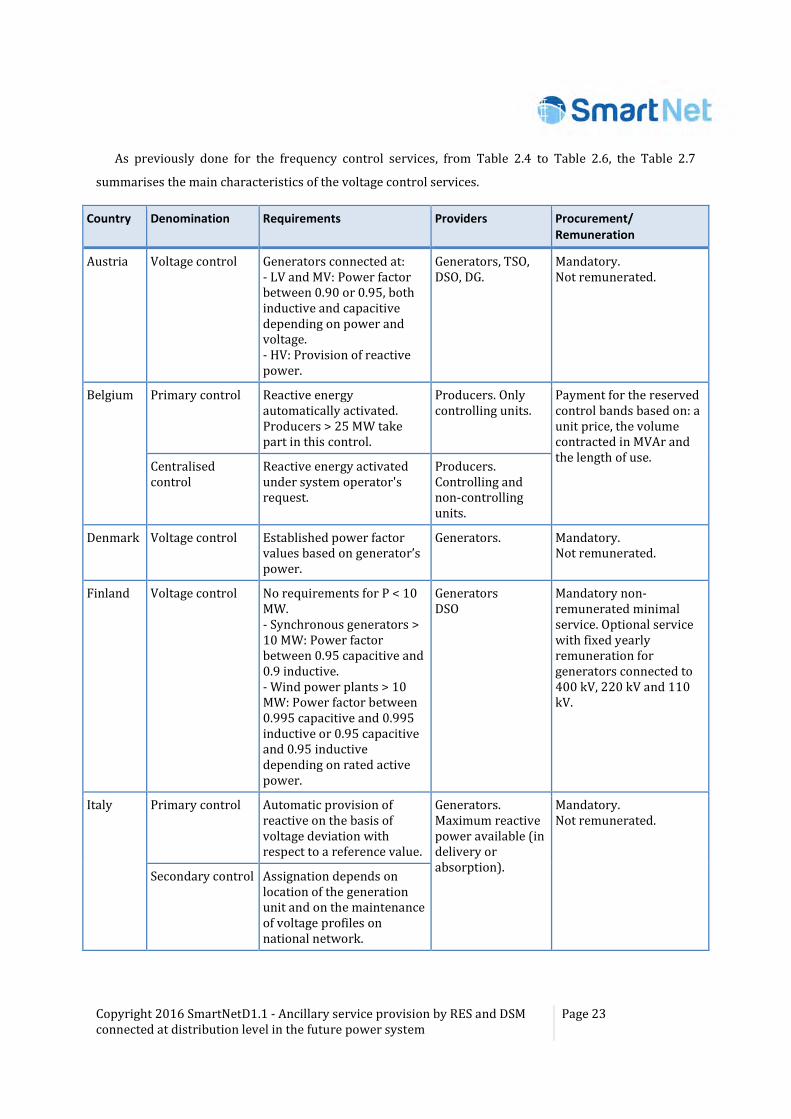
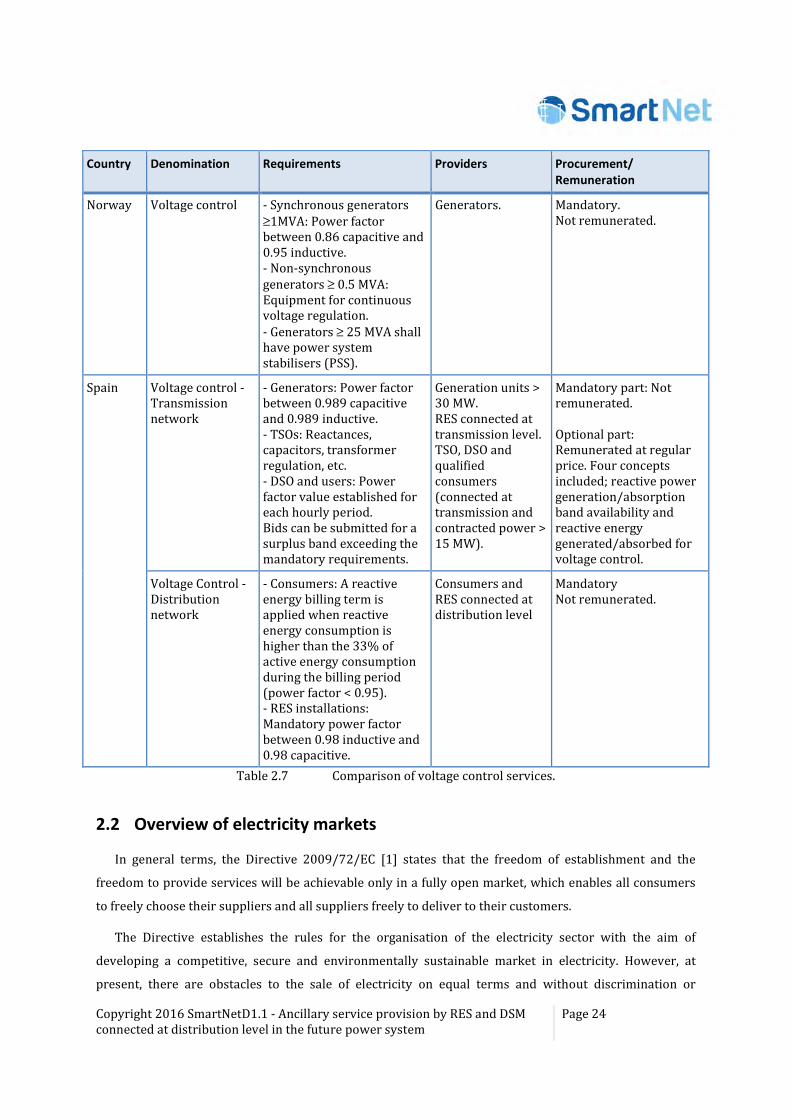
As previously done for the frequency control services, from Table 2.4 to Table 2.6, the Table 2.7
summarises the main characteristics of the voltage control services.
Country Denomination Requirements Providers Procurement/
Remuneration
Austria Voltage control Generators connected at: - LV and MV: Power factor between 0.90 or 0.95, both inductive and capacitive depending on power and voltage. - HV: Provision of reactive power.
Generators, TSO, DSO, DG.
Mandatory. Not remunerated.
Belgium Primary control Reactive energy automatically activated. Producers > 25 MW take part in this control.
Producers. Only controlling units.
Payment for the reserved control bands based on: a unit price, the volume contracted in MVAr and the length of use.
Centralised control
Reactive energy activated under system operator's request.
Producers. Controlling and non-controlling units.
Denmark Voltage control Established power factor values based on generator’s power.
Generators. Mandatory. Not remunerated.
Finland Voltage control No requirements for P < 10 MW. - Synchronous generators > 10 MW: Power factor between 0.95 capacitive and 0.9 inductive. - Wind power plants > 10 MW: Power factor between 0.995 capacitive and 0.995 inductive or 0.95 capacitive and 0.95 inductive depending on rated active power.
Generators DSO
Mandatory non-remunerated minimal service. Optional service with fixed yearly remuneration for generators connected to 400 kV, 220 kV and 110 kV.
Italy Primary control Automatic provision of reactive on the basis of voltage deviation with respect to a reference value.
Generators. Maximum reactive power available (in delivery or absorption).
Mandatory. Not remunerated.
Secondary control Assignation depends on location of the generation unit and on the maintenance of voltage profiles on national network.
Copyright 2016 SmartNetD1.1 - Ancillary service provision by RES and DSM connected at distribution level in the future power system
Page 24
Country Denomination Requirements Providers Procurement/
Remuneration
Norway Voltage control - Synchronous generators ≥1MVA: Power factor between 0.86 capacitive and 0.95 inductive. - Non-synchronous generators ≥ 0.5 MVA: Equipment for continuous voltage regulation. - Generators ≥ 25 MVA shall have power system stabilisers (PSS).
Generators. Mandatory. Not remunerated.
Spain Voltage control - Transmission network
- Generators: Power factor between 0.989 capacitive and 0.989 inductive. - TSOs: Reactances, capacitors, transformer regulation, etc. - DSO and users: Power factor value established for each hourly period. Bids can be submitted for a surplus band exceeding the mandatory requirements.
Generation units > 30 MW. RES connected at transmission level. TSO, DSO and qualified consumers (connected at transmission and contracted power > 15 MW).
Mandatory part: Not remunerated. Optional part: Remunerated at regular price. Four concepts included; reactive power generation/absorption band availability and reactive energy generated/absorbed for voltage control.
Voltage Control - Distribution network
- Consumers: A reactive energy billing term is applied when reactive energy consumption is higher than the 33% of active energy consumption during the billing period (power factor < 0.95). - RES installations: Mandatory power factor between 0.98 inductive and 0.98 capacitive.
Consumers and RES connected at distribution level
Mandatory Not remunerated.
Table 2.7 Comparison of voltage control services.
2.2 Overview of electricity markets
In general terms, the Directive 2009/72/EC [1] states that the freedom of establishment and the
freedom to provide services will be achievable only in a fully open market, which enables all consumers
to freely choose their suppliers and all suppliers freely to deliver to their customers.
The Directive establishes the rules for the organisation of the electricity sector with the aim of
developing a competitive, secure and environmentally sustainable market in electricity. However, at
present, there are obstacles to the sale of electricity on equal terms and without discrimination or
Copyright 2016 SmartNetD1.1 - Ancillary service provision by RES and DSM connected at distribution level in the future power system
Page 25
disadvantages in the EU countries. Currently, different types of market organisation exist and EU
countries may impose on electricity undertakings public service obligations which cover issues such as
security of supply, power quality, price, and environmental protection (including energy efficiency,
energy from renewable sources and climate protection).
EU countries have to define technical safety criteria to ensure the integration of their national markets
at one or more regional levels. In addition, the national regulatory authorities are to cooperate to
guarantee the compatibility of regulatory frameworks between regions. Moreover, countries must define
criteria for the construction of generating capacity in their territory, taking into account aspects such as
the contribution made by the units towards the Commission's ‘20-20-20’ objectives. In order to secure
competition and the supply of electricity at the most competitive price, cross-border access for new
suppliers of electricity from different energy sources, as well as for new providers of power generation,
has to be facilitated. Ultimately, in a single market, roles and responsibilities should converge across
Member States.
With those purposes, the roles and responsibilities of each electricity market participant are described
in this Directive. In particular, as regards the TSOs, the Directive states that the TSOs shall be responsible
for ensuring a secure, reliable and efficient electricity system and, in that context, for ensuring the
availability of all necessary ancillary services. In order to ensure effective market access for all market
players, non-discriminatory and cost-reflective balancing mechanisms are necessary. TSOs should
facilitate participation of final customers and final customers’ aggregators in reserve and balancing
markets. Regulatory authorities shall be responsible for fixing the methodologies used to establish the
terms and conditions for the provision of these balancing services.
With regard to the DSOs, the Directive states that each DSO shall procure any service for its system
according to transparent, non-discriminatory and market based procedures.
Member States should encourage the modernisation of distribution networks, which should be built in
a way that they encourage decentralised generation and energy efficiency. The current market reality is
that the ancillary services markets are designed around the limitations and properties of large centralised
power plants. The regulatory environment affecting the distribution activity is still strongly in favour of
traditional network investments and thus, in practise, it generally prevents using ancillary services from
DERs as an alternative, even if they could offer better response speed, better combined reliability,
lower losses and lower costs (variable and total). Currently, there are initiatives to enable better access of
DERs to the ancillary services markets, but, at this time, it is unknown how these markets will eventually
be developed in the long term.
Sections from 2.2.1 to 2.2.4 show the main characteristics and the analysis of current market
mechanisms in some European countries (where the physical pilots will be established within SmartNet
project, that is, Denmark, Italy and Spain). This is intended to envisage how the future development of
Copyright 2016 SmartNetD1.1 - Ancillary service provision by RES and DSM connected at distribution level in the future power system
Page 26
market regulations in the SmartNet horizon (2030) could be, since no disruptive changes in the market
structures are foreseen. Additionally, other European countries have also been analysed and the results
are shown in section 8 (Appendix B).
2.2.1 Market rules
The market rules are defined to facilitate the trading of products and services, and to improve the
competition among the different stakeholders involved. At the same time, these rules are intended to
reduce the investors’ risks, by minimising uncertainties and defining the incentives in order to give
support for an efficient operation of the system. Several common topics are gathered in the definition of
market rules:
1) Power trading mechanisms:
• Type of product: FRR, RR, voltage control, load shedding service, etc.
• Market participants: All the participants are identified as well as the requirements for accessing
to the market. Their responsibilities and scope of action are delimited too.
• Compulsory nature/Free submission of bids to the market.
• Arrangement of electricity trading in the wholesale market: Electricity pools
(compulsory/voluntary) or bilateral contracts model.
• Matching process: Establishment of the algorithm and the process to select the best offers in
order to optimise the costs for the provision of the ancillary services.
• Communication procedure to inform participants whether their offers have been accepted or not.
• Clearing: Calculation of the price to be paid to the service providers.
2) Power trading time frames: This part of the market rules mainly includes the definition of the
times for the bidding process as well as the closure time where the contracts are fixed: day-ahead,
intraday or balancing (for real-time provision of the services).
2.2.2 Electricity market – Denmark
Both Danish and EU authorities have supported the liberalisation of the electricity market in order to
stimulate free competition in electricity production and trade. Some of the main consequences of this
liberalisation were the unbundling of the transmission grid from electricity generation and the
incorporation of many new players in the electricity market. The grid ownership and operation is now
independent from generation activities, and all electricity market players have equal rights to use it.

Copyright 2016 SmartNetD1.1 - Ancillary service provision by RES and DSM connected at distribution level in the future power system
Page 27
The Danish wholesale market is a part of the Nordic market model and most of the electricity trading
takes place on the common Nordic power exchange, Nord Pool, which is owned by the TSOs in the Nordic
countries. The power exchange has two market places for electricity, namely Elspot and Elbas:
• Trading at Elspot (day-ahead market) is based on the auction principle, which means that once a
day Nord Pool will find a market price for each hour of the next day for the various price areas by
matching purchase and sales bids.
• In the Elbas market (intraday market), players can trade themselves into balance with
continuous trading after Elspot is closed.
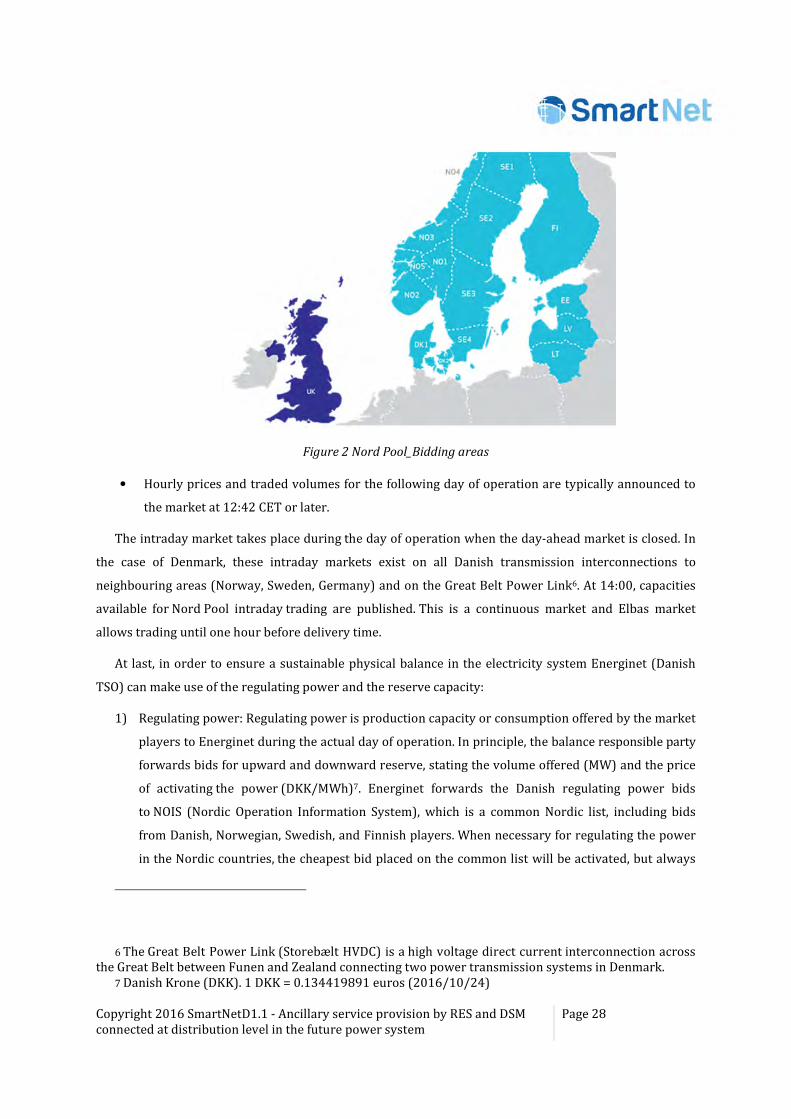
Nord Pool has divided the Nordic market area into bidding areas. All physical trading between these
areas must take place via Nord Pool in order to optimise the flow, taking capacity restrictions in the
transmission grid into consideration. In the spot market, Nord Pool uses implicit auction, which means
that transfer capacity is allocated while electricity is traded.
Trading in the Nord Pool spot market follows a fixed time schedule that is repeated every day:
• Before 10:00, the Nordic TSOs announces how much capacity is available for the spot market for
the next day.
• Before 12:00, the electricity suppliers and producers submit purchase and sales bids for the next
day to Nord Pool.
• Subsequently, Nord Pool calculates the price. Initially, Nord Pool adds up all the buying and
selling bids arriving at the price that strikes a balance between purchase and sale in the whole
area (system price). If sufficient transfer capacity between the areas is available, a common
market price equal to the system price will become effective in all the areas. This is seldom the
case.
• In situations of insufficient transfer capacity (congestion), the Nordic countries are divided into
different price areas (market splitting). For each Nordic country, the local TSO decides, which
bidding areas the country is divided into. Eastern Denmark and Western Denmark are always
treated as two different bidding areas.
• The different bidding areas help indicate constraints in the transmission systems, and ensure
that regional market conditions are reflected in the price. Due to bottlenecks in the transmission
system, the bidding areas may get different prices called area price. Figure 2 shows the current
bidding areas in the Nord Pool market.
Copyright 2016 SmartNetD1.1 - Ancillary service provision by RES and DSM connected at distribution level in the future power system
Page 28
Figure 2 Nord Pool_Bidding areas
• Hourly prices and traded volumes for the following day of operation are typically announced to
the market at 12:42 CET or later.
The intraday market takes place during the day of operation when the day-ahead market is closed. In
the case of Denmark, these intraday markets exist on all Danish transmission interconnections to
neighbouring areas (Norway, Sweden, Germany) and on the Great Belt Power Link6. At 14:00, capacities
available for Nord Pool intraday trading are published. This is a continuous market and Elbas market
allows trading until one hour before delivery time.
At last, in order to ensure a sustainable physical balance in the electricity system Energinet (Danish
TSO) can make use of the regulating power and the reserve capacity:
1) Regulating power: Regulating power is production capacity or consumption offered by the market
players to Energinet during the actual day of operation. In principle, the balance responsible party
forwards bids for upward and downward reserve, stating the volume offered (MW) and the price
of activating the power (DKK/MWh)7. Energinet forwards the Danish regulating power bids
to NOIS (Nordic Operation Information System), which is a common Nordic list, including bids
from Danish, Norwegian, Swedish, and Finnish players. When necessary for regulating the power
in the Nordic countries, the cheapest bid placed on the common list will be activated, but always
6 The Great Belt Power Link (Storebælt HVDC) is a high voltage direct current interconnection across the Great Belt between Funen and Zealand connecting two power transmission systems in Denmark.
7 Danish Krone (DKK). 1 DKK = 0.134419891 euros (2016/10/24)
Copyright 2016 SmartNetD1.1 - Ancillary service provision by RES and DSM connected at distribution level in the future power system
Page 29
taking into consideration possible constraints in the interconnections between the countries.
Energinet will always be responsible for activating the Danish regulating bids. Regulating power
and balancing power are priced at marginal prices. Current regulating power and balancing
power prices are published at Nord Pool Spot's webpage [10].
2) Reserve capacity (ancillary services): Reserve capacity is the production or the flexible
consumption capacity offered in advance by the balance responsible parties to Energinet, who
pays players a fixed availability payment for being available and for submitting bids for
upward/downward regulation to the regulating power market. This allows Energinet to ensure
that enough reserve capacity is available. Denmark is the only country in Europe that belongs to
two synchronous areas (the Continental synchronous area and the Nordic synchronous area) and
different requirements apply in Western Denmark (DK1) and in Eastern Denmark (DK2). For that
reason, the requirements to be met by suppliers of ancillary services vary slightly depending on
whether the services are to be supplied in Eastern or in Western Denmark. The ancillary services
to be delivered in each zone are:
o DK1:
� FCR (Primary reserves)
� aFRR (Secondary reserves, Load Frequency Control (LFC))
� mFRR (Manual reserves)
o DK2:
� FCR-D (Frequency-controlled disturbance reserve)
� FCR-N (Frequency-controlled normal operation reserve)
� mFRR (Manual reserves)
Bids must be submitted as upward and downward regulation for FCR. FCR-N is procured
symmetrically and FCR-D and mFRR is only procured as up regulation.
For more information about regulation of ancillary services in Denmark, see the Continental Europe
operation handbook. P1 – Policy 1: Load frequency control and performance [11], the Nordic System
Operation Agreement [12] and Energinet.dk's regulations for grid connection [13].
2.2.3 Electricity market – Italy
In Italy the regulation that controls the dispatching activity and the related ancillary services market is
disciplined by deliberation 111/06 [14] of the national Regulatory Authority. The technical regulation for
the operation of the system is instead provided by the Grid Code [15] for transmission, dispatching,
development and security of grid issued by the TSO Terna. This document provides all technical
regulations for access to the grid, development, management and maintenance of the grid, performance of
Copyright 2016 SmartNetD1.1 - Ancillary service provision by RES and DSM connected at distribution level in the future power system
Page 30
dispatching services, supply measurement and settlement services for financial charges connected to the
aforementioned services and security of national electricity system.
The Day-Ahead Market (DAM), [16], hosts most of the electricity sale and purchase transactions and it
is managed by the market operator (Gestore Mercati Energetici– GME). Participants submit offers/bids
where they specify the quantity and the minimum/maximum price at which they are willing to
sell/purchase. Bids/asks are accepted after the closure of the market sitting based on the economic
merit-order criterion and taking into account transmission capacity limits between zones. The Italian
transmission grid is divided into several zones: eleven foreign virtual zones, six geographical zones and
five poles of limited production (national virtual zones)8. All the supply offers and the demand bids
belonging to foreign virtual zones that are accepted in the day-ahead market (DAM) are valued at the
marginal clearing price of the zone to which they belong. This price is determined, for each hour, by the
intersection of the demand and supply curves. This is differentiated from one zone to another in case of
congestion. The accepted demand bids pertaining to consumption units belonging to Italian geographical
zones are valued at the “Prezzo Unico Nazionale” (PUN – national single price). This price is equal to the
average of the prices corresponding to the geographical zones, weighted for the quantities purchased in
these zones. The day-ahead market session relevant for the day D starts at 08:00 of D-9 and closes at
09:15 of the day D-1 (i.e. the day-ahead).
The intra-day spot market (also managed by GME), whose sessions take place after the closure of the
day-ahead market session, has the purpose of adjusting the schedule output of the day-ahead market for
several reasons. For example, the day-ahead market schedule could violate some technical constraints of
generation/consumption units (e.g. ramp rates, start-up / shut-down times, etc.), making it not feasible.
Moreover, since the intra-day market sessions take place closer to real-time, market players could benefit
from new information that has become available after the closure of the day-ahead market session (e.g.
failures of plants, new forecasts of renewable generation or of consumption, etc.) and that would make
necessary to adjust the day-ahead market schedule, in order to avoid imbalances.
For these reasons, the intra-day market typically deals with volumes much lower than the day-ahead
ones. The intra-day market (Mercato Infragiornaliero - MI) allows participants to change the schedules
defined in the day-ahead market through additional demand bids or supply offers. This way, a generator
can sell additional energy or buy-back part of the energy already sold in the day-ahead market, while a
load can buy additional energy or re-sell part of the energy already bought in the day-ahead market.
8 The current existing zones can be checked in: https://www.mercatoelettrico.org/en/mercati/MercatoElettrico/Zone.aspx
Copyright 2016 SmartNetD1.1 - Ancillary service provision by RES and DSM connected at distribution level in the future power system
Page 31
The MI consists of four sessions: MI1, MI2, MI3 and MI4. The sessions are organised in the form of
implicit auctions of electric energy, like the day-ahead one, with different closure times and in sequence.
• The session of MI1 takes place after the results of the day-ahead market have been published: it
opens at 10:45 of the day before the day of delivery and closes at 12:30 of the same day. The
results of MI1 are notified to participants and published by 13:00 of the day before the day of
delivery.
• The session of MI2, like MI1, opens at 10:45 of the day before the day of delivery, but closes at
14:40 of the same day. The results of MI2 are notified to participants and published by 15:10 of
the day before the day of delivery.
• The session of MI3 opens at 16:00 of the day before the day of delivery and closes at 07:30 of the
day of delivery. Offers / bids refer to the hours from noon to midnight of the day of delivery. The
results of MI3 are notified to participants and published by 8:00 of the day of delivery.
• The session of MI4, like MI3, opens at 16:00 of the day before the day of delivery and closes at
11:45 of the day of delivery. Offers / bids refer to the hours from 16:00 to midnight of the day of
delivery. The results of MI4 are notified to participants and published by 12:15 of the day of
delivery.
• The sessions of the intra-day market are based on price-setting rules that are consistent with
those of the day-ahead market, including zonal prices and congestion management. Nevertheless,
unlike in the day-ahead market, the National Single Price (PUN) is not calculated and all
purchases and sales are valued at the zonal price.
In the intra-day market it is also possible to submit the so-called “balanced offers”, composed of sale
offers at a price equal to zero and purchase bids without price indication, submitted even by different
market participants, but referring to the same hour and to “offer points” belonging to the same
geographical or virtual zone, in such a way that the sold quantity is equal to the purchased one. “Balanced
offers” are typically used by each large generation company to re-dispatch the amount of energy sold in
the day-ahead market among its generators located in a specific zone, in order to better optimise the
scheduling of its portfolio.
After the closure of each session of the intra-day market, GME (as done after the closure of the day-
ahead market) notifies the Italian TSO Terna of the results that are relevant for dispatching: flows and
updated injection and withdrawal schedules. These results are required by Terna to determine
information about residual transmission capacities between zones for subsequent market sessions.
Once the intra-day sessions are closed the balancing markets are used. The ancillary services market
(Mercato per il Servizio di Dispacciamento - MSD) is the market where Terna - as the Italian TSO -
procures the resources needed to manage, operate, monitor and control the power system (relief of intra-
zonal congestions, creation of power reserve, real-time balancing). In the MSD, Terna enters into
Copyright 2016 SmartNetD1.1 - Ancillary service provision by RES and DSM connected at distribution level in the future power system
Page 32
purchase and sale contracts with the aim of obtaining resources for dispatching services and acts as
central counterpart to the transactions. Bids/offers must refer to offer points (i.e. generation units)
qualified to provide ancillary services in the MSD and must be submitted by the respective dispatching
users directly (without agents acting on their behalf). All accepted bids/offers are remunerated at the
offered price (pay-as-bid methodology).
The MSD consists of a scheduling stage, ex-ante MSD, and a real time stage, the balancing market MB
(MB-“Mercato del Bilanciamento”):
1) In the ex-ante MSD, Terna accepts energy demand bids and supply offers in order to relieve
residual intra-zonal congestions and create reserve margins. In particular, the ex-ante MSD
consists of four scheduling sub-stages: MSD1, MSD2, MSD3 and MSD4. In this phase, Terna accepts
tertiary reserve bids and offers to define an optimal scheduling, relieving network congestions
and creating suitable secondary and tertiary reserve margins for the real time operation.
2) The balancing market (Mercato del Bilanciamento - MB) takes place in different sessions, during
which Terna selects bids/offers for the groups of hours of the same day on which the related MB
session takes place. In the MB, Terna accepts energy demand bids and supply offers in order to
provide secondary regulation and to balance energy injections and withdrawals into/from the
grid in real time. The Balancing Market is currently divided into five sessions in which Terna
selects offers referring to groups of hours the same day that takes place on the MB session. For
the first session of the MB, tenders submitted by operators in the previous ex-ante MSD session
are considered valid. For other sessions of the MB, the sessions for the submission of tenders are
all opened at 22:30 of the day before the delivery day (and in any case not before the results of the
previous ex-ante MSD session have been announced) and close one hour and a half before the first
hour that can be traded at each session.
In Italy, only generating units can be qualified to provide ancillary services (no consumption units
allowed), but they must have the following features: being a generation unit with a rated power greater
than 10 MVA, not being a non-dispatchable renewable energy source (RES), not being a generation unit
under test period, being able to increase/reduce at least 10 MW of power generation within 15 minutes
from the start of the service and for hydro power plants, being able to produce at the maximum power for
at least 4 hours.
Further technical details and limitations for the provision of ancillary services can be found in the grid
code of the Italian TSO Terna [15].
As summary, Figure 3 shows the time schedule, gate closure and application horizon of the Italian
electricity market sessions.
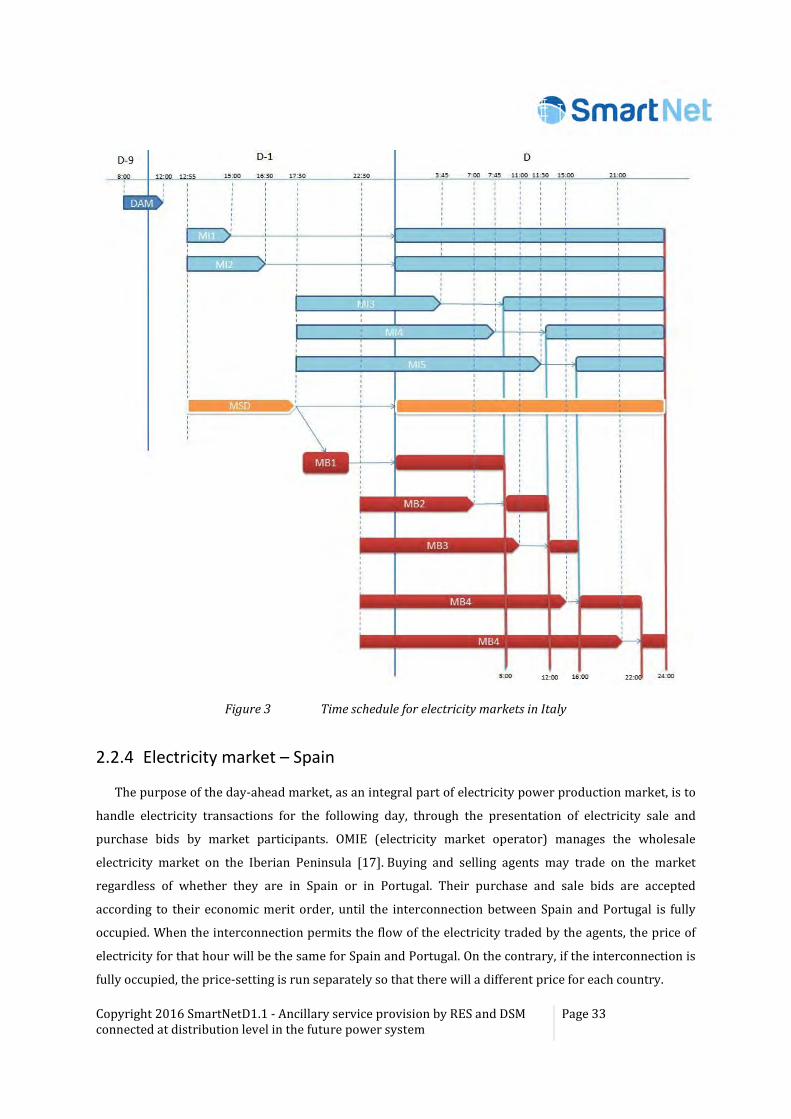
Copyright 2016 SmartNetD1.1 - Ancillary service provision by RES and DSM connected at distribution level in the future power system
Page 33
Figure 3 Time schedule for electricity markets in Italy
2.2.4 Electricity market – Spain
The purpose of the day-ahead market, as an integral part of electricity power production market, is to
handle electricity transactions for the following day, through the presentation of electricity sale and
purchase bids by market participants. OMIE (electricity market operator) manages the wholesale
electricity market on the Iberian Peninsula [17]. Buying and selling agents may trade on the market
regardless of whether they are in Spain or in Portugal. Their purchase and sale bids are accepted
according to their economic merit order, until the interconnection between Spain and Portugal is fully
occupied. When the interconnection permits the flow of the electricity traded by the agents, the price of
electricity for that hour will be the same for Spain and Portugal. On the contrary, if the interconnection is
fully occupied, the price-setting is run separately so that there will a different price for each country.
Copyright 2016 SmartNetD1.1 - Ancillary service provision by RES and DSM connected at distribution level in the future power system
Page 34
Every day, two hours before the closure of the day-ahead market (12:00 h), the TSO (REE) publishes
the foreseen demand for every hour of the following day and the power exchanges between the Spanish
grid and the neighbouring ones. Then, the market operator clears the market and sends the information
of the base schedule to the TSO.
Based on this base schedule and including the information of the generation and consumption
programs established by bilateral agreements, the TSO determines the Daily Base Operating Schedule
(PDBF).
This program also needs to be feasible in physical terms, so a validation from the standpoint of
technical viability is performed. This process is known as technical constraints resolution and it ensures
that the market results can be technically accommodated. This means that the daily market results may
be altered slightly, affecting around 4-5 % of the energy. To execute the technical restrictions process, the
TSO analyses the generation programs of the units and the expected international exchanges in order to
guarantee that energy is supplied with quality, safety and reliability. This process is repeated after every
intra-day market session.
In order to participate in this technical constraints resolution, the generation power plants must have
presented their corresponding upward and downward bids. This process has two stages:
• In the first stage, some generating units or pumping stations (upward/downward) are re-
dispatched, considering the base case and the N-1 and N-2 criterion. The upward clearing price is
the one offered in the bidding process for technical constraints. The downward clearing price is
established according to the results of the day-ahead market.
• In the second stage, a new re-dispatching of the generation units and the pumping stations is
done for balancing the global generation and demand programs. The upward clearing price is
the one offered in the upward bid. The downward clearing price is the specific one of the
downward bid.
Once the technical restrictions have been solved, the TSO publishes the provisional daily
viable schedule, together with the limits to the generation units in order to avoid new restrictions. In
parallel, the TSO also publishes the secondary reserve needs and several hours later the assignation of
this reserve is carried out among the available production units.
After the day-ahead market, agents may once again buy and sell electricity on the intraday market, i.e.
at different trading sessions some hours earlier than real time. There are six trading sessions based on
auctions such as those described for the daily market, where the volume of energy and each hourly price
are determined by the point where supply and demand meet. These sessions enable all the agents
(especially small ones) to adjust their position easily and under the same conditions as any other
operator within the same day as the physical delivery. In general, the Spanish intraday market records
Copyright 2016 SmartNetD1.1 - Ancillary service provision by RES and DSM connected at distribution level in the future power system
Page 35
similar prices to those arising in the day-ahead market. Intraday markets permit buying and selling
agents to readjust their commitments up to four hours ahead of real time. After each intra-day session a
new Final Hourly Schedule is launched.
Once each intra-day market session is closed, market parties cannot trade electricity to make
adjustments to their schedules. However, they must notify any unavailability of generation units to the
TSO. In addition, the TSO continuously monitors the real-time generation of wind power and real-time
consumption, in order to check their differences to the traded volumes in the day-ahead and intraday
markets. When these differences, together with the non-availabilities communicated by producers, create
an imbalance of more than 300MWh during several hours, the TSO calls for the imbalance management
market, where producers can send offers to compensate such expected imbalances. If the difference is not
that high, the TSO can use the offers for tertiary regulation.
In real-time operation, frequency control services (first, the automatic secondary frequency
mechanisms and, if they are not enough to restore nominal frequency, the tertiary reserve) act, cancelling
the imbalances that come either from forecasting errors for production and/or demand, or from
unexpected events in the production units, as well as from the deviations over the program in the
interconnection between Spain and France.
The Spanish electricity market schedule [18] is shown in Figure 4, where the green bars represent the
execution periods and the purple bars represent the application horizon for every market. The day-ahead
and intraday markets are displayed in the upper area and the ancillary services’ markets in the lower
area.
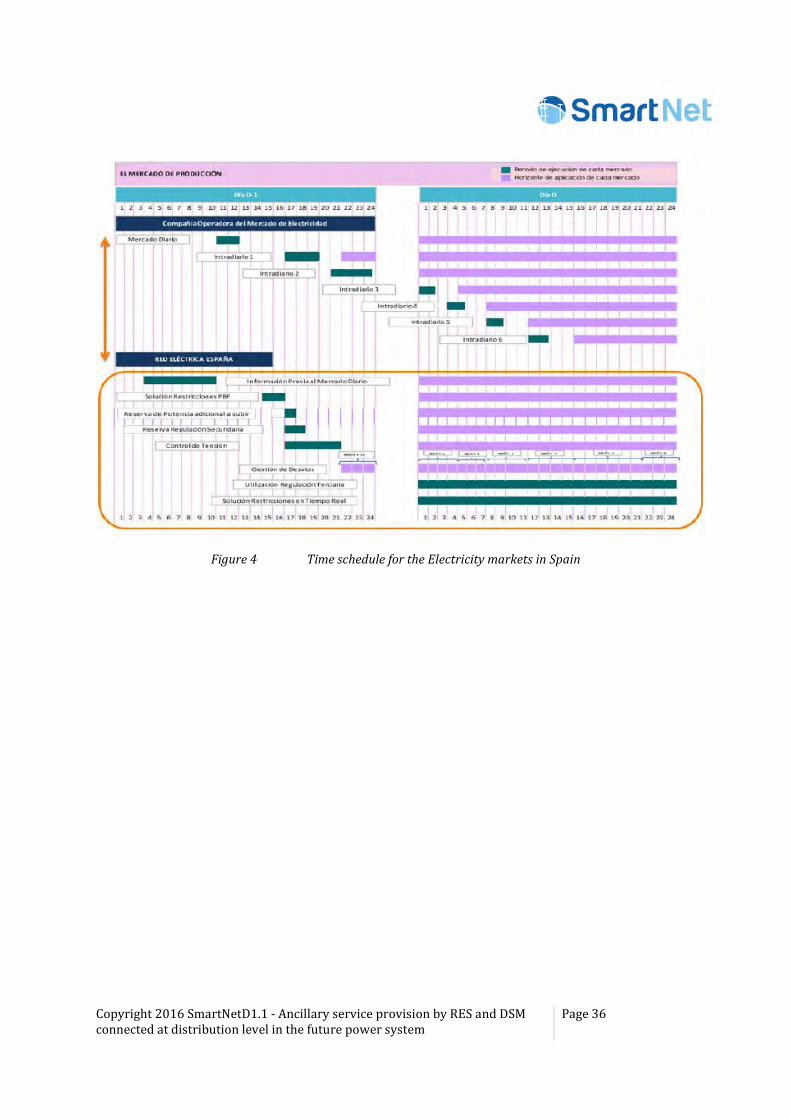
Copyright 2016 SmartNetD1.1 - Ancillary service provision by RES and DSM connected at distribution level in the future power system
Page 36
Figure 4 Time schedule for the Electricity markets in Spain
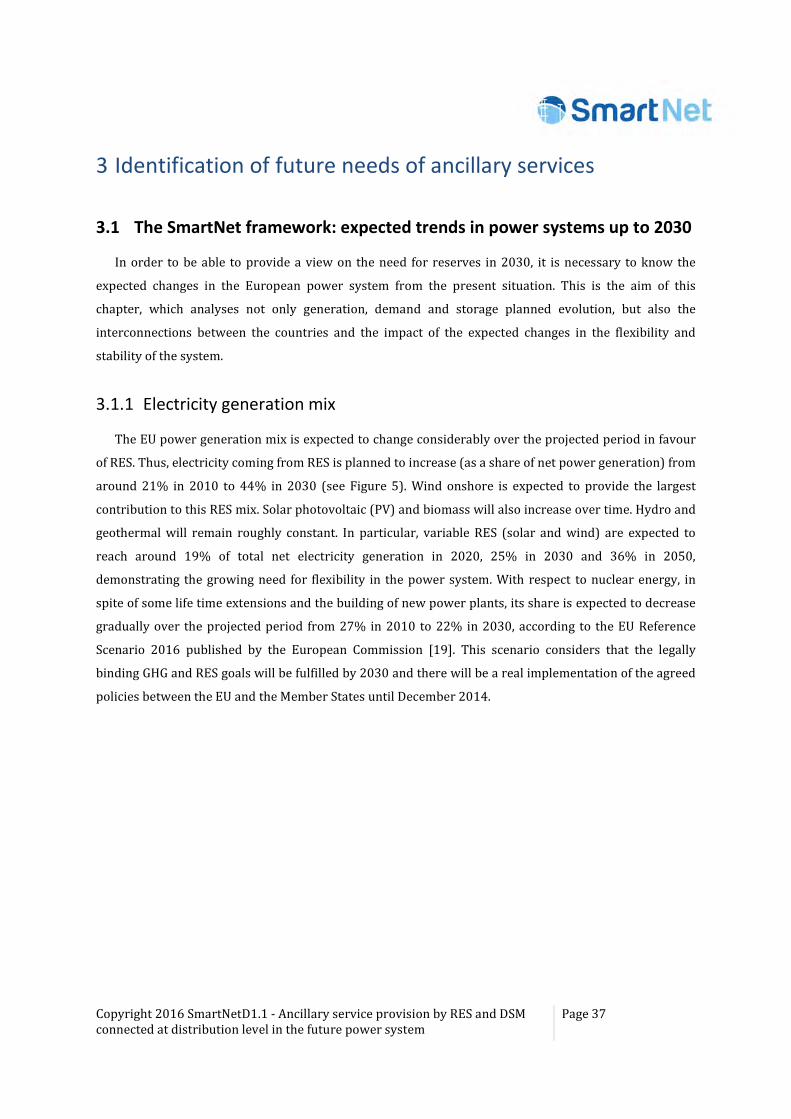
Copyright 2016 SmartNetD1.1 - Ancillary service provision by RES and DSM connected at distribution level in the future power system
Page 37
3 Identification of future needs of ancillary services
3.1 The SmartNet framework: expected trends in power systems up to 2030
In order to be able to provide a view on the need for reserves in 2030, it is necessary to know the
expected changes in the European power system from the present situation. This is the aim of this
chapter, which analyses not only generation, demand and storage planned evolution, but also the
interconnections between the countries and the impact of the expected changes in the flexibility and
stability of the system.
3.1.1 Electricity generation mix
The EU power generation mix is expected to change considerably over the projected period in favour
of RES. Thus, electricity coming from RES is planned to increase (as a share of net power generation) from
around 21% in 2010 to 44% in 2030 (see Figure 5). Wind onshore is expected to provide the largest
contribution to this RES mix. Solar photovoltaic (PV) and biomass will also increase over time. Hydro and
geothermal will remain roughly constant. In particular, variable RES (solar and wind) are expected to
reach around 19% of total net electricity generation in 2020, 25% in 2030 and 36% in 2050,
demonstrating the growing need for flexibility in the power system. With respect to nuclear energy, in
spite of some life time extensions and the building of new power plants, its share is expected to decrease
gradually over the projected period from 27% in 2010 to 22% in 2030, according to the EU Reference
Scenario 2016 published by the European Commission [19]. This scenario considers that the legally
binding GHG and RES goals will be fulfilled by 2030 and there will be a real implementation of the agreed
policies between the EU and the Member States until December 2014.
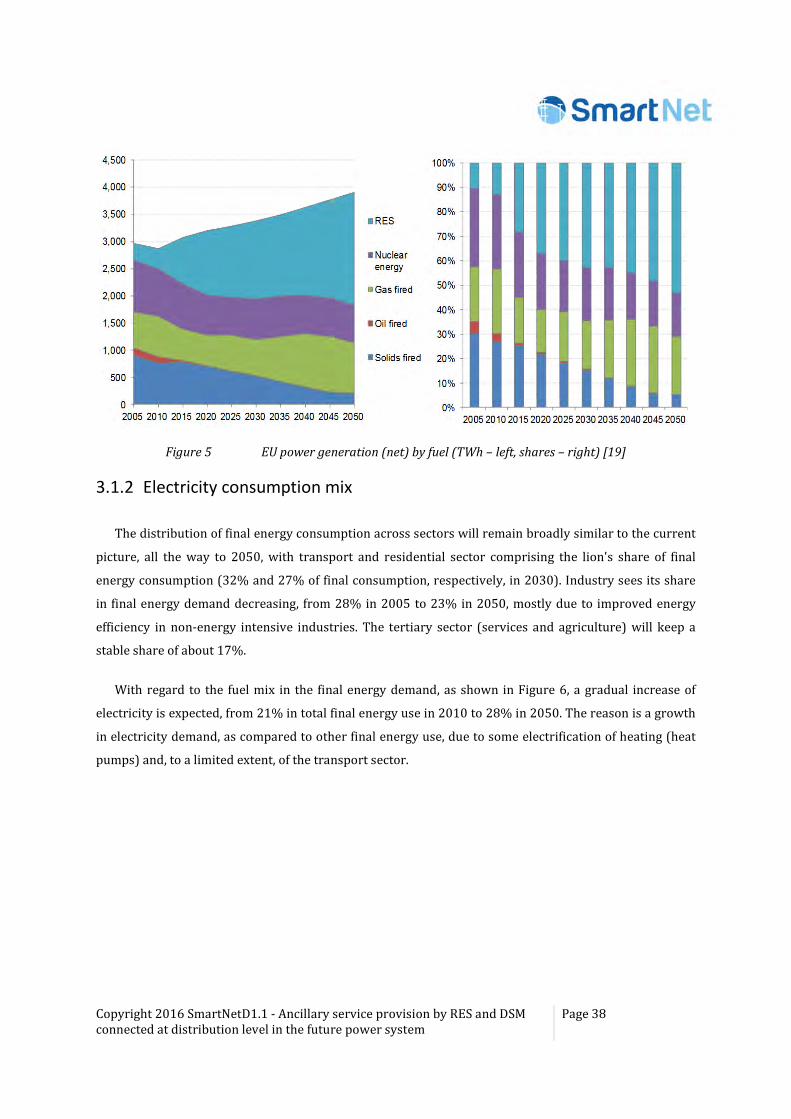
Copyright 2016 SmartNetD1.1 - Ancillary service provision by RES and DSM connected at distribution level in the future power system
Page 38
Figure 5 EU power generation (net) by fuel (TWh – left, shares – right) [19]
3.1.2 Electricity consumption mix
The distribution of final energy consumption across sectors will remain broadly similar to the current
picture, all the way to 2050, with transport and residential sector comprising the lion's share of final
energy consumption (32% and 27% of final consumption, respectively, in 2030). Industry sees its share
in final energy demand decreasing, from 28% in 2005 to 23% in 2050, mostly due to improved energy
efficiency in non-energy intensive industries. The tertiary sector (services and agriculture) will keep a
stable share of about 17%.
With regard to the fuel mix in the final energy demand, as shown in Figure 6, a gradual increase of
electricity is expected, from 21% in total final energy use in 2010 to 28% in 2050. The reason is a growth
in electricity demand, as compared to other final energy use, due to some electrification of heating (heat
pumps) and, to a limited extent, of the transport sector.
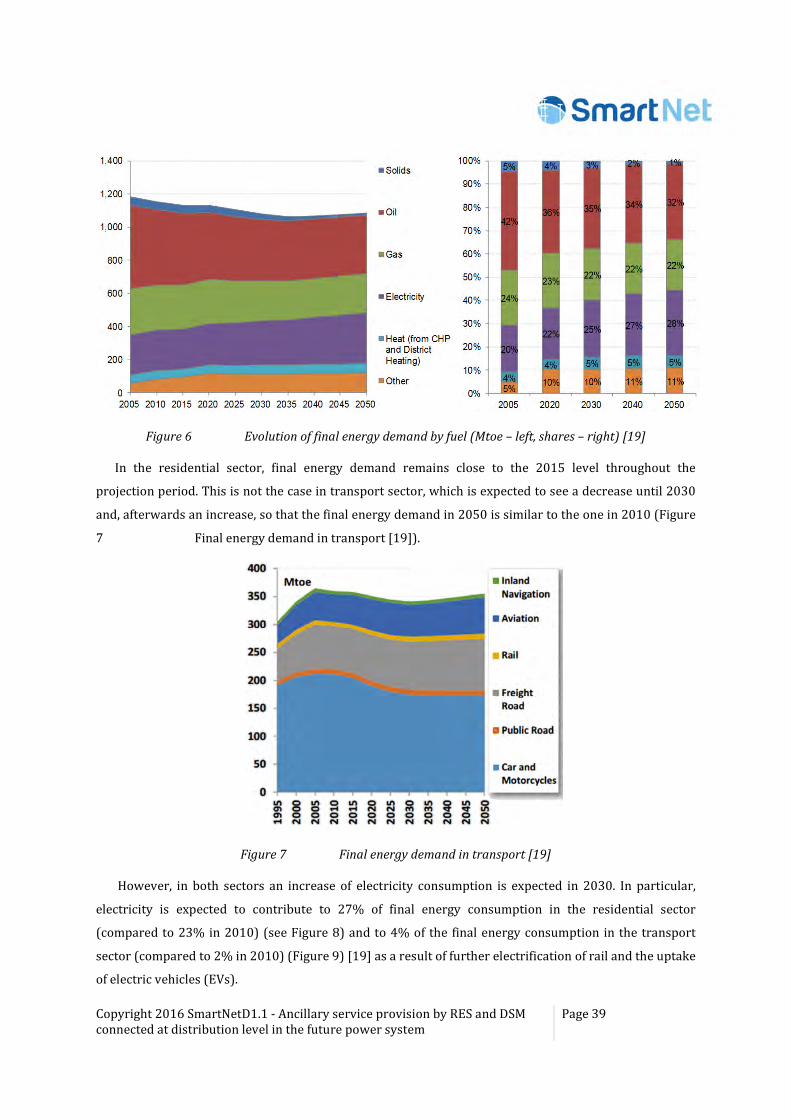
Copyright 2016 SmartNetD1.1 - Ancillary service provision by RES and DSM connected at distribution level in the future power system
Page 39
Figure 6 Evolution of final energy demand by fuel (Mtoe – left, shares – right) [19]
In the residential sector, final energy demand remains close to the 2015 level throughout the
projection period. This is not the case in transport sector, which is expected to see a decrease until 2030
and, afterwards an increase, so that the final energy demand in 2050 is similar to the one in 2010 (Figure
7 Final energy demand in transport [19]).
Figure 7 Final energy demand in transport [19]
However, in both sectors an increase of electricity consumption is expected in 2030. In particular,
electricity is expected to contribute to 27% of final energy consumption in the residential sector
(compared to 23% in 2010) (see Figure 8) and to 4% of the final energy consumption in the transport
sector (compared to 2% in 2010) (Figure 9) [19] as a result of further electrification of rail and the uptake
of electric vehicles (EVs).
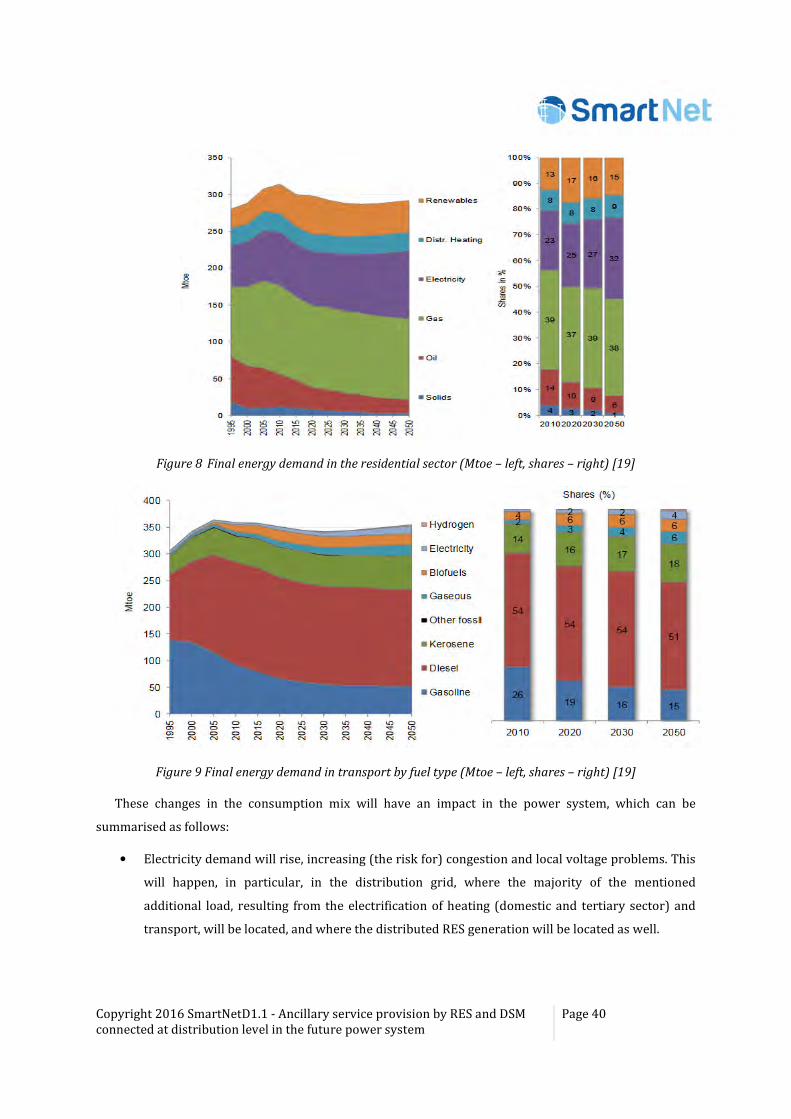
Copyright 2016 SmartNetD1.1 - Ancillary service provision by RES and DSM connected at distribution level in the future power system
Page 40
Figure 8 Final energy demand in the residential sector (Mtoe – left, shares – right) [19]
Figure 9 Final energy demand in transport by fuel type (Mtoe – left, shares – right) [19]
These changes in the consumption mix will have an impact in the power system, which can be
summarised as follows:
• Electricity demand will rise, increasing (the risk for) congestion and local voltage problems. This
will happen, in particular, in the distribution grid, where the majority of the mentioned
additional load, resulting from the electrification of heating (domestic and tertiary sector) and
transport, will be located, and where the distributed RES generation will be located as well.
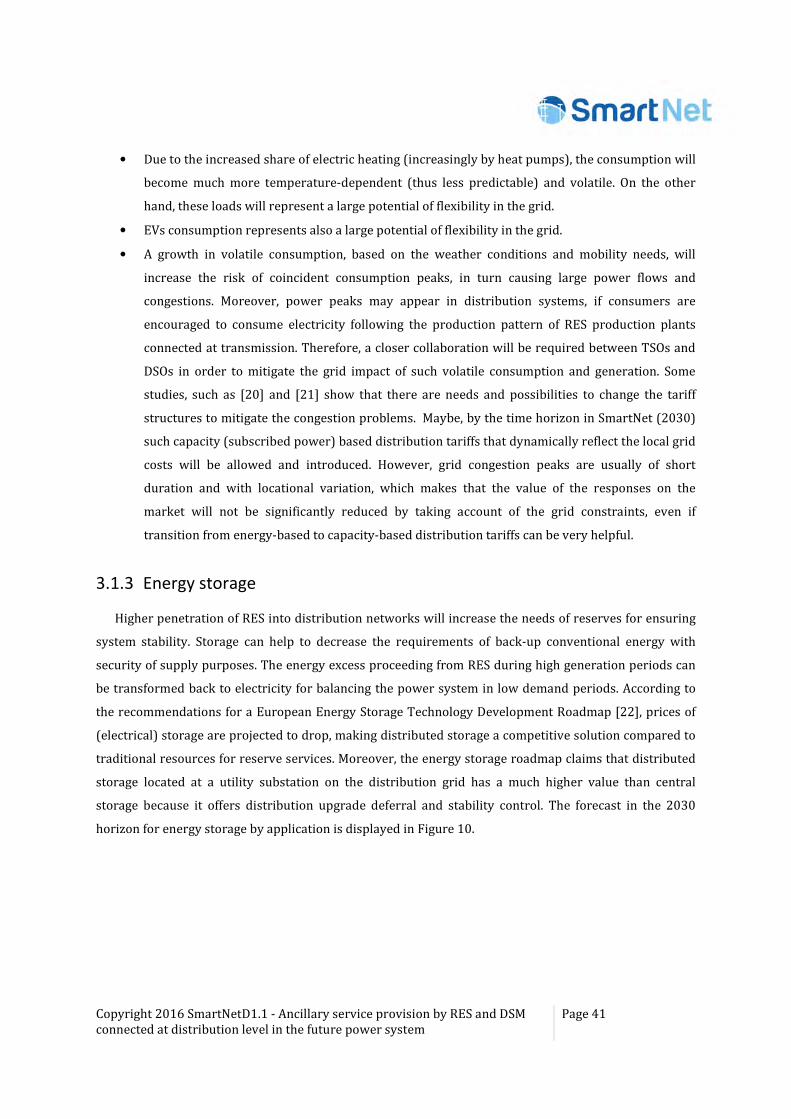
Copyright 2016 SmartNetD1.1 - Ancillary service provision by RES and DSM connected at distribution level in the future power system
Page 41
• Due to the increased share of electric heating (increasingly by heat pumps), the consumption will
become much more temperature-dependent (thus less predictable) and volatile. On the other
hand, these loads will represent a large potential of flexibility in the grid.
• EVs consumption represents also a large potential of flexibility in the grid.
• A growth in volatile consumption, based on the weather conditions and mobility needs, will
increase the risk of coincident consumption peaks, in turn causing large power flows and
congestions. Moreover, power peaks may appear in distribution systems, if consumers are
encouraged to consume electricity following the production pattern of RES production plants
connected at transmission. Therefore, a closer collaboration will be required between TSOs and
DSOs in order to mitigate the grid impact of such volatile consumption and generation. Some
studies, such as [20] and [21] show that there are needs and possibilities to change the tariff
structures to mitigate the congestion problems. Maybe, by the time horizon in SmartNet (2030)
such capacity (subscribed power) based distribution tariffs that dynamically reflect the local grid
costs will be allowed and introduced. However, grid congestion peaks are usually of short
duration and with locational variation, which makes that the value of the responses on the
market will not be significantly reduced by taking account of the grid constraints, even if
transition from energy-based to capacity-based distribution tariffs can be very helpful.
3.1.3 Energy storage
Higher penetration of RES into distribution networks will increase the needs of reserves for ensuring
system stability. Storage can help to decrease the requirements of back-up conventional energy with
security of supply purposes. The energy excess proceeding from RES during high generation periods can
be transformed back to electricity for balancing the power system in low demand periods. According to
the recommendations for a European Energy Storage Technology Development Roadmap [22], prices of
(electrical) storage are projected to drop, making distributed storage a competitive solution compared to
traditional resources for reserve services. Moreover, the energy storage roadmap claims that distributed
storage located at a utility substation on the distribution grid has a much higher value than central
storage because it offers distribution upgrade deferral and stability control. The forecast in the 2030
horizon for energy storage by application is displayed in Figure 10.
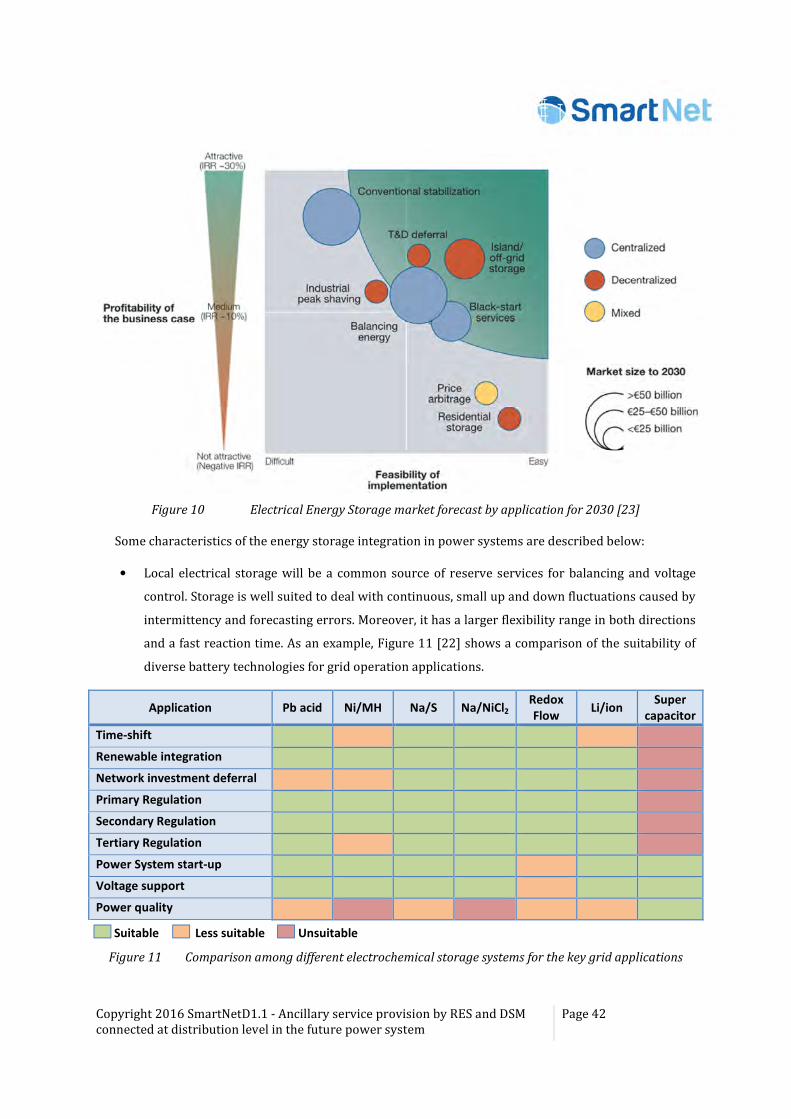
Copyright 2016 SmartNetD1.1 - Ancillary service provision by RES and DSM connected at distribution level in the future power system
Page 42
Figure 10 Electrical Energy Storage market forecast by application for 2030 [23]
Some characteristics of the energy storage integration in power systems are described below:
• Local electrical storage will be a common source of reserve services for balancing and voltage
control. Storage is well suited to deal with continuous, small up and down fluctuations caused by
intermittency and forecasting errors. Moreover, it has a larger flexibility range in both directions
and a fast reaction time. As an example, Figure 11 [22] shows a comparison of the suitability of
diverse battery technologies for grid operation applications.
Application Pb acid Ni/MH Na/S Na/NiCl2 Redox
Flow Li/ion
Super
capacitor
Time-shift
Renewable integration
Network investment deferral
Primary Regulation
Secondary Regulation
Tertiary Regulation
Power System start-up
Voltage support
Power quality
Suitable Less suitable Unsuitable
Figure 11 Comparison among different electrochemical storage systems for the key grid applications
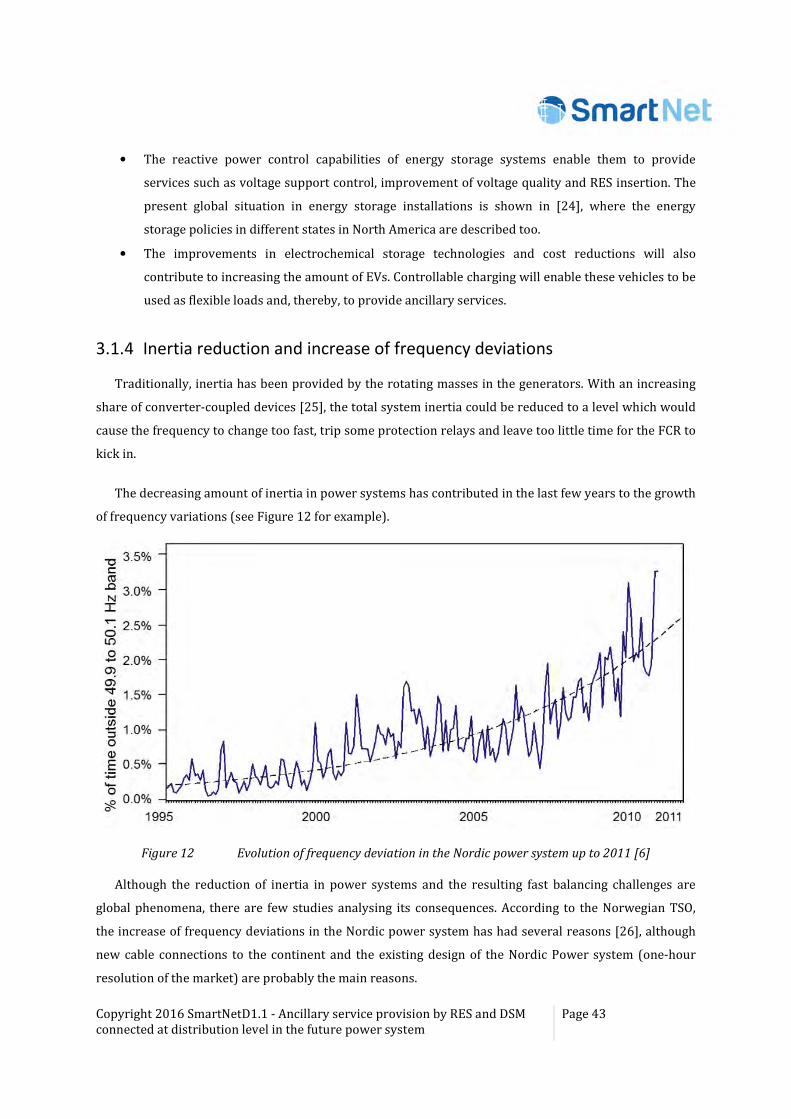
Copyright 2016 SmartNetD1.1 - Ancillary service provision by RES and DSM connected at distribution level in the future power system
Page 43
• The reactive power control capabilities of energy storage systems enable them to provide
services such as voltage support control, improvement of voltage quality and RES insertion. The
present global situation in energy storage installations is shown in [24], where the energy
storage policies in different states in North America are described too.
• The improvements in electrochemical storage technologies and cost reductions will also
contribute to increasing the amount of EVs. Controllable charging will enable these vehicles to be
used as flexible loads and, thereby, to provide ancillary services.
3.1.4 Inertia reduction and increase of frequency deviations
Traditionally, inertia has been provided by the rotating masses in the generators. With an increasing
share of converter-coupled devices [25], the total system inertia could be reduced to a level which would
cause the frequency to change too fast, trip some protection relays and leave too little time for the FCR to
kick in.
The decreasing amount of inertia in power systems has contributed in the last few years to the growth
of frequency variations (see Figure 12 for example).
Figure 12 Evolution of frequency deviation in the Nordic power system up to 2011 [6]
Although the reduction of inertia in power systems and the resulting fast balancing challenges are
global phenomena, there are few studies analysing its consequences. According to the Norwegian TSO,
the increase of frequency deviations in the Nordic power system has had several reasons [26], although
new cable connections to the continent and the existing design of the Nordic Power system (one-hour
resolution of the market) are probably the main reasons.
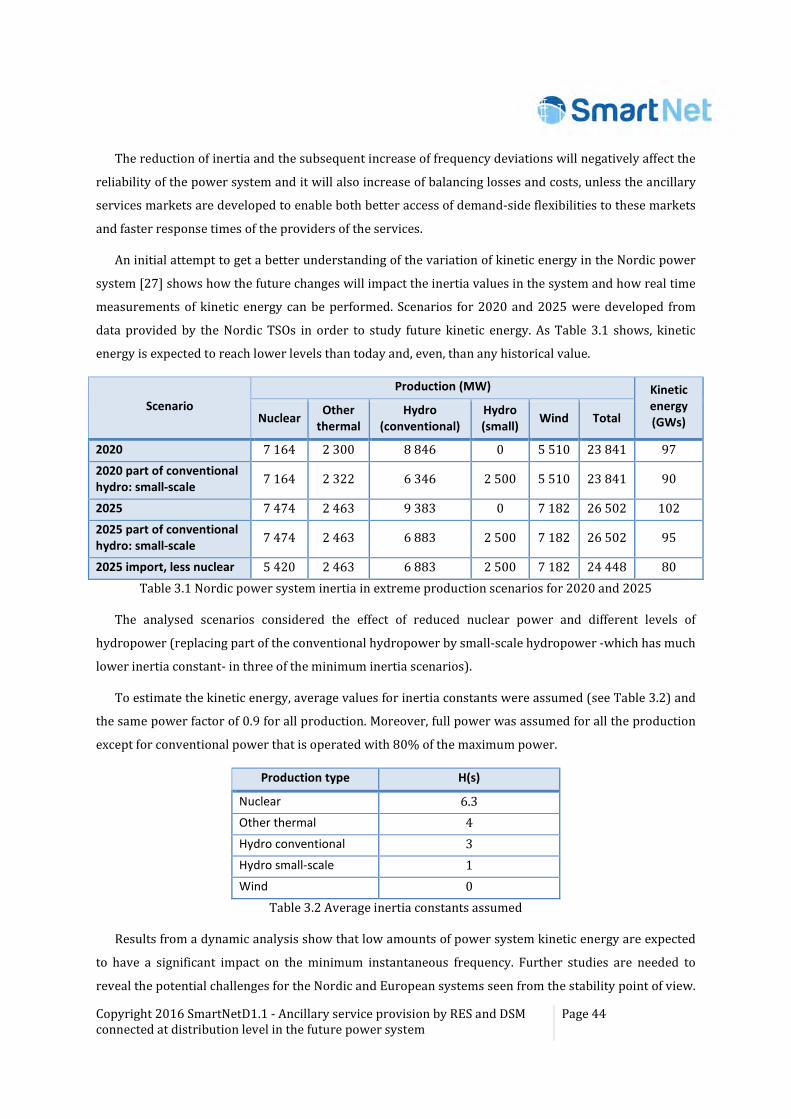
Copyright 2016 SmartNetD1.1 - Ancillary service provision by RES and DSM connected at distribution level in the future power system
Page 44
The reduction of inertia and the subsequent increase of frequency deviations will negatively affect the
reliability of the power system and it will also increase of balancing losses and costs, unless the ancillary
services markets are developed to enable both better access of demand-side flexibilities to these markets
and faster response times of the providers of the services.
An initial attempt to get a better understanding of the variation of kinetic energy in the Nordic power
system [27] shows how the future changes will impact the inertia values in the system and how real time
measurements of kinetic energy can be performed. Scenarios for 2020 and 2025 were developed from
data provided by the Nordic TSOs in order to study future kinetic energy. As Table 3.1 shows, kinetic
energy is expected to reach lower levels than today and, even, than any historical value.
Scenario
Production (MW) Kinetic
energy
(GWs) Nuclear Other
thermal
Hydro
(conventional)
Hydro
(small) Wind Total
2020 7 164 2 300 8 846 0 5 510 23 841 97
2020 part of conventional
hydro: small-scale 7 164 2 322 6 346 2 500 5 510 23 841 90
2025 7 474 2 463 9 383 0 7 182 26 502 102
2025 part of conventional
hydro: small-scale 7 474 2 463 6 883 2 500 7 182 26 502 95
2025 import, less nuclear 5 420 2 463 6 883 2 500 7 182 24 448 80
Table 3.1 Nordic power system inertia in extreme production scenarios for 2020 and 2025
The analysed scenarios considered the effect of reduced nuclear power and different levels of
hydropower (replacing part of the conventional hydropower by small-scale hydropower -which has much
lower inertia constant- in three of the minimum inertia scenarios).
To estimate the kinetic energy, average values for inertia constants were assumed (see Table 3.2) and
the same power factor of 0.9 for all production. Moreover, full power was assumed for all the production
except for conventional power that is operated with 80% of the maximum power.
Production type H(s)
Nuclear 6.3
Other thermal 4
Hydro conventional 3
Hydro small-scale 1
Wind 0
Table 3.2 Average inertia constants assumed
Results from a dynamic analysis show that low amounts of power system kinetic energy are expected
to have a significant impact on the minimum instantaneous frequency. Further studies are needed to
reveal the potential challenges for the Nordic and European systems seen from the stability point of view.
Copyright 2016 SmartNetD1.1 - Ancillary service provision by RES and DSM connected at distribution level in the future power system
Page 45
The report [27] also recommends measures to handle future low kinetic energy situations, such as:
synthetic inertia from resources connected through frequency converters and adjustable FCR parameters
for FCR contributing resources.
Therefore, the importance of distributed FCR services will increase significantly in the future
European power system. Moreover, the FCR also needs to be somewhat faster than today.
3.1.5 Increased flexibility
The fastest responding flexibility is in controllable loads, electricity storage systems and counverter-
coupled energy sources, which are mainly distributed resources. The main limitation for controllable
loads is that the duration of the responses is limited (depending on the case) and it often includes pay-
back effects. Loads can be controlled upwards and downwards (solar and wind power mainly
downwards).
The modern wind power plants are able to provide active and reactive power control. In addition to
downward control, the upward control is also possible to a certain extent, if the wind generation is first
curtailed (i.e. by modifying the pitch control of the blades to produce less than the available resource,
even at lower speeds than the rated speed). The second option for upward regulation is to momentarily
exploit the kinetic energy stored in the inertia of the rotor. This way, the wind power plants can
momentarily contribute to supporting the system frequency.
At the moment, PV plants are able to provide voltage and they are also expected to contribute to
frequency control in the future. Voltage control is normally implemented locally by reactive/active power
droop control. PV plants have the potential to be aggregated in virtual power plants in order to
participate in markets, including balancing markets.
Typical thermal power plants are condensing, combined heat and power (CHP), gas turbine, motor
and nuclear power plants. The starting time of condensing power plant is related to the time when the
plant was shut down (cold start or warm start). Frequency and voltage control can be provided at the
same time, given that the working point of the synchronous machine and of the prime mover are within
the capability limits [28]. It is possible to increase the flexibility of the CHP by using heat storages and,
this way, reduce the dependence between electricity and heat production [29].
A comparison of the flexibility of different power plants is included in [30], when assessing future
technical solutions for integrating higher amounts of RES production. It is also pointed out that there is
currently (2012) a lack of metrics, methods and tools to measure the flexibility and its related cost of
provision, evaluate the flexibility required, and optimise the generation resources to provide such
flexibility at a minimum cost.
Copyright 2016 SmartNetD1.1 - Ancillary service provision by RES and DSM connected at distribution level in the future power system
Page 46
3.1.6 Demand response
DR may be defined as "the actual response/reaction of demand on certain signals or incentives to
change their behaviour" [31].
Current developments and challenges (advanced metering and control technologies and the ever-
increasing capacity of variable and distributed generation sources, respectively) have opened the door for
a more active participation of customers.
Historically, DR was provided by large industrial loads, connected to the transmission grid, and mainly
via interruptible load programs directly contracted with the TSO or with a BRP. Today, end-users are
active customers, who are being empowered by technological breakthroughs to participate in the energy
market.
Vision [32] on active customers includes the following views, for example:
• As demand response technology develops and human interactions are better understood, the
availability, volume and response time of the demand-side resource will provide the flexibility
necessary to respond to both peak demand and variable generation needs [33][34].
• The management of peak demand can enable better system planning throughout the entire
electricity system, increasing options for new loads such as electric vehicles, for storage
deployment and for generation technologies [34].
• While the smart meter is the interface between the distribution system and the customer’s home,
it is the HEMS or BEMS in home or business that can deliver the information and support the
ability of the customer to adjust the use of electricity [35].
• Most consumers participate to electricity market based on economic incentives [29] [33]
• Customers use their own generation, energy storages and other controllable resources for DR
[29]. Obviously, these DER must to be controlled automatically, because manual control is too
unpredictable, expensive and slow for the intended electricity market purposes.
• The load profiles of the active consumers are totally different from the past passive consumers.
The distribution tariffs are power-based and include products that give incentives to use
flexibility to support distribution grid management [29].
• Many consumers have some emergency back-up power units, which are always switched on
during power system outages. Own generation and electricity storages enable that [29].
• Standards and requirements on smart house/home properties are compulsory for all new
buildings, thus enabling cost-efficient implementation of flexibility [29].
Even where aggregated distributed DR is allowed to participate to all markets for electricity and
ancillary services, the volume of participation of DR can be small. This could be attributed to the design of
Copyright 2016 SmartNetD1.1 - Ancillary service provision by RES and DSM connected at distribution level in the future power system
Page 47
most wholesale markets, which could be hindering direct participation of DR. For instance, the minimum
volume and response duration required by existing markets makes it difficult for small users or
aggregators to take part in the day-ahead, intraday or ancillary service markets. Also, some products in
the market of ancillary services are limited to resources connected at the transmission grid or to
generation units. The introduction of smart grid technologies (home automation systems), new
infrastructure (replacement of conventional meters by smart meters, smart appliances, etc.) and new
market rules (products and processes that take into account the specificities of small aggregated load
connected to the distribution grid) will enable a broader deployment of flexibility on the demand side.
An overview of different DR programs is provided in [31] and [36]. In these programs, it is common to
observe demand participating in what is known as interruptible load contracts, as shown in section 2.1.3.
The capacity for this service is usually procured on a yearly basis, but it is rarely used. Some countries
have defined more advanced products. For instance, in Belgium demand can participate in the organised
market mechanisms for primary and tertiary reserve and free flexibility energy; in particular, Elia
(Belgian TSO) is already contracting loads connected at distribution system level for the tertiary reserve
dynamic profile (R3-Dynamic profile, see Table 2.1).
Another example is France where the NEBEF (Notification d’Échange de Blocs d’Effacement)
mechanism could be highlighted. This mechanism allows end-users (or their representatives) to sell the
energy from a demand reduction action on the French day-ahead market. More information on this
mechanism can be found in [37].
The electricity and ancillary services markets in Finland allow demand side participation, but the
participation of demand side in ancillary services markets is still small. The structures of the ancillary
services markets and their products are not suitable for small distributed flexible resources thus making
prohibitively complex aggregation necessary for participation.
In Spain this service can be provided by electricity consumers connected at high voltage level through
a yearly reverse auction managed by the TSO. It is an optional service and the participants can offer
demand reduction blocks of 5MW or 90 MW, which have associated several options of execution
depending on the prior notice time; without prior notice (immediate execution), 15 min (fast execution)
and 2 hours (hourly execution).
Several challenges will need to be addressed in order to increase the participation of DR. At the level
of the market design, a clear definition of the role and responsibilities of the aggregator will have to be
determined. At the moment, in most countries, the role of aggregator is not defined, while in some others
it is even forbidden. In addition, the impact on the portfolio of the balancing responsible party (BRP) due
to activation by aggregators will have to be analysed and it has to be determined if compensation
mechanisms need to be developed.
Copyright 2016 SmartNetD1.1 - Ancillary service provision by RES and DSM connected at distribution level in the future power system
Page 48
On the level of the data flow, it is important to have a safe, secure and efficient transfer and sharing of
data with market parties which need of them. As an example, there is a discussion on data management at
the level of DSOs and to what extent the DSO metering data could be used/ should be transferred to
commercial market parties offering aggregation services.
Another element is that the newly developed products to increase DR at the distribution level should
not hinder the safe and secure operation of the grid, meaning that clear control mechanisms and smart
market clearing mechanisms have to be developed to ensure that no additional congestion or voltage
violations are introduced by allowing more DR in the market.
3.1.7 Enhancement of cross-border interconnections
Sharing and exchange of balancing resources is expected to bring several benefits to the system. It will
potentially improve the security of supply, increase competition on the balancing markets by better
utilisation of the resources and, thus, provide TSO access to cheaper resources, reducing costs for the
end-users.
At the moment, there are three main models in operation directly related to cross-border exchanges,
although several alternative models and comparative evaluation of these can be found in [38]:
1. TSO-TSO: TSO-TSO model is a model for the exchange of balancing services exclusively by TSOs. In the
TSO-TSO model, all interactions with a Balancing Service Provider (BSP) in another responsibility
area are carried on through the connecting TSO. The TSO-TSO model is the standard one for the
exchange of balancing services. It was decided that the European integration model for a future EU-
wide balancing market should be based on a TSO-TSO model, where TSOs will cover all cross-border
processes and obligations (if not delegated to a third party) [39].
2. TSO-BSP: TSO-BSP model is a model for the exchange of balancing capacity or the exchange of
balancing energy where the contracting TSO has an agreement with a BSP in another responsibility
or scheduling area. Under the TSO-BSP model, a BSP has a contractual relationship with another TSO
than its connecting TSO. If the use of the TSO-BSP model is approved by the relevant national
regulatory authority, the TSOs must define a set of rules which require, on the one hand, the adoption
of the current processes and obligations and, on the other, the creation and development of new ones
[38].
3. Imbalance netting: The Load Frequency Control & Reserves (LFCR) Network Code [40] defines the
imbalance netting process as “a process agreed between TSOs of two or more LFC Areas within one or
Copyright 2016 SmartNetD1.1 - Ancillary service provision by RES and DSM connected at distribution level in the future power system
Page 49
more than one Synchronous Areas that allows for avoidance of simultaneous FRR activation in opposite
directions by taking into account the respective FRCEs as well as activated FRR and correcting the
input of the involved FRPs accordingly”9. The control target of the imbalance netting process is to
reduce the amount of simultaneous counteracting FRR activation of different participating LFC Areas
by imbalance netting power interchange. Each TSO shall have the right to implement the imbalance
netting process for LFC areas within the same LFC block, between different LFC blocks or between
different synchronous areas by concluding an imbalance netting agreement (see [40] for more
details). The imbalance netting power interchange of LFC area should not exceed the actual amount
of FRR activation, which is necessary to regulate the FRCE of the given LFC area to zero without
imbalance netting power interchange. In a similar manner the interchange should not result in power
flows exceeding the operational limits. The involved TSO should ensure that the sum of all
interchanges is equal to zero. Several other formal requirements to TSOs involved in the same cross
border activation for FRR and RR, imbalance netting and exchange of FCR, FRR and RR are defined in
the LFCR Network Code [40].
Regardless of the model implemented, one of the main challenges for cross-border exchange is how to
allocate the available transmission capacity at interconnectors, in order to make it in the most
economically feasible way, and which allows an optimal utilisation of the available transmission capacity
between the national transmission systems. Since cross-zonal capacities are a limited resource, capacity
reservations are quite controversial, because they means that less cross-zonal capacity will be available
for day-ahead and intraday trading. Because it is not possible to predict in advance how much of the
contracted reserves will actually be used at a certain future time, there is a risk that the valuable
transmission capacity will not be used. Since the interconnectors are likely to be congested in hours with
high price differentials between bidding areas, the value of the trade lost is expected to be high. This was
taken into consideration by the so-called EU Target Model, developed by ACER (Agency for Cooperation
of Energy Regulators). This Target Model proposes a market design for balancing services that includes
the management of cross-border exchanges at each timeframe (i.e. forward, day-ahead, intraday and
balancing) and a coordinated approach for capacity calculation.
Another important issue is that cross-border trade shall not jeopardise system security, as stated by
ERGEG (forerunner of ACER). Therefore, security of supply in each TSO’s power system is the most
important aspect that must be taken into account when the exchange of balancing services is considered
[41]. This can be ensured by making available for being sold to other areas only the reserves beyond the
9 FRCE means Frequency Restoration Control Error and FRP stands for Frequency Restoration Process.
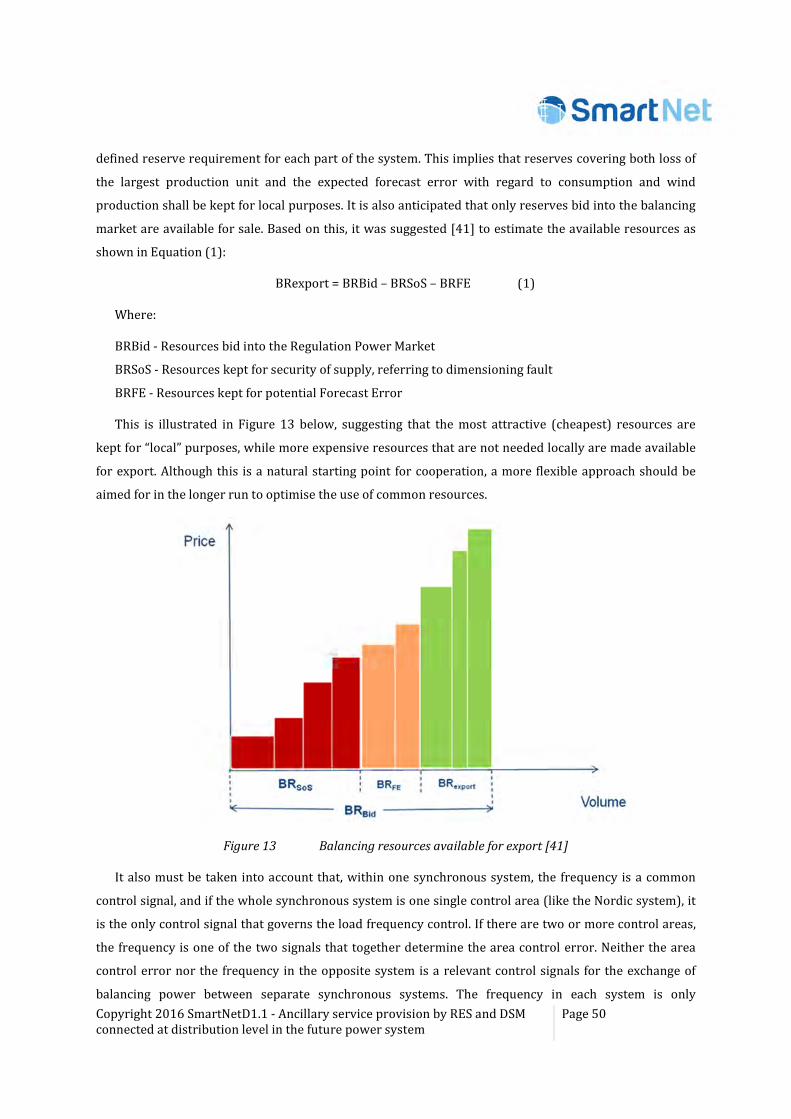
Copyright 2016 SmartNetD1.1 - Ancillary service provision by RES and DSM connected at distribution level in the future power system
Page 50
defined reserve requirement for each part of the system. This implies that reserves covering both loss of
the largest production unit and the expected forecast error with regard to consumption and wind
production shall be kept for local purposes. It is also anticipated that only reserves bid into the balancing
market are available for sale. Based on this, it was suggested [41] to estimate the available resources as
shown in Equation (1):
BRexport = BRBid – BRSoS – BRFE (1)
Where:
BRBid - Resources bid into the Regulation Power Market
BRSoS - Resources kept for security of supply, referring to dimensioning fault
BRFE - Resources kept for potential Forecast Error
This is illustrated in Figure 13 below, suggesting that the most attractive (cheapest) resources are
kept for “local” purposes, while more expensive resources that are not needed locally are made available
for export. Although this is a natural starting point for cooperation, a more flexible approach should be
aimed for in the longer run to optimise the use of common resources.
Figure 13 Balancing resources available for export [41]
It also must be taken into account that, within one synchronous system, the frequency is a common
control signal, and if the whole synchronous system is one single control area (like the Nordic system), it
is the only control signal that governs the load frequency control. If there are two or more control areas,
the frequency is one of the two signals that together determine the area control error. Neither the area
control error nor the frequency in the opposite system is a relevant control signals for the exchange of
balancing power between separate synchronous systems. The frequency in each system is only
Copyright 2016 SmartNetD1.1 - Ancillary service provision by RES and DSM connected at distribution level in the future power system
Page 51
interrelated via the change of flow over the HVDC interconnections. It is therefore necessary to exchange
explicit control signals to the HVDC terminals (and possibly generators) in the other system to enable the
exchange of balancing services.
As an example of a real implementation of this advanced control of cross-border exchange of ancillary
services, the recently commissioned HVDC cable between Norway and Denmark (Skagerrak 4) has the
overall transmission capacity of 700 MW whereof 110 MW of the capacity have been contracted for
provision of primary and secondary reserves (10 and 100 MW accordingly) from Norway to Denmark
during a five-year period. It has been estimated that the value of this interconnection will be higher than
the one obtained by taking this capacity away from the spot market. It is furthermore intended to trade
automated ancillary services through the planned connections with Germany and UK. By reserving up to
300 MW of capacity to trading ancillary services, it is estimated that the Norwegian trading revenues
could increase by approximately EUR 5 million per year and per cable. This situation presumes that the
transmission capacity will be allocated to balancing services or to the spot market, depending on which
the most feasible is in each case.
3.2 SmartNet high-level scenario
The expected changes in the European power system for the next years are drafted in section 3.1, but
given the uncertainty linked to the definition of future behaviours, it is advisable to consider several
scenarios, which represent different possible developments of certain issues into the future (some more
optimistic and some others more pessimistic, considering factors such as the emission targets
achievement or the RES and DR deployment). These scenarios are intended to cover not only such
uncertainty, but also all the casuistry that can occur in different European countries.
Thus, in order to set the framework for the evaluation of future reserve needs, some SmartNet
high-level scenarios have been defined. As described in the following subsections, they have been built
both by adapting the e-Highway 2050 methodology and by considering the ENTSO-E visions.
3.2.1 Introduction to scenario design
When present situation needs to be defined in a certain field, quantifying all the parameters to
characterise it may be an easy task. However, that is not the case when looking into the future, since many
developments turn possible and several uncertainties should be managed.
In accordance to the definition of what a scenario is and how its design process should be addressed
provided by the energy systems group of the International Institute for Applied Systems Analyses (IIASA),
”In designing scenarios we devise images of the future, or better of alternative futures. Scenarios are neither
predictions nor forecasts. Rather each scenario is one alternative image of how the future could unfold” [42].

Copyright 2016 SmartNetD1.1 - Ancillary service provision by RES and DSM connected at distribution level in the future power system
Page 52
A scenario describes one possible development of certain issues into the future and it is defined
according to a set of parameters and their evolution in time. When big changes take place, a modification
in one parameter brings changes in many other variables. This is the situation where scenario planning is
more useful, as it involves the analysis of the joint impact of various parameters, when several values are
changed at a time, while keeping others constant [43]. The objective is to build representations of
possible futures and the route to be followed to get there from the present.
The number of scenarios should be optimised to get a plausible, consistent and structurally different
set of scenarios. They should also offer insights into the future and challenge the conventional wisdom
about it. Four different approaches are possible to create these scenarios:
• Normative vs. exploratory scenarios:
○ Normative approach selects a possible future (optimistic/pessimistic/neutral) and
evaluates the possibilities to get there from the present.
○ In the exploratory approach the present is the starting point, determining future
scenarios by asking “what if” questions.
• Inductive vs. deductive scenarios:
○ Inductive approach (or bottom/up) starts with the data available and builds future
scenarios by the combination of this information. This is particularly applied in
developed markets, as macroeconomic variables are not expected to change dramatically
in the short-term.
○ Deductive approaches (or top/down) are particularly used in emerging markets. In this
case, the overall framework is imagined and the available data is then allocated where
suitable.
• Qualitative vs. quantitative scenarios:
○ Qualitative approach uses visual symbols or words (storyline) to describe the scenarios,
showing their main features.
○ Quantitative approach uses numerical information that is usually introduced in
simulation tools.
For the development of the SmartNet high-level scenarios, some previous methodologies dealing with
this topic have been analysed. They have been derived either by some international groups of interest
(ENTSO-E, JRC, etc.) or by other projects (evolvDSO). The results of such literature review can be found in
chapter 9 (Appendix C).
Copyright 2016 SmartNetD1.1 - Ancillary service provision by RES and DSM connected at distribution level in the future power system
Page 53
3.2.2 Generation of SmartNet high-level scenarios
The planning process of designing the SmartNet framework starts with the definition of scenarios that
represent future projections over the 2030 time horizon. In these scenarios, all the elements that may
have a direct or indirect impact on the need for and on the provision of ancillary services have to be taken
into account.
The considered elements include policy and regulatory factors essentials to define the framework and
sketch the boundaries of extreme scenarios. At European level, the European Commission (EC) published
in March 2011 the communication “A roadmap for moving to a competitive low carbon economy in 2050”
[44], where the role of electricity in the decarbonisation path was analysed. It was stated that, by 2050,
electricity generation could almost totally eliminate CO2 emissions (in a 93-99% below the 1990 level), as
required for achieving the 79-82% economy-wide emissions reduction target established at the G8 in
2009 [45]. Mid-term emission reduction targets were also established by the EC, setting a 54-68% CO2
reduction (compared to the 1990 level) for the power sector by 2030.
Several studies were published to analyse the progress needed in the power sector to get these
objectives in 2050. One of them is “Power Perspectives 2030: on the road to a decarbonised power sector”
[45], where the major challenges related to the decarbonisation transition were outlined, by taking into
account several axes: generation technologies, transmission grid, demand side resources, etc.
Building on this information, SmartNet scenarios were drafted following a methodology based on the
one deployed in e-Highway project (see subsection 9.6) and adapted to the needs and objectives of this
project. According to this methodology, key uncertainties and options were defined and, then, linked to
create possible futures and strategies respectively. Afterwards, futures and strategies were combined into
possible and coherent scenarios. This set of scenarios is later investigated (detecting inconsistencies,
similarities, etc.) in order to obtain a reduced number (4-6) scenarios that will be further analysed in the
following tasks of the project.
For the application of the e-Highway methodology to the SmartNet project, ENTSO-E visions towards
2030 (see subsection 9.2, [46]) and the scenarios defined in the report “Power Perspectives 2030: on the
road to a decarbonised power sector” [45] were taken as a reference.
The possible situations that could happen in the future are defined by parameters beyond our control,
called uncertainties, such as the evolution of the economy, fuel prices, etc. For the definition of SmartNet
scenarios, a number of key uncertainties were selected, based on the ENTSO-E European generation
adequacy outlook [46]:
• Economic & financial conditions
• European framework
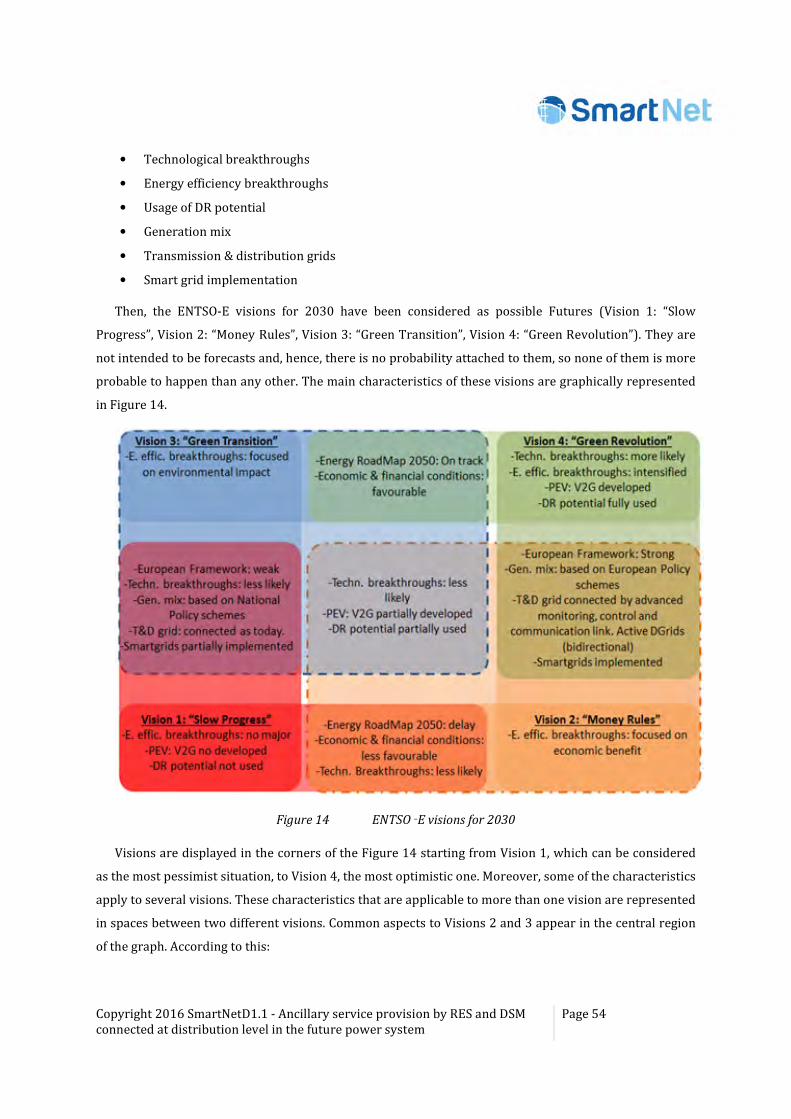
Copyright 2016 SmartNetD1.1 - Ancillary service provision by RES and DSM connected at distribution level in the future power system
Page 54
• Technological breakthroughs
• Energy efficiency breakthroughs
• Usage of DR potential
• Generation mix
• Transmission & distribution grids
• Smart grid implementation
Then, the ENTSO-E visions for 2030 have been considered as possible Futures (Vision 1: “Slow
Progress”, Vision 2: “Money Rules”, Vision 3: “Green Transition”, Vision 4: “Green Revolution”). They are
not intended to be forecasts and, hence, there is no probability attached to them, so none of them is more
probable to happen than any other. The main characteristics of these visions are graphically represented
in Figure 14.
Figure 14 ENTSO‑E visions for 2030
Visions are displayed in the corners of the Figure 14 starting from Vision 1, which can be considered
as the most pessimist situation, to Vision 4, the most optimistic one. Moreover, some of the characteristics
apply to several visions. These characteristics that are applicable to more than one vision are represented
in spaces between two different visions. Common aspects to Visions 2 and 3 appear in the central region
of the graph. According to this:
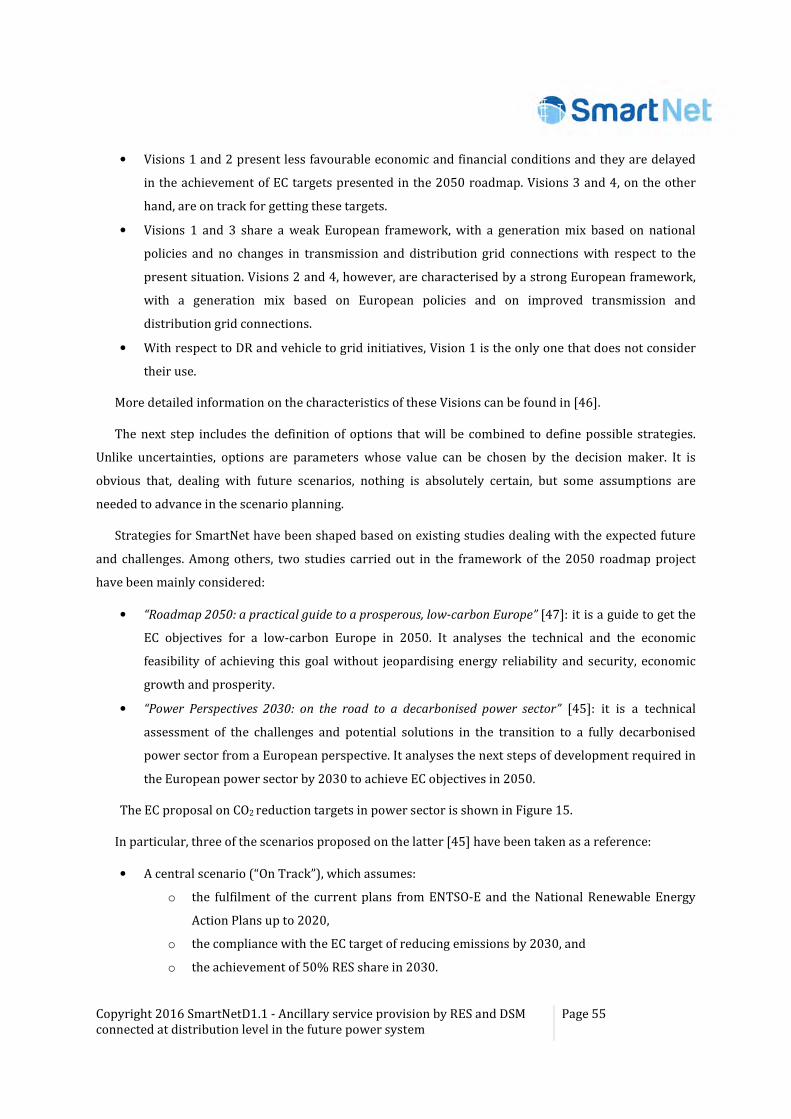
Copyright 2016 SmartNetD1.1 - Ancillary service provision by RES and DSM connected at distribution level in the future power system
Page 55
• Visions 1 and 2 present less favourable economic and financial conditions and they are delayed
in the achievement of EC targets presented in the 2050 roadmap. Visions 3 and 4, on the other
hand, are on track for getting these targets.
• Visions 1 and 3 share a weak European framework, with a generation mix based on national
policies and no changes in transmission and distribution grid connections with respect to the
present situation. Visions 2 and 4, however, are characterised by a strong European framework,
with a generation mix based on European policies and on improved transmission and
distribution grid connections.
• With respect to DR and vehicle to grid initiatives, Vision 1 is the only one that does not consider
their use.
More detailed information on the characteristics of these Visions can be found in [46].
The next step includes the definition of options that will be combined to define possible strategies.
Unlike uncertainties, options are parameters whose value can be chosen by the decision maker. It is
obvious that, dealing with future scenarios, nothing is absolutely certain, but some assumptions are
needed to advance in the scenario planning.
Strategies for SmartNet have been shaped based on existing studies dealing with the expected future
and challenges. Among others, two studies carried out in the framework of the 2050 roadmap project
have been mainly considered:
• “Roadmap 2050: a practical guide to a prosperous, low-carbon Europe” [47]: it is a guide to get the
EC objectives for a low-carbon Europe in 2050. It analyses the technical and the economic
feasibility of achieving this goal without jeopardising energy reliability and security, economic
growth and prosperity.
• “Power Perspectives 2030: on the road to a decarbonised power sector” [45]: it is a technical
assessment of the challenges and potential solutions in the transition to a fully decarbonised
power sector from a European perspective. It analyses the next steps of development required in
the European power sector by 2030 to achieve EC objectives in 2050.
The EC proposal on CO2 reduction targets in power sector is shown in Figure 15.
In particular, three of the scenarios proposed on the latter [45] have been taken as a reference:
• A central scenario (“On Track”), which assumes:
o the fulfilment of the current plans from ENTSO-E and the National Renewable Energy
Action Plans up to 2020,
o the compliance with the EC target of reducing emissions by 2030, and
o the achievement of 50% RES share in 2030.
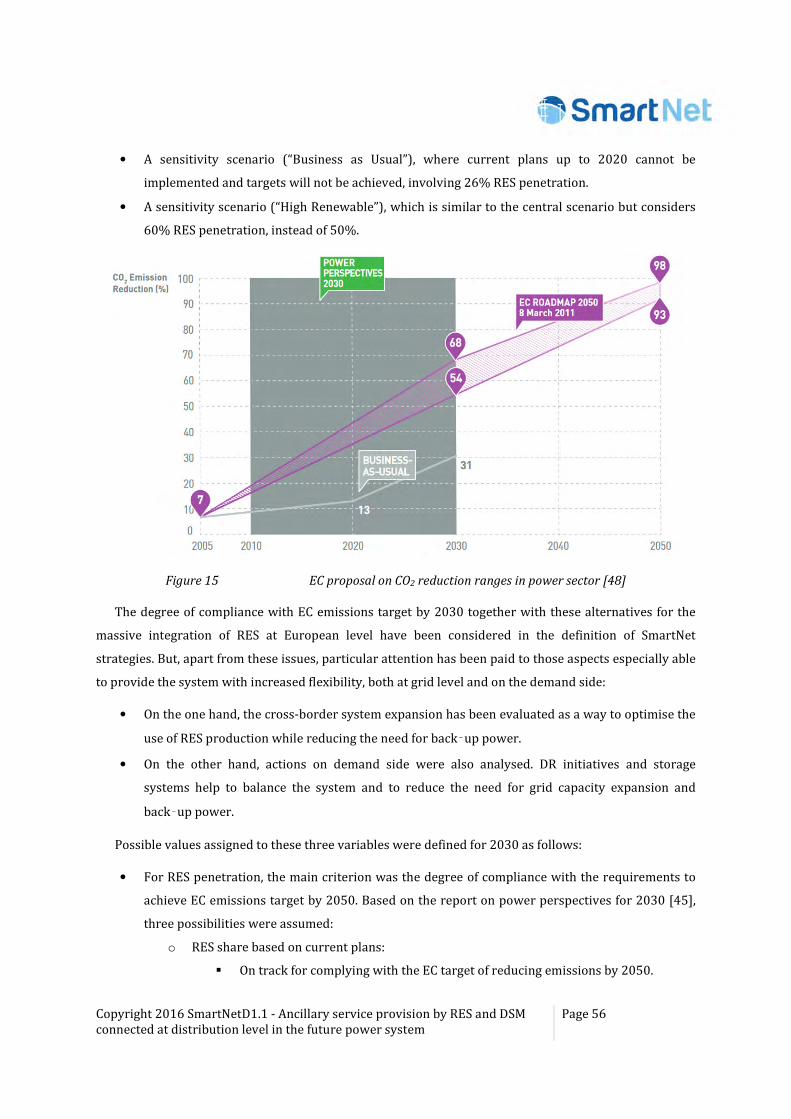
Copyright 2016 SmartNetD1.1 - Ancillary service provision by RES and DSM connected at distribution level in the future power system
Page 56
• A sensitivity scenario (“Business as Usual”), where current plans up to 2020 cannot be
implemented and targets will not be achieved, involving 26% RES penetration.
• A sensitivity scenario (“High Renewable”), which is similar to the central scenario but considers
60% RES penetration, instead of 50%.
Figure 15 EC proposal on CO2 reduction ranges in power sector [48]
The degree of compliance with EC emissions target by 2030 together with these alternatives for the
massive integration of RES at European level have been considered in the definition of SmartNet
strategies. But, apart from these issues, particular attention has been paid to those aspects especially able
to provide the system with increased flexibility, both at grid level and on the demand side:
• On the one hand, the cross-border system expansion has been evaluated as a way to optimise the
use of RES production while reducing the need for back‑up power.
• On the other hand, actions on demand side were also analysed. DR initiatives and storage
systems help to balance the system and to reduce the need for grid capacity expansion and
back‑up power.
Possible values assigned to these three variables were defined for 2030 as follows:
• For RES penetration, the main criterion was the degree of compliance with the requirements to
achieve EC emissions target by 2050. Based on the report on power perspectives for 2030 [45],
three possibilities were assumed:
o RES share based on current plans:
� On track for complying with the EC target of reducing emissions by 2050.
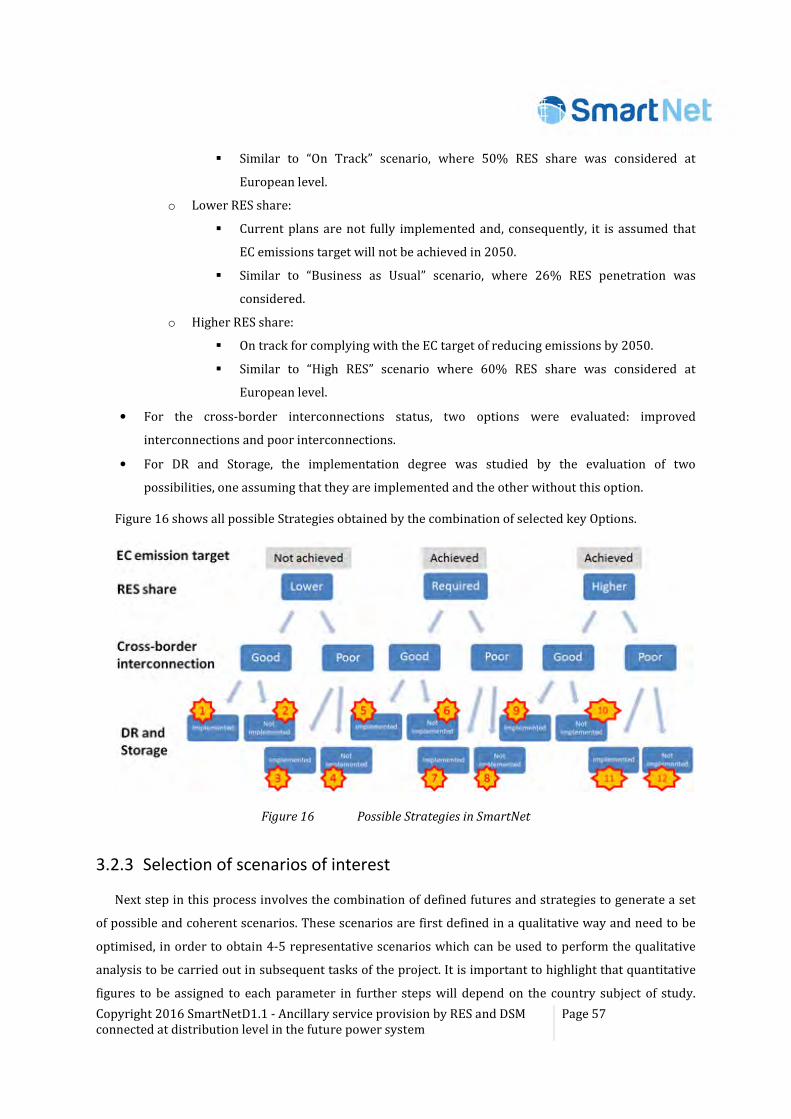
Copyright 2016 SmartNetD1.1 - Ancillary service provision by RES and DSM connected at distribution level in the future power system
Page 57
� Similar to “On Track” scenario, where 50% RES share was considered at
European level.
o Lower RES share:
� Current plans are not fully implemented and, consequently, it is assumed that
EC emissions target will not be achieved in 2050.
� Similar to “Business as Usual” scenario, where 26% RES penetration was
considered.
o Higher RES share:
� On track for complying with the EC target of reducing emissions by 2050.
� Similar to “High RES” scenario where 60% RES share was considered at
European level.
• For the cross-border interconnections status, two options were evaluated: improved
interconnections and poor interconnections.
• For DR and Storage, the implementation degree was studied by the evaluation of two
possibilities, one assuming that they are implemented and the other without this option.
Figure 16 shows all possible Strategies obtained by the combination of selected key Options.
Figure 16 Possible Strategies in SmartNet
3.2.3 Selection of scenarios of interest
Next step in this process involves the combination of defined futures and strategies to generate a set
of possible and coherent scenarios. These scenarios are first defined in a qualitative way and need to be
optimised, in order to obtain 4-5 representative scenarios which can be used to perform the qualitative
analysis to be carried out in subsequent tasks of the project. It is important to highlight that quantitative
figures to be assigned to each parameter in further steps will depend on the country subject of study.
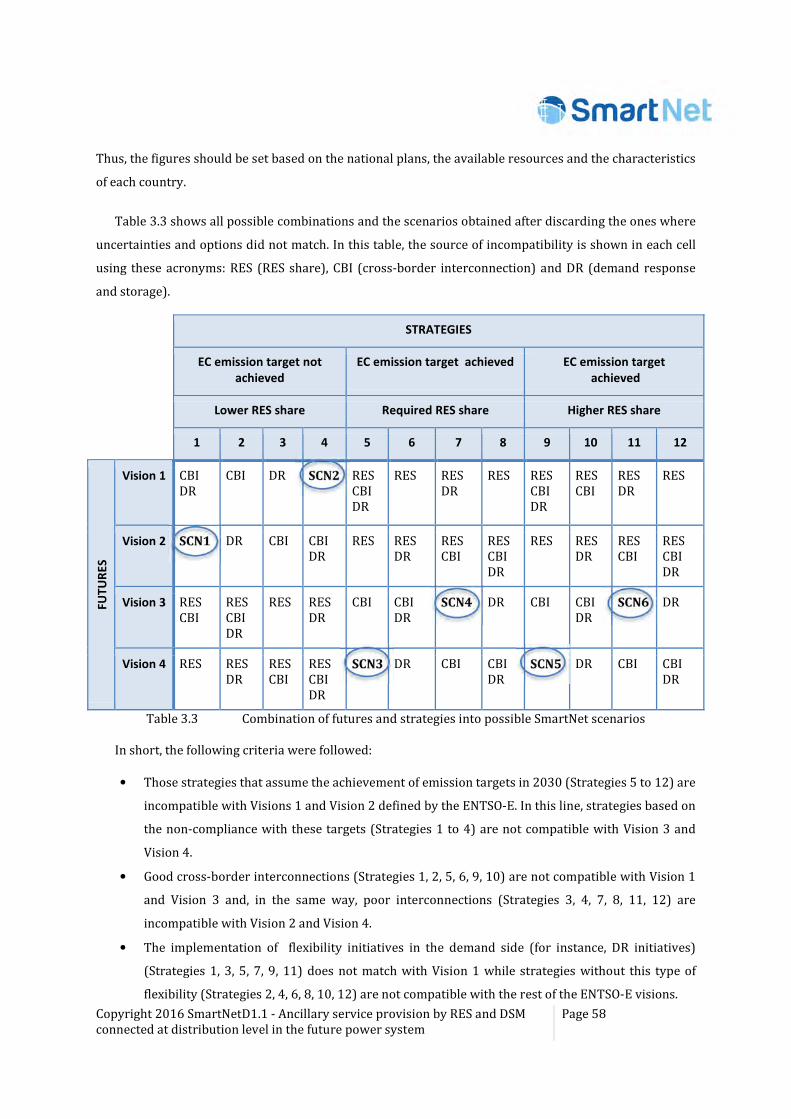
Copyright 2016 SmartNetD1.1 - Ancillary service provision by RES and DSM connected at distribution level in the future power system
Page 58
Thus, the figures should be set based on the national plans, the available resources and the characteristics
of each country.
Table 3.3 shows all possible combinations and the scenarios obtained after discarding the ones where
uncertainties and options did not match. In this table, the source of incompatibility is shown in each cell
using these acronyms: RES (RES share), CBI (cross-border interconnection) and DR (demand response
and storage).
STRATEGIES
EC emission target not
achieved
EC emission target achieved EC emission target
achieved
Lower RES share Required RES share Higher RES share
1 2 3 4 5 6 7 8 9 10 11 12
FU
TU
RE
S
Vision 1 CBI DR
CBI DR SCN2 RES CBI DR
RES RES DR
RES RES CBI DR
RES CBI
RES DR
RES
Vision 2 SCN1 DR CBI CBI DR
RES RES DR
RES CBI
RES CBI DR
RES RES DR
RES CBI
RES CBI DR
Vision 3 RES CBI
RES CBI DR
RES RES DR
CBI CBI DR
SCN4 DR CBI CBI DR
SCN6 DR
Vision 4 RES RES DR
RES CBI
RES CBI DR
SCN3 DR CBI CBI DR
SCN5 DR CBI CBI DR
Table 3.3 Combination of futures and strategies into possible SmartNet scenarios
In short, the following criteria were followed:
• Those strategies that assume the achievement of emission targets in 2030 (Strategies 5 to 12) are
incompatible with Visions 1 and Vision 2 defined by the ENTSO-E. In this line, strategies based on
the non-compliance with these targets (Strategies 1 to 4) are not compatible with Vision 3 and
Vision 4.
• Good cross-border interconnections (Strategies 1, 2, 5, 6, 9, 10) are not compatible with Vision 1
and Vision 3 and, in the same way, poor interconnections (Strategies 3, 4, 7, 8, 11, 12) are
incompatible with Vision 2 and Vision 4.
• The implementation of flexibility initiatives in the demand side (for instance, DR initiatives)
(Strategies 1, 3, 5, 7, 9, 11) does not match with Vision 1 while strategies without this type of
flexibility (Strategies 2, 4, 6, 8, 10, 12) are not compatible with the rest of the ENTSO-E visions.
Copyright 2016 SmartNetD1.1 - Ancillary service provision by RES and DSM connected at distribution level in the future power system
Page 59
This way, six final scenarios were obtained:
• Scenarios 1 and 2 (SCN1, SCN2) are based on the non-compliance with emission targets for 2030,
assuming lower RES share than required to fulfil the 2050 energy roadmap. Moreover:
o SCN1 falls within the scope of Vision 2 and it is characterised by the expansion of cross-
border interconnections and the use of DR potential.
o SNC2 takes place in the framework of Vision 1 and neither improved cross-border
interconnections nor flexible demand are available.
• Scenarios 3, 4, 5 and 6 (SCN3, SCN4, CN5, SCN6) are based on the achievement of emission
targets in 2030.
o SCN3 and SCN5 are very similar, with the only difference on RES penetration, higher in
SCN5. These scenarios take place in the framework of Vision 4 and they take into
account both improved cross-border interconnections and flexible demand.
o SCN4 and SCN6 are also very similar, with higher RES share in SCN6. They take place in
the framework of Vision 3 and they assume no improvements in cross-border
interconnections, but flexible demand is available.
In view of the similarities explained and in order to optimise the final scenarios, SCN3 and SCN5 (on
the one hand) and SCN4 and SCN6 (on the other hand) are merged into two scenarios, where EC emission
target is achieved or even improved in 2050. In this case, RES penetration is assumed to be, at least, the
required by current plans for complying with this objective.
In this way, four scenarios can be finally defined for 2030, as reported in Table 3.4, where all the
parameters (uncertainties and options) and their qualitative value are shown for each scenario.
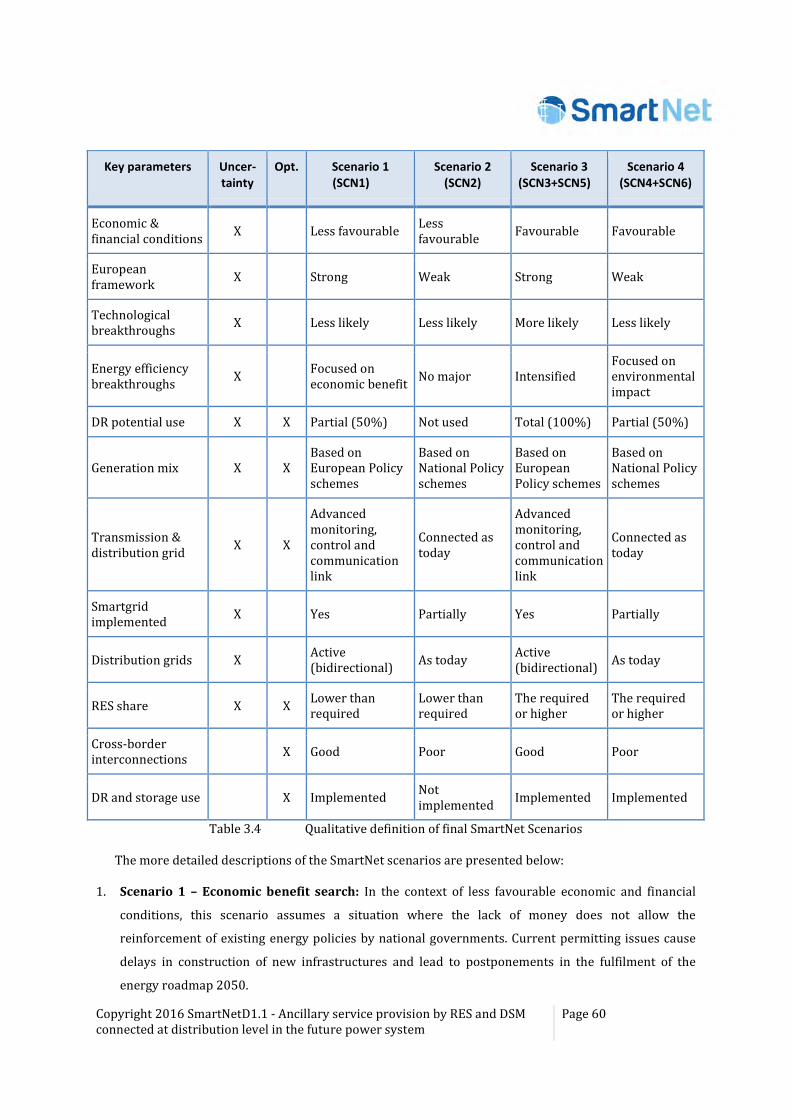
Copyright 2016 SmartNetD1.1 - Ancillary service provision by RES and DSM connected at distribution level in the future power system
Page 60
Key parameters Uncer-
tainty Opt. Scenario 1
(SCN1)
Scenario 2
(SCN2)
Scenario 3
(SCN3+SCN5)
Scenario 4
(SCN4+SCN6)
Economic & financial conditions
X Less favourable Less favourable
Favourable Favourable
European framework
X Strong Weak Strong Weak
Technological breakthroughs
X Less likely Less likely More likely Less likely
Energy efficiency breakthroughs
X Focused on economic benefit
No major Intensified Focused on environmental impact
DR potential use X X Partial (50%) Not used Total (100%) Partial (50%)
Generation mix X X Based on European Policy schemes
Based on National Policy schemes
Based on European Policy schemes
Based on National Policy schemes
Transmission & distribution grid
X X
Advanced monitoring, control and communication link
Connected as today
Advanced monitoring, control and communication link
Connected as today
Smartgrid implemented
X Yes Partially Yes Partially
Distribution grids X Active (bidirectional)
As today Active (bidirectional)
As today
RES share X X Lower than required
Lower than required
The required or higher
The required or higher
Cross-border interconnections
X Good Poor Good Poor
DR and storage use X Implemented Not implemented
Implemented Implemented
Table 3.4 Qualitative definition of final SmartNet Scenarios
The more detailed descriptions of the SmartNet scenarios are presented below:
1. Scenario 1 – Economic benefit search: In the context of less favourable economic and financial
conditions, this scenario assumes a situation where the lack of money does not allow the
reinforcement of existing energy policies by national governments. Current permitting issues cause
delays in construction of new infrastructures and lead to postponements in the fulfilment of the
energy roadmap 2050.
Copyright 2016 SmartNetD1.1 - Ancillary service provision by RES and DSM connected at distribution level in the future power system
Page 61
European framework is strong, having influence on the definition of the generation mix.
Nevertheless, due to the financial restrictions mentioned, RES penetration is lower than required for
achieving EC emission targets in 2050. For base load electricity generation, hard coal is the preferred
technology as a consequence of the carbon pricing level driven by existing policies.
This situation does not promote technological breakthroughs. There are no technology preferences
and they compete in the market without specific support measures. Planned commercial
deployments of carbon capture and storage (CCS) infrastructures are however boosted by European
subsidies for their demonstration at full-scale.
Economic benefit drives the increase in the use of electricity in transport and heating/cooling sectors,
as well as energy efficiency breakthroughs. Low growths are expected in electricity demand,
particularly in view that energy efficiency improvements will partly compensate the increases caused
by the assumed new uses of electricity.
With regard to electricity grids, advanced monitoring, control and communication links are
considered in transmission and distribution (T&D) systems, together with bidirectional electricity
flows in distribution. Vehicle-to-grid (V2G) approach is partially developed for electric vehicles and
flexibility is assumed on charging side.
The need for additional back-up capacity has been reduced by the existence of a common European
energy framework and the improvement of cross-border interconnections for electricity trading
among European countries. In any case, when required, the pursuit of the economic benefit leads to
the preferential use of the DR potential (the 50% of the maximum capacity of 10% is used due to no
fundamental changes in current market design) rather than gas units.
2. Scenario 2 – Pessimistic: In the context of less favourable economic and financial conditions and a
weak European framework, this scenario assumes a situation where the lack of money does not allow
the reinforcement of existing energy policies by national governments. Current permitting issues
cause delays in construction of new infrastructures and lead to delays in the fulfilment of the energy
roadmap 2050.
Due to the absence of a European framework, generation mix is defined by national policy schemes.
RES penetration is lower than required for achieving EC emission targets in 2050. For base load
electricity generation, hard coal is the preferred technology as a consequence of the carbon pricing
level driven by existing policies.
This situation does not promote technological or energy efficiency breakthroughs, as research and
development (R&D) is financed by parallel national plans (very repetitive and not optimised), and
planned commercial deployments of CCS infrastructures become non-realistic.
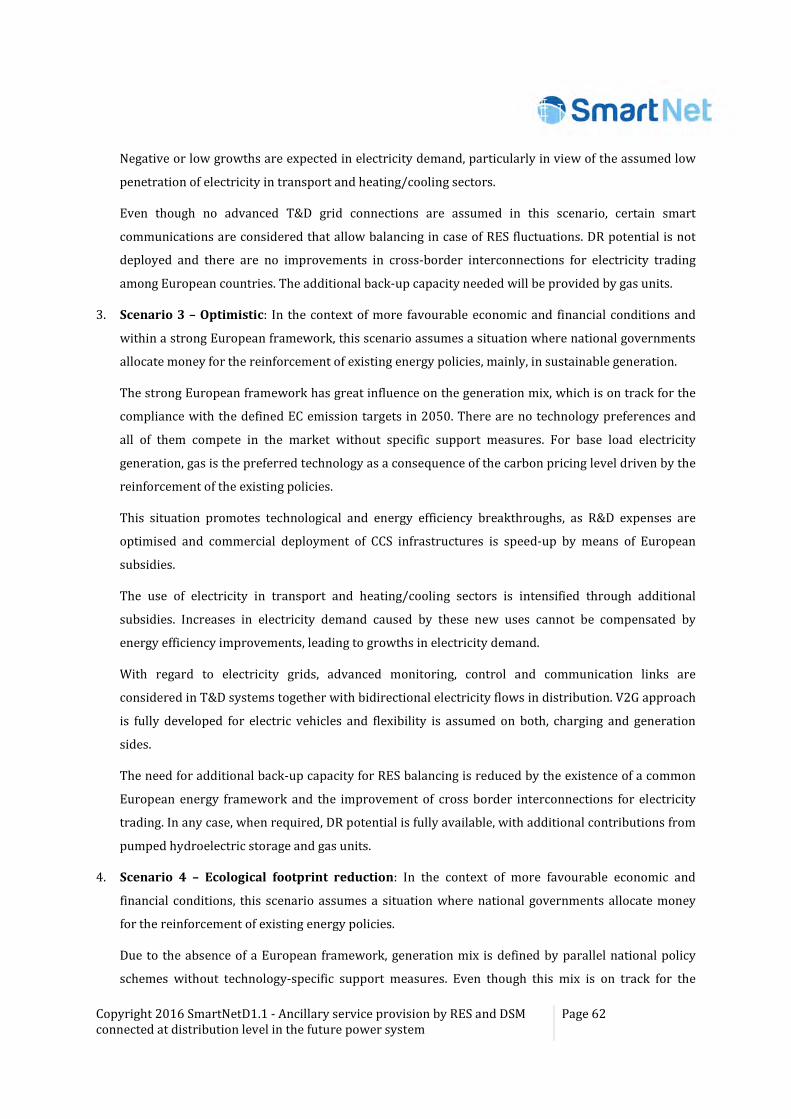
Copyright 2016 SmartNetD1.1 - Ancillary service provision by RES and DSM connected at distribution level in the future power system
Page 62
Negative or low growths are expected in electricity demand, particularly in view of the assumed low
penetration of electricity in transport and heating/cooling sectors.
Even though no advanced T&D grid connections are assumed in this scenario, certain smart
communications are considered that allow balancing in case of RES fluctuations. DR potential is not
deployed and there are no improvements in cross-border interconnections for electricity trading
among European countries. The additional back-up capacity needed will be provided by gas units.
3. Scenario 3 – Optimistic: In the context of more favourable economic and financial conditions and
within a strong European framework, this scenario assumes a situation where national governments
allocate money for the reinforcement of existing energy policies, mainly, in sustainable generation.
The strong European framework has great influence on the generation mix, which is on track for the
compliance with the defined EC emission targets in 2050. There are no technology preferences and
all of them compete in the market without specific support measures. For base load electricity
generation, gas is the preferred technology as a consequence of the carbon pricing level driven by the
reinforcement of the existing policies.
This situation promotes technological and energy efficiency breakthroughs, as R&D expenses are
optimised and commercial deployment of CCS infrastructures is speed-up by means of European
subsidies.
The use of electricity in transport and heating/cooling sectors is intensified through additional
subsidies. Increases in electricity demand caused by these new uses cannot be compensated by
energy efficiency improvements, leading to growths in electricity demand.
With regard to electricity grids, advanced monitoring, control and communication links are
considered in T&D systems together with bidirectional electricity flows in distribution. V2G approach
is fully developed for electric vehicles and flexibility is assumed on both, charging and generation
sides.
The need for additional back-up capacity for RES balancing is reduced by the existence of a common
European energy framework and the improvement of cross border interconnections for electricity
trading. In any case, when required, DR potential is fully available, with additional contributions from
pumped hydroelectric storage and gas units.
4. Scenario 4 – Ecological footprint reduction: In the context of more favourable economic and
financial conditions, this scenario assumes a situation where national governments allocate money
for the reinforcement of existing energy policies.
Due to the absence of a European framework, generation mix is defined by parallel national policy
schemes without technology-specific support measures. Even though this mix is on track for the
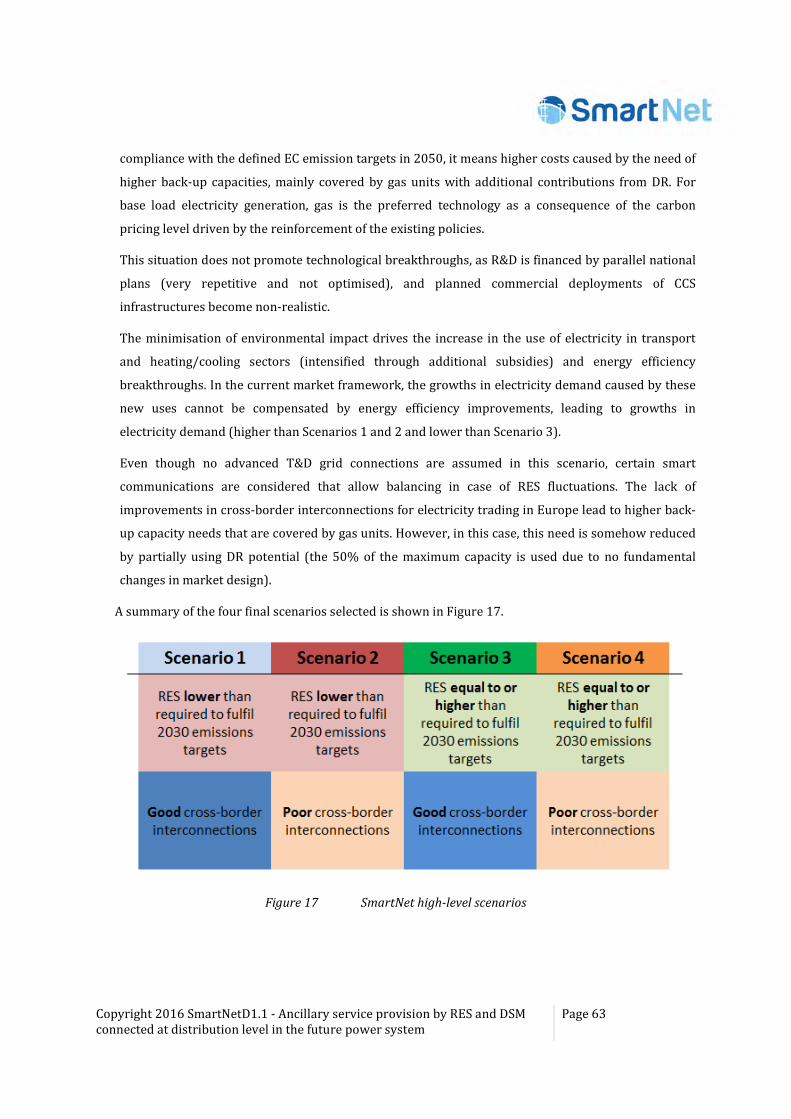
Copyright 2016 SmartNetD1.1 - Ancillary service provision by RES and DSM connected at distribution level in the future power system
Page 63
compliance with the defined EC emission targets in 2050, it means higher costs caused by the need of
higher back-up capacities, mainly covered by gas units with additional contributions from DR. For
base load electricity generation, gas is the preferred technology as a consequence of the carbon
pricing level driven by the reinforcement of the existing policies.
This situation does not promote technological breakthroughs, as R&D is financed by parallel national
plans (very repetitive and not optimised), and planned commercial deployments of CCS
infrastructures become non-realistic.
The minimisation of environmental impact drives the increase in the use of electricity in transport
and heating/cooling sectors (intensified through additional subsidies) and energy efficiency
breakthroughs. In the current market framework, the growths in electricity demand caused by these
new uses cannot be compensated by energy efficiency improvements, leading to growths in
electricity demand (higher than Scenarios 1 and 2 and lower than Scenario 3).
Even though no advanced T&D grid connections are assumed in this scenario, certain smart
communications are considered that allow balancing in case of RES fluctuations. The lack of
improvements in cross-border interconnections for electricity trading in Europe lead to higher back-
up capacity needs that are covered by gas units. However, in this case, this need is somehow reduced
by partially using DR potential (the 50% of the maximum capacity is used due to no fundamental
changes in market design).
A summary of the four final scenarios selected is shown in Figure 17.
Figure 17 SmartNet high-level scenarios
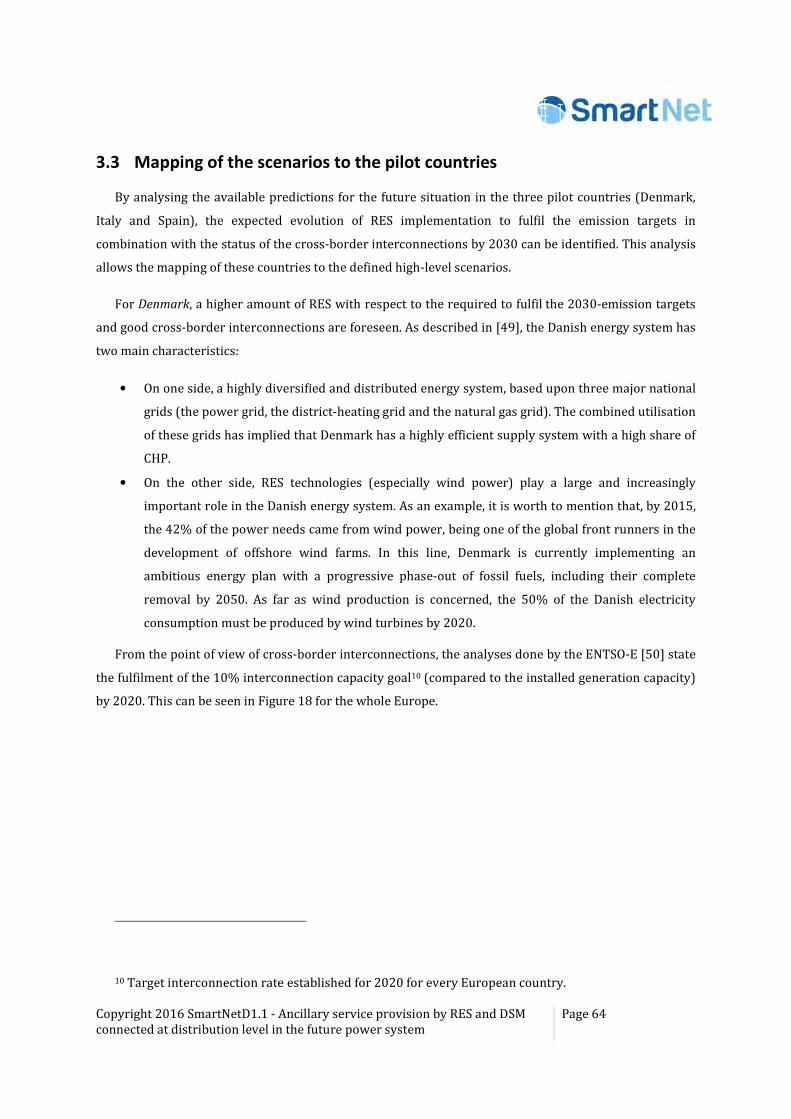
Copyright 2016 SmartNetD1.1 - Ancillary service provision by RES and DSM connected at distribution level in the future power system
Page 64
3.3 Mapping of the scenarios to the pilot countries
By analysing the available predictions for the future situation in the three pilot countries (Denmark,
Italy and Spain), the expected evolution of RES implementation to fulfil the emission targets in
combination with the status of the cross-border interconnections by 2030 can be identified. This analysis
allows the mapping of these countries to the defined high-level scenarios.
For Denmark, a higher amount of RES with respect to the required to fulfil the 2030-emission targets
and good cross-border interconnections are foreseen. As described in [49], the Danish energy system has
two main characteristics:
• On one side, a highly diversified and distributed energy system, based upon three major national
grids (the power grid, the district-heating grid and the natural gas grid). The combined utilisation
of these grids has implied that Denmark has a highly efficient supply system with a high share of
CHP.
• On the other side, RES technologies (especially wind power) play a large and increasingly
important role in the Danish energy system. As an example, it is worth to mention that, by 2015,
the 42% of the power needs came from wind power, being one of the global front runners in the
development of offshore wind farms. In this line, Denmark is currently implementing an
ambitious energy plan with a progressive phase-out of fossil fuels, including their complete
removal by 2050. As far as wind production is concerned, the 50% of the Danish electricity
consumption must be produced by wind turbines by 2020.
From the point of view of cross-border interconnections, the analyses done by the ENTSO-E [50] state
the fulfilment of the 10% interconnection capacity goal10 (compared to the installed generation capacity)
by 2020. This can be seen in Figure 18 for the whole Europe.
10 Target interconnection rate established for 2020 for every European country.
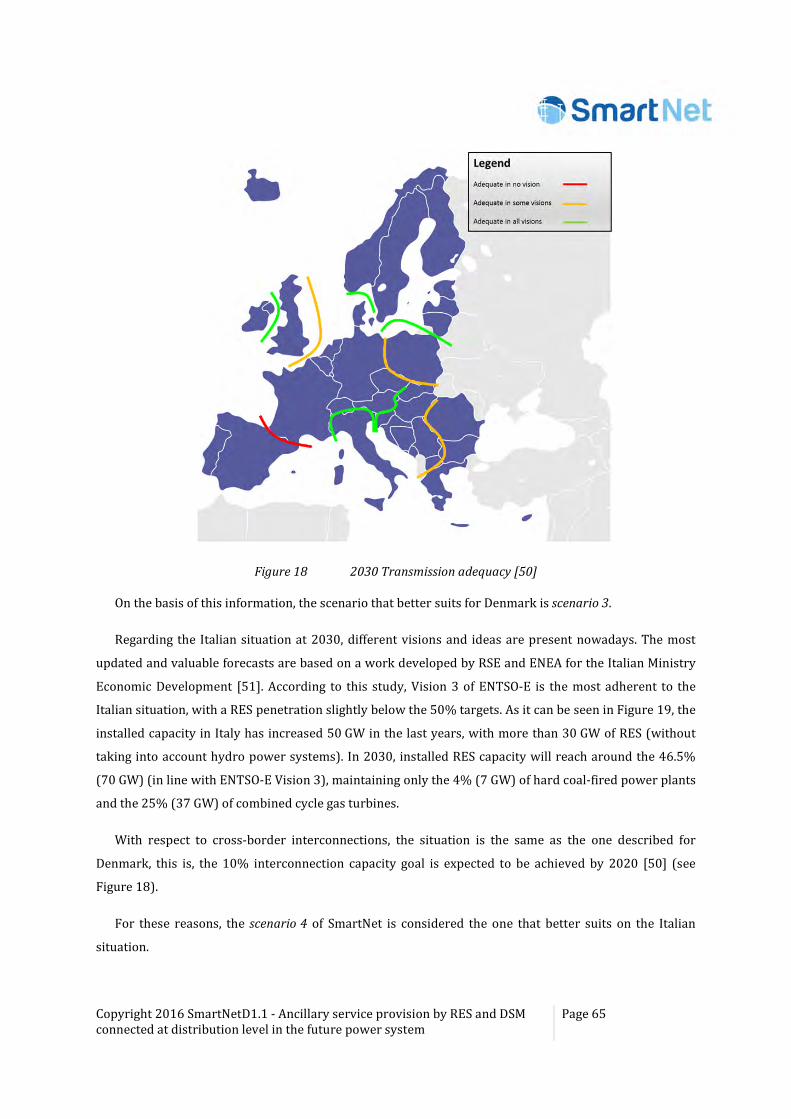
Copyright 2016 SmartNetD1.1 - Ancillary service provision by RES and DSM connected at distribution level in the future power system
Page 65
Figure 18 2030 Transmission adequacy [50]
On the basis of this information, the scenario that better suits for Denmark is scenario 3.
Regarding the Italian situation at 2030, different visions and ideas are present nowadays. The most
updated and valuable forecasts are based on a work developed by RSE and ENEA for the Italian Ministry
Economic Development [51]. According to this study, Vision 3 of ENTSO-E is the most adherent to the
Italian situation, with a RES penetration slightly below the 50% targets. As it can be seen in Figure 19, the
installed capacity in Italy has increased 50 GW in the last years, with more than 30 GW of RES (without
taking into account hydro power systems). In 2030, installed RES capacity will reach around the 46.5%
(70 GW) (in line with ENTSO-E Vision 3), maintaining only the 4% (7 GW) of hard coal-fired power plants
and the 25% (37 GW) of combined cycle gas turbines.
With respect to cross-border interconnections, the situation is the same as the one described for
Denmark, this is, the 10% interconnection capacity goal is expected to be achieved by 2020 [50] (see
Figure 18).
For these reasons, the scenario 4 of SmartNet is considered the one that better suits on the Italian
situation.
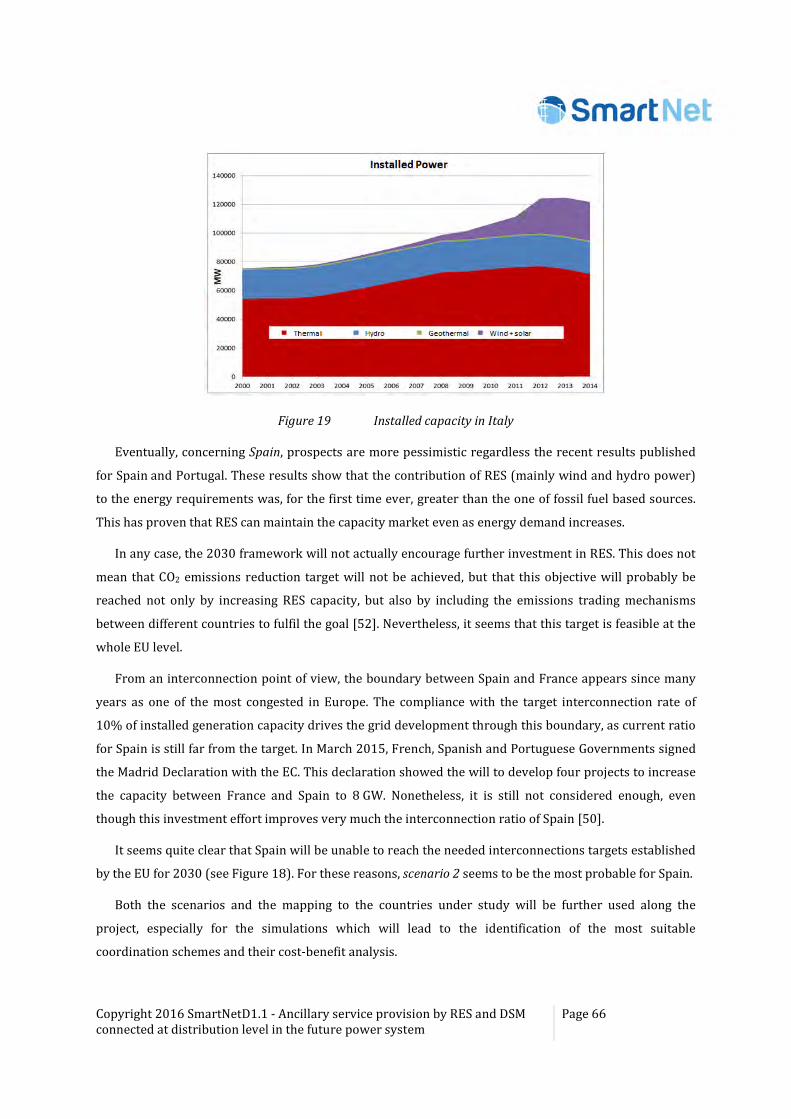
Copyright 2016 SmartNetD1.1 - Ancillary service provision by RES and DSM connected at distribution level in the future power system
Page 66
Figure 19 Installed capacity in Italy
Eventually, concerning Spain, prospects are more pessimistic regardless the recent results published
for Spain and Portugal. These results show that the contribution of RES (mainly wind and hydro power)
to the energy requirements was, for the first time ever, greater than the one of fossil fuel based sources.
This has proven that RES can maintain the capacity market even as energy demand increases.
In any case, the 2030 framework will not actually encourage further investment in RES. This does not
mean that CO2 emissions reduction target will not be achieved, but that this objective will probably be
reached not only by increasing RES capacity, but also by including the emissions trading mechanisms
between different countries to fulfil the goal [52]. Nevertheless, it seems that this target is feasible at the
whole EU level.
From an interconnection point of view, the boundary between Spain and France appears since many
years as one of the most congested in Europe. The compliance with the target interconnection rate of
10% of installed generation capacity drives the grid development through this boundary, as current ratio
for Spain is still far from the target. In March 2015, French, Spanish and Portuguese Governments signed
the Madrid Declaration with the EC. This declaration showed the will to develop four projects to increase
the capacity between France and Spain to 8 GW. Nonetheless, it is still not considered enough, even
though this investment effort improves very much the interconnection ratio of Spain [50].
It seems quite clear that Spain will be unable to reach the needed interconnections targets established
by the EU for 2030 (see Figure 18). For these reasons, scenario 2 seems to be the most probable for Spain.
Both the scenarios and the mapping to the countries under study will be further used along the
project, especially for the simulations which will lead to the identification of the most suitable
coordination schemes and their cost-benefit analysis.
Copyright 2016 SmartNetD1.1 - Ancillary service provision by RES and DSM connected at distribution level in the future power system
Page 67
3.4 The evolution of the ancillary services in the 2030 horizon
Once the three pilot countries have been mapped into one of the four high-level scenarios, it is
possible to identify the evolution required in the ancillary services in each of the countries, not only in
terms of possible changes in the existing mechanisms but also considering that new products, services or
functionalities could appear in the markets.
3.4.1 Novel ancillary services
The growth of new technologies (RES, DR, electricity storage) implies a major change in the power
supply structure, which will require both the provision of new ancillary services and the evolution of the
existing ones. According to the expected future changes, the traditionally main providers of ancillary
services (conventional generators) will be proportionally less important, as a result of the increasingly
important impact of novel resources in the grids. That is the reason why new ancillary services will be
needed. The objective of this section is the identification of the expected, most relevant ancillary services
to be provided in the future by DER units.
As a first step, these expected services have been identified and classified into four main categories;
frequency control services, voltage control services, power quality improvement and other services (for
other purposes or for combined frequency and voltage control), as shown in Table 3.5. In the technical
literature concerning the future ancillary services provision, noticeable differences between several
authors can be found in the definition of what a new ancillary service is. For clarification purposes, new
ancillary services have been split into three categories:
A) Ancillary services that are currently widespread implemented, but only provided by conventional
generation up to date. These novel services will be supplied by the DER/DSM that appear as new
market participants in the time horizon considered in SmartNet (2030).
B) Ancillary services that are considered as “new” because they are not widely deployed. This is the
case of voltage control or the black start capability. Primary, Secondary and Tertiary Voltage
control ancillary services are commonly found in the literature. However, in many countries, such
as in Spain, the voltage control service is simpler, so this distinction between the different control
layers is not made.
C) New functions that will be implemented in DER in order to make them suitable for the provision
of certain ancillary services. Some of them could be oriented to provide a certain service, e.g. a
wind turbine with fault ride-through capability can contribute to restore the voltages during a
fault by supplying reactive power to the system. This way, it could be used for primary voltage
control. Some others can constitute a new ancillary service itself, such as the ones dedicated to
the power quality improvement.
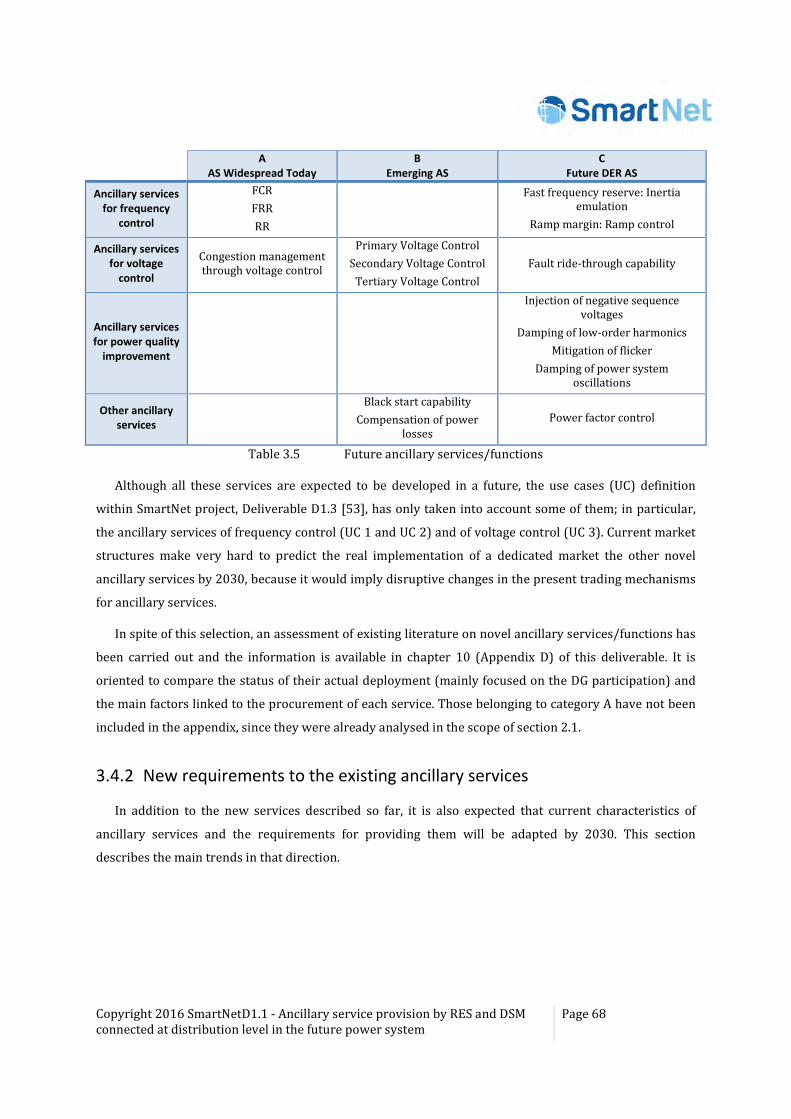
Copyright 2016 SmartNetD1.1 - Ancillary service provision by RES and DSM connected at distribution level in the future power system
Page 68
A
AS Widespread Today B
Emerging AS
C
Future DER AS
Ancillary services
for frequency
control
FCR
FRR
RR
Fast frequency reserve: Inertia
emulation
Ramp margin: Ramp control
Ancillary services
for voltage
control
Congestion management through voltage control
Primary Voltage Control
Secondary Voltage Control
Tertiary Voltage Control
Fault ride-through capability
Ancillary services
for power quality
improvement
Injection of negative sequence voltages
Damping of low-order harmonics
Mitigation of flicker
Damping of power system oscillations
Other ancillary
services
Black start capability
Compensation of power losses
Power factor control
Table 3.5 Future ancillary services/functions
Although all these services are expected to be developed in a future, the use cases (UC) definition
within SmartNet project, Deliverable D1.3 [53], has only taken into account some of them; in particular,
the ancillary services of frequency control (UC 1 and UC 2) and of voltage control (UC 3). Current market
structures make very hard to predict the real implementation of a dedicated market the other novel
ancillary services by 2030, because it would imply disruptive changes in the present trading mechanisms
for ancillary services.
In spite of this selection, an assessment of existing literature on novel ancillary services/functions has
been carried out and the information is available in chapter 10 (Appendix D) of this deliverable. It is
oriented to compare the status of their actual deployment (mainly focused on the DG participation) and
the main factors linked to the procurement of each service. Those belonging to category A have not been
included in the appendix, since they were already analysed in the scope of section 2.1.
3.4.2 New requirements to the existing ancillary services
In addition to the new services described so far, it is also expected that current characteristics of
ancillary services and the requirements for providing them will be adapted by 2030. This section
describes the main trends in that direction.
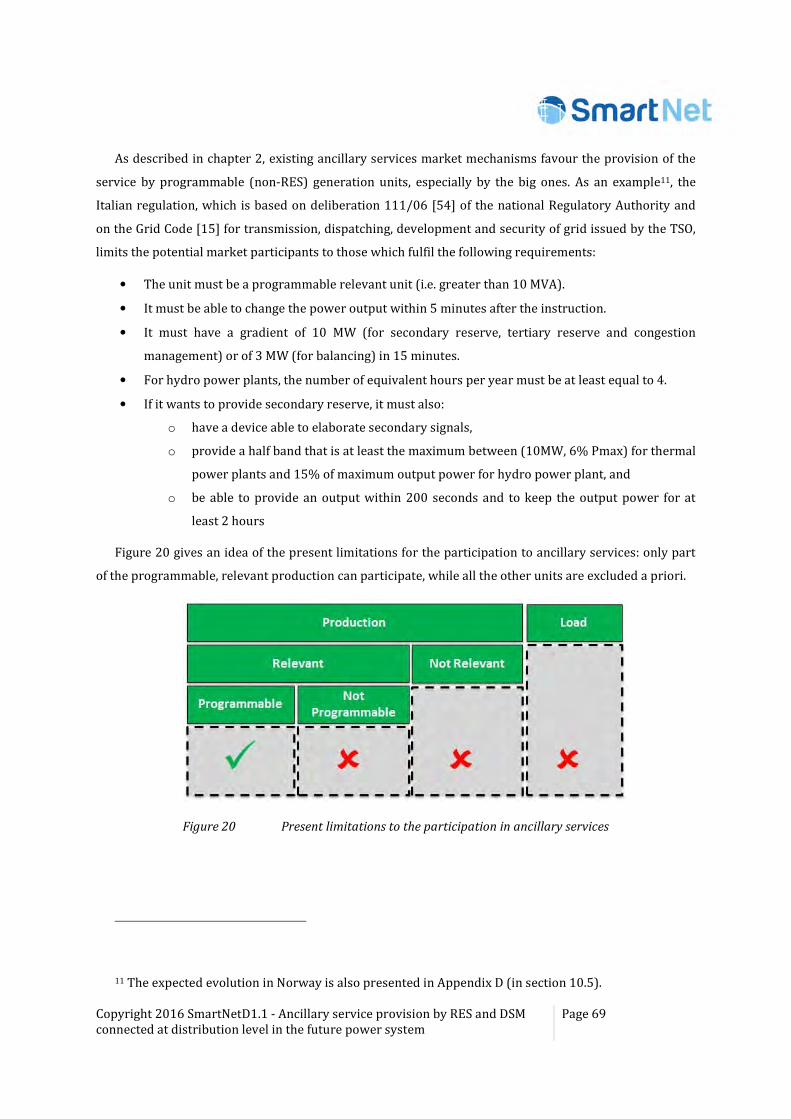
Copyright 2016 SmartNetD1.1 - Ancillary service provision by RES and DSM connected at distribution level in the future power system
Page 69
As described in chapter 2, existing ancillary services market mechanisms favour the provision of the
service by programmable (non-RES) generation units, especially by the big ones. As an example11, the
Italian regulation, which is based on deliberation 111/06 [54] of the national Regulatory Authority and
on the Grid Code [15] for transmission, dispatching, development and security of grid issued by the TSO,
limits the potential market participants to those which fulfil the following requirements:
• The unit must be a programmable relevant unit (i.e. greater than 10 MVA).
• It must be able to change the power output within 5 minutes after the instruction.
• It must have a gradient of 10 MW (for secondary reserve, tertiary reserve and congestion
management) or of 3 MW (for balancing) in 15 minutes.
• For hydro power plants, the number of equivalent hours per year must be at least equal to 4.
• If it wants to provide secondary reserve, it must also:
o have a device able to elaborate secondary signals,
o provide a half band that is at least the maximum between (10MW, 6% Pmax) for thermal
power plants and 15% of maximum output power for hydro power plant, and
o be able to provide an output within 200 seconds and to keep the output power for at
least 2 hours
Figure 20 gives an idea of the present limitations for the participation to ancillary services: only part
of the programmable, relevant production can participate, while all the other units are excluded a priori.
Figure 20 Present limitations to the participation in ancillary services
11 The expected evolution in Norway is also presented in Appendix D (in section 10.5).
Copyright 2016 SmartNetD1.1 - Ancillary service provision by RES and DSM connected at distribution level in the future power system
Page 70
This means that, with the present regulation, there are some barriers to a non-discriminatory
participation at the ancillary services market; in particular, there is a technology limitation, because there
are explicit constraints on generation technologies: load and RES are excluded while the access should be
allowed for all the resources that could potentially provide those services.
There are also limitations on sizing: the access is limited to power plants greater than 10 MVA with
some requirements defined such as secondary margins, gradients, etc., that allow the access only to big
power plants.
Finally, also the service is defined for upward/downward regulation, and this limits the possibility to
provide a service for some actors (i.e. half secondary band for RES power plants).
There are several reasons to pursue for changing the existing situation. The most obvious are:
• Improve the process of procurement and activation of the reserves.
• Involvement of RES into the reserves whenever it is technically possible.
• Encourage harmonisation of balancing markets across Europe.
Following these, several changes have been proposed, based on the public consultation process in
Italy and the intermediate conclusions from Market4RES project [55].
1. Timing of markets: Timing of markets could be modified in order to allow market participants to
react faster to the changing conditions, caused by the intermittent generation. The European
Commission recognises market participants’ needs for “adjusting their balances by trading in the
intraday market time-frame as close as possible to real time” [56] and establishes a maximum time
of one hour between the intraday cross-zonal gate closure and the start of the relevant market time
unit. Although this requirement is more demanding than the existing setups in some countries (see
Figure 3 or Figure 4), some other countries are going even further by establishing shorter periods
between intraday gate closure and real time operation12. These modifications of the present timing
of markets will reduce the imbalance on reduce volumes necessary for provision of the ancillary
services.
2. Minimum bid size requirements and aggregation of the bids: Minimum bid size refers to the
minimum balancing power that must be offered by a single BSP in order to participate in balancing
markets. Depending on the product minimum bid size, small generation and load units may be
prevented from participating in balancing markets if aggregation of individual units’ offers (for
12 https://www.epexspot.com/en/press- media/press/details/press/EPEX_SPOT_and_ECC_to_reduce_Intraday_lead_time_on_all_markets https://www.epexspot.com/en/product-info/intradaycontinuous
Copyright 2016 SmartNetD1.1 - Ancillary service provision by RES and DSM connected at distribution level in the future power system
Page 71
compliance with minimum bid size) is not allowed. This is the case of balancing markets in Spain
where bids must be sent by individual (generation) units. In several countries this obstacle
however already does not exist e.g. at the Nordic Regulating Power market does not distinguish
between a single-object or aggregated bid. Minimum bid size of 1 MW was proposed by
Market4RES project [55] as a common target Europe.
3. Participation of demand products in balancing markets: Several European countries currently
allow participation of demand in the balancing markets from single regulating objects or
aggregated. However, there is no clear framework, which may encourage involvement of the end-
users and design of the necessary market mechanisms.
4. The Imbalance settlement period: The imbalance settlement period refers to the period of time for
which imbalances are calculated. Historically it is different practice in European countries, where
settlement periods vary from 15 minutes (e.g. Belgium, the Netherlands, Germany, Switzerland,
and Austria), 30 minutes (e.g. France), up to 1 hour (e.g. Portugal, Spain, and the Nordic countries).
Short settlement periods contribute to a more cost-reflective imbalance settlement. This can be
explained by the fact that BRPs that have been out of balance within a settlement period may be
balanced over the whole period. Consequently, the costs incurred by the TSO to balance the system
in real time cannot be properly allocated to the responsible market party. Reduction of the
settlement period is also likely to reduce the activated volumes. It is interesting to mention that in
EcoGrid EU project [57] 5 minutes was suggested as initial settlement period and tested in big-
scale demonstration. The project however concluded that 15 minutes would probably be the most
feasible alternative.
Based on these general recommendations, the specific recommendations for the Italian case described
above can be summarised as:
• To enable not only large units, but also aggregation of the smaller ones;
• The gradient should not be expressed in absolute values (10 MW) but with a percentage of the
maximum output power;
• The differentiations in upward and downward bids (no more symmetric as it is actually), so that
also RES can participate to ancillary services market.
Moreover, current standard products traded in Italy are suitable also in a context with high
penetration of decentralised generation. The focus is on the removal of constraints related to the
technology and the size of resources that limit the participation of DER.
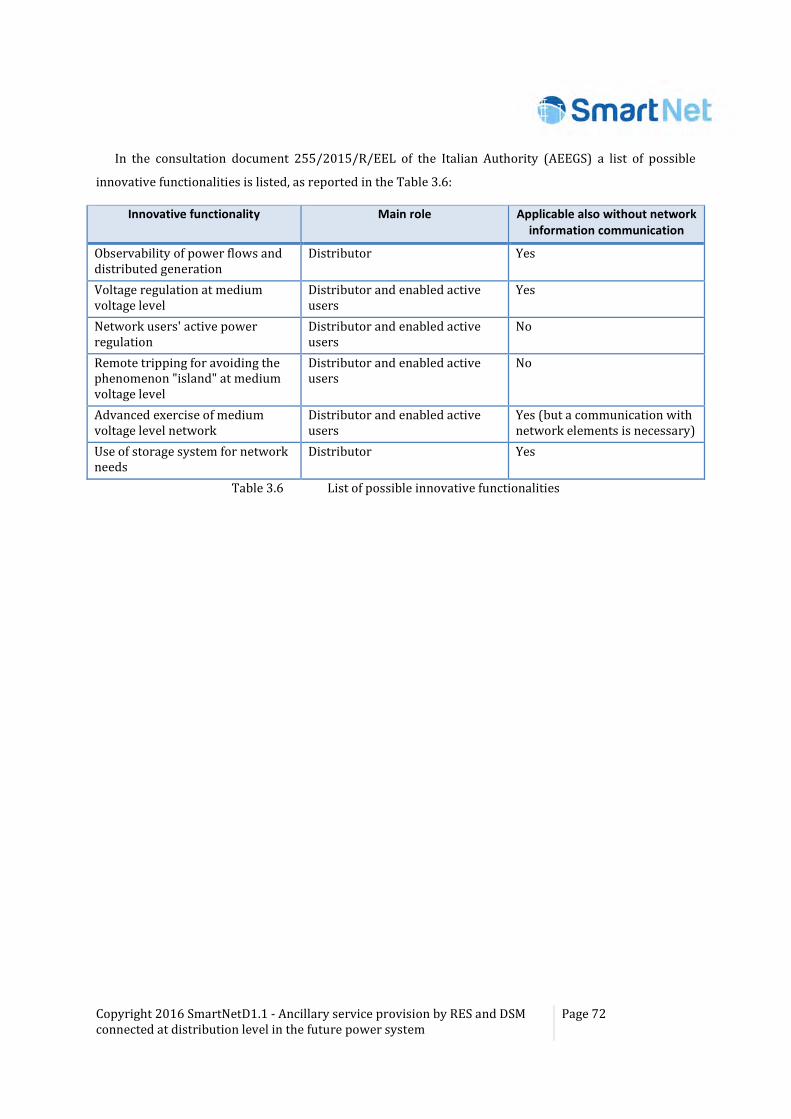
Copyright 2016 SmartNetD1.1 - Ancillary service provision by RES and DSM connected at distribution level in the future power system
Page 72
In the consultation document 255/2015/R/EEL of the Italian Authority (AEEGS) a list of possible
innovative functionalities is listed, as reported in the Table 3.6:
Innovative functionality Main role Applicable also without network
information communication
Observability of power flows and distributed generation
Distributor Yes
Voltage regulation at medium voltage level
Distributor and enabled active users
Yes
Network users' active power regulation
Distributor and enabled active users
No
Remote tripping for avoiding the phenomenon "island" at medium voltage level
Distributor and enabled active users
No
Advanced exercise of medium voltage level network
Distributor and enabled active users
Yes (but a communication with network elements is necessary)
Use of storage system for network needs
Distributor Yes
Table 3.6 List of possible innovative functionalities
Copyright 2016 SmartNetD1.1 - Ancillary service provision by RES and DSM connected at distribution level in the future power system
Page 73
4 Evaluation of the future needs for reserves
In order to guarantee the correct performance of the future European power system, an estimation of
the reserves needs in 2030+ is required. For that purpose, the reserves forecasts for the different
products existing today at a European level can be taken as a basis, together with the methods used by
the responsible agents for such estimations.
In this chapter, this knowledge of current reserves mechanisms will be used as groundwork for
projecting the reserves needs in the SmartNet horizon in Denmark, Italy and Spain through a Reserves
Dimensioning Tool that could be easily extended to any other European country.
4.1 Approaches to reserves sizing
4.1.1 Frequency reserves
The ultimate cause of frequency changes is the difference between active power production and
demand. These frequency deviations can occur as a result of different causes:
• Small and fast variations produced in generation and consumption.
• Stochastic errors coming from the forecasts of plants relying on fluctuating energy sources
(wind, solar…) or from the forecasts for the electricity demand.
• Imbalances between the actual production and consumption curves and the stepwise results of
the market based balancing schedule.
• Large disturbances caused by the sudden disconnection of a generator, a major component of the
transmission network or a big load.
• Network splitting and reconfiguration.
The purpose of frequency control reserves is to maintain the system frequency within its boundary
conditions. In order to determine which the reserves needs are in a power system, three different
approaches can be used:
1. Deterministic: The most straightforward methods for dimensioning of reserves are the
deterministic methods. A deterministic method calculates the reserves starting from a fixed
assumption. This assumption can be the consideration of the event with the largest balancing impact
or the definition of a reference incident to be used for dimensioning.
The reference incident is the worst event occurring on the network that the available reserves need
to be able to handle. This constitutes a simplified (but conservative) version of the deterministic
approach where only the event with the largest impact is considered. In order to calculate the
reserves needs in the deterministic approaches the sum of the contributions from the different
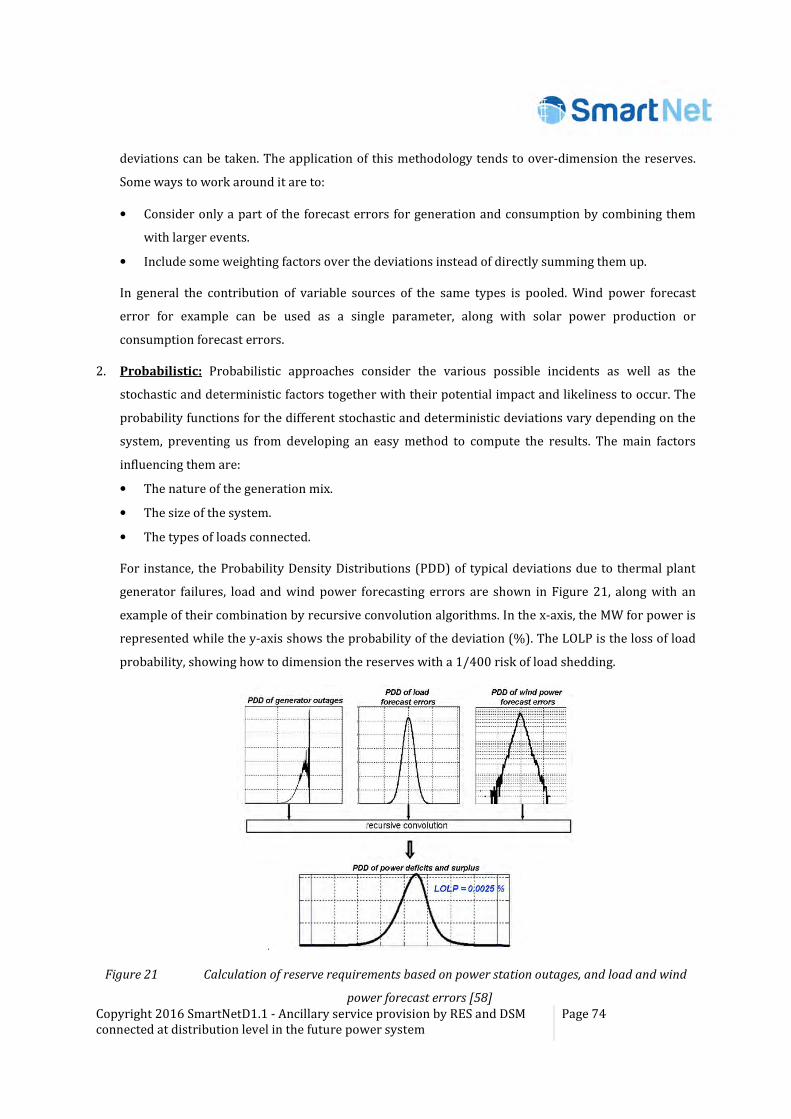
Copyright 2016 SmartNetD1.1 - Ancillary service provision by RES and DSM connected at distribution level in the future power system
Page 74
deviations can be taken. The application of this methodology tends to over-dimension the reserves.
Some ways to work around it are to:
• Consider only a part of the forecast errors for generation and consumption by combining them
with larger events.
• Include some weighting factors over the deviations instead of directly summing them up.
In general the contribution of variable sources of the same types is pooled. Wind power forecast
error for example can be used as a single parameter, along with solar power production or
consumption forecast errors.
2. Probabilistic: Probabilistic approaches consider the various possible incidents as well as the
stochastic and deterministic factors together with their potential impact and likeliness to occur. The
probability functions for the different stochastic and deterministic deviations vary depending on the
system, preventing us from developing an easy method to compute the results. The main factors
influencing them are:
• The nature of the generation mix.
• The size of the system.
• The types of loads connected.
For instance, the Probability Density Distributions (PDD) of typical deviations due to thermal plant
generator failures, load and wind power forecasting errors are shown in Figure 21, along with an
example of their combination by recursive convolution algorithms. In the x-axis, the MW for power is
represented while the y-axis shows the probability of the deviation (%). The LOLP is the loss of load
probability, showing how to dimension the reserves with a 1/400 risk of load shedding.
Figure 21 Calculation of reserve requirements based on power station outages, and load and wind
power forecast errors [58]
Copyright 2016 SmartNetD1.1 - Ancillary service provision by RES and DSM connected at distribution level in the future power system
Page 75
According to ENTSO-E recommendations, the probability density functions representing the
stochastic and deterministic variations to have to be assessed on the basis of the measurements
spanning over at least one year. The use of a convolution product to combine the effects of different
distributions can be made only if the factors are not correlated. For example, PV generation and
forecasting error related to air conditioning loads are correlated. However, ignoring this effect does
not leads to a underestimation of the reserve needs and the approach can be still considered
conservative.
A typical method to handle a convolution product is to calculate them using the fast Fourier
transform of the probability functions.
3. Dynamic: The deterministic and probabilistic methods already described compute the reserves
needs for a long period of time, such as a year. They provide good results when the major or the only
component for sizing is the reference incident. Other sources of deviations, such as errors in RES
generation or load forecasts, can vary quite fast and have very different values throughout a day. For
that reason, it can be more efficient to recalculate the needed amount of reserves at shorter intervals.
The level of dynamicity can be different from case to case. For example, the FCR reserves are adjusted
on a day-ahead basis in Finland, while studies on high levels of wind integration [59] point out that
adjustment to reserve levels may be required up to every 10 minutes. The dynamic approach can be
applied to any of the other approaches presented earlier.
The use of a dynamic approach can help to reduce the costs of acquiring reserves. A longer term
method is still needed to assess the amount of reserves that should be possible to activate at any
given time. The dynamic approach optimises the costs but it works only if the resources are available.
4.1.2 Voltage control reserves
The objective of voltage control is the maintenance of the voltage value within the limits permitted by
voltage quality standards and the restriction of the voltage drop in the event of a short circuit. In section
10 (Appendix D), five different future ancillary services for voltage control are defined: fault ride-through
capability, congestion management, primary voltage control, secondary voltage control and tertiary
voltage control. The categorisation adopted in this section is different from the one used in Appendix D
because this is based on grid phenomena, where a distinction is made between static and dynamic voltage
stability:
• Static voltage stability primarily involves maintenance of local reactive power balance.
• Dynamic voltage stability largely depends on the provision of short circuit power during a
disturbance.
Copyright 2016 SmartNetD1.1 - Ancillary service provision by RES and DSM connected at distribution level in the future power system
Page 76
The TSOs have the commitment to ensure the availability of sufficient resources providing fast
response to ensure normal operation in stationary conditions and to be able to push back the voltage
levels in case of any contingency [11]. This is made by a combination of deterministic and dynamic
approaches (according to the definitions given in subsection 4.1.1 for frequency reserve estimation
methodologies). ). For the dynamic adjustment of the voltage reserves, the worst condition that can be
experienced in the real world (according to the actual generation capacity) it is periodically simulated,
periodically, the worst condition that could take place in real-time, according to the actual generation
capacity. In Tthis way, the reserve estimation of the reserves made in advance is corrected on the basis
based onof the forecasted voltage profile. Current practices in estimating the reserves needs in Europe.
4.2 Current practises in estimating the reserves needs in Europe
4.2.1 Frequency reserves
There are three main types of frequency reserves:
1. Frequency containment reserves (FCR): The establishment of the required FCR needs is
determined by ENTSO-E for every synchronous area at a global level, but the responsibility to
provide the FCR reserves is shared among the different TSOs. The FCR are used to keep the system
balance and correct minor deviations in the synchronous area, as well as to stabilise the system in
case of a severe disturbance (that should be later corrected by the FRR and RR). The FCR needs in
every synchronous area are determined by means of a reference incident.
In the Northern Europe Area (NE) the reference incident is the N-1 criterion and the reserve is
dimensioned on the basis of the worst event that can occur. That disturbance can be the
disconnection of a generating unit, a big load, a high-voltage direct current (HVDC) link or the
tripping of an AC-line. The reference incident is volatile and it is calculated regularly [6]. In NE, the
reference incident has been selected using a deterministic method, considering the maximum
expected instantaneous power deviation between generation and demand in the synchronous area.
The particularisation of the contribution of every country to the FCR reserves is done by introducing
a coefficient affecting the total FCR. This coefficient is the ratio between the energy produced in the
affected country the year before (considering importing/exporting power flows) over the energy
produced (also the year before) in the whole synchronous area. Therefore, this coefficient is dynamic
and has to be updated annually.
In the Continental Europe area (CE), with more generating units, lines and loads, it is more likely that
a second disturbance would occur before the first one has been completely recovered. In that case the
N-1 criterion has a higher probability of not being sufficient and the N-2 criterion has shown to be the
best practice by applying probabilistic techniques. In this case, two disturbances as described above
Copyright 2016 SmartNetD1.1 - Ancillary service provision by RES and DSM connected at distribution level in the future power system
Page 77
can occur simultaneously. In the CE synchronous area, the reference incident is currently considered
to be 3000 MW (two nuclear power units of 1500 MW each) [6]. The share between countries follows
the same rule as in the NE area, which is the application of a yearly updated coefficient over the total
to make the distribution of FCR obligations among partners.
In both reference incidents, the reserve exhaustion possibility is checked by using probabilistic
methods that combine the effectively used FCR reserves together with the existing Frequency
Restoration Control Error.
2. Frequency restoration reserves (FRR): The frequency restoration reserves have to be determined
for every control area belonging to the synchronous region. The FRR rules, for example, the
aFRR/mFRR ratio, have to be agreed between the TSOs in the same control block. In Spain, REE is the
responsible for determining these needs for FRR reserves (jointly with REN, the Portuguese TSO,
since they share the control block), whereas Terna must determine the requirements for the Italian
case. In the Nordic countries, the situation is a bit different because several TSOs have responsibility
on the NE, which is a single control block/control area. As a result, all the involved TSOs have to agree
to fulfil the common goal of FRR reserves.
The ENTSO-E recommendations to settle the minimum values of reserves in the CE and in NE given
by ENTSO-E are based on the combination of both deterministic and probabilistic methods. The
deterministic method uses the reference incident, which has to be combined with the historical
records of the TSO (for at least one year). From this approach, the minimum requirement of FRR
reserves established for the UCTE area [11] is shown in equation (2):
� � ����� �� � (2)
Where a and b are known coefficients (10MW and 150MW respectively) and Lmax is the anticipated
consumer load in the control block. Considering the recommendations of the Network Code on LFCR
[40], the minimum upward reserve in the whole Control Block should not be less than the positive
value of the reference incident and the negative downward reserve should not be smaller than the
negative reference incident. However, by common agreements between neighbouring blocks and
considering probabilistic indexes, these minimum requirements for reserves can be reduced.
3. Replacement Reserves (RR): As for the FRR, an agreement in the rules between the TSOs belonging
to the same control block has to be reached. The RR must be sufficient to, at least, replace the
operation of the FCR and FRR, both upwards and downwards.
4.2.2 Voltage control reserves
According to the ENTSO-E operational handbook, the recommended procedure to estimate the voltage
control reserves is to apply the N-1 criterion to several facilities. Each generator is obliged, by the TSO in
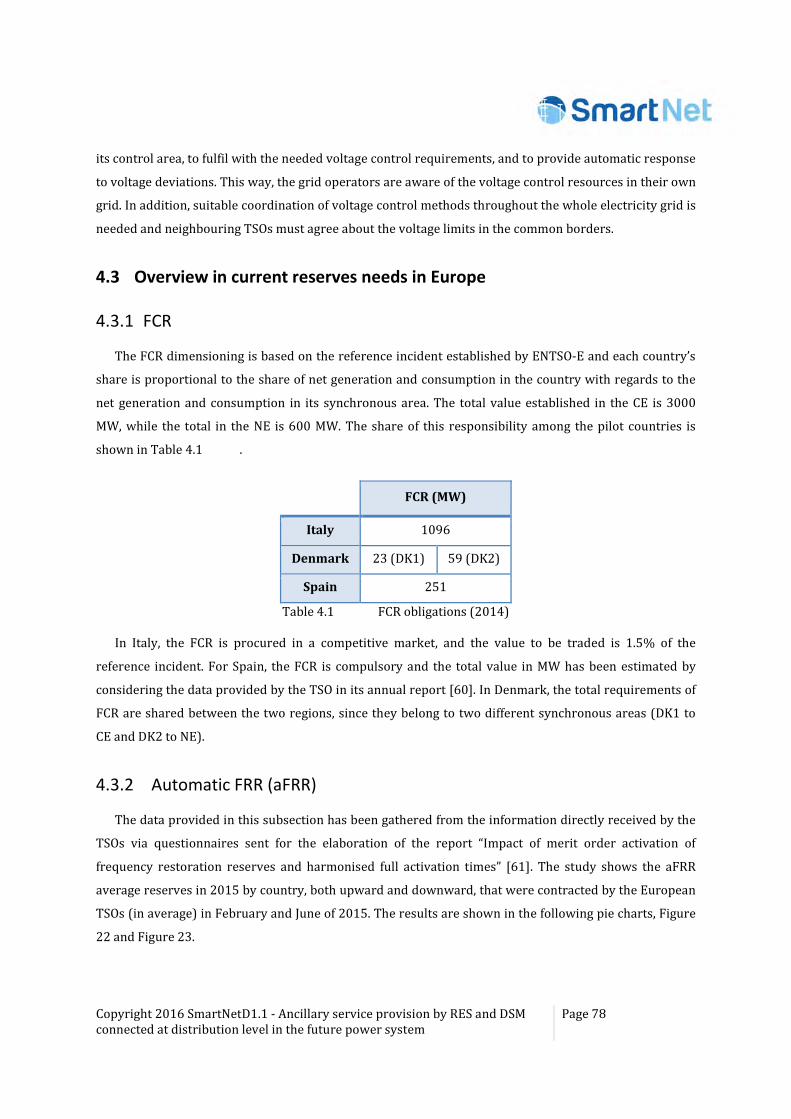
Copyright 2016 SmartNetD1.1 - Ancillary service provision by RES and DSM connected at distribution level in the future power system
Page 78
its control area, to fulfil with the needed voltage control requirements, and to provide automatic response
to voltage deviations. This way, the grid operators are aware of the voltage control resources in their own
grid. In addition, suitable coordination of voltage control methods throughout the whole electricity grid is
needed and neighbouring TSOs must agree about the voltage limits in the common borders.
4.3 Overview in current reserves needs in Europe
4.3.1 FCR
The FCR dimensioning is based on the reference incident established by ENTSO-E and each country’s
share is proportional to the share of net generation and consumption in the country with regards to the
net generation and consumption in its synchronous area. The total value established in the CE is 3000
MW, while the total in the NE is 600 MW. The share of this responsibility among the pilot countries is
shown in Table 4.1 .
FCR (MW)
Italy 1096
Denmark 23 (DK1) 59 (DK2)
Spain 251
Table 4.1 FCR obligations (2014)
In Italy, the FCR is procured in a competitive market, and the value to be traded is 1.5% of the
reference incident. For Spain, the FCR is compulsory and the total value in MW has been estimated by
considering the data provided by the TSO in its annual report [60]. In Denmark, the total requirements of
FCR are shared between the two regions, since they belong to two different synchronous areas (DK1 to
CE and DK2 to NE).
4.3.2 Automatic FRR (aFRR)
The data provided in this subsection has been gathered from the information directly received by the
TSOs via questionnaires sent for the elaboration of the report “Impact of merit order activation of
frequency restoration reserves and harmonised full activation times” [61]. The study shows the aFRR
average reserves in 2015 by country, both upward and downward, that were contracted by the European
TSOs (in average) in February and June of 2015. The results are shown in the following pie charts, Figure
22 and Figure 23.
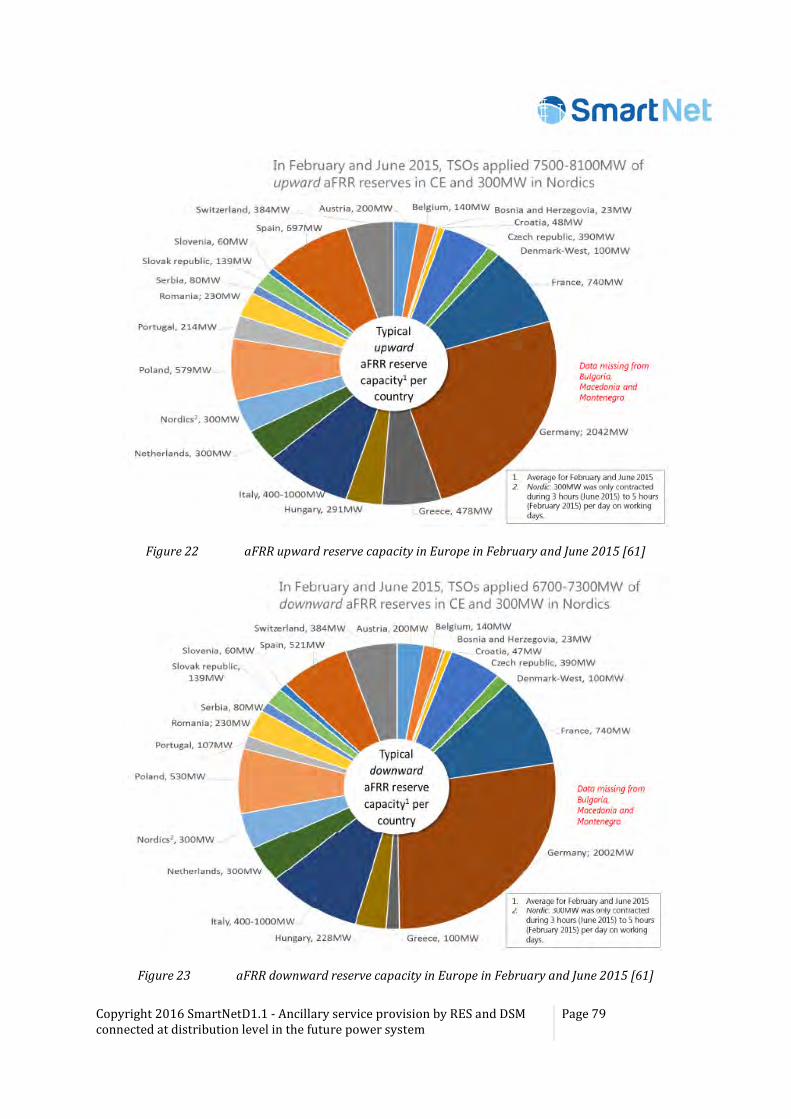
Copyright 2016 SmartNetD1.1 - Ancillary service provision by RES and DSM connected at distribution level in the future power system
Page 79
Figure 22 aFRR upward reserve capacity in Europe in February and June 2015 [61]
Figure 23 aFRR downward reserve capacity in Europe in February and June 2015 [61]
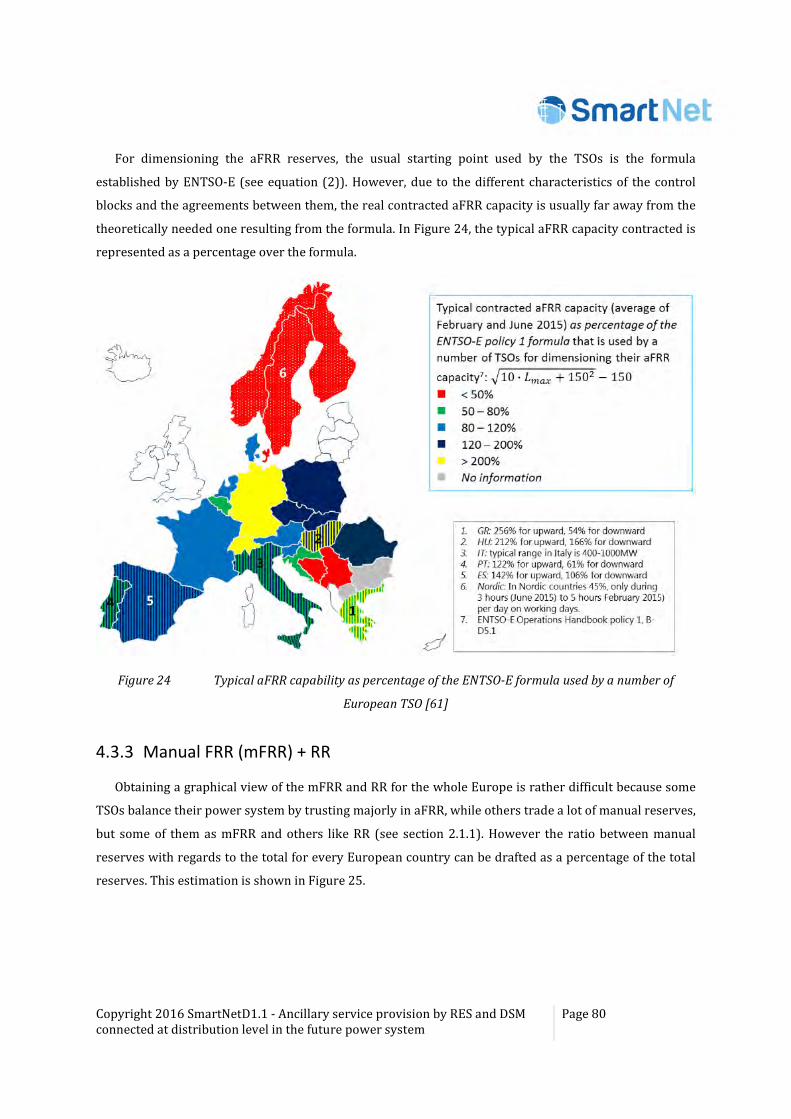
Copyright 2016 SmartNetD1.1 - Ancillary service provision by RES and DSM connected at distribution level in the future power system
Page 80
For dimensioning the aFRR reserves, the usual starting point used by the TSOs is the formula
established by ENTSO-E (see equation (2)). However, due to the different characteristics of the control
blocks and the agreements between them, the real contracted aFRR capacity is usually far away from the
theoretically needed one resulting from the formula. In Figure 24, the typical aFRR capacity contracted is
represented as a percentage over the formula.
Figure 24 Typical aFRR capability as percentage of the ENTSO-E formula used by a number of
European TSO [61]
4.3.3 Manual FRR (mFRR) + RR
Obtaining a graphical view of the mFRR and RR for the whole Europe is rather difficult because some
TSOs balance their power system by trusting majorly in aFRR, while others trade a lot of manual reserves,
but some of them as mFRR and others like RR (see section 2.1.1). However the ratio between manual
reserves with regards to the total for every European country can be drafted as a percentage of the total
reserves. This estimation is shown in Figure 25.
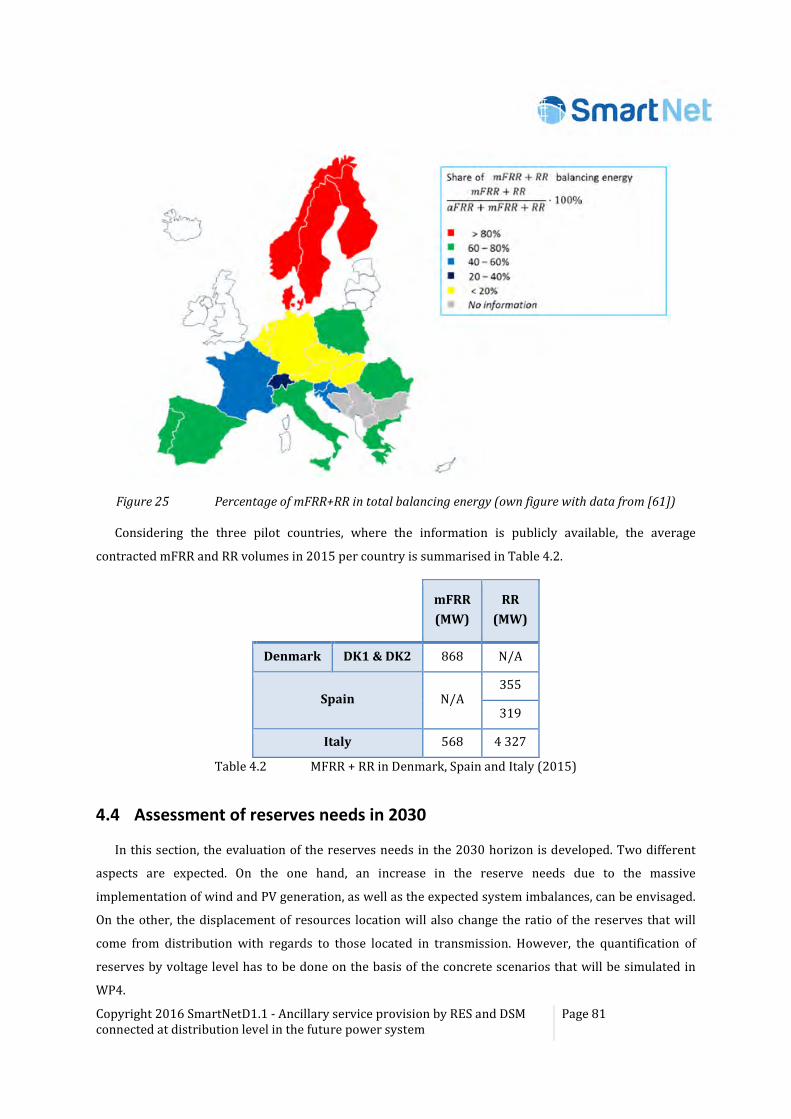
Copyright 2016 SmartNetD1.1 - Ancillary service provision by RES and DSM connected at distribution level in the future power system
Page 81
Figure 25 Percentage of mFRR+RR in total balancing energy (own figure with data from [61])
Considering the three pilot countries, where the information is publicly available, the average
contracted mFRR and RR volumes in 2015 per country is summarised in Table 4.2.
mFRR
(MW)
RR
(MW)
Denmark DK1 & DK2 868 N/A
Spain N/A 355
319
Italy 568 4 327
Table 4.2 MFRR + RR in Denmark, Spain and Italy (2015)
4.4 Assessment of reserves needs in 2030
In this section, the evaluation of the reserves needs in the 2030 horizon is developed. Two different
aspects are expected. On the one hand, an increase in the reserve needs due to the massive
implementation of wind and PV generation, as well as the expected system imbalances, can be envisaged.
On the other, the displacement of resources location will also change the ratio of the reserves that will
come from distribution with regards to those located in transmission. However, the quantification of
reserves by voltage level has to be done on the basis of the concrete scenarios that will be simulated in
WP4.
Copyright 2016 SmartNetD1.1 - Ancillary service provision by RES and DSM connected at distribution level in the future power system
Page 82
4.4.1 Frequency control reserves
As discussed in section 4.2, there are three (four if both mFRR and RR are implemented) main types of
frequency control reserves. Each country normally uses three types of reserves for different purposes. In
all of them, FCR perform a similar role, but they are calculated in a centralised way and they are not able
to contain frequency fluctuations for a long time. On the other hand, slower reserves can provide a more
significant balancing capability and these can be traded in market environments. Therefore, the Reserve
Dimensioning Tool has been designed to obtaining the reserve needs for aFRR, mFRR and RR. As
described in section 4.3.3, RR is not considered separately but as part of mFRR.
The methodology used in SmartNet is based on the heuristics approach applied by the Belgian TSO,
Elia [62], which is based on ENTSO-E recommendations. It roots on the combination of deterministic and
probabilistic techniques. This approach was selected for three key reasons:
• It simplifies data needs compared to probabilistic methods.
• It is aligned with the current approaches applied by TSOs.
• It provides a rough but conservative estimation on balancing needs.
The total reserve is calculated taking into consideration the main sources of uncertainties in the
power systems, both in the demand (load) side and in the side of non-dispatchable energy production
(mainly wind and PV generation). The equation (4) represents the total reserve needs in a power system,
in MW:
TR � ���� ���� ���� ����� �� (3)
• ����: Maximum generation loss (in MW). E.g. largest nuclear power plant. This amount depends
on the system’s Reference Incident.
• ����: Demand deviation error. Taken into account by increasing reserve needs by a percentage of
the forecasted demand. E.g. x = 2% (in Spain).
• ����: Wind power deviation error. Taken into account by increasing reserve needs to cover a
certain percentile of wind forecast error (e.g. 99th percentile).
• �����: PV power deviation error. Taken into account by increasing reserve needs to cover a
certain percentile of PV forecast error (e.g. 99th percentile).
• AR: Additional reserve needed to cope with further deviations of forecasts and market schedules
as well as to manage international connections.
In order to have a simpler formulation, some of the equation terms are grouped and equation
TR � �� ���� ����� (4) is obtained:
TR � �� ���� ����� (4)
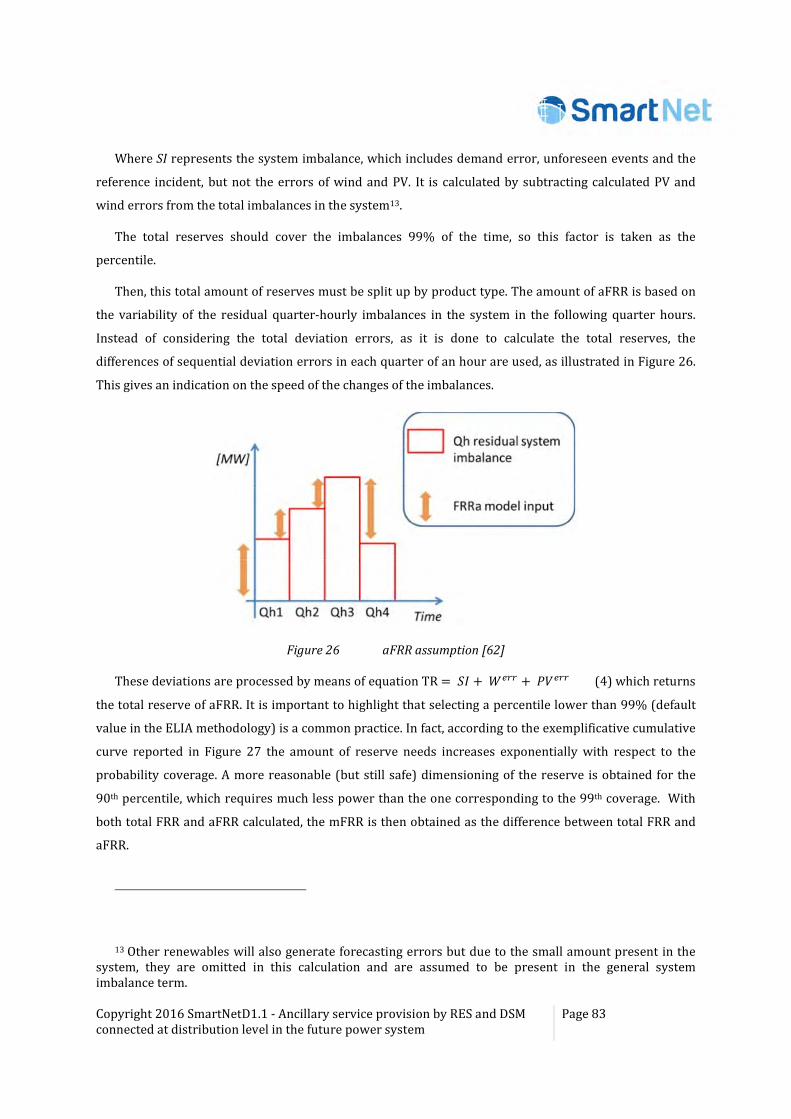
Copyright 2016 SmartNetD1.1 - Ancillary service provision by RES and DSM connected at distribution level in the future power system
Page 83
Where SI represents the system imbalance, which includes demand error, unforeseen events and the
reference incident, but not the errors of wind and PV. It is calculated by subtracting calculated PV and
wind errors from the total imbalances in the system13.
The total reserves should cover the imbalances 99% of the time, so this factor is taken as the
percentile.
Then, this total amount of reserves must be split up by product type. The amount of aFRR is based on
the variability of the residual quarter-hourly imbalances in the system in the following quarter hours.
Instead of considering the total deviation errors, as it is done to calculate the total reserves, the
differences of sequential deviation errors in each quarter of an hour are used, as illustrated in Figure 26.
This gives an indication on the speed of the changes of the imbalances.
Figure 26 aFRR assumption [62]
These deviations are processed by means of equation TR� �� ���� ����� (4) which returns
the total reserve of aFRR. It is important to highlight that selecting a percentile lower than 99% (default
value in the ELIA methodology) is a common practice. In fact, according to the exemplificative cumulative
curve reported in Figure 27 the amount of reserve needs increases exponentially with respect to the
probability coverage. A more reasonable (but still safe) dimensioning of the reserve is obtained for the
90th percentile, which requires much less power than the one corresponding to the 99th coverage. With
both total FRR and aFRR calculated, the mFRR is then obtained as the difference between total FRR and
aFRR.
13 Other renewables will also generate forecasting errors but due to the small amount present in the system, they are omitted in this calculation and are assumed to be present in the general system imbalance term.
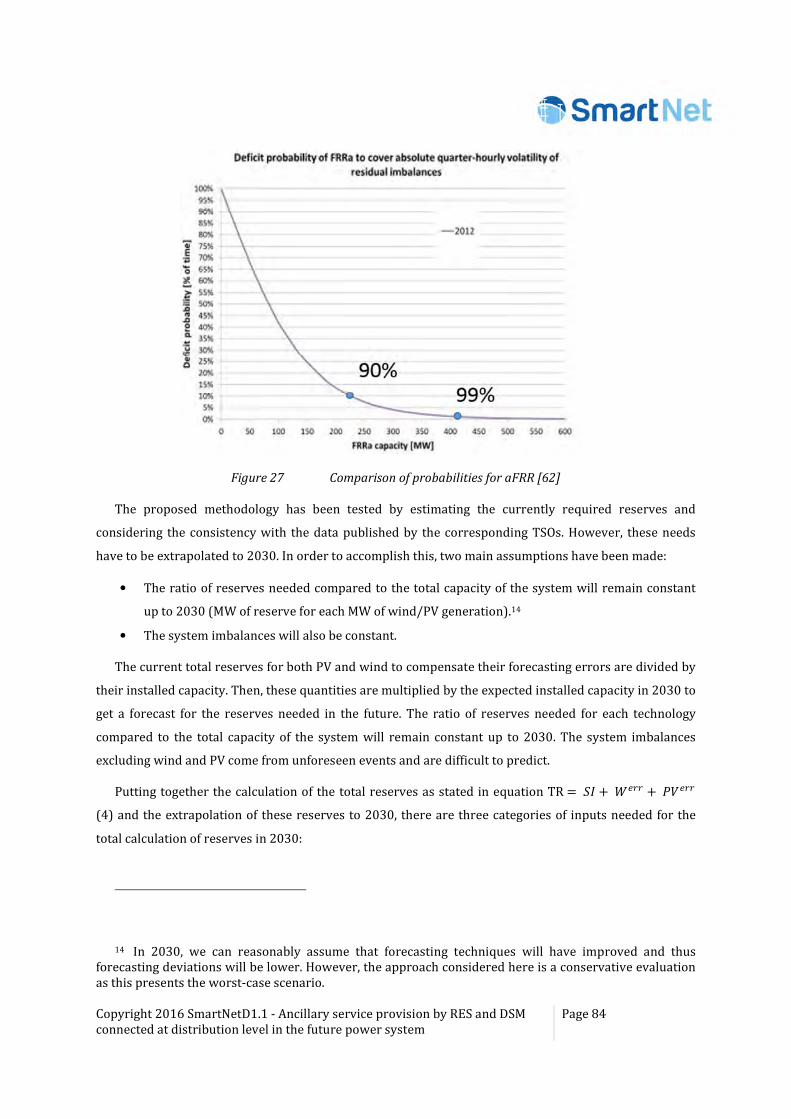
Copyright 2016 SmartNetD1.1 - Ancillary service provision by RES and DSM connected at distribution level in the future power system
Page 84
Figure 27 Comparison of probabilities for aFRR [62]
The proposed methodology has been tested by estimating the currently required reserves and
considering the consistency with the data published by the corresponding TSOs. However, these needs
have to be extrapolated to 2030. In order to accomplish this, two main assumptions have been made:
• The ratio of reserves needed compared to the total capacity of the system will remain constant
up to 2030 (MW of reserve for each MW of wind/PV generation).14
• The system imbalances will also be constant.
The current total reserves for both PV and wind to compensate their forecasting errors are divided by
their installed capacity. Then, these quantities are multiplied by the expected installed capacity in 2030 to
get a forecast for the reserves needed in the future. The ratio of reserves needed for each technology
compared to the total capacity of the system will remain constant up to 2030. The system imbalances
excluding wind and PV come from unforeseen events and are difficult to predict.
Putting together the calculation of the total reserves as stated in equation TR� �� ���� �����
(4) and the extrapolation of these reserves to 2030, there are three categories of inputs needed for the
total calculation of reserves in 2030:
14 In 2030, we can reasonably assume that forecasting techniques will have improved and thus forecasting deviations will be lower. However, the approach considered here is a conservative evaluation as this presents the worst-case scenario.
Copyright 2016 SmartNetD1.1 - Ancillary service provision by RES and DSM connected at distribution level in the future power system
Page 85
• Both for wind and PV, the historical generation and the historical forecast for that generation is
required so that the forecast errors can be calculated.
• For the system imbalance, the general imbalance of the system is needed. Together with the wind
and PV errors, a new term can be calculated by subtracting wind and PV from the total system
imbalance. This gives a new term called “SI-RES” that considers the additional imbalances in the
system.
• For the 2030 forecast, both the currently installed capacity and the forecasted capacity in 2030
are needed, as well as both wind and PV capacities. For Italy and Spain, data from the PRIMES
model is used. For Denmark, data from PRIMES is only used for the forecast [19]. However, as
Denmark has two synchronous areas and only DK1 (West Denmark) is considered here, the data
is adjusted by taking 75% of the total for wind and 70% for PV. These ratios are calculated from
data provided by Energinet.dk, the Danish TSO.
Most data was with quarter-hourly granularity and for one whole year, i.e. 2015. The data with a
different granularity was adapted in order to fit into the methodology.
As some data was only available with hourly granularity, the impact on aFRR had to be adjusted. For
this purpose, data from Germany was analysed for 2015 and 2016. The average deviation for aFRR when
using hourly data instead of quarter-hourly data was around 40%, meaning that hourly data gives 40%
less reserves than quarter-hourly data. However, results are still limited as these differences will not be
the same for each country.
As some data was only available with hourly granularity, the impact on aFRR had to be adjusted. For
this purpose, the following method was used:
1. aFRR calculations are done for Germany15, both for 15-minute and hourly data sets.
2. The average deviation between both data sets was calculated.
3. There is a reduction of 40% when using hourly data compared to 15-minute data
Therefore, the aFRR reserve calculations for countries with hourly data are reduced by 40%.
The application of the methodology and the calculation of the reserves for the pilot countries in
SmartNet (Denmark, Italy and Spain) are shown below.
The total reserves calculated by the tool for Denmark by 2030 are shown in Table 4.3:
15 German data is used for this as both 15-minute data and hourly data was available and the data is more reliable due to the experience with RES and forecasting
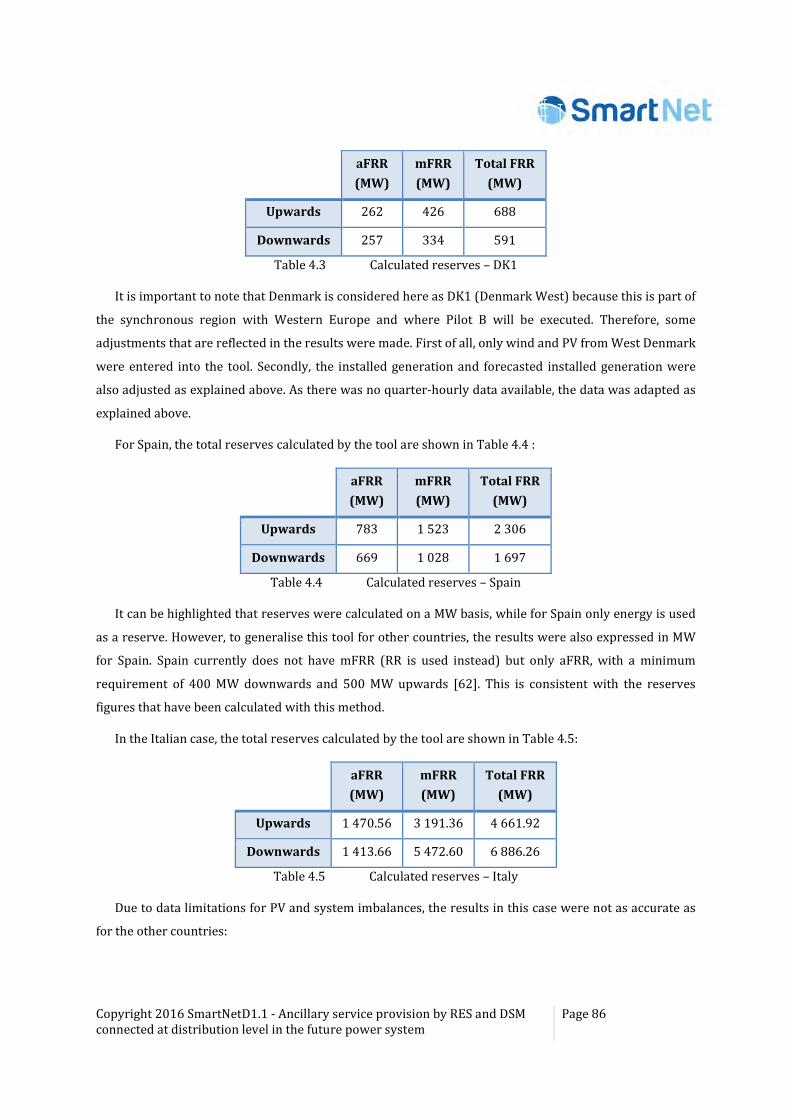
Copyright 2016 SmartNetD1.1 - Ancillary service provision by RES and DSM connected at distribution level in the future power system
Page 86
aFRR
(MW)
mFRR
(MW)
Total FRR
(MW)
Upwards 262 426 688
Downwards 257 334 591
Table 4.3 Calculated reserves – DK1
It is important to note that Denmark is considered here as DK1 (Denmark West) because this is part of
the synchronous region with Western Europe and where Pilot B will be executed. Therefore, some
adjustments that are reflected in the results were made. First of all, only wind and PV from West Denmark
were entered into the tool. Secondly, the installed generation and forecasted installed generation were
also adjusted as explained above. As there was no quarter-hourly data available, the data was adapted as
explained above.
For Spain, the total reserves calculated by the tool are shown in Table 4.4 :
aFRR
(MW)
mFRR
(MW)
Total FRR
(MW)
Upwards 783 1 523 2 306
Downwards 669 1 028 1 697
Table 4.4 Calculated reserves – Spain
It can be highlighted that reserves were calculated on a MW basis, while for Spain only energy is used
as a reserve. However, to generalise this tool for other countries, the results were also expressed in MW
for Spain. Spain currently does not have mFRR (RR is used instead) but only aFRR, with a minimum
requirement of 400 MW downwards and 500 MW upwards [62]. This is consistent with the reserves
figures that have been calculated with this method.
In the Italian case, the total reserves calculated by the tool are shown in Table 4.5:
aFRR
(MW)
mFRR
(MW)
Total FRR
(MW)
Upwards 1 470.56 3 191.36 4 661.92
Downwards 1 413.66 5 472.60 6 886.26
Table 4.5 Calculated reserves – Italy
Due to data limitations for PV and system imbalances, the results in this case were not as accurate as
for the other countries:
Copyright 2016 SmartNetD1.1 - Ancillary service provision by RES and DSM connected at distribution level in the future power system
Page 87
• For PV, data of realised generation was only available for 5% of the total installations. Therefore,
we took this 5% as representative for the whole country but deviations are likely to occur as this
is a large/strong assumption.
• For imbalances, no raw data was available. Instead, data of calculated imbalances based on bids
in the balancing market was used. However, this data was not available for a full year (only 2
months), which may cause results to deviate from reality and also makes them not comparable
with the other countries.
4.4.2 Voltage control reserves
The voltage control reserves have a local character and they are largely dependent on the grid
topologies. As a result, it is complicated to have the required data to evaluate the voltage control needs in
the different pilot countries in 2030+. Moreover, the WP4 simulations exclude the use of voltage control
reserves and, hence, the lack of data for calculation of voltage reserve needs is not determining for the
SmartNet purpose. In future scenarios, we can have an increased need for localised reserves. In the same
way as FRR reserves are currently separated between control areas in order to better control the power
flows, some new reserves could be beneficial to help alleviate congestion and to provide voltage control
at the distribution level.
However, in order to review how the future development of voltage control needs could be, the
situation of two countries where this problem has already been considered by local organisations are
analysed: Germany, as an example of a strong and meshed grid with a high degree of variable distributed
sources installed, and Ireland, as a representative mock-up of a weak grid.
Reactive power provision 4.4.2.1
As an example of voltage reserves calculation according to future grid developments, a study prepared
by the German Energy Agency [64] is presented. The reactive power demand at each grid node was
calculated for 8760 use cases (one per hour in a year) utilising the optimal power flow. The calculation
was first carried out without a consideration of reactive power sources and the results represented the
demand. In a second step, all available controllable resources were considered, and the additional
demand to be covered by alternative sources was identified. Both the Rhine-Ruhr region and Greater
Bremen were found to be the areas with the highest additional capacitive and inductive demand,
respectively. The additional capacitive demand required in Rhine-Ruhr region was 2753 MVAr and the
additional inductive demand for Greater Bremen was 562 MVAr. The range of reactive power demand at
the grid nodes was found to be higher overall.
Copyright 2016 SmartNetD1.1 - Ancillary service provision by RES and DSM connected at distribution level in the future power system
Page 88
In sum, the demand for reactive power in the transmission and distribution grids will increase in
Germany for 2030, as well as the demand for reactive power control in distribution grids. Although
reactive power demand calculation was carried out in the study, the study does not highlight quantitative
results of the changes in reactive power demand, but rather emphasised the trends and factors affecting
the needs as well as potential situations and locations where lack of reactive power may occur in future. It
is also important to notice that results from individual reactive power demand calculations cannot be
extrapolated to indicate the additional reactive power demand in other cases. The additional reactive
power demand in individual cases needs to be calculated separately taking into account the grid topology
and the available reactive power capacity. In the context of SmartNet this will also be an outcome of the
simulations in WP4.
For other countries, like Ireland, the future reserves needs for voltage control are more difficult to
estimate based on national studies and other literature. The current performance of the Irish system is
not causing significant problems at present, although the system is becoming more stretched. An Irish
study [65] states that given the nature of the changes to the types, connection methods and location of the
future generation portfolio, together with the development and evolution of the transmission and
distribution networks, it is difficult to predict exactly how much reactive power will be required and
where. However, the study estimates that it is reasonable to expect that secure system operation will
require a reactive power range that is broadly similar to the one at present.
In Ireland, existing generation has slightly better capabilities in terms of lagging reactive power and
poorer capabilities in terms of leading reactive power than required by the new grid codes. It is assumed
that new generation will replace the existing one to fulfil the new grid codes. Thus, the system capability
for lagging reactive power is expected to fall while the level of leading reactive power is expected to rise,
as shown in Table 4.6 for different 2020 capabilities (wind power not providing reactive power,
transmission grid connected wind power providing reactive power 0.95 lag/lead, and all wind power
providing reactive power 0.95 lag/lead) [65].
Lagging MVar Leading MVar
2010 3 510 1 570
2020 (only conventional) 2 650 (-24 %) 1 310 (-16 %)
2020 (wind in transmission) 3 240 (-8 %) 2 000 (+21 %)
2020 (all wind) 3 830 (+9 %) 2 480 (+58 %)
Table 4.6 Average available reactive power in Irish system
The fundamental shift from bulk power generation and transmission system into a system with high
levels of embedded variable generation may increase the range of reactive power control that is required
to maintain system voltages within limits. The demand for reactive power may become higher than
Copyright 2016 SmartNetD1.1 - Ancillary service provision by RES and DSM connected at distribution level in the future power system
Page 89
expected due to additional capacitances in the transmission network and the distributed nature of wind
generation.
Short-circuit power provision 4.4.2.2
According to the study of the German Energy Agency abovementioned, the volume of available short
circuit power in Germany still mostly depends on the number and the apparent power of the grid-
connected synchronous generators, as well as their electrical distance to the fault location.
One trend stated in the German study is that construction of new generation units in distribution grids
will be associated with an increase in transfer capacity demand at the interfaces between the
transmission and the distribution grid. This will require the construction of additional transformers or
new grid interconnections, which will increase the coupling between the respective grid levels. This is
expected to increase the short circuit current contributions from the transmission grid in case of faults in
the distribution grid.
In the study, the short circuit power development trend in the German electricity grid was calculated
based on an aggregated European transmission grid model and a showcase 110 kV distribution grid.
Based on them, the short circuit power in Germany will increase by 20% on average by 2033. Minimum
and maximum short circuit capacity levels will not be exceeded. The short circuit power of industrial
regions will continue to be far higher than that of rural areas.
The largest share of renewable energy systems in Germany will continue to be installed in the 110 kV
distribution grid, and not the 380 kV transmission grid. According to existing standard grid codes, wind
turbines and PV systems disconnect from the grid in times when there is no active power supply. This is
expected to lead to a certain level of weather and daytime-dependent fluctuations in the available short
circuit power. However, Decentralised Energy Conversion Units with converters would be technically
able to supply reactive current without primary energy provision and, consequently, stay connected to
the grid at any time to provide short circuit power.
In sum, the bandwidth of the short circuit power available will hardly change in Germany by 2030.
However, major time-dependent fluctuation at all grid levels is expected, due to the boost of decentralised
energy units.
In Ireland, it is expected that at high non-synchronous penetration levels, the transient stability of the
system will be significantly compromised, due to the reduction in synchronising torque - the forces that
keep generators operating in unison. According to the Irish study [65], the percentage of contingencies
with critical clearance time of less than 200 milliseconds will increase, meaning that the system will
become less transiently stable at high shares of wind power.

Copyright 2016 SmartNetD1.1 - Ancillary service provision by RES and DSM connected at distribution level in the future power system
Page 90
The provision of dynamic reactive power from network devices (e.g., synchronous compensators or
wind power plants) during voltage disturbances could be used to improve the transient stability of the
system, by increasing the critical clearance time of the most onerous faults. In the Irish study, these
strategies to improve the transient stability relied on wind power plants which are able to provide
significant reactive current during voltage disturbances. However, the grid codes may not be that
demanding for wind power plants - particularly not for distribution grid connected wind power plants.
The main cause for the reserve needs in distribution would be the congestion created by high or low
levels of production by DER units, combined with variable levels of local consumption. Depending on the
local regulations and the market prices, there could be situations where contracting local reserves could
be used instead of the curtailment of DER for solving the congestion issues. These reserves could be
voltage-controlled or activated by tripping signals in case the power flows in the transformers reach
specific limits.
It should be noted that resources providing simultaneous reserves services on a local level could lead
to voltage problems if, for instance, the activation of reserves for the larger area needs would create a
local congestion. In this case, the dimensioning of the reserves in that area must include some restrictions
and the amount of global reserves should be adjusted in accordance. Clear rules regarding priority of
activation signals, as well as for measurement and settlement of actions, should be agreed upon between
the different actors. Otherwise a resource could receive, for example, upward and downward activation
signals from different controllers.
Copyright 2016 SmartNetD1.1 - Ancillary service provision by RES and DSM connected at distribution level in the future power system
Page 91
5 Summary and conclusions
This deliverable carries out a thorough analysis of the current status of ancillary services provision as
well as an overview in the existing market structures in Europe by regions (North/Central/South). In
order to identify the ancillary services needs that could exist in the SmartNet horizon (2030), the main
trends concerning the generation/consumption mix changes, the boost of DER devices and DSM, the
reduction of inertia or the improvement of the cross-border interconnections have also been analysed.
From the comparative study on current status of ancillary services markets together with the
expected changes in the power networks by 2030, it has been possible to foresee, on the one hand, which
novel ancillary services or products could be provided in the future by DER/DSM from distribution to
transmission and, on the other hand, how could the future regulations evolve concerning to the ancillary
services markets.
A method to create some high-level scenarios for being used as a framework for mapping the different
countries with pilots in SmartNet has been developed and it is shown in this document. These scenarios
have been derived as a function of their generation mix and the interconnection degree with the
neighbouring countries, both considered the key impact factors. Eventually, a methodology to make a
quantitative evaluation of the reserves needs has been deployed. The results of the application of the tool
to the pilot countries (Denmark, Italy, Spain) are also presented.
As a summary, the main conclusions that can be drawn from work done in this document are:
• Regardless the fulfilment of several minimum requirements established by ENTSO-E, the
ancillary services mechanism is freely stated by each country, which leads to great
heterogeneity. Thus, while the main issues related to the frequency control and voltage
control services definition maintain certain similarity between countries, the acceptance
criteria for other ancillary services is determined individually by each country.
• The Directive 2009/72/EC intends to increase the convergence across Member States
towards a unified market, ensuring non-discriminatory access for all market players (new
providers, final customers and aggregators of final customers), while facilitating their
participation in reserve and balancing markets. The day-ahead provision mechanisms are
rather similar over the countries and there are a few differences in intraday markets (i.e.
remuneration schema), but these differences are more pronounced in the ancillary services
markets (minimum bid size, mandatory vs. non-mandatory, marginal price vs. pay as bid,
etc.).
• The current regulatory frameworks still encourage the traditional network investments,
dissuading of the use of ancillary services from DER. As a consequence, the national criteria
for the provision of ancillary services usually promotes the use of large centralised power
Copyright 2016 SmartNetD1.1 - Ancillary service provision by RES and DSM connected at distribution level in the future power system
Page 92
plants for it; e. g. minimum bid size of at least 1 MW, symmetrical bids, aggregation of small
prosumers not allowed, etc.
• Based on current and expected future development, the pilot countries were mapped to the
SmartNet scenarios and it can be outlined that: in all the cases, 2030-emissions targets seem
to be feasible at the whole EU level. Both Denmark and Italy are expected to fulfil these
targets with an important contribution of RES. However, for Spain, emissions trading
mechanisms among the European countries will be required. Even though RES contribution
to the energy mix is already very high, it seems not to be enough to meet the target and
national 2030 framework does not encourage further investment. With respect to
cross-border interconnections, almost all European countries (with the exception of Spain)
are in a good position to fulfil the 10% interconnection capacity goal16 by 2020. The border
links between Spain and France are the most congested in Europe and, although some
projects aim to improve them, they will be insufficient to allow the 10% achievement, as the
current ratio is still far from the target.
• The results of the most common methods to estimate the reserves needs by TSOs
(probabilistic, deterministic, dynamic) highly depend on the country where they are applied,
due to the network topology, the grid status, the historical data, the capacity installed, the
energy mix, etc. This poses noticeable differences between the theoretical results derived
from the application of the ENTSO-E recommendations and the real reserves nowadays
contracted by the TSOs. The information about the methods used by the DSOs in distribution
grids is even scarcer. Moreover, not all the countries use the same type of reserves (some
mainly trust on aFRR, while some others use mFRR and/or RR), which makes it really
challenging to foresee the evolution of the reserves needs in the SmartNet horizon.
• Based on the information concerning to those current methods of reserves sizing and
considering some feasible assumptions, a tool was designed to estimate the reserves needs in
the future for Denmark, Italy and Spain. Nevertheless, this tool is designed to be country-
independent, so that it can easily be applied to other countries. However, calculation methods
strongly depend on the grid topology, historical data, the generation mix, etc. and, thus, each
TSO and DSO must use some coefficients to adjust the theoretical values to their real
implementation. Therefore, the general results obtained from the tool may differ from those
that could be more realistic according to the data publicly available up to date (e.g. in Italy).
16 The 10% interconnection capacity goal is in comparison to the installed generation capacity.

Copyright 2016 SmartNetD1.1 - Ancillary service provision by RES and DSM connected at distribution level in the future power system
Page 93
The final goal of this document is to serve as a general framework for the project. Consequently, the
current mechanisms of ancillary services provision have been analysed and the expected changes and the
needed increase in the reserves resulting from the increased contribution by DER and DSM have been
assessed. The results here are expected to deliver an input to the analysis on how the DER and DSM
resources (which technologies) will be able to provide those ancillary services by 2030. Moreover, the
information in this deliverable is also expected to be used for information purposes when identifying new
coordination schemes between TSOs/DSOs, in order to settle the market structures for the provision of
the services which are not in potential conflict with existing practices. Eventually, the amount of
estimated data needs, the scenarios and the mapping to the countries under study will be of key
importance for the simulation of the national cases which will lead to the identification of the most
suitable coordination schemes and their cost-benefit analysis.
Copyright 2016 SmartNetD1.1 - Ancillary service provision by RES and DSM connected at distribution level in the future power system
Page 94
6 References
[1] Directive 2009/72/EC of the European Parliament and of the council of 13 July 2009 concerning
common rules for the internal market in electricity and repealing Directive 2003/54/EC. Available
online at:
http://eur-lex.europa.eu/legal-content/EN/TXT/?uri=celex:32009L0072 (last accessed: 2016/11/04).
[2] OFGEM (Electricity regulator in Great Britain). D. Hall - “Wholesale energy markets in 2016”.
Available online at:
https://www.ofgem.gov.uk/system/files/docs/2016/08/wholesale_energy_markets_in_2016.pdf (last
accessed: 2016/11/04).
[3] B. Kirby, “Ancillary Services: Technical and Commercial Insights”. 2007. Available online at:
http://www.science.smith.edu/~jcardell/Courses/EGR325/Readings/Ancillary_Services_Kirby.pdf (last
accessed: 2016/11/04).
[4] ENTSO-E Definitions and Acronyms website:
https://emr.entsoe.eu/glossary/bin/view/GlossaryCode/GlossaryIndex (last accessed: 2016/11/04).
[5] Continental Europe Operation Handbook. Appendix 1, Load-frequency control and performance.
2004.
https://www.entsoe.eu/fileadmin/user_upload/_library/publications/entsoe/Operation_Handbook/Polic
y_1_Appendix%20_final.pdf (last accessed: 2016/12/14).
[6] ENTSO-E, Supporting Document for the Network Code on Load-Frequency Control and Reserves.
2013. Available online at:
http://www.acer.europa.eu/Official_documents/Acts_of_the_Agency/Annexes/ENTSO-
E%E2%80%99s%20supporting%20document%20to%20the%20submitted%20Network%20Code
%20on%20Load-Frequency%20Control%20and%20Reserves.pdf (last accessed: 2016/11/04).
[7] European Commission – Commission regulation. Establishing a guideline on electricity transmission
system operation. Draft version, November 2015. Available online at:
https://ec.europa.eu/energy/sites/ener/files/documents/Draft%20GLSysOP-2611_clean.pdf
(last accessed: 2016/11/04).
[8] M. Braun, “Provision of ancillary services by distributed generators – Technological and economic
perspective”. Kassel University, 2008. Available online at,
http://www.uni-kassel.de/upress/online/OpenAccess/978-3-89958-638-1.OpenAccess.pdf (last accessed:
2016/12/14)
[9] Elia. Adequacy calculations for Belgium - Strategic reserves volume. Available online at:
http://publications.elia.be/upload/UG_upload/BG3KPBOHX4.pdf (last accessed: 2016/12/15)
[10] Nord Pool – Market data:
http://www.nordpoolspot.com/Market-data1/#/nordic/table (last accessed: 2016/11/04).
Copyright 2016 SmartNetD1.1 - Ancillary service provision by RES and DSM connected at distribution level in the future power system
Page 95
[11] ENTSO-E – Continental Europe operation handbook. P1 – Policy 1: Load frequency control and
performance. March 2009. Available online at:
https://www.entsoe.eu/fileadmin/user_upload/_library/publications/entsoe/Operation_Handbook/Polic
y_1_final.pdf (last accessed: 2016/11/04).
[12] AGREEMENT (Translation) regarding operation of the interconnected Nordic power system (System
Operation Agreement). Available online at:
https://www.entsoe.eu/Documents/Publications/SOC/Nordic/System_Operation_Agreement_2014.pdf
(last accessed: 2016/11/04).
[13] Energinet – Regulations for grid connection. Available online at:
http://www.energinet.dk/EN/El/Forskrifter/Technical-regulations/Sider/Forskrifter-for-
nettilslutning.aspx (last accessed: 2016/11/04).
[14] Authority for Electric Energy, Gas and Hydro Services, Deliberation n° 111/06, 13 June 2006 and
successive updates. Available online at:
http://www.autorita.energia.it/it/docs/06/111-06.htm (last accessed: 2016/11/04).
[15] Grid code. Terna. Available online at:
https://www.terna.it/en-gb/sistemaelettrico/codicedirete.aspx (last accessed: 2016/11/04).
[16] GME (Gestore Mercati Energetici) Spot electricity market website:
https://www.mercatoelettrico.org/En/Mercati/MercatoElettrico/MPE.aspx (last accessed: 2016/11/04).
[17] OMIE (Iberian Market Operator) website:
http://www.omie.es/en/home/markets-and-products/about-our-market (last accessed: 2016/11/04).
[18] P. Blanquer (Energya-VM), “Servicios de Ajuste del Sistema: Potencialidad de participación de las
centrales de cogeneración”. Electricity market conference held in Bilbao, 2016/11/16.
[19] European Commission, “EU Reference Scenario 2016 - Energy, transport and GHG emissions Trends
to 2050”, 2015. Available online at:
https://ec.europa.eu/energy/sites/ener/files/documents/20160712_Summary_Ref_scenario_MAIN
_RESULTS%20(2)-web.pdf (last accessed: 2016/11/04).
[20] H. Sæle, B. A. Bremdal, T. Troset Engan, V. Kristoffersen, J. A. Foosnæs, T. E. Nordal, and J. M. Sletner,
“Subscribed power – testing new power based network tariffs stimulating for demand response,” in
Proc. 23th Int. Conf. and Exhibition on Electricity Distribution, CIRED, Lyon, France, 15–18 June
2015, pp. 1–5.
[21] S. Honkapuro, J. Tuunanen , P. Valtonen , J. Partanen. DSO tariff structures: development options
from stakeholders’ viewpoint. International Journal of Energy Sector Management. 2014.
[22] Joint EASE/EERA recommendations for a European Energy Storage Technology Development
Roadmap towards 2030. Joint EASE/EERA recommendations. 2013.
[23] Electrical Energy Storage. IEC. 2011. Available online at:
http://www.iec.ch/whitepaper/pdf/iecWP-energystorage-LR-en.pdf (last accessed: 2016/11/04).
Copyright 2016 SmartNetD1.1 - Ancillary service provision by RES and DSM connected at distribution level in the future power system
Page 96
[24] DOE global energy storage database:
http://www.energystorageexchange.org/ (last accessed: 2016/11/04).
[25] P. Tielens and D. Van Hertem. KU Leuven. Grid Inertia and Frequency Control in Power Systems with
High Penetration of Renewables. 2012. Available online at:
https://lirias.kuleuven.be/bitstream/123456789/345286/1/Grid_Inertia_and_Frequency_Contr (last
accessed: 2016/11/04).
[26] Statnett - Report on market development. In Norwegian. Available online at:
http://www.statnett.no/Global/Dokumenter/Kraftsystemet/Systemansvar/Statnett_SMUP_24.05_lnk_Lo
w.pdf (last accessed 2016/11/04).
[27] Future system inertia. ENTSO-E. 2015. Available online at:
https://www.entsoe.eu/Documents/Publications/SOC/Nordic/Nordic_report_Future_System_Inertia.pdf
(last accessed: 2016/11/04).
[28] Technical regulation 3.2.5 for wind power plants with a power output greater than 11 kW.
Energinet.dk. 2011. Available online at:
https://www.energinet.dk/SiteCollectionDocuments/Engelske%20dokumenter/El/55986-
10_v1_Grid%20Code%203%202%205_v%204%201-30%20%20September%202010.pdf (last accessed:
2016/11/04).
[29] A. Aalto, N. Honkasalo, P. Järvinen, et al. Energy Industry and Fingrid Oyj, 2012. How to increase
flexibility in the power system. ÅF-Consult Limited. In Finnish.
[30] White paper: Grid integration of large-capacity renewable energy sources and use of large capacity
Electrical Energy Storage. IEC. 2012. Available online at:
http://www.iec.ch/whitepaper/pdf/iecWP-gridintegrationlargecapacity-LR-en.pdf (last accessed:
2016/11/04).
[31] Evaluation of Current Market Architectures and Regulatory Frameworks and the Role of DSOs.
Deliverable 1.2 – evolvDSO Project. 2014. Available online at:
http://www.evolvdso.eu/getattachment/70a9e337-5fb3-4300-a7d5-0b5b0b56ab1f/Deliverable-1-2.aspx
(last accessed: 2016/11/04).
[32] L. Kumpulainen, J. Rinta-Luoma, S. Voima, et. al. Roadmap 2025 Sähkömarkkina- ja verkkovisio 2035
& Roadmap 2025. In Finnish.
[33] Eurelectric. Designing fair and equitable market rules por demand response aggregation. Available
online at:
http://www.eurelectric.org/media/169872/0310_missing_links_paper_final_ml-2015-030-0155-
01-e.pdf (last accessed: 2016/12/20).
[34] International Energy Agency. Technology Roadmap: Smart Grids. Available online at:
https://www.iea.org/publications/freepublications/publication/smartgrids_roadmap.pdf (last
accessed: 2016/12/20).
Copyright 2016 SmartNetD1.1 - Ancillary service provision by RES and DSM connected at distribution level in the future power system
Page 97
[35] International Energy Agency. How2Guide for Smart Grids in Distribution Networks. Roadmap
development and implementation. Available online at:
https://www.iea.org/publications/freepublications/publication/TechnologyRoadmapHow2GuideforSmart
GridsinDistributionNetworks.pdf (last accessed: 2016/12/20).
[36] SEDC – Smart Energy Demand Coalition. “Mapping demand response in Europe today”. 2015.
Available online at:
http://www.smartenergydemand.eu/wp-content/uploads/2015/10/Mapping-Demand-Response-in-
Europe-Today-2015.pdf (last accessed: 2016/11/04).
[37] RTE – Customers portal – Block exchange notification:
http://clients.rte-france.com/lang/an/clients_producteurs/services_clients/service_neb.jsp
(last accessed: 2016/11/04).
[38] ENTSO-E Network Code on Electricity Balancing. Available online at:
https://www.entsoe.eu/Documents/Network%20codes%20documents/NC%20EB/140806_NCEB_Resub
mission_to_ACER_v.03.PDF (last accessed: 2016/11/04).
[39] Emissions – EUETS.com. European Union Emissions Trading Scheme – Legal point of view:
http://www.emissions-euets.com/internal-electricity-market-glossary/594-tso-tso-model (last accessed:
2016/11/04).
[40] Network Code on Load-Frequency Control and Reserves. ENTSO-E. 2013. Available online at:
https://www.entsoe.eu/fileadmin/user_upload/_library/resources/LCFR/130628-NC_LFCR-
Issue1.pdf (last accessed 2016/11/04).
[41] O.S. Grande et. al. "Alternative schemes for exchange of balancing resources between separate
synchronous systems in Northern Europe", Technical Report TR A7102 SINTEF Energy Research
2011. Available online at:
https://www.sintef.no/globalassets/project/balance-management/tr/tr-a7102-alternative-
schemes-for-exchange-of-balancing-recources-between-separate-synchronous-systems-in-
northern-europe.pdf (last accessed: 2016/11/04).
[42] Energy services demand and scenario assessment. Deliverable 2.2 – REALISEGRID Project. 2009.
Available online at:
http://realisegrid.rse-
web.it/content/files/File/Publications%20and%20results/Deliverable_REALISEGRID_2.2.pdf
(last accessed: 2016/11/04).
[43] P. J. H. Schoemaker, “Scenario Planning: A Tool for Strategic Thinking”. MIT Sloan Management
Review (SMR). Available online at:
http://sloanreview.mit.edu/article/scenario-planning-a-tool-for-strategic-thinking/ (last accessed:
2016/11/04).
[44] A roadmap for moving to a competitive low carbon economy in 2050. Available online at:
Copyright 2016 SmartNetD1.1 - Ancillary service provision by RES and DSM connected at distribution level in the future power system
Page 98
https://ec.europa.eu/clima/policies/strategies/2050/docs/roadmap_fact_sheet_en.pdf (last accessed:
2016/11/04).
[45] European Climate Foundation, “Power Perspectives 2030: on the road to a decarbonised power
sector”. 2011. Available online at:
http://www.roadmap2050.eu/attachments/files/PowerPerspectives2030_FullReport.pdf (last accessed:
2016/11/04).
[46] ENTSO-E 2015 Scenario Outlook & adequacy forecast, 30th June 2015. Available online at:
https://www.entsoe.eu/Documents/SDC%20documents/SOAF/150630_SOAF_2015_publication_wcover.
pdf (last accessed: 2016/11/04).
[47] European Climate Foundation “RoadMap 2050: a practical guide to a prosperous, low-carbon
Europe”. 2010:
http://www.roadmap2050.eu/ (last accessed: 2016/11/04).
[48] European Climate Foundation, “Power Perspectives 2030: on the road to a decarbonised power
sector. Executive Summary”. 2011. Available online at:
http://www.roadmap2050.eu/attachments/files/PowerPerspectives2030_ExecutiveSummary.pdf
(last accessed: 2016/11/04).
[49] Energy systems integration for the transition to non-fossil energy systems, DTU International
Energy Report 2015. Available online at:
http://orbit.dtu.dk/files/119583507/DTU_International_Energy_Report_2015_rev.pdf (last accessed:
2016/11/04).
[50] ENTSO-E. TYNDP 2016, Ten-Year Network Development Plan 2016. Executive report. Available
online at:
http://tyndp.entsoe.eu/exec-report/ (last accessed: 2016/11/04).
[51] A methodology to assess the impact of 2030 EU climate and energy targets on the national power
systems: the Italian case, F. Lanati, A. Gelmini, M. Benini, M. Gallanti, EEM15, Lisbon.
[52] EU 2030 Objectives: emissions vs. renewables, Ed Gavaghan , 30 January 2014. Available online at:
http://www.europeanpublicaffairs.eu/eu-2030-objectives-emissions-vs-renewables/ (last accessed:
2016/11/04).
[53] H. Gerard, E. Rivero, D. Six, “Basic schemes for TSO-DSO coordination and ancillary services
provision”, SMARTNET Deliverable D1.3 (Draft version). Oct. 2016.17
17 Deliverables D1.1 and D1.3 have been written in parallel. D1.3 is currently under review.
Copyright 2016 SmartNetD1.1 - Ancillary service provision by RES and DSM connected at distribution level in the future power system
Page 99
[54] Authority for Electric Energy, Gas and Hydro Services, Deliberation n° 111/06, 13 June 2006 and
successive update. Available online at:
http://www.autorita.energia.it/it/docs/06/111-06.htm (last accessed: 2016/11/04).
[55] L. Olmos et. al “D3.2 Development affecting the design of short-term markets” Technical Report from
Market4RES project. September 2015. Available online at:
http://market4res.eu/wp-content/uploads/D3.2_20151009_final.pdf (last accessed: 2016/11/04).
[56] European Comission. “Commission Regulation (EU) 2015/1222 of 24 July 2015 establishing a
guideline on capacity allocation and congestion management”. Article 49. Available online at:
http://publications.europa.eu/en/publication-detail/-/publication/b91aa370-3293-11e5-9f85-
01aa75ed71a1/language-en (last accessed: 2016/12/19).
[57] Ecogrid project. Available online: http://www.eu-ecogrid.net/ (last accessed: 2016/12/19).
[58] H. Holttinen et al. “Methodologies to Determine Operating Reserves Due to Increased Wind Power”.
IEEE Transactions on Sustainable Energy, Vol. 3, No. 4, 2012.
[59] M. Milligan et al. Operating Reserve Implication of Alternative Implementations of an Energy
Imbalance Service on Wind Integration in the Western Interconnection National Renewable Energy
Laboratory. IEEE conference paper. 2011. Available online at:
http://www.nrel.gov/docs/fy11osti/51343.pdf (last accessed: 2016/11/04).
[60] Red Eléctrica de España. Informe anual 2014. Available online at:
http://www.ree.es/es/publicaciones/informe-anual-2014 (last accessed 2016/11/04).
[61] ENTSO-E. “Impact of merit order activation of automatic frequency restoration reserves and
harmonized full activation times”. Available online at:
https://www.entsoe.eu/Documents/MC%20documents/balancing_ancillary/151224_Report_Study
_merit_order_aFRR_and_harmonising_FAT_vs_0_1_draft_selection_for_BSG_meeting_on_15_January.p
df (last accessed: 2016/11/04).
[62] Red Eléctrica de España, Procedimiento de Operación 1.5.: Establecimiento de la reserva para la
regulación frecuencia-potencia. Available online at:
https://www.boe.es/diario_boe/txt.php?id=BOE-A-2006-13170 (last accessed: 2016/12/20).
[63] Elia, “Evolution of ancillary services needs to balance the Belgian control area towards 2018”. 2013.
Available online at:
http://www.elia.be/~/media/files/Elia/Grid-data/Balancing/Reserves-Study-2018.pdf (last
accessed: 2016/11/04).
[64] System Services Study 2030. Dena – German Energy Agency. 2014. Available online at:
https://shop.dena.de/fileadmin/denashop/media/Downloads_Dateien/esd/9094_Ergebniszusamm
enfassung_dena-Studie_Systemdienstleistungen_2030_englisch.pdf (last accessed: 2016/11/04).
Copyright 2016 SmartNetD1.1 - Ancillary service provision by RES and DSM connected at distribution level in the future power system
Page 100
[65] EirGrid & SONI. Ensuring a Secure, Reliable and Efficient Power System in a Changing Environment.
2011.
[66] System Operator’s operating procedures. Available, only in Spanish, at:
http://www.ree.es/es/actividades/operacion-del-sistema-electrico/procedimientos-de-operacion
(last accessed: 2016/11/04).
[67] Belgium - Product and services sheets available at Elia’s website:
http://www.elia.be/en/products-and-services/product-sheets (last accessed: 2016/11/04).
[68] Elia, “General framework for Cross-border Primary Frequency Control Service – France”, 2015.
Available online at:
http://www.elia.be/~/media/files/Elia/Products-and-
services/ancillary%20services/purchase%20of%20ancillary%20services/R1-France-General-
Framework_2016.pdf (last accessed: 2016/11/04).
[69] Elia, “International Frequency Containment Reserve (FCR) cooperation: Belgium joining the coupled
German, Dutch, Swiss & Austrian markets”. 2016. Available online at:
http://www.elia.be/en/about-elia/newsroom/news/2016/02-08-2016-International-Frequency-
Containment-Reserve-cooperation (last accessed: 2016/11/04).
[70] Elia, “Ancillary Services: Volumes & Prices”. 2016:
http://www.elia.be/en/suppliers/purchasing-categories/energy-purchases/Ancillary-Services-
Volumes-Prices (last accessed: 2016/11/04).
[71] Elia, “STAR - Short-Term Auctioning of Reserves”. 2016:
http://www.elia.be/en/grid-data/extranet-for-customers/Star (last accessed: 2016/11/04).
[72] RTE - IGCC (International Grid Control Cooperation) initiative. 2012:
https://clients.rte-france.com/lang/an/visiteurs/vie/initiative_igcc.jsp (last accessed: 2016/11/04).
[73] Fingrid website. Demand-side management:
http://www.fingrid.fi/en/electricity-market/Demand-Side_Management/Pages/default.aspx
(last accessed: 2016/11/04).
[74] JRC-European Commission. Online Foresight Guide for “Scenario building”:
http://forlearn.jrc.ec.europa.eu/guide/3_scoping/meth_scenario.htm (last accessed: 2016/11/04).
[75] H. Schuster et al., “Definition of a Limited but Representative Number of Future Scenarios.
Deliverable 1.1 - EvolvDSO Project. 2014. Available online at:
http://www.evolvdso.eu/getattachment/8744acac-f692-4ad0-932d-44a45b1d71c7/D-1 (last accessed:
2016/11/04).
[76] Structuring of uncertainties, options and boundary conditions for the implementation of Electricity
Highways System. Deliverable 1.2 – e-Highway2050 Project. Available online at:
http://www.e-highway2050.eu/fileadmin/documents/Results/eHighway2050_D1_2.pdf (last accessed:
2016/11/04).
Copyright 2016 SmartNetD1.1 - Ancillary service provision by RES and DSM connected at distribution level in the future power system
Page 101
[77] GRID TECH GridTech - Deliverable D4.1, Description of four scenarios for the development of the
European electricity system up to 2050 (with special consideration of the target years 2020, 2030
and 2050) incorporating new innovative technologies fostering RES-Electricity and storage
integration. Available online at:
http://www.gridtech.eu/images/Deliverables/GridTech_D4.1_Description_of_GridTech_scenarios.pdf
(last accessed: 2016/11/04).
[78] Ancillary services provided from DER_ Oak Ridge National Laboratory for the U.S Department of
Energy. December 2005. Available online at:
http://web.ornl.gov/~webworks/cppr/y2001/rpt/124395.pdf (last accessed: 2016/11/04).
[79] Ancillary services: technical specifications, system needs and costs. Deliverable D 2.2. Technical
University of Denmark, 2012. Available online at:
http://orbit.dtu.dk/files/72251308/Ancillary_Services.pdf (last accessed: 2016/11/04).
[80] Capabilities and costs for ancillary services provision by wind power plants. Deliverable D 3.1.
Technical University of Denmark, 2013. Available online at:
http://orbit.dtu.dk/files/71169605/Capabilities_and_costs_for_ancillary.pdf (last accessed: 2016/11/04).
[81] Ancillary Services, Unbundling Electricity Products – an emerging market. Eurelectric. 2004.
http://www.eurelectric.org/Download/Download.aspx?DocumentFileID=25426 (last accessed:
2016/11/04).
[82] E. Hirst , B. Kirby, “Separating and measuring the regulation and load-following ancillary services”.
Utilities Policy. 1999.
[83] M. Braun, “Technological control capabilities of DER to provide future ancillary services”.
International journal of distributed energy resources. 2007. Available online at:
http://fenix.iwes.fraunhofer.de/docs/documents/ (last accessed: 2016/11/04).
[84] Mitigation of flicker and voltage fluctuations. Power quality in electrical systems website:
http://www.powerqualityworld.com/2011/09/mitigation-flicker-voltage-fluctuation.html (last accessed:
2016/11/04).
[85] Grid Operation benefits (load following) - Energy Storage Association:
http://energystorage.org/energy-storage/energy-storage-benefits/benefit-categories/grid-operations-
benefits (last accessed: 2016/11/04).
[86] Fault-ride through – The Switch company website:
http://www.theswitch.com/2011/02/02/meeting-fault-ride-through-requirements-a-constant-response-
to-grid-code-jungle/ (last accessed: 2016/11/04).
[87] M. Savaghebi, A. Jalilian, J. C. Vasquez, J.M. Guerrero, “Autonomous voltage unbalance compensation
in an islanded droop-controlled microgrid”. Aalborg University, Denmark. 2013. Available online at:
Copyright 2016 SmartNetD1.1 - Ancillary service provision by RES and DSM connected at distribution level in the future power system
Page 102
http://vbn.aau.dk/files/61549828/PREPRINT_autonomous_voltage_unbalance_compensation_in_an_isla
nded_droop_controlled.pdf (last accessed 2016/11/04).
[88] Congestion management in distribution networks. Deliverable 5.2, project Ideal Grid For All. 2013.
Available online at:
https://webhotel2.tut.fi/units/set/ide4l/ide4l-wp5---d5.2-3---v1.0---figure-3.1.3-corrected-1.pdf
(last accessed 2016/11/04).
[89] IEEE Recommended Practices and Requirements for Harmonic Control in Electrical Power Systems.
Standard 519.
[90] Advanced Architectures and Control Concepts for More Microgrids. Executive summary report, final
results. Project More Microgrids 2006 – 2009. Available online at:
http://www.microgrids.eu/documents/esr.pdf (last accessed 2016/11/04).
[91] M. Saleh, M. Bamasak and M. A. Abido, “Robust coordinated design of PSS & Statcom controllers for
damping power system oscillation”. 2005. Available online at:
http://citeseerx.ist.psu.edu/viewdoc/download?doi=10.1.1.579.2782&rep=rep1&type=pdf
(last accessed: 2016/11/04).
[92] X. Han, A.M. Kosek, “Assessment of distribution grid voltage control strategies in view of
deployment”. University of Denmark. 2014. Available online at:
http://www.danskenergi.dk/~/media/Analyse/Projekter/iPower/Assess_of_distribution_grid_voltage_co
ntrol_strategies_in_view_of_deployment.ashx (last accessed 2016/11/04).
[93] Fingrid - The power system reserves:
http://www.fingrid.fi/en/electricity-market/reserves/Pages/default.aspx (last accessed: 2016/11/04).
[94] World Energy Outlook. IEA:
http://www.worldenergyoutlook.org/ (last accessed: 2016/11/04).
[95] Statnett - System operation and market development. In Norwegian. Available online at:
www.statnett.no/Global/Dokumenter/Kraftsystemet/Systemansvar/Statnett_SMUP_24.05_lnk_Low.
pdf (last accessed: 2016/11/04).
Copyright 2016 SmartNetD1.1 - Ancillary service provision by RES and DSM connected at distribution level in the future power system
Page 103
7 Appendix A: Current status of ancillary services provision in
some European countries
7.1 Austria
• Frequency Containment Reserve – Primary reserve
Procurement schema: Optional. Organised market. Tenders by the control area manager and TSO
Austrian Power Grid (APG). At the end of the bidding period the bids are ranked according to prices,
starting with the cheapest bids, until the total volume of control power required is reached. These bids
are accepted, whereby acceptance of the last bid, the most expensive, may be restricted to ensure that the
tender quantity is not exceeded.
Remuneration schema: Charges for the provision of control reserve (€/MW) only. Suppliers whose
offers are accepted receive the power price they quoted, pay as bid approach is adopted. The energy is
not remunerated.
Service provider: Power plant operators.
Cost recovery: Generators with a capacity of over 5 MW. The costs are allocated in proportion to annual
output.
Minimum rated power: ± 1 MW (the bids must be equal in both directions: positive and negative).
Activation time/Duration: Activation time: 0 - 30 s. Service duration: Maximum 15 min until Frequency
Restoration Reserve re-establishes the initial values of Frequency Containment Reserve.
Requirements: The access to tenders is organised in two steps:
i. Technical prequalification (according to [11])
ii. Framework Agreement concerning legal relationship between the supplier and the control area
manager.
Penalty clause: A supplier who cannot meet the obligation to provide primary control power due to
technical problems must inform Austrian Power Grid AG immediately by telephone and also by e-mail. If
the failure can be attributed to gross negligence or intent, Austrian Power Grid AG can obligate the
supplier to pay a contractual penalty and compensation. In the event that the contractual obligations are
breached repeatedly, Austrian Power Grid AG has the right to terminate the framework agreement with
the supplier.
Scheduling horizon: The tendering period (the period in which the primary control power should be
provided) always extends from Monday 00:00 to Sunday 24:00 (a product over 7 days). The total volume
of primary control power must be available in this period without interruption. This means that it must
also be continuously reserved by the suppliers in their power plants. The product contains equal amounts
of negative and positive primary control reserve. Separate offers for positive or negative primary control
Copyright 2016 SmartNetD1.1 - Ancillary service provision by RES and DSM connected at distribution level in the future power system
Page 104
power are therefore not possible. The bidding period for the provision of primary control power in the
following week is normally from Friday, 12:00 to Tuesday, 15:00. In the event that a deviating bidding
period needs to be defined due to special circumstances, the suppliers will be informed of the deviation at
least one week prior to the commencement of the deviating bidding period.
• Automatic Frequency Restoration Reserve – Secondary reserve
Procurement schema: Optional. Organised market. Tenders managed by the control area manager and
TSO Austrian Power Grid (APG). At the end of the bidding period the bids are ranked according to the
following criteria and the contracts are awarded:
i. Lowest power price.
ii. If there are several bids with the same power price, the energy price will be used as a basis:
lowest energy price for positive secondary control, highest energy price for negative secondary
control.
iii. If the power and energy prices are identical, the bid that was placed first wins (time stamp).
Remuneration schema: Charges both, for the provision of control reserve (€/MW) and for the supply of
control power (€/kWh). Service suppliers receive the power price they quoted (pay as bid approach is
adopted). Once the bid has been accepted, the suppliers are obliged to reserve the corresponding volume
of secondary control power.
Service provider: Power plant operators, aggregators (virtual power plants).
Cost recovery: The costs of secondary control (capacity provision and energy) are allocated in the
following manner:
i. 78% are charged to the electricity producers with an installed capacity of over 5 MW in
accordance with the system utilisation tariff. This tariff component is referred to as a system
service.
ii. The remaining 22% are forwarded to the balance responsible party as a partial component for
the entire balancing energy.
Minimum rated power: ± 5 MW. The bids must be equal in both directions, positive and negative.
Activation time/Duration: Activation time: 30 s to 15 min. Secondary control power is activated when
the system is affected for longer than 30 seconds or it is assumed that the system will be affected for a
period longer than 30 seconds. Restoration of the secondary control range can take up to 15 minutes,
whereas tertiary control may continue after this period.
Requirements: The access to tenders is organised in two steps:
i. Technical prequalification (according to [11])
ii. Framework Agreement concerning legal relationship between the supplier and the control area
manager.
Copyright 2016 SmartNetD1.1 - Ancillary service provision by RES and DSM connected at distribution level in the future power system
Page 105
Penalty clause: A supplier who cannot meet the obligation to provide secondary control power due to
technical problems must inform Austrian Power Grid AG immediately by telephone and also by e-mail. If
the failure can be attributed to gross negligence or intent, Austrian Power Grid AG can obligate the
supplier to pay a contractual penalty and compensation. In the event that the contractual obligations are
breached repeatedly, Austrian Power Grid AG has the right to terminate the framework agreement with
the supplier.
Scheduling horizon: The bidding period for four-week products is normally on Tuesday from 9:00 to
14:00. All other products can normally be tendered Tuesdays from 9:00 to 15:00. Suppliers who have
been accepted can adjust their energy prices for the following day on each working day (except Saturday)
up to 15:00. The original energy price may, however, not be exceeded in the case of positive secondary
control power or undercut in the case of negative secondary control power. Corresponding rules can be
found in the Framework Agreement for Secondary Control. The suppliers will be informed in due time
should it be necessary to postpone or change the bidding period in the presence of exceptional
circumstances.
• Manual Frequency Restoration Reserve – Tertiary reserve
Procurement schema: Optional. Organised market. Tenders managed by the control area manager and
TSO Austrian Power Grid (APG). In the market maker tender, the bids with the lowest power price are
accepted. If the prices of two bids are identical, preference is given to the bid that was placed first.
Remuneration schema: Charges for the supply of control power (€/kWh) only. Service suppliers receive
the power price they quoted (pay as bid approach is adopted). Once the bid has been accepted, the
suppliers are obliged to reserve the corresponding volume of tertiary control power.
Service provider: Power plant operators, aggregators (virtual power plants).
Minimum rated power: 5 to 50 MW per supplier and time interval. The bids can be positive or negative.
This will be changed to 1 MW for the first bid. For the second bid of the same bidder: 5 to 50 MW.
Cost recovery: The power used for tertiary control is billed to the balancing group representatives via
imbalance settlement.
Activation time/Duration: Activation time: 15 min after the frequency deviation. Duration: minimum 15
min. Tertiary control energy is activated when the deviation in the control area lasts for longer than 15
minutes.
Requirements: The access to tenders is organised in two steps:
i. Technical prequalification (according to [11])
ii. Framework Agreement concerning legal relationship between the supplier and the control area
manager.
Copyright 2016 SmartNetD1.1 - Ancillary service provision by RES and DSM connected at distribution level in the future power system
Page 106
The available tertiary control reserve must be, at least, as large as the capacity of the largest power
station unit in the control area.
Penalty clause: A supplier who cannot meet the obligation to provide tertiary control power due to
technical problems must inform Austrian Power Grid AG immediately by telephone and also by e-mail. If
the failure can be attributed to gross negligence or intent, Austrian Power Grid AG can obligate the
supplier to pay a contractual penalty and compensation. In the event that the contractual obligations are
breached repeatedly, Austrian Power Grid AG has the right to terminate the framework agreement with
the supplier.
Scheduling horizon: The bidding period for the market maker tender is normally on Wednesday from
9:00 to 15:00. Suppliers who have been accepted can adjust their energy prices up to the end of the day-
ahead tender. The bidding period for the day-ahead tender normally begins directly after the market
maker tender and extends up to 15:00 on the previous working day (except Saturday) of the tendering
period. The suppliers will be informed in due time should it be necessary to postpone or change the
bidding period in the presence of exceptional circumstances.
• Voltage control
Procurement schema: Mandatory.
Remuneration schema: No remuneration.
Service provider:
Generation units. Each generation unit connected to the distribution grid must be able to operate within a
certain area, depending on its size and location.
MV and LV:
i. Installations with Sn <3.68 kVA. A symmetric power factor is established at 0.90
(Qmax=43.6%Sr). If the real apparent power is at least 20% lower than the nominal apparent
power, the fulfilment is not mandatory anymore.
ii. Installations with Sn >=3.68 KVa. In case the installation is connected on the LV network, the
same rule applies as before. For the MV, the generators must be able to operate within the area
delimited by a power factor of 0.925 (both for capacitive and inductive). The DSO might also
require two other settings in some special cases: in this case the generator might be able to
operate within an unsymmetrical area delimited by a capacitive cosϕ of 0.90 / inductive cosϕ of
0.95 and vice versa. Independently from the size and location of the installation, the installation
must be able to provide a certain amount of reactive power for a given voltage level.
HV: The units connected to the HV grid must be able to provide a certain amount of reactive power
depending on the voltage variation. The range is the same for each unit connected to the same voltage
level (110 kV, 220 kV and 380 kV).
Copyright 2016 SmartNetD1.1 - Ancillary service provision by RES and DSM connected at distribution level in the future power system
Page 107
Penalty clause: No penalty (the network operators considers that the producer will fulfil the
requirements because it has validated the grid connection).
• Other services - Redispatch
Procurement schema: The control area manager plans and controls the redispatch.
Remuneration schema: Remuneration fees for losses of profit.
i. Thermal power plant. Forced generation: variable operational costs minus proceeds. Restriction
of generation: lost proceeds minus saved variable operational costs.
ii. Pumped storage plant (turbine operation). Forced generation: value of lost water reservoir
minus proceeds. Restriction of generation: lost proceeds minus value of saved water reservoir.
iii. Pumped storage plant (pumping operation). Lost proceeds minus market value of planned
purchase taking into consideration a pumping efficiency of 70%.
iv. Pondage power plant. Forced generation: market value of planned generation minus market
value of forced generation. Restriction of generation: analogous.
v. Eco-electricity plants. Restricted power multiplied by the time and the feed-in tariff.
vi. Own production power plant (industry). Analogous to power plants above but plus additional
costs due to limitation of production.
Service provider: Power plants.
Minimum rated power: Only power plants with power >50 MW.
• Other services – Grid losses compensation
Procurement schema: A procurement strategy already exists in Austria to procure electricity to cover
grid losses in the Austrian transmission grid. Austria Power Grid (APG) handles the market procurement
of grid losses by conducting a common tender in the form of tradable products (annual, quarterly and
monthly base and peak products). APG acts as a major buyer of electricity and procures around 85% of
electricty needed to cover grid losses.
Remuneration schema: Pay as bid approach is adopted.
Minimum rated power: The minimum bid is 1 MW.
Requirements:
i. Grid operators notify APG of grid loss forecasts up to 3 years in advance.
ii. APG cumulates the quantities and allocates them to several tenders of standard products.
iii. Any remaining quantites are covered on the daily spot market (short term process, no tenders)
Scheduling horizon: Yearly, quarterly and monthly products for base and peak times respectively up to 2
years in advance.
Copyright 2016 SmartNetD1.1 - Ancillary service provision by RES and DSM connected at distribution level in the future power system
Page 108
7.2 Belgium
• Frequency containment reserve – Primary control (R1)
Procurement schema: Mandatory. Organised market.
The global reaction of primary reserves set forth by the ENTSO-E regulations must be a symmetrical and
linear activation with a total activation at a frequency deviation of +-200mHz. However in order to allow
different types of flexibility (generation, load, generation in France...) to participate in primary reserves,
Elia sources different types of products who react at different frequency deviations. Type of services:
i. FCR – R1 upwards - Load: This product is activated between [-200mHz, -100mHz], whereas the
total contracted volume must be activated at -200mHz.
ii. FCR – R1 downwards: This product is activated between [100mHz, 200mHz], whereas the total
contracted volume must be activated at 200mHz.
iii. FCR – R1 Symmetrical 100 mHz: This product is activated between -100mHz and +100mHz,
whereas the total contracted volume must be activated at the most extreme bands of the
frequency interval indicated. This maximum contracted volume must however also remain
activated for frequency deviations between [-200mHz,-100mHz] and [100mHz, 200mHz].
iv. FCR – R1 Symmetrical 200 mHz: This product is activated between -200mHz and + 200mHz,
whereas the total contracted volume must be activated at the most extreme bands of the
frequency interval indicated.
v. FCR – R1 RTE (French TSO): Agreement with RTE that Elia may procure FCR from French BSP
(TSO-BSP model).
Remuneration schema: The primary reserve is subject to a payment that covers the provision and
activation of the service. No specific payment is made for the actual supply of energy.
Service provider:
i. FCR – R1 upwards - Load: Large industrial clients. TSO grid users (via aggregator).
ii. FCR – R1 Downwards: This product is only supplied by base-load Elia-connected generation
(mainly nuclear power plants).
iii. FCR – R1 Symmetrical 100 mHz: Base-load flexible units (Gas, Steam and Gas power stations
(STEG)).
iv. FCR – R1 Symmetrical 200 mHz: Base-load flexible units (Gas, Steam and Gas power stations
(STEG)).
v. FCR – R1 RTE (French TSO): French generators.
Cost recovery: BRP via the procedure of the imbalance settlement + grid users.
Requirements: For FCR – R1 upwards, FCR – R1 downwards, FCR – R1 Sym 100 mHz and FCR – R1 Sym
200 mHz: local frequency measurement and continuous activation.
For FCR – R1 RTE: Requirements defined by RTE.
Copyright 2016 SmartNetD1.1 - Ancillary service provision by RES and DSM connected at distribution level in the future power system
Page 109
Activation time/Duration: Activation time: 0 - 30 sec. FCR must be able to be activated minimum 15 min.
Scheduling horizon: Monthly tendering.
• Frequency restoration reserve – Secondary control (R2)
Procurement schema: Optional. Organised market.
Remuneration schema: Two types of payment, a set contractual payment for provision of the reserve
and a payment for activation of the reserve.
i. Maximum price for incremental activation: Elia pays the grid user on the basis of the latter’s bid.
The maximum price for a bid for upward activation is expressed in € per MWh and is based on
the fuel price and on the market reference price. Price cap for upward regulation = Fuel cost of
Combined Cycle Gas Turbine (CCGT) with 50% efficiency + 40€/MWh.
ii. Minimum price for decremental activation: The grid user pays Elia, because the user can reduce
its generation output or use for other purposes the power normally deployed for the secondary
reserve. The prices given in the bids submitted by grid users must be no lower than a certain
stipulated minimum. Price cap for downward regulation = 0€/MWh.
Cost recovery: BRP via the procedure of the imbalance settlement + grid users.
Service provider: Base-load flexible units (Gas, Steam and Gas power stations (STEG)).
Minimum rated power: 5 MW.
Product resolution: Total volume of 140 MW maximally.
Activation time/Duration: Maximum reaction time from 0MW to maximum up or down: 7.5 min (or 15
min from max up to down). Maximum duration, no limit.
Requirements:
i. Setpoint sent by dispatching Elia over dedicated SCADA connection.
ii. Continuous activation
Scheduling horizon: FRR upward: Monthly tendering. FRR downward: Free bids day-ahead.
• Tertiary control (R3) – R3 Production
Procurement schema: Optional. Organised market.
Remuneration schema:
i. Payment for provision of the tertiary reserve: Elia has to make a payment to the grid user
providing the tertiary reserve (expressed in €/MW/hour of availability).
ii. Payment for the energy supplied to Elia: Free prices nominated day ahead.
iii. Payment to cover start-up costs: The amount of the payment is calculated using the same formula
found in the CIPU contract (Coordination of Injection by the Production Units). This formula
Copyright 2016 SmartNetD1.1 - Ancillary service provision by RES and DSM connected at distribution level in the future power system
Page 110
takes account of the specifications of the production unit, the cost of the fuel used and the
management costs incurred.
Service provider: Turbo-jets, non-spinning units.
Cost recovery: BRP via the procedure of the imbalance settlement + grid users.
Minimum rated power: Total volume min, 300 MW.
Activation time/Duration: To be activated within 15 min and there is no duration limit.
Requirements: Interface (B2B). There is neither max activation/year nor minimum time between
activations.
Penalty clause: Elia will apply a penalty if the supplier has failed, for any particular quarter-hour, to
make the quantity of his tertiary control obligation to Elia. Said penalty is valued by means of the Belpex
(Belgium energy market) day-ahead price and applies to any missing MW.
Scheduling horizon: Yearly tendering + monthly tendering.
• Tertiary control (R3) – R3 Dynamic Profile
The R3 DP is a new type of tertiary reserves that allows distributed energy resources to participate in the
ancillary services.
Procurement schema: Optional. Organised market.
Remuneration schema: Elia has to remunerate (expressed in €/MW/hour of availability) the dynamic
profile provider providing the tertiary reserve. This payment, the size of which is specified in the
contract, covers the entire contractual term. The fee is determined by the offer from the dynamic profile
provider in the tendering process. There is no remuneration for activation.
Service provider: DSO connected loads / emergency generators.
Cost recovery: BRP via the procedure of the imbalance settlement + grid users.
Activation time/Duration: Maximum duration of 2h.
Requirements: Interface (B2B). Maximum 40 activations/year. Minimum time between activations: 12h.
R3-DP requires 100% availability of the contracted power.
Penalty clause: Elia will apply a penalty if the supplier has failed, for any particular quarter-hour, to
make the quantity of his tertiary control power - dynamic profile obligations available to Elia. Said
penalty applies to any missing MW.
Scheduling horizon: Yearly tendering + monthly tendering.
• Tertiary control (R3) – R3 ICH: Tertiary control by interrupting grid users
Procurement schema: Optional. Organised market.
Copyright 2016 SmartNetD1.1 - Ancillary service provision by RES and DSM connected at distribution level in the future power system
Page 111
Remuneration schema: Elia pays for both the provision of reserve and the activation of the
interruptibility service.
i. Payment for providing the reserve: Payment according to tariff period. Elia has defined distinct
tariff periods. Remuneration will be greater during peak hours than during off peak or weekend
hours. Payment for provision of reserve is made via a system of monthly advances.
ii. Payment for activation of the service: The energy term price is set at 108% of the highest
incremental bid selected in Belpex market and a minimum payment of 75 €/MWh is also
stipulated.
Service provider: Large industrial TSO grid users (via aggregator).
Cost recovery: BRP via the procedure of the imbalance settlement + grid users.
Minimum rated power: 5 MW.
Activation time/Duration: It must be connected within 3 min. Depending on the product, maximum
duration: 2 h – 4 h – 8 h. Maximum activations/year: 12 – 4 – 4.
Requirements: Dedicated SCADA connection. Minimum time between activations: 24h.
Scheduling horizon: Yearly tendering.
• Voltage control (MVAr)
Procurement schema: There are two types of voltage control:
i. Primary control: Controlling production units. Reactive energy is activated automatically, within
the bounds of the band that is provided by the producer.
ii. Centralised control. Controlling and non-controlling production units. Elia asks the producer to
activate reactive energy upwards or downwards, depending on the band specified in the
contract.
Elia chooses suppliers of the voltage control service based on price and also on the location of the
production units within the high-voltage grid. The reactive energy may be activated by the production
units automatically (primary control) or at Elia’s request (centralised control). Producers with units that
have a capacity of over 25 MW have to take part in primary control.
Remuneration schema: Payment for the reserved control bands based on: a unit price, the volume
contracted in MVAr and the length of use. In the event that absorptions or injections either by the
centralised control or by the primary control go outside the contractual limits of the band (Qband-;
Qband+), Elia pays the producer for the actual volumes absorbed or generated an amount in €/MVArh.
Service provider: Producers.
Requirements: The production units must have certain technical features that vary depending on
whether the unit is a controlling production unit or a non-controlling production unit.
Copyright 2016 SmartNetD1.1 - Ancillary service provision by RES and DSM connected at distribution level in the future power system
Page 112
Scheduling horizon: Voltage control services are governed by contracts of at least one year signed by Elia
and the producer.
• Other services – Strategic Reserves (SGR & SDR)
Elia has been given the task of organising a strategic reserve mechanism to cover the structural shortages
in generation in the winter period. This mechanism differs from the balancing resources that offset the
sum of residual imbalances of ARPs (also known as balance responsible party) in real time. The strategic
reserve makes use of load shedding and off-market generation units.
Procurement schema: Optional. Organised market. The strategic reserve takes two forms, whose
activation produces similar results:
i. Strategic Generation Reserve (SGR): Delivered by production units.
ii. Strategic Demand Response (SDR): Delivered by a reduction in the offtake on the demand side.
Remuneration schema:
i. SGR: It covers the expenses in generating the energy. This remuneration takes account of the cost
of the fuels and overheads, and the period of activation and the volume injected.
ii. SDR: Suppliers are remunerated for the availability of the contracted capacity and for the
activation of the SDR.
Service provider:
i. SGR: The SGR is supplied by generation units in the Belgian control area that have already been
shut down. Production: EDF Luminus (Serain), Eon (Vilvoorde).
ii. SDR: The SDR is supplied by demand-side management offers. A temporary reduction, individual
or aggregated, has the same impact on the balance of the control area as an increase in
generation.
Cost recovery: BRP via the procedure of the imbalance settlement + grid users.
Activation time/Duration: To be activated within 1,5h . Maximum duration between 4 and 12 hours,
depending on the product.
Other characteristics: Maximum number of activations/year between 20 and 40 depending on the
product. The minimum time between activations, 4 – 12 h.
Scheduling horizon: Yearly tendering.
• Other services – Black start service
Procurement schema: Bilateral contracts. Selection criteria: location, start-up speed and availability of
trained personnel.
Copyright 2016 SmartNetD1.1 - Ancillary service provision by RES and DSM connected at distribution level in the future power system
Page 113
Remuneration schema: Fixed payment (capacity). Investment costs incurred to meet technical
requirements are covered by the fixed retribution (contractually stipulated).
Service provider: Power plants > 100 MW.
Cost recovery: Grid users.
Requirements:
i. be capable of starting up without using an auxiliary source of power derived from high-, medium-
or low-voltage network;
ii. be capable of responding swiftly and dynamically to load fluctuations up to 10 M;
iii. be capable to absorb a minimum of 30 MVAr at the connection point;
iv. be equipped with a regulator enabling rotation speed to be geared to the frequency required by
Elia’s dispatching department;
v. have synchronisation equipment enabling voltage to be restored to a substation without power;
vi. be capable of feeding power into the grid:
vii. within 1.5 hours after the blackout for units in service at the time of the blackout;
viii. 3 hours after the blackout for units in shot-down;
ix. for a period of at least 24 hours.
Activation time/Duration: Activation time; 1.5h (units in service) and 3h (units in shot-down). Duration:
24h.
Penalty clause: There are penalties if contracted units do not pass the start-up tests under Black Start
conditions. However, the specifics are unknown.
Scheduling horizon: From one to several years.
• Other services – Compensation for grid losses
Procurement schema: Candidates for supplying are selected and then a tender is sent out to these
candidates. These tenders are submitted in online reverse auctions.
Remuneration schema: Energy term is remunerated according to the price agreed in the auction.
Service provider: All European suppliers with an ARP contract.
Cost recovery: Grid users.
Product resolution: Around 500 GWh.
Requirements: Candidates are selected on the basis of the following criteria:
i. Economic criteria (main business activity in recent years, experience of supplying similar
services, main contracts, supplied volumes, etc.);
ii. Financial criteria (balance sheets, liquidity ratios, solvency, profitability, etc.);
iii. Technical criteria (quality system, suitably qualified staff, knowledge of languages, etc.).
Scheduling horizon: One year.
Copyright 2016 SmartNetD1.1 - Ancillary service provision by RES and DSM connected at distribution level in the future power system
Page 114
7.3 Denmark
Requirements to be met by suppliers of ancillary services vary slightly depending on whether the
services are to be supplied in Eastern Denmark (called DK2) or in Western Denmark (called DK1). In
general, ancillary services to be delivered are:
- DK1: i) FCR Primary reserves, ii) aFRR Secondary reserves - LFC (Load Frequency Control), iii)
mFRR Manual reserves, iv) Short-circuit power, reactive reserves and voltage control.
- DK2: i) FCR-D Frequency-controlled disturbance reserve, ii) FCR-N Frequency-controlled normal
operation reserve, iii) mFRR Manual reserves, iv) Short-circuit power, reactive reserves and
voltage control.
• FCR Frequency Containment Reserve - Primary reserve DK1: upward and downward
regulation
Procurement schema: Daily reserve auction of blocks of 4 hours.
Remuneration schema: Fixed price per MW per hour. Marginal price. All accepted bids for up-and down-
regulation receive an availability payment corresponding to the auction's marginal cost. Running the
primary reserve is paid as ordinary imbalances.
Service provider: Production or consumption units which, by means of control equipment, respond to
grid frequency deviations.
Ramp size/Speed drop: The reserve must at least be delivered linearly with frequency deviations
between 20 and 200 mHz deviation. The first half of the activated reserve must be delivered within 15
seconds, while the last part must be delivered within 30 seconds at a frequency deviation +/- 200 mHz.
The regulation must continuously be active and contain features that ensure the maintenance of 100%
power for a minimum of 15 minutes.
Minimum rated power: 0.3 MW.
Activation time/Duration: Automatically activated within 30 seconds. Maximum duration 15 minutes.
Requirements: Primary regulation must be delivered at a frequency deviation of +/- 200 mHz compared
to reference frequency of 50 Hz. This will usually mean in the range 49.8 to 50.2 Hz. It is allowed a dead
band of +/- 20 mHz.
Penalty clause: When it turns out that the capacity is not available, for example because of a breakdown,
the availability payment is canceled and the player must cover any additional costs for replacement. In
case of accidents, which implies that a plant cannot supply reserve, the reserve must be re-established at
one or more plants that can supply the reserve as soon as possible but within 30 minutes after the
incident. If the supplier cannot re-establish the reserve, contact Energinet.dk within 15 minutes to
announce where and when the reserve can be restored.
Copyright 2016 SmartNetD1.1 - Ancillary service provision by RES and DSM connected at distribution level in the future power system
Page 115
Scheduling horizon: Daily auction.
• aFRR Automatic Frequency Restoration Reserve - Secondary/Load frequency reserve DK1
Procurement schema: Long term contract with Norway for delivery of aFRR over Skagerrak 4. There is
only ad hoc procurement in DK1.
Remuneration schema:
i. Capacity is remunerated through a fixed price (stipulated on a bilateral contract with
energinet.dk)
ii. Energy is remunerated marginally (DK1 spot price plus/less DKK 100/MWh, or at least, the price
for upward/downward regulation at DK1)
Service provider: Secondary reserve regulation is automatic and provided by production or consumption
units which, by means of control equipment, respond to signals received from Energinet.dk.
Cost recovery: This service is free of charge to users.
Minimum rated power: Minimum bid 1 MW, maximum bid 50 MW.
Penalty clause: When it turns out that the capacity is not available, for example because of a breakdown,
the availability payment is canceled and the player must cover any additional costs for replacement. In
case of accidents, which implies that a plant cannot supply reserve, the reserve must be re-established at
one or more plants that can supply the reserve as soon as possible but within 30 minutes after the
incident. If the supplier cannot re-establish the reserve, contact Energinet.dk within 15 minutes to
announce where and when the reserve can be restored.
Activation time/Duration: Automatically activated within 15 minutes.
Scheduling horizon: Ad hoc.
• mFRR Manual Frequency Restoration Reserve – Tertiary/Manual reserve DK1 and DK2
Procurement schema: Auction, economic merit order. Energinet.dk buys manual reserve in DK1as
upward regulation power. An auction is held once a day for each of the hours of the coming day of
operation. In DK2 there is a long term contract, and ad hoc procurement in DK1.
Remuneration schema: Capacity and energy are marginally remunerated. Prices are settled marginally
hour by hour.
Service provider: Typically gas turbines, thermal power, hydropower, CHP and load shedding.
Cost recovery: Reserve providers pay capacity fees and energy is paid by the imbalance parties through
the imbalance settlement.
Minimum rated power: Minimum bid 10 MW. Maximum bid 50 MW.
Activation time/Duration: Manually activated within 15 min.
Copyright 2016 SmartNetD1.1 - Ancillary service provision by RES and DSM connected at distribution level in the future power system
Page 116
Penalty clause: When it turns out that the capacity is not available, for example because of a breakdown,
the availability payment is canceled and the player must cover any additional costs for replacement. In
case of accidents, which implies that a plant cannot supply reserve, the reserve must be re-established at
one or more plants that can supply the reserve as soon as possible but within 30 minutes after the
incident. If the supplier cannot re-establish the reserve, contact Energinet.dk within 15 minutes to
announce where and when the reserve can be restored.
Scheduling horizon: Daily market.
• FCR-D Frequency-controlled disturbance reserve DK2
In the event of major system disturbances, the frequency-controlled disturbance reserve is a fast reserve
used for regulating the frequency following substantial frequency drops resulting from the outage of
major generation plants or lines.
Procurement schema: The reserve is activated automatically in the event of sudden frequency drops to
under 49.9 Hz and remains active until balance has been restored or until regulation by means of the
manual reserve takes over. Activation of reserves is based on the supplier’s own frequency
measurements.
Remuneration schema: Availability (capacity) payment equal to the price that the actor has bid (pay-as-
bid). Energy is paid as a regular imbalance.
Service provider: Production or consumption units which, by means of control equipment, respond to
grid frequency deviations.
Ramp size/Speed drop: 50% of the response must be delivered within 5 seconds and the remaining 50%
within the next 25 seconds.
Minimum rated power: 0.3 MW.
Activation time/Duration: Supply 50% of the response within 5 seconds. The remaining 50% of the
response must be supplied within the next 25 seconds.
Requirements: Power must be provided inversely linearly with frequency between 49.9 and 49.5 Hz.
Completely activated at 49.5 Hz.
Penalty clause: When it turns out that the capacity is not available, for example because of a breakdown,
the availability payment is canceled and the player must cover any additional costs for replacement. In
case of accidents, which implies that a plant cannot supply frequency controlled normal operation
reserve, the reserve must be re-established at one or more plants that can supply the reserve as soon as
possible but within 30 minutes after the incident. If the supplier cannot re-establish the reserve, contact
Energinet.dk within 15 minutes to announce where and when the reserve can be restored.
Scheduling horizon: Daily market. Energinet.dk buys frequency-controlled disturbance reserve in
collaboration with Svenska Kraftnät (Swedish TSO) through daily auctions. Energinet.dk’s and Svenska
Copyright 2016 SmartNetD1.1 - Ancillary service provision by RES and DSM connected at distribution level in the future power system
Page 117
Kraftnät’s total requirement is purchased at daily auctions where part of the requirement is purchased
two days before the day of operation (D-2), and the remaining part is purchased the day before the day of
operation (D-1).
Other characteristics: The supplier can bid on an hourly basis or a block bid. Block bids that are
submitted at the auction two days before the day of operation (D-2), may have a duration of up to six
hours. Block bids that are submitted at the auction the day before the day of operation (D-1), may last up
to three hours. The actor will state what hour block bid starts, however, the block bid must be completed
within the day of operation.
• FCR-N Frequency-controlled normal operation reserve DK2
Procurement schema: Optional. Remunerated. Frequency controlled normal operation reserve is
purchased as a symmetric product: the supplier simultaneously must provide both upward and
downward regulation available.
Remuneration schema: Availability (capacity) payment equal to the price that the actor has bid (pay-as-
bid). Energy is paid at the upward/downward regulation price.
Service provider: Production or consumption units. A delivery can be made up of supplies from several
production units with different properties which collectively can provide the required response within
the required response time. A delivery can also be made up of supplies from several consumption units
with different properties which collectively can provide the required response within the required
response time. Automatic regulation provided by production or consumption units which, by means of
control equipment, respond to grid frequency deviations.
Ramp size/Speed drop: The reserve must at least be delivered linearly with frequency deviations
between 0 and 100 mHz deviation. The activated reserve must be supplied within 150 seconds,
regardless of the size of the deviation.
Minimum rated power: 0.3 MW.
Activation time/Duration: The activated reserve must be supplied within 150 seconds. It must be
possible to maintain regulation continuously.
Requirements: The normal operation reserve must be supplied at a frequency deviation of up to +/-100
mHz relative to the reference frequency of 50 Hz. This means in the 49.9-50.1 Hz range. Deliveries must
be made without deadband. The reserve must as a minimum be supplied linearly at frequency deviations
of between 0 and 100 mHz.
Penalty clause: When it turns out that the capacity is not available, for example because of a breakdown,
the availability payment is canceled and the player must cover any additional costs for replacement. In
case of accidents, which implies that a plant cannot supply frequency controlled normal operation
reserve, the reserve must be re-established at one or more plants that can supply the reserve as soon as
Copyright 2016 SmartNetD1.1 - Ancillary service provision by RES and DSM connected at distribution level in the future power system
Page 118
possible but within 30 minutes after the incident. If the supplier cannot re-establish the reserve, contact
Energinet.dk within 15 minutes to announce where and when the reserve can be restored.
Scheduling horizon: Daily market. Energinet.dk buys the frequency-controlled normal operation reserve
in collaboration with Svenska Kraftnät through daily auctions. Energinet.dk’s and Svenska Kraftnät’s total
requirement is purchased at daily auctions where part of the requirement is purchased two days before
the day of operation (D-2), and the remaining part is purchased the day before the day of operation (D-1).
The supplier can submit bids hourly or as block bids. Block bids submitted to the auction two days before
the day of operation (D-2) can have a duration of up to six hours. Block bids submitted to the auction the
day before the day of operation (D-1) can have a duration of up to three hours. The player determines the
hour at which the block bid commences. However, the block bid must end within the day of operation.
• Voltage control
Procurement schema: Mandatory
Remuneration schema: Not remunerated.
Service provider: Generators.
Requirements:
- Generators larger than 1.5 MW: In the point of common coupling, a power station unit connected
to a point of common coupling with nominal voltage up to 100 kV must be able to use/produce
reactive power with tanφ within the -0.20 to 0.40 range at nominal maximum power and at
voltages in the point of common coupling within the full-load voltage range. In the point of
common coupling, a power station unit connected to a point of common coupling with nominal
voltage up to 100 kV must be able to use/produce reactive power as indicated by the hatched
area in Figure X at nominal maximum power and at voltages in the point of common coupling
within the full-load voltage range. At voltages in the point of common coupling lying outside the
full-load voltage range, the potential reactive power production of a power station unit connected
to a point of common coupling with a nominal voltage above 100 kV must only be reduced to an
extent determined by the fact that the generator’s and the step-up transformer’s thermal limits
are not exceeded and that the generator remains at a stable operating point.
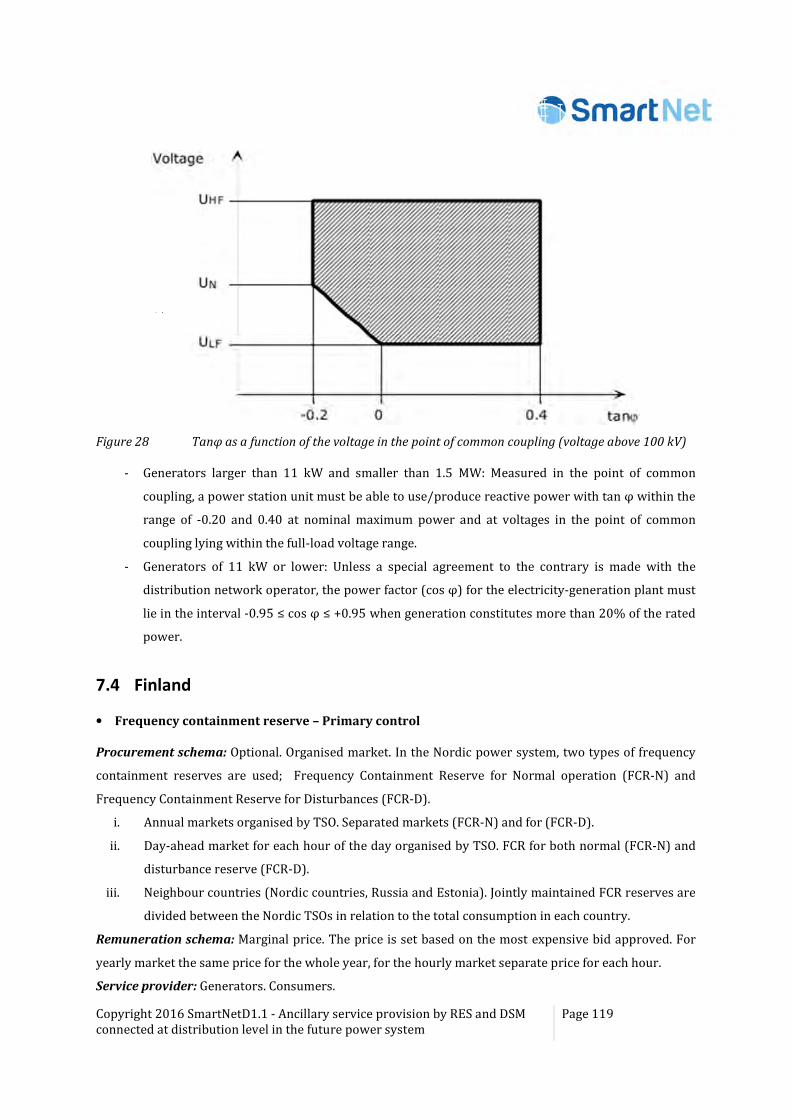
Copyright 2016 SmartNetD1.1 - Ancillary service provision by RES and DSM connected at distribution level in the future power system
Page 119
Figure 28 Tanφ as a function of the voltage in the point of common coupling (voltage above 100 kV)
- Generators larger than 11 kW and smaller than 1.5 MW: Measured in the point of common
coupling, a power station unit must be able to use/produce reactive power with tan φ within the
range of -0.20 and 0.40 at nominal maximum power and at voltages in the point of common
coupling lying within the full-load voltage range.
- Generators of 11 kW or lower: Unless a special agreement to the contrary is made with the
distribution network operator, the power factor (cos φ) for the electricity-generation plant must
lie in the interval -0.95 ≤ cos φ ≤ +0.95 when generation constitutes more than 20% of the rated
power.
7.4 Finland
• Frequency containment reserve – Primary control
Procurement schema: Optional. Organised market. In the Nordic power system, two types of frequency
containment reserves are used; Frequency Containment Reserve for Normal operation (FCR-N) and
Frequency Containment Reserve for Disturbances (FCR-D).
i. Annual markets organised by TSO. Separated markets (FCR-N) and for (FCR-D).
ii. Day-ahead market for each hour of the day organised by TSO. FCR for both normal (FCR-N) and
disturbance reserve (FCR-D).
iii. Neighbour countries (Nordic countries, Russia and Estonia). Jointly maintained FCR reserves are
divided between the Nordic TSOs in relation to the total consumption in each country.
Remuneration schema: Marginal price. The price is set based on the most expensive bid approved. For
yearly market the same price for the whole year, for the hourly market separate price for each hour.
Service provider: Generators. Consumers.
Copyright 2016 SmartNetD1.1 - Ancillary service provision by RES and DSM connected at distribution level in the future power system
Page 120
Cost recovery: Via consumer (mostly) and producer tariffs. Payments collected in balancing services
(from market imbalance payments).
Minimum rated power: 0.1 MW for FCR-N and for 1 MW FCR-D. Maximum single unit size 70 MW.
Activation time/Duration: Active all the time during contracted period when system fundamental
frequency deviates from the nominal. For FCR-N the deadband is from 49.95 to 50.05 Hz and the
operating range 49.9 to 50.1 Hz. FCR-D activates at 49.50 or 49.90 Hz.
Ramp size/Speed drop: For FCR-N the power must be fully activated in 3 minutes. For FCR-D fully within
30s but with additional requirements that depend on the type of resource.
Requirements: Automatic activation based on local measurement of the system fundamental frequency.
Penalty clause: Financial penalty.
Scheduling horizon:
i. Y-1: For the early markets the bidding competition is organised once a year in autumn.
ii. D-1: The bids for the hours in the following 24-hour period must be submitted by 6.30 pm.
• Automatic Frequency Restoration Reserve – Secondary control
FRR-A is a centralised automatically activated reserve. Its activation is based on a power change signal
calculated on the base of the frequency deviation in the Nordic synchronised area and sent by the TSO.
Procurement schema: Optional. Organised market (hourly market). Operators can submit bids to the
hourly market separately for upward and downward capacities
Remuneration schema: In addition to the capacity payment, the operator receives a separate energy
compensation based on regulation carried out.
Service provider: Generators. Rules designed for generators, consumption allowed but is not
participating.
Minimum rated power: 5 MW (aggregation allowed).
Activation time/Duration: 15 minutes.
Ramp size/Speed drop: Fully activated within 2 minutes. Responses must start within 30 seconds from
the request when filtered control signal is applied. For slower responding units unfiltered control signal
can be applied and then the response must start within 60 seconds and activate faster than 1(1+sT)^4
where the time constant T =35 s
Requirements: Automatic activation based on a power change signal sent by the TSO. This signal is
calculated by StatNett (Norwegian TSO) based on measured frequency deviation and power flows
between transmission network areas. The adequate response performance of the unit will be tested.
Fingrid and the FRR-A units communicate with a maximum interval of 10 seconds.
Penalty clause: Financial penalty.
Scheduling horizon: D-1.
Copyright 2016 SmartNetD1.1 - Ancillary service provision by RES and DSM connected at distribution level in the future power system
Page 121
• Manual Frequency Restoration Reserve – Secondary control
FRR-M is used to control power balancing in normal and disturbance situations. FRR-M consists of
market-based regulating bids in the Regulating Power Market (RPM) and capacity that TSO reserves for
disturbances. Activation is done manually from Fingrid’s Main Grid Control Centre..
Procurement schema: Fingrid maintains a balancing power market together with the other Nordic
transmission system operators. In the balancing power market, production and load owners can give
balancing power bids for their adjustable capacity. Mainly from power plants owned or leased by the TSO
(Fingrid). Each Nordic TSO maintains FRR-M to cover the dimensioning fault of its own area.
Remuneration schema: Capacity and energy are remunerated; Capacity (pay as bid). Energy (marginal
price). Activation payments (energy payments) reduce the capacity payments
Service provider: Generators. Consumption (disconnectable loads).
Cost recovery: Via consumer (mostly) and producer tariffs. Payments collected in balancing services
(from market imbalance payments).
Minimum rated power: 10 MW. Aggregation allowed.
Activation time/Duration: Manual activation in 15 min.
Penalty clause: Financial penalty.
• Voltage control
Procurement schema: Mandatory.
Remuneration schema: Units are obliged to provide a non-remunerated minimal service for voltage
control but fixed yearly remuneration based on unit real power for generators connected to 400 kV, 220
kV and 110 kV.
Service providers: Generators, DSOs.
Requirements: The requirements apply to generators connected to the transmission network as well as
distribution network levels. In general, the monitoring rate is hourly values for reactive power tariffs and
real-time monitoring for voltage control in generators. These units are obliged to provide a non-
remunerated minimal service for voltage control. Requirements are defined according to generator unit’s
nominal power. Additionally, wind power units are defined separately.
i) Mandatory service
- Generators and wind units with power < 10 MW: No requirements.
- Generators with power > 10 MW: Voltage control at generator connection point. Constant voltage
control. Power factor 0.95 reactive ≤ cos ϕ ≤ 0.9 inductive. Required during voltages 0.85 p.u. < V <
1.1 p.u. Generators with power > 100 MW require additional power system stabilisers (PSS).

Copyright 2016 SmartNetD1.1 - Ancillary service provision by RES and DSM connected at distribution level in the future power system
Page 122
- Wind units with 10 MW < Power < 25 MW: Voltage control at generator connection point. Type of
service; constant reactive power, constant power factor or constant voltage control. 0995 reactive
≤ cos ϕ ≤ 0.995 inductive. Required during voltages 0.9 p.u. < V < 1.05 p.u.
- Wind units with Power > 25 MW: Voltage control at generator connection point. Type of service;
constant reactive power, constant power factor or constant voltage control. 095 reactive ≤ cos ϕ ≤
0.95 inductive. Required during voltages 0.9 p.u. < V < 1.05 p.u. Wind installations with power >
100 MW require additional PSS or power oscillation damping.
- DSOs: Defined constraints for free reactive power transfer at TSO/DSO interface. Penalties applied
for exceeding these constraints. DSO sets own tariffs for its customers based on these reactive
power constraints.
ii) Additional service
Generators connected to 110 kV, 220 kV and 400 kV can offer this optional service with a
remuneration based on unit real power.
New principles for voltage control and reactive power management will be issued soon. First drafts indicate
three connection types; consumption, generation and combined consumption/generation. Reactive power
for voltage control would be measured for each connection. Related payments would be according to
agreements. This would help to create a market for reactive power for voltage control purposes. However,
this market structure is not defined yet.
• Other services – Peak load capacity reserves
Procurement schema: The Finnish energy authority arranges competitive bidding for two years period.
In addition, consumption must go via the balancing power market and generation via the Elspot day-
ahead market and the balancing market. The bid is activated if market-based bids are not sufficient to
reach balance of supply and demand.
Remuneration schema: Marginal price at the balancing power market, but, at least, Elspot (day-ahead
market) price.
Service provider: Generators. Consumption.
Cost recovery: Via consumer (mostly) and producer tariffs. Payments collected in balancing services
(from market imbalance payments).
Minimum rated power: 10 MW. Aggregation allowed.
Activation time/Duration:
For consumption: Activation within 10 minutes and minimum duration 2 h.
For generation: 12 hours in winter time (December- February). In other seasons, 1 month.
Scheduling horizon: Y-2.
Copyright 2016 SmartNetD1.1 - Ancillary service provision by RES and DSM connected at distribution level in the future power system
Page 123
7.5 Italy
• Primary Frequency Control
Procurement schema: Mandatory provision.
Remuneration schema: There is an optional remuneration scheme for the provision of the service. The
price of the service is related to the weighted average price of activation in real time balancing market.
Service provider: All units with rated power greater than 10 MVA must contribute to primary frequency
regulation except of those without, by their nature, of regulating capacity, such as, hydro with reversible
Francis turbine and the geothermal units.
Cost recovery: Partially recovered through imbalance settlement and cost charges applied to end users.
Minimum rated power: 10 MVA.
Activation time/Duration: half of the variation of the generated power requested to the unit must be
supplied within 15 seconds and the full variation within 30 seconds; then, the new generation level must
be kept for at least 15 minutes (in case there are no new frequency variations).
Product resolution: all the qualified generating units shall provide the primary control reserve
responding to frequency variations with variations of the generated power within upward and downward
bands equal to 1.5% of nominal power.
i. in Sardinia, the synchronous generation units must make available a regulation band of not less
than ± 10% of the efficient power of each eligible generation group;
ii. in other areas, the synchronous generators must make available a regulation band of not less
than ± 1.5% of the efficient power;
iii. in areas belonging to the region of Sicily, a control band should be made available not less than ±
10% of the efficient power of each of the appropriate generation unit, in time periods in which is
not in service the interconnection with the mainland.
• Secondary Frequency/Power Control
Procurement schema: Optional. Market based schema.
Remuneration schema: Pay as bid. Only the energy term is remunerated (€/MWh).
Service provider: Only power generation units, but intermittent resources.
Cost recovery: Partially recovered through imbalance settlement and cost charges applied to end users.
Activation time/Duration: 15 min. Secondary reserve shall be guaranteed for 120 min.
Product resolution: Power generation units (but intermittent renewables) with rated power greater than
10 MVA with a minimum gradient of 10 MW in 15 min. They have to be able to provide a reserve margins
equal to: a) ± 15% of the maximum power for hydro; b) the greater between ± 10 MW and ± 6% of the
maximum power for thermal units.
Copyright 2016 SmartNetD1.1 - Ancillary service provision by RES and DSM connected at distribution level in the future power system
Page 124
Other characteristics: This automatic function is performed by a central controller in the control system
of Terna (Italian TSO). The Sardinia (normally) and Sicily (when not in synchronism with the Continent),
perform locally the secondary power reserve function.
The procurement of secondary reserve is made by the TSO in the ancillary services market in which the
scheduling resulting from the energy market is modified in order to be compliant with system constraints
(minimum reserve margins, network constraints). Secondary reserve margins are reserved upon
generating units qualified for the provision of the service.
• Tertiary Power Control
Procurement schema: Optional. Market based schema.
Remuneration schema: Pay as bid.
Service provider: Only power generation units, but intermittent resources.
Cost recovery: Partially recovered through imbalance settlement and cost charges applied to end users.
Activation time/Duration: 15 min. Tertiary reserve shall be guaranteed for an indefinite time period.
Other characteristics: The procurement of tertiary reserve is made by the TSO in the ancillary services
market. All the qualified units shall make available to the TSO all the residual margins after the energy
market, up to the maximum power and down to the minimum power and they have to be ready to accept
a variation in the generation scheduling to make available such margin.
• Voltage control – Reactive reserve for the primary voltage control
Procurement schema: Mandatory.
Remuneration schema: Not remunerated.
Service provider: Generators.
Product resolution: An enabled dispatching unit will make available the maximum reactive power (in
delivery or absorption) compatible with the technical characteristics of each generation group.
Other characteristics: The supply of resources for the reactive reserve service for primary voltage
regulation consists in the provision of the reactive power production; this provision is given through an
automatic adjusting device able to modulate the reactive power supplied by the generation group on the
basis of the voltage deviation of the same generation group of terminals with respect to a reference value.
For the suitability of reactive reserve service for primary voltage regulation each unit must be equipped
with an Autonomous System for the Regulation of reactive power and voltage in conformity with the
specifications described in the network code.
• Voltage control – Reactive reserve for the secondary voltage control
Copyright 2016 SmartNetD1.1 - Ancillary service provision by RES and DSM connected at distribution level in the future power system
Page 125
Procurement schema: Mandatory. The eligible dispatching units have an obligation to provide the
maximum reactive power available.
Remuneration schema: Not remunerated.
Service provider: Participation in the service from eligible generation units is determined depending on
the location of the generation unit on the network and maintaining appropriate voltage profiles on the
national network.
Other characteristics: Each unit will be equipped with an autonomous system for the regulation of
reactive power and voltage and with telecommunications equipment able to exchange all the necessary
information. The supply of resources for the reactive reserve service for secondary voltage regulation
consists in the provision of the reactive power production; this provision is given through an automatic
adjusting device able to modulate the reactive power supplied by the generation group on the basis of the
voltage deviation of the same generation group of terminals with respect to a reference value defined for
some network points.
• Other services – Real time balancing
Procurement schema: In the real time balancing service the TSO accepts secondary and tertiary reserve
bids/offers procured ex-ante. Secondary reserve is activated according to a pro quota mechanism.
Tertiary reserve is activated according to a merit order list.
Remuneration schema: Pay as bid.
Service provider: Only power generation units, but intermittent resources
Cost recovery: For the qualified generating units, energy imbalances are priced according to a dual price
mechanism, depending on the sign of the control area imbalance. On the other hand, imbalances of
consumers and of all the generating units not qualified for providing ancillary services are priced with a
single price mechanism, depending on the sign of the control area imbalance. For non-dispatchable
renewable energy sources the current regulation fixes an imbalance threshold for each energy sources
(wind, PV, RoR hydro), within which the cost of imbalances is aggregated and equally divided among all
generating units of a specific source. The net imbalance of a unit exceeding the threshold is then priced
according to the non-qualified unit regulation.
Activation time/Duration: For qualified units the relevant time frame is 15 minutes, for non-qualified
units it is 1 hour.
Other characteristics: The TSO uses the resources for the real-time balance for: a) maintaining the
balance between injections and withdrawals of electricity; b) the resolution of network congestion; c) the
restoration of the correct secondary power reserve margins.
• Other services – Interruptible load service (Interruptibility)
Copyright 2016 SmartNetD1.1 - Ancillary service provision by RES and DSM connected at distribution level in the future power system
Page 126
Procurement schema: Optional.
Remuneration schema: The amount of interruptible loads to be supplied in the 3-year-period (2015-
2017) is 3300 MW, that the TSO Terna shall buy by means of a Dutch auction mechanism (auctioneer
begins with a high asking price which is lowered until some participant is willing to accept the
auctioneer's price, or a predetermined reserve price is reached), starting from a price of 105000
€/MW/year for Instantaneous switch-off and 60000 €/MW/year for Emergency switch-off. In addition to
the capacity compensation, during the annual operation, interruptible loads receive an additional
compensation of 3000 €/MW for each interruption ordered by the TSO.
Service provider: All the entities which are able to:
i. ensure the interruptible service: a) in real time, characterised by an actuation time less than 200
ms, on the basis of a remote signaling sent by Terna; b) in deferred time in an emergency,
characterised by an actuation time of less than 5 s, on the basis of a remote signaling sent by
Terna.
ii. be an end customer, so that the assumption of responsibility resulting from the load shedding is
directly between Terna and each counterparty;
iii. certify that this gap does not lead, in any case, the risk to workers, the environment and
production facilities;
iv. certify that they have a installed power according to specifications set by Terna.
The requirements for a consumer for participating to the auction include the minimum size of the
load equal to 1 MW, the capability to switch-off the consumption according to the required
timing and the presence in the site of an automatic device for processing the control signal issued
by the TSO.
Minimum rated power: 1 MW.
Product resolution: The standard products traded in this auction include:
i. A 3-year-period product (¾ of the total amount to be provided should be covered by this
product);
ii. Annual product, that accounts for the residual capacity after the 3-year-period allocation;
iii. Monthly product, that accounts for the residual capacity after the previous long term allocations
Other characteristics: It is necessary an automatic device for processing the control signal issued by the
TSO.
7.6 Norway
• Frequency containment reserve – Primary control
Procurement schema: Mandatory reservation for machines over 10 MVA (via droop set point).
Copyright 2016 SmartNetD1.1 - Ancillary service provision by RES and DSM connected at distribution level in the future power system
Page 127
i. Weekly markets organised by TSO. FCR for normal operation (FCR-N): on Thursdays for
weekends and on Fridays for working days.
ii. Daily market organised by TSO. FCR for both normal (FCR-N) and disturbance reserve (FCR-D).
Remuneration schema: Marginal price. In special cases pay-as-bid can be applied.
Service provider: Generators. Consumption.
Cost recovery: Via consumer (mostly) and producer tariffs.
Minimum rated power: 1 MW.
Ramp size/Speed drop: The transmission system operator (TSO) requires that generators above 10 MVA
can have a maximum of 12 % droop if they are not active in the market. During summer this requirement
is lowered to a maximum of 6 %.
Activation time/Duration:
i. For FCR-N: Activation within 5 s and full activation 30 s. Duration: 4 hour block 20:00-24:00, 8
hour block 00:00-08:00, 12 hour block 08:00-20:00.
ii. For FCR-D: Activation, 2-3 minutes. Minimum duration, 1 hour.
Requirements: Automatic activation. The generators have to meet the general functional requirements.
Penalty clause: Financial penalty.
Scheduling horizon: W-1 for FCR-N. D-1 for FCR-D.
• Automatic Frequency Restoration Reserve – Secondary control
Procurement schema: Weekly market organised by TSO. Reserves from the other Nordic countries can
be used.
Remuneration schema: Marginal price. In special cases pay-as-bid can be applied.
Service provider: Generators.
Cost recovery: Via consumer (mostly) and producer tariffs.
Minimum rated power: Minimum 5 MW. Maximum 35 MW.
Product resolution: The volume should be dividable by 5.
Activation time/Duration: Activation time, 120-210 s.
Requirements: Automatic activation.
Penalty clause: Financial penalty.
Scheduling horizon: W-1.
• Manual Frequency Restoration Reserve – Tertiary control
Procurement schema: Common Nordic Market arrangements (merit list order) for FRR-M:
- FRR Option market (season) week 45-15
Copyright 2016 SmartNetD1.1 - Ancillary service provision by RES and DSM connected at distribution level in the future power system
Page 128
- FRR Option market (week) as needed
- FRR Organised Market
- Bilateral Agreements
The Option Market is an additional arrangement, which secures liquidity on the regular RR market.
Remuneration schema: Marginal price.
Service provider: Generators. Consumption.
Cost recovery: Via consumer (mostly) and producer tariffs.
Minimum rated power: 10 MW.
Activation time/Duration: Activation time, 15 minutes. Minimum duration, 1 hour.
Penalty clause: Financial penalty.
Scheduling horizon: D-1 (bids are submitted the day before at 20:00).
• Voltage Control
Procurement schema: Mandatory
Remuneration schema: Not remunerated.
Service provider: Generators.
Requirements:
For hydro- and thermal power plants the requirements are applied to the production unit ≥ 1 MVA (not
where the sum of production units exceed this size). In addition, the unit ≥ 0.5 MVA have to be
synchronous machine with automatic voltage regulation. For wind turbines the requirements are applied
where the overall production, i.e. wind energy park ≥ 1 MVA.
Hydropower (selection): The System Operator can define the voltage levels and limits for the exchange of
reactive power in the regional and central grid, as well as adopting reactive regulation. Synchronous
Generators ≥ 1 MVA shall at full load operate by the power factor cos ϕ ≤0.86 capacitively and cos ϕ ≤
0.95 inductively. Asynchronous Generators should at least be compensated for the idle reactive power
consumption, but this must be considered from the voltage of the place.
Generator (not asynchronous) ≥ 0.5 MVA should have voltage regulator / equipment for continuous
voltage regulation.
Generator ≥ 25 MVA shall have PSS. Voltage setpoint (voltage reference) should be set locally and from
the control room. Voltage Regulator has to operate freely and without undue restriction within
operational limits for generator. Unless special circumstances require it, MVAr- or cos-regulation should
not be used unless this is agreed and approved by the system operator.
Copyright 2016 SmartNetD1.1 - Ancillary service provision by RES and DSM connected at distribution level in the future power system
Page 129
Windpower (selection): The system operator can oblige the generator to provide regulation reactive
power within production units' technical limitations. Windpower parks ≥ 1 MVA shall at full load operate
by the power factor cos ϕ ≤ 0.95 capacitively and cos ϕ ≤ 0.95 inductively.
Directly connected asynchronous machines shall have equipment for compensating for the reactive
power consumption. This equipment shall be designed with regard to reactive power needs in the
connected networks, and if necessary provide dynamic voltage regulation.
7.7 Spain
This section is based on Spanish system operator’s operating procedures [66].
• Frequency Containment Reserve – Primary Reserve
Procurement schema: Mandatory.
Remuneration schema: Not remunerated.
Service provider: Generators only.
Product resolution: ± 1.5% of maximum power output.
Activation time/Duration: The service is activated before 15s or 30s, depending on the imbalance, and
the maximum duration is 15 min until Frequency Restoration Reserve re-establishes the initial values of
Frequency Containment Reserve. The service must be activated before 15s for imbalances generation-
demand lower than 1500 MW. For imbalances generation-demand higher than 1500 MW, 50% of the
reserve before 15s and on a straight-line basis up to 100% before 30s.
Other characteristics: When any technical problem makes impossible the provision of the service, the
duty-bearers must contract directly the service from other available providers.
• Frequency Restoration Reserve – Secondary Reserve
Procurement schema: Optional.
Remuneration schema: Market based schema. It is remunerated under two concepts: capacity
(regulation band) and usage (energy):
i. Reserve assignation price: Marginal price of the regulation band assignation. The provision of
more regulation than the previously assigned implies a collection right at a price equal to 1.5
marginal price. On the contrary, the no provision of the service implies a payment obligation
equal to 1.5 marginal price.
ii. Effective net energy: The energy usage price is the marginal price of the tertiary energy price
(replacement reserve) which has been necessary to assign for the replacement of the restoration
reserve.
Copyright 2016 SmartNetD1.1 - Ancillary service provision by RES and DSM connected at distribution level in the future power system
Page 130
Service provider: Generation units included in a Regulation Area, which is a grouping of production units
that can regulate under the management of an Automatic Generation Control system. The responsible
entity of a regulatory area submits bids for power band in €/MW for each scheduling period of the next
day. The bids for each scheduling period are made up of several blocks. Only one of these blocks can
include an indivisibility clause.
Cost recovery:
i. The regulation band cost is defrayed through the acquisition units, depending on their
consumption raised to power station busbars.
ii. The effective energy usage cost is allocated between the energy market participants who have
committed any deviation with respect to their scheduled operation.
Minimum rated power: The minimum bid size is 10 MW.
Product resolution: The recommended minimum requirement of upward secondary regulation reserve
is:
� � √���� �2 �
Where, Lmax=Expected load in the control area, a = 10 MW and b = 150 MW.
In general, the downward band is between 40%-100% of the upward band. The minimum regulatory
band, especially during off-peak periods, is 500 MW for the upward band and 400 MW for the downward
band.
Activation time/Duration: The activation time is before 30 s and the service duration 15 min.
Penalty clause: Payment penalisation.
Other characteristics: The total amount of assigned power bands must be +/- 10% of the total required
regulatory band.
Required by the System Operator:
- Upward reserve requirement (RSSUBh (MW)).
- Downward reserve requirement (RSBAJh (MW)).
- Minimum and maximum value of the regulation band (sum of the upward and downward reserve
of the individual bids), RSBANmax (MW) and RSBANmin (MW).
Bids:
- Upward reserve offered, RNSsubirh (MW).
- Downward reserve offered, RNSbajarh (MW).
- Regulation band price, PSbandah (€/MW).
- Energy variation with respect to the planned in provisional daily viable schedule.
The sum of the upward and downward reserve within a bid (RNSsubirh + RNSbajarh) must be between
the limits established by the System Operator (RSBANmax and RSBANmin).
Each regulatory area must comply with the established ratio between upward and downward reserve,
RSBh (RSBh = RSSUBh/RSBAJh (p.u.)).
Copyright 2016 SmartNetD1.1 - Ancillary service provision by RES and DSM connected at distribution level in the future power system
Page 131
Scheduling horizon: Day-ahead market. The day before dispatching, D-1.
• Replacement Reserve – Tertiary Reserve
Procurement schema: Mandatory bidding for the available capacity.
Remuneration schema: Market based schema. Marginal price (€/MWh):
i. Upward energy assignation: Collection right at marginal upward energy price.
ii. Downward energy assignation: Payment obligation at marginal downward energy price.
Service provider: Generation installations and pumped hydro units (consumption) which have been pre-
qualified by the TSO. Since February 2016, RES and other DER can also ask to be pre-qualified as service
providers.
Cost recovery: The service cost is defrayed by the energy market participants who have committed any
deviation with respect to their scheduled operation.
Minimum rated power: 10 MW.
Product resolution: Minimum upward reserve is equal to the maximum loss of generation caused by a
simple failure of an electric system element, plus the 2% of the expected demand in each scheduling
period. In general, the downward reserve is between 40%-100% of the upward reserve. Indivisible
blocks of bids are not allowed.
Activation time/Duration: Activation time: 15 min. Service duration: 2 hours.
Penalty clause: Breach of:
i. Upward energy assignation: Payment obligation for breach of the assigned energy at an average
price calculated considering several issues as; technical restrictions, deviation management,
tertiary reserve, etc. and multiplied by 0.2.
ii. Downward energy assignation: Payment obligation for breach of the assigned energy at day-
ahead market price.
Other characteristics: The bids must include the available reserve in MW, both upward and downward,
and the related energy price in €/MWh. When several installations offer the same price, those using
renewable resources have priority. Then, the high efficiency cogeneration installation, and at last, the
remaining bids.
Scheduling horizon: Day-ahead market. The day before dispatching, D-1.
• Voltage control – Transmission network
Procurement schema: Mandatory (not remunerated) and Optional (remunerated)
Remuneration schema: Only the optional assignation is remunerated.
Generators: Four concepts are included:
Copyright 2016 SmartNetD1.1 - Ancillary service provision by RES and DSM connected at distribution level in the future power system
Page 132
i. Reactive power generation additional band availability (assigned by the Annual voltage control
Plan).
ii. Reactive power absorption additional band availability (assigned by the Annual voltage control
Plan).
iii. Reactive energy generated at power plant busbar, for the effective voltage control at
transmission network, excluding the coming energy from the mandatory band.
iv. Reactive energy absorbed at power plant busbar, for the effective voltage control at transmission
network, excluding the coming energy from the mandatory band.
v. The operation as synchronous compensator is remunerated for the power band availability and
for the effective energy generated/absorbed for the voltage control.
Consumers (service providers) and distribution grid managers:
i. Additional band availability (assigned by the Annual voltage control Plan), equal to a reactive
power generation.
ii. Additional band availability (assigned by the Annual voltage control Plan), equal to a reactive
power absorption.
iii. Reactive energy delivered/no consumed, for the effective voltage control of the transmission
network, within the additional band assigned in the day-ahead scheduling.
iv. Reactive energy consumed, for the effective voltage control of the transmission network, within
the additional band assigned in the day-ahead scheduling.
Service provider:
i. Generation units with net power > 30 MW (ordinary regime) or renewable/cogeneration/wastes
installations connected to the transmission network.
ii. Transmission Operators.
iii. Qualified consumers connected to transmission network and with a contracted power ≥ 15 MW.
iv. Distribution network managers.
Cost recovery: The service cost is defrayed through the holders of acquisition units and physical bilateral
contracts, depending on their consumption raised to power station busbars.
Requirements:
Mandatory requirements:
i. Generators: They must have a minimum mandatory margin of reactive power, both in generation
and in absorption, for the service provision. The aim is to maintain the voltage at power plant
busbars within the established margins (for the whole variation range of active power between
the technical minimum and the maximum net power). These margins are:
- Capacitive Cos φ = 0.989 (reactive power generation equal to 15% of the maximum net active
power).
Copyright 2016 SmartNetD1.1 - Ancillary service provision by RES and DSM connected at distribution level in the future power system
Page 133
- Inductive Cos φ = 0.989 (reactive power absorption equal to 15% of the maximum net active
power).
ii. Transmission System Operators: They must provide the service with the available equipment in
their networks; reactances, capacitors, regulating transformers, etc.
iii. Consumers (service providers) and Distribution System Operators: For each hourly period (peak,
off-peak, super off-peak):
- Peak period: Reactive power consumption cannot exceed the 33% of active power
consumption (Cosφ ≥0.95 inductive).
- Off-peak period: Reactive power consumption cannot exceed the 33% of active power
consumption and it cannot exist reactive power delivery to the transmission network (0.95
inductive < Cosφ < 1.00 inductive).
- Super off-peak period: It cannot exist reactive power delivery to the transmission network
(Cosφ ≥ 1 inductive).
Optional requirements (remaining resources): The bids for additional resources do not include any price,
since this is regulated and established by the Government.
i. Generators: They can submit bids for the availability of a surplus band of reactive power
generation/consumption exceeding the mandatory requirements. Additionally, bids for the
operation of generators as synchronous compensators can be submitted.
ii. Consumers (service providers) and Distribution System Operators: They can submit bids for
their additional available resources exceeding the minimum requirements.
Penalty clause: Breach of mandatory requirements: A payment obligation for the reactive power no
delivered/consumed. Breach of additional resources assigned: A negative term and a coefficient to
discourage these breaches are included in the payment formula.
Scheduling horizon: Annual assignation: Additional resource assignation for the next year, before 15
December.
The day before dispatching, D-1, the System Operator advertises:
i. The voltage set points to be maintained at control nodes (power plant busbars and nodes
controlled by transformers with on load tap changer).
ii. Power factors to be maintained by consumers and the distribution system operators, related to
assigned bids of additional resources.
When necessary, the System Operator can require some actions for the voltage control during system
operation in real time.
• Voltage control – Distribution network
Copyright 2016 SmartNetD1.1 - Ancillary service provision by RES and DSM connected at distribution level in the future power system
Page 134
Procurement schema: Mandatory.
Remuneration schema: Not remunerated.
Service provider:
i. Consumers connected at distribution level
ii. RES installations connected at distribution network
Requirements:
Consumers: All consumers, apart from consumers type 2.0A, must have installed a reactive energy meter.
The reactive energy term is applied over every tariff periods, except that one from 0:00 to 8:00 (super off-
peak period for tariffs Type 3 and Type 6), when the reactive energy consumption is higher than the 33%
of active energy consumption during the billing period (cos ϕ < 0.95) and only is applied over the excess.
This excess price is defined in euro/kVArh.
The distribution operators must show the investments performed each year (by elements and by zones)
to the competent authority in order to fulfil the voltage control requirements.
The conditions and obligation for this term application are:
i. Mandatory power factor correction: When the reactive energy consumption is 1.5 times higher
than the active energy consumption in three or more measurements, the distribution operator,
supplier of this consumer, must inform the competent authority. This entity can establish a
period for the power factor improvement and, if this schedule is not fulfilled, may deny the access
to the energy network. The consumers with simple tariff (2.0A) must have the suitable
equipment for the correction of the reactive energy consumption to get an average consumption
lower than the 50% of the active energy consumption.
ii. Capacitive effects correction: When the installation of a supply causes capacitive effects and
disturbances in the distribution or transmission networks, anyone affected by these disturbances
can inform the competent authority. This entity can establish a period for the disturbance
correction and, if this is not achieved, may deny the access to the distribution network.
iii. Management of reactive energy correction equipment: The distributors can agree with their
clients the total or partial disconnection of their reactive energy correction equipment and the
reactive energy meters during the off-peak period, and the reactive energy term fixation to be
applied in these cases. These agreements must be approved by the competent authority.
RES installations: The mandatory power factor range is established between 0.98 inductive and 0.98
capacitive. The special regime installations with power higher than 5 MW, or those ones with powers
lower than 5 MW that are part of a group (of the same subgroup type) whose total power is > 5 MW,
must be assigned to a generation control centre. This will be the interlocutor with the System Operator,
sending the installations’ information in real time and executing the convenient instructions in order to
guarantee the electrical system reliability. The installations with installed power higher than 1 MW, or
lower than 1 MW but being part of an installations aggrupation whose total power is higher than 1 MW,
Copyright 2016 SmartNetD1.1 - Ancillary service provision by RES and DSM connected at distribution level in the future power system
Page 135
must send tele-measurements in real time to the System Operator. These telemeasurements can be sent
by the installation owner, its legal representative or through the distribution company control centre. The
distribution system operators will have access to the real time telemeasurements of the installations
connected to their networks. The installations with power > 5 MW must follow the indications launched
by the System Operator for the modification of the power factor range, depending on the system
necessities. Until the development of the procedure for RES participation in voltage control service the
RES installations must maintain their power factor within the established range. The installations with
power < 100 kW connected to networks < 1 kV must maintain the power factor as close to 1 as possible
or, at least, higher than 0.98 when the installation is working at power higher than 25% of its nominal
power. RES installations connected to transmission network can participate in the voltage control service
in the same manner as the ordinary regime installations do.
Penalty clause:
Consumers: Payment obligation depending on cosϕ and, ultimately, the prohibition of access to the
distribution network.
RES installations: The mandatory power factor range is currently established between 0.98 inductive and
0.98 capacitive. This range can be modified annually. The penalty for breach is 0.261 c€/kWh and it is
applied on an hourly basis.
• Other services – Interruptible load service (Interruptibility)
Procurement schema: Optional. Reverse auction managed by System Operator.
Remuneration schema: Two terms:
i. Fixed term linked to power availability
Rmmax = (1/12)*Psub* Price
Psub: Power assigned (auction). Price: Clearing price (auction)
ii. Variable term linked to the effective execution of power reduction
Reoi = Psub * teoi * Preoi
teoi: Operation duration (hours). Preoi: Reference price in €/MWh. Index-linked value to the
estimated and weighted average tertiary reserve price.
Service provider: Electricity consumers connected to high voltage network.
Cost recovery: The service cost is borne by:
i. The owners of the power plants defray a part of the monthly fixed cost according to their
contributions to the coverage of the system peak demand.
ii. The demand assumes the remaining monthly fixed cost proportionally to its consumption at the
power plant busbars.
iii. The hourly variable cost and the energy reduced will be integrated with the balance energy
according to the procedure of the imbalance settlement.
Minimum rated power: Demand reduction blocks of 5MW or 90 MW.
Copyright 2016 SmartNetD1.1 - Ancillary service provision by RES and DSM connected at distribution level in the future power system
Page 136
Activation time/Duration: Three options (to be determined by System Operator):
i. Immediate execution: Without prior notice.
ii. Fast execution: Minimum prior notice of 15 min.
iii. Hourly execution: Minimum prior notice of 2 hours.
Maximum duration of each execution = 1 hour. No more than 2 consecutive executions. Maximum per
year:
i. 5 MW product: 40 hours/week and 240 hours/year.
ii. 90 MW product: 60 hours/week and 360 hours/year
Requirements: Some of the most relevant requirements to provide the service:
i. To fulfil the requirements to be considered as an electricity supply point or installation.
ii. To be high voltage consumers who buy electricity in the production market, directly or
throughout a supplier, and which have a grid-access contract with the corresponding DSO.
iii. To have installed the measurement and control equipment for service management and a load
shedding relay by subfrequency in the supply point.
iv. Financial guarantee for possible breach of service provision obligation.
v. To prove that, at least, 50% and 55% of monthly consumption is made in pricing period 6 (from
0:00 to 8:00 every day, and the whole day in Saturday, Sundays, bank holidays and August) for
the 90 MW and the 5 MW products, respectively.
vi. For the 5 MW product: To prove that the average hourly consumption during the whole
scheduling horizon is not below 5 MW over a reference residual power (Pmax) stated by the
consumer during the qualification process.
vii. For the 90 MW product: To prove an effective and verifiable consumption higher than 90 MW
over a reference residual power (Pmax) stated by the consumer during the qualification process
during, at least, the 91% of the hours of the month.
Penalty clause: Payment obligation or exclusion and loss of retribution. It depends on several factors
such as frequency and kind of breach; resource availability, load shedding relay, monthly consumption,
etc.
Scheduling horizon: Annual market (assignation for the next year, 1 January - 31 December).
• Other services – Deviation management
Procurement schema: Optional. Market based schema.
Remuneration schema: Marginal price (€/MWh). Upward energy assignation: Collection right at
marginal upward energy price. Downward energy assignation: Payment obligation at marginal
downward energy price.
Service provider: Generation installations. Pumped hydro units (consumption).
Copyright 2016 SmartNetD1.1 - Ancillary service provision by RES and DSM connected at distribution level in the future power system
Page 137
Cost recovery: The service cost is defrayed by the energy market participants who have committed any
deviation with respect to their scheduled operation.
Minimum rated power: 10 MW.
Activation time/Duration: Resolution of deviations arisen between generation-consumption after the
end of an intraday market session till the beginning of the scheduling horizon of the next session.
Product resolution: The value of the extra active power reserve is calculated as:
i. Upward reserve: Sum of deficits caused by; a) Differences between the expected hourly demand
by the System Operator and the resulting hourly demand in the Functioning Base Programme
(PBF) and the successive intra-day sessions. b) Differences between the sum of the wind
production in the Functioning Base Programme (PBF) and the hourly wind production foreseen
by the System Operator. c) The foreseen loss of generation caused by successive failures
and/or delays on the couplings or increase of the thermal set load, with a probability of 5% or
more, is higher than the maximum loss of production caused by a simple failure of an electric
system element.
ii. Downward reserve: Sum of excesses caused by the same concepts as in the upward reserve case.
Requirements: The System Operator, only when the foreseen average deviation is ≥ 300 MW, organises
the deviation management market. The assigned bids must cover the +/- 10% of the advertised total
requirement. When several installations offer the same price, the priority to organise the bids: a) Divisible
blocks against indivisible blocks. b) For the same type of blocks, priority for those offering lower amount
of energy. c) Those using renewable resources. d) The remaining bids. The upward or downward energy
within an indivisible bid cannot be higher than 300 MWh.
Penalty clause: Breach of upward energy assignation: Payment obligation for breach of the assigned
energy at an average price calculated considering several issues as; technical restrictions, deviation
management, tertiary reserve, etc. and multiplied by 0.2. Breach of downward energy assignation:
Payment obligation for breach of the assigned energy at day-ahead market price.
Scheduling horizon: Quasi real time. Dispatching day, D.
• Other services – Black start service
Procurement schema: Agreement of collaboration.
Remuneration schema: Not remunerated.
Service provider: Utilities operating in the Spanish power system. The hydro plants are the first to be
restarted in case a blackout takes place.
Requirements: Every year a national blackout rehearsal coordinated by the system operator is
performed using the system operator network model. All the generation utilities participate in this

Copyright 2016 SmartNetD1.1 - Ancillary service provision by RES and DSM connected at distribution level in the future power system
Page 138
simulation, taking about 4-5 hours to restore the 70% of the system. The renewable resources are not
taking into account for this service provision due to the instability and unpredictability of its generation.
The steps of the procedure for the service restoration are:
i. Six different electric zones has been defined (zone division is related to hydro plants location).
ii. In case a national blackout occurs, the autonomous hydro plants are simultaneously started
forming electrical islands.
iii. The zone which extends from the river Duero to the French border is considered as key zone.
After connecting this zone to the European transmission network through the French border, the
European frequency is achieved.
iv. This key zone acts as reference to which the rest of the electric areas will be then successively
synchronised.
Scheduling horizon: Emergency plans are yearly reviewed.
• Other services – Technical restrictions resolution (after day-ahead market)
Procurement schema: Technical restrictions of the daily base operating schedule (PDBF). Two phases:
Phase I: Modifications of the PDBF scheduling for security reasons.
i. Technical restrictions identification. This includes several steps such as; i) analysis of available
information related to production and demand forecasts, international exchanges included in the
PDBF, unavailable units, etc. ii) identification of any circumstance which can affect the security,
quality and reliability of the system, iii) resolution of restrictions affecting the interconnections
and, at least, resolution of restrictions in the Spanish system.
ii. Means for technical restrictions resolution. The production units will have assigned a value no
lower than the minimum technical limit and no higher than the net active power.
- Increase of energy scheduled in the PDBF. By means of energy sale bids submitted during the
technical restriction process by production installations. When several solutions are
technically feasible the system operator carries out an economic assessment.
- Decrease of energy scheduled in the PDBF: These reductions will be carried out by means of
withdrawals in the PDBF schedule (submitted bids for technical restrictions resolution are
not used).
- Technical restrictions solution due to an insufficient upward power reserve. When after the
incorporation of redispatchings and security limitations the upward reserve is not sufficient,
the system operator establishes a schedule considering a value equal to the technical
minimum over the thermal groups scheduled in the PDBF and also applies maximum
limitations over the pumping consumption. When these actions are not enough the system
operator schedules the start and coupling of additional thermal groups.
Copyright 2016 SmartNetD1.1 - Ancillary service provision by RES and DSM connected at distribution level in the future power system
Page 139
- Technical restrictions solution due to an insufficient downward power reserve. When after
the incorporation of redispatchings and security limitations the downward reserve is
insufficient, the system operator will apply limitations over the acquisition units up to the
values established in the PDBF.
Phase II: Generation-demand rebalancing. Once the technical restrictions identified in the PDBF are
solved, the System Operator modifies the schedule in order to obtain a balance generation-demand taking
into account the limitations from phase I. The System Operator defines the modifications to be included in
the PDBF. Firstly, these modifications are assigned to those units which are bound to submit energy bids
but that have not met that requirement. When this is not enough, the System Operator makes use of the
upward/downward technical restrictions bids. Pay as bid schema. After all these considerations the daily
viable schedule (PDVP) is launched by the System Operator.
Remuneration schema:
Phase I: PDBF modifications for security reasons.
i. Phase I - Upward assignation:
- Production units: The upward energy assignation is remunerated at the submitted price
depending on whether the bids are simple or complex. When there are no bids, or not enough,
and the exceptional mechanism of resolution is used, the price of remuneration will be
1.15xday-ahead market price.
- Pumping consumption and exportation acquisition units: The upward energy assignation for
acquisition units within the day-ahead market are considered as a rectification in the
production market and imply a collection right at day-ahead market price. Transaction linked
to a bilateral agreement: There will be no financial settlement.
ii. Phase I - Downward assignation, production units. The downward energy assignation for
production units within the day-ahead market are considered as a rectification in the production
market and imply a payment obligation at day-ahead market price. Transaction linked to a
bilateral agreement (for sale units whose production is for national consumption): Payment
obligation at day-ahead market price. Transaction linked to a bilateral agreement (for sale units
whose production is for pumping consumption or exportation): There is no financial settlement.
The breach of assignations can cause penalties application.
When the energy is removed from bilateral contracts by congestion at international borders, there is no
financial settlement.
Phase II: Generation-demand rebalancing. The downward energy assigned to bilateral contracts of
production units whose demand has been reduced in the phase I, will not result in any financial
settlement. The upward energy assigned to bilateral contracts of acquisition units (pumping or
exportation) whose generation has been reduced in the phase I, will not result in any financial settlement.
Copyright 2016 SmartNetD1.1 - Ancillary service provision by RES and DSM connected at distribution level in the future power system
Page 140
i. Phase II - Upward assignation:
- With simple bid submitted: Collection right at upward price submitted for technical
restrictions resolution.
- Without simple bids submitted:
• Acquisition units which have not submitted upward bids: Collection right at 0.85xday-
ahead market price.
• Production units which have not submitted upward bids: Collection right at 0.85xday-
ahead market price.
• After all submitted bids have been assigned, if the exceptional mechanism of resolution is
necessary: Collection right at 1.15xday-ahead market price.
ii. Phase II - Downward assignation:
- With simple bids submitted: Payment obligation at downward price submitted for technical
restrictions resolution.
- Without simple bids submitted:
• Acquisition units which have not submitted downward bids: Payment obligation at
0.85xday-ahead market price.
• Production units which have not submitted downward bids: Payment obligation at
1.15xday-ahead market price.
Cost recovery: The extra charge due to technical restrictions is calculated as the addition of payment
obligations and collection rights generated during the process. The technical restrictions resolution of the
daily base operating schedule (PDBF) is defrayed through the acquisition units, depending on their
consumption raised to power station busbars. Pumping consumption units, supply for ancillary services
of production units and acquisition units for supply out of the Spanish electrical system are excluded of
this assignation.
Requirements: Once the daily base operating schedule (PDBF) is issued the System Operator opens the
bids process for 30 min. Different types of bids can be submitted:
i. Bids from energy sale units
- Energy sale bids. The submission of these bids is mandatory for no renewable thermal groups,
reversible pumping station and renewable energy installations. The power to be offered is the
maximum power available after the definition of the PDBF. In the case of bilateral contracts
for the energy exportation through interconnections without coordinated system of exchange
capacity management, the bids must include the whole maximum power available without
considering the energy already scheduled in the PDBF. The submission will be optional for the
energy units related to importations from external electrical systems where a coordinated
system of exchange capacity management does not exist.
Copyright 2016 SmartNetD1.1 - Ancillary service provision by RES and DSM connected at distribution level in the future power system
Page 141
- Energy purchase bids. They are mandatory and must include the whole energy sale scheduled
in the PDBF for each sale unit.
ii. Bids from energy acquisition units (for pumping consumption)
- Energy sale bids. They are mandatory and must include the whole pumping energy
consumption included in the PDBF.
- Energy purchase bids. They are optional. Increase with respect to the consumption scheduled
in the PDBF.
In general, the bids will be simple bids (only thermal groups are allowed to submit complex bids) and
they must include the following information:
i. Type (production, importation or pumping consumption).
ii. For each scheduling period and with respect to the energy scheduled in the PDBF:
- Upward energy: Block number (Dividable blocks with increasing prices. From 1 up to
maximum 10 blocks). Energy (MWh). Energy price.
- Downward energy: Block number (Dividable blocks with decreasing prices. From 1 up to
maximum 10 blocks). Energy (MWh). Energy price.
iii. Code for the order of redispatching assignation when the same unit takes part in a market
transaction and in one or more bilateral contracts.
Scheduling horizon: D-1.
• Other services – Technical restrictions resolution (after each intraday market session)
Procurement schema: Daily, the System Operator launches the security limitations jointly with the PDVP.
These security considerations can be modified throughout the day. This information is available for the
Market Operator before each intra-day session, so the security limitation can be taken into account before
matching the intra-day bids. After each intraday session, the System Operator reviews the fulfilment of
the previously established security limits and the interconnection capacities. After that, if any technical
restriction is identified, the System Operator removes the bids which solve the identified restrictions, as
long as these matched bids can be compensated with the removal of other bids matched in the same
session and located in the Spanish system. After that, the rebalancing generation-demand is established
by means of the withdrawal of bids submitted to that intra-day market session. The Final Hourly Schedule
is launched after each intra-day market session, once the detected technical restrictions are solved.
Remuneration schema: A sale bid withdrawal previously matched in the intra-day market session
implies a rectification in the production schedule and leads to a payment obligation for the sale unit at the
marginal price of the corresponding session. An acquisition bid withdrawal previously matched in the
Copyright 2016 SmartNetD1.1 - Ancillary service provision by RES and DSM connected at distribution level in the future power system
Page 142
intra-day market session implies a rectification in the production schedule and leads to a collection right
at the marginal price of the corresponding session.
Scheduling horizon: D.
• Other services – Technical restrictions resolution (in real time)
Procurement schema:
i. Modifications by security reasons: The minimum and maximum limits are continuously assessed
by the System Operator. When the production schedule needs to be modified the following steps
are followed:
- Minimum cost by using tertiary regulation bids.
- When the tertiary regulation is not enough the bids submitted for the PDBF technical
restriction resolution will be used. After the assignation of the secondary reserve, the market
participants can update the bids submitted for technical restrictions resolution of the PDBF.
ii. Capacity reductions/withdrawals caused by unavailability of transmission or distribution assets.
The system operator will solve the congestion by an energy redispatching over the foreseen
schedule of the unit.
iii. Insufficient downward reserve: Several solutions:
- To increase the energy schedule of pumping consumption units.
- To decrease the scheduled production of thermal groups to their technical minimum power.
- To schedule the pause of thermal groups.
- When the previous actions are not enough, the procedure will be the same as the detailed one
for the technical restrictions resolution of the daily base operating schedule (PDBF).
- Actions on the demand: When the technical restriction resolution implies an increase over the
production units and this is not feasible, the following steps can be followed:
• Reduction/withdrawal of pumping consumption: According to the upward tertiary reserve
submitted bids.
• Reduction/withdrawal of exportation capacity.
• Interruptibility service application: According to its specific procedure.
iv. Rebalancing generation-demand after technical restrictions resolution in real time. There is no
specific procedure for this rebalancing. Any deviation caused by the technical restriction
resolution will be managed in the same manner as the rest of deviations, by means of the
secondary and tertiary regulation and, when possible, through the deviation management
mechanism.
Remuneration schema:
Copyright 2016 SmartNetD1.1 - Ancillary service provision by RES and DSM connected at distribution level in the future power system
Page 143
i. Upward technical restrictions in real time.
- With tertiary reserve bids: The assignation of upward energy using tertiary bids implies a
collection right for each energy block at submitted upward tertiary price (and an additional
term if a complex bid needs to be used).
- With bids submitted for the technical restrictions resolution of the daily base operating
schedule (PDBF):
• Simple bid: Collection right at the submitted price for technical restriction resolution.
• Complex bid: Collection right (or payment obligation if the result of the formula is
negative). The cost is calculated according to different terms such as; upward scheduled
energy, limited energy by technical restrictions, energy of the last Final Hourly Schedule,
average price of the energy assigned for the participation in the intra-day session and a
price calculated for the complex bids price calculation.
- Without bids: Collection right at 1.15xday-ahead market price.
ii. Downward technical restrictions in real time.
- With tertiary reserve bids: The assignation of downward energy using tertiary bids implies a
payment obligation for each energy block at submitted downward tertiary price (and an
additional term if a complex bid needs to be used).
- With bids submitted for the technical restrictions resolution of the daily base operating
schedule (PDBF): Payment obligation right at the submitted price for technical restriction
resolution.
- Without bids: Payment obligation at 0.85xday-ahead market price.
- for pumping acquisition units: An additional payment obligation at 0.7xday-ahead market
price for the energy reserve generated in the upper vessel of the pumping unit.
Cost recovery: The extra charge due to technical restriction in real time is calculated as the difference
between the sum of payment obligations and collection rights and the cost of the assigned energy valued
at day-ahead market price. The technical restrictions resolution in real time is defrayed through the
acquisition units, depending on their consumption raised to power station busbars. Pumping
consumption units, supply for ancillary services of production units and acquisition units for supply out
of the Spanish electrical system are excluded of this assignation.
Scheduling horizon: D.
Copyright 2016 SmartNetD1.1 - Ancillary service provision by RES and DSM connected at distribution level in the future power system
Page 144
8 Appendix B: Market rules – Other countries
The market mechanisms established in the three selected national cases (Italy, Denmark, Spain) for
the physical pilots within SmartNet were already described in section 2.2. In this appendix, the markets
for other countries are described.
8.1 Electricity market - Belgium
In Belgium, the TSO (Elia) procures power reserves via an organised market.
Power reserves provided by grid users fall into three categories: Primary (R1)18, Secondary (R2)19 and
Tertiary (R3)20. Elia uses these reserves to maintain frequency and voltage and reduce imbalances or
solve congestions (Product sheet S in [67]).
To fulfill the requirement for primary reserve (R1), Elia may contract capacity from Belgian and
French generators [68] and large industrial grid users at Elia's control area. In addition, Elia participates
to the common FCR tendering (between Germany, The Netherlands, Austria, Switzerland and Denmark).
By joining this international cross-border cooperation, the total Belgian FCR obligation (73 MW in 2016)
will be auctioned on a weekly basis via both a national and a cross-border common auction [69]. Contrary
to several other countries, Elia allows also non-symmetric offers for the primary reserve. In addition,
recent changes in regulation make it possible that aggregated load (R1 Load) participates to the primary
reserve as well. Nevertheless, participation to the market of primary reserves is still limited to resources
connected at the transmission grid.
With respect to secondary reserve (R2), Elia contracts upward and downward reserve from baseload
flexible units via monthly tenders. For R2, volumes are symmetrical, meaning that R2-upward volumes
and R2-downward volumes have the same value. In 2016, Elia set 140 MW as the volume to be purchased
via short-term auctions for secondary reserve [70].
Tertiary reserve (R3) may be contracted from generation units (R3-Production), loads connected at
transmission level (R3-ICH) and DSO connected loads (R3-DP). The procurement of these reserves is
done yearly and monthly.21 In 2016, Elia set the required total volume to 770 MW. From the yearly total, a
minimum of 300 MW must come from R3-Production while the amount for R3-ICH was capped at 300
18 Reserves in this category refer to “Frequency Containment Reserves” (FCR). 19 Reserves in this category refer to “ Automatic Frequency Restauration Reserves” (aFRR). 20 Reserves in this category refer to “Manual Frequency Restauration Reserves” (mFRR). 21 R3-ICH is only procured on a yearly basis.
Copyright 2016 SmartNetD1.1 - Ancillary service provision by RES and DSM connected at distribution level in the future power system
Page 145
MW. Monthly, Elia procures 70 MW of R3-Production and R3-DP via short-term auctions [71]22. The
introduction of R3DP is one of the first examples in Europe of standardised ancillary service products that
are structured to stimulate the participation of resources connected at the distribution grid to the market
of ancillary services (Product sheet S8 in [67]).
In addition to these reserves, Elia procures voltage control and black start services. For voltage
control, Elia organises tenders and choose the suppliers based on price and location (Product sheet S6 in
[67]). The black start service is paid for via a contract that may cover several years. The selection of
suitable generators is done based on performance, location and price offer (Product sheet S7 in [67]).
To ensure Belgium’s electricity supply Elia organised a strategic reserve mechanism (Product sheet E9
in [67])23. This reserve is contracted with generation units (SGR) not participating to the organised
markets and with consumption (SDR) located in various access points.24
New reserve products that allow provision of ancillary services from distribution connected
generation and load may be introduced by Elia in 2017.
Additional to the services listed above, Elia coordinates the injections of electricity by means of a
contract (commonly known as CIPU contract).25 The CIPU contract allows Elia to use power available to
manage grid balance (and frequency), voltage and congestion (Product sheet S5 in [67]). Within the
framework of this contract Elia collects producers’ forecasts that cover long- (a year) and short-term (day
of delivery) and prices for energy increments and decrements (incl. start-up price). Bids provided allow
for certain level of freedom, hence they are commonly known as free bids, to the producer (to offer his
available capacity) and to Elia (to exploit available capacity close to real-time).
In 2013, Elia made a study that assessed reserve requirements for 2018 [62]. The study sheds light on
the availability of appropriate ancillary services in Belgium. Based on the assumptions adopted in the
study it could be expected that by 2018 reserves needs and according costs for society highly increase if,
efforts and investments fall short. Elia concludes that “reserves needs of the system heavily depend on
the BRP behavior”. Therefore, to avoid steep costs to society, Elia continues, BRPs and network operators
should behave proactively. In addition, Elia emphasises the crucial role of providing adequate incentives
via the imbalance mechanism.
22 The volume represents the sum of both reserve types. 23 The objective of the mechanism is to cover structural shortages in generation in the winter period. 24 Access points connected to Elia’s grid, to the distribution grid, or another point within the electrical
facilities of a grid user downstream of an access point connected to Elia’s grid. 25 BRPs responsible for electricity injections (output of production units) that take place at Elia’s grid
are legally bound to conclude a CIPU contract with Elia.
Copyright 2016 SmartNetD1.1 - Ancillary service provision by RES and DSM connected at distribution level in the future power system
Page 146
Via the balancing mechanism Elia manages the instantaneous imbalances BRPs are not able to control.
To recover the costs from balancing the system, Elia applies a charge to any BRP imbalance. This
imbalance tariffs provides incentives to BRPs to maintain their balancing perimeter in balance. More
information on the balancing mechanism and the imbalance tariff can be found in (Product sheet E1 in
[67]) and (Product sheet E2 in [67]), respectively.
In the international arena, on October 1, 2012 the Belgian control block was added to the international
grid control cooperation (IGCC). The IGCC is based on an optimisation system for the activation of
secondary reserve. Austria (April, 2012) and Denmark (October, 2011) also belongs to this cooperation
group. More information on the IGCC can be found in [72].
Current developments in network codes are expected to impact the Belgian market for ancillary
services. Some of the expected impacts are:
• Dimensioned volumes needed to be available instead of procured.
• Stricter dimensioning with respect to downward mFRR.
• Short term procurement of reserve capacity (monthly instead of yearly).
• Evolution towards less contracted reserves upfront.
• Increased cross border cooperation (netting of balancing volumes, procurement of ancillary
services cross border).
8.2 Electricity market - Finland
Nord Pool, Europe’s leading (bulk) power market, delivers both day-ahead and intraday trading,
clearing and settlement to its customers, regardless their size or location. Nord Pool delivers day-ahead
trading within the Nordic, Baltic and UK markets, and intraday trading within the Nordic, Baltic, UK and
German markets.
The Elspot market of Nord Pool Spot determines the next day’s wholesale prices for electricity. Based
on these bids and offers, Nord Pool Spot will calculate the spot price for electricity for every hour of the
following day. 12:00 CET is the deadline for submitting bids for power which will be delivered the
following day. Hourly prices are typically announced to the market at 12:42 CET or later. Finally, once the
market prices have been calculated, trades are settled.
The intraday market supplements the day-ahead market and helps secure the necessary balance
between supply and demand in the power market for Northern Europe. At 14:00 CET, capacities available
for Nord Pool intraday trading are published. This is a continuous market, and trading takes place every
day around the clock until one hour before delivery. The prices are set based on a first-come, first-served
principle, where best prices come first, highest buy price and lowest sell price.
Copyright 2016 SmartNetD1.1 - Ancillary service provision by RES and DSM connected at distribution level in the future power system
Page 147
According to Directive [1] one of the tasks for TSOs is to ensure the availability of all necessary
ancillary services and with that aim, TSOs must manage the corresponding balancing power markets.
Holders of production units and loads can submit capacity bids to the balancing power market. The
balance service agreement gives balance responsible parties a right to participate in the balancing power
market. Other holders of flexible capacity can participate in the balancing power market through their
balance responsible party or by signing a separate balancing power market agreement with the TSO.
Fingrid uses the purchased products of balancing power markets also for congestion management
purposes.
In the joint Nordic system (Finland, Sweden, Norway and East Denmark), the obligations for
maintaining reserves have been agreed in System Operation Agreement between the Nordic
Transmission System Operators (TSOs). The total amount of Frequency Containment Reserve for Normal
operation (FCR-N) is 600 MW which is constantly maintained. This jointly maintained reserve is divided
annually between the Nordic TSOs in relation to the total consumption in each country. Obligation for
Finland is about 140MW. In 2013 the total consumption in Sweden was 137.5 TWh, in Norway it was
128.1 TWh, in Finland 81.4 TWh and in Eastern Denmark 34.0 TWh.
Frequency Containment Reserve for Disturbances (FCR-D) is maintained to the extent that the power
system can withstand, for example, disconnection of a large production unit without the steady state
frequency deviation exceeding 0.5 Hz. The dimension of this reserve is set weekly to correspond to the
greatest individual fault in the system, reduced by self-regulation of load in the system (200 MW). In a
normal situation, the dimension of the Frequency Containment Reserve for Disturbances is about 1 200
MW which is jointly maintained by the Nordic system. Obligation for Finland is 220-265 MW.
It has been agreed that up to 300 MW of Automatic Frequency Restoration Reserve (aFRR) is
maintained in predefined morning and evening hours in the Nordic countries. Country-specific
obligations have been divided between the Nordic TSOs in relation to the annual consumption.
Obligation for Finland is 70 MW. Furthermore, each TSO maintains Manual Frequency Restoration
Reserve (FRR-M) to cover the dimensioning fault in its own area. Obligation for Finland is 880-1100 MW.
Fingrid meets its FRR-M obligation with the reserve power plants it owns and with the leasing of other
power plants. These plants are not used for commercial electricity production since the unbundling of
energy supply and generation from the operation of transmission networks is already established.
The TSO of each country procures its share of reserves as it considers best. In order to meet reserve
obligations, trade can be done between countries. Part of reserves must be maintained nationally, so that
the frequency can also be maintained in situations of island operation. In normal situation, a maximum of
1/3 of the obligations for frequency containment reserves can be purchased from other Nordic countries.
Fingrid covers the maintenance costs of reserves with a grid network tariff and payments collected in
balance services. The costs of the balancing power market are covered by imbalance power.
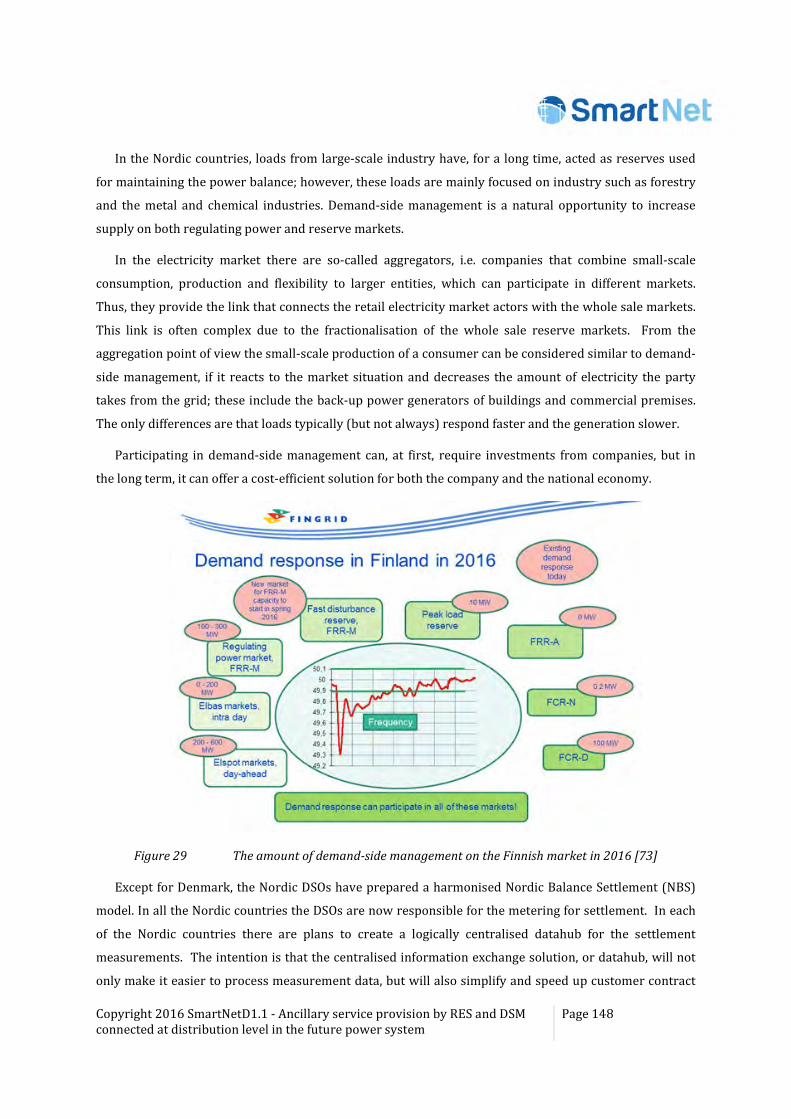
Copyright 2016 SmartNetD1.1 - Ancillary service provision by RES and DSM connected at distribution level in the future power system
Page 148
In the Nordic countries, loads from large-scale industry have, for a long time, acted as reserves used
for maintaining the power balance; however, these loads are mainly focused on industry such as forestry
and the metal and chemical industries. Demand-side management is a natural opportunity to increase
supply on both regulating power and reserve markets.
In the electricity market there are so-called aggregators, i.e. companies that combine small-scale
consumption, production and flexibility to larger entities, which can participate in different markets.
Thus, they provide the link that connects the retail electricity market actors with the whole sale markets.
This link is often complex due to the fractionalisation of the whole sale reserve markets. From the
aggregation point of view the small-scale production of a consumer can be considered similar to demand-
side management, if it reacts to the market situation and decreases the amount of electricity the party
takes from the grid; these include the back-up power generators of buildings and commercial premises.
The only differences are that loads typically (but not always) respond faster and the generation slower.
Participating in demand-side management can, at first, require investments from companies, but in
the long term, it can offer a cost-efficient solution for both the company and the national economy.
Figure 29 The amount of demand-side management on the Finnish market in 2016 [73]
Except for Denmark, the Nordic DSOs have prepared a harmonised Nordic Balance Settlement (NBS)
model. In all the Nordic countries the DSOs are now responsible for the metering for settlement. In each
of the Nordic countries there are plans to create a logically centralised datahub for the settlement
measurements. The intention is that the centralised information exchange solution, or datahub, will not
only make it easier to process measurement data, but will also simplify and speed up customer contract

Copyright 2016 SmartNetD1.1 - Ancillary service provision by RES and DSM connected at distribution level in the future power system
Page 149
events. The purpose also is that it will help the service to run more smoothly with fewer disruptions. The
standardised interface to electricity consumption data promotes the full utilisation of smart networks and
meters, as well as new business opportunities. However centralisation of settlement may create some
new technical and business risks.
Copyright 2016 SmartNetD1.1 - Ancillary service provision by RES and DSM connected at distribution level in the future power system
Page 150
9 Appendix C: Literature review/Methodology approaches to
high-level scenario design
9.1 Overview
In this framework, several approaches have been described in bibliography to undertake the scenario
building process.
Next sub-chapters provide a summary of the methodologies found in some of the references
examined. In particular:
• Subsection 9.2 analyses the approach from ENTSO-E
• Subsection 9.3 summarises one of the methodologies proposed in the Foresight Guide presented
in the website of JRC IPTS
• Subsection 9.4 shows the point of view of Paul J. H. Schoemaker, published in MIT Sloan
Management Review Magazine
• Subsection 9.5 presents the approach developed under the EvolvDSO project
• Subsection 9.6 summarises the methodology followed in e-Highway 2050 project
• Subsection 9.7 summarises the approach developed in the Gridtech project.
9.2 Scenario Outlook and Adequacy Forecast 2014-2030” (ENTSO-E)
The objective of the “Scenario Outlook and Adequacy Forecast 2014-2030 (SO&AF 2014)” [46]
published by ENTSO-E (according to Article 8(3)b of Regulation (EC) No 714/2009) was to provide
stakeholders in the European electricity market with a pan-European overview of generation, demand
and their adequacy using different scenarios for the future power system.
Even though different approaches (deductive and inductive) were used in the selection of scenarios,
the same criteria and methodology were used for their assessment. These scenarios include:
• The “EU2020” scenario: deductive (top-down) scenario based on the achievement of the energy
policy targets established in the EU for 2020 translated into national level in the National
Renewable Energy Action Plans (NREAPs) or the equivalent governmental plans.
• Two inductive (bottom-up) scenarios until 2025:
o Scenario A or “Conservative”: is based on the expectations of TSOs for the potential
future developments, taking into account only the implementation of generation
capacity already decided and considered secure.
Copyright 2016 SmartNetD1.1 - Ancillary service provision by RES and DSM connected at distribution level in the future power system
Page 151
o Scenario B or “Best Estimate”: is based on the expectations of TSOs for the potential
future developments, assuming the availability of suitable incentives for investments. In
this case, not only secure generation capacity (scenario A) is taken into account but also
future power plants that can be considered as likely and needed by the TSO with the
available information.
• The “2030 Visions” that offer a “bridge” between the European energy targets for 2020 and 2050
and try to encompass all possible cornerstones of development until 2030.
o Vision 1 “Slow progress”
o Vision 2 “Money Rules”
o Vision 3 “Green transition”
o Vision 4 “Green revolution”
These four visions were based on different suppositions aiming to estimate the extreme values
where future evolution of the parameters is expected to lie in‑between with a high level of
certainty. ENTSO‑E defined these visions considering previous market studies (both regional and
from the ENTSO‑E), public economic analyses and existing European documents.
In general, Visions 1 and 3 assume lower levels of integration of the European energy market
than Visions 2 and 4, which are based on a strongly integrated market at a European level. For
this reason, Visions 1 and 3 were built based on national data (botton-up approaches) and
Visions 2 and 4 were defined following a deductive (top‑down) approach. With regard to the
fulfilment of 2050 energy roadmap goals, Visions 1 and 2 assume a delay in their completion
while Visions 3 and 4 are considered to be “on track” towards these goals.
9.3 FOR-LEARN Online Foresight Guide for “Scenario building” (JRC-IPTS)
The Joint Research Centre (JRC-IPTS) of the EC offers in its website a Foresight Guide [74] where
knowledge on scenario building is provided. This online guide was developed within FOR-LEARN project
(in the 6th Framework Programme of the EC) for introducing the users to the design steps, the
implementation and the follow-up of foresight projects. It also shows the main methods used in their
development, highlighting the fact that not every method suits to every study. For this reason, the method
should be chosen having in mind the objective, context and resources. For example, some methods offer
graphs as output, others narrative descriptions of scenarios.
Among others, the methodology for “Scenario Building” is presented as a method that helps the
decision‑maker to enunciate a range of plausible visions of the future, gaining knowledge in this process.
This methodology is also accompanied by a step-by-step guide for the development of scenarios. In short,
the process could be summarised as follows:

Copyright 2016 SmartNetD1.1 - Ancillary service provision by RES and DSM connected at distribution level in the future power system
Page 152
• It starts with the definition of the time horizon and the identification of the focal issue based on
the detected uncertainties.
• Then, the key drivers or parameters that have an influence on the case studied are identified,
including Social, Technological, Economic, Environmental/Ecological, Political and Value-based
issues (STEEPV thematic groups).
• These driving forces are then sorted out by importance and uncertainty level, aiming to obtain
the two or three most important and most uncertain factors. This defines the number of
scenarios.
• Scenario logics are then selected to structure the scenarios and reduce their number to the
minimum that contain all the defined uncertainties. Once the final ones have been selected, they
have to be elaborated, detailing the behaviour of each key driver in each scenario.
• Finally, an analysis is carried out to evaluate opportunities and threads and turn the scenarios
into strategy.
9.4 “Scenario Planning: A Tool for Strategic Thinking”
In 1995, MIT Sloan Management Review Magazine published an article of Paul J. H. Schoemaker
showing a systematic methodology for scenario planning [43].
This article defines the scenario planning as a way to capture the range of possibilities for future
development, organises them into narratives and makes the use of great volumes of data easier. The
possible futures selected should challenge present beliefs but avoiding “underprediction” and
“overprediction” of changes.
The process for scenario planning can be collected in 10 steps:
1. Definition of the scope and time horizon.
2. Identification of the major stakeholders interested and affected by the subject of the study and
those who have influence on it.
3. Identification of basic trends (in the political, economic, societal, technological, legal, and
industry fields) that affect the case study and characterisation of their impact (positive, negative,
or uncertain).
4. Specification of key uncertainties that significantly affect the defined trends and their possible
outcomes. The relationships between these uncertainties should be checked to identify
incompatibilities.
5. Construction of Initial Scenario Themes. This can be done by identifying, for instance, “extreme
worlds” (one characterised by positive outcomes in all the uncertainties and the other by the
negative ones) or by selecting the two most important uncertainties and the analysis of the
plausibility and compatibility of all their possible outcomes by crossing them.
Copyright 2016 SmartNetD1.1 - Ancillary service provision by RES and DSM connected at distribution level in the future power system
Page 153
6. Refining of scenarios, eliminating similarities and inconsistencies on trends, on outcome
combinations or based on the reactions of major stakeholders.
7. Development of “Learning Scenarios” by the identification of themes that are strategically
relevant, the organisation of the possible outcomes and trends around them and the naming of
the scenarios using a title easy to follow and remember.
8. Identification of further research needs from the learning scenarios.
9. Development of quantitative models to be used in the detection of implausible scenarios and to
allow the quantification of the behaviour of certain selected parameters under various scenarios.
10. Definition of final scenarios, checking their relevance and internal consistency and making sure
they describe different futures (instead of variations on one theme) that are expected to exist for
some length of time.
9.5 “Definition of a Limited but Representative Number of Future
Scenarios” (EvolvDSO project)
Deliverable 1.1. of EvolvDSO project [75] dealt also with scenario building. The objective of this
publication was the definition of representative future scenarios for the evolution of distribution systems
in some of countries involved on the project (Belgium, France, Germany, Ireland, Italy, Portugal and the
UK).
The defined scenarios took into account the potential evolution of the electricity system in terms of
generation mix, demand and degrees of technological freedom to determine the requirements that may
be needed in the future. No regulatory or market aspects were included in this definition.
In this framework, each country defined three future scenarios in three time horizons (short-term,
mid-term and long-term) where uncertainties were outlined by their upper and lower limits (extreme
scenarios where the most likely scenario lies).
Scenario definition followed a methodology similar to the ones presented in subsections 9.3 and 9.4:
• Definition of the scope and time horizon.
• Definition of present and future scenarios, considering three types of futures: under-expected,
most-likely and over-expected scenarios.
• Definition of the main parameter used to characterise these scenarios and its evolution in each
case.
• Identification of relevant parameters and allocation of their values in each scenario.
• Analysis and comparison of the different options and identification of the main drivers and the
uncertainties expected for the future evolution.
Copyright 2016 SmartNetD1.1 - Ancillary service provision by RES and DSM connected at distribution level in the future power system
Page 154
9.6 “Structuring of uncertainties, options and boundary conditions for the
implementation of Electricity Highways System” (e-Highway 2050
project)
Within the WP1, the European project e-Highway2050 established the boundary conditions for the
implementation of a scenario building methodology. Its main purpose was establishing the framework
required for the transition from current solutions to the infrastructure needed to support an integrated
power system in 2050, with expected electricity generation mainly driven by RES.
Deliverable 1.2 [76] presented the scenarios selected in the project for the implementation of an
Electricity Highways System. They were built following a methodology that can be summarised in six
steps:
• Specification of Uncertainties and Options and their boundary conditions (upper/lower limits)
taking into account several fields (technical, economical/financial,
political/social/environmental, R&D). Uncertainties are defined as variables that are not
controllable by the decision maker. Options, however, are the ones chosen by the decision maker.
• Selection of the key Uncertainties and Options among all the identified in Step 1.
• Definition of possible Futures and Strategies. Futures are defined as a combination of
Uncertainties and Strategies come from the combination of Options (see Figure 30 ).
• Definition of possible scenarios by the combination of Futures and Strategies.
• Optimisation of the number of scenarios. Inconsistencies and similarities are analysed for their
refining.
• Selection of the most representative scenarios to enable subsequent detailed numerical analyses
of each one.
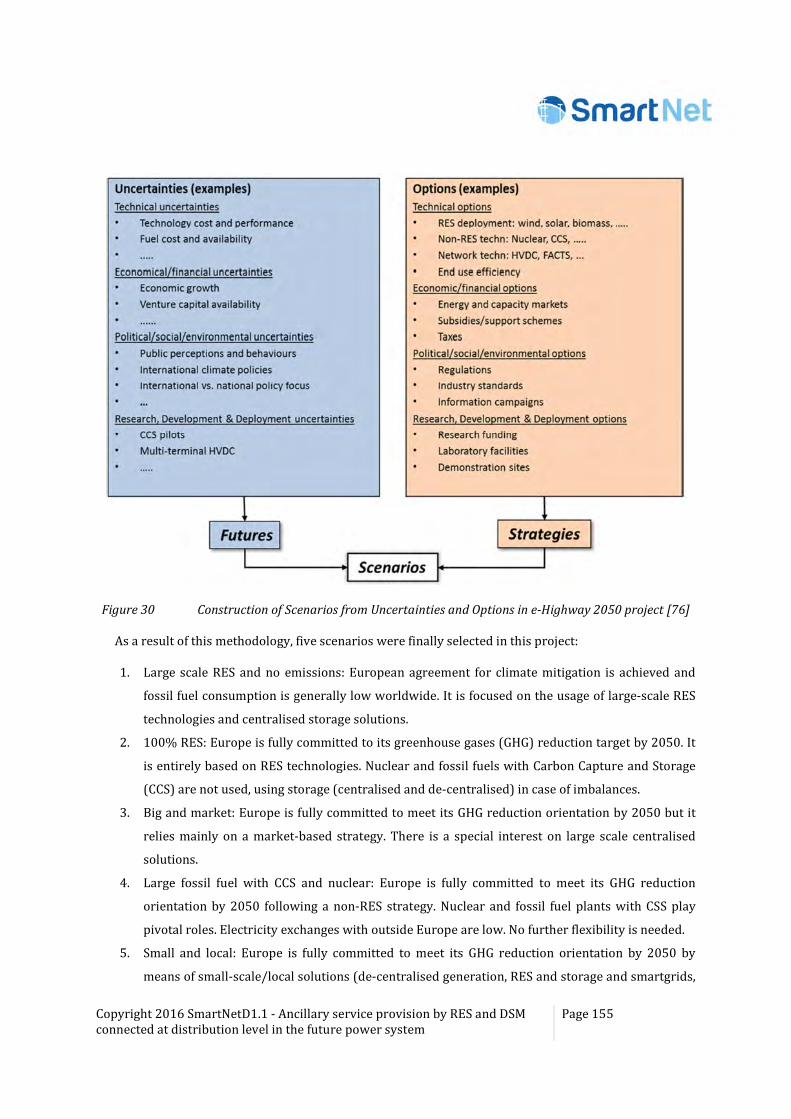
Copyright 2016 SmartNetD1.1 - Ancillary service provision by RES and DSM connected at distribution level in the future power system
Page 155
Figure 30 Construction of Scenarios from Uncertainties and Options in e-Highway 2050 project [76]
As a result of this methodology, five scenarios were finally selected in this project:
1. Large scale RES and no emissions: European agreement for climate mitigation is achieved and
fossil fuel consumption is generally low worldwide. It is focused on the usage of large-scale RES
technologies and centralised storage solutions.
2. 100% RES: Europe is fully committed to its greenhouse gases (GHG) reduction target by 2050. It
is entirely based on RES technologies. Nuclear and fossil fuels with Carbon Capture and Storage
(CCS) are not used, using storage (centralised and de-centralised) in case of imbalances.
3. Big and market: Europe is fully committed to meet its GHG reduction orientation by 2050 but it
relies mainly on a market-based strategy. There is a special interest on large scale centralised
solutions.
4. Large fossil fuel with CCS and nuclear: Europe is fully committed to meet its GHG reduction
orientation by 2050 following a non-RES strategy. Nuclear and fossil fuel plants with CSS play
pivotal roles. Electricity exchanges with outside Europe are low. No further flexibility is needed.
5. Small and local: Europe is fully committed to meet its GHG reduction orientation by 2050 by
means of small-scale/local solutions (de-centralised generation, RES and storage and smartgrids,
Copyright 2016 SmartNetD1.1 - Ancillary service provision by RES and DSM connected at distribution level in the future power system
Page 156
mainly at distribution level). However, there are no common agreements/rules for transnational
initiatives for internal EU market operation and no agreement has been reached on this matter in
the global community. Nuclear and fossil fuels with CCS are not used.
9.7 The Gridtech project
For the achievement of the European Union (EU)’s ambitious renewable energy targets for 2020, 2030
and beyond, extensive electricity system planning and investments are necessary. This covers electricity
generation capacity, transmission networks, and supporting technologies and measures that will ensure
clean, secure and efficient energy supply. In particular, the development of adequate transmission
infrastructures and grid-impacting technologies plays more and more a crucial role to foster the
integration of Renewable Energy Sources (RES) and to realise the European Energy Union, set as strategic
target by the European Commission. Within this framework, the European project GridTech (Innovative
grid-impacting technologies enabling a clean, efficient and secure electricity system in Europe,
http://www.gridtech.eu), run over 2012-2015, has conducted an integrated assessment of new grid-
impacting technologies and their implementation into the European electricity system. This has allowed
comparing different technological options towards the exploitation of the full potential of future
electricity production from RES, with the lowest possible total electricity system cost.
Within the 2020, 2030 and 2050 time horizons, the goal of GridTech project has been to assess, among
innovative grid-impacting technologies, which ones, where, when, and to what extent could effectively
contribute to the further development of the European system, fostering the integration of an ever-
increasing penetration of RES generation and boosting the creation of a pan-European electricity market,
while maintaining secure, competitive and sustainable electricity supply. This has been carried out within
GridTech by combining a pan-European analysis (top-down approach) and seven regional case studies
(bottom-up approach) related to the seven project target countries (Austria, Bulgaria, Germany, Ireland,
Italy, Netherlands, Spain) in order to get robust results.
Among the innovative technologies that indirectly impact on the transmission grid, the ones related to
optimal Demand Response (DR) appear to be very promising and have been screened within GridTech for
their global effects in terms of load shifting, upon opportune modeling.
In the pan-European study, the modelled (so-called EU30+)26 system takes fully into account as
endogenous 37 European countries such as the today’s 28 Member States of the EU (EU28), the EU
26 EFTA: European Free Trade Association. The EU30+ system includes as endogenous countries: AL (Albania), AT (Austria), BA (Bosnia-Herzegovina), BE (Belgium), BG (Bulgaria), CH (Switzerland), CY (Cyprus), CZ (Czech Republic), DE (Germany), DK (Denmark), EE (Estonia), ES (Spain), FI (Finland), FR (France), GR (Greece), HR (Croatia), HU (Hungary), IE (Ireland), IS (Iceland), IT
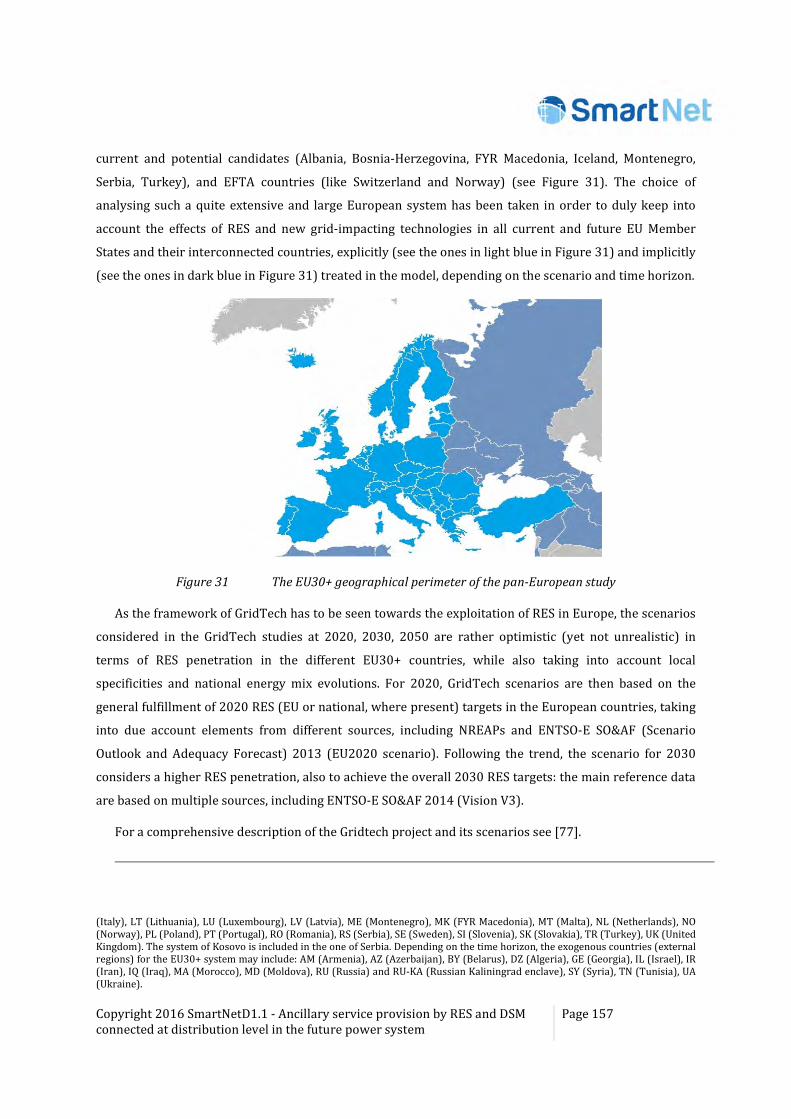
Copyright 2016 SmartNetD1.1 - Ancillary service provision by RES and DSM connected at distribution level in the future power system
Page 157
current and potential candidates (Albania, Bosnia-Herzegovina, FYR Macedonia, Iceland, Montenegro,
Serbia, Turkey), and EFTA countries (like Switzerland and Norway) (see Figure 31). The choice of
analysing such a quite extensive and large European system has been taken in order to duly keep into
account the effects of RES and new grid-impacting technologies in all current and future EU Member
States and their interconnected countries, explicitly (see the ones in light blue in Figure 31) and implicitly
(see the ones in dark blue in Figure 31) treated in the model, depending on the scenario and time horizon.
Figure 31 The EU30+ geographical perimeter of the pan-European study
As the framework of GridTech has to be seen towards the exploitation of RES in Europe, the scenarios
considered in the GridTech studies at 2020, 2030, 2050 are rather optimistic (yet not unrealistic) in
terms of RES penetration in the different EU30+ countries, while also taking into account local
specificities and national energy mix evolutions. For 2020, GridTech scenarios are then based on the
general fulfillment of 2020 RES (EU or national, where present) targets in the European countries, taking
into due account elements from different sources, including NREAPs and ENTSO-E SO&AF (Scenario
Outlook and Adequacy Forecast) 2013 (EU2020 scenario). Following the trend, the scenario for 2030
considers a higher RES penetration, also to achieve the overall 2030 RES targets: the main reference data
are based on multiple sources, including ENTSO-E SO&AF 2014 (Vision V3).
For a comprehensive description of the Gridtech project and its scenarios see [77].
(Italy), LT (Lithuania), LU (Luxembourg), LV (Latvia), ME (Montenegro), MK (FYR Macedonia), MT (Malta), NL (Netherlands), NO (Norway), PL (Poland), PT (Portugal), RO (Romania), RS (Serbia), SE (Sweden), SI (Slovenia), SK (Slovakia), TR (Turkey), UK (United Kingdom). The system of Kosovo is included in the one of Serbia. Depending on the time horizon, the exogenous countries (external regions) for the EU30+ system may include: AM (Armenia), AZ (Azerbaijan), BY (Belarus), DZ (Algeria), GE (Georgia), IL (Israel), IR (Iran), IQ (Iraq), MA (Morocco), MD (Moldova), RU (Russia) and RU-KA (Russian Kaliningrad enclave), SY (Syria), TN (Tunisia), UA (Ukraine).
Copyright 2016 SmartNetD1.1 - Ancillary service provision by RES and DSM connected at distribution level in the future power system
Page 158
10 Appendix D: Future ancillary services
This appendix is aimed at further developing the information included in section 3.4. Sections 10.1 to
10.4 present the services identified in section 3.4.1 more in detail, while the final section (10.5) presents
the expected evolution of the characteristics of the ancillary services in Norway and the requirements to
provide them, as an extension of the example provided for Italy in section 3.4.2.
In the tables below27, one for each selected ancillary service, several issues are shown:
• Definition: This section includes the definition of an already existing service or, in the cases in
which the proposed service does not exist yet, some ideas about how this may be developed.
• Status: This part tries to identify how the deployment of the service is nowadays, mainly focused
on the distributed generation participation.
• Motivation: Some appealing factors for the procurement of each service have been identified.
10.1 Ancillary services for frequency control
Fast frequency reserves (FFR): Inertia emulation
Definition System inertia is an important part of the power system response to frequency events, being its magnitude proportional to the system's resilience to sudden change. It depends on the physical characteristics of the power system, namely the types of generators in operation and their own rotating masses that provide energy during the momentary frequency dips. The more inertia a system can exhibit, the more resilient to events is its frequency. With an increasing penetration of non-synchronous generation in the system, there will be an increasing need for capabilities from generators to supply very fast frequency response.
Status Inertial response has not traditionally been considered as ancillary service, but rather a natural and uncontrollable characteristic of the power system. Introduction of technologies that make inertial response controllable is a substantial change. Some grid codes have already been modified to include some type of inertial response requirement.
Inertia emulation is commercially available today. Renewable energy sources (especially wind turbines and solar plants), as well as battery storage capacities, can already be technically equipped to contribute to this inertia emulation. For example, for wind generators, a control scheme that is already being implemented in order to mitigate this problem is the addition of an inertia emulator. This emulator uses the accumulated kinetic energy in the wind turbine shaft to provide a temporary increase of the active power injected to the grid, proportional to the system frequency rate of drop. Other technologies require a long-term loss of active power and additional investments, so they are less
27 The information in this Annex is based on references: [64], [78], [79], [80], [81], [82], [83], [84], [85], [86], [87], [88], [89], [90], [91], [92].
Copyright 2016 SmartNetD1.1 - Ancillary service provision by RES and DSM connected at distribution level in the future power system
Page 159
efficient alternatives.
Motivation The levels of inertia in power systems may decrease in the future, due to increased levels of energy being provided from renewable sources, which typically have little or no inertia.
Suitable alternative technological solutions are required to provide this service in future in parallel to the further expansion of renewable generation. To implement this, the regulatory framework conditions must be adapted such that decentralised energy units can contribute to the provision of this service.
Ramp margin (RM): Ramp control
Definition Ramping is a significant change of generation power output over time frames ranging from a few seconds to a few minutes. Of particular interest are: a) wind generation ramping that is caused by rapid wind-speed variations and b) solar generation ramping which occurs as large clouds pass over the generator. Indeed, ramping may increase as variable resources are added to the grid. If ramping does become significant, then system operators will have to respond, or the grid could become unstable.
The ramping ancillary service involves resources that offset output ramping, so, resources used for the ramping service provide output variability that is the reverse of other generations’ output variability.
Storage is a suitable technology for this service. The storage used for ramping service provides ramping up by increasing output and/or by decreasing charging. On the contrary, storage provides ramping down by decreasing output and/or increasing charging.
In general, most conventional generation is not very suitable for ramping because it must be capable of relatively rapid output changes.
Status Potential providers of these services include conventional generators that are not dispatched to their maximum output, storage devices, demand side providers, solar PV and wind power plants that have been dispatched down.
The ramping margin service essentially needs capabilities comparable to frequency control services (FCR, FRR and RR).
Motivation At present, imbalances between generation and demand in both directions (upwards and downwards) are managed using frequency response services (e.g. operating reserves) over very short timeframes (seconds and minutes). Over longer timeframes, additional factors can cause an imbalance which, if not managed, would result in unacceptable frequency excursions. These factors include changes in demand, wind generation, interconnector flows and generator availability. All these factors are expected to change in a near future.
Copyright 2016 SmartNetD1.1 - Ancillary service provision by RES and DSM connected at distribution level in the future power system
Page 160
10.2 Ancillary services for voltage control
Fault-ride through (FRT) capability
Definition FRT is the capability of electric generators to stay connected in short periods of lower electric network voltage (voltage dip) until the faulted element has been cleared from the transmission system. The fault-ride through capability mostly depends on the reactive power control. All DG units have a grid coupling device which feeds electrical energy into the grid as the last element of a chain of energy converters of the unit. The FRT capability depends on the grid-coupling technology, which has to balance the power flow on the grid-side and the DC-side in case of voltage disturbances. Inverters which couple a DC source to the grid show very good FRT capabilities because the DC voltage can be changed promptly.
Initially it was identified as an issue with wind generation employing power electronic converters but the concept equally applies to all generation types.
The fault ride through specifications for distributed generators, defined by the grid codes, establish the requirements of power supply in the event of short circuits based on the prevailing voltage levels at the grid connection point as a function of time.
Status In general, FRT is not remunerated but required as mandatory from generators when connecting to the grid in Grid Codes. The FRT capability is dependent on the grid-coupling converter. Inverter-based DG has an acceptable flexibility in terms of FRT because they decouple the power generation process and the grid. This flexibility comprises the phase, magnitude and even harmonic content of the currents injected. However, there is one drawback, the maximum fault current that the converter may be able to provide.
Motivation It is needed at distribution level (wind parks, PV systems, distributed cogeneration, etc.) to avoid that a short circuit on high voltage level leads to a wide-spread loss of generation.
Primary voltage control
Definition Primary voltage control maintains the voltage at the point of coupling of the generator close to a voltage reference given by the TSO. It is performed by automatic and rapid voltage regulators which control reactive power output so that the output voltage magnitudes are kept at specified values. The system operator fixes the voltage setting points of the different generators in order to guarantee an adequate operating point, the maximal reactive power which is possible to generate by each generator, the voltage drop in the transmission lines and finally the voltage profile at the transmission buses. Primary voltage control is performed in the range of milliseconds since a deviation of the voltage respect to the set point is detected.
The primary voltage control referrers to the local response of the generators. This control has only local scope targeting the control in the particular bus assigned to the controllable device. The operational value of being able to deliver reactive power is very location-specific
It can be provided by spinning generators and synchronous compensators, reactors and capacitors, Static VAR Compensators, HVDC substations and other FACTS (Flexible Alternating Current Transmission System) devices, or other equipment capable of fast regulation.
It is a service used during voltage dips and for post fault voltage control.
Status Currently, some studies have focused on voltage control solutions using the flexibility in DER units. However, the challenges and difficulties when applying their control strategies in practice have not been studied in depth.
Planners have long recognised the need for reactive power delivery and, in particular, fast VAR. The behavior is similar to traditional synchronous condensers. Services based upon
Copyright 2016 SmartNetD1.1 - Ancillary service provision by RES and DSM connected at distribution level in the future power system
Page 161
this capability may be needed much more often in the future, when there will be more need for local voltage support from distributed generators.
In the specific case of the wind turbine technology, the current design includes the capability for a controlled fast reactive current response and limitations depend on the wind turbine conversion technology and the grid requirements imposed. Technical challenges include the development of accurate voltage sensing, recognition of fault types and appropriate tuning of controllers.
In many countries the conditions for the connection of DG and RES have been updated along with the availability of advanced inverters that have been built to allow the DG and RES generators to provide primary voltage control.
Motivation Voltage control service is a critical ancillary service used by all system operators for secure and reliable operation of the power system. It must be continuously active.
The most significant benefits of using distributed generators are for systems with substantial dynamic reactive power requirements (i.e. projects that are physically remote with electrical weak connections to the grid or areas with heavy and variable loads).
Secondary voltage control
Definition Secondary voltage control is a slower control that acts to bring the voltage in a region back to the normal profile and it consists on the measurements of the voltage magnitude in some critical buses of the system. These buses are known by the operator as the result of its experience in the control of the system. If the voltages at these buses are out of range, the operator is going to change the settings points of the voltage regulators (generators) in order to recover a voltage profile in the normalised interval. The time response of the voltage secondary control goes up to one minute and less than several minutes.
The secondary control refers to voltage control at a zonal level. The coordination and the supervision of the primary control set point values within a given geographical zone are the tasks of the secondary voltage control. The main idea behind this secondary control is to coordinate the various regional reactive power resources in such a manner that they control the voltage at given pilot nodes. Pilot nodes are selected such that the voltage magnitude at the pilot node represents the voltage profile over the associated zone. Usually the pilot nodes are the ones with the highest short-circuit power in a given zone.
The definition and the implementation of the secondary and tertiary voltage control vary from one TSO to another. Some TSOs consider secondary and tertiary voltage controls together. In this case, the voltage control is divided only into two classes: primary and centralised voltage controls.
The secondary control is performed by automatic or manual on load tap changers, so that the voltage ratio and hence the secondary voltage may be varied as the load supplied by the transformer changes.
The objective of this control is to restore the voltage profiles to the required values within a region, but minimising circulating reactive power flows and maximising reactive reserves.
Status In general, from the perspective of providers of voltage control services, the production of reactive power can be divided into a basic and an enhanced reactive power service. The basic or compulsory service includes the generating units’ requirements that must be fulfilled to be connected to the network. The enhanced reactive power service is a non-compulsory service that is provided as supplement to the basic requirements.
Currently, some studies have focused on voltage control solutions using the flexibility in DER units. However, the challenges and difficulties when applying their control strategies in practice have not been studied in depth.
Motivation Voltage control service is a critical ancillary service used by all system operators for secure
Copyright 2016 SmartNetD1.1 - Ancillary service provision by RES and DSM connected at distribution level in the future power system
Page 162
and reliable operation of the power system. It must be continuously active.
Tertiary voltage control
Definition Tertiary voltage control is used by the operator to optimise the system voltage profile and to provide reference values of the secondary voltage control. Normally, the tertiary control operates in a 15 minutes cycle.
The tertiary voltage control is on a global system level. The basic idea is to increase the operating security and efficiency of the system through a centralised coordination of the secondary control zonal structure. The tertiary control considers the counteract coupling between controls at the secondary control levels. In fact, the tertiary control defines the optimal voltage set-points for the secondary pilot nodes. Different objectives like minimising the grid losses or maximising the reactive reserve can be taken into account when selecting these set-points. Normally secondary and tertiary controls are implemented with a delay and they involve both automatic and manual actions.
The definition and the implementation of the secondary and tertiary voltage control vary from one TSO to another. Some TSOs consider secondary and tertiary voltage controls together. In this case, the voltage control is divided only into two classes: primary and centralised voltage controls.
Tertiary control coordinates the action of primary and secondary control devices according to secured operation and economic criteria based on load and generation forecast. Tertiary control acts in a time scale of about 10 to 30 minutes. The objective in this case is to optimise the operation of the network by minimising losses, maintaining the required voltage and the substitution of reactive reserves. The control variables used in this case are the setting values sent to the generation controllers and switch orders sent to shunt capacitors, reactors and tap changers. Tap changers in general have been used as devices for secondary control, but the introduction of static compensators for voltage control may require the need for coordination of both types of equipment.
It is inefficient to transfer reactive power across large electrical distances, including across the transformation between voltage levels. The effectiveness of distribution reactive power resources to provide support at transmission level will thus not be possible in all instances. It is highly dependent on the network impedance, and on the generation resource and technology employed.
Status In general, from the perspective of providers of voltage control services, the production of reactive power can be divided into a basic and an enhanced reactive power service. The basic or compulsory service includes the generating units’ requirements that must be fulfilled to be connected to the network. The enhanced reactive power service is a non-compulsory service that is provided as supplement to the basic requirements.
Currently, some studies have focused on voltage control solutions using the flexibility in DER units in order to evaluate the benefits of reactive power control by distributed generation. The main objective of these projects is to evaluate whether reactive power supply on distribution grid level can reduce the need for grid reinforcements and further increase the hosting capacity for further generators.
Motivation Connecting DG units to the network affects the voltage profiles and influences the voltage control in distribution systems.
Voltage control service is a critical ancillary service used by all system operators for secure and reliable operation of the power system. It must be continuously active.
Copyright 2016 SmartNetD1.1 - Ancillary service provision by RES and DSM connected at distribution level in the future power system
Page 163
10.3 Ancillary services for power quality improvement
Injection of negative sequence voltages
Definition Voltage unbalance is regarded as a power quality problem of significant concern at the electricity distribution level. Although the voltages are quite well balanced at the generator and transmission levels the voltages at the utilisation level can become unbalanced due to the unequal system impedances and the unequal distribution of single-phase loads. Under asymmetrical grid faults, the negative sequence voltage produces additional generator torque oscillations and reduces the lifetime of the installed equipment.
A voltage unbalance, according to IEEE, can be defined as the largest difference between the average root mean square (RMS) voltage and the RMS value of any single voltage phase divided by the average RMS voltage, usually expressed as a percentage.
A major cause of voltage unbalance is the connection of unbalanced loads (mainly single phase loads connection between two phases or between one phase and the neutral). Voltage unbalance has some negative impacts on equipment such as induction motors, power electronic converters, etc. Thus, the International Electrotechnical Commission recommends the limit of 2% for voltage unbalance in electrical systems.
Compensation of voltage unbalance is usually done using series active power filter through injection of negative sequence voltage in series with the distribution line.
Whenever there is a voltage dip, the induction generator may consume a large amount of reactive power which can result into progression of faults and voltage collapse. When unsymmetrical faults occur, positive and negative sequence voltages are generated. Positive sequence voltage causes voltage instability and negative sequence voltage causes heavy generator torque oscillation which leads to mechanical vibrations. StatCom (Static Compensator) is a FACTS device that can be used for eradicating positive and negative sequence voltages. It is a type of synchronous generator whose capacitive or inductive output current can be controlled irrespective of its ac voltage. Statcom can operate as either a source or sink of reactive AC power to an electricity network and the basis of this device is power electronics voltage source converter. The degree up to which the StatCom can compensate the voltage depends on the rating current of StatCom and the impedance of the power system. When designing and dimensioning machines and converters, negative sequence voltage and currents resulting from system faults have to be considered as they cause oscillating torques.
Status Some approaches have been developed to use DG for voltage unbalance compensation. For example, using a two inverter structure, one to control active and reactive power flow, and the other in series with the grid to balance the line currents and the voltages at sensitive load terminals, in spite of unbalanced grid voltage. This is done by injecting negative sequence voltage. The requirement of two inverters can be considered as a negative point in terms of the cost and volume of the DG interface converter.
Another assessed approach, line currents become balanced in spite of the unbalanced loads presence through injection of negative sequence current by DGs. However, under severely unbalanced conditions, a large amount of the interface converter capacity is used for compensation and it may interfere with the active and reactive power supply by the DG.
Motivation Unbalanced voltages can result in adverse effects on equipment and power system. Under unbalanced conditions, the power system will incur more losses and be less stable.
Copyright 2016 SmartNetD1.1 - Ancillary service provision by RES and DSM connected at distribution level in the future power system
Page 164
Damping of low order harmonics
Definition Harmonics cause distortion of source voltage, additional losses due to unwanted current flowing and it may also lead to malfunctioning of protective relays and control units. Harmonic compensation is the use of online generation equipment to compensate for harmonics caused by non-continuous loads. Harmonics can cause poor power quality, voltage imbalances, and excessive zero-sequence currents.
The active power filters minimise the harmonics producing harmonic current of equal magnitude and opposite polarity.
DG could perform a harmonic-compensation function. However, this compensation needs fast-response capability, so only DG with power electronics interfaces can perform this function. For harmonics compensation service, the DG needs to provide only reactive power.
Through harmonic compensation provided by DG, the source avoids the need to provide harmonic current to a load with harmonic components. Thus, there will be no harmonic current flowing through the rest of the utility. This improves system efficiency and stability by reducing losses in the rest of the system.
Status There are many techniques to reduce the effect of harmonics.
Conventionally, passive LC filters have been used to eliminate line current harmonics and to increase the load power factor. However, these filters present several disadvantages.
At present, active power filters have been developed. DG with power electronic technology could act as an active power filter to minimise the harmonics.
Motivation Harmonics are the most common distortion in power systems, existing in both voltage and current. The existence of harmonics reduces the energy efficiency of a power system at the generation, transmission, and consumption points of the system. Harmonics can cause extra heating of the cores of transformers and electrical machines. Furthermore, the harmonics may expedite the aging of the insulation of the components in the system and shorten their useful lifetimes.
Mitigation of flicker
Definition Flicker is caused by voltage fluctuations (for example, when clouds pass by photovoltaic cells, rapidly changing their power output). The effect of these fluctuations will depend on its amplitude and the rate of their occurrence. Generally, mitigation measures are focused on limiting the amplitude of the voltage fluctuations.
According to IEEE recommended practices, the measurement of flicker is comprised of the amount of system voltage variation involved and the frequency at which the variation recurs. Sources of flicker in industrial power distribution systems can be, for instance, the somewhat random variations of load typified by an arc furnace melting scrap steel or an elevator motor’s starts and stops.
DG capable of providing constant, uninterrupted power can improve power quality by mitigating flicker and other voltage regulation problems. But, on the other hand, DG connected to the grid via power electronic inverters (solar PV, fuel cells and most wind turbines) are sources of voltage waveform distortion. However, if designed and implemented properly the power electronics could theoretically cancel grid distortions and help regulate voltage.
Status Some methods used to flicker mitigation are; series capacitors, thyristor switching of inductors with shunt capacitors (static var control), saturating shunt inductors, and thyristor switched shunt capacitors may be used to maintain a relatively steady voltage at the tie point.
Many inverters on the market today are capable of cancel this grid distortion, but such feature adds cost and today DG owners rarely have incentives to invest in this added
Copyright 2016 SmartNetD1.1 - Ancillary service provision by RES and DSM connected at distribution level in the future power system
Page 165
functionality. Some approaches are being assessed, for example, the feasibility and effectiveness of flicker mitigation solutions in the planning phase of the installation.
The standard IEEE 1547, Standard for Interconnecting Distributed Resources with Electric Power Systems, includes several provisions to mitigate DG’s potential negative impacts on power quality and it requires that DG not create objectionable flicker for other customers.
Motivation Flicker causes deterioration in quality of supply from the utility, especially to other consumers served from the same coupling point. It is necessary to find ways to mitigate its effect.
Damping of power system oscillations
Definition With a reduced number of power plants, the oscillation and damping characteristics of the integrated European grid can change. Based on Wide Area Measurement Systems), wide area damping controllers for HVDC transmissions and FACTS (Flexible Alternating Current Transmission System) can be designed to attenuate large-scale oscillations between grid areas (so-called inter-area oscillations).
Damping of power system oscillations is one of the main concerns in the power system operation. The interconnection between distant located power systems is a common practice, which increases the low frequency oscillations. These oscillations, when not well damped, may keep growing until loss of synchronism.
Low-frequency oscillations in a power system affect the system stability, the operating efficiency of the power system and restrict the operating capability of power transmissions. The Power System stabiliser (PSS), by which a supplementary stabilising signal is added to the excitation system, appears as a simple and cost-effective solution. Generally machine parameters change with loading and the machine behavior is different at different operating conditions. Hence, PSSs should provide some degree of robustness to the variations in system parameters, loading conditions and configurations. In most cases, the PSS works well in damping oscillations, however, its control has less flexibility if the operating conditions change.
Other controllers have been developed such as; high voltage dc (HVDC), thyristor-controlled series capacitors and flexible ac transmission system (FACTS). FACTS devices have the advantage of flexibility of being located at the most suitable places to achieve the best control results.
In general, the PSS provides satisfactory damping over a wide range of system loading conditions, but, at the same time, this PSS can cause great variations in the voltage profile. The FACTS devices have the capability of enhancing the system damping. The static compensators (StatCom) maintain the bus voltage by supplying the required reactive power even at low bus voltages and improve the power oscillation damping.
Status Utilities are installing FACT devices in their transmission networks. In addition to their primary function, FACTS have the capability of enhancing the system damping.
Motivation The European energy supply system exhibits low-frequency oscillations that are damped by conventional power plants by means of power system stabilisers. Due to the loss of conventional power suppliers, it may be possible that these oscillations cannot be attenuated this way in the future.
Copyright 2016 SmartNetD1.1 - Ancillary service provision by RES and DSM connected at distribution level in the future power system
Page 166
10.4 Other ancillary services (for other purposes or for combined f/V control)
Black start capability
Definition The black start capability is a system restoration service required to return electrical power system to normal operation after a blackout.
Black start is used in the power system restoration phase, defined as “a set of actions implemented after a disturbance with large-scale consequences to bring the system from emergency or blackout system state back to normal state. Actions of restoration are launched once the system is stabilised. Restoration of the system consists of a very complex sequence of coordinated actions whose framework is studied and, as far as possible, prepared in advance”.
The re-energisation process can be implemented using two strategies. I) Top-down re-energisation using external voltage sources when the grid is reenergised from a neighbouring TSO, starting from the tie-lines. II) Bottom-up re-energisation based on internal sources capabilities is done using units that provide the capability of controlling voltage and speed/frequency during supplied isolated operation and stable operation in an islanded network. Those units are referred to as having black start capabilities.
It is the capability of a generating unit to start up without an external power supply, called on as a means of restoring supplies following a major failure on all or part of the network.
Status At present, the only distributed generators that are likely to be used for black start are large units with capacities in the tens of megawatts that are already designed for blackout service. There are such units at hospitals, airports and other large installations. These installations may be good candidates for black-start service.
Motivation At present, the penetration of DG units which are capable to provide this service is not big enough to energise the transmission network. However, they might be able to energise parts of distribution grids which can then be operated in islanded mode. With the increase of such island grids it will be possible to interconnect these islands and energise an increasing share of the distribution network.
Compensation of power losses
Definition The line losses are basically dependent on the resistance, length, active and reactive power flow over the line and the voltage level.
While the losses due to resistance, the length and the voltage level can only be optimised during the network planning process, the losses due to active and reactive power flows can be optimised during the operation by power dispatch strategies.
The main objective of the optimisation/minimisation of grid losses is to reduce the costs of the power transport and distribution. Grid loss compensation consists in compensating the transmission system losses between the generators and the loads.
Currently, losses reduction initiatives in distribution systems have been activated. In general, these initiatives have been introduced by the utilities as incentives/penalties.
Status Elia (Belgium) purchases electricity to compensate for part of the losses on its grid. Domestic and foreign suppliers can submit bids for such purchase.
Also Austria Power Grid (Austria) has a market-based and non-discriminatory procurement for the required electricity to cover grid losses.
Motivation Theoretically, with DGs, locating generation closer to demand, distribution losses could be reduced as the distance over which electricity is transported is shortened and the number of voltage transformation levels is reduced. However, this is only true when the energy generated is consumed locally. In reality, in liberalised environments, their dispatching can
Copyright 2016 SmartNetD1.1 - Ancillary service provision by RES and DSM connected at distribution level in the future power system
Page 167
lead to increased network flows (and thus losses), often translated into reverse flows from distribution networks to transmission systems.
To enable reduction of power losses, DG units should be operated efficiently with a losses minimisation objective which would help to save a lot of energy.
Power factor control
Definition The power factor indicates how efficiently the load current is being converted into useful work output. Additionally it is a good indicator of the effect of the load current on the efficiency of the supply system.
The power factor can be corrected (reactive power component is reduced) by installing suitable capacitors in the distribution system in order to minimise the wasted energy.
With this correction the value becomes nearer to 1 improving the efficiency of a plant and liberating more kW from the available supply.
Wind and PV can provide reactive power compensation (for example by predefined power factor), and this has direct influence on voltage control and power transmission losses.
Status In general, when the power factor falls below an established value, the utilities charge a penalty by adding a reactive power charge to the bill.
Motivation Power factor correction favours efficiency of electrical distribution lines. Power factor correction can improve the efficiency of the entire transmission network and reduce the need of additional new generation plants.
10.5 Plans for further improvement of ancillary services in Norway (2016-
2021)
This section summarises the present plans for further development of the ancillary services, which are
planned by the Norwegian TSO Statnett within the next five years. The summary is based on Statnett's
own action plan and complies with both Nordic and European initiatives. Figure 32 shows the planned
time schedule for the given actions.
The following actions are planned for implementation within the next five years:
• Definition of common Nordic targets for frequency quality and dimensioning of the automatic
reserves
There is an extensive Nordic activity for further development of methodology for assessment of
operational security, defining a common Nordic level for operational security and dimensioning of the
automatic reserves in order to maintain this level. Based on the results of this work it planned to develop
an optimal combination the automatic reserves.
• Implementation of the new Nordic specification requirements for FCR
Common understanding of requirements for FCR is missing in the Nordic countries at the moment.
Therefore, it has been initiated a Nordic activity for defining new common Nordic technical specification
for FCR N/D. It is further planned to develop requirements for pre-qualification and a plan for
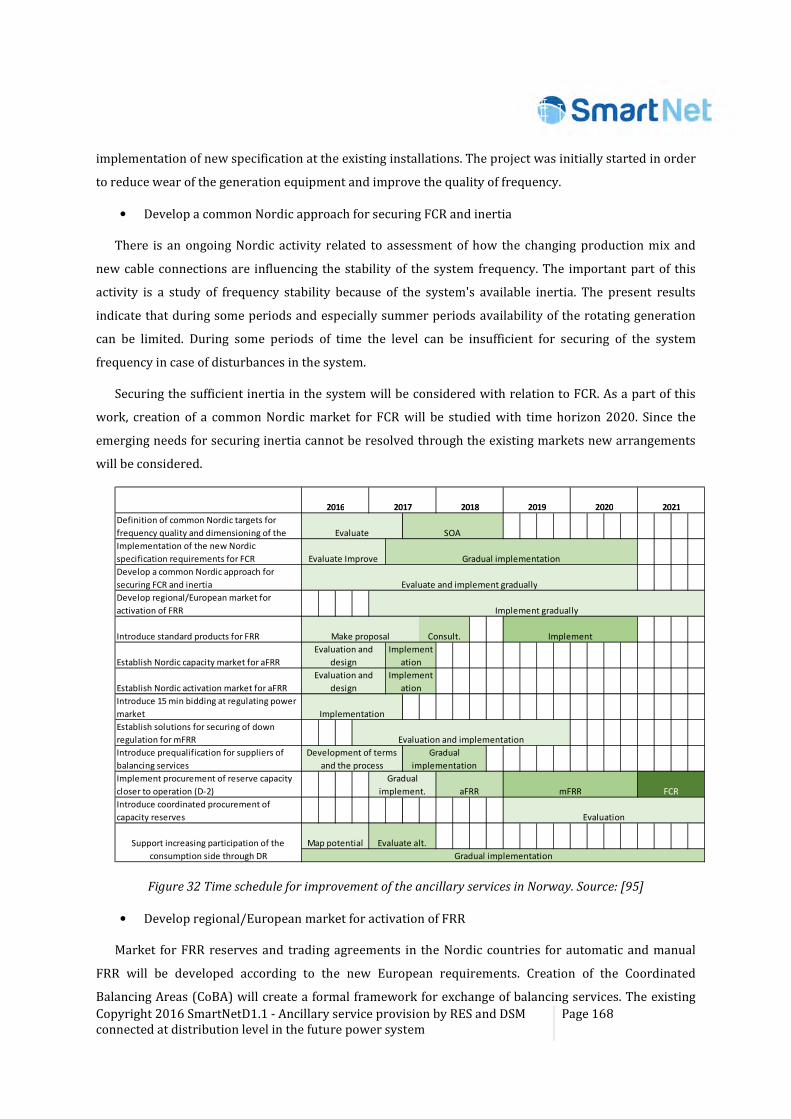
Copyright 2016 SmartNetD1.1 - Ancillary service provision by RES and DSM connected at distribution level in the future power system
Page 168
implementation of new specification at the existing installations. The project was initially started in order
to reduce wear of the generation equipment and improve the quality of frequency.
• Develop a common Nordic approach for securing FCR and inertia
There is an ongoing Nordic activity related to assessment of how the changing production mix and
new cable connections are influencing the stability of the system frequency. The important part of this
activity is a study of frequency stability because of the system's available inertia. The present results
indicate that during some periods and especially summer periods availability of the rotating generation
can be limited. During some periods of time the level can be insufficient for securing of the system
frequency in case of disturbances in the system.
Securing the sufficient inertia in the system will be considered with relation to FCR. As a part of this
work, creation of a common Nordic market for FCR will be studied with time horizon 2020. Since the
emerging needs for securing inertia cannot be resolved through the existing markets new arrangements
will be considered.
Figure 32 Time schedule for improvement of the ancillary services in Norway. Source: [95]
• Develop regional/European market for activation of FRR
Market for FRR reserves and trading agreements in the Nordic countries for automatic and manual
FRR will be developed according to the new European requirements. Creation of the Coordinated
Balancing Areas (CoBA) will create a formal framework for exchange of balancing services. The existing
Definition of common Nordic targets for
frequency quality and dimensioning of the
Implementation of the new Nordic
specification requirements for FCR
Develop a common Nordic approach for
securing FCR and inertia
Develop regional/European market for
activation of FRR
Introduce standard products for FRR
Establish Nordic capacity market for aFRR
Establish Nordic activation market for aFRR
Introduce 15 min bidding at regulating power
market
Establish solutions for securing of down
regulation for mFRR
Introduce prequalification for suppliers of
balancing services
Implement procurement of reserve capacity
closer to operation (D-2)
Introduce coordinated procurement of
capacity reserves
Evaluation and
design
Implement
ation
Evaluate and implement gradually
Implement gradually
Make proposal Consult. Implement
2020 2021
Evaluate SOA
Evaluate Improve Gradual implementation
2016 2017 2018 2019
Evaluation and
design
Implement
ation
Implementation
Evaluation and implementation
Development of terms
and the process
Gradual
implementation
Map potential Evaluate alt.Support increasing participation of the
consumption side through DR Gradual implementation
Gradual
implement. aFRR mFRR FCR
Evaluation
Copyright 2016 SmartNetD1.1 - Ancillary service provision by RES and DSM connected at distribution level in the future power system
Page 169
cooperation will be further improved of will include more harmonised products, terms for participation
in the capacity markets and methods for reservation of the transmission capacities.
• Introduce standard products for FRR
This activity is ongoing under ENTSO-E work for specification of standard products for FRR. The
objective for the standard products with clearly defined properties is to make possible exchange of the
balancing services between countries, both within and between regional markets. A single TSO can define
specific products for its own use, but there is a clear intention that the most of the balancing services
within ENTSO-E area will be based upon standard products.
There is an expectation that it will be more products (for example 2-3) for mFRR instead of one single
product today. The change will require considerable ICT-development both at the actors and TSOs.
• Establish Nordic capacity and activation market for aFRR
Statnett cooperates with other Nordic TSOs in development and implementation of common markets
for aFRR. Firstly for procurement of the reserves and later for activation of these. Through the common
market it is expected to achieve a more efficient use of regulating resources, what it expected to improve
the socio-economic feasibility and contribute to limiting of costs for the reserves at the Nordic level. aFRR
was taken into operation in Nordic countries in 2012 and until 2015 have been procured at national
markets with different configurations. There is an agreement about common view for shaping the future
aFRR market.
• Introduce 15 min bidding at regulating power market
Statnett plans to introduce a requirement that actors, submitting production plans with volumes
varying pr. 15 minutes within an hour, will also have to submit 15 minutes volume bids at the regulating
power market (mFRR). The price for these bids will be still given pr. one hour.
Reason for this is to achieve better operator's overview og handling of the capacities at the regulating
power market during hours with varying production throughout an hour.
• Establish solutions for securing of down regulation for mFRR
The system responsible operator should be able to regulate balance in the power system in both
directions. The framework today specifies requirements to the resources available for up-regulation i.e.
increase in generation or reduction of consumption in the system. The Norwegian TSO has experienced
situation with scarce resources for manual down-regulation event though in limited scale. There are
however expectations that this is going to be an increasing challenge in the future, and therefore it will be
a specific need to secure that sufficient resources for down-regulation will be available for TSO in the
operation time.
Copyright 2016 SmartNetD1.1 - Ancillary service provision by RES and DSM connected at distribution level in the future power system
Page 170
The lack of resources is partially caused by physical limitations for down-regulation in the generating
installations, water channels or/and the power network and partially because of the available down-
regulation resources are not submitted to the markets. It is assumed that
• Introduce prequalification for suppliers of balancing services
Statnett intends to introduce prequalification procedures for suppliers of FCR and FRR. This is
necessary to meet the growing needs for securing the necessary functionality and availability as well as to
meet prequalification requirements of the European guidelines for System Operation. The
prequalification also presumes that all suppliers of FCR and FRR have to apply formally to the TSO in
order to participate in the markets for the reserves. The applicants should demonstrate that their own
installations meet technical requirements for delivery and availability of the resources.
• Implementation of procurement of capacity reserves closer to operation (D-2)
The capacity reserves today are procured today at different points in time and durations. Usually it
happens one week ahead and for approximately for one duration. By committing their reserves the
suppliers reduce their flexibility for participation in other markets e.g. day-ahead market. Statnett plans
to schedule daily procurement of the reserves to evening before clearing the day-ahead market i.e. D-2.
• Introduce coordinated procurement of capacity reserves
In the theory, the optimal solution will be to clear all capacity reserves' markets simultaneously with
the day-ahead market and let the bids to include detailed information about production costs. This
however is not considered to be realistic within the given planning period i.e. 2025. However it can be
realistic within this period to introduce solutions, where suppliers will submit offers for several types of
capacity reserves at the same point in time. In order to achieve this several procurement times and bid
sizes should be harmonised for FCR, aFRR and mFRR. Development of these procedures will be
coordinated among all Nordic TSOs in order secure that the resources can be shared and exchanged
across the synchronised area.
• Support increasing participation of the consumption side through DR
Statnett works on solutions allowing new and more actors to participate in the capacity reserves'
markets. The work includes assessment of necessities for development of new solutions for getting access
to the flexibility on the consumption side as well as legal conditions because of the European framework.
Further on it is an ongoing dialogue with the distribution networks in order to understand their opinions
and needs related to the DR.
Copyright 2016 SmartNetD1.1 - Ancillary service provision by RES and DSM connected at distribution level in the future power system
Page 171
11 Glossary
Ancillary services: According to the United States Federal Energy Regulatory Commission (FERC)
ancillary services are services necessary to support the transmission of electric power from seller to
purchaser given the obligations of control areas and transmitting utilities within those control areas to
maintain reliable operations of the interconnected transmission system. The list of the six types of
ancillary services by FERC is not as such suitable for the European context. In the SmartNet project we
include as ancillary services the following services
• scheduling, dispatch and load following to the extent it is not done by the electricity market
• balancing and frequency control.
• control of reactive power, voltage and voltage quality
• management of losses
• protection.
Back-up generation capacity: Households and businesses connected to the main power grid may
also have some form of “back-up” power generation capacity that can, in the event of disruption, provide
electricity. Back-up generators are typically fuelled with diesel or gasoline and capacity can be from as
little as a few kilowatts. Such capacity is distinct from mini- and off-grid systems that are not connected to
the main power grid.
Balancing a power system means that the power consumed is kept equal to the power produced.
This is necessary because the grid does not include much electrical energy storage. In alternating current
systems the system frequency decreases if less power is produced than consumed and vice versa. The AC
power system and many connected equipment can safely and properly work only within a relatively
narrow frequency range around the nominal frequency of the system. In the European Union (EU) the
balancing is done initially by the electricity markets and finally by the ancillary services for balancing and
frequency control.
Biofuels: Liquid fuels derived from biomass or waste feedstocks and include ethanol and biodiesel.
They can be classified as conventional and advanced biofuels according to the technologies used to
produce them and their respective maturity.
Contingency reserves are also known as replacement reserves. See the definition of replacement
reserves.
Coordinated Balancing Area (CoBA) means a cooperation with respect to the Exchange of Balancing
Services, Sharing of Reserves or operating the imbalance Netting Process between two or more TSOs.
Demand side flexibility means the capability of electricity consumers to respond to market prices,
grid tariffs, control commands, etc. by controlling their embedded generation, energy storages and
controllable loads accordingly.
Copyright 2016 SmartNetD1.1 - Ancillary service provision by RES and DSM connected at distribution level in the future power system
Page 172
Distribution System Operator (DSO), operates the distribution networks by managing its balance,
transmission constraints, voltage quality, losses, faults and protection. It is almost a synonym to a
Distribution Network Operator (DNO) but emphasises the increasing role of the DSO in supporting the
TSO in balancing and other ancillary services.
Frequency containment, Frequency Containment Process (FCP) means a process that aims at
stabilising the System Frequency by compensating imbalances by means of appropriate reserves.
Frequency restoration reserves, Frequency Restoration Reserves (FRR) means the Active Power
Reserves activated to restore System Frequency to the Nominal Frequency and for Synchronous Area
consisting of more than one LFC Area power balance to the scheduled value.
Hydropower: The energy content of the electricity produced in hydropower plants, assuming 100%
efficiency. It excludes output from pumped storage and marine (tide and wave) power plants.
Imbalance Netting Process means a process agreed between TSOs of two or more LFC Areas within
one or more than one Synchronous Areas that allows for avoidance of simultaneous FRR activation in
opposite directions by taking into account the respective FRCEs as well as activated FRR and correcting
the input of the involved FRPs accordingly.
Off-grid systems: Stand-alone systems for individual households or groups of consumers.
Photovoltaic (PV) is a method of converting solar energy into direct current electricity using
semiconducting materials that exhibit the photovoltaic effect.
Operating reserve means the flexible energy resources available to the system operator for the
provision of ancillary services such as balancing.
Renewable Energy Sources (RES), Now RES mainly include intermittent solar PV and wind as well
as hydropower, geothermal and biomass. New promising sources such as tidal, wave, solar CSP power
may need to be considered for the future.
Renewables, Includes bioenergy, geothermal, hydropower, solar photovoltaics (PV), concentrating
solar power (CSP), wind and marine (tide and wave) energy for electricity and heat generation.
Replacement reserves (RR) means the reserves used to restore/support the required level of FRR to
be prepared for additional system imbalances. This category includes operating reserves with activation
time from Time to Restore Frequency up to hours.
System reserves, See operating reserve
Transmission System Operator (TSO). The European Commission defines TSO as an entity
entrusted with transporting energy in the form of natural gas or electrical power on a national or regional
level, using fixed infrastructure. Electricity TSO is an operator that transmits electrical power from power
generation plants over the electrical grid to electricity DSOs and large energy consumers. In Europe
electricity Transmission Network Operator is also a System Operator (SO). In Europe the system
operators are independent from the power generation just like the ISO:s (Independent System Operators)
in the US.

Copyright 2016 SmartNetD1.1 - Ancillary service provision by RES and DSM connected at distribution level in the future power system
Page 173
TSO-BSP Model means a model for the Exchange of Balancing Capacity or the Exchange of Balancing
Energy where the Contracting TSO has an agreement with a Balancing Service Provider in another
Responsibility Area or Scheduling Area when appropriate.
TSO-TSO Model means a model for the Exchange of Balancing Services exclusively by TSOs. The TSO-
TSO Model is the standard model for the Exchange of Balancing Services.
Sources: [25], [40] and Annex C of [94]
Recommended