REPORT MAY 2018
BANKING ON REFORM ALIGNING DEVELOPMENT BANKS WITH THE PARIS CLIMATE AGREEMENT
HELENA WRIGHT, JAMES HAWKINS, DILEIMY OROZCO, NICK MABEY
2 B A N K I N G O N R E F O R M
Acknowledgements: We would like to thank all the experts who have contributed inputs and ideas including Jan Corfee-Morlot, Steve Herz, Kiri Hanks, Sam Fankhauser, Naeeda Crishna Morgado, Alan Searl, Alfred Helm, Alex Doukas, Julia Bingler, Peter Sweatman, Kate Geary, Laurence Connell, Anna Ostergren, Dom Molloy, Rob Moore, Steve Pye, Pedro Guertler, Matt Webb, Camilla Born, George Triggs and Robert Barbe, and staff from the Multilateral Development Banks. Photo credit: Flickr Shehal Joseph
About E3G E3G is an independent climate change think tank operating to accelerate the
global transition to a low carbon
economy. E3G builds cross-sectoral coalitions to achieve carefully defined outcomes, chosen for their capacity to leverage change. E3G works closely with like-minded partners in government,
politics, business, civil society, science, the media, public interest foundations and elsewhere. In 2016, E3G was ranked
the number one environmental think tank in the UK. www.e3g.org
Berlin office
Neue Promenade 6 Berlin, 10178 – Germany Tel: +49 (0) 30 2887 3405
Brussels office
Rue de la Science 23 1040 Brussels, Belgium Tel: +32 (0)28 93 92 12
London office 47 Great Guildford Street
London SE1 0ES, UK Tel: +44 (0)20 7593 2020
Washington DC office 2101 L St NW
Suite 400 Washington DC, WA 20037 United States Tel: +1 202 466 0573
© E3G 2018
Copyright This work is licensed under the Creative Commons Attribution-NonCommercial-
ShareAlike 2.0 License.
You are free to:
> Copy, distribute, display, and perform the work.
> Make derivative works.
Under the following conditions:
> You must attribute the work in the
manner specified by the author or licensor.
> You may not use this work for
commercial purposes.
> If you alter, transform, or build upon this work, you may distribute the
resulting work only under a license identical to this one.
> For any reuse or distribution, you
must make clear to others the license terms of this work.
> Any of these conditions can be waived if you get permission from the copyright holder.
Your fair use and other rights are in no way affected by the above.
3 B A N K I N G O N R E F O R M
CONTENTS About E3G ........................................................................................................................ 2
Copyright ......................................................................................................................... 2
EXECUTIVE SUMMARY ..................................................................................................... 4
INTRODUCTION..............................................................................................................13
CHAPTER 1 STANDALONE CLIMATE STRATEGY ............................................................. 16
CHAPTER 2 INTEGRATION INTO SECTORAL STRATEGIES ............................................... 22
CHAPTER 3 INTEGRATION OF CLIMATE INTO COUNTRY WORK .................................... 28
CHAPTER 4 LEVEL OF TRANSPARENCY ........................................................................... 34
CHAPTER 5 ENERGY EFFICIENCY STANDARDS AND INVESTMENTS ............................... 40
CHAPTER 6 FORESTS AND AGRICULTURE ...................................................................... 49
CHAPTER 7 FOSSIL FUEL POLICIES ................................................................................. 56
CHAPTER 8 ENERGY ACCESS AND FUEL POVERTY ......................................................... 62
CHAPTER 9 PORTFOLIO GREENHOUSE GAS ACCOUNTING AND REDUCTION ............... 69
CHAPTER 10 CLIMATE RISK ............................................................................................ 76
CHAPTER 11 SHADOW CARBON PRICING ...................................................................... 82
CHAPTER 12 GREEN/BROWN ENERGY RATIO AND CLIMATE INVESTMENT .................. 87
CHAPTER 13 TECHNICAL ASSISTANCE FOR IMPLEMENTING PARIS GOALS ................. 101
CHAPTER 14 GREEN FINANCE ...................................................................................... 109
CHAPTER 15 INNOVATIVE INSTRUMENTS ................................................................... 118
CHAPTER 16 INSTITUTIONAL LEADERSHIP................................................................... 127
CONCLUSIONS AND RANKING ..................................................................................... 131
ANNEX .......................................................................................................................... 137
4 B A N K I N G O N R E F O R M
EXECUTIVE SUMMARY The Multilateral Development Banks (MDBs) have a crucial role in achieving the Paris Agreement and the Sustainable Development Goals (SDGs). The main six development banks have committed to align their financial flows with the UN’s Paris Agreement on climate change1. In this report, we assess their progress in this commitment.
The world is expected to invest approximately US$90 trillion in infrastructure over the next 15 years. The investment choices over the next few years will start to lock-in a climate-smart and inclusive growth pathway or a high-carbon and unsustainable pathway for decades to come2. The multilateral development banks occupy a unique catalytic position in achieving the Paris goals - complementing governments limited resources and leveraging multiple times their investments from private capital. Moreover, MDBs assist client governments in planning and project preparation, and can play a role in providing economic advice on development pathways that last for decades. As publicly funded institutions, they have a duty to ensure their investments are in the wider public interest and that they are not financing harmful or risky activities. This report assesses the progress of the six main MDBs; the African Development Bank (AfDB), Asian Development Bank (AsDB), European Bank for Reconstruction and Development (EBRD), European Investment Bank (EIB), Inter-American Development Bank (IADB) and World Bank Group (WBG) in aligning their financial flows with the UN’s Paris Agreement on climate change. The assessment scores and ranks their progress across sixteen criteria within four different thematic areas: Governance, Strategy, Risk and Operational Management, and Transformational Initiatives3. MDB performance is rated on a scale ranging from ‘rogue’ to ‘transformational’. Analysis involved a combination of desk research, project-level data analysis and stakeholder consultations.
1 IDFC-MDB Statement (2017) Together Major Development Finance Institutions Align Financial Flows with Paris Agreement
2 New Climate Economy (2016). The Sustainable Infrastructure Imperative.
3 These sub-categories of indicators were informed by the Financial Stability Board’s Task Force on Climate-related Financial Disclosures. See: www.fsb-tcfd.org
5 B A N K I N G O N R E F O R M
Key Findings and Recommendations The multilateral development banks have the potential to lead the world towards a sustainable transition. The final ranking shows that the Inter-American Development Bank is leading the way among the group in supporting the transition to a low-carbon and resilient economy. The European Investment Bank and World Bank Group also perform reasonably well. Nevertheless, none of these institutions has been shown to be transformational across the four different areas, demonstrating that these banks must do more to integrate climate change across their operations to help achieve the Paris Agreement goals. According to the MDBs own estimates, they committed more than US$27 billion in climate finance in 20164. However, some of the banks are still investing almost as much in fossil fuels as they do in energy-related climate finance. The revision of sectoral strategies over the next two years offers a key opportunity to align with the Paris Agreement.
For all the MDBs, there were gaps in data availability and transparency5.
MDBs should do more to share learning with one another on best
practices and pool data to inform collective progress. Limited data was
available on the green/brown energy finance ratio. It is therefore
recommended the MDBs begin tracking and self-reporting on their
alignment with the Paris Agreement.
MDBs are also working in a range of ways to translate Paris pledges – known as nationally determined contributions (NDCs) - into investment plans. The research identified IADB’s NDC Invest6 initiative as a good example. Since country pledges under the Paris Agreements are insufficient to limit global temperature rise to 2°C, we recommend that MDBs should go beyond offering support on Paris goals and offer technical assistance on long-term pathways that align with the goal of achieving net zero greenhouse gas emissions.
4 IADB (2017) MDB 2016 Joint Report on Climate Finance
5 The analysis of OECD-DAC climate finance data was also limited by the completeness of reporting by MDBs.
6 NDC Invest is a comprehensive package of assistance including advising on enabling policies to unlock investments at scale. See www.ndcinvest.org
6 B A N K I N G O N R E F O R M
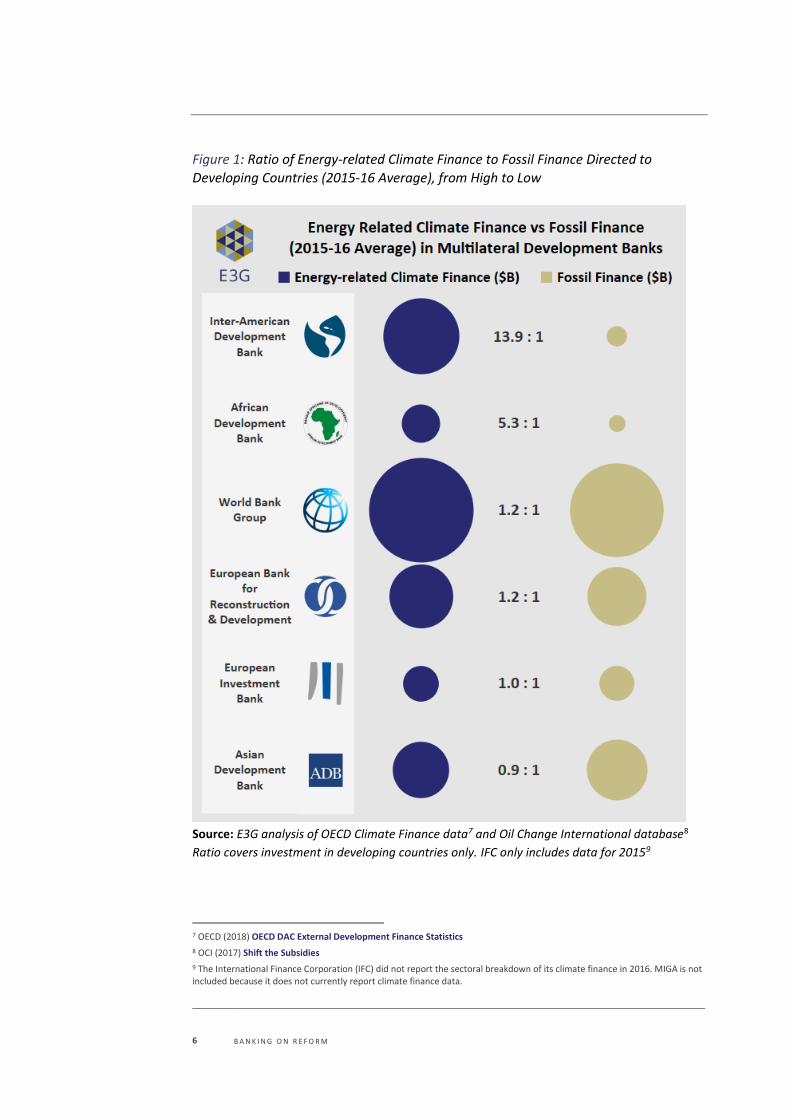
Figure 1: Ratio of Energy-related Climate Finance to Fossil Finance Directed to
Developing Countries (2015-16 Average), from High to Low
Source: E3G analysis of OECD Climate Finance data7 and Oil Change International database8
Ratio covers investment in developing countries only. IFC only includes data for 20159
7 OECD (2018) OECD DAC External Development Finance Statistics
8 OCI (2017) Shift the Subsidies
9 The International Finance Corporation (IFC) did not report the sectoral breakdown of its climate finance in 2016. MIGA is not included because it does not currently report climate finance data.
7 B A N K I N G O N R E F O R M
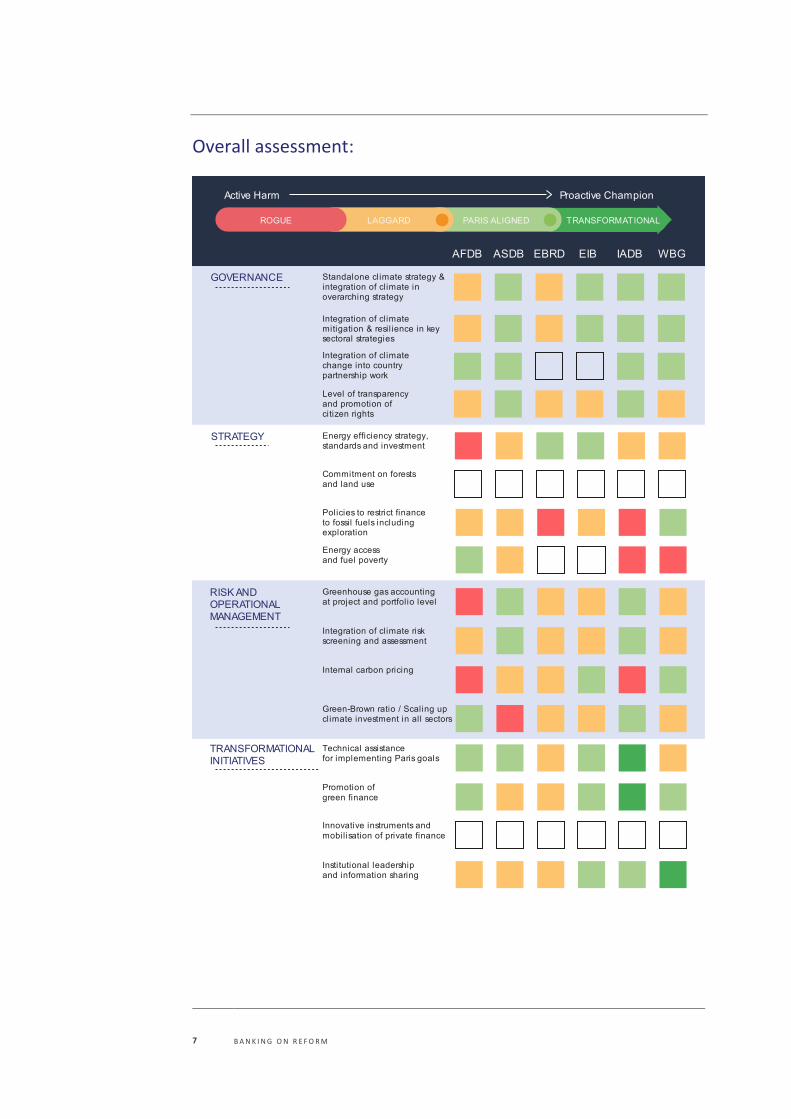
Overall assessment:
8 B A N K I N G O N R E F O R M
The MDBs were scored on their progress against these 16 criteria in a simple scoring system10, with the final ranking being:
• Inter-American Development Bank (1st) – Overall Score: 23 points
• European Investment Bank 2nd) – Overall Score: 22 points
• World Bank Group (3rd) – Overall Score: 21 points
• Asian Development Bank – Overall Score: 20 points
• African Development Bank – Overall Score: 17 points
• European Bank for Reconstruction & Development - Overall Score: 15 points The analysis and information gathered in this report was used to develop a series of
targeted priority recommendations for each MDB, outlined below.
Policy Recommendations
African Development Bank (AfDB) • AfDB should update sectoral strategies to incorporate climate change, in key
sectors. The transport strategy is set to be revised soon which provides an opportunity for alignment with the Paris Agreement - it is recommended this be updated to include the ‘avoid-shift-improve’ approach.
• AfDB should adopt standards for energy efficiency of power generation and building projects which it supports, including learning from the IFC’s EDGE program. AfDB requires 20% energy savings from energy efficiency projects - a positive signal which could be adopted more widely. AfDB should seek to ensure key infrastructure investments are efficient in terms of energy use.
• AfDB should consider becoming the first MDB to make a commitment on reducing deforestation or increasing afforestation with its finance. This would be particularly significant given the importance of forests for the African region.
• AfDB should disclose the absolute greenhouse gas emissions from projects in high-emitting sectors, as well as reporting on emissions across the portfolio, and considering setting a reduction commitment, as well as considering the usage of shadow carbon pricing for project assessment.
• AfDB should make additional effort to support countries with climate-resilient policies, particularly given the vulnerability of the region it operates in.
• AfDB should explore which member countries would benefit the most from energy subsidy reform, as other MDBs have done.
• AfDB should continue to support countries with green banking and green bond issuance, building on existing work. AfDB could assess what proportion of its credit lines go to green activities and consider providing technical assistance to local financial institutions interested in financing green investment.
10 MDBs were scored with a simple points system with a score of ‘3’ for transformational, ‘2’ for Paris-aligned, ‘1’ for laggard and ‘0’ for rogue. EIB and EBRD’s average scores for categories they were ranked on were extrapolated to the total number of criteria so as not to disadvantage them for categories which were not applicable.
9 B A N K I N G O N R E F O R M
Asian Development Bank (AsDB) • AsDB should continue to integrate climate into its country work following
the Paris Agreement, and support countries with deep decarbonization, as IADB is doing.
• AsDB should require energy efficiency standards for power generation or buildings in AsDB-supported projects, in line with best practice in other MDBs.
• AsDB should consider committing to net zero deforestation or making an equivalent commitment on forests. AsDB’s climate framework notes that AsDB has a very limited portfolio of investments on preventing deforestation and degradation and AsDB should look at filling this gap given the importance of forests for the Paris Agreement goals. Fisheries and oceans may well also be a crucial gap given the importance of fisheries in the Asian region – an area which requires further research.
• AsDB should put restrictions in place to limit oil and gas lending, which would improve the Bank’s green to brown energy lending ratio.
• AsDB should ensure its commitment to reduce portfolio emissions takes into account best practices in terms of disclosing absolute emissions and on project inclusion thresholds.
• AsDB should update its internal carbon price with the recommendations from the High-Level Commission on Carbon Pricing, as the World Bank has recently done.
• AsDB should support regulators on greening the financial system and green fiscal reforms, building on existing work.
European Bank for Reconstruction and Development (EBRD) • On fossil fuel finance, the upcoming revision of EBRD’s Energy Sector
Strategy this year is an opportunity to align with the Paris Agreement. EBRD should immediately rule out oil finance as well as putting in place a timeline for ruling out gas investments by 2020.
• EBRD should consider setting a target for emission reductions to be achieved across its portfolio. IADB and AsDB have already made commitments in this regard. EBRD has a portfolio-wide greenhouse gas (GHG) accounting system in place, providing a suitable basis for setting a reduction target.
• EBRD should consider additional efforts to support clients with climate resilience, as well as scaling up adaptation finance.
• EBRD should introduce a carbon price across all sectors and update its carbon price in line with levels recommended by the High-Level Commission on Carbon Pricing. EBRD is currently looking into this area and deciding on the application and scope of shadow pricing11.
• EBRD should improve on the quality of reporting of its climate finance data to OECD-DAC. Many climate finance projects were missing the project description and/or short description.
11 Information received from EBRD.
1 0 B A N K I N G O N R E F O R M
• EBRD should provide technical support on long-term pathway planning for deep decarbonization, as well as in supporting countries and private sector actors to understand stranded asset risks.
• EBRD should provide green finance support for regulators and a broader set of national financial institutions, building on existing work on green bonds and work with local financial institutions.
• EBRD should continue to work with other MDBs to share its learning on financing energy efficiency. The research identified EBRD’s work on energy efficiency as an example of leadership among the MDBs.
European Investment Bank (EIB) • On fossil fuel finance, EIB’s upcoming revision of its energy strategy is an
opportunity to align its energy lending with the Paris Agreement. As for EBRD, EIB should immediately rule out oil finance as well as putting in place a timeline for ruling out gas investments by 2020. This would improve EIB’s green to brown energy finance ratio.
• EIB should consider setting a greenhouse gas emission reduction target across its portfolio, as well as measuring the greenhouse gas impacts of its equity investments.
• EIB should make additional efforts to scale up adaptation finance, as well as support climate resilience as part of its technical support.
• As part of the European Investment Advisory Hub (EIAH), EIB should provide advisory support on 2050 pathway planning and support on fossil fuel subsidy reform. Our analysis found that all of the MDBs had provided some form of technical support on fossil fuel subsidy reform, apart from the EIB.
• EIB should work to support regulators and local or national financial institutions on green finance, including continuing to support green bond markets, building on existing work.
• EIB should continue to work on alignment with the Paris Agreement, including sharing the learning and findings with other MDBs. There are signs of progress given that EIB plans to assess the level of alignment with the Paris Agreement as part of its mid-term review of its Climate Strategy 5-year implementation plan.
Inter-American Development Bank (IADB) • IADB should set standards for energy efficiency for investments in relevant
sectors e.g. learning from IFC or EIB. IADB currently does not require the use of a specific energy efficiency standard in buildings financed through its operations (hospitals, schools, offices, housing, etc).
• IADB should be the first MDB to pledge to net zero deforestation or make an equivalent commitment on reducing deforestation. To address deforestation, IADB could be the first among the MDBs to provide technical advice to support sustainable food consumption, in line with the goal of keeping global temperature rise below 2 degrees.
• IADB should go further than the WBG and rule out oil and gas investment. This commitment would reflect existing progress in greening IADB’s investments whilst setting an example for others.
1 1 B A N K I N G O N R E F O R M
• IADB should assess whether it should increase its portfolio emission reduction targets. IADB has a target for reducing emissions across its portfolio and should assess whether this target is ambitious enough to support the Paris Agreement goals. IADB should consider pioneering a commitment for alignment of its portfolio with 1.5 degrees. This may require conducting an assessment of its alignment.
• IADB should consider using internal carbon pricing and to align this shadow price with the High-Level Commission recommendations. The IADB is currently reviewing this issue.
World Bank Group (WBG) • WBG should support client countries with long-term economic planning for
2050 pathways and integrate this into their work as well as supporting client countries on understanding stranded asset risks. WBG should seek to provide more publicly available information about its NDC Support Facility to enhance transparency.
• On energy access, WBG should consider setting a target to improve overall progress on sustainable energy access, as well as supporting Climate Vulnerable Forum countries to meet their goal of 100% renewable energy by 2050.
• WBG should ensure its commitment to greenhouse gas reporting integrates best practices across the MDBs. This should include disclosure of absolute project emissions, for all projects with emissions above 25kt of emissions. Based on available evidence, WBG should set a reduction target for gross portfolio-wide greenhouse gas emissions.
• WBG should further strengthen its climate finance target, in line with the ambition in other MDBs.
• Among the WBG institutions, the International Finance Corporation (IFC) should adopt climate risk screening processes, as are already used within the
International Bank for Reconstruction and Development (IBRD) and International Development Association (IDA).
• IBRD and IDA projects should adopt energy efficiency standards for investments in the power sector and buildings. i.e. IFC standards requiring power plants to be in the top quartile of efficiency, and for buildings to reduce absolute energy use by at least 20% compared to the baseline.
Conclusions and implications for future research MDBs must commit to use tools which assess their level of alignment across the portfolio. The MDBs have committed to aligning with the Paris Agreement and must assess their progress to ensure this commitment is robustly implemented. The EIB shows emerging signs of leadership in this area, as EIB plans to assess the level of
alignment as part of its mid-term review of its Climate Strategy 5-year implementation plan. For all MDBs there was limited transparency of project-level data with which to estimate the green to brown energy finance ratio, meaning that
fossil fuel spending was drawn from secondary data. To improve transparency on climate-related disclosures it would be helpful if the MDBs Annual Reports and/or Joint Reports would self-report on such information, including to inform country members on progress. MDBs should assess their exposure to high-carbon assets, in
1 2 B A N K I N G O N R E F O R M
line with the Task Force on Climate-Related Financial Disclosures (TCFD)12. MDBs should also disclose disaggregated data on the instruments used for climate finance. Research challenges included the difficulty of tracking down missing data, and new initiatives and updates being announced on a regular basis. As such, we have included
all data possible where it was robust and conclusive, but this area would benefit from further research or annual updates. Scoring against several criteria was based on guidelines and policies which were introduced recently, and future research would be required to review the implementation of those guidelines and policies in practice as information becomes available. In addition, while this research focused primarily on
key infrastructure sectors, there are other important climate-relevant sectors such as forests, agriculture, oceans, and waste on which further research is needed. Among
all MDBs, it was found that additional research was needed to identify what proportion of climate finance goes to forests. Additional research would also be needed explore how transport investments can better align with the Paris Agreement. These rankings are likely to change in future, and climate change should be incorporated as sectoral strategies are updated.
MDBs should do more to share learning with one another on best practices and pool data to inform collective progress. Various transformational case studies were identified from across the MDBs, including the Carbon Pricing Leadership Coalition13,
ProAdapt14, and IFC’s EDGE tool15.
On green finance, all MDBs should seek to provide relevant technical assistance on green finance for regulators including finance ministries and central banks as well as
local and national financial institutions. This should include putting in place robust policies and incentives to build capacity of other institutions to carry out
environmental screening and ‘green’ their investments. In addition, MDBs should seek to create investment vehicles and financial structures that maximize private sector leverage with climate finance.
The findings have implications for other national and international financial institutions, given that multiple institutions have committed to aligning their finance
with the Paris Climate Agreement. For example, the International Development Finance Club (IDFC) which is made up of 23 institutions with total assets of more than
$3.5 trillion has also committed to aligning financial flows with the Paris Agreement16.
New institutions such as the Asian Infrastructure Investment Bank (AIIB) should also look to implement best practices from the MDBs on areas such as portfolio greenhouse gas accounting, climate risk screening and energy efficiency.
12 The Financial Stability Board (FSB)’s Task Force on Climate-related Financial Disclosures (TCFD) is an industry-led taskforce chaired by Michael Bloomberg. See: www.fsb-tcfd.org
13 Convenes leaders to put in place effective carbon pricing policies. See: https://www.carbonpricingleadership.org/
14 Aims to increase the climate resilience of micro, small, and medium enterprises and works with microfinance institutions (MFIs) to help them incorporate climate risk. See: https://www.proadapt.org/
15 EDGE provides a no cost assessment tool to help broaden uptake of green buildings. See: https://www.edgebuildings.com/
16 IDFC-MDB Statement (2017) Together Major Development Finance Institutions Align Financial Flows with Paris Agreement
1 3 B A N K I N G O N R E F O R M
INTRODUCTION Multilateral Development Banks (MDBs) have a crucial role in achieving the Paris Agreement and the Sustainable Development Goals (SDGs). The world is expected to invest around $90 trillion in infrastructure over the next 15 years. The investment choices we make even over the next 2-3 years will start to lock in for decades to come either a climate-smart, inclusive growth pathway, or a high-carbon, inefficient and unsustainable pathway17. This requires an urgent paradigm shift in global infrastructure investment. MDBs and other International Financial Institutions (IFIs) also have an important role in assisting client governments in planning and project preparation and can play a role in providing advice on economic pathways that last for decades. In addition, MDBs can leverage multiple times their investments from private capital. It is estimated that for every $1 invested directly by IFIs, $2-5 are mobilized in private investment18. The MDB’s committed over $27bn to climate finance in 2016 – around 20% of total operations19. This report analyses the progress of the main MDBs in their commitment to align their financial flows with the Paris Agreement on climate change20.
Methodology and benchmarking of progress In this report, we assess the progress of the main Multilateral Development Banks
(MDBs) in aligning their financial flows with the UN’s Paris Agreement on climate change. The Paris Agreement on Climate Change was a landmark agreement which sets out a commitment to limit the global temperature rise to well below 2°C (and strive for a 1.5°C limit). The group of MDBs committed to scale up finance for climate
action in developing countries21 as well aligning their financial flows with Paris goals22.
The report focuses on the ‘big six’ development banks, the African Development Bank (AfDB), Asian Development Bank (AsDB), European Bank for Reconstruction and Development (EBRD), European Investment Bank (EIB), Inter-American Development Bank (IADB) and World Bank Group (WBG)23. Each of the main WBG institutions were
included; the International Development Association (IDA); International Bank for
17 New Climate Economy (2016). The Sustainable Infrastructure Imperative.
18 http://www.worldbank.org/en/news/press-release/2015/07/10/international-financial-institutions-400-billion-sustainable-development-goals
19 IADB (2017) Joint report on MDBs climate finance The report explains that total operations of the MDBs amounted to $140.6bn in 2016, of which $27.4bn was climate finance. FDI flows to developing economies were $646bn in 2016.
20 IDFC-MDB Statement (2017) Together Major Development Finance Institutions Align Financial Flows with Paris Agreement
21 Joint Statement by the Multilateral Development Banks at Paris (2015)
22 IDFC-MDB Statement (2017) Together Major Development Finance Institutions Align Financial Flows with Paris Agreement
23 Further research could assess the progress of other institutions including the Asian Infrastructure Investment Bank.
1 4 B A N K I N G O N R E F O R M
Reconstruction and Development (IBRD); Multilateral Investment Guarantee Agency (MIGA); and International Finance Corporation (IFC); though at times the WBG is ranked as a whole due to a lack of disaggregated information. After a multi-stakeholder process involving consultation with more than 25 experts, the following 16 criteria were identified for the ranking24:
Governance 1) Standalone climate strategy and integration of climate in overarching strategy 2) Integration of climate mitigation and resilience in key sectoral strategies 3) Integration of climate change into country work 4) Level of transparency and promotion of citizen rights
Strategy 5) Energy efficiency strategy, standards and investment
6) Commitment on forests and land use 7) Policies to restrict finance to fossil fuels including exploration 8) Energy access and fuel poverty Risk and Operational Management 9) Greenhouse gas accounting at project and portfolio level
10) Integration of climate risk screening and assessment
11) Internal carbon pricing 12) Green-Brown energy ratio and scaling up climate investment in all sectors Transformational initiatives
13) Technical assistance for implementing Paris goals
14) Promotion of green finance 15) Innovative instruments, mechanisms and tools 16) Institutional leadership and information sharing
These sub-categories of indicators were informed by the Financial Stability Board’s
Task Force on Climate-related Financial Disclosures (TCFD)25. Informed by these sub-categories we developed a Scoring System for benchmarking MDBs against these indicators which was also tested with experts (see Annex 1).
The forthcoming sections take each of these criteria in turn and assess the progress of the MDBs based on a combination of desk research using available literature, analysis
of available datasets26, and stakeholder consultations. Where relevant, we focus primarily on the infrastructure sectors of energy, transport, and water and
sanitation27. However, it is notable that there are other important climate-relevant areas and sectors including fisheries, the ocean, waste and soils which were not
included due to time constraints and would require additional research. According to
24 Experts were consulted from among development institutions, civil society, government and academia. 25 https://www.fsb-tcfd.org/publications/final-recommendations-report/
26 Data sources included the project-level data on climate-related development finance self-reported by the MDBs to the Organisation for Economic Co-operation and Development's (OECD) Development Assistance Committee (DAC), as well as data on projects identified as support for fossil fuels in the Oil Change International ‘Shift the Subsidies’ database. Please refer to the E3G Briefing on Greening Financial Flows for more information, as well as Chapter 12, for more information on data sources.
27 Within the Organisation for Economic Co-operation and Development (OECD) reporting system, “infrastructure” refers to the sectors of water and sanitation, energy generation and support, transport and communications. Communications infrastructure was determined to be less relevant to climate-related finance and has received limited climate-related development finance so far. See: https://www.e3g.org/library/sustainable-infrastructure-what-progress-in-multilateral-development-banks
1 5 B A N K I N G O N R E F O R M
this methodology, we have incorporated announcements into the ranking where evidence has been provided and there was a degree of certainty about the details, while noting that forthcoming updates may raise the level of progress in several places28. As this assessment has been focused on positive change, where sufficient detail was provided, we have given credit for announcements in advance of their
implementation while noting that further research is needed over time and that scoring could decrease if a policy is not implemented in practice. This research has been evolving over the past 12 months, during which time several announcements have been made. As such, we have included all data possible where it was robust and conclusive, but we also understand that this would benefit from further research.
28 For some forthcoming updates there was insufficient detail in the public domain to increase the score against the relevant metric at this stage, but we have noted where this is the case.
1 6 B A N K I N G O N R E F O R M
CHAPTER 1
STANDALONE CLIMATE STRATEGY AND
INTEGRATION OF CLIMATE IN
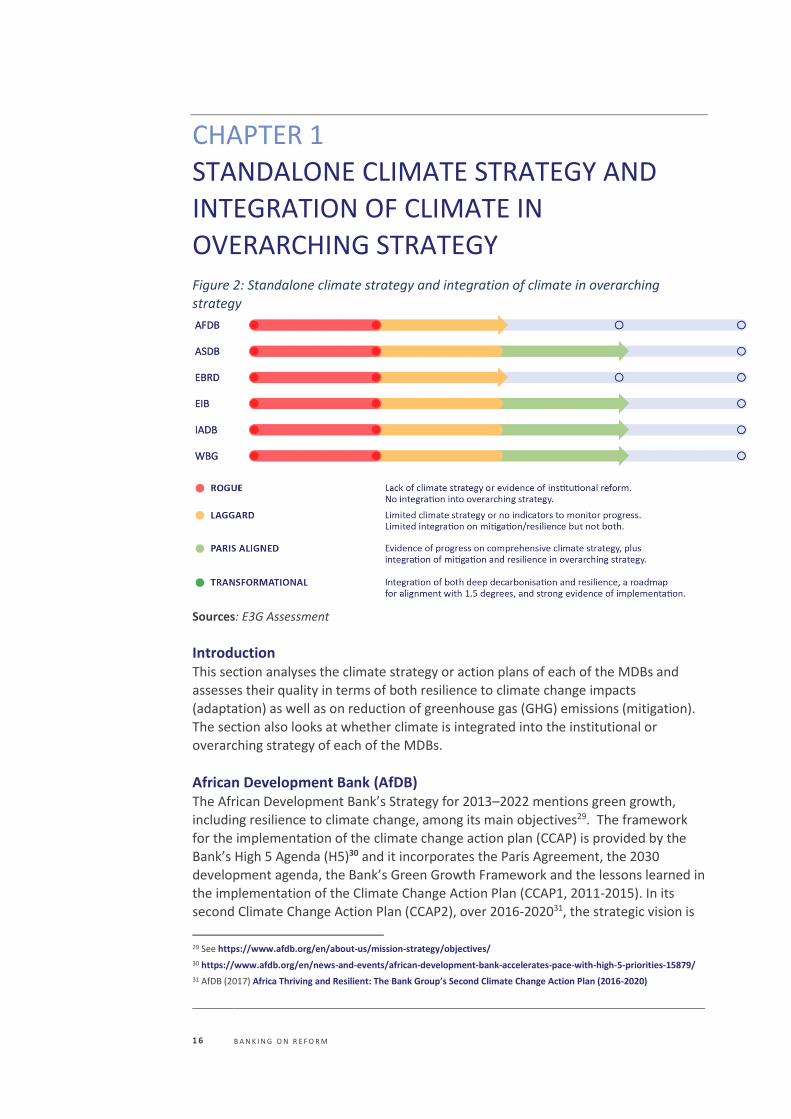
OVERARCHING STRATEGY Figure 2: Standalone climate strategy and integration of climate in overarching
strategy
Sources: E3G Assessment
Introduction This section analyses the climate strategy or action plans of each of the MDBs and assesses their quality in terms of both resilience to climate change impacts (adaptation) as well as on reduction of greenhouse gas (GHG) emissions (mitigation).
The section also looks at whether climate is integrated into the institutional or overarching strategy of each of the MDBs.
African Development Bank (AfDB) The African Development Bank’s Strategy for 2013–2022 mentions green growth,
including resilience to climate change, among its main objectives29. The framework for the implementation of the climate change action plan (CCAP) is provided by the Bank’s High 5 Agenda (H5)30 and it incorporates the Paris Agreement, the 2030 development agenda, the Bank’s Green Growth Framework and the lessons learned in the implementation of the Climate Change Action Plan (CCAP1, 2011-2015). In its
second Climate Change Action Plan (CCAP2), over 2016-202031, the strategic vision is
29 See https://www.afdb.org/en/about-us/mission-strategy/objectives/
30 https://www.afdb.org/en/news-and-events/african-development-bank-accelerates-pace-with-high-5-priorities-15879/
31 AfDB (2017) Africa Thriving and Resilient: The Bank Group’s Second Climate Change Action Plan (2016-2020)
1 7 B A N K I N G O N R E F O R M
to enable the achievement of “low–carbon and climate-resilient” development in Africa. It has four Pillars: Mitigation, Adaptation, Climate Finance and a Cross Cutting Pillar on technology transfer, capacity development, institutional reforms as well as other cross-cutting activities to create the enabling environment for successful implementation32. On adaptation, it recognizes the low participation of the private
sector and proposes to address this under different initiatives to scale up climate finance, and by integrating adaptation in the design of the projects. On mitigation it recognizes the need to decouple economic growth from emissions and that technology transfer is going to play a key role33. However, AfDB’s climate strategy mentions “investment in coal-fired generators with minimal cooling water
requirements” within the Annex, therefore AfDB is ranked as a laggard among the group34.
Asian Development Bank (AsDB) AsDB’s new long-term strategy is expected to incorporate climate change35. The document contains the objective that 75% of ADB’s commitments will be made climate relevant by 203036. AsDB’s Climate Change Operational Framework 2017–2030 (CCOF2030)37, recognizes the central role of climate change in achieving the
SDGs and AsDB’s Strategy 2030 objectives. As such climate change is being fully mainstreamed into AsDB plans and operations. This appears to be the first long-term
climate strategy among MDBs that goes beyond 2020. The vision is to enhance actions
for lower greenhouse gas emissions and climate resilient development in AsDB’s
Developing Member Countries (DMCs). The vision is aligned with the three core elements of the strategic agenda 2020: inclusive economic growth, environmentally sustainable development, and regional integration, and it is expected to be integrated
into AsDB’s 2030 strategy.
The Climate Change Operational Framework provides direction on strengthening climate actions in AsDB’s operations, as well as ensuring that all its projects are climate sensitive and take climate risk into account in project design. AsDB states that it will strengthen assessments of both climate and disaster risk from the country and
regional perspective, besides improving assessments at project level. Furthermore, the AsDB suggests… “[it] may employ a more proactive approach that transcends the
traditional demand driven model of assistance…”38, as some DMCs do not currently prioritize climate adaptation and mitigation in their interactions with the AsDB. The CCOF2030 is going to be implemented in two phases which gives the opportunity to review and update the framework – an acknowledgment of the need for flexibility
which seems to be unique amongst MDBs. The CCOF2030 is centered on five actions: supporting institutional development and policy frameworks conducive to ambitious
32 AfDB (2017) Africa Thriving and Resilient: The Bank Group’s Second Climate Change Action Plan (2016-2020)
33 AfDB (2017) Africa Thriving and Resilient: The Bank Group’s Second Climate Change Action Plan (2016-2020)
34 AfDB (2017) Africa Thriving and Resilient: The Bank Group’s Second Climate Change Action Plan (2016-2020)
35 See https://www.adb.org/sites/default/files/institutional-document/414336/strategy-2030-draft.pdf
36 See https://www.adb.org/sites/default/files/institutional-document/414336/strategy-2030-draft.pdf
37 AsDB (2017) Climate Change Operational Framework 2017–2030
38 AsDB (2017) Climate Change Operational Framework 2017–2030
1 8 B A N K I N G O N R E F O R M
climate action; facilitating access to public and private, domestic and international climate finance; promoting the use of climate technologies in operations; developing knowledge solutions and capacity development support; and strengthening partnerships and networks. It contains several new and innovative aspects compared to the other MDBs, for example it states that AsDB will “support its DMCs [Developing
Member Countries] in gaining a better understanding of the economics of climate impact and alternative actions to improve decision making under highly uncertain circumstances”39. In addition, the plan states that AsDB will reduce its portfolio emissions, which is a first among the MDBs (refer to the Section on GHG accounting for more information).
European Bank for Reconstruction and Development (EBRD) EBRD’s strategy implementation plan 2017-2018 mentions the green transition as a key component of moving to a well-functioning market economy. It also highlights the
position it has on the opportunity to scale up its activities on energy efficiency, and to promote innovation with a focus on environmental technology transfer and the Green Economy Transition (GET) policy dialogue. In addition, EBRD mentions the water vulnerability of the countries in which it operates and that it is working to develop an
environmental policy to improve the resilience of water supply groundwater and surface water resources40.
Unlike other MDBs, EBRD focuses on the green economy41 which provides the basis
for its GET approach. The EBRD launched the GET approach in 2015 to put investments that bring environmental benefits at the heart of its mandate42. EBRD’s sustainable investments aim to mitigate and/or build resilience to the effects of
climate change and other forms of environmental degradation43. Expanding its initial focus on energy efficiency and renewable energy projects, the EBRD has moved into
the areas of water, material efficiency and adaptation. EBRD’s strategy is around the green economy rather than climate change per se. It also mentions the UN Sustainable Development Goals (SDGs) and refers to reforming
markets to reduce their impact on the environment as a whole rather than emphasizing the effects of climate change. This reflects the countries where the EBRD
operates, having been established to support former Soviet countries in establishing and promoting private markets. There is a strong emphasis on enabling the conditions for the transition, as such the focus is mostly on policy dialogue, regulations, incentives where needed and legal infrastructure.
39 Ibid
40 EBRD (2016) EBRD’s strategy implementation plan 2017-18
41 EBRD defines the Green Economy as “a market economy in which public and private investments are made with a specific concern to minimise the impact of economic activity on the environment and where market failures are addressed through improved policy and legal frameworks aiming at accounting systematically for the inherent value of services provided by nature, at managing related risks and at catalysing innovation” 42 EBRD (2015). Green Economy Transition Approach
43 http://www.ebrd.com/cs/Satellite?c=Content&cid=1395250237163&d=Mobile&pagename=EBRD%2FContent%2FContentLayout
1 9 B A N K I N G O N R E F O R M
European Investment Bank (EIB) Climate change has been integrated into the EIB’s operational plan which covers
2017-1944, which states that “the Bank will seek to retain its position as the largest multilateral provider of climate finance and deliver on its pledge to increase the share of climate action finance from 25% to 35%”. Climate change is one of the top objectives of the European Union (EU) and the EIB as the EU’s bank lists climate change is one of its top priorities45. EIB climate action is intertwined with EU policy,
and as such it seems that the EIB will not go beyond its mandate. Therefore, given that the EU doesn’t have a 2050 roadmap this absence is reflected at the EIB. EU policy provides guidance on EIB’s medium to long-term actions within and outside the
EU including on climate finance projects. The focus of the EIB’s climate strategy46 is on the opportunities for the real economy from addressing climate change, including job creation, retaining Europe’s position as
a global leader on green technologies; and securing the energy supply by investing in energy efficiency and renewables. It also recognizes the effect of climate change on living conditions. Furthermore, EIB is focusing its efforts on unlocking finance to accelerate the low carbon transition, innovative financial instruments and leveraging
the private sector. However, EIB’s climate efforts are not reflected in recent decisions on project approvals. For example, EIB has recently approved a loan for the TAP gas
pipeline (Trans Adriatic Pipeline)47.
The EIB’s main focus has been on mitigation but it has mentioned and highlighted the barriers to adaptation and the need for strengthening the capacity for those who work on delivering projects on the ground. Interestingly the EIB is thinking about assessing
and managing portfolio climate risks – with the climate strategy noting EIB will ‘undertake a preliminary scoping exercise… to assess the level of relevance of systemic
climate risk to its financial standing’48. This seems to be at an initial stage49.
Inter-American Development Bank Group (IADB) IADB has integrated climate change as a cross-cutting issue in its institutional strategy up to 201950. In the IADB Group Climate Action Plan 2016-2020, climate change and
environmental sustainability is identified as one of three cross-cutting issues underpinning development in the region alongside gender equality and institutional
capacity51. The strategy includes the following actions: aligning with IADB strategies; strengthening collaboration and mobilizing external resources; actions to further
mainstream climate change into IADB; and sector-specific opportunities; as well as measuring results52. IADB states that it is going to align its operations to support 44 EIB (2016) The EIB Group Operational Plan 2017-2019
45 EIB (2015) Climate Strategy
46 EIB (2015) Climate Strategy
47 See: https://www.reuters.com/article/eu-energy/update-1-eib-approves-1-5-bln-euro-loan-for-tap-gas-pipeline-idUSL8N1PW6EY
48 EIB (2015) Climate Strategy
49 Information received from EIB
50 IADB (2015) Update to the Institutional Strategy 2016-2019 (UIS)
51 IADB (to be published). IDBG Climate Change Action Plan 2016-2020.
52 Ibid
2 0 B A N K I N G O N R E F O R M
countries to deliver their Paris commitments, known as nationally determined contributions (NDCs), and it is encouraging cross-ministerial dialogue to promote policy consistency and create synergies so as to translate NDCs into specific investments. However, as for other MDBs, the approach is largely demand-driven, as such their goal of increasing climate finance is conditional on their clients’ priorities.
IADB highlights the importance of including climate change not only in the project cycle but also at the upstream level, particularly when strategic dialogue with clients takes place. Following the launch of the TCFD, IADB is exploring the potential for conducting a “climate stress-test on the portfolio to determine the extent to which it
is aligned to the Paris Agreement and its level of exposure to climate risk”53.
World Bank Group (WBG) Climate change has been integrated into the 2017 WBG ‘Forward Look’ - the WBG’s
strategic vision document to 203054. This reinforces its commitment to the implementation of their Climate Change Action Plan (CCAP) approved in 2016. The ‘Forward Look’ document states that IDA18 has raised the WBG’s ambition further, by committing all IDA Systematic Country Diagnostics (SCDs) and Country Partnership
Frameworks (CPFs) to address climate risks and “reflect the countries’ Nationally Determined Contributions (NDCs)”55. Since it does not refer to long-term planning
beyond NDCs, this is not ranked as transformational. Both IFC56 and MIGA57 also have
a specific focus on climate change in their business plans.
The WBG Climate Change Action Plan (CCAP)58, published in 2016, recognizes that climate change is a threat to its core mission of ending extreme poverty and
promoting shared prosperity59 60. The action plan aims to demonstrate how the WBG is going to meet the challenges and opportunities posed by climate change, providing
concrete actions to help countries address current and future climate risks and opportunities. The plan also recognizes that countries have different starting points and need differentiated support. Providing policy and institutional support for national investment plans and facilitating private sector initiatives is noted as critical
to having an impact. The action plan is underpinned by five strategic shifts for the WBG’s climate work: (i) accelerate implementation with a focus on how to get results
on the ground; (ii) ensure convergence of the WBG climate and development agendas so that climate stabilization is coordinated with country strategies and operations; (iii) maximize impact, moving from measuring inputs to measuring impacts; (iv) boost resilience, where the portfolio will be rebalanced with a greater focus on adaptation;
53 Ibid
54 World Bank (2017) Forward Look: A Vision For The World Bank Group In 2030
55 World Bank (2017) Forward Look: A Vision For The World Bank Group In 2030
56 IFC (2017) Strategy & Business Outlook FY18-20
57 MIGA (2017) Strategy & Business Outlook FY18-20
58 World Bank Group (2016) Climate Change Action Plan 2016-2020
59 See: http://www.worldbank.org/en/about/what-we-do
60 As it is going to affect the most vulnerable people and could push climate impacts could push an additional 100 million people into poverty by 2030
2 1 B A N K I N G O N R E F O R M
and (v) transformation, as achieving global commitments will require a shift from business as usual, the action plan will focus on facilitating transformational impacts. Within the CCAP, rather more emphasis is placed on adaptation to impacts than mitigation of emissions. For example, the plan states the World Bank’s “Systematic
Country Diagnostics (SCDs) and Country Partnership Frameworks (CPFs) will consider the risks and opportunities created by climate change and countries’ climate priorities” but this does not specifically mention the low-carbon transition. Moreover, on transport there is a “strong focus on enhancing the resilience of the road portfolio” but the electric vehicle transition is not mentioned within the document even though
transport is one of the most important sectors for decarbonization. The plan does not refer to deep decarbonization or supporting countries with long-term 2050 planning.
Summary The focus and aims of MDB strategies on the transition to a low carbon and resilient global economy differ significantly, and no two MDBs are taking the same approach. For example, the AsDB is more focused on the potential impact of climate change on its member states. Whereas the EIB sees new technologies associated with
decarbonisation as a potential opportunity for Europe, the EBRD is focused on building up the green economy in countries where it invests to combat the energy-
intensive legacy of their communist pasts. Leverage points for transformational
policies or interventions will vary, therefore, depending on the region in which MDBs
operate. Nevertheless, it is important that MDB strategies are aligned with national
approaches towards achieving the transition, given the unprecedented scale and pace of the required economic transformation61. A more proactive approach from the
MDBs is imperative. Therefore, AsDB has been given the highest score, as in its most recent CCOF2030 it has signaled a change in its traditional relationship with its member countries, as well as the opportunity to update the CCOF2030 to reflect country needs and the fast-changing landscape. The IADB has also demonstrated that
it is supporting countries in translating their NDCs into action and is also piloting 2050 decarbonisation plans. Overall, there has not yet been a significant change in the
traditional demand-driven approach taken by the MDBs. Our recommendation is for the MDBs to adopt a more proactive approach and long-term plans to support countries. If actions are still linked to the 4-6 year electoral cycle of countries, this could undermine the transition and continuity of programs.
61 OECD (2017) Investing in Climate, Investing in Growth
2 2 B A N K I N G O N R E F O R M
CHAPTER 2
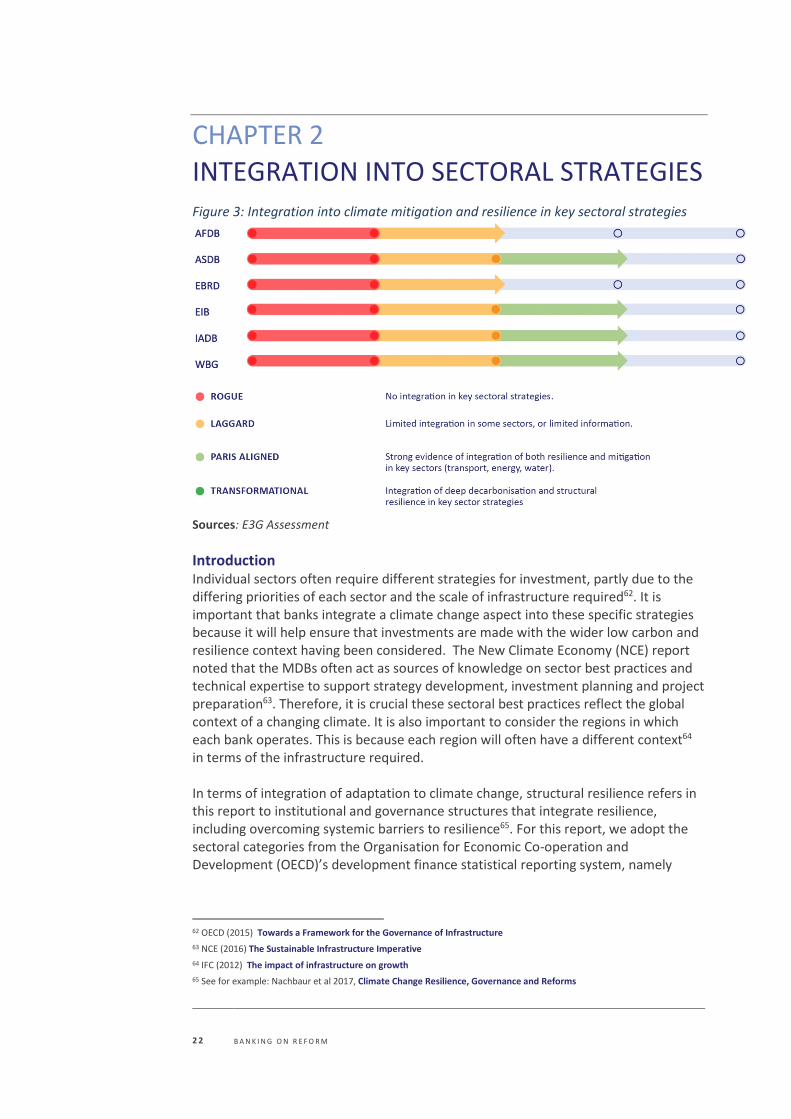
INTEGRATION INTO SECTORAL STRATEGIES Figure 3: Integration into climate mitigation and resilience in key sectoral strategies
Sources: E3G Assessment
Introduction Individual sectors often require different strategies for investment, partly due to the differing priorities of each sector and the scale of infrastructure required62. It is important that banks integrate a climate change aspect into these specific strategies because it will help ensure that investments are made with the wider low carbon and resilience context having been considered. The New Climate Economy (NCE) report noted that the MDBs often act as sources of knowledge on sector best practices and technical expertise to support strategy development, investment planning and project preparation63. Therefore, it is crucial these sectoral best practices reflect the global context of a changing climate. It is also important to consider the regions in which each bank operates. This is because each region will often have a different context64 in terms of the infrastructure required. In terms of integration of adaptation to climate change, structural resilience refers in this report to institutional and governance structures that integrate resilience, including overcoming systemic barriers to resilience65. For this report, we adopt the sectoral categories from the Organisation for Economic Co-operation and Development (OECD)’s development finance statistical reporting system, namely
62 OECD (2015) Towards a Framework for the Governance of Infrastructure
63 NCE (2016) The Sustainable Infrastructure Imperative
64 IFC (2012) The impact of infrastructure on growth
65 See for example: Nachbaur et al 2017, Climate Change Resilience, Governance and Reforms
2 3 B A N K I N G O N R E F O R M
transport, energy, and water and sanitation sectors66. For water and sanitation, there is usually a greater focus on resilience measures due to freshwater systems being vulnerable to the impacts of climate change67. Studies have shown that national water sector policies predominantly focus on adaptation68. However, some water projects can increase emissions, including hydro-power dams, desalination plants (depending on energy source) and some irrigation measures69. However, hydro-power dams are likely to be included in the energy strategies of the MDB’s. This section therefore only assesses the integration of resilience measures in the MDB’s water strategies, whilst looking at both resilience and mitigation for the energy and transport sectors.
African Development Bank (AfDB) The AfDB has specific Climate Finance Tracking guidance documents70 for transport,
water, energy and agriculture. These documents detail general information on how to track climate finance, what projects are covered, who is responsible, and how the information is reported. Importantly, these documents also detail how mitigation and adaptation is defined for each sector as well as issues that arise in tracking climate finance for each sector71 72.
Specific climate finance tracking documents do not mean that climate action is integrated across all projects within each sector, only specific projects. The AfDB does have an energy strategy which stresses the need for low carbon growth, and
announcements in 2017 by AfDB have demonstrated that all energy projects were
renewable energy73 74. Adaptation is mentioned in the energy sector strategy in reference to helping clients with national or regional adaptation plans. Moreover, AfDB’s Energy Strategy, New Deal on Energy for Africa 2016-2025 promotes modern,
clean and sustainable energy and supports the delivery of Africa Renewable Energy Initiative (AREI) to achieve 10 GW by 2020 and mobilize additional 300 GW by 203075.
The AfDB has a vision and strategy for water supply and sanitation, but this does not specifically mention climate change or sustainability76. Moreover, while there is a climate finance tracking document dedicated to transport, the Bank’s strategy and
vision for transport does not specifically mention either climate change or sustainability77. The Transport strategy is being updated to reflect the Bank’s High 5
66 OECD (2017) Investing in Climate, Investing in Growth To note that telecommunications are also categorized as a sustainable infrastructure sector by OECD but were not included as the MDBs do not have a large amount of investment in telecommunications. The agriculture, forest and land use sectors are also important, as is green infrastructure and sectoral work around cities. These areas would require further research.
67 Pacific Institute (2015) Climate Change and Water
68 England et al (2018) How do sectoral policies support climate compatible development?
69 IPCC (2014) Climate change mitigation measures and water
70 AfDB (2014 ) Climate Finance Tracking at AfDB
71 AfDB (2013) Climate Finance Tracking Guidance Manual Transport Sector
72 AfDB (2013) Climate Finance Tracking Guidance Manual Energy Sector
73 AfDB (2012) Energy Sector Policy
74 AfDB (2017) African Development Bank achieves 100% investment in green energy projects in 2017
75 AfDB (2016) The Bank Group’s Strategy for The New Deal on Energy for Africa 2016 – 2025
76 AfDB (2016) Bank Group Vision – Water Supply & Sanitation
77 AfDB (2016) Bank Group Vision - Transport
2 4 B A N K I N G O N R E F O R M
agenda78, and it is recommended that this should include the ‘Avoid-Shift-Improve’ approach.
Asian Development Bank (AsDB) The AsDB has a policy or plan for each sector. Transport has its own report titled Sustainable Transport Initiative Operational Plan79. This document has a section dedicated to addressing climate change which details a three-step approach for
limiting greenhouse gases from transport. It is also committed to developing analytical tools for integrating adaptation into transport operations. Within the energy policy, there is a requirement for the Bank to promote energy efficiency and
renewable energy80. Additionally, the Bank has a document for ‘Climate Proofing Investment in the Energy Sector’81. This focuses on adaptation and demonstrates a clear integration of climate change into a sector strategy. The AsDB has a Water Operational Plan82 which states that the plan “has developed a range of operational
interventions—these are in line with emerging best practice measures to respond to the potential adverse impacts of climate change and associated uncertainty”. The plan is more focused on resilience and countering the projected impacts of climate change on water management. However, the plan also mentions water losses and the
resulting carbon footprint. Sanitation is included in the document83 but, as the strategy is mainly focused on water, waste management is not identified as a
mitigation opportunity.
European Bank for Reconstruction and Development (EBRD) The EBRD has sectoral strategies for energy and transport. However, it does not have
one for water. Climate change features prominently in the energy sector strategy84, which states that this is the sector with “the greatest potential for achieving emissions reductions” and the challenge of mitigating climate change is immediate. Adaptation
is mentioned in relation to water flows and how energy generation could be affected.
The transport sector strategy85 states that it will support sustainable transport by applying “energy efficient technologies and standards and encourages lower-emission modes to reduce energy consumption”. A promising point to note is that the
approach to financing airline investments will be highly selective and focused on energy efficiency. Both strategies demonstrate that climate change is considered a
priority for infrastructure investment. Adaptation is also mentioned in the context of coastal infrastructure but there is insufficient detail.
78 Information received from AfDB.
79 AsDB (2010) Sustainable transport initiative operational plan
80 AsDB (2009) Energy Sector Policy
81 AsDB (2013) Climate Proofing Investment in the Energy Sector
82 AsDB (2011) Water Operational Plan
83 AsDB (2011) Water Operational Plan
84 EBRD (2013) Energy Sector Strategy
85 EBRD (2013) Transport Sector Strategy
2 5 B A N K I N G O N R E F O R M
European Investment Bank (EIB) The EIB Finance for climate action86 report outlines key climate projects in the major
infrastructure sectors. This includes a Bus Rapid Transport system in Laos and biogas sewage treatment plan in Vienna. Within the Transport Lending Policy,87 land transport is prioritised towards urban public transport and rail projects rather than road projects due to a greater potential to reduce emissions per transport unit. A similar approach to waterborne and airborne transport is also taken, demonstrating
that climate change is intrinsic to transport investment at the EIB. This is confirmed by the Cleaner Transport Facility88, which lays out a framework for facilitating clean investment in transport. EIB has noted that integration will be done at the time of
updating the sectoral strategies, whose timing is linked with major EU policy changes. In the meantime, the Bank carries out analyses that are not published (e.g. an ongoing study on climate action in transport). There is an internal guidance document for tracking climate action in transport projects for both mitigation and adaptation89.
The EIB strategy for water investment has a focus on climate change resilience. This is demonstrated by the Water Lending Policy90 having a section dedicated to adaptation. A specific document for Financing Water and Climate Change Adaptation91 reiterates
the importance of climate change to investment decisions in the water sector for the EIB. In addition, as for transport, there is an internal guidance document for tracking
climate action in water and wastewater related projects for both mitigation and
adaptation92.
Within the lending criteria for energy93 climate change provides much of the context through which energy investments are now made. Examples include cost benefit
analysis with a carbon price (see Chapter on Carbon Pricing) and an Emission Performance Standard for all fossil fuel power plants. However, the ambition of these
measures could be strengthened. While the energy lending criteria do not make a specific reference to resilience, the EIB has a collective of guidance notes for different sectors, which provide information about how climate is being mainstreamed94. EIB’s Energy Sector guidance note makes a specific reference to resilience.
Inter-American Development Bank (IADB) The IADB has Sector Framework documents95 which outline the directives that are
applied to IADB loans in numerous economic sectors. All three sectors being investigated (water, energy and transport) are included within the framework
documents. Moreover, the IADB has a ‘Climate Change Sector Framework
86 EIB (2015) Climate Finance Action
87 EIB (2011) EIB Transport Lending Policy
88 EIB (2016) The Cleaner Transport Facility
89 Information available from EIB.
90 EIB ( 2008) Water Sector Lending Policy
91 EIB (2011) Water and climate change adaptation
92 Information available from EIB.
93 EIB (2016) Energy Lending Criteria
94 Information available from EIB.
95 IADB (2018) Sector Policies and Sector Framework Documents
2 6 B A N K I N G O N R E F O R M
Document’96 which is important because the Bank explicitly recognises that climate change measures must be considered for all sectors to ensure sustainable growth. This is best practice among the MDBs. Within the energy sector framework97, two key sections cover climate change and the challenges it poses for this sector. The water sector framework98 focuses on climate resilience and the need to consider this in
infrastructure planning. IADB was the only bank that has an overarching climate change sector framework which explicitly links all sectors to climate change. However, IADB has not been ranked as ‘transformational’ since the sectoral strategies do not yet integrate the priorities of supporting deep decarbonization pathways and structural resilience in key sectors.
World Bank Group (WBG) The World Bank states that in transport it will respond to the climate imperative “by reducing the carbon footprint of the sector (mitigation) and enhancing climate
resilience (adaptation)”. The four priority goals are access of all, efficiency, safety of mobility solutions, and responding to the climate imperative which including both mitigation and adaptation99. The World Bank has led on the development of the Sustainable Mobility for All (Sum4All) initiative since 2016100.
In energy there is a clear focus on energy access and clean energy within the WBG’s
strategy overview, as well as references to resilience101. This overview states that the
WBG is committed to helping countries meet the climate mitigation and resilience
targets they set as part of the Paris Agreement process – the Nationally Determined Contributions, and that the World Bank will no longer finance upstream oil and gas investments after 2019102. In water there is a clear focus on considering the impacts of
climate change on water supplies and for an emphasis on this being considered at the country, basin and project level103. The World Bank has a separate strategy for solid
waste management which includes both resilience and greenhouse gas mitigation104. However, it is not clear whether transport or energy investments are aligned with long term deep decarbonization. In terms of supporting structural resilience across sectors, there are examples where the WBG is supporting institutional and legal
frameworks to build resilience and overcome barriers to resilience105, but it is not clear to what extent the approach is mainstreamed.
96 IADB (2015) Climate Change Sector Framework Document
97 IADB (2015) Energy Sector Framework Document
98 IADB (2014) Water And Sanitation Sector Framework Document
99 World Bank (2018) Transport Overview
100 See: http://sum4all.org/
101 World Bank (2018) Energy Overview To note that this was recently updated on 11 April 2018.
102 World Bank (2018) Energy Overview
103 World Bank (2018) Water Overview
104 World Bank (2018) http://www.worldbank.org/en/topic/urbandevelopment/brief/solid-waste-management
105 World Bank (2017) Barriers to Climate-Resilient Infrastructure Financing, SCF Forum Presentation, September 2017.
2 7 B A N K I N G O N R E F O R M
Summary
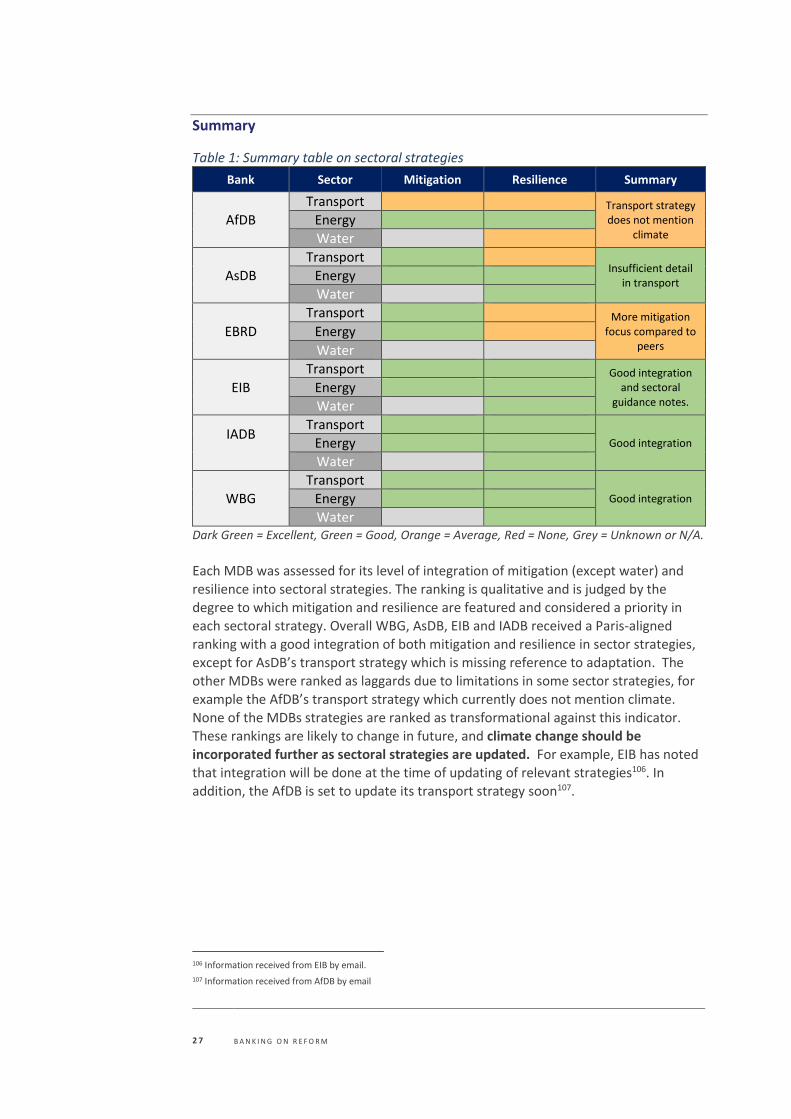
Table 1: Summary table on sectoral strategies
Bank Sector Mitigation Resilience Summary
AfDB
Transport Transport strategy does not mention
climate Energy
Water
AsDB
Transport Insufficient detail
in transport Energy
Water
EBRD
Transport More mitigation focus compared to
peers Energy
Water
EIB
Transport Good integration and sectoral
guidance notes. Energy
Water
IADB
Transport Good integration Energy
Water
WBG
Transport Good integration Energy
Water Dark Green = Excellent, Green = Good, Orange = Average, Red = None, Grey = Unknown or N/A.
Each MDB was assessed for its level of integration of mitigation (except water) and resilience into sectoral strategies. The ranking is qualitative and is judged by the degree to which mitigation and resilience are featured and considered a priority in
each sectoral strategy. Overall WBG, AsDB, EIB and IADB received a Paris-aligned ranking with a good integration of both mitigation and resilience in sector strategies,
except for AsDB’s transport strategy which is missing reference to adaptation. The other MDBs were ranked as laggards due to limitations in some sector strategies, for
example the AfDB’s transport strategy which currently does not mention climate.
None of the MDBs strategies are ranked as transformational against this indicator.
These rankings are likely to change in future, and climate change should be incorporated further as sectoral strategies are updated. For example, EIB has noted that integration will be done at the time of updating of relevant strategies106. In addition, the AfDB is set to update its transport strategy soon107.
106 Information received from EIB by email.
107 Information received from AfDB by email
2 8 B A N K I N G O N R E F O R M
CHAPTER 3
INTEGRATION OF CLIMATE INTO COUNTRY
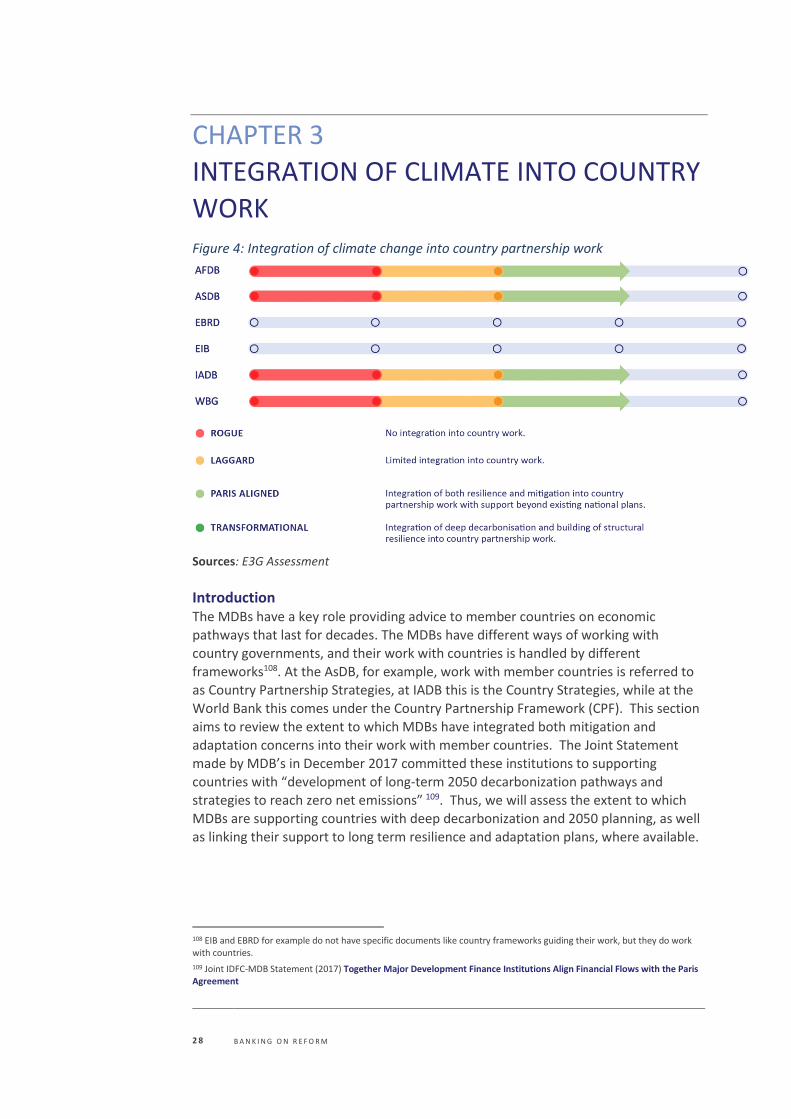
WORK Figure 4: Integration of climate change into country partnership work
Sources: E3G Assessment
Introduction The MDBs have a key role providing advice to member countries on economic pathways that last for decades. The MDBs have different ways of working with country governments, and their work with countries is handled by different
frameworks108. At the AsDB, for example, work with member countries is referred to as Country Partnership Strategies, at IADB this is the Country Strategies, while at the World Bank this comes under the Country Partnership Framework (CPF). This section
aims to review the extent to which MDBs have integrated both mitigation and adaptation concerns into their work with member countries. The Joint Statement
made by MDB’s in December 2017 committed these institutions to supporting countries with “development of long-term 2050 decarbonization pathways and
strategies to reach zero net emissions” 109. Thus, we will assess the extent to which MDBs are supporting countries with deep decarbonization and 2050 planning, as well as linking their support to long term resilience and adaptation plans, where available.
108 EIB and EBRD for example do not have specific documents like country frameworks guiding their work, but they do work with countries.
109 Joint IDFC-MDB Statement (2017) Together Major Development Finance Institutions Align Financial Flows with the Paris Agreement
2 9 B A N K I N G O N R E F O R M
African Development Bank (AfDB) In 2012 the Bank developed a Guidance Document for Mainstreaming Climate Change
in the Bank’s Country Strategy Papers (CSPs) and Regional Integration Strategy Paper (RISPS), which included “recommendations and guidance to ensure that, as the Bank engages in dialogue with governments on climate change issues, climate risks are taken into account”110. This document aims to be a guideline to assist climate change experts working within the country or regional teams to ensure country teams can
design improved climate-resilient strategies111. At the time of its publication in 2012, this was an advanced document among MDBs, with Bank Information Centre (BIC) and Sierra Club concluding in 2015 that “the AfDB is the only MDB with a specific
objective to mainstream climate change into Country Strategy Papers (CSPs) and Regional Integration Strategy Papers (RISPs)”112. The 2012 document was more focused on climate risk rather than mitigation, and included advice on undertaking a rapid climate risks assessment, sharing of suggestions to mitigate climate risks, and
then identifying co-finance sources for proposed investments113. The document has now been updated to take into account the Paris Agreement and its implications, including further information on identification of mitigation opportunities, in view of the long-term objective of the Paris Agreement114. Moreover, AfDB is also finalising
the design of 25 Country Climate Change Profiles, with the rest to completed soon, to provide climate change data and information per country and region115.
The AfDBs climate action plan (CCAP2)116 states that the Bank’s climate team “will use
existing Indicative Operational Plans (IOPs)” and “participate, as far as staffing resources allow, in the drafting and mid-term reviews of CSPs and RISPs going forward”. However, this is caveated in that it states that the teams will participate as
far as resources allow. The document also states that “staff in the Bank’s country offices and Regional Business Development Centres, working with RMC staff, can use
the CCAP2 M&E Framework to revise or update CSPs and RISPs in line with national/regional climate change priorities” 117.
Asian Development Bank (AsDB) AsDB’s work with member countries is referred to as Country Partnership Strategies
(CPS). AsDB’s new climate operational framework (2017) gives priority to “embedding NDCs and climate considerations in all country partnership strategies and country
operations business plans”118. It also states that AsDB “will ensure that successive generations of CPSs are supportive of a long-term transition toward low GHG
emissions and climate-resilient development paths” and that “robust diagnostics, including climate models and analyses of climate risk, and adaptation and mitigation
110 AfDB (2013) Progress report on the implementation of the Climate Change Action Plan
111 Guidance Document for Mainstreaming Climate Change in Bank’s CSPs and RISPs, 2012. Requested from AfDB directly.
112 BIC and Sierra Club (2015) MDB Climate Change Scorecard
113 Page 7, Guidance Document for Mainstreaming Climate Change in Bank’s CSPs and RISPs, 2012.
114 Version of the Guidance Document is in draft. Requested from AfDB.
115 Information received from AfDB
116 AfDB (2017) Africa Thriving and Resilient: The Bank Group’s Second Climate Change Action Plan (2016-2020)
117 AfDB (2017) Africa Thriving and Resilient: The Bank Group’s Second Climate Change Action Plan (2016-2020)
118 AsDB (2017) Climate Change Operational Framework
3 0 B A N K I N G O N R E F O R M
needs and opportunities, must underpin the CPSs”119. It also states that AsDB will continue to support countries in “gaining a better understanding of the economics of climate impact”120. For example, India’s CPS 2018-22 includes several references to achievement of NDC goals121.
Climate resilience has already been integrated to a certain extent though current guidance may be more weighted to resilience than low-carbon transitions. In 2017, AsDB issued guidance on the integration of Disaster Risk Management into the CPS, which included analysis on the likely consequences of climate change productions on climate-related hazards, stating that the DRM assessment “should consider the
impacts of climate change on natural hazards both over the typical expected life of infrastructure and also over more extended periods of 50–100 years”122.
European Bank for Reconstruction and Development (EBRD) EBRD has a strong private sector focus, thus working with countries is not such a major focus for the institution as it is for other MDBs. However, the EBRD’s Green Economy Transition (GET) approach is relevant to its work with governments since it was launched in 2015 to put investments that bring environmental benefits “at the
heart of our mandate”. In addition, the EBRD does work with governments through “policy dialogue” activities to support institutional and regulatory frameworks. The
EBRD’s GET approach refers to a deepening of the policy dialogue as well as
“continuing to deliver policy dialogue that contributes to an enabling environment for
sustainable resource investment”123. This document also refers to national action plans, as well as policy roadmaps for specific industry sectors; cement, steel, carbon capture and storage (CCS). It is not clear to what extent the roadmaps are aligned
with a long-term net zero pathway. The GET approach does not specifically mention supporting countries with long term economic planning for 2050 or deep
decarbonization pathways. The EBRD is updating its energy strategy in 2018, and it is recommended that this should be updated to take account of implementation of the Paris Agreement as well as long-term 2050 energy pathway support for countries.
European Investment Bank (EIB) The EIB, like EBRD does not have a specific country strategy framework guiding its
work with countries. However, EIB’s Climate Strategy states the EIB is involved in “lending”, “blending” and “advising”, including the sharing of substantial technical
and financial expertise124. EIB advisory services include for example “feasibility and market studies, programme structuring, energy audits, project preparation and implementation support”125. However, this does not specifically refer to advisory support toward deep decarbonization or 2050 pathways. As the world’s largest
119 AsDB (2017) Climate Change Operational Framework
120 AsDB (2017) Climate Change Operational Framework
121 AsDB (2017) India Country Partnership Strategy
122 AsDB (2017) Disaster Risk Management and Country Partnership Strategies
123 EBRD (2015) Green Economy Transition approach
124 EIB (2015) EIB Climate Strategy
125 EIB (2015) EIB Climate Strategy
3 1 B A N K I N G O N R E F O R M
multilateral borrower and lender, EIB should be improving its provision of climate-related advice to countries. The High-Level Expert Group on Sustainable Finance (HLEG) has also recommended that the EIB establish a ‘Sustainable Infrastructure Europe’ facility to expand the size and quality of the EU pipeline of sustainable assets126. The existing European Investment Advisory Hub (EIAH) is designed to act as
a single access point to various types of advisory and technical assistance services, and its sectoral coverage includes renewable energy and efficiency127. The European Parliament recently adopted a legislative report that requires the EU and its member states to reach an objective of net zero emissions by 2050 at the latest, and the Commission to put forward a carbon budget128. This demonstrates the direction of
travel needed for emissions to meet the Paris goals. EIB should be more proactive in supporting advice and technical assistance on long-term pathways to achieve net
zero emissions.
Inter-American Development Bank (IADB) IADB’s engagement with countries takes place in the Country Strategies (CS) preparation process. At IADB, this begins with a kick-off of the Country Development Challenges (CDC) document, to be followed by the Overview Paper (OP). Next, the
Sector Notes are prepared which are then validated by the Strategic Planning and Development Effectiveness (SPD). Finally, the CS will be submitted to the Board. The
IADB has developed a comprehensive process for ensuring that climate is integrated
into the CS work. This includes mainstreaming of climate change in the CS and
strategic dialogue work129. The guidelines state that cross-cutting issues such as gender and climate change “must be taken into account in the analyses prepared and the relevant recommendations, as well as in the strategic objectives agreed upon in
the CS”130. IADB’s climate change action plan also notes that whenever it is pertinent and agreed with the government, climate change-related indicators will be included in
the CS results matrices131. The NDC Invest Platform is a key part of this work, acting as a one-stop shop for countries to access resources for transforming their national commitments into achievable investments plans132. IADB research has indicated that the national and multilateral development banks (MDBs) can have a critical role in
helping governments translate NDCs into tangible investment objectives and develop an appropriate investment framework133. The NDC Invest package offer countries a
comprehensive package of resources to implement NDCs which can be accessed in parallel or as modules depending on country-specific needs and context134.
126 https://ec.europa.eu/info/publications/180131-sustainable-finance-report_en
127 http://eiah.eib.org/about/sectors.htm
128 http://www.europarl.europa.eu/sides/getDoc.do?pubRef=-%2f%2fEP%2f%2fTEXT%2bTA%2bP8-TA-2018-0011%2b0%2bDOC%2bXML%2bV0%2f%2fEN&language=EN
129 IADB presentation at World Bank Annual Meetings, Oct 2017
130 Information received from IADB.
131 IADB (to be published). IDBG Climate Change Action Plan 2016-2020.
132 https://www.ndcinvest.org/
133 IADB (2017) Supporting National Development Banks to Drive Investment in the Nationally Determined Contributions of Brazil, Mexico and Chile.
134 IADB (2017) Supporting National Development Banks to Drive Investment in the Nationally Determined Contributions of Brazil, Mexico and Chile.
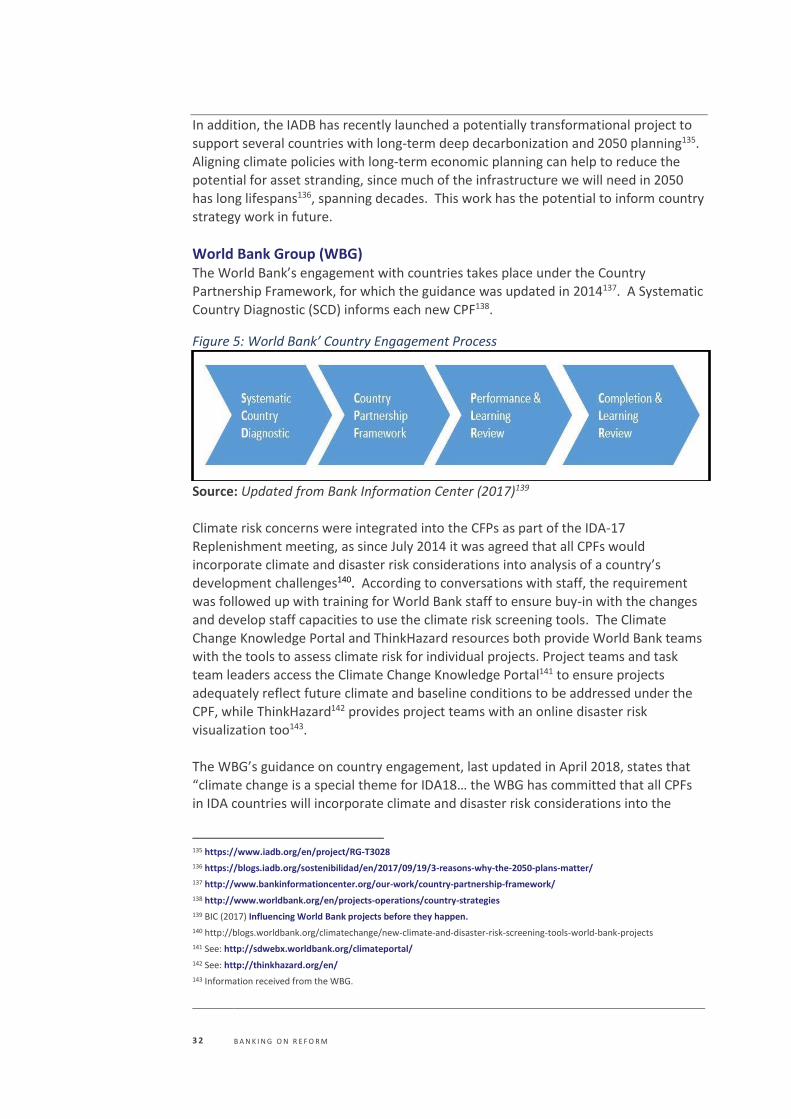
3 2 B A N K I N G O N R E F O R M
In addition, the IADB has recently launched a potentially transformational project to support several countries with long-term deep decarbonization and 2050 planning135. Aligning climate policies with long-term economic planning can help to reduce the potential for asset stranding, since much of the infrastructure we will need in 2050 has long lifespans136, spanning decades. This work has the potential to inform country
strategy work in future.
World Bank Group (WBG) The World Bank’s engagement with countries takes place under the Country Partnership Framework, for which the guidance was updated in 2014137. A Systematic
Country Diagnostic (SCD) informs each new CPF138.
Figure 5: World Bank’ Country Engagement Process
Source: Updated from Bank Information Center (2017)139
Climate risk concerns were integrated into the CFPs as part of the IDA-17 Replenishment meeting, as since July 2014 it was agreed that all CPFs would
incorporate climate and disaster risk considerations into analysis of a country’s development challenges140. According to conversations with staff, the requirement was followed up with training for World Bank staff to ensure buy-in with the changes
and develop staff capacities to use the climate risk screening tools. The Climate Change Knowledge Portal and ThinkHazard resources both provide World Bank teams
with the tools to assess climate risk for individual projects. Project teams and task team leaders access the Climate Change Knowledge Portal141 to ensure projects adequately reflect future climate and baseline conditions to be addressed under the
CPF, while ThinkHazard142 provides project teams with an online disaster risk
visualization too143.
The WBG’s guidance on country engagement, last updated in April 2018, states that “climate change is a special theme for IDA18… the WBG has committed that all CPFs
in IDA countries will incorporate climate and disaster risk considerations into the
135 https://www.iadb.org/en/project/RG-T3028
136 https://blogs.iadb.org/sostenibilidad/en/2017/09/19/3-reasons-why-the-2050-plans-matter/
137 http://www.bankinformationcenter.org/our-work/country-partnership-framework/
138 http://www.worldbank.org/en/projects-operations/country-strategies
139 BIC (2017) Influencing World Bank projects before they happen.
140 http://blogs.worldbank.org/climatechange/new-climate-and-disaster-risk-screening-tools-world-bank-projects
141 See: http://sdwebx.worldbank.org/climateportal/
142 See: http://thinkhazard.org/en/
143 Information received from the WBG.
3 3 B A N K I N G O N R E F O R M
analysis of the country’s development challenges and priorities and, when the country agrees, in the content of the programs and results framework”144. As for AsDB, focus is more weighted to climate risk concerns (adaptation) than low-carbon development (mitigation). The SCD guidance, updated in 2016, states that the SCD “takes into account climate change, which may directly influence economic growth, poverty
reduction, and longer-term sustainability of these trends”145. On adaptation, the SCD analysis covers “both climate-related risks and policy choices, including the potential benefits of taking early adaptation actions” whilst on emissions reduction policies, the “SCD is expected to assess the impacts of the policies that countries indicate through their NDCs… on growth and poverty objectives”146. However, the document does not
explicitly state that the SCD will assist countries with decisions on long-term planning, policy guidance or advice on implementation of NDCs. The World Bank has recently
confirmed that it will be taking part in the new Global 2050 Pathways Platform initiative sponsored by the European Climate Foundation to keep them informed of modelling work and how countries are actively exploring how to achieve zero-net carbon emissions in the latter half of this century147. WBG staff have noted that this information is fed back to relevant country and task teams as it comes available,
which could be potentially transformational in terms of considering long-term
scenarios when this is implemented. The WBG has reported that they are set to launch a dialogue on this topic148.
Summary Among the MDBs, the IADB has initiated a programme to support member countries with long term economic planning for 2050 to reach net zero emissions, while the WBG is now set to engage in the 2050 pathways platform. The AsDB has committed
recently to ensuring that its CPS are supportive of a long-term transition toward low GHG emissions and resilience, including robust diagnostics. However, the guidance
has only been issued recently so its implementation is not fully actioned. AfDB has recently updated its guidance for country partnership strategies. However, it is notable that across all MDBs, much of the guidance has been updated recently, and further research is required on implementation of the guidance in practice. In terms
of EIB and EBRD, both of these MDBs are classified as ‘N/A’ for this metric since these banks do not have a specific workstream on ‘country partnerships’, and the EBRD in
particular has more of a private-sector focus. We recommend that all of MDBs begin to support client countries with long term planning for 2050 and integrate this into their work.
144 World Bank (2018) Guidance on Country Engagement
145 World Bank (2016) Systematic Country Diagnostic.
146 Ibid
147 Information received directly from WBG staff.
148 Information received directly from WBG staff. Comments at Civil Society Policy Forum Panel Event, 18th April 2018.
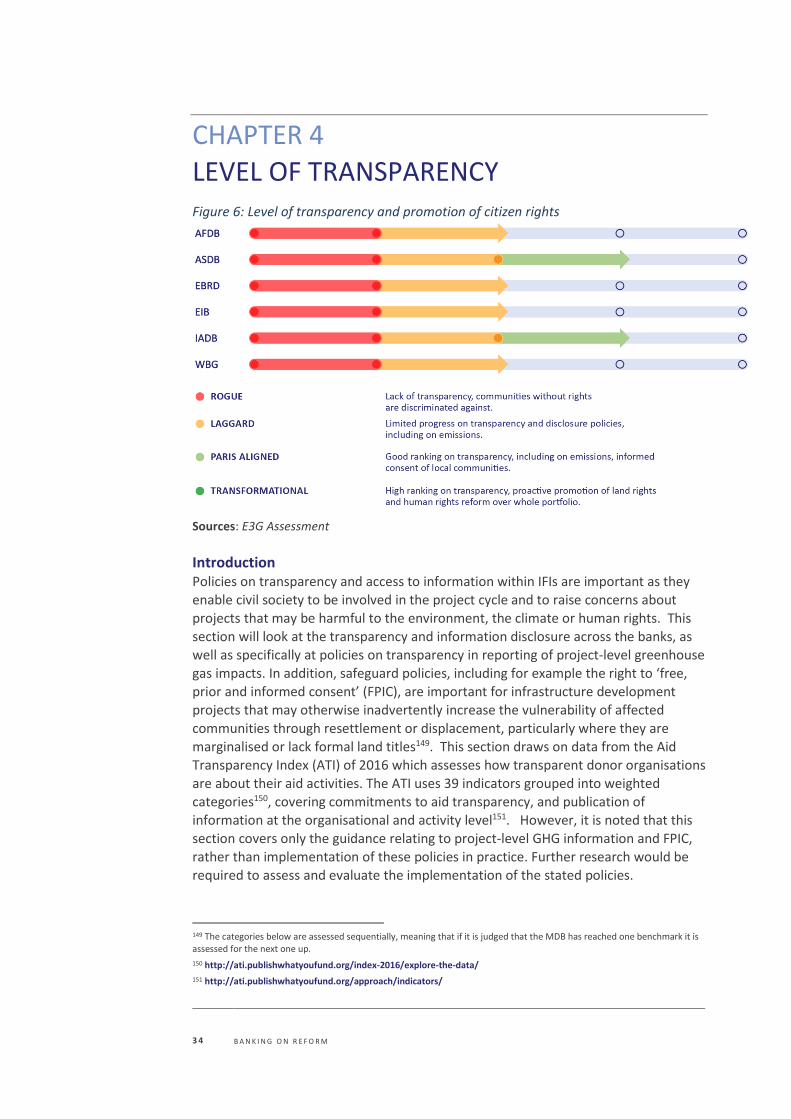
3 4 B A N K I N G O N R E F O R M
CHAPTER 4
LEVEL OF TRANSPARENCY Figure 6: Level of transparency and promotion of citizen rights
Sources: E3G Assessment
Introduction Policies on transparency and access to information within IFIs are important as they
enable civil society to be involved in the project cycle and to raise concerns about projects that may be harmful to the environment, the climate or human rights. This
section will look at the transparency and information disclosure across the banks, as well as specifically at policies on transparency in reporting of project-level greenhouse gas impacts. In addition, safeguard policies, including for example the right to ‘free,
prior and informed consent’ (FPIC), are important for infrastructure development projects that may otherwise inadvertently increase the vulnerability of affected
communities through resettlement or displacement, particularly where they are marginalised or lack formal land titles149. This section draws on data from the Aid Transparency Index (ATI) of 2016 which assesses how transparent donor organisations
are about their aid activities. The ATI uses 39 indicators grouped into weighted categories150, covering commitments to aid transparency, and publication of
information at the organisational and activity level151. However, it is noted that this section covers only the guidance relating to project-level GHG information and FPIC, rather than implementation of these policies in practice. Further research would be
required to assess and evaluate the implementation of the stated policies.
149 The categories below are assessed sequentially, meaning that if it is judged that the MDB has reached one benchmark it is assessed for the next one up.
150 http://ati.publishwhatyoufund.org/index-2016/explore-the-data/
151 http://ati.publishwhatyoufund.org/approach/indicators/
3 5 B A N K I N G O N R E F O R M
African Development Bank (AfDB) The AfDB is ranked as ‘very good’ according to the Aid Transparency Index (ATI)152.
The AfDB also requires timely disclosure of documents in its access to information policy153. AfDB’s safeguard system also states that “it is fundamental that stakeholder engagement and consultation during the ESIA process is meaningful (i.e. free, prior and informed)”154. In terms of transparency of GHG information, the AfDB has committed to report ex-ante on GHG emissions (gross and net) in project
documentation in future155. However, this is expected to take place after the piloting of the AfDB’s greenhouse gas emission tracking tool156. It is not clear when the pilot will be completed.
Asian Development Bank (AsDB) Ranking of accessibility practices by Bankwatch across four MDBs (AsDB, EBRD, EIB and WBG) indicated that AsDB scores highly against the 12 transparency criteria covered in their assessment, followed by EIB and WBG, then EBRD, with new Asian Infrastructure Investment Bank coming last157. The same report argues that providing
the public with access to information is a cornerstone of accountability and transparency158. AsDB is also ranked as ‘very good’ according to the Aid Transparency
Index159. In terms of safeguards for indigenous peoples, the AsDB Safeguard Policy Statement of 2009 contains safeguard requirements for Indigenous Peoples as well as
containing the principles and process of the Free, Prior and Informed Consent
(FPIC)160. AsDB also provides time-bound disclosure and is the best among MDBs for
this - with a 120-day disclosure rule for high risk Cat A projects161.
In terms of transparency of GHG information, the new AsDB guidelines on estimating GHG emissions states that the project classification system requires that carbon dioxide (CO2) emission reduction estimates are an integral part of the concept papers
and the Reports and Recommendations of the President (RRPs)162. AsDB is also the only MDB that publishes its climate change projects and related documents in
detail163. This provision of transparent climate finance data as an example of leadership among the group. However, on overall support for human rights and land rights, the AsDB has been subject to concerns from civil society groups in relation to
engaging in land tenure reform without adequate consultation164 as well as in relation
152 http://ati.publishwhatyoufund.org/index-2016/explore-the-data/
153 AfDB (2013) Disclosure and Access to Information: Staff Handbook
154 AfDB (2015) Integrated Safeguard System
155 AfDB (2016) Results Measurement Framework 2016-2025
156 Climate Investment Funds (2017) Greenhouse Gas Analysis and Harmonization of Methodology.
157 https://bankwatch.org/is-it-accessible
158 https://bankwatch.org/is-it-accessible
159 http://ati.publishwhatyoufund.org/index-2016/explore-the-data/
160 Forest Peoples Programme (2013) We Have Rights
161 AsDB (2009) Safeguard Policy Statement
162 AsDB (2017) Guidelines for Estimating Greenhouse Gas Emissions for Asian Development Bank projects Further research would be needed to review to what extent this is being implemented.
163 See: https://www.adb.org/news/adb-launches-climate-financing-database
164 http://www.pireport.org/articles/2016/09/06/asian-development-bank-failed-consult-samoan-public-about-land-reforms
3 6 B A N K I N G O N R E F O R M
to changes to public access to information policies165, therefore AsDB does not achieve the transformational benchmark.
European Bank for Reconstruction and Development (EBRD) The EBRD is ranked as ‘fair’ according to the Aid Transparency Index166. The latest ATI assessment has found that sub-national locations, evaluations, contracts, results and impact appraisals are not consistently published167, and recommends that EBRD
improve the quality of its publication to the International Aid Transparency Initiative (IATI) Registry. A recent assessment by Bankwatch found the EBRD was lacking as it does not have a public information request registry, and neither does it endorse the
right to information as a human right168. In terms of indigenous peoples, the EBRD fares better, as its policy includes a Performance Requirement (PR 7) which recognises the right to free, prior and informed consent169 170. According to the EBRD’s Public Information Policy (2014), each project has a Project Summary Document (PSD) which
summarises a description of the main environmental and social issues associated with the project; key measures agreed to mitigate the risks and impacts; and the expected GHG emissions of the project, where these are greater than 25,000t CO2 equivalent/year threshold171. Each PSD must be released to the public domain 60 days
before Board consideration for public sector projects and 30 days before for private sector projects172.
European Investment Bank (EIB) The EIB is ranked as ‘fair’ according to the Aid Transparency Index173. The latest assessment by the ATI has found that items such as activity budgets, country
strategies, sub-national locations, evaluations and impact appraisals are not consistently published174. It is noted that EIB is committed to regularly publish accurate information regarding its role, policies and operations in a “timely
fashion”175, and that EIB has a public registry for information requests176. The EIB does recognize the principle of FPIC, both in the Environmental and Social Standards
(ESS) 7, on the Rights and Interests of Vulnerable Groups, as well as in ESS 10 on Stakeholder Engagement177. In addition, the EIB is a EU institution and is as such bound by the EU Charter on Human Rights and is a signatory to the Aarhus
Convention. In terms of transparency of GHG impacts for projects, every operation that goes to the EIB Board has an Environmental and Social Data Sheet (ESDS) which is
165 https://www.forestpeoples.org/en/responsible-finance-public-sector-asian-development-bank-adb/news-article/2018/appeal-protections
166 http://ati.publishwhatyoufund.org/index-2016/explore-the-data/
167 http://ati.publishwhatyoufund.org/donor/ebrd/
168 https://bankwatch.org/is-it-accessible
169 World Bank (2015) Comparative Review of Multilateral Development Bank Safeguard Systems
170 IPACC (2012) An Assessment by the CSO Coalition on the AfDB
171 http://www.ebrd.com/what-we-do/strategies-and-policies/public-information-policy.html
172 EBRD Public Information Policy
173 See: http://ati.publishwhatyoufund.org/index-2016/explore-the-data/
174 See: http://ati.publishwhatyoufund.org/donor/eib/
175 EIB (2015) Transparency Policy
176 http://www.eib.org/infocentre/registers/index.htm
177 World Bank (2015) Comparative Review of Multilateral Development Bank Safeguard Systems
3 7 B A N K I N G O N R E F O R M
publicly available178. For operations crossing the EIB’s GHG thresholds, the emissions are included in the ESDS179. Like EBRD, EIB receives a ranking of laggard due to the ‘fair’ ranking according to the Aid Transparency Index180.
Inter-American Development Bank (IADB) The IADB is ranked as ‘very good’ according to the Aid Transparency Index181. IADB also requires that affected indigenous peoples give their informed consent to the
resettlement and compensation measures182. Since 2006, the Bank’s Environment and Safeguards Compliance Policy mandates calculation and reporting of GHG emissions for operations that are expected to produce significant amounts of them183. A review
of such documents found that the figures are often available in the projects’ Environmental and Social Management Report (ESMR). However, in terms of overall support for the human rights and land rights in the region, a broad cross-section of groups recently called on the IADB to include human rights and participatory
development as a focus for any regional development plans, noting that IADB lending has gone to banks which have in turn financed companies linked to land-grabbing184. Thus, it does not reach the ‘transformational’ rating.
Box 1: Carbon Disclosure Project (CDP) & Staff Incentives at the World Bank The World Bank is the only MDB within this study that discloses its Scope 1 & 2 emissions to the CDP, along with other operational information regarding climate change. For the World Bank, the next step is portfolio level emission reporting to the CDP, an achievable ask considering the Bank has now committed to reporting project greenhouse gas emissions185. Other banks should strive to match this step, as a greater number of banks reporting will allow better comparisons and benchmarking to be conducted. Within its disclosure the World Bank reported it provided staff incentives linked to climate finance186. The aim being to encourage staff at all levels to actively strive to increase finance to climate related projects. The two incentives provided are:
• Vice-Presidential Unit (VPU) Team Awards program provides meaningful recognition for outstanding team achievements with a monetary award ranges between $400-$2,000.
• Specific mitigation and adaptation targets are linked to IFC Director level scorecards. Meeting the targets increases the bonus pool available for staff performance rewards.
The impact of these incentives in encouraging staff to mainstream climate change into projects and procedures in unclear. However, it is a method that all MDB’s could use to encourage a
greater focus upon climate related finance within each bank.
178 Information received from EIB.
179 See the section on GHG reporting for more information on the thresholds.
180 http://ati.publishwhatyoufund.org/index-2016/explore-the-data/
181 http://ati.publishwhatyoufund.org/index-2016/explore-the-data/
182 https://www.iadb.org/en/about-us/involuntary-reSETtlement%2C6660.html
183 IADB (2012) Greenhouse Gas Assessment Emissions Methodology
184 http://www.ciel.org/news/organizations-call-iadb-include-human-rights-participatory-development-focus-regional-development-plans/
185 http://www.worldbank.org/en/news/press-release/2017/12/12/world-bank-group-announcements-at-one-planet-summit
186 CDP (2017) World Bank CDP response for 2017
3 8 B A N K I N G O N R E F O R M
World Bank Group (WBG) In the WBG, IDA is ranked as ‘very good’ in the Aid Transparency Index, however, the
IFC is ranked as ‘poor’187. The 2016 assessment of IFC found that at the activity level, information such as collaboration type, flow type, tied aid status, budget documents, contracts, disbursements and expenditure are not published at all188, and it was recommended that the IFC start to publish information in the IATI Standard. A recent assessment by Bankwatch found that the WBG does provide time-bound disclosure of
documents with the Environment Assessment for projects required to be published at least 60 days prior to the Board decision for high risk projects. However, the WBG was falling short in not endorsing the right to information as a human right189. A World
Bank consultancy report from 2015, which compared the safeguard policies across MDBs, found that WBG, unlike other MDBs, does not have the same set of safeguard requirements applied to both public and private sector lending, and provided only limited clarity when it came to responsibilities between the Bank and its borrowers190.
Among the MDBs, the WBG appears to have been rather slow in implementing the principle of ‘free, prior and informed consent (FPIC)’ for indigenous communities191, and while the principle has now been introduced192, there were concerns the World
Bank restricted the situations in which FPIC is required193. The new Environmental and Social Framework which incorporates the FPIC principle will be launched in 2018194. In
terms of transparency of GHG information, WBG recently announced that starting
next year, it will report GHG emissions from projects it finances in key emissions-
producing sectors, such as energy195. Under the WBG’s new Environment and Social Framework, project level gross GHG emissions will be estimated196, and this information will be disclosed by Borrowers as part of the Borrower’s environmental
and social assessment197.
Summary The table below categorises the progress in the section above against three specific
criteria for which there was information for all MDBs: transparency and information disclosure, recognition of the FPIC principle, and policies on transparency in reporting
187 http://ati.publishwhatyoufund.org/index-2016/explore-the-data/
188 See: http://ati.publishwhatyoufund.org/donor/world-bankifc/
189 https://bankwatch.org/is-it-accessible
190 World Bank (2015) Comparative Review of Multilateral Development Bank Safeguard Systems
191 Forest Peoples Programme (2013) Experience of Asian indigenous peoples with the finance lending policies of IFIs.
192 http://www.worldbank.org/en/news/press-release/2015/08/04/world-bank-board-committee-authorizes-release-of-revised-draft-environmental-and-social-framework
193 http://www.bankinformationcenter.org/the-world-bank-just-passed-a-new-safeguards-policy-why-does-this-matter-for-forests-and-indigenous-people/
194 See: http://www.worldbank.org/en/programs/environmental-and-social-policies-for-projects/brief/the-environmental-and-social-framework-esf
195 http://www.worldbank.org/en/news/press-release/2017/12/12/world-bank-group-announcements-at-one-planet-summit
196 See: http://www.worldbank.org/en/programs/environmental-and-social-policies-for-projects/brief/the-environmental-and-social-framework-esf The framework is to be launched in 2018.
197 Response from the WBG ESF team. As noted above, however, this section covers the stated policies on transparency rather than implementation. Further research is required on implementation of the policies including on disclosure of GHG data.
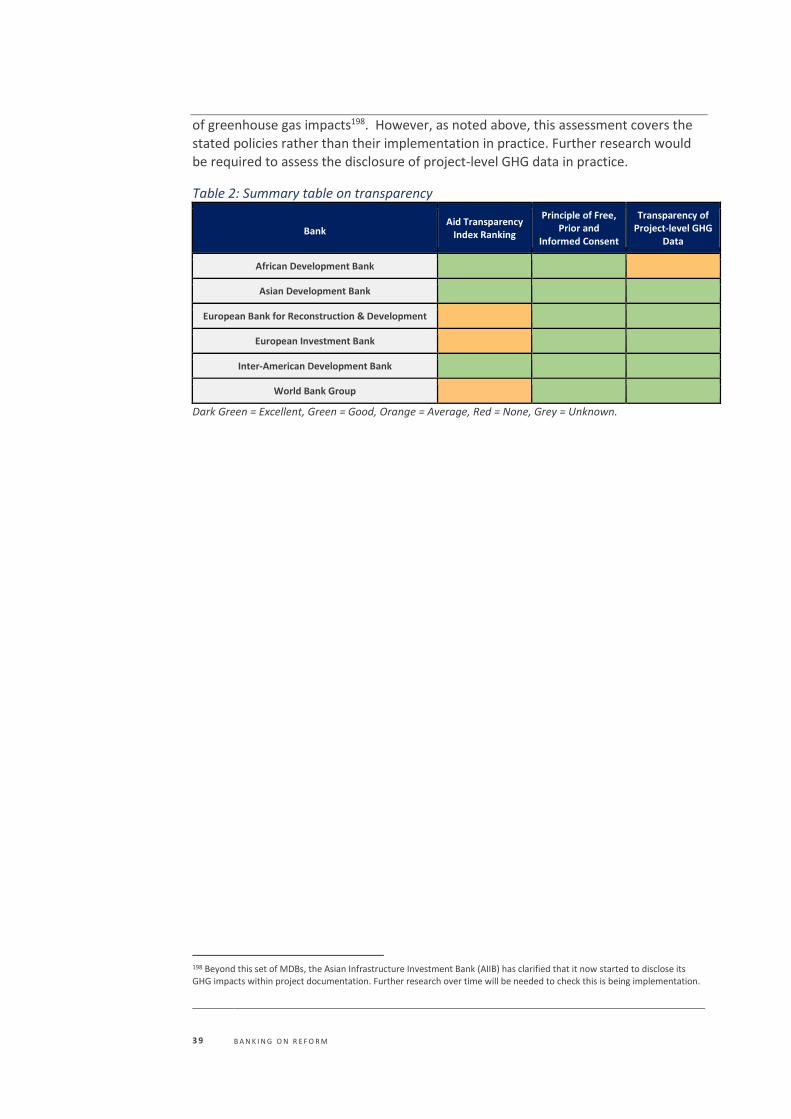
3 9 B A N K I N G O N R E F O R M
of greenhouse gas impacts198. However, as noted above, this assessment covers the stated policies rather than their implementation in practice. Further research would be required to assess the disclosure of project-level GHG data in practice.
Table 2: Summary table on transparency
Bank Aid Transparency
Index Ranking
Principle of Free, Prior and
Informed Consent
Transparency of Project-level GHG
Data
African Development Bank
Asian Development Bank
European Bank for Reconstruction & Development
European Investment Bank
Inter-American Development Bank
World Bank Group
Dark Green = Excellent, Green = Good, Orange = Average, Red = None, Grey = Unknown.
198 Beyond this set of MDBs, the Asian Infrastructure Investment Bank (AIIB) has clarified that it now started to disclose its GHG impacts within project documentation. Further research over time will be needed to check this is being implementation.
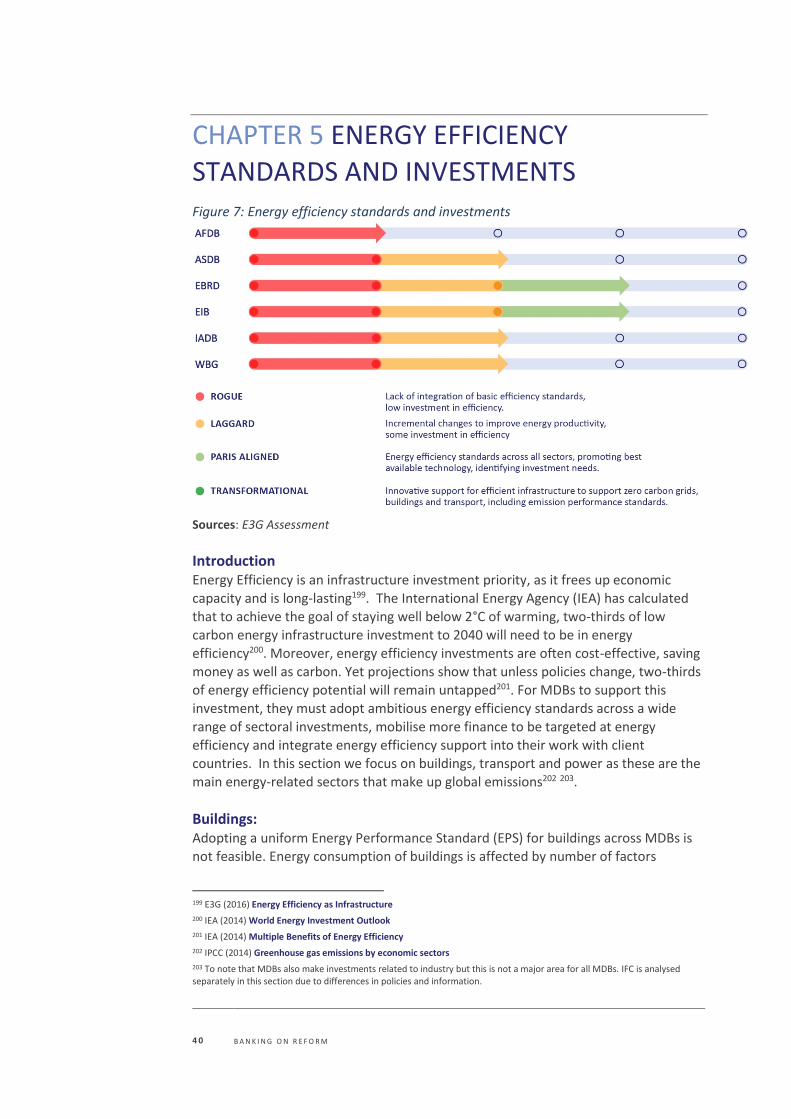
4 0 B A N K I N G O N R E F O R M
CHAPTER 5 ENERGY EFFICIENCY
STANDARDS AND INVESTMENTS Figure 7: Energy efficiency standards and investments
Sources: E3G Assessment
Introduction Energy Efficiency is an infrastructure investment priority, as it frees up economic capacity and is long-lasting199. The International Energy Agency (IEA) has calculated
that to achieve the goal of staying well below 2°C of warming, two-thirds of low carbon energy infrastructure investment to 2040 will need to be in energy efficiency200. Moreover, energy efficiency investments are often cost-effective, saving
money as well as carbon. Yet projections show that unless policies change, two-thirds of energy efficiency potential will remain untapped201. For MDBs to support this investment, they must adopt ambitious energy efficiency standards across a wide
range of sectoral investments, mobilise more finance to be targeted at energy efficiency and integrate energy efficiency support into their work with client
countries. In this section we focus on buildings, transport and power as these are the main energy-related sectors that make up global emissions202 203.
Buildings: Adopting a uniform Energy Performance Standard (EPS) for buildings across MDBs is not feasible. Energy consumption of buildings is affected by number of factors
199 E3G (2016) Energy Efficiency as Infrastructure
200 IEA (2014) World Energy Investment Outlook
201 IEA (2014) Multiple Benefits of Energy Efficiency
202 IPCC (2014) Greenhouse gas emissions by economic sectors
203 To note that MDBs also make investments related to industry but this is not a major area for all MDBs. IFC is analysed separately in this section due to differences in policies and information.
4 1 B A N K I N G O N R E F O R M
including climate, energy prices and building function204. Furthermore, energy efficiency can be influenced through building design, through retrofitting and maintenance improvements. MDBs will need to apply energy efficiency standards that are suitable for the region in which they are operating. Analysis shows that to reach the 1.5°C target205, buildings built after 2020 for OECD countries and after 2025 for
non-OECD countries must be zero carbon. Building renovation rates must increase from less than 1% per annum currently to 5% by 2020 for OECD countries and 3% in non-OECD countries206. Each retrofit must achieve a 90% direct emissions reduction.
Box 2: EDGE - Green Buildings Software (Certification for Green Buildings) The IFC has developed EDGE, an online platform that allows design teams to estimate the efficiency of a building and determine the financial viability of a green building project at the early design stage. EDGE defines “a green building as one that is projected to reduce the consumption of energy and water by at least 20%, as well as the energy used to make the construction materials”207. The tool provides a set of technical solutions that reduce energy and water consumption by calculating upfront costs and potential operational savings. Expected outcome: The aim is to green 20% of the new buildings being built within seven years in rapidly urbanizing countries208. IFC has decided the 20% efficiency improvement separated business-as-usual improvements from a serious commitment to building efficiency209. On the residential side alone, the results would equate to 1.3 million green homes and a reduction of a million tons of CO2 emissions per year. Transformational aspect: Buildings use 40% of global energy and resources, and account for more than 30% of total global emissions210. EDGE provides a no cost assessment tool, which can help broaden uptake of green buildings. It helps to introduce standards “voluntarily” by incentivising the market and developers to use this tool to differentiate themselves, whilst building up a dataset that can be used by banks to provide green mortgages. The information could also inform government efforts to revamp their codes and standards211. IFC now has a partnership with Architecture2030 to support the architecture and building community in design of Zero Net Carbon (ZNC) buildings212. ESMAP has helped bring the program to scale – EDGE certification has been implemented by development banks such as Germany’s KfW, the UK’s CDC, and EDGE-certified buildings are eligible under the Climate Bonds Initiative213. IADB has used EDGE to certify the Ministry of Education of Buenos Aires and is starting the process to use this certification for the refurbishment of the Vitoria (Brazil) town hall214.
Transport: MDBs have committed to providing technical and financial support for low carbon transport and pledged to invest $175bn in loans and grants over 10 years for
204 World Bank (2014) Improving Energy Efficiency in Buildings
205 CAT (2016) The Ten Most Important Short-Term Steps To Limit Warming To 1.5c
206 Boermans, Bettgenhäuser, Offermann, & Schimschar, 2012; cited by CAT (2016) THE TEN MOST IMPORTANT SHORT-TERM STEPS TO LIMIT WARMING TO 1.5C
207 See https://www.edgebuildings.com/
208 See https://www.edgebuildings.com/
209 Data provided by IFC.
210 http://www.ifc.org/wps/wcm/connect/news_ext_content/ifc_external_corporate_site/news+and+events/news/on+the+edge+of+transformation
211 https://www.ifc.org/wps/wcm/connect/047090004060e0a994369682455ae521/EDGE+Presentation.pdf?MOD=AJPERES
212 See: http://architecture2030.org/on-the-edge-of-a-global-transformation/
213 See: https://esmap.org/node/66798
214 Information received directly from IADB
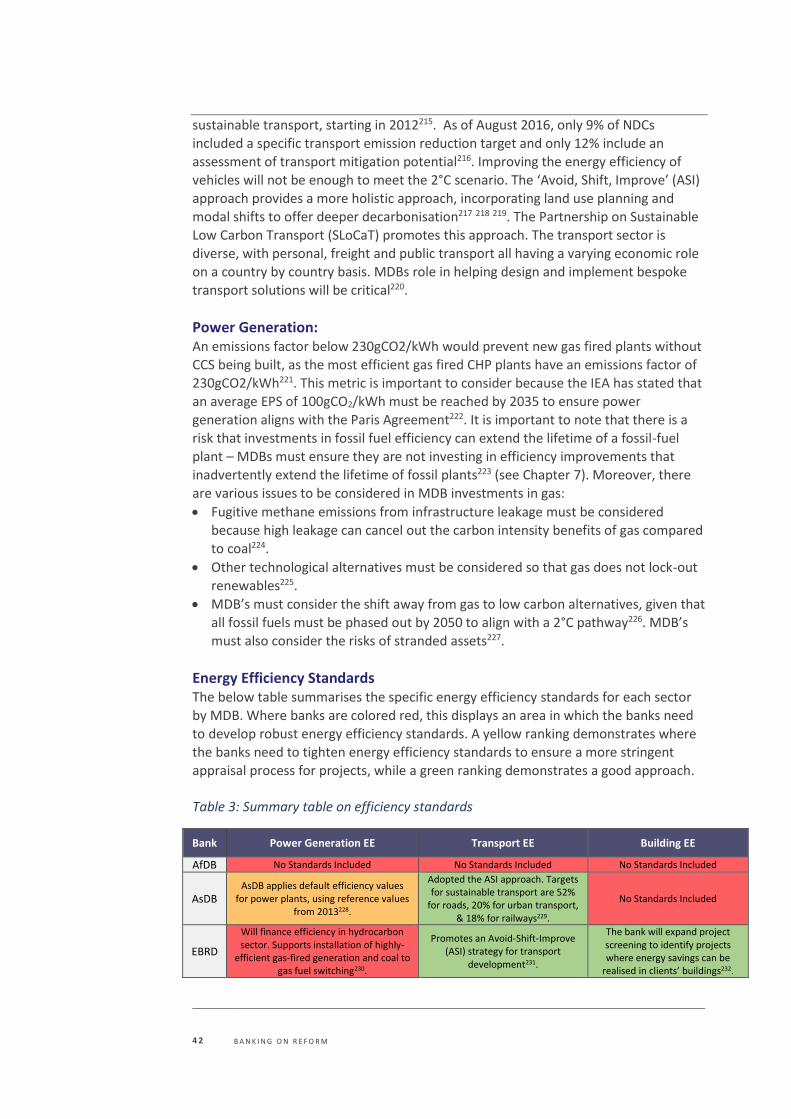
4 2 B A N K I N G O N R E F O R M
sustainable transport, starting in 2012215. As of August 2016, only 9% of NDCs included a specific transport emission reduction target and only 12% include an assessment of transport mitigation potential216. Improving the energy efficiency of vehicles will not be enough to meet the 2°C scenario. The ‘Avoid, Shift, Improve’ (ASI) approach provides a more holistic approach, incorporating land use planning and
modal shifts to offer deeper decarbonisation217 218 219. The Partnership on Sustainable Low Carbon Transport (SLoCaT) promotes this approach. The transport sector is diverse, with personal, freight and public transport all having a varying economic role on a country by country basis. MDBs role in helping design and implement bespoke transport solutions will be critical220.
Power Generation: An emissions factor below 230gCO2/kWh would prevent new gas fired plants without CCS being built, as the most efficient gas fired CHP plants have an emissions factor of
230gCO2/kWh221. This metric is important to consider because the IEA has stated that an average EPS of 100gCO2/kWh must be reached by 2035 to ensure power generation aligns with the Paris Agreement222. It is important to note that there is a risk that investments in fossil fuel efficiency can extend the lifetime of a fossil-fuel
plant – MDBs must ensure they are not investing in efficiency improvements that inadvertently extend the lifetime of fossil plants223 (see Chapter 7). Moreover, there
are various issues to be considered in MDB investments in gas:
• Fugitive methane emissions from infrastructure leakage must be considered because high leakage can cancel out the carbon intensity benefits of gas compared to coal224.
• Other technological alternatives must be considered so that gas does not lock-out
renewables225.
• MDB’s must consider the shift away from gas to low carbon alternatives, given that all fossil fuels must be phased out by 2050 to align with a 2°C pathway226. MDB’s
must also consider the risks of stranded assets227.
Energy Efficiency Standards The below table summarises the specific energy efficiency standards for each sector
by MDB. Where banks are colored red, this displays an area in which the banks need to develop robust energy efficiency standards. A yellow ranking demonstrates where
the banks need to tighten energy efficiency standards to ensure a more stringent appraisal process for projects, while a green ranking demonstrates a good approach. Table 3: Summary table on efficiency standards
Bank Power Generation EE Transport EE Building EE
AfDB No Standards Included No Standards Included No Standards Included
AsDB AsDB applies default efficiency values
for power plants, using reference values from 2013228.
Adopted the ASI approach. Targets for sustainable transport are 52%
for roads, 20% for urban transport, & 18% for railways229.
No Standards Included
EBRD
Will finance efficiency in hydrocarbon sector. Supports installation of highly-
efficient gas-fired generation and coal to gas fuel switching230.
Promotes an Avoid-Shift-Improve (ASI) strategy for transport
development231.
The bank will expand project screening to identify projects where energy savings can be
realised in clients’ buildings232.
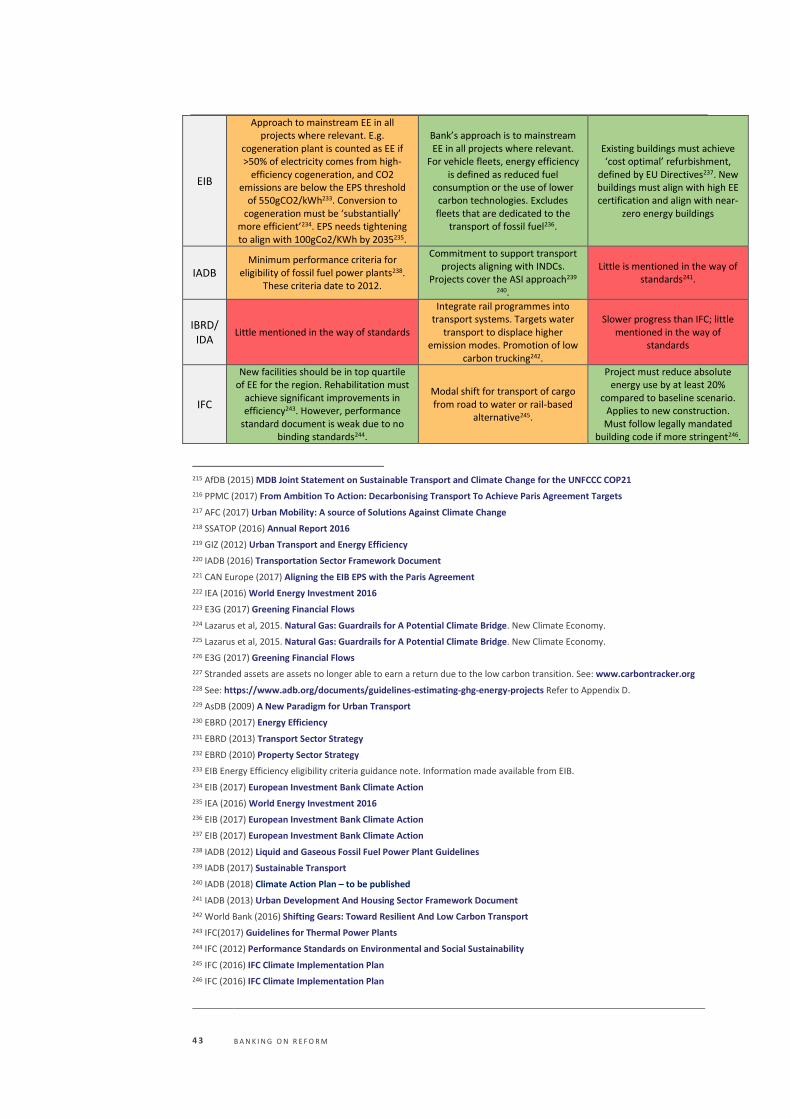
4 3 B A N K I N G O N R E F O R M
215 AfDB (2015) MDB Joint Statement on Sustainable Transport and Climate Change for the UNFCCC COP21
216 PPMC (2017) From Ambition To Action: Decarbonising Transport To Achieve Paris Agreement Targets
217 AFC (2017) Urban Mobility: A source of Solutions Against Climate Change
218 SSATOP (2016) Annual Report 2016
219 GIZ (2012) Urban Transport and Energy Efficiency
220 IADB (2016) Transportation Sector Framework Document
221 CAN Europe (2017) Aligning the EIB EPS with the Paris Agreement
222 IEA (2016) World Energy Investment 2016
223 E3G (2017) Greening Financial Flows
224 Lazarus et al, 2015. Natural Gas: Guardrails for A Potential Climate Bridge. New Climate Economy.
225 Lazarus et al, 2015. Natural Gas: Guardrails for A Potential Climate Bridge. New Climate Economy.
226 E3G (2017) Greening Financial Flows
227 Stranded assets are assets no longer able to earn a return due to the low carbon transition. See: www.carbontracker.org
228 See: https://www.adb.org/documents/guidelines-estimating-ghg-energy-projects Refer to Appendix D.
229 AsDB (2009) A New Paradigm for Urban Transport
230 EBRD (2017) Energy Efficiency
231 EBRD (2013) Transport Sector Strategy
232 EBRD (2010) Property Sector Strategy
233 EIB Energy Efficiency eligibility criteria guidance note. Information made available from EIB.
234 EIB (2017) European Investment Bank Climate Action
235 IEA (2016) World Energy Investment 2016
236 EIB (2017) European Investment Bank Climate Action
237 EIB (2017) European Investment Bank Climate Action
238 IADB (2012) Liquid and Gaseous Fossil Fuel Power Plant Guidelines
239 IADB (2017) Sustainable Transport
240 IADB (2018) Climate Action Plan – to be published
241 IADB (2013) Urban Development And Housing Sector Framework Document
242 World Bank (2016) Shifting Gears: Toward Resilient And Low Carbon Transport
243 IFC(2017) Guidelines for Thermal Power Plants
244 IFC (2012) Performance Standards on Environmental and Social Sustainability
245 IFC (2016) IFC Climate Implementation Plan
246 IFC (2016) IFC Climate Implementation Plan
EIB
Approach to mainstream EE in all projects where relevant. E.g.
cogeneration plant is counted as EE if >50% of electricity comes from high-
efficiency cogeneration, and CO2 emissions are below the EPS threshold
of 550gCO2/kWh233. Conversion to cogeneration must be ‘substantially’
more efficient’234. EPS needs tightening to align with 100gCo2/KWh by 2035235.
Bank’s approach is to mainstream EE in all projects where relevant.
For vehicle fleets, energy efficiency is defined as reduced fuel
consumption or the use of lower carbon technologies. Excludes fleets that are dedicated to the
transport of fossil fuel236.
Existing buildings must achieve ‘cost optimal’ refurbishment,
defined by EU Directives237. New buildings must align with high EE certification and align with near-
zero energy buildings
IADB Minimum performance criteria for
eligibility of fossil fuel power plants238. These criteria date to 2012.
Commitment to support transport projects aligning with INDCs.
Projects cover the ASI approach239 240.
Little is mentioned in the way of standards241.
IBRD/ IDA
Little mentioned in the way of standards
Integrate rail programmes into transport systems. Targets water
transport to displace higher emission modes. Promotion of low
carbon trucking242.
Slower progress than IFC; little mentioned in the way of
standards
IFC
New facilities should be in top quartile of EE for the region. Rehabilitation must
achieve significant improvements in efficiency243. However, performance
standard document is weak due to no binding standards244.
Modal shift for transport of cargo from road to water or rail-based
alternative245.
Project must reduce absolute energy use by at least 20%
compared to baseline scenario. Applies to new construction. Must follow legally mandated
building code if more stringent246.
4 4 B A N K I N G O N R E F O R M
Dark Green = Excellent, Green = Good, Orange = Average, Red = None, Grey = Unknown.
In addition to the broad sectoral standards mentioned above, some of the MDBs have developed definitions for investments which are classified as ‘energy efficiency’ investments. For example, the EIB states that in order to qualify for the energy efficiency label a project should reduce energy consumption significantly, i.e. “at least 20% compared to the situation before the project was implemented”247. It also states that EIB aims to support the ambitious goal set by the European Council on energy efficiency through specific actions, and for projects with a significant contribution to energy efficiency “the Bank will propose increasing its customary financing up to 75% of project cost”248. Separately the EIB has determined that to be eligible for funding the investment must be economically viable, in terms words, the Net Present Value (including externalities) of energy saved has to be greater than the Net Present Cost “over its life considering 5% real discount rate in the EU” and “up to 10% outside of the EU”249. Further information would be needed to review how other MDBs and institutions are assessing which projects count as energy efficiency250.
Mobilising Finance for Energy Efficiency: The Oil Change International database tags efficiency projects by ‘fossil’, ‘clean’ or ‘other’251. This tagging has been taken at face value and is shown in the figure below.
Fossil fuel efficiency is important to identify as, without specific exclusions, there remains a risk that fossil fuel efficiency projects can extend the lifetime of fossil
assets252. Whilst the database does not provide a granular view of energy efficiency investment, it does provide a high-level picture of the trends in energy efficiency
investments across the banks and where clear progress is being made.
247 EIB (2007) Clean Energy for Europe: A Reinforced EIB Contribution
248 Ibid
249 EIB Internal Note (2015) Energy Efficiency eligibility criteria: application and monitoring requirements
250 Further research would also be needed to review the discount rates being used.
251 ‘Fossil’ includes any fossil fuel projects (oil, gas, and coal), infrastructure and policy reforms supporting fossil fuels. ‘Clean’ refers to include energy sources that are both low-carbon and have low impacts on the local environment – and refers in the Oil Change dataset energy from sun, wind, rain, and tides, and geothermal energy. ‘Other’ refers to renewables such as hydropower and biomass that can have large environmental impacts, nuclear power and energy infrastructure that is not directly linked to either clean or fossil fuel type. See: OCI (2017) Shift the Subsidies Methodology
252 See: E3G (2017) Greening Financing Flows
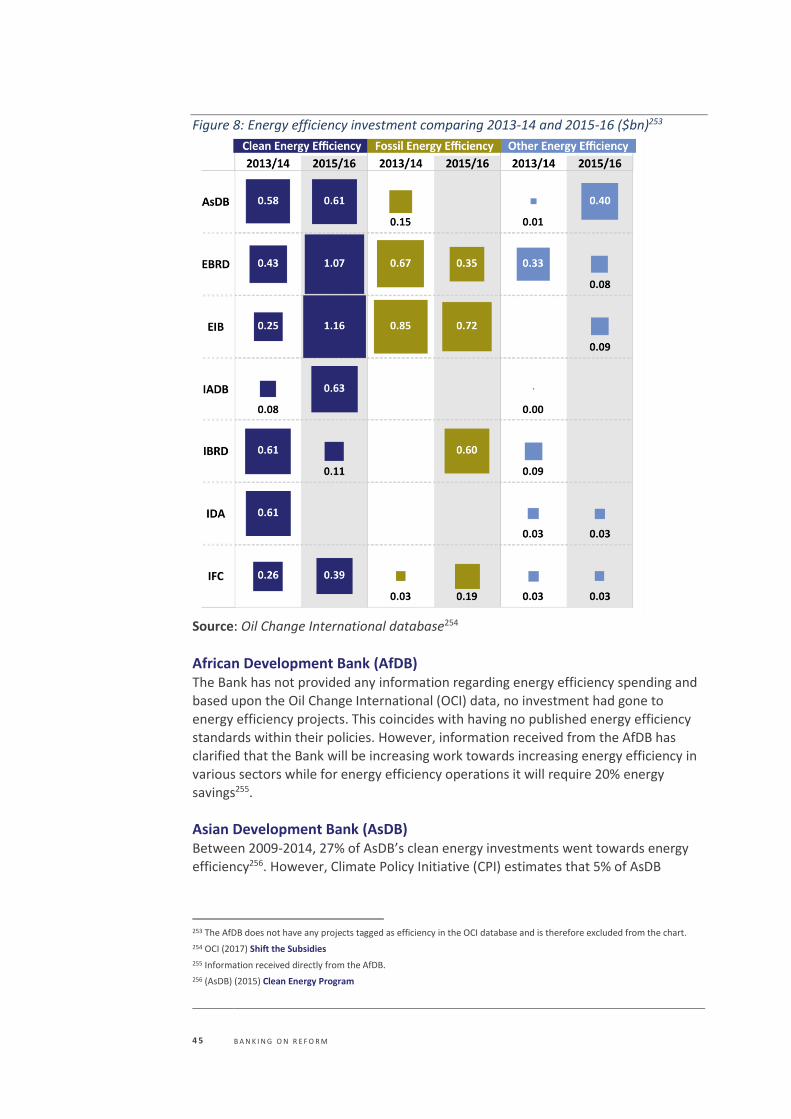
4 5 B A N K I N G O N R E F O R M
Figure 8: Energy efficiency investment comparing 2013-14 and 2015-16 ($bn)253
Source: Oil Change International database254
African Development Bank (AfDB) The Bank has not provided any information regarding energy efficiency spending and based upon the Oil Change International (OCI) data, no investment had gone to
energy efficiency projects. This coincides with having no published energy efficiency standards within their policies. However, information received from the AfDB has
clarified that the Bank will be increasing work towards increasing energy efficiency in various sectors while for energy efficiency operations it will require 20% energy savings255.
Asian Development Bank (AsDB) Between 2009-2014, 27% of AsDB’s clean energy investments went towards energy efficiency256. However, Climate Policy Initiative (CPI) estimates that 5% of AsDB
253 The AfDB does not have any projects tagged as efficiency in the OCI database and is therefore excluded from the chart.
254 OCI (2017) Shift the Subsidies
255 Information received directly from the AfDB.
256 (AsDB) (2015) Clean Energy Program
4 6 B A N K I N G O N R E F O R M
investment went to energy efficiency over 2012-2014257. AsDB’s Clean Energy Program258 has key tranches dedicated to demand and supply side energy efficiency and this is reflected in the increase of both clean and other efficiency investment. Fossil efficiency also stopped in 2015/16, making AsDB a leader amongst the banks in this area.
European Bank for Reconstruction and Development (EBRD) The 2016 Sustainability Report states that 53.7% of their ‘green project portfolio’ went to energy efficiency259. The figure above shows that clean energy efficiency has increased since 2013/14, whilst fossil efficiency investment has decreased.
Box 3: Sustainable Energy Financing Facilities (SEFF) - EBRD The EBRD SEFF facility partners with local financial institutions, such as banks, to establish sustainable energy financing channels in two key areas: energy efficiency and small-scale renewable energy; including for small and medium-sized businesses, corporate and residential borrowers, and renewable energy project developers. SEFF establishes a project team comprised of experts who provide support to participating local financial institutions and their clients. They undertake a range of activities, such as training staff in promoting the new financial product and how to recognise technically eligible projects, marketing the facility, providing technical advice, and supporting creation of standards for environmental due diligence. SEFF is offered across different sectors: food processing, manufacturing, industry, services, construction, agribusiness, and renewable energy. Outcomes260 : Over €3 billion has been provided by EBRD for sustainable energy financing since 2006. EBRD has credit lines in 24 countries and partners with over 100 local financial institutions, reaching more than 100,000 companies and residential borrowers. Over 6m ton/y of CO2 emissions have been reduced through the projects. Transformational aspect: The focus goes from policy dialogue through to financing and technical assistance so there is continuity for the country and financial institutions. SEFF works closely with policy makers to reduce barriers to markets through regulations, and to increase the supply of green technology which prepares the ground for the private sector to participate.
European Investment Bank (EIB) The EIB has provided information since 2012 on energy efficiency investments261. A seen below, there is a clear trend showing how these investments have been increasing. CPI estimated that 6% of EIB investment went to energy efficiency over 2012-2014262.
257 Climate Policy Initiative (2017) The Productivity of International Financial Institutions’ Energy Interventions
258 (AsDB) (2015) Clean Energy Program
259 EBRD (2016) Sustainability Report 2016 260 http://seff.ebrd.com/about-seff.html
261 EIB (2017) Financing Energy Efficiency
262 Climate Policy Initiative (2017) The Productivity of International Financial Institutions’ Energy Interventions
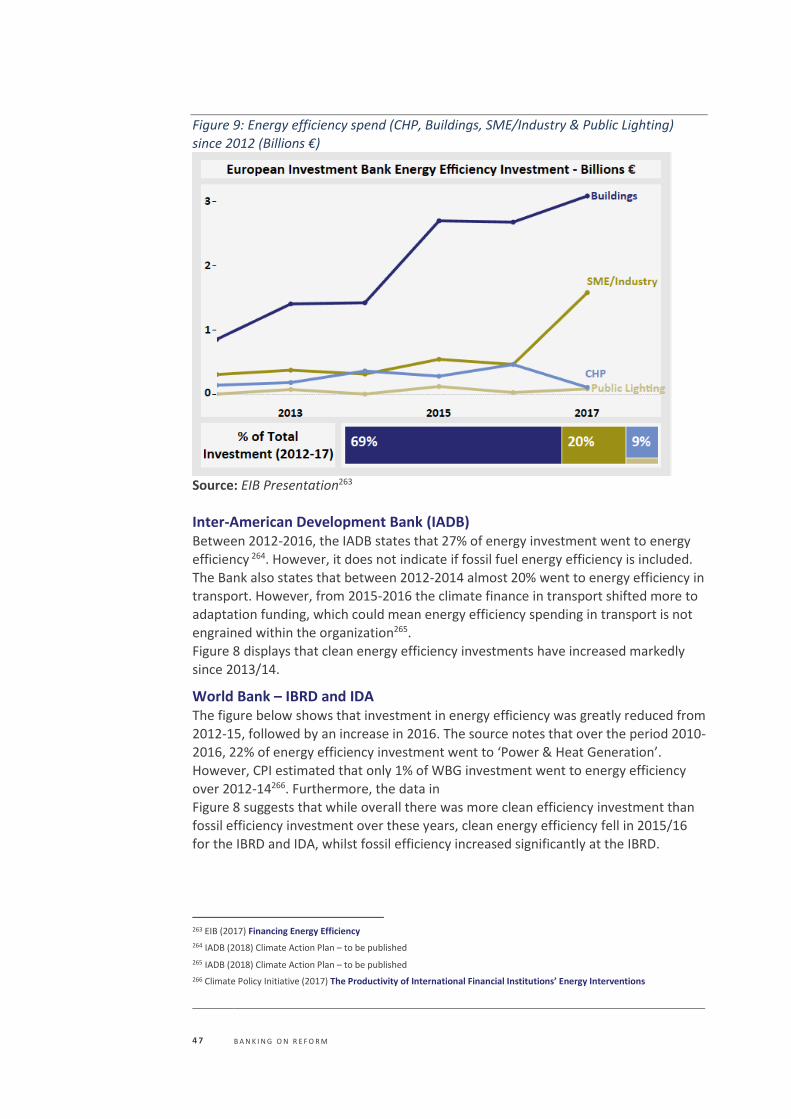
4 7 B A N K I N G O N R E F O R M
Figure 9: Energy efficiency spend (CHP, Buildings, SME/Industry & Public Lighting) since 2012 (Billions €)
Source: EIB Presentation263
Inter-American Development Bank (IADB) Between 2012-2016, the IADB states that 27% of energy investment went to energy efficiency 264. However, it does not indicate if fossil fuel energy efficiency is included.
The Bank also states that between 2012-2014 almost 20% went to energy efficiency in transport. However, from 2015-2016 the climate finance in transport shifted more to adaptation funding, which could mean energy efficiency spending in transport is not
engrained within the organization265. Figure 8 displays that clean energy efficiency investments have increased markedly
since 2013/14.
World Bank – IBRD and IDA The figure below shows that investment in energy efficiency was greatly reduced from 2012-15, followed by an increase in 2016. The source notes that over the period 2010-
2016, 22% of energy efficiency investment went to ‘Power & Heat Generation’. However, CPI estimated that only 1% of WBG investment went to energy efficiency over 2012-14266. Furthermore, the data in Figure 8 suggests that while overall there was more clean efficiency investment than fossil efficiency investment over these years, clean energy efficiency fell in 2015/16
for the IBRD and IDA, whilst fossil efficiency increased significantly at the IBRD.
263 EIB (2017) Financing Energy Efficiency
264 IADB (2018) Climate Action Plan – to be published
265 IADB (2018) Climate Action Plan – to be published
266 Climate Policy Initiative (2017) The Productivity of International Financial Institutions’ Energy Interventions
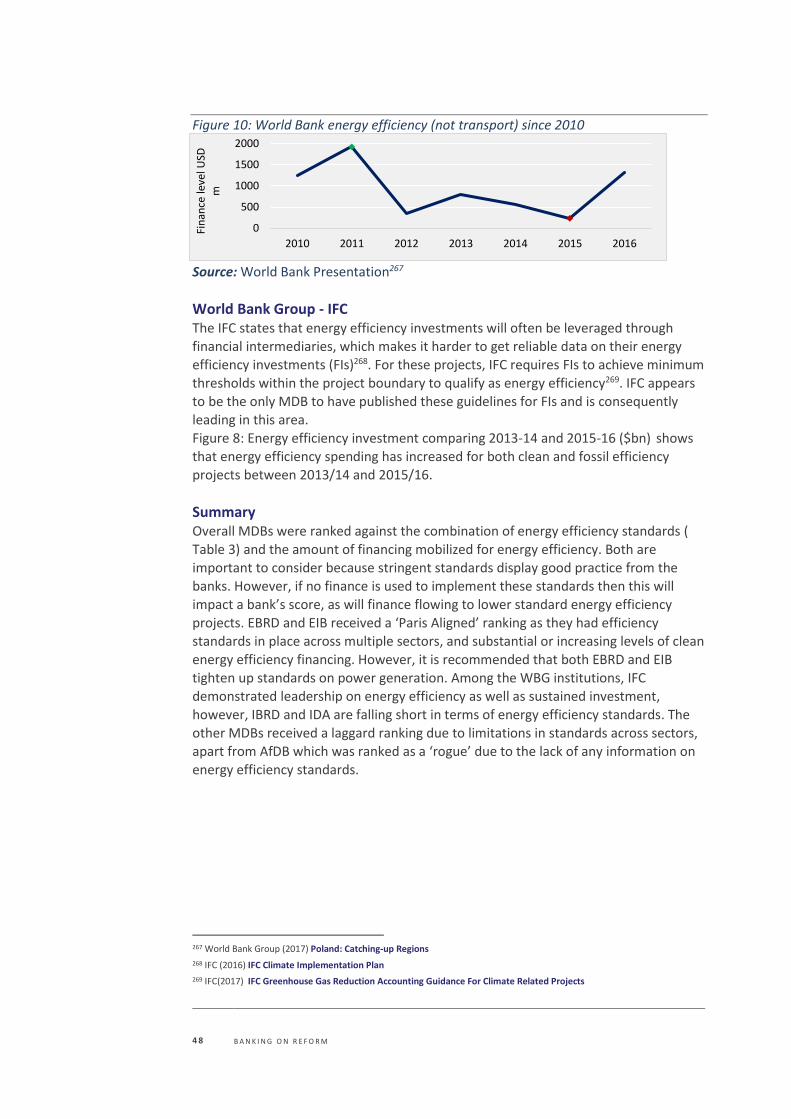
4 8 B A N K I N G O N R E F O R M
Figure 10: World Bank energy efficiency (not transport) since 2010
Source: World Bank Presentation267
World Bank Group - IFC The IFC states that energy efficiency investments will often be leveraged through financial intermediaries, which makes it harder to get reliable data on their energy efficiency investments (FIs)268. For these projects, IFC requires FIs to achieve minimum
thresholds within the project boundary to qualify as energy efficiency269. IFC appears to be the only MDB to have published these guidelines for FIs and is consequently leading in this area. Figure 8: Energy efficiency investment comparing 2013-14 and 2015-16 ($bn) shows
that energy efficiency spending has increased for both clean and fossil efficiency projects between 2013/14 and 2015/16.
Summary Overall MDBs were ranked against the combination of energy efficiency standards ( Table 3) and the amount of financing mobilized for energy efficiency. Both are
important to consider because stringent standards display good practice from the banks. However, if no finance is used to implement these standards then this will impact a bank’s score, as will finance flowing to lower standard energy efficiency
projects. EBRD and EIB received a ‘Paris Aligned’ ranking as they had efficiency standards in place across multiple sectors, and substantial or increasing levels of clean
energy efficiency financing. However, it is recommended that both EBRD and EIB tighten up standards on power generation. Among the WBG institutions, IFC demonstrated leadership on energy efficiency as well as sustained investment,
however, IBRD and IDA are falling short in terms of energy efficiency standards. The other MDBs received a laggard ranking due to limitations in standards across sectors,
apart from AfDB which was ranked as a ‘rogue’ due to the lack of any information on energy efficiency standards.
267 World Bank Group (2017) Poland: Catching-up Regions
268 IFC (2016) IFC Climate Implementation Plan
269 IFC(2017) IFC Greenhouse Gas Reduction Accounting Guidance For Climate Related Projects
0
500
1000
1500
2000
2010 2011 2012 2013 2014 2015 2016
Fin
ance
leve
l USD
m
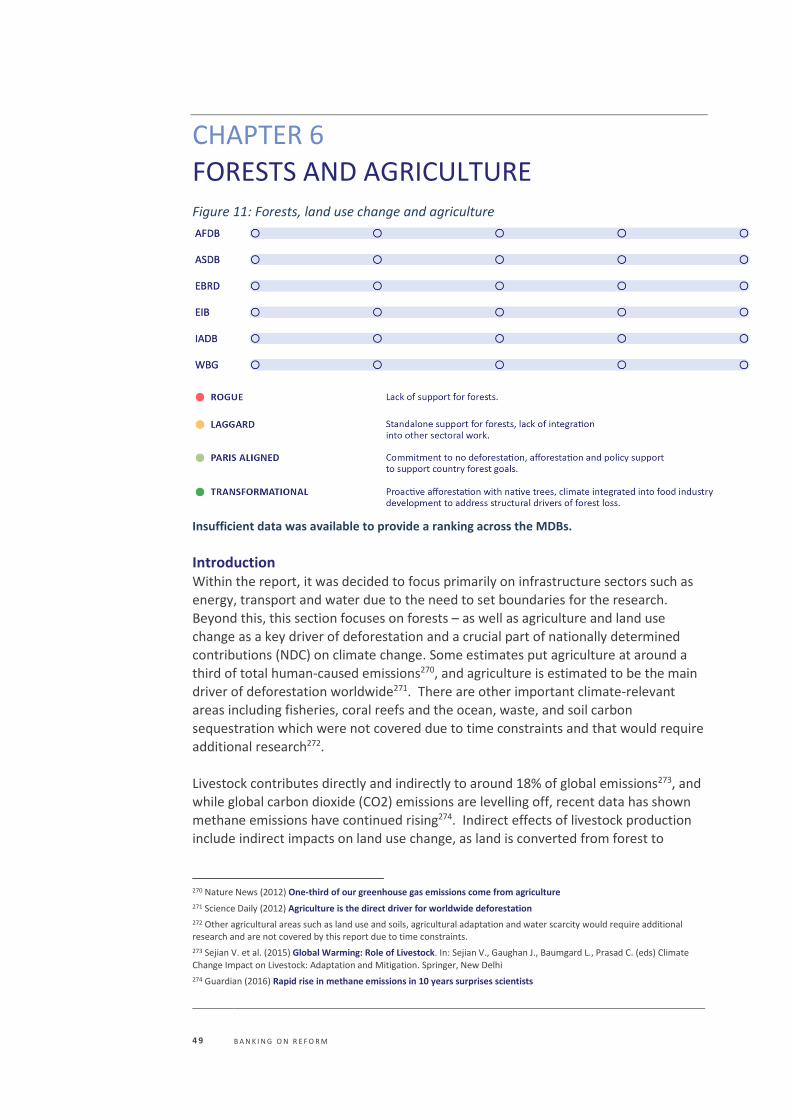
4 9 B A N K I N G O N R E F O R M
CHAPTER 6
FORESTS AND AGRICULTURE Figure 11: Forests, land use change and agriculture
Insufficient data was available to provide a ranking across the MDBs.
Introduction Within the report, it was decided to focus primarily on infrastructure sectors such as
energy, transport and water due to the need to set boundaries for the research. Beyond this, this section focuses on forests – as well as agriculture and land use
change as a key driver of deforestation and a crucial part of nationally determined contributions (NDC) on climate change. Some estimates put agriculture at around a third of total human-caused emissions270, and agriculture is estimated to be the main
driver of deforestation worldwide271. There are other important climate-relevant areas including fisheries, coral reefs and the ocean, waste, and soil carbon
sequestration which were not covered due to time constraints and that would require additional research272.
Livestock contributes directly and indirectly to around 18% of global emissions273, and while global carbon dioxide (CO2) emissions are levelling off, recent data has shown
methane emissions have continued rising274. Indirect effects of livestock production include indirect impacts on land use change, as land is converted from forest to
270 Nature News (2012) One-third of our greenhouse gas emissions come from agriculture
271 Science Daily (2012) Agriculture is the direct driver for worldwide deforestation
272 Other agricultural areas such as land use and soils, agricultural adaptation and water scarcity would require additional research and are not covered by this report due to time constraints.
273 Sejian V. et al. (2015) Global Warming: Role of Livestock. In: Sejian V., Gaughan J., Baumgard L., Prasad C. (eds) Climate Change Impact on Livestock: Adaptation and Mitigation. Springer, New Delhi
274 Guardian (2016) Rapid rise in methane emissions in 10 years surprises scientists
5 0 B A N K I N G O N R E F O R M
cropland, including for soy feed275. The livestock sector is also linked to ocean dead zones and further land degradation after conversion276, 277 contributing to the release of nitrous oxide, which has an emission factor around 300 times that of CO2. Among the key drivers of land use change, studies have noted that business as usual trends of rising meat and dairy consumption will make achieving current global climate goals
impossible278 although this sector has seen relatively little attention from policymakers279. According to the MDB Joint report, agriculture, forestry and land-use made up only 3% of MDB climate mitigation finance in 2016280. This section covers commitments to zero deforestation across multilateral
development banks (MDBs), as well as to what extent the MDBs tackle the various drivers of deforestation. Infrastructure projects funded by MDBs have the potential to
impact on protected areas and can contribute to deforestation, though the impact depends on the location, practices and on forest management. Bank Information Centre (BIC) analysis covering a sample of MDB energy, transport and agriculture projects in 13 countries from 2008-14 found that one in 12 projects analysed impacted on protected forest areas281. An estimated 18% of MDB-financed East Asian
transport projects, for example, are expected to impact on protected areas282.
African Development Bank (AfDB) The African Development Bank is administering support to several African countries
under the Forest Investment Program (FIP) which is funded by the Strategic Climate
Fund (SCF), one of the two Climate Investment Funds (CIF). However specific figures for the AfDB’s forest investments were not readily available283. The FIP is active in Burkina Faso, Democratic Republic of Congo and Ghana284. In Burkina Faso, forest land
degradation accounts for 60% of GHG emissions285.
Afforestation and preventing deforestation can also support adaptation to the impacts of climate change in African countries. For example, the ‘Great Green Wall’ project is a pan-Sahel proposal to green the southern edge of the Sahara Desert and thus hold back the impacts of desertification286. AfDB has been involved in promoting
economic opportunities in the countries involved in this project across multiple sectors287. Drawing on a small sample size, BIC found that the AfDB was consistent in
275 https://globalforestatlas.yale.edu/amazon/land-use/soy
276 Guardian (2017) Meat industry blamed for largest-ever 'dead zone' in Gulf of Mexico
277 http://wwf.panda.org/what_we_do/footprint/agriculture/impacts/soil_erosion/
278 GRAIN, IATP and Heinrich Böell Foundation (2017) Big meat and dairy’s supersized carbon footprint.
279 Chatham House (2015) Changing climate, changing diets
280 IADB (2016) Joint Report on Multilateral Development Banks' Climate Finance An equivalent figure was not available for the adaptation sector. The sectoral spending figure was not broken down by MDB.
281 BIC (2016) Putting the “Drivers of Deforestation” in context.
282 BIC (2016) Putting the “Drivers of Deforestation” in context.
283 Tomaselli (2015) Brief Study On Funding And Finance For Forestry And Forest-Based Sector
284 AfDB (2018) Forest Investment Program
285 AfDB (2018) Forest Investment Program
286 https://www.afdb.org/en/news-and-events/the-great-green-wall-is-helping-african-countries-to-mitigate-climate-change-15130/
287 https://www.afdb.org/en/news-and-events/multi-stakeholder-preparatory-workshop-to-the-great-green-wall-17476/
5 1 B A N K I N G O N R E F O R M
reporting on capacity building to manage the impacts of its projects, but that the AfDB’s investments had a wide range of impacts on forests, from destruction of forest cover to the disturbance of national park ecosystems288.
Asian Development Bank (AsDB) AsDB’s involvement in forest investments has a mixed history. For example, one study in 2003 found that between 1980-2000, AsDB provided about $990m in loans to the
forest sector in 11 Developing Member Countries (DMCs), and a large portion (81%) of AsDB’s forest sector investments went to establishing plantations for fuelwood, soil protection, and commercial timber production289. However, in some countries, the
AsDB has been involved in supporting and implementing policy and institutional reforms to enhance the human welfare impact of forests and forestry investments, recognising the importance of tenure sector for communities to commit to long-term forestry efforts290. In 2008/9, the AsDB undertook a review of its environmental and
social safeguard operational policies and issued a revised Safeguard Policy including a more progressive policy on Indigenous Peoples, though it is not clear how this has been implemented291.
In many AsDB member countries, forests are recognised in Nationally Determined Contributions (NDCs) as important for both adaptation and mitigation292. AsDB also
notes that over 60% of the region’s population works in agriculture, fisheries, and
forestry, the productive sectors considered most at risk from climate change293.
AsDB’s Safeguard Policy ensures that critical habitats and protected areas remain untouched294. However, the AsDB’s own climate framework admits that AsDB has a very limited portfolio of investments and limited internal capacity on preventing
deforestation and degradation thus making it “doubtful” that AsDB “will be able to carry out large investments in Phase 1” of the climate framework295 [from 2017 to
2023]. Given this is a gap for AsDB, and the crucial importance of this sector for 1.5-2°C scenarios as well as for member countries, it is recommended that AsDB look at filling this gap as well as ensuring the AsDB’s advice can help members countries to reduce drivers to deforestation. Fisheries may be another gap for the AsDB,
particularly given that several Asian countries are home to a large proportion of the world’s coral reefs296, which are highly vulnerable to the impacts of climate change.
This issue requires further research.
European Bank for Reconstruction and Development (EBRD) EBRD is actively involved in a wide variety of projects, which involve wood or related forestry products as well as investing in biomass energy projects using forest
288 BIC (2016) Putting the “Drivers of Deforestation” in context.
289 http://www.fao.org/docrep/ARTICLE/WFC/XII/0892-C1.HTM
290 http://www.fao.org/docrep/ARTICLE/WFC/XII/0892-C1.HTM
291 Forest Peoples Programme (2013) Experience of Asian indigenous peoples with the finance lending policies of IFIs.
292 AsDB (2016) Assessing The Intended Nationally Determined Contributions Of ADB Developing Members
293 AsDB (2017). Climate Change Operational Framework 2017–2030
294 AsDB (2012) Environment Safeguards: A Good Practice Sourcebook Draft Working Document
295 AsDB (2017). Climate Change Operational Framework 2017–2030
296 http://coral.unep.ch/atlaspr.htm
5 2 B A N K I N G O N R E F O R M
resources for fuel supply297. However, specific figures for the scale of EBRD’s forest-related investment were not available. EBRD requires its clients to adhere to standards to ensure that all wood used is of legal and sustainable origin and that it does not originate from protected areas or forests with a high biodiversity value298. However, it is not clear how this is assessed. Among EBRD’s activities on forestry, it
has been involved in promoting sustainable forestry in several regions in Russia, noting that Russia’s forestry sector faces competition from fast-growing trees in South America and China299. EBRD’s activities are mainly focused on the private sector but further research would be needed to provide an overall assessment.
European Investment Bank (EIB) EIB invested €4.5bn in the forestry value chain between 2011 and 2015, making the EIB is one of the largest global financiers of the forestry sector300. Within Europe, the EIB supports the EU Forestry Strategy and Forest Action Plan, and notes that forests
cover 33% of Europe’s total land area and that this area continues to increase301. As a long-term lender, EIB documents note that EIB is well suited to the long-term character of the sector302. The EIB’s lending to the forestry sector includes planting activities, forest rehabilitation and protection (including disaster recovery), wood
processing and research303. The same document notes that half of the EU’s total renewable energy consumption is derived from forest biomass304. However, how this
affects climate mitigation depends in large measure on how it is sourced and
consumed. The use of solid biomass is controversial, with Chatham House finding
that while some types of wood may have lower levels of carbon emissions than some types of coal, “in general wood is more carbon intensive than coal”305.
Despite the multiple benefits for adaptation and mitigation, in terms of climate change lending outside the EU, agriculture and forestry make up a relatively small
portion of total lending volumes – less than 10% in 2016306. Like other MDBs the EIB has not focused on investments for healthy and less carbon-intensive diets which could act as a driver to reduce deforestation and agricultural emissions, except in so far as noting that value chains also play a vital role in healthy diets307.
Inter-American Development Bank (IADB) Loans and credits by IADB to approved forest projects in Latin America and the
Caribbean, reached $350m between 1996-2005308. Many countries in Latin America and the Caribbean include forests and land use as a vital part of their NDCs under the
297 http://forestindustries.eu/content/ebrd-promoting-sustainable-forestry-bratislava-vladivostok
298 http://forestindustries.eu/content/ebrd-promoting-sustainable-forestry-bratislava-vladivostok
299 http://www.ebrd.com/news/2012/ebrd-study-on-forestry-how-to-attract-forest-industry-investments-to-russia.html
300 EIB (2017) The EIB and the forest sector
301 Ibid
302 EIB (2012) The European Investment Bank forestry and climate change
303 EIB (2017) The EIB and the forest sector
304 EIB (2017) The EIB and the forest sector
305 Brack (2017) Woody Biomass for Power and Heat
306 EIB (2016) EIB outside the EU
307 http://www.eib.org/projects/sectors/agriculture/index.htm
308 Tomaselli (2015) Brief Study On Funding And Finance For Forestry And Forest-Based Sector
5 3 B A N K I N G O N R E F O R M
Paris Agreement. The majority of the Amazon rainforest, the world’s largest rainforest and a significant contributor the world’s oxygen, is located in Brazil, as well as portions in Colombia and Peru, amongst other countries. The government of Brazil is now working on its national strategy for implementing and financing its NDC, and as part of this process, the IADB has worked with the Ministry of Environment to create a
“base document” to initiate discussions309. Brazil is the largest GHG emitter in Latin America, with a majority of its emissions coming from agriculture, land use, and forestry, and which are also projected to rise due to deforestation and agricultural shifts310.
Amongst its activities on forests, the IADB supports programs and policies to clarify tenure status of forested lands, including the creation and establishment of protected
areas311. It is notable that forestry projects have benefits for both mitigation (by enhancing forest GHG sinks) and adaptation (by improving the climate resiliency of the surrounding ecosystem)312. Like the World Bank, it also works on policies and programs that intensify agricultural production as means to reduce the expansion of agriculture into forest areas313. However, like other MDBs there has been relatively
less focus on upstream policies to reduce drivers of deforestation such as pricing of
greenhouse gas emissions across all sectors. Among middle income countries, healthier diets might also support regional food security, resilience and sustainability.
World Bank Group (WBG) The World Bank is a leading financier of agriculture, with $4bn in new commitments in Fiscal Year 2017314. It is estimated the WBG invested an average of $465m per year in the forest sector between FY02 and FY15315. Based on OECD statistics, the World Bank
ranks first in the list of multilateral financiers of forest activities316.
It has since 2015 placed an emphasis on ‘climate smart agriculture’, an approach that aims to lead to improved productivity, resilience and lower emissions317. While the World Bank has focused its work on the supply end of the agricultural supply chains, there has been relatively less focus upon the drivers of deforestation such as demand
for resource-intensive agricultural products. The WBG’s work within the livestock sector in Vietnam, for example, has the objective of increasing the efficiency of
livestock production but there have been concerns about this intensification project on the basis that it contributed to low animal welfare outcomes318. The Bank’s work on forests include partnerships with the private sector including many major
309 EDF and Forest Trends (2017) Collaboration towards zero deforestation
310 IADB (2017) Supporting National Development Banks to Drive Investment in the Nationally Determined Contributions of Brazil, Mexico and Chile.
311 https://www.iadb.org/en/forestry
312 IADB (2017) Supporting National Development Banks to Drive Investment in the Nationally Determined Contributions of Brazil, Mexico and Chile.
313 https://www.iadb.org/en/forestry
314 http://www.worldbank.org/en/results/2017/11/29/climate-smart-agriculture
315 WBG (2016) World Bank Group Forest Action Plan FY16–20
316 WBG (2016) World Bank Group Forest Action Plan FY16–20
317 http://www.worldbank.org/en/topic/climate-smart-agriculture
318 WBG (2017) Vietnam - Livestock Competitiveness and Food Safety Projects
5 4 B A N K I N G O N R E F O R M
agricultural producers. While increasing efficiency of livestock food chains may reduce emissions per unit of output319, increasing efficiency of industrial agriculture may have the effect of reducing prices for certain types of resource-intensive products320 thus inadvertently leading to increased emissions321. Further data on the GHG emissions associated with production changes resulting from MDB projects would be needed to
explore this issue in more detail. The World Bank is working with others to reduce deforestation under the New York Declaration322. However, the World Bank has not made a commitment to zero deforestation within its own portfolio323. Recent analysis has found that World Bank
documents are more likely to mention forest impacts than trigger the forest policy, and that the triggering of the forest policy was also highly inconsistent across regions
and sectors, while IFC displayed a lack in transparency in its publication of key documents such as impact assessments324.
Summary Our analysis suggests MDBs must place greater attention on reducing the drivers of deforestation, including both infrastructure and land use. However, due to the
scarcity of available research and data with which to rank the MDBs progress on tackling deforestation or support for NDC-related forest commitments, we are not
able to rank the MDBs against this criteria at this stage. Consistent data was not
available on MDBs finance for forests, either as a proportion of overall climate
spending or as a proportion of overall spending. There are other important climate-relevant areas relating to ecosystems, including fisheries, coral reefs and the ocean which have not been covered in our analysis due to time constraints; and these would
require additional research. For example, a review of the Organisation for Economic Co-operation and Development's (OECD) Development Assistance Committee (DAC)
database has revealed that only a tiny portion of MDB funding over 2010-15 went towards coral reefs325. We recommend further that research into the MDBs investments in global ecosystem services should be done to cover this topic comprehensively.
None of the development banks have any policy committing them to zero
deforestation326. Analysis by BIC across 13 countries states that the MDBs invest more in sectors linked of drivers of deforestation, such as transport, energy and agriculture, than they do in forest management and conservation activities, and that the MDBs frequently underreport (or under-classify) impacts on forests327. In addressing
319 Hyland et al (2016) Improving livestock production efficiencies presents a major opportunity to reduce sectoral greenhouse gas emissions
320 UNEP (2012) Growing Greenhouse Gas Emissions Due to Meat Production
321 UNEP (2012) Growing Greenhouse Gas Emissions Due to Meat Production
322 WBG (2017) Engaging the private sector in results-based landscape programs.
323 In fact, zero deforestation pledges have also encountered controversy in terms of how such pledges have been implemented. See: https://forest500.org/sites/default/files/achievingzeronetdeforestation.pdf
324 BIC (2016) Putting the “Drivers of Deforestation” in context.
325 http://www.climatechangenews.com/2018/03/06/worlds-climate-funds-ignoring-coral-reefs/
326 https://www.e3g.org/library/huffington-post-blog-when-will-all-the-development-banks-disclose-their-car
327 BIC (2016) Putting the “Drivers of Deforestation” in context.
5 5 B A N K I N G O N R E F O R M
deforestation, MDBs document ex-post mitigation efforts more frequently than ex-ante measures to avoid or minimize harm328. In addition, desk research by E3G found limited evidence that MDBs or DFIs are focusing on structural drivers which could help to address drivers of deforestation in the food system, for example promotion of healthier diets which could have health co-benefits.
328 BIC (2016) Putting the “Drivers of Deforestation” in context.
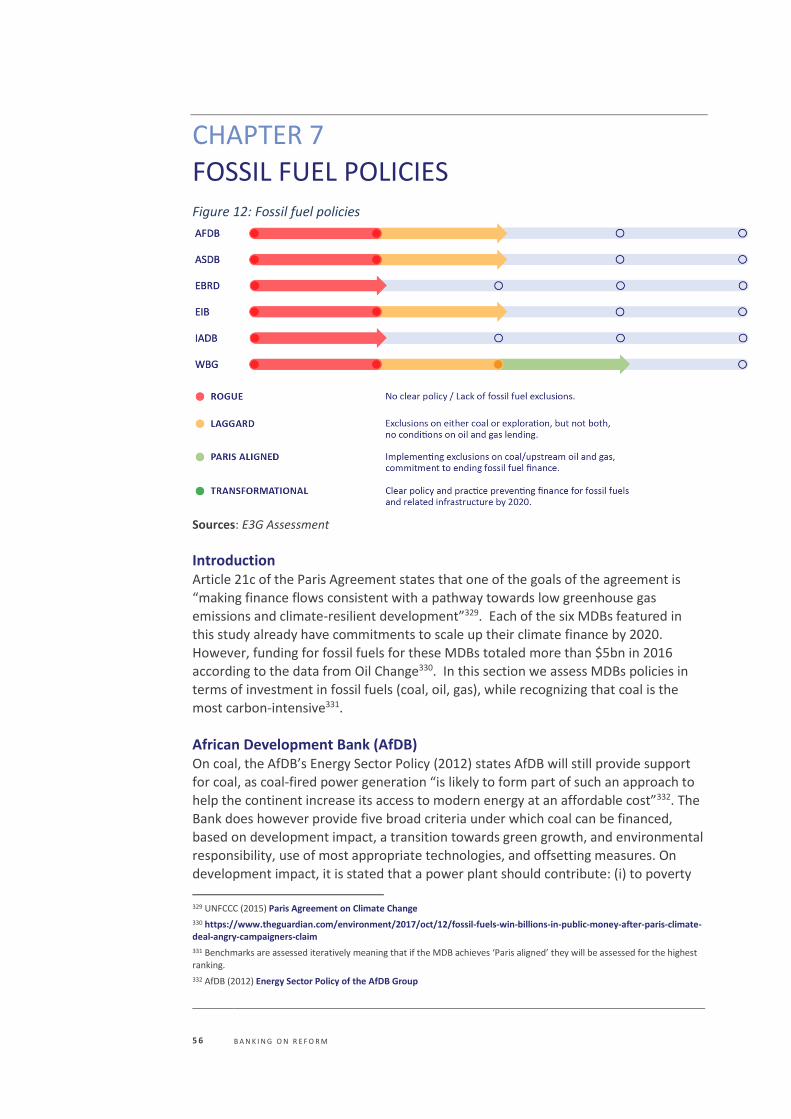
5 6 B A N K I N G O N R E F O R M
CHAPTER 7
FOSSIL FUEL POLICIES Figure 12: Fossil fuel policies
Sources: E3G Assessment
Introduction Article 21c of the Paris Agreement states that one of the goals of the agreement is
“making finance flows consistent with a pathway towards low greenhouse gas emissions and climate-resilient development”329. Each of the six MDBs featured in this study already have commitments to scale up their climate finance by 2020.
However, funding for fossil fuels for these MDBs totaled more than $5bn in 2016 according to the data from Oil Change330. In this section we assess MDBs policies in
terms of investment in fossil fuels (coal, oil, gas), while recognizing that coal is the most carbon-intensive331.
African Development Bank (AfDB) On coal, the AfDB’s Energy Sector Policy (2012) states AfDB will still provide support for coal, as coal-fired power generation “is likely to form part of such an approach to help the continent increase its access to modern energy at an affordable cost”332. The Bank does however provide five broad criteria under which coal can be financed, based on development impact, a transition towards green growth, and environmental
responsibility, use of most appropriate technologies, and offsetting measures. On development impact, it is stated that a power plant should contribute: (i) to poverty
329 UNFCCC (2015) Paris Agreement on Climate Change
330 https://www.theguardian.com/environment/2017/oct/12/fossil-fuels-win-billions-in-public-money-after-paris-climate-deal-angry-campaigners-claim
331 Benchmarks are assessed iteratively meaning that if the MDB achieves ‘Paris aligned’ they will be assessed for the highest ranking.
332 AfDB (2012) Energy Sector Policy of the AfDB Group
5 7 B A N K I N G O N R E F O R M
reduction, and (ii) addressing national and/or regional energy security needs”333. Secondly on transitioning to green growth, the policy states “any coal power plant to be financed by the Bank will form part of a technologically and commercially feasible low-carbon and cost-effective strategy for energy resources”334. Thirdly, the policy states that when supporting coal, technology should allow for “high-efficiency” and
diversify the energy mix. On technology, the policy states the Bank will encourage assessment “for readiness for relevant Carbon Capture and Storage technologies”335. Finally, the Bank will support countries that express interest in offsetting measures related to agreements agreed under climate negotiations, “or on a voluntary basis”. While the five criteria provide a useful framework, AfDB’s coal policy does not use the
words ‘exceptional’, or ‘rare’ and therefore can be seen as one of the least restrictive among the MDBs. While the policy is silent on coal mining, on oil and gas, the energy
policy states that AfDB “will not support oil and gas exploration activities”336. This may still permit investment in other upstream activities such as extraction of reserves.
Asian Development Bank (AsDB) On coal, the AsDB has one of the least restrictive policies among the MDBs. The Energy Policy of 2009 states that AsDB “will selectively support coal-based power
projects if cleaner technologies are adopted and adequate mitigation equipment and measures are incorporated into the project design” 337. On oil and gas, AsDB’s Energy
Policy of 2009 states AsDB “will continue its policy of not financing any oil and gas
field exploration projects because of the associated risks” 338. The wording suggests
this policy was established due to financial risks rather than climate risks, and that oil is a commercial product with little need for MDB finance339. The policy also states that “since coal and oil are internationally traded commodities with established
commercial interests, AsDB will not finance coal mine development except for captive use by thermal power plants, and oil field development except for marginal and
already proven oil fields”340. Interestingly, AsDB cites ‘additionality’ as a key reason why coal mining and oil field development are ruled out, given that established commercial interests are already involved. In other words, MDB capital should be put into use when other sources are not available341 342.
333 AfDB (2012) Energy Sector Policy of the AfDB Group
334 This begs the question of how coal can be part of a feasible low carbon strategy when there is no more carbon intensive option available.
335 This does not incorporate consideration of where the CO2 would be stored.
336 AfDB (2012) Energy Sector Policy of the AfDB Group. Like for AsDB, this may be for financial risk reasons.
337 AsDB (2009) Energy Policy. The document states elsewhere that: ‘As new technologies—such as integrated gasification combined cycle and carbon capture and storage (or sequestration)—are shown to be technically feasible and economically viable, AsDB will support their deployment in DMCs to increase their financial viability’
338 AsDB (2009) Energy Policy
339 It states that ‘oil is an internationally traded commodity with established private sector involvement’. MDBs have a policy of investing in areas where they can be ‘additional’ to the private sector.
340 AsDB (2009) Energy Policy
341 See: https://www.iisd.org/blog/financing-infrastructure-how-can-multilateral-development-banks-avoid-crowding-out
342 However, there is a risk that the additionality justification could be undermined if there is a shift away from exploration and development by private commercial interests. This shows that the MDBs need to strengthen their policies in line with the Paris climate goals.
5 8 B A N K I N G O N R E F O R M
The policy also states that AsDB “will continue to provide assistance for gas field development, and transportation and distribution of gas”. Thus, there is a distinction between oil and gas; for oil, both exploration and development are excluded, while for gas, exploration projects are excluded but development is still permitted. Support for oil “refining, transportation and distribution” is still permitted343. The energy policy
of the AsDB has not been updated since 2009 making it one of the least up-to-date policies among the MDBs. It is not clear whether AsDB is adhering to its own policies on ruling out exploration finance, given that Chapter 12 identified some of AsDB’s fossil fuel finance over 2013-16 going to exploration and extraction projects. Further research would be required to investigate this further.
European Bank for Reconstruction and Development (EBRD) On coal, EBRD’s methodology for assessment of coal fired generation projects (2014), states that EBRD “will only finance such projects in rare and exceptional
circumstances and where they satisfy three coal screening criteria (referred to as the tripartite test)”344. This policy states that coal is only funded in ‘rare and exceptional circumstances’. It has three criteria put in place, which is less than several other MDBs, though arguably the criteria are clearer. The three criteria are345:
1. “infrastructure being financed must be the least carbon-intensive of the realistically
available options.
2. …infrastructure must use best available techniques (BAT), as defined in the EU Industrial
Emissions Directive.
3. …plant must comply with the EU Industrial Emissions Directive requirements in relation to
carbon capture and storage [CCS] readiness.”346 EBRD’s Energy Sector Strategy of 2013 clarifies that the ‘tripartite’ test also applies to
associated infrastructure and thermal coal mining, though it is not clear how the CCS test could apply to mining. The restrictions on coal are also linked to the Industrial
Emission Directive, which imposes limits on emissions of local pollutants and stipulates efficiency standards, as well as limits related to carbon capture and storage readiness347. Finally, the strategy states that EBRD will incorporate shadow carbon prices to demonstrate the investment is economically viable taking account of
emission externalities348.
On oil and gas, the EBRD falls short by not having restrictions on exploration or extraction, or on unconventional oil and gas resources such as tar sands or fracking. The energy strategy states: “the Bank will support exploration and production of oil and gas by applying the best international EHSS [Environment, Health and Safety] standards while unlocking the potential for economic growth and development of the
value chain”349. On unconventional oil and gas, it states: “the Bank will develop and propose an approach to the Board in this area that achieves transition impact, subject
343 AsDB (2009) Energy Policy
344 EBRD (2014) Coal Methodology
345 EBRD (2014) Coal Methodology
346 The problem of CO2 storage availability has not been considered in the document.
347 EBRD (2013) Energy Sector Strategy
348 EBRD (2013) Energy Sector Strategy It is not clear whether this requirement covers all categories of energy investment.
349 EBRD (2013) Energy Sector Strategy (page 57)
5 9 B A N K I N G O N R E F O R M
to compliance with domestic legislation and the highest international standards”350. Interestingly, EBRD has also begun analysing the fiscal risks of a low carbon transition in partner countries that export oil and gas351, reportedly an initiative from the Chief Economist’s office. The EBRD’s revision of its Energy Sector Strategy this year is an opportunity to immediately rule out oil finance as well as putting in place a timeline
for ruling out gas investments by 2020, with a series of robust lending criteria. The data shows EBRD still continues to invest heavily in fossil fuels352 (see Chapter 12).
European Investment Bank (EIB) EIB’s Energy Lending Criteria (2013) state that ‘all’ fossil fuel power plants must353:
• “be economically justified based on a cost benefit analysis – including a carbon price which
reflects the marginal damage of each unit harmful emission (e.g. CO2)”
• “have CO2 emissions of less than the EPS… expressed in gCO2/kWh”
In practice, the emission performance criteria set by the EIB means it will not support
coal plants. The EIB set the limit at 550gCO2/kWh which rules out any further lending to regular coal power plants, although it will for the time-being allow the financing of the most advanced coal technology if it includes biomass cofiring/heat capture354.
On oil and gas, the shadow carbon price would apply (as noted in the criteria above). There do not appear to be specific exclusions on exploration, other than the EIB
Energy Lending Criteria which states: “standard EIB structures would probably not
allow funding of the early stage ‘exploration/ appraisal’”355. In practice, oil exploration
is too risky for EIB undertake, so it does not undertake these projects356. However, the criteria also states that: “all other parts of the chain should be eligible”357. This is weaker than the restrictions by AsDB, as field development and pipelines would both
be allowed.
Inter-American Development Bank (IADB) On coal, IADB’s coal fired power plant guidelines (2009) state that IADB will “continue
supporting those coal plants that are designed to use the best appropriate available technology to allow for high efficiency and therefore lower GHG emissions intensity, and to meet internationally-recognized best practices and standards”358. This is one
of the weakest policies among the MDBs in terms of its wording, akin to those of the EBRD, but ranked as even lower since there is no reference to carbon pricing.
On oil and gas, IADB’s policies similarly state IADB will “continue supporting those
fossil fuel power plants that are designed to meet minimum efficiency and GHG emissions performance criteria and to use the best appropriate available technology
350 EBRD (2013) Energy Sector Strategy
351 http://www.ebrd.com/publications/government-assets-climate-policy
352 https://www.e3g.org/library/greening-financial-flows-what-progress-has-been-made-development
353 EIB (2013) Energy Lending Criteria
354 E3G (2013) European Investment Bank Turns Away from Coal Financing
355 EIB (2013) Energy Lending Criteria
356 Information received from EIB.
357 EIB (2013) Energy Lending Criteria
358 IADB (2009) Coal Fired Power Plants Guidelines
6 0 B A N K I N G O N R E F O R M
to allow for high efficiency and lower GHG emissions intensity”359. In addition, IADB’s webpage outlines that IADB may “participate in, promote or support” exploration including to “assist in identifying and locating the various sources of energy, both renewable and non-renewable”360. Thus, no restrictions seem to be in place for upstream or exploration finance. In practice, however, IADB provides little finance to
fossil fuels. E3G’s briefing paper on green to brown energy ratios among the MDB’s has found that IADB is among the greenest361. However, if associated lending criteria were in place, they would score better in this assessment.
World Bank Group (WBG) On coal, the World Bank Group’s Energy Sector Directions Paper (2013), states the WBG will provide financial support for greenfield coal generation projects “only in rare circumstance… meeting basic energy needs in countries with no feasible alternatives to coal and a lack of financing for coal power would define such rare
cases”362. The same paper also refers to “exceptional circumstances”. The Directions paper references the 2010 Criteria for Screening Coal Projects, with 6 criteria363:-
1. “demonstrated developmental impact of the project”
2. “assistance is being provided to identify and prepare low-carbon projects”
3. “energy sources are optimized looking at the possibility of meeting the country’s needs
through energy efficiency (both supply and demand) and conservation”
4. “after full consideration of viable alternatives”
5. “coal projects will be designed to use the best, appropriate available technology”
6. “incorporate environmental externalities in project analysis.”
The note clarifies “upstream activities such as coal mining and processing” would be subject to the same guidance364. With six criteria in place, this approach is judged as
more robust than that of the AfDB. On oil and gas, the WBG recently announced in 2017 it will no longer finance upstream oil and gas after 2019365. As for coal, in
exceptional circumstances, consideration will be given to financing upstream gas “in the poorest countries where there is a clear benefit in terms of energy access for the poor and the project fits within the countries’ Paris Agreement commitments”366.
Summary The table below summarises coal, oil and gas policies among MDBs. All policies except AsDB, EBRD and WBG policies remain silent on coal mining. WBG’s coal criteria refer
also to ‘associated transmission infrastructure’ while EBRD’s coal lending criteria refers to ‘associated infrastructure’, but the other policies remain silent on coal-
related infrastructure such as ports or distribution infrastructure. MDBs do not have specific exclusions in place to ensure lending through intermediaries does not reach
359 IADB (2012) Liquid and Gaseous Fossil Fuel Power Plant Guidelines
360 http://www.iadb.org/en/about-us/energy,6219.html
361 As cited in the Guardian. https://www.theguardian.com/environment/2017/oct/12/fossil-fuels-win-billions-in-public-money-after-paris-climate-deal-angry-campaigners-claim
362 WBG (2013) Directions for the World Bank Group’s Energy Sector
363 WBG (2010) Criteria for Screening Coal Projects
364 WBG (2010) Criteria for Screening Coal Projects
365 http://www.worldbank.org/en/topic/climatechange/brief/qa-the-world-bank-group-and-upstream-oil-and-gas
366 http://www.worldbank.org/en/topic/climatechange/brief/qa-the-world-bank-group-and-upstream-oil-and-gas
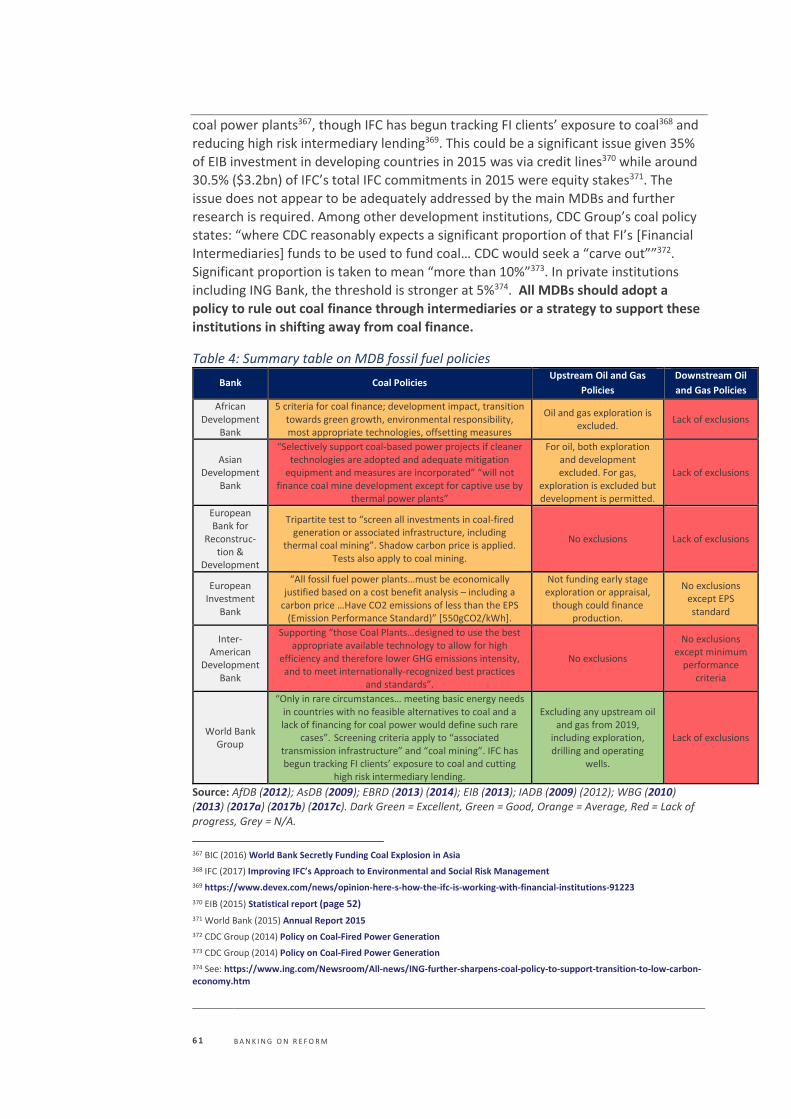
6 1 B A N K I N G O N R E F O R M
coal power plants367, though IFC has begun tracking FI clients’ exposure to coal368 and reducing high risk intermediary lending369. This could be a significant issue given 35% of EIB investment in developing countries in 2015 was via credit lines370 while around 30.5% ($3.2bn) of IFC’s total IFC commitments in 2015 were equity stakes371. The issue does not appear to be adequately addressed by the main MDBs and further
research is required. Among other development institutions, CDC Group’s coal policy states: “where CDC reasonably expects a significant proportion of that FI’s [Financial Intermediaries] funds to be used to fund coal… CDC would seek a “carve out””372. Significant proportion is taken to mean “more than 10%”373. In private institutions including ING Bank, the threshold is stronger at 5%374. All MDBs should adopt a
policy to rule out coal finance through intermediaries or a strategy to support these institutions in shifting away from coal finance.
Table 4: Summary table on MDB fossil fuel policies
Bank Coal Policies Upstream Oil and Gas
Policies
Downstream Oil
and Gas Policies
African Development
Bank
5 criteria for coal finance; development impact, transition towards green growth, environmental responsibility, most appropriate technologies, offsetting measures
Oil and gas exploration is excluded.
Lack of exclusions
Asian Development
Bank
“Selectively support coal-based power projects if cleaner technologies are adopted and adequate mitigation
equipment and measures are incorporated” “will not finance coal mine development except for captive use by
thermal power plants”
For oil, both exploration and development excluded. For gas,
exploration is excluded but development is permitted.
Lack of exclusions
European Bank for
Reconstruc-tion &
Development
Tripartite test to “screen all investments in coal-fired generation or associated infrastructure, including
thermal coal mining”. Shadow carbon price is applied. Tests also apply to coal mining.
No exclusions Lack of exclusions
European Investment
Bank
“All fossil fuel power plants…must be economically justified based on a cost benefit analysis – including a
carbon price …Have CO2 emissions of less than the EPS (Emission Performance Standard)” [550gCO2/kWh].
Not funding early stage exploration or appraisal,
though could finance production.
No exclusions except EPS standard
Inter-American
Development Bank
Supporting “those Coal Plants…designed to use the best appropriate available technology to allow for high
efficiency and therefore lower GHG emissions intensity, and to meet internationally-recognized best practices
and standards”.
No exclusions
No exclusions except minimum
performance criteria
World Bank Group
“Only in rare circumstances… meeting basic energy needs in countries with no feasible alternatives to coal and a lack of financing for coal power would define such rare
cases”. Screening criteria apply to “associated transmission infrastructure” and “coal mining”. IFC has begun tracking FI clients’ exposure to coal and cutting
high risk intermediary lending.
Excluding any upstream oil and gas from 2019,
including exploration, drilling and operating
wells.
Lack of exclusions
Source: AfDB (2012); AsDB (2009); EBRD (2013) (2014); EIB (2013); IADB (2009) (2012); WBG (2010) (2013) (2017a) (2017b) (2017c). Dark Green = Excellent, Green = Good, Orange = Average, Red = Lack of progress, Grey = N/A.
367 BIC (2016) World Bank Secretly Funding Coal Explosion in Asia
368 IFC (2017) Improving IFC’s Approach to Environmental and Social Risk Management
369 https://www.devex.com/news/opinion-here-s-how-the-ifc-is-working-with-financial-institutions-91223
370 EIB (2015) Statistical report (page 52)
371 World Bank (2015) Annual Report 2015
372 CDC Group (2014) Policy on Coal-Fired Power Generation
373 CDC Group (2014) Policy on Coal-Fired Power Generation
374 See: https://www.ing.com/Newsroom/All-news/ING-further-sharpens-coal-policy-to-support-transition-to-low-carbon-economy.htm
6 2 B A N K I N G O N R E F O R M
The coal policies of WBG, EIB and EBRD are ranked as stronger within this qualitative assessment. Overall WBG is ranked the highest and is at the boundary of laggard and Paris-aligned in the overall assessment, due to the recent announcement on ending upstream oil and gas finance, as well as the coverage of its coal lending criteria. It is notable that EIB’s EPS applies to ‘all fossil fuel power plants’ and thus could be
strengthened in future to rule out gas power plants. Whilst their policies on coal power plants are fairly robust, both EBRD and EIB are marked down in this assessment as their policies on intermediary lending are unclear. EBRD and EIB should arguably both be leading the way given that these institutions are operating within Europe. Moreover, it is unclear how all MDBs are promoting green finance in their
equity investments (see Chapter 14).
Chapter 12 shows that there is little association between MDBs fossil fuel policies and levels of fossil fuel finance. For example, IADB had one of weakest fossil fuel policies and among the lowest levels of fossil fuel finance among MDBs. Neither AsDB nor IADB provided coal finance in recent years despite relatively lax policies. This might indicate that while energy policies might be important in directing energy investment
in some cases375, other factors may also be relevant such as governance, overarching
strategy, and board priorities. On downstream oil and gas financing, Chapter 12 shows MDBs continue to invest
heavily in gas in particular - accounting for the largest proportion of fossil investment
in MDBs. However, none of the MDBs yet have lending criteria for gas power. As described in Chapter 5, potential criteria to ensure that gas investments align with a 2°C pathway include ensuring fugitive emissions are controlled because high leakage
can lead to higher emissions than coal376; ensuring technological alternatives are considered so gas does not lock-out renewables;377 considering the risk of stranded
assets. Gas generation can play a complementary function with renewables, but other solutions achieve a similar effect, such as grid interconnectivity or demand side management378. In addition, research suggests gas investments should “make deep
gains in energy efficiency, and/or have a plan to incorporate carbon capture and storage”379. EIB and EBRD are soon updating their energy strategies, providing an opportunity to integrate lending criteria for gas investments.
375 See: https://www.devex.com/news/coal-or-no-coal-a-balancing-act-for-mdbs-87610
376 New Climate Economy (2015). Natural Gas: Guardrails for A Potential Climate Bridge.
377 New Climate Economy (2015). Natural Gas: Guardrails for A Potential Climate Bridge.
378 Climate Action Tracker (2017) Foot Off The Gas
379 WRI (2017) Financing the Energy Transition
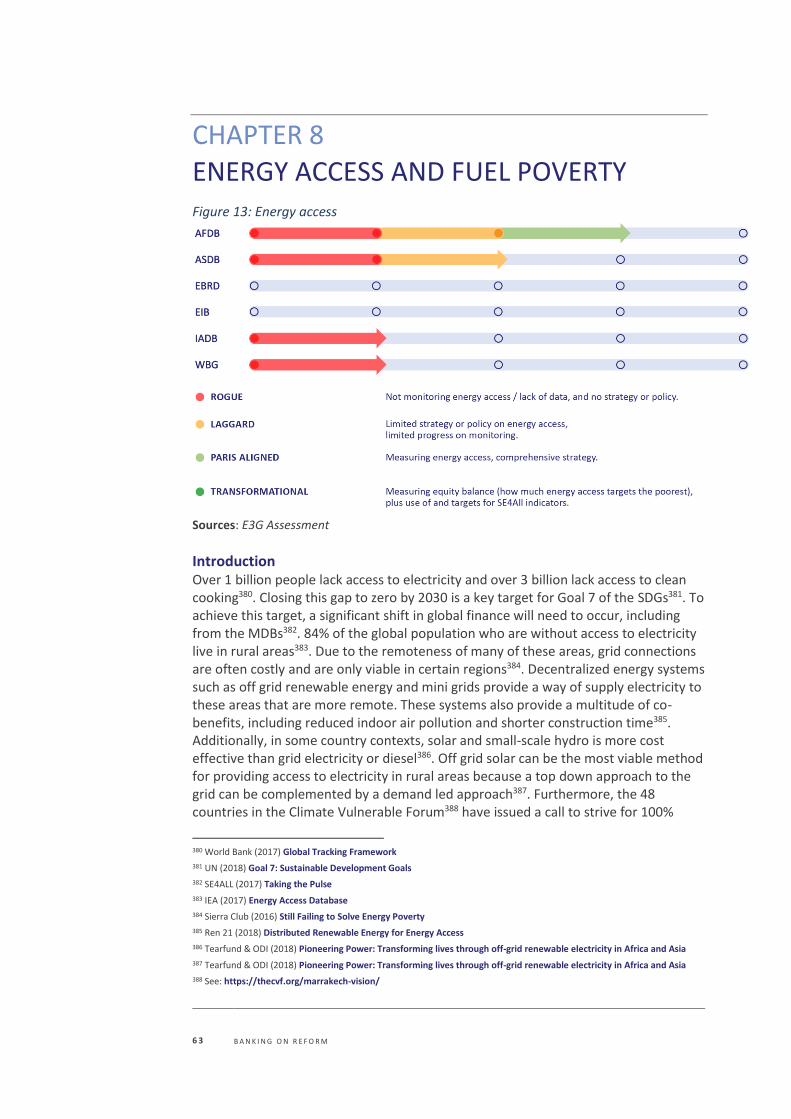
6 3 B A N K I N G O N R E F O R M
CHAPTER 8
ENERGY ACCESS AND FUEL POVERTY Figure 13: Energy access
Sources: E3G Assessment
Introduction Over 1 billion people lack access to electricity and over 3 billion lack access to clean cooking380. Closing this gap to zero by 2030 is a key target for Goal 7 of the SDGs381. To achieve this target, a significant shift in global finance will need to occur, including from the MDBs382. 84% of the global population who are without access to electricity live in rural areas383. Due to the remoteness of many of these areas, grid connections are often costly and are only viable in certain regions384. Decentralized energy systems such as off grid renewable energy and mini grids provide a way of supply electricity to these areas that are more remote. These systems also provide a multitude of co-benefits, including reduced indoor air pollution and shorter construction time385. Additionally, in some country contexts, solar and small-scale hydro is more cost effective than grid electricity or diesel386. Off grid solar can be the most viable method for providing access to electricity in rural areas because a top down approach to the grid can be complemented by a demand led approach387. Furthermore, the 48 countries in the Climate Vulnerable Forum388 have issued a call to strive for 100%
380 World Bank (2017) Global Tracking Framework
381 UN (2018) Goal 7: Sustainable Development Goals
382 SE4ALL (2017) Taking the Pulse
383 IEA (2017) Energy Access Database
384 Sierra Club (2016) Still Failing to Solve Energy Poverty
385 Ren 21 (2018) Distributed Renewable Energy for Energy Access
386 Tearfund & ODI (2018) Pioneering Power: Transforming lives through off-grid renewable electricity in Africa and Asia
387 Tearfund & ODI (2018) Pioneering Power: Transforming lives through off-grid renewable electricity in Africa and Asia
388 See: https://thecvf.org/marrakech-vision/
6 4 B A N K I N G O N R E F O R M
renewable energy by 2050 while working to end energy poverty389. This sets out a strong and ambitious goal for sustainable energy access which MDBs should support.
The definition of fuel or energy poverty refers to not only to inadequate access to lighting and electric appliances but also inadequate access to ‘modern’ fuels for cooking and space heating390. The UN and World Bank lead the Sustainable Energy 4 All initiative (SE4All)391. This has developed the ‘Multi-Tier Framework’ for energy
access are proposed benchmarks which can be used to measure the progress towards the SDG7 goal and the quantity and quality of the energy supply392. All MDBs have signed up to this partnership, although they do not all use the SE4ALL metrics. It is
argued MDBs should strive for projects that meet a certain level of access to energy as proposed by this framework. Tier 3 provides adequate peak capacity and availability of supply for electricity. It is also argued Tier 4 should be the minimum for cooking because of the negative impacts of indoor air pollution from cooking on health393.
389 See: https://www.independent.co.uk/news/world/renewable-energy-target-climate-united-nations-climate-change-vulnerable-nations-ethiopia-a7425411.html
390 Bouzarovski & Petrova (2015) A global perspective on domestic energy deprivation
391 Se4ALL (2018) About Us
392 ESMAP (2015) Beyond Connections: Energy Access Redefined
393 UNNGLS (2015) Energy SDG Indicators
394 Climate Investment Funds (2016) Pilot Program for Climate Resilience
395 See https://www.centreforpublicimpact.org/case-study/solar-home-systems-bangladesh/
396 See http://www.worldbank.org/en/news/feature/2014/01/15/lighting-up-rural-communities-in-bangladesh
397 See http://www.worldbank.org/en/news/feature/2014/01/15/lighting-up-rural-communities-in-bangladesh
Box 4: Bangladesh – Solar Home Systems (SHS)394
Launched in 2003, the state-owned Infrastructure Development Company Ltd (IDCOL), and the WB joined forces to support the first Rural Electrification and Renewable Energy Development Project (RERED). The aim was to bring electricity to the country’s poorest regions. The project was set up with selected local partner organisations (POs) who extend loans, install the solar home systems (SHS), and provide after-sales support, while IDCOL provides grants, soft loans and technical assistance. POs are microfinance institutions which are active in rural areas and involve local private vendors in importing and installing SHS; allowing firms to offer families low down-payments of up to 3 years in exchange for SHS. Outcomes: The target to install 50,000 SHS by 2008 was achieved 3 years ahead of schedule and for $2m below the estimated cost. By May 2017, 4.12 million SHS systems had been installed, with a focus on areas where electrification and grid expansion were particularly challenging395. RERED II is building on this success, piloting renewable energy based mini grids, and supporting solar irrigation pumps to reduce costs of irrigation to the farmers which saves on foreign exchange from importing diesel396. Transformational aspect: The programme is effectively deploying subsidies with concessional loans to make small scale solar installations affordable. The subsidy cost is small compared to grid extension and gradually decreasing, falling from 25% of the average unit price in 2004 to 10% in 2012. The project also has positive impacts on the local manufacturing industry. Initially, batteries were the only component produced in Bangladesh and sold as part of an SHS. However, gradually all components (including solar panels) began to be produced locally. This contributed to the growth of the renewable energy market in Bangladesh as a whole, which employed 114,000 people in 2013 alone397. The estimated nationwide reduction in carbon emissions due to switching from kerosene lamps to solar home systems is 160,000 metric tons a year, reducing air pollution.
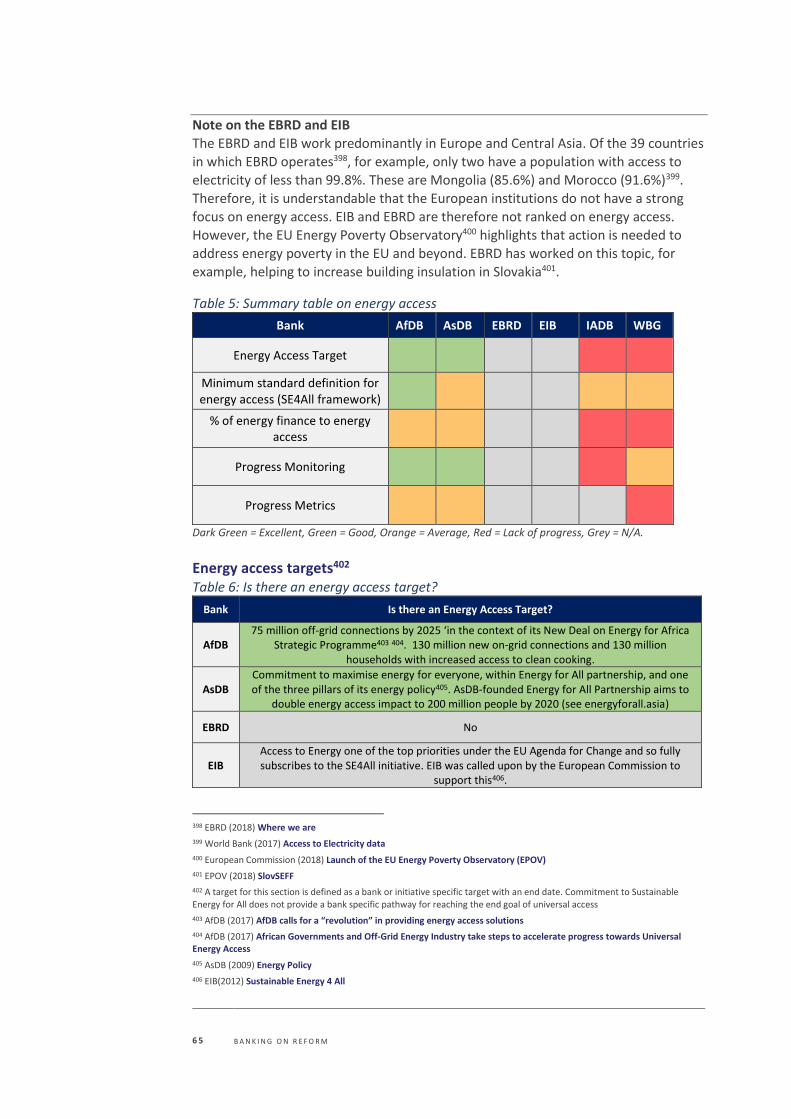
6 5 B A N K I N G O N R E F O R M
Note on the EBRD and EIB The EBRD and EIB work predominantly in Europe and Central Asia. Of the 39 countries in which EBRD operates398, for example, only two have a population with access to electricity of less than 99.8%. These are Mongolia (85.6%) and Morocco (91.6%)399. Therefore, it is understandable that the European institutions do not have a strong
focus on energy access. EIB and EBRD are therefore not ranked on energy access. However, the EU Energy Poverty Observatory400 highlights that action is needed to address energy poverty in the EU and beyond. EBRD has worked on this topic, for example, helping to increase building insulation in Slovakia401.
Table 5: Summary table on energy access
Bank AfDB AsDB EBRD EIB IADB WBG
Energy Access Target
Minimum standard definition for energy access (SE4All framework)
% of energy finance to energy access
Progress Monitoring
Progress Metrics
Dark Green = Excellent, Green = Good, Orange = Average, Red = Lack of progress, Grey = N/A.
Energy access targets402 Table 6: Is there an energy access target?
Bank Is there an Energy Access Target?
AfDB 75 million off-grid connections by 2025 ‘in the context of its New Deal on Energy for Africa
Strategic Programme403 404. 130 million new on-grid connections and 130 million households with increased access to clean cooking.
AsDB Commitment to maximise energy for everyone, within Energy for All partnership, and one of the three pillars of its energy policy405. AsDB-founded Energy for All Partnership aims to
double energy access impact to 200 million people by 2020 (see energyforall.asia)
EBRD No
EIB Access to Energy one of the top priorities under the EU Agenda for Change and so fully subscribes to the SE4All initiative. EIB was called upon by the European Commission to
support this406.
398 EBRD (2018) Where we are
399 World Bank (2017) Access to Electricity data
400 European Commission (2018) Launch of the EU Energy Poverty Observatory (EPOV)
401 EPOV (2018) SlovSEFF
402 A target for this section is defined as a bank or initiative specific target with an end date. Commitment to Sustainable Energy for All does not provide a bank specific pathway for reaching the end goal of universal access
403 AfDB (2017) AfDB calls for a “revolution” in providing energy access solutions
404 AfDB (2017) African Governments and Off-Grid Energy Industry take steps to accelerate progress towards Universal Energy Access
405 AsDB (2009) Energy Policy
406 EIB(2012) Sustainable Energy 4 All
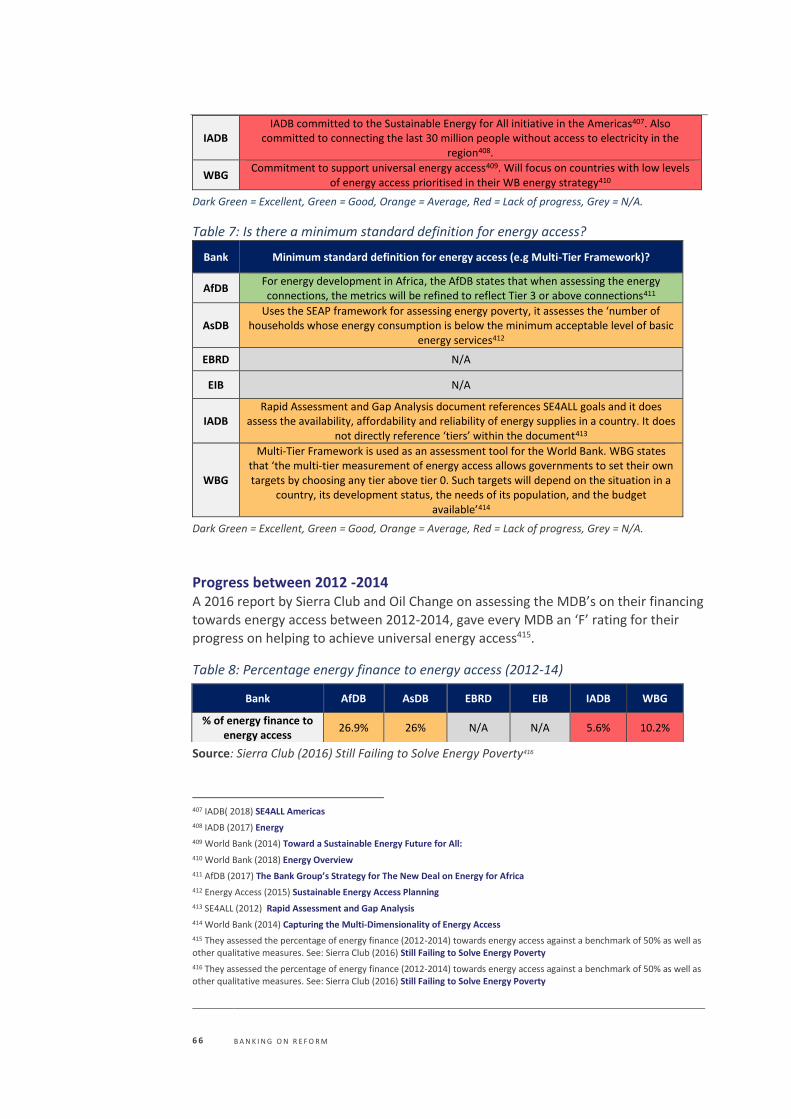
6 6 B A N K I N G O N R E F O R M
IADB IADB committed to the Sustainable Energy for All initiative in the Americas407. Also
committed to connecting the last 30 million people without access to electricity in the region408.
WBG Commitment to support universal energy access409. Will focus on countries with low levels
of energy access prioritised in their WB energy strategy410
Dark Green = Excellent, Green = Good, Orange = Average, Red = Lack of progress, Grey = N/A.
Table 7: Is there a minimum standard definition for energy access?
Bank Minimum standard definition for energy access (e.g Multi-Tier Framework)?
AfDB For energy development in Africa, the AfDB states that when assessing the energy connections, the metrics will be refined to reflect Tier 3 or above connections411
AsDB Uses the SEAP framework for assessing energy poverty, it assesses the ‘number of
households whose energy consumption is below the minimum acceptable level of basic energy services412
EBRD N/A
EIB N/A
IADB Rapid Assessment and Gap Analysis document references SE4ALL goals and it does
assess the availability, affordability and reliability of energy supplies in a country. It does not directly reference ‘tiers’ within the document413
WBG
Multi-Tier Framework is used as an assessment tool for the World Bank. WBG states that ‘the multi-tier measurement of energy access allows governments to set their own targets by choosing any tier above tier 0. Such targets will depend on the situation in a
country, its development status, the needs of its population, and the budget available’414
Dark Green = Excellent, Green = Good, Orange = Average, Red = Lack of progress, Grey = N/A.
Progress between 2012 -2014 A 2016 report by Sierra Club and Oil Change on assessing the MDB’s on their financing
towards energy access between 2012-2014, gave every MDB an ‘F’ rating for their progress on helping to achieve universal energy access415.
Table 8: Percentage energy finance to energy access (2012-14)
Source: Sierra Club (2016) Still Failing to Solve Energy Poverty416
407 IADB( 2018) SE4ALL Americas
408 IADB (2017) Energy
409 World Bank (2014) Toward a Sustainable Energy Future for All:
410 World Bank (2018) Energy Overview
411 AfDB (2017) The Bank Group’s Strategy for The New Deal on Energy for Africa
412 Energy Access (2015) Sustainable Energy Access Planning
413 SE4ALL (2012) Rapid Assessment and Gap Analysis
414 World Bank (2014) Capturing the Multi-Dimensionality of Energy Access
415 They assessed the percentage of energy finance (2012-2014) towards energy access against a benchmark of 50% as well as other qualitative measures. See: Sierra Club (2016) Still Failing to Solve Energy Poverty
416 They assessed the percentage of energy finance (2012-2014) towards energy access against a benchmark of 50% as well as other qualitative measures. See: Sierra Club (2016) Still Failing to Solve Energy Poverty
Bank AfDB AsDB EBRD EIB IADB WBG
% of energy finance to energy access
26.9% 26% N/A N/A 5.6% 10.2%
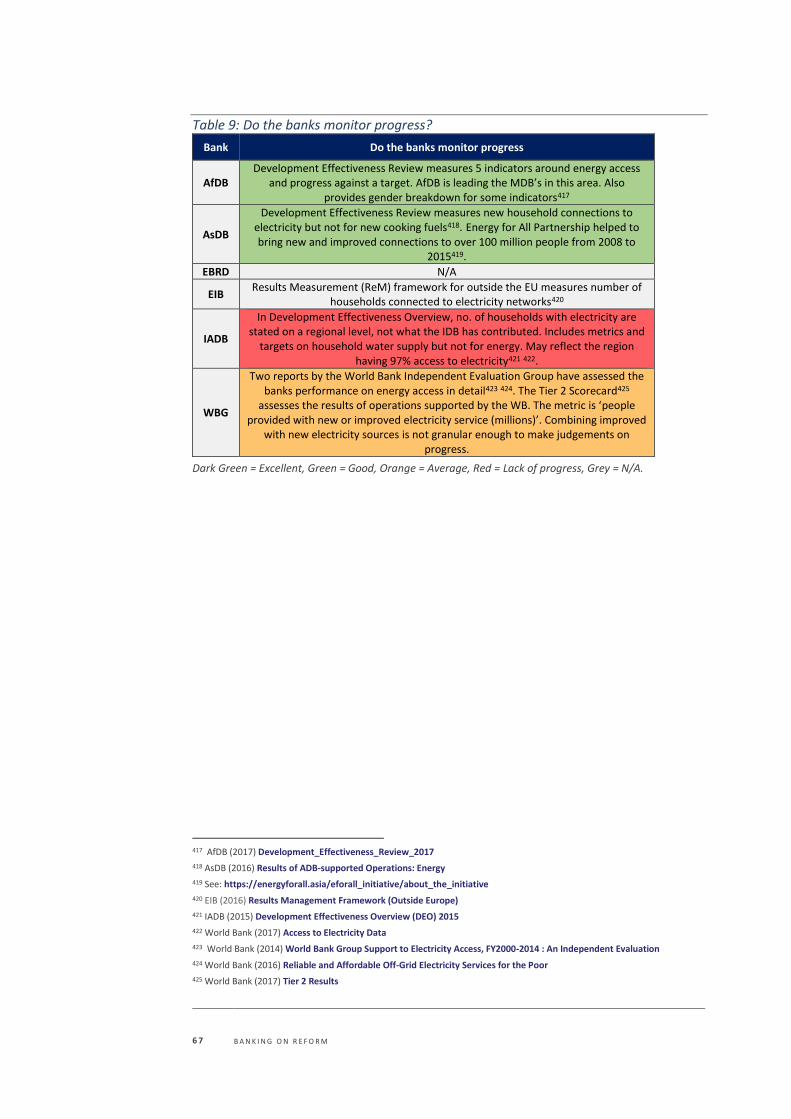
6 7 B A N K I N G O N R E F O R M
Table 9: Do the banks monitor progress?
Bank Do the banks monitor progress
AfDB Development Effectiveness Review measures 5 indicators around energy access
and progress against a target. AfDB is leading the MDB’s in this area. Also provides gender breakdown for some indicators417
AsDB
Development Effectiveness Review measures new household connections to electricity but not for new cooking fuels418. Energy for All Partnership helped to bring new and improved connections to over 100 million people from 2008 to
2015419.
EBRD N/A
EIB Results Measurement (ReM) framework for outside the EU measures number of
households connected to electricity networks420
IADB
In Development Effectiveness Overview, no. of households with electricity are stated on a regional level, not what the IDB has contributed. Includes metrics and
targets on household water supply but not for energy. May reflect the region having 97% access to electricity421 422.
WBG
Two reports by the World Bank Independent Evaluation Group have assessed the banks performance on energy access in detail423 424. The Tier 2 Scorecard425
assesses the results of operations supported by the WB. The metric is ‘people provided with new or improved electricity service (millions)’. Combining improved
with new electricity sources is not granular enough to make judgements on progress.
Dark Green = Excellent, Green = Good, Orange = Average, Red = Lack of progress, Grey = N/A.
417 AfDB (2017) Development_Effectiveness_Review_2017
418 AsDB (2016) Results of ADB-supported Operations: Energy
419 See: https://energyforall.asia/eforall_initiative/about_the_initiative
420 EIB (2016) Results Management Framework (Outside Europe)
421 IADB (2015) Development Effectiveness Overview (DEO) 2015
422 World Bank (2017) Access to Electricity Data
423 World Bank (2014) World Bank Group Support to Electricity Access, FY2000-2014 : An Independent Evaluation
424 World Bank (2016) Reliable and Affordable Off-Grid Electricity Services for the Poor
425 World Bank (2017) Tier 2 Results
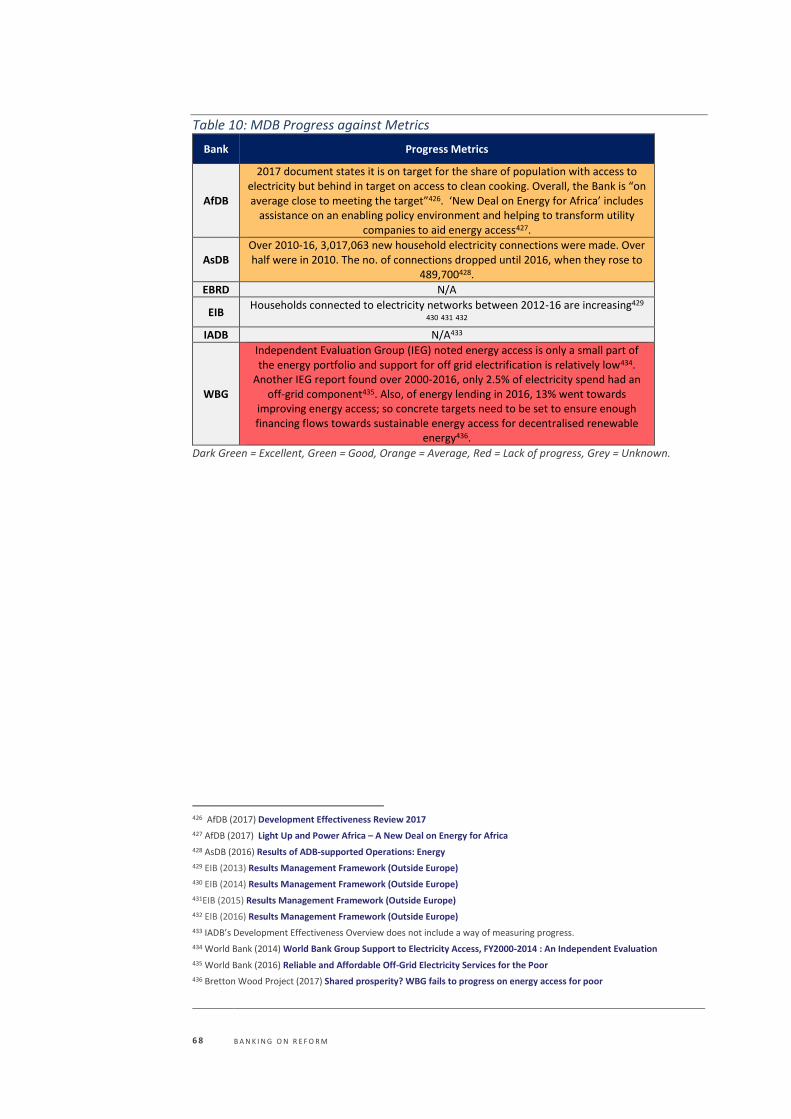
6 8 B A N K I N G O N R E F O R M
Table 10: MDB Progress against Metrics
Bank Progress Metrics
AfDB
2017 document states it is on target for the share of population with access to electricity but behind in target on access to clean cooking. Overall, the Bank is “on average close to meeting the target”426. ‘New Deal on Energy for Africa’ includes
assistance on an enabling policy environment and helping to transform utility companies to aid energy access427.
AsDB Over 2010-16, 3,017,063 new household electricity connections were made. Over half were in 2010. The no. of connections dropped until 2016, when they rose to
489,700428.
EBRD N/A
EIB Households connected to electricity networks between 2012-16 are increasing429
430 431 432
IADB N/A433
WBG
Independent Evaluation Group (IEG) noted energy access is only a small part of the energy portfolio and support for off grid electrification is relatively low434.
Another IEG report found over 2000-2016, only 2.5% of electricity spend had an off-grid component435. Also, of energy lending in 2016, 13% went towards
improving energy access; so concrete targets need to be set to ensure enough financing flows towards sustainable energy access for decentralised renewable
energy436.
Dark Green = Excellent, Green = Good, Orange = Average, Red = Lack of progress, Grey = Unknown.
426 AfDB (2017) Development Effectiveness Review 2017
427 AfDB (2017) Light Up and Power Africa – A New Deal on Energy for Africa
428 AsDB (2016) Results of ADB-supported Operations: Energy
429 EIB (2013) Results Management Framework (Outside Europe)
430 EIB (2014) Results Management Framework (Outside Europe)
431EIB (2015) Results Management Framework (Outside Europe)
432 EIB (2016) Results Management Framework (Outside Europe)
433 IADB’s Development Effectiveness Overview does not include a way of measuring progress.
434 World Bank (2014) World Bank Group Support to Electricity Access, FY2000-2014 : An Independent Evaluation
435 World Bank (2016) Reliable and Affordable Off-Grid Electricity Services for the Poor
436 Bretton Wood Project (2017) Shared prosperity? WBG fails to progress on energy access for poor
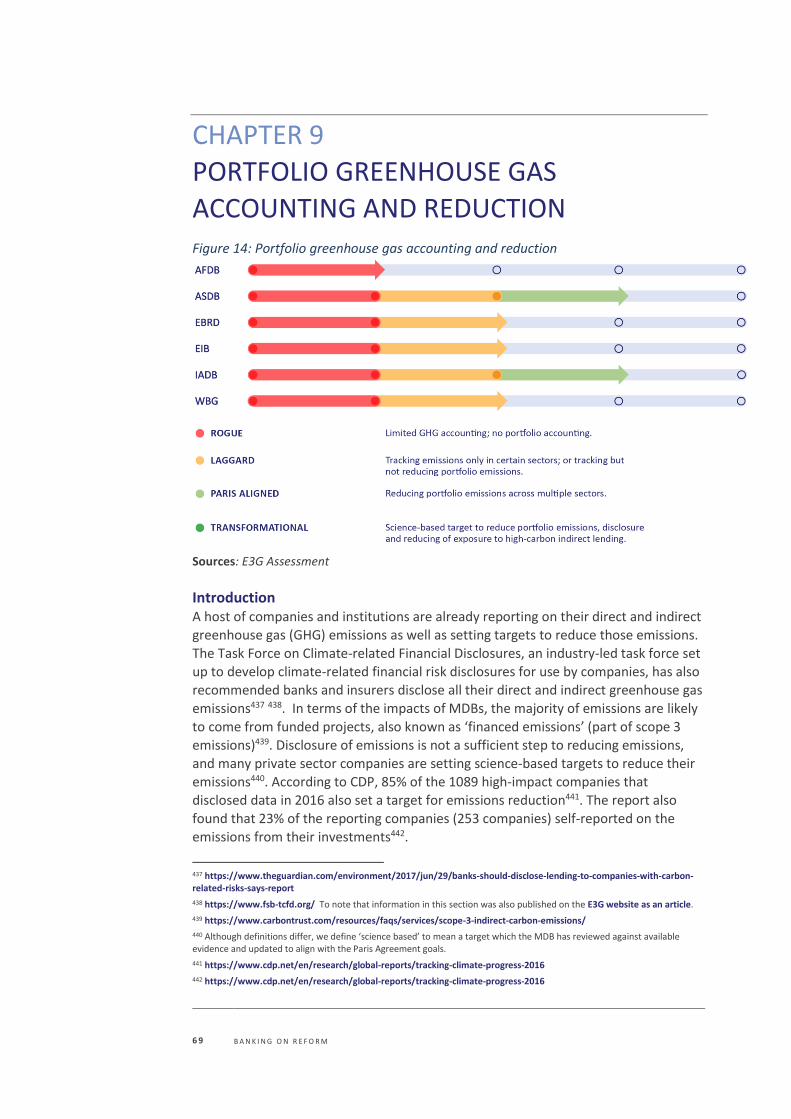
6 9 B A N K I N G O N R E F O R M
CHAPTER 9
PORTFOLIO GREENHOUSE GAS
ACCOUNTING AND REDUCTION Figure 14: Portfolio greenhouse gas accounting and reduction
Sources: E3G Assessment
Introduction A host of companies and institutions are already reporting on their direct and indirect greenhouse gas (GHG) emissions as well as setting targets to reduce those emissions. The Task Force on Climate-related Financial Disclosures, an industry-led task force set
up to develop climate-related financial risk disclosures for use by companies, has also recommended banks and insurers disclose all their direct and indirect greenhouse gas emissions437 438. In terms of the impacts of MDBs, the majority of emissions are likely
to come from funded projects, also known as ‘financed emissions’ (part of scope 3 emissions)439. Disclosure of emissions is not a sufficient step to reducing emissions,
and many private sector companies are setting science-based targets to reduce their emissions440. According to CDP, 85% of the 1089 high-impact companies that
disclosed data in 2016 also set a target for emissions reduction441. The report also found that 23% of the reporting companies (253 companies) self-reported on the emissions from their investments442.
437 https://www.theguardian.com/environment/2017/jun/29/banks-should-disclose-lending-to-companies-with-carbon-related-risks-says-report
438 https://www.fsb-tcfd.org/ To note that information in this section was also published on the E3G website as an article.
439 https://www.carbontrust.com/resources/faqs/services/scope-3-indirect-carbon-emissions/
440 Although definitions differ, we define ‘science based’ to mean a target which the MDB has reviewed against available evidence and updated to align with the Paris Agreement goals.
441 https://www.cdp.net/en/research/global-reports/tracking-climate-progress-2016
442 https://www.cdp.net/en/research/global-reports/tracking-climate-progress-2016
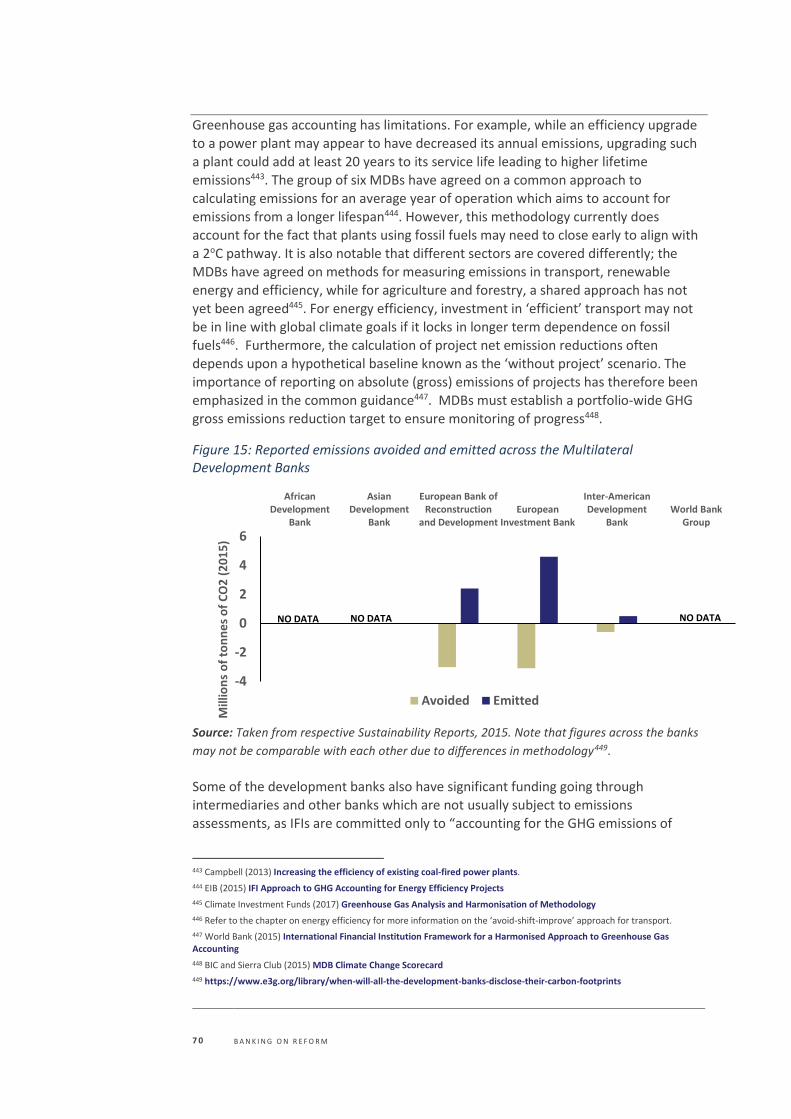
7 0 B A N K I N G O N R E F O R M
Greenhouse gas accounting has limitations. For example, while an efficiency upgrade to a power plant may appear to have decreased its annual emissions, upgrading such a plant could add at least 20 years to its service life leading to higher lifetime emissions443. The group of six MDBs have agreed on a common approach to calculating emissions for an average year of operation which aims to account for
emissions from a longer lifespan444. However, this methodology currently does account for the fact that plants using fossil fuels may need to close early to align with a 2oC pathway. It is also notable that different sectors are covered differently; the MDBs have agreed on methods for measuring emissions in transport, renewable energy and efficiency, while for agriculture and forestry, a shared approach has not
yet been agreed445. For energy efficiency, investment in ‘efficient’ transport may not be in line with global climate goals if it locks in longer term dependence on fossil
fuels446. Furthermore, the calculation of project net emission reductions often depends upon a hypothetical baseline known as the ‘without project’ scenario. The importance of reporting on absolute (gross) emissions of projects has therefore been emphasized in the common guidance447. MDBs must establish a portfolio-wide GHG gross emissions reduction target to ensure monitoring of progress448.
Figure 15: Reported emissions avoided and emitted across the Multilateral Development Banks
Source: Taken from respective Sustainability Reports, 2015. Note that figures across the banks
may not be comparable with each other due to differences in methodology449.
Some of the development banks also have significant funding going through intermediaries and other banks which are not usually subject to emissions
assessments, as IFIs are committed only to “accounting for the GHG emissions of
443 Campbell (2013) Increasing the efficiency of existing coal-fired power plants.
444 EIB (2015) IFI Approach to GHG Accounting for Energy Efficiency Projects
445 Climate Investment Funds (2017) Greenhouse Gas Analysis and Harmonisation of Methodology
446 Refer to the chapter on energy efficiency for more information on the ‘avoid-shift-improve’ approach for transport.
447 World Bank (2015) International Financial Institution Framework for a Harmonised Approach to Greenhouse Gas Accounting
448 BIC and Sierra Club (2015) MDB Climate Change Scorecard
449 https://www.e3g.org/library/when-will-all-the-development-banks-disclose-their-carbon-footprints
-4
-2
0
2
4
6
AfricanDevelopment
Bank
AsianDevelopment
Bank
European Bank ofReconstruction
and DevelopmentEuropean
Investment Bank
Inter-AmericanDevelopment
BankWorld Bank
Group
Mill
ion
s o
f to
nn
es
of
CO
2 (
20
15
)
Avoided Emitted
NO DATA NO DATA NO DATA
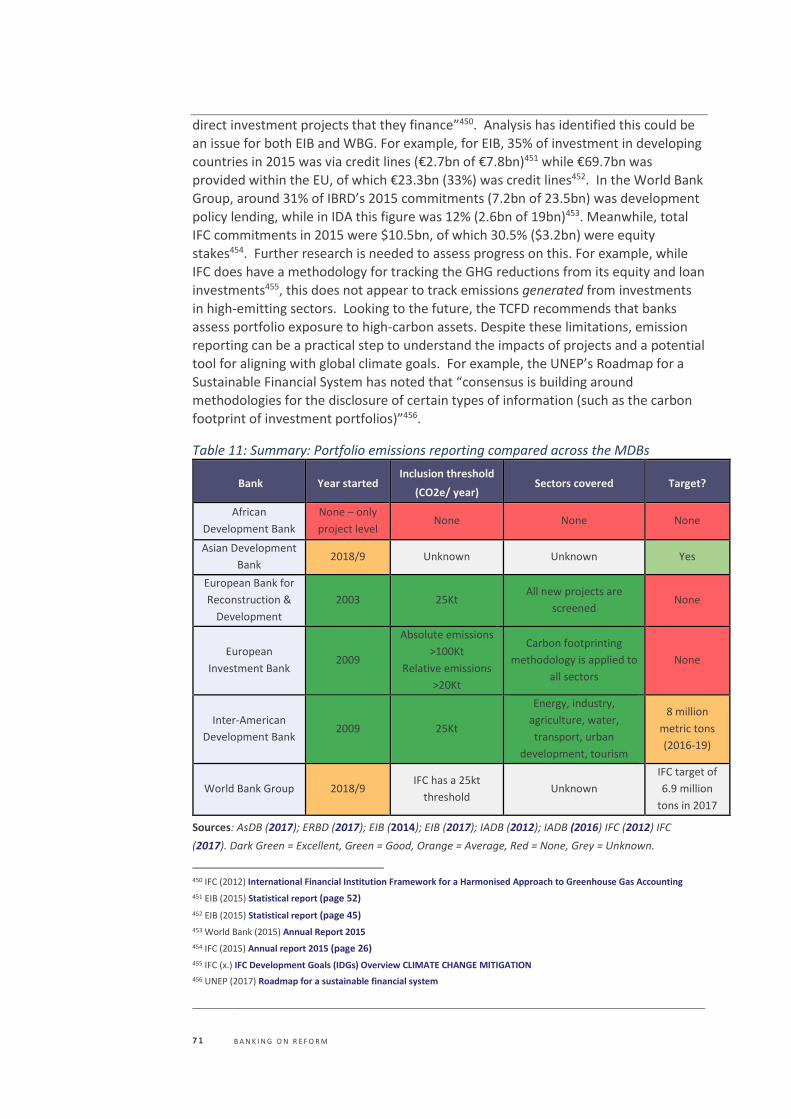
7 1 B A N K I N G O N R E F O R M
direct investment projects that they finance”450. Analysis has identified this could be an issue for both EIB and WBG. For example, for EIB, 35% of investment in developing countries in 2015 was via credit lines (€2.7bn of €7.8bn)451 while €69.7bn was provided within the EU, of which €23.3bn (33%) was credit lines452. In the World Bank Group, around 31% of IBRD’s 2015 commitments (7.2bn of 23.5bn) was development
policy lending, while in IDA this figure was 12% (2.6bn of 19bn)453. Meanwhile, total IFC commitments in 2015 were $10.5bn, of which 30.5% ($3.2bn) were equity stakes454. Further research is needed to assess progress on this. For example, while IFC does have a methodology for tracking the GHG reductions from its equity and loan investments455, this does not appear to track emissions generated from investments
in high-emitting sectors. Looking to the future, the TCFD recommends that banks assess portfolio exposure to high-carbon assets. Despite these limitations, emission
reporting can be a practical step to understand the impacts of projects and a potential tool for aligning with global climate goals. For example, the UNEP’s Roadmap for a Sustainable Financial System has noted that “consensus is building around methodologies for the disclosure of certain types of information (such as the carbon footprint of investment portfolios)”456.
Table 11: Summary: Portfolio emissions reporting compared across the MDBs
Bank Year started Inclusion threshold
(CO2e/ year) Sectors covered Target?
African
Development Bank
None – only
project level None None None
Asian Development
Bank 2018/9 Unknown Unknown Yes
European Bank for
Reconstruction &
Development
2003 25Kt All new projects are
screened None
European
Investment Bank 2009
Absolute emissions
>100Kt
Relative emissions
>20Kt
Carbon footprinting
methodology is applied to
all sectors
None
Inter-American
Development Bank 2009 25Kt
Energy, industry,
agriculture, water,
transport, urban
development, tourism
8 million
metric tons
(2016-19)
World Bank Group 2018/9 IFC has a 25kt
threshold Unknown
IFC target of
6.9 million
tons in 2017
Sources: AsDB (2017); ERBD (2017); EIB (2014); EIB (2017); IADB (2012); IADB (2016) IFC (2012) IFC
(2017). Dark Green = Excellent, Green = Good, Orange = Average, Red = None, Grey = Unknown.
450 IFC (2012) International Financial Institution Framework for a Harmonised Approach to Greenhouse Gas Accounting
451 EIB (2015) Statistical report (page 52)
452 EIB (2015) Statistical report (page 45)
453 World Bank (2015) Annual Report 2015
454 IFC (2015) Annual report 2015 (page 26)
455 IFC (x.) IFC Development Goals (IDGs) Overview CLIMATE CHANGE MITIGATION
456 UNEP (2017) Roadmap for a sustainable financial system
7 2 B A N K I N G O N R E F O R M
African Development Bank (AfDB): According to the recent updates from a report to the Climate Investment Funds
Board, AfDB is currently piloting a project level GHG emission accounting tool which started with the energy sector457. AfDB has deployed the GHG emissions accounting tool since 2016 to assess emissions on a project by project basis, and the sectors covered at present include energy, land use and agriculture, water and sanitation and transport458. It has been indicated that the GHG accounting and reporting at project
level is used to measure and report GHG project emissions on a case by case basis459. AfDB does not currently appear to aggregate or disclose emissions over its portfolio460.
Asian Development Bank (AsDB): In its climate change operational framework, published in 2017, the Asian Development Bank became the first among the group of MDBs to commit to reducing its overall portfolio GHG emissions461. AsDB is currently tracking the GHG reductions of completed AsDB energy sector projects462. However, it is not known which sectors
will be covered by the new commitment, and the commitment of “peaking” emissions by 2030 is weak463 as global emissions need to peak as soon as possible if the world is
to have a chance of staying below 2°C of warming. The transport GHG guidelines state that AsDB’s ‘Safeguard Policy Statement… asks that all projects be screened in
terms of their gross GHG emissions and that more detailed analysis be conducted if a
certain threshold is exceeded’464. The 2009 Safeguard Policy465 states “the significance
threshold to be considered for these requirements is generally 100,000 tons” (CO2e/year), a threshold which is under evaluation466.
In terms of the methodology for estimating net GHG emissions, AsDB’s approach involves comparing the project emissions to the ‘without project’ scenario - a
hypothetical scenario that can reasonably represent the GHG emissions that would occur in the absence of the AsDB project467. As for the IFI’s common agreed
methodology, this aims to take into account emissions resulting from a longer project lifespan as emissions are estimated for a representative year of operation468. However, energy efficiency rehabilitation or retrofit projects often involve an increase
of output related to increased capacity and extended operating life – and the methodology assumes that this displaces production from new capacity that would
457 Climate Investment Funds (2017) Greenhouse Gas Analysis and Harmonisation of Methodology
458 Information received from the AfDB
459 Information received from the AfDB
460 A target to reduce gross portfolio emissions may not be suitable for the AfDB considering Africa’s emissions are the lowest of all regions, in which case a target for aggregate net emissions from projects may be more suitable.
461 AsDB (2017) Climate Change operational framework
462 AsDB (2017) 2016 Development Effectiveness Review This currently appears to only track GHG reductions.
463 AsDB (2017) Climate Change operational framework
464 AsDB (2016) Guidelines for estimating greenhouse gas emissions of Asian Development Bank projects
465 AsDB (2009) Safeguard Policy
466 This is undergoing evaluation in 2018. It has been indicated this will likely result in a threshold of 25kt and involve disclosure of absolute emissions, in line with best practices.
467 AsDB (2017) Guidelines for estimating greenhouse gas emissions of Asian Development Bank projects
468 EIB (2015) IFI Approach to GHG Accounting for Energy Efficiency Projects
7 3 B A N K I N G O N R E F O R M
have been built in the country or elsewhere. This shows that estimated GHG reductions are often dependent on a range of assumptions made about the no-project baseline.
European Bank for Reconstruction and Development (EBRD): Within EBRD, emission reporting over the portfolio (loan and equity investments) has been in place since 2003469. While an EBRD document from 2010 previously cited an
inclusion threshold of projects over 100Kt of CO2, this document was since updated in 2017470 and it appears that the EBRD are now collating the GHG emissions from all projects over 25ktCO2 per year in line with best practices. In terms of calculating
project GHG emissions, like other MDBs, EBRD estimates the ‘change’ in emissions compared to what would have occurred in the absence of the project471. Absolute (gross) emissions are also reported472. The EBRD does not appear to have a target in place to reduce its portfolio emissions.
European Investment Bank (EIB): The EIB appears to have a comprehensive system for tracking portfolio emissions which has been in place since 2009. The EIB Carbon Footprint Exercise includes
“direct Investment Loans and large Framework Loan allocations” however it is notable that intermediary lending is “not currently included due to the limited information
available to carry out a useful calculation”473. The inclusion threshold for projects is
for absolute (gross) emissions greater than 100,000tCO2e and relative emissions
(either positive or negative) of greater than 20,000tCO2e, which the EIB states capture approximately 95% of the absolute and relative GHG emissions from
projects474. The sectoral coverage is broad with emissions from the waste, industrial, transport and energy sectors included. Agricultural emissions and water supply emissions are not covered475.
It is notable that EIB has been a leader in terms of reporting on absolute (gross)
emissions as well as relative emissions, a key step to understanding the climate impact of any portfolio, and EIB has been advocating for other MDBs and IFIs to adopt this approach and to report absolute and relative emissions476. The 2016 carbon
footprint analysis showed that total absolute GHG emissions were estimated at 2.4 million tonnes of CO2e per year, with carbon sequestration by forestry estimated at
3.5 million tonnes of CO2e per year, meaning that for the first time, aggregated sequestration of carbon by forestry financing exceeded the absolute emissions from
other sectors477. EIB does not yet have a specific commitment to reduce portfolio
469 EBRD (2010) Methodology for assessment of greenhouse gas emissions
470 EBRD (2017) Protocol for assessment of greenhouse gas emissions
471 Ibid
472 ibid
473 EIB (2014) European Investment Bank Induced GHG Footprint Our research has indicated that other development finance institutions have progressed further on this, for example, CDC Group (UK) is measuring GHG impacts of all types of investments.
474 Ibid
475 https://www.e3g.org/library/which-development-bank-is-leading-the-way-on-emissions-reporting
476 Information received from EIB. This has been noted as an example of institutional leadership (see Chapter 16)
477 EIB (2017) Sustainability Report 2016
7 4 B A N K I N G O N R E F O R M
emissions. EIB’s guidance details that where a baseline is used to calculate the relative emissions, it is important to check that the proposed scenario is credible. The guidance states that the baseline scenario must meet three conditions: (1) a socio-economic test that the baseline has an economic rate of return (2) legal requirement test that the baseline complies with legal requirements and (3) the life-expired asset
test: the baseline alternative could not assume to continue existing assets beyond their economic life478.
Inter-American Development Bank (IADB): The IADB appears to be leading the way with one of the most comprehensive systems
for assessing emissions. The approach covers projects in the seven sectors that dominate the portfolio GHG emissions footprint —energy, industry, agriculture, water and sanitation, transport, urban development, and tourism479. Moreover, all direct investment projects with emissions, or emissions savings, exceeding 25 kilotons CO2-
equivalents (CO2e) per annum have been assessed, which is the lowest threshold among the banks480. The IADB’s approach is transparent and states: “Presenting gross positive emissions and net savings numbers alongside each other allows for a holistic view of the carbon footprint of the activity of an institution.... It is important
to highlight positive (+) gross GHG emissions figures in order to be transparent and credible and to create an awareness of high-emission projects”481. IADB is tracking
the emissions reduced (avoided net emissions) and generated (generated gross
emissions) across its portfolio, for example in 2015, the IADB reduced emissions by
0.6 million tons from low-carbon development projects, and generated emissions of 0.5 million tons from greenfield and expansion projects482. IADB has a portfolio-wide multi-year emission reduction target in its corporate results framework of reducing
emissions by 8 million tons CO2 equivalent (based on cumulative results over 2016-19), which was set against a reference baseline of 6.9 million tons CO2e over 2012-
14483. However, it is not clear if IADB has reviewed whether this target is sufficient to align with Paris Agreement goals. Therefore, this is not ranked as ‘transformational’.
World Bank Group (WBG) and International Finance Corporation (IFC): The World Bank was lagging behind until recently without a commitment to report on
aggregated emissions over its portfolio. In October 2017, President Kim announced the WBG will report on its portfolio emissions - the first time the World Bank will be
disclosing aggregate data on the greenhouse gases emitted or avoided as a result of bank-funded projects484. Bank staff have noted it will include all WBG institutions
including MIGA485. The World Bank already has methodologies for tracking GHG emissions in several sectors including energy, transport, agriculture, forestry, water
478 EIB (2014) European Investment Bank Induced GHG Footprint
479 IADB (2012) Greenhouse Gas Assessment Emissions Methodology
480 Ibid
481 Ibid
482 IADB (2016) Sustainability Report
483 IADB (2016) Corporate Results Framework
484 https://www.devex.com/news/world-bank-to-report-aggregate-greenhouse-gas-emissions-for-first-time-91292
485 Personal Communication with World Bank Group staff (December 2017)
7 5 B A N K I N G O N R E F O R M
and solid waste486. Development policy lending will not be included but staff have stated they are considering options in this regard487. Under the World Bank’s new Environment and Social Framework488, project-level gross GHG emissions will be estimated in significant sectors. The WBG does not yet have a portfolio-wide emission reduction target.
For IFC, the baseline scenario is one that occurred in the absence of the IFC project489. IFC requires clients to report on GHG emissions over a threshold of 25Kt of emissions490, and has a target of reducing portfolio emissions by 6.91 million metric tons of CO2e/year491 . The target appears to be based on reductions from mitigation
projects only492. As for IADB, it is not clear how the target was established. Furthermore, the target does not appear to be a stretching target for IFC given that
IFC’s commitments 2014-16, represented GHG reductions of 73.5 million metric tons per year493. IFC also calculates the gross GHG emissions from its real-sector investments using its Carbon Emissions Estimator Tool494. For direct investments, the expected gross emissions for projects over 25Kt are disclosed in the Environmental and Social Review Summary (ESRS)495, but this disclosure does not apply to financial
intermediaries. IFC does not appear to have set a target to reduce gross emissions.
The project greenhouse gas emissions estimates are used as an input to shadow carbon pricing (see Section 11 for more details)496.
486 Climate Investment Funds (2017) Greenhouse Gas Analysis and Harmonisation of Methodology
487 Personal Communication with World Bank Group staff (December 2017)
488 See: http://www.worldbank.org/en/programs/environmental-and-social-policies-for-projects/brief/the-environmental-and-social-framework-esf
489 IFC (2017) IFC Greenhouse Gas Reduction Accounting Guidance For Climate Related Projects The baseline activity is the scenario that would occurred in the absence of the IFC project
490 IFC (2012) Update of IFC’s Policy and Performance Standards
491 IFC (2017) IFC Annual Report 2017
492 IFC (x) IFC Development Goals (IDGs) Overview CLIMATE CHANGE MITIGATION
493 See: https://www.ifc.org/wps/wcm/connect/topics_ext_content/ifc_external_corporate_site/climate+business/priorities/measuringreporting
494 CIF (2017) Greenhouse Gas Analysis and Harmonization of Methodology
495 IFC (x) Information Routinely Made Available by IFC
496 World Bank (2017) Shadow price of carbon in economic analysis
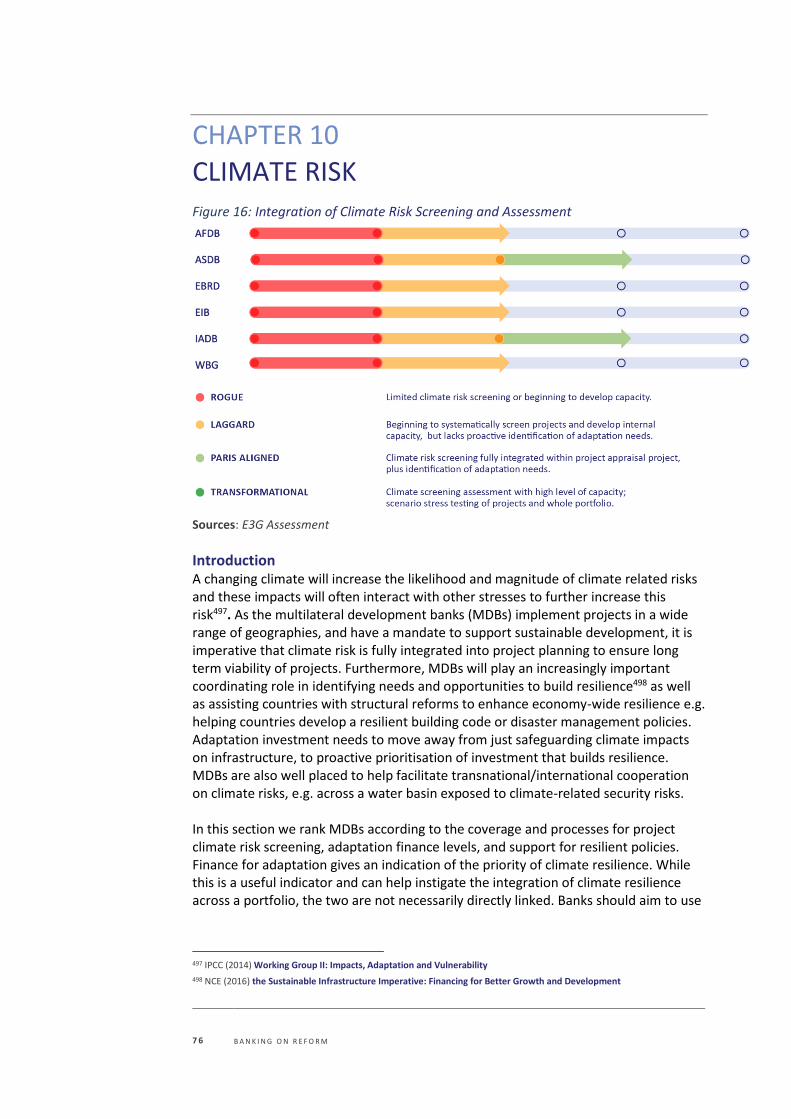
7 6 B A N K I N G O N R E F O R M
CHAPTER 10
CLIMATE RISK Figure 16: Integration of Climate Risk Screening and Assessment
Sources: E3G Assessment
Introduction A changing climate will increase the likelihood and magnitude of climate related risks and these impacts will often interact with other stresses to further increase this risk497. As the multilateral development banks (MDBs) implement projects in a wide range of geographies, and have a mandate to support sustainable development, it is imperative that climate risk is fully integrated into project planning to ensure long term viability of projects. Furthermore, MDBs will play an increasingly important coordinating role in identifying needs and opportunities to build resilience498 as well as assisting countries with structural reforms to enhance economy-wide resilience e.g. helping countries develop a resilient building code or disaster management policies. Adaptation investment needs to move away from just safeguarding climate impacts on infrastructure, to proactive prioritisation of investment that builds resilience. MDBs are also well placed to help facilitate transnational/international cooperation on climate risks, e.g. across a water basin exposed to climate-related security risks. In this section we rank MDBs according to the coverage and processes for project climate risk screening, adaptation finance levels, and support for resilient policies. Finance for adaptation gives an indication of the priority of climate resilience. While this is a useful indicator and can help instigate the integration of climate resilience across a portfolio, the two are not necessarily directly linked. Banks should aim to use
497 IPCC (2014) Working Group II: Impacts, Adaptation and Vulnerability
498 NCE (2016) the Sustainable Infrastructure Imperative: Financing for Better Growth and Development
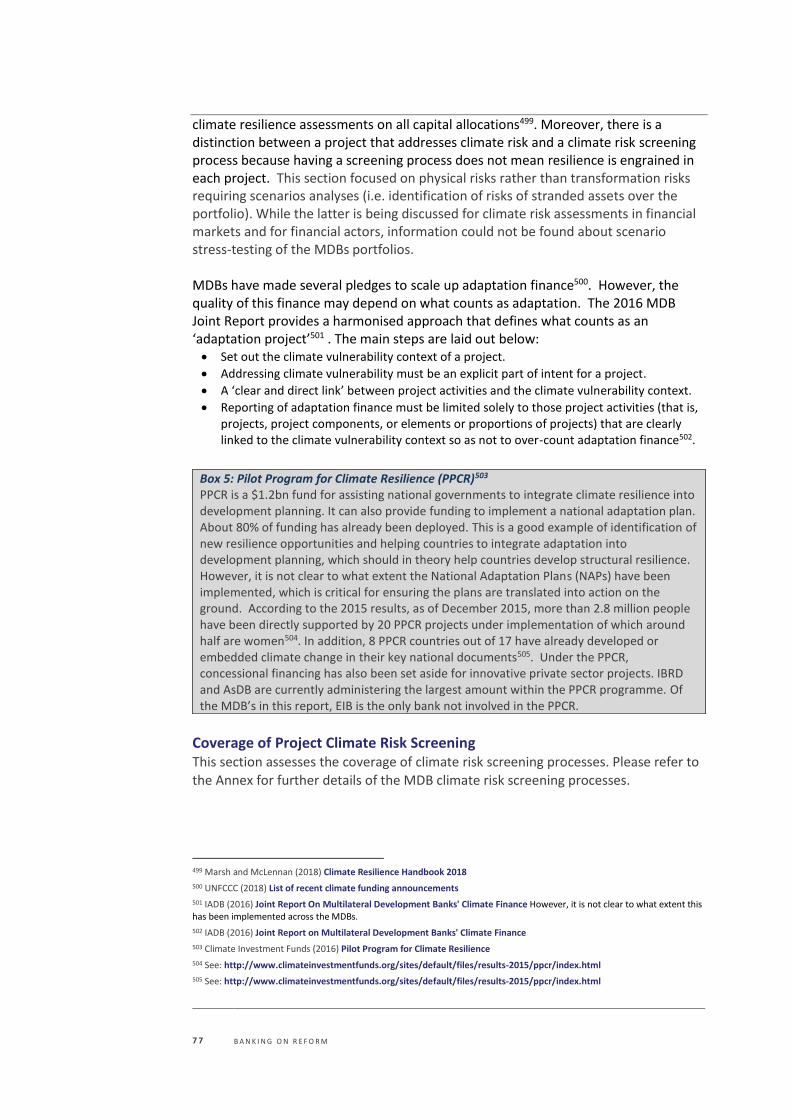
7 7 B A N K I N G O N R E F O R M
climate resilience assessments on all capital allocations499. Moreover, there is a distinction between a project that addresses climate risk and a climate risk screening process because having a screening process does not mean resilience is engrained in each project. This section focused on physical risks rather than transformation risks requiring scenarios analyses (i.e. identification of risks of stranded assets over the portfolio). While the latter is being discussed for climate risk assessments in financial markets and for financial actors, information could not be found about scenario stress-testing of the MDBs portfolios. MDBs have made several pledges to scale up adaptation finance500. However, the quality of this finance may depend on what counts as adaptation. The 2016 MDB Joint Report provides a harmonised approach that defines what counts as an ‘adaptation project’501 . The main steps are laid out below: • Set out the climate vulnerability context of a project.
• Addressing climate vulnerability must be an explicit part of intent for a project.
• A ‘clear and direct link’ between project activities and the climate vulnerability context.
• Reporting of adaptation finance must be limited solely to those project activities (that is, projects, project components, or elements or proportions of projects) that are clearly linked to the climate vulnerability context so as not to over-count adaptation finance502.
Coverage of Project Climate Risk Screening This section assesses the coverage of climate risk screening processes. Please refer to
the Annex for further details of the MDB climate risk screening processes.
499 Marsh and McLennan (2018) Climate Resilience Handbook 2018
500 UNFCCC (2018) List of recent climate funding announcements
501 IADB (2016) Joint Report On Multilateral Development Banks' Climate Finance However, it is not clear to what extent this has been implemented across the MDBs.
502 IADB (2016) Joint Report on Multilateral Development Banks' Climate Finance
503 Climate Investment Funds (2016) Pilot Program for Climate Resilience
504 See: http://www.climateinvestmentfunds.org/sites/default/files/results-2015/ppcr/index.html
505 See: http://www.climateinvestmentfunds.org/sites/default/files/results-2015/ppcr/index.html
Box 5: Pilot Program for Climate Resilience (PPCR)503 PPCR is a $1.2bn fund for assisting national governments to integrate climate resilience into development planning. It can also provide funding to implement a national adaptation plan. About 80% of funding has already been deployed. This is a good example of identification of new resilience opportunities and helping countries to integrate adaptation into development planning, which should in theory help countries develop structural resilience. However, it is not clear to what extent the National Adaptation Plans (NAPs) have been implemented, which is critical for ensuring the plans are translated into action on the ground. According to the 2015 results, as of December 2015, more than 2.8 million people have been directly supported by 20 PPCR projects under implementation of which around half are women504. In addition, 8 PPCR countries out of 17 have already developed or embedded climate change in their key national documents505. Under the PPCR, concessional financing has also been set aside for innovative private sector projects. IBRD and AsDB are currently administering the largest amount within the PPCR programme. Of the MDB’s in this report, EIB is the only bank not involved in the PPCR.
7 8 B A N K I N G O N R E F O R M
Table 12: Covering of project climate risk screening
Bank Climate Risk Screening Coverage Summary
AfDB
Requires an assessment of vulnerability to climate change as part of the environmental and social assessment process for its public
and private sector operations506.
Comprehensive coverage
AsDB All AsDB projects are screened for climate risks507. Comprehensive
coverage
EBRD The EBRD screens all its projects for climate vulnerability, there is also a focus on providing technical support for each project508 509
Comprehensive coverage
EIB
Since 2015, EIB has screened for climate risk in its External Lending Mandate (ELM) and Africa, Caribbean and Pacific (ACP)
projects. EIB’s Climate Strategy sets out the objective of screening 100% of EIB’s projects by 2020510.
Comprehensive coverage by 2020
IADB
Disaster Risk Management Policy applies in both public and private activities, and to Multilateral Investment Fund (MIF) 511
Comprehensive coverage
IBRD/ IDA
All new IDA projects are screened for short and long terms climate change risks512
Comprehensive coverage
IFC IFC is piloting climate risk tools for a number of climate vulnerable
sectors – limited information is available at present513. No information
Dark Green = Excellent, Green = Good, Orange = Average, Red = Lack of progress, Grey = Unknown.
Box 6: Qairokkum hydropower: Planning for a changing climate at EBRD In 2014 the EBRD gave a $50m loan with maturity of 15 years to Tajikstan’s state-owned power utility to modernise and rehabilitate the 126MW Qairokkum hydropower plant which supplies electricity to 500,000 people. This project was jointly financed with the Pilot Program for Climate Resilience (PPCR)514. The rehabilitation of the hydropower station incorporated climate change into the investment design – including projecting the water inflow under different climate scenarios to choose the right design across the range of projected scenarios. EBRD provided a technical assistance package to integrate resilience into the plant operations whilst facilitating knowledge sharing with relevant organisations515. Outcomes: Ensure a reliable and resilient energy supply for the local population. Transformational aspect: The technical assistance component aims to support Tajikstan’s state-owned power utility in mainstreaming climate change and climate data into operation of hydropower assets – aiming to ensure smooth operations even under changing climate conditions. This could be an example for other MDBs to replicate as hydropower operators worldwide will face the same challenges.
506 AfDB (2013) Integrated Safeguards System
507 AsDB (2014) Climate Risk Management in AsDB Projects
508 EBRD (2017) Sustainable Energy Initiative
509 EBRD (2016) Building Resilience To Climate Change: Investing In Adaptation
510 Information received from EIB.
511 IADB (2007) Disaster Risk Management Policy
512 World Bank (2018) Climate Risk Screening Tools
513 Information received directly from IFC.
514 This was complemented with the contribution of the Pilot Program for Climate Resilience (PPCR) of about $21m consisting of $10m loan – maturity 40 years, and a $11m grant. The PPCR is a special program of the Strategic Climate Fund, one of the two Climate Investment Funds (CIFs). 515 Sustainable Energy Initiative. Case Study: Qairokkum hydropower: planning ahead for a changing climate
7 9 B A N K I N G O N R E F O R M
Identifying Opportunities and Integrating Resilient Policies: Box 7: PROADAPT – IADB PROADAPT516 was initiated as a 5-year project facility created in partnership with the Nordic Development Fund in 2013. The facility aims to increase the climate resilience of micro, small, and medium enterprises (MSMEs) in Latin America and the Caribbean (LAC) and the local communities in which they operate. PROADAPT works with microfinance institutions (MFIs) to help them incorporate climate risk management in their portfolios and provide green finance to clients517. Priority beneficiaries include women-owned MSMEs and other traditionally excluded groups. The facility provides grant resources for technical assistance and supports the development of new models, tools, and technical and market knowledge needed to help MSMEs become more climate resilient and capitalise on new business opportunities. The Climate Change Division of the IDB and the Nordic Development Fund (NDF) are currently planning the second phase of the program to start during 2019. The main objective is to serve as a private climate resilience platform for the IDB Group, building climate resilience in value chains and expanding markets for climate resilient solutions. Outcome: By October 2017, PROADAPT had approved 11 technical assistance projects in 14 countries in the region. The program has funded market assessments in sectors such agriculture, fisheries, housing and construction, water and sanitation, and transportation518. PROADAPT has also supported an ongoing market study in three regions (Colombia, South Africa and the Philippines) on the market for climate resilient solutions. PROADAPT committed $12m in technical assistance and leveraged a total of $23m in the region. PROADAPT’s initial success and the identification of the opportunity to become a pioneering regional platform for private climate resilience in the region resulted in the decision to develop a second phase519. Transformational aspect: PROADAPT offers an innovative approach to incentivise new business models and expand awareness of threats posed by climate change to MSMEs. By working with MFIs to help them incorporate climate risk, PROADAPT can have an impact over the whole portfolio of these institutions. This is one of the only MDB climate finance programmes to have been identified that is working with MFIs. The Facility aims to boost domestic green markets whilst creating local private sector solutions for climate resilience targeted to the most vulnerable groups.
Table 13: Resilient policies
Bank Integrating Resilient Policies Summary
AfDB The CCS is being updated to include ‘multisector project scorecards’.
More information is required on this520.
Initiatives are relatively new;
therefore, hard to judge effectiveness.
AsDB
Several projects through the PPCR have focused on providing technical assistance for countries which are linked to the AsDB’s country
strategies521. There are also 2 other funds for disseminating knowledge: Integrated Disaster Risk Management (IDRM) Fund522 - supports identification, design, financing and knowledge for climate adaptation and acts as a facilitator. Urban Climate Change Resilience
Some support for capacity in
countries but good support for cities.
516 http://ndf.fi/project/proadapt-building-climate-resilience-msmes-latin-america-and-caribbean-ndf-c51 Information in this box was also drawn from a discussion with the IADB. 517 See: https://www.proadapt.org/en-us/Home/About.aspx
518 The Climate change division of the IDB and the Nordic Development Fund (NDF) are currently planning the second phase of the program which will start implementation during the fourth quarter of 2019.
519 Information shared by IDBG 520 Climate Energy Solutions (2017) Regional Integration in the Context of Climate Change
521 AsDB (2016) Country Fact Sheets
522 AsDB (2018) Integrated Disaster Risk Management
8 0 B A N K I N G O N R E F O R M
Trust Fund (UCCRTF)523 builds institutional capacity to make climate a central pillar of city planning524
EBRD
Partners with the Global Centre of Excellence on Climate Adaptation (GCECA) to strengthen the resilience of the financial sector to climate
impacts. One aim is to further develop climate risk metrics for investors525.
No inclusion of initiatives to assist member countries
EIB
In EIB’s climate strategy it states that ‘EIB will identify ways of giving priority to the implementation of urgent or no-regret adaptation
actions, on a sector-specific basis as relevant.’ There is no information on how this will be achieved526 527.
Information not provided on how EIB will work with
countries on resilience
IADB
Technical assistance provided to develop country specific ‘Indicators of Disaster Risk’. Focus on country dialogue528 529. Helping countries build financial capacity to manage natural disasters through 3 tranches: 530
(1) technical assistance and knowledge sharing to help countries understand disaster exposure531; (2) support the design of financing
mechanisms, special reserves and catastrophe bonds; 532 (3) provides loans depending on intensity of a disaster; can help countries access
risk transfer markets as well as helping domestic insurers533.
Provides both technical assistance
and financial capacity building. The latter being transformational
amongst the MDB’s
IBRD/
IDA
Climate Change Action Plan states countries will be helped with National Investment Plans to ensure ‘climate smart’ public
investments.534 Any new IDA Country Partnership Framework should integrate risk consideration into countries development priorities.535
Guidelines for climate risk to be integrated in performance-based contracting for every infrastructure type 536. The World Bank has a
MultiCat programme which helps countries issue catastrophe bonds537, it also provides assistance for developing mechanisms such as weather
derivatives538.
Positive; will need to be assessed later
for successful impact. 539
IFC
IFC recognizes it has been lacking in this area and invested little in adaptation540, to address this it created a taskforce to evaluate the
pipeline for climate risks and opportunities. First outputs were expected by September 2016; however, they do not appear to have
been communicated publicly.
Awaiting next steps for IFC to
operationalise outputs of the
taskforce
Dark Green = Excellent, Green = Good, Orange = Average, Red = Lack of progress, Grey = Unknown.
523 AsDB (2018) Urban Climate Change Resilience Trust Fund (UCCRTF)
524 AsDB (2014) Climate Risk Management in AsDB Projects
525 Acclimatize (2018) Finance
526 EIB (2015) EIB Climate Strategy
527 EBRD (2017) EBRD and Global Centre of Excellence on Climate Adaptation join forces
528 IADB (2018) Risk Identification
529 IADB (2007) Disaster Risk Management Policy
530 IADB (2018) Financial Risk Management
531 IADB (2018) Risk Identification
532 IADB (2018) Development and implementation of financial mechanisms and instruments
533 IADB (2018) Development and implementation of financial mechanisms and instruments
534 World Bank (2016) Climate Change Action Plan
535 World Bank (2018) Climate Risk Screening Tools
536 https://wbgeconsult2.worldbank.org/wbgect/download?uuid=65fc8b11-3f54-4e41-a76a-ad5040b50e81.
537 World Bank (2011) MultiCat
538 World Bank (2012) Financial Solutions for Catastrophe Risk Management
539 IMC Report
540IFC (2016) IFC Climate Implementation Plan
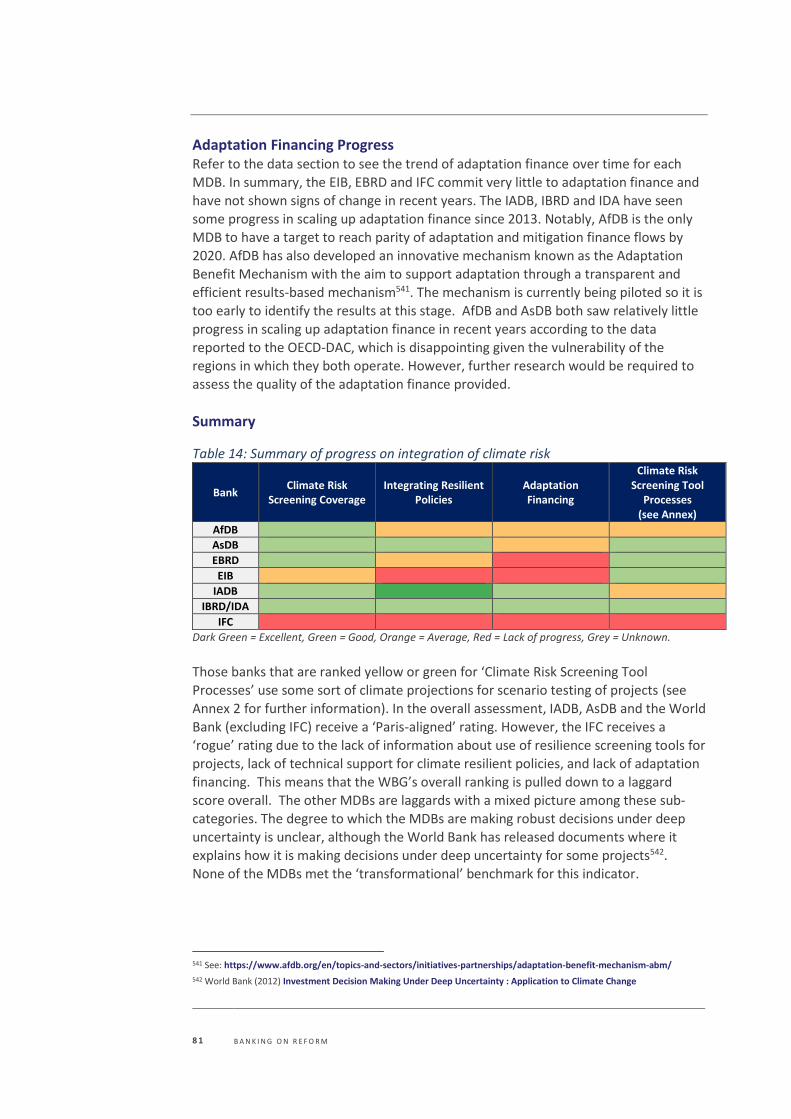
8 1 B A N K I N G O N R E F O R M
Adaptation Financing Progress Refer to the data section to see the trend of adaptation finance over time for each MDB. In summary, the EIB, EBRD and IFC commit very little to adaptation finance and
have not shown signs of change in recent years. The IADB, IBRD and IDA have seen some progress in scaling up adaptation finance since 2013. Notably, AfDB is the only MDB to have a target to reach parity of adaptation and mitigation finance flows by 2020. AfDB has also developed an innovative mechanism known as the Adaptation Benefit Mechanism with the aim to support adaptation through a transparent and
efficient results-based mechanism541. The mechanism is currently being piloted so it is
too early to identify the results at this stage. AfDB and AsDB both saw relatively little
progress in scaling up adaptation finance in recent years according to the data reported to the OECD-DAC, which is disappointing given the vulnerability of the regions in which they both operate. However, further research would be required to assess the quality of the adaptation finance provided.
Summary
Table 14: Summary of progress on integration of climate risk
Bank Climate Risk
Screening Coverage Integrating Resilient
Policies Adaptation Financing
Climate Risk Screening Tool
Processes (see Annex)
AfDB
AsDB
EBRD
EIB
IADB
IBRD/IDA
IFC
Dark Green = Excellent, Green = Good, Orange = Average, Red = Lack of progress, Grey = Unknown.
Those banks that are ranked yellow or green for ‘Climate Risk Screening Tool Processes’ use some sort of climate projections for scenario testing of projects (see Annex 2 for further information). In the overall assessment, IADB, AsDB and the World
Bank (excluding IFC) receive a ‘Paris-aligned’ rating. However, the IFC receives a ‘rogue’ rating due to the lack of information about use of resilience screening tools for
projects, lack of technical support for climate resilient policies, and lack of adaptation financing. This means that the WBG’s overall ranking is pulled down to a laggard score overall. The other MDBs are laggards with a mixed picture among these sub-categories. The degree to which the MDBs are making robust decisions under deep uncertainty is unclear, although the World Bank has released documents where it
explains how it is making decisions under deep uncertainty for some projects542. None of the MDBs met the ‘transformational’ benchmark for this indicator.
541 See: https://www.afdb.org/en/topics-and-sectors/initiatives-partnerships/adaptation-benefit-mechanism-abm/
542 World Bank (2012) Investment Decision Making Under Deep Uncertainty : Application to Climate Change
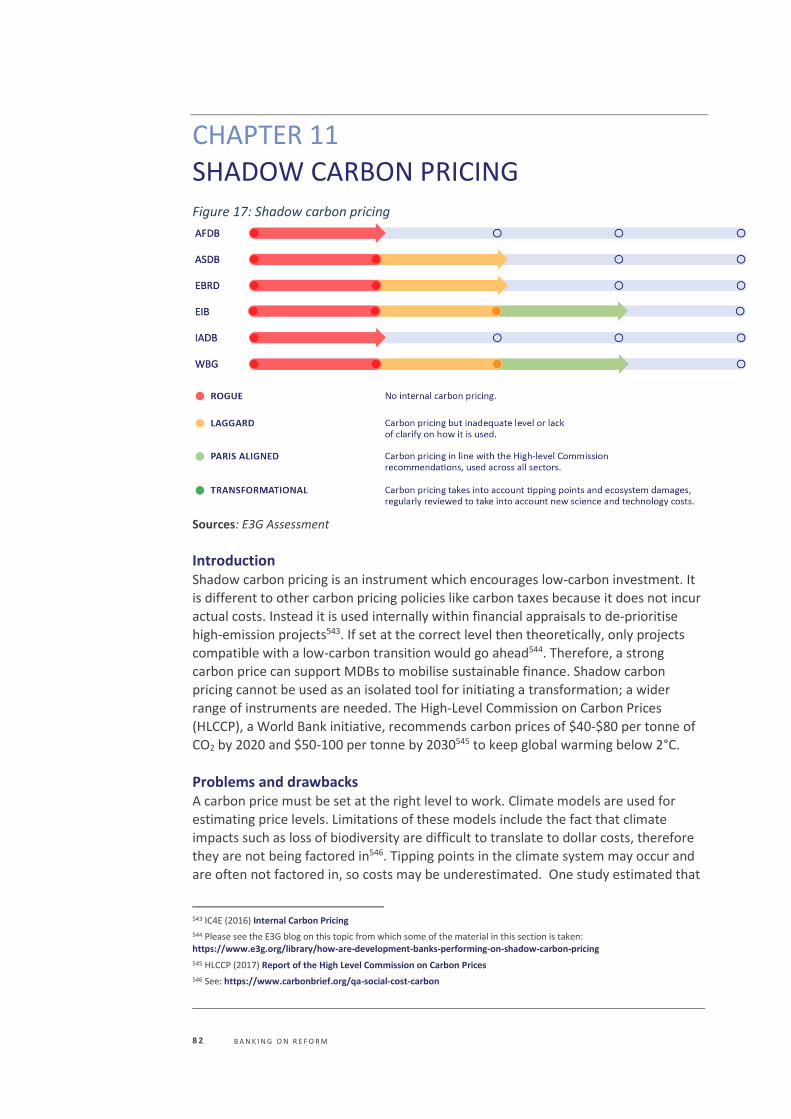
8 2 B A N K I N G O N R E F O R M
CHAPTER 11
SHADOW CARBON PRICING Figure 17: Shadow carbon pricing
Sources: E3G Assessment
Introduction Shadow carbon pricing is an instrument which encourages low-carbon investment. It
is different to other carbon pricing policies like carbon taxes because it does not incur actual costs. Instead it is used internally within financial appraisals to de-prioritise
high-emission projects543. If set at the correct level then theoretically, only projects compatible with a low-carbon transition would go ahead544. Therefore, a strong carbon price can support MDBs to mobilise sustainable finance. Shadow carbon
pricing cannot be used as an isolated tool for initiating a transformation; a wider range of instruments are needed. The High-Level Commission on Carbon Prices
(HLCCP), a World Bank initiative, recommends carbon prices of $40-$80 per tonne of CO2 by 2020 and $50-100 per tonne by 2030545 to keep global warming below 2°C.
Problems and drawbacks A carbon price must be set at the right level to work. Climate models are used for
estimating price levels. Limitations of these models include the fact that climate impacts such as loss of biodiversity are difficult to translate to dollar costs, therefore
they are not being factored in546. Tipping points in the climate system may occur and are often not factored in, so costs may be underestimated. One study estimated that
543 IC4E (2016) Internal Carbon Pricing
544 Please see the E3G blog on this topic from which some of the material in this section is taken: https://www.e3g.org/library/how-are-development-banks-performing-on-shadow-carbon-pricing
545 HLCCP (2017) Report of the High Level Commission on Carbon Prices
546 See: https://www.carbonbrief.org/qa-social-cost-carbon
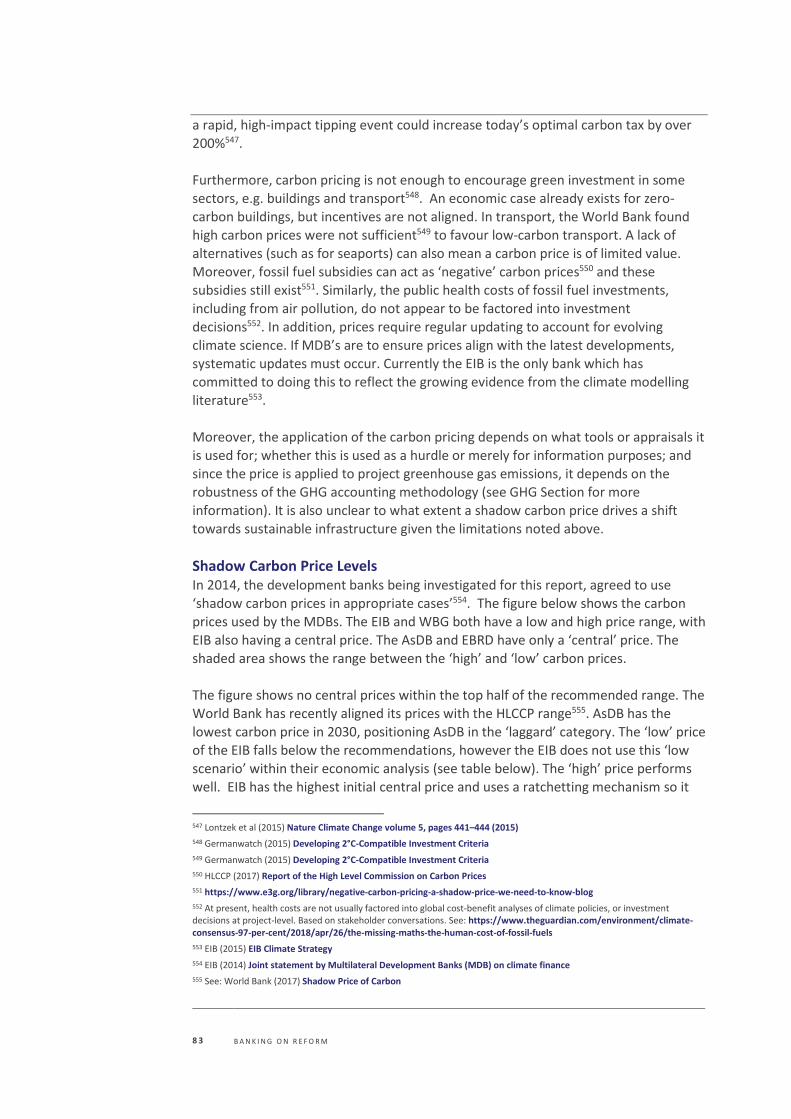
8 3 B A N K I N G O N R E F O R M
a rapid, high-impact tipping event could increase today’s optimal carbon tax by over 200%547. Furthermore, carbon pricing is not enough to encourage green investment in some sectors, e.g. buildings and transport548. An economic case already exists for zero-
carbon buildings, but incentives are not aligned. In transport, the World Bank found high carbon prices were not sufficient549 to favour low-carbon transport. A lack of alternatives (such as for seaports) can also mean a carbon price is of limited value. Moreover, fossil fuel subsidies can act as ‘negative’ carbon prices550 and these subsidies still exist551. Similarly, the public health costs of fossil fuel investments,
including from air pollution, do not appear to be factored into investment decisions552. In addition, prices require regular updating to account for evolving
climate science. If MDB’s are to ensure prices align with the latest developments, systematic updates must occur. Currently the EIB is the only bank which has committed to doing this to reflect the growing evidence from the climate modelling literature553.
Moreover, the application of the carbon pricing depends on what tools or appraisals it
is used for; whether this is used as a hurdle or merely for information purposes; and since the price is applied to project greenhouse gas emissions, it depends on the robustness of the GHG accounting methodology (see GHG Section for more
information). It is also unclear to what extent a shadow carbon price drives a shift
towards sustainable infrastructure given the limitations noted above.
Shadow Carbon Price Levels In 2014, the development banks being investigated for this report, agreed to use ‘shadow carbon prices in appropriate cases’554. The figure below shows the carbon
prices used by the MDBs. The EIB and WBG both have a low and high price range, with EIB also having a central price. The AsDB and EBRD have only a ‘central’ price. The shaded area shows the range between the ‘high’ and ‘low’ carbon prices.
The figure shows no central prices within the top half of the recommended range. The World Bank has recently aligned its prices with the HLCCP range555. AsDB has the
lowest carbon price in 2030, positioning AsDB in the ‘laggard’ category. The ‘low’ price of the EIB falls below the recommendations, however the EIB does not use this ‘low scenario’ within their economic analysis (see table below). The ‘high’ price performs well. EIB has the highest initial central price and uses a ratchetting mechanism so it
547 Lontzek et al (2015) Nature Climate Change volume 5, pages 441–444 (2015)
548 Germanwatch (2015) Developing 2°C-Compatible Investment Criteria
549 Germanwatch (2015) Developing 2°C-Compatible Investment Criteria
550 HLCCP (2017) Report of the High Level Commission on Carbon Prices
551 https://www.e3g.org/library/negative-carbon-pricing-a-shadow-price-we-need-to-know-blog
552 At present, health costs are not usually factored into global cost-benefit analyses of climate policies, or investment decisions at project-level. Based on stakeholder conversations. See: https://www.theguardian.com/environment/climate-consensus-97-per-cent/2018/apr/26/the-missing-maths-the-human-cost-of-fossil-fuels
553 EIB (2015) EIB Climate Strategy
554 EIB (2014) Joint statement by Multilateral Development Banks (MDB) on climate finance
555 See: World Bank (2017) Shadow Price of Carbon
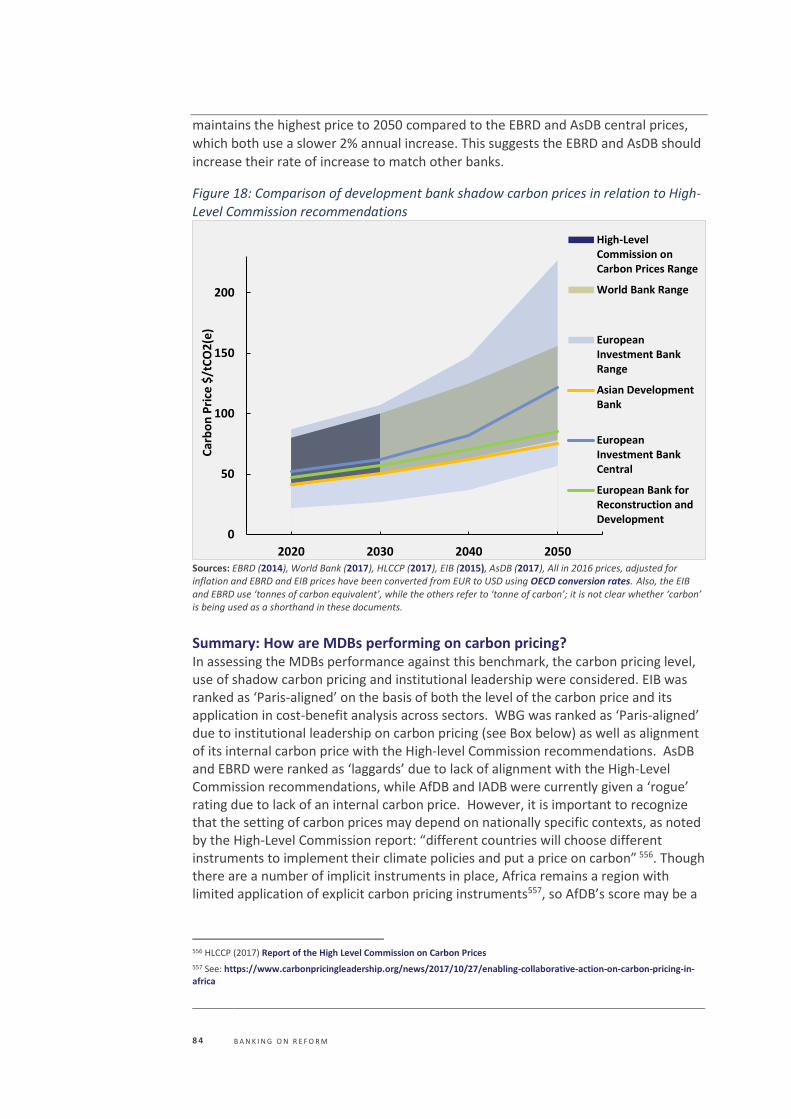
8 4 B A N K I N G O N R E F O R M
maintains the highest price to 2050 compared to the EBRD and AsDB central prices, which both use a slower 2% annual increase. This suggests the EBRD and AsDB should increase their rate of increase to match other banks.
Figure 18: Comparison of development bank shadow carbon prices in relation to High-Level Commission recommendations
Sources: EBRD (2014), World Bank (2017), HLCCP (2017), EIB (2015), AsDB (2017), All in 2016 prices, adjusted for inflation and EBRD and EIB prices have been converted from EUR to USD using OECD conversion rates. Also, the EIB and EBRD use ‘tonnes of carbon equivalent’, while the others refer to ‘tonne of carbon’; it is not clear whether ‘carbon’ is being used as a shorthand in these documents. Summary: How are MDBs performing on carbon pricing? In assessing the MDBs performance against this benchmark, the carbon pricing level, use of shadow carbon pricing and institutional leadership were considered. EIB was ranked as ‘Paris-aligned’ on the basis of both the level of the carbon price and its application in cost-benefit analysis across sectors. WBG was ranked as ‘Paris-aligned’ due to institutional leadership on carbon pricing (see Box below) as well as alignment of its internal carbon price with the High-level Commission recommendations. AsDB and EBRD were ranked as ‘laggards’ due to lack of alignment with the High-Level Commission recommendations, while AfDB and IADB were currently given a ‘rogue’ rating due to lack of an internal carbon price. However, it is important to recognize that the setting of carbon prices may depend on nationally specific contexts, as noted by the High-Level Commission report: “different countries will choose different instruments to implement their climate policies and put a price on carbon” 556. Though there are a number of implicit instruments in place, Africa remains a region with limited application of explicit carbon pricing instruments557, so AfDB’s score may be a
556 HLCCP (2017) Report of the High Level Commission on Carbon Prices
557 See: https://www.carbonpricingleadership.org/news/2017/10/27/enabling-collaborative-action-on-carbon-pricing-in-africa
0
50
100
150
200
2020 2030 2040 2050
Car
bo
n P
rice
$/t
CO
2(e
)
High-LevelCommission onCarbon Prices Range
World Bank Range
EuropeanInvestment BankRange
Asian DevelopmentBank
EuropeanInvestment BankCentral
European Bank forReconstruction andDevelopment
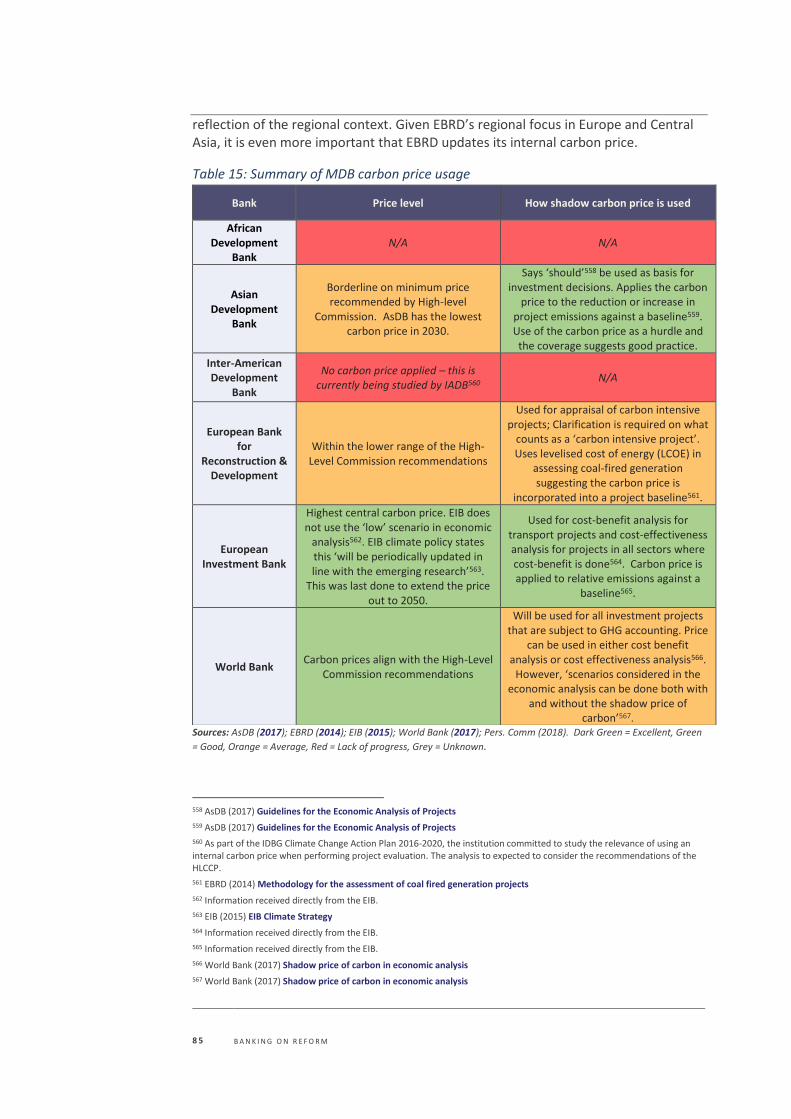
8 5 B A N K I N G O N R E F O R M
reflection of the regional context. Given EBRD’s regional focus in Europe and Central Asia, it is even more important that EBRD updates its internal carbon price.
Table 15: Summary of MDB carbon price usage
Sources: AsDB (2017); EBRD (2014); EIB (2015); World Bank (2017); Pers. Comm (2018). Dark Green = Excellent, Green
= Good, Orange = Average, Red = Lack of progress, Grey = Unknown.
558 AsDB (2017) Guidelines for the Economic Analysis of Projects
559 AsDB (2017) Guidelines for the Economic Analysis of Projects
560 As part of the IDBG Climate Change Action Plan 2016-2020, the institution committed to study the relevance of using an internal carbon price when performing project evaluation. The analysis to expected to consider the recommendations of the HLCCP.
561 EBRD (2014) Methodology for the assessment of coal fired generation projects
562 Information received directly from the EIB.
563 EIB (2015) EIB Climate Strategy
564 Information received directly from the EIB.
565 Information received directly from the EIB.
566 World Bank (2017) Shadow price of carbon in economic analysis
567 World Bank (2017) Shadow price of carbon in economic analysis
Bank Price level How shadow carbon price is used
African Development
Bank N/A N/A
Asian Development
Bank
Borderline on minimum price recommended by High-level
Commission. AsDB has the lowest carbon price in 2030.
Says ‘should’558 be used as basis for investment decisions. Applies the carbon
price to the reduction or increase in project emissions against a baseline559. Use of the carbon price as a hurdle and
the coverage suggests good practice.
Inter-American Development
Bank
No carbon price applied – this is currently being studied by IADB560
N/A
European Bank for
Reconstruction & Development
Within the lower range of the High-Level Commission recommendations
Used for appraisal of carbon intensive projects; Clarification is required on what
counts as a ‘carbon intensive project’. Uses levelised cost of energy (LCOE) in
assessing coal-fired generation suggesting the carbon price is
incorporated into a project baseline561.
European Investment Bank
Highest central carbon price. EIB does not use the ‘low’ scenario in economic
analysis562. EIB climate policy states this ‘will be periodically updated in line with the emerging research’563.
This was last done to extend the price out to 2050.
Used for cost-benefit analysis for transport projects and cost-effectiveness analysis for projects in all sectors where cost-benefit is done564. Carbon price is applied to relative emissions against a
baseline565.
World Bank Carbon prices align with the High-Level
Commission recommendations
Will be used for all investment projects that are subject to GHG accounting. Price
can be used in either cost benefit analysis or cost effectiveness analysis566.
However, ‘scenarios considered in the economic analysis can be done both with
and without the shadow price of carbon’567.
8 6 B A N K I N G O N R E F O R M
Box 8: Carbon Pricing Leadership Coalition (CPLC)568 Launched at COP21 in Paris, and convened by the World Bank Group, the coalition’s objective is put in place effective carbon pricing policies and expand their use widely across the global economy, through convening leaders at national and subnational level, as well as in the private sector, and civil society. Expected outcomes: Its long-term objective is to have carbon price across the global economy which is meaningful to achieve emission reductions. Only 15% of emissions are covered by carbon pricing, and the current prices are below those recommended by the High-Level Commission on Carbon Prices. Therefore, the CLPC aims to “double the percentage of global emissions covered by explicit carbon prices to 25 percent by 2020, and to double it again to 50 percent within a decade” 569. Transformational aspect: An effective carbon price could translate into job creation and increased competitiveness, whilst delivering significant carbon emission reductions. The coalition is transforming the carbon pricing market through different fronts by:
• Increasing knowledge sharing through reports such as the Report from the High-Level Commission on Carbon Prices, and Carbon Pricing Dashboard
• Creating space to convene public and private sectors.
• Deepening sectoral engagement by collaborating with different stakeholders from construction value chain, banking sector, and maritime sector.
568 http://www.worldbank.org/en/results/2017/12/01/carbon-pricing
569 http://www.worldbank.org/en/results/2017/12/01/carbon-pricing
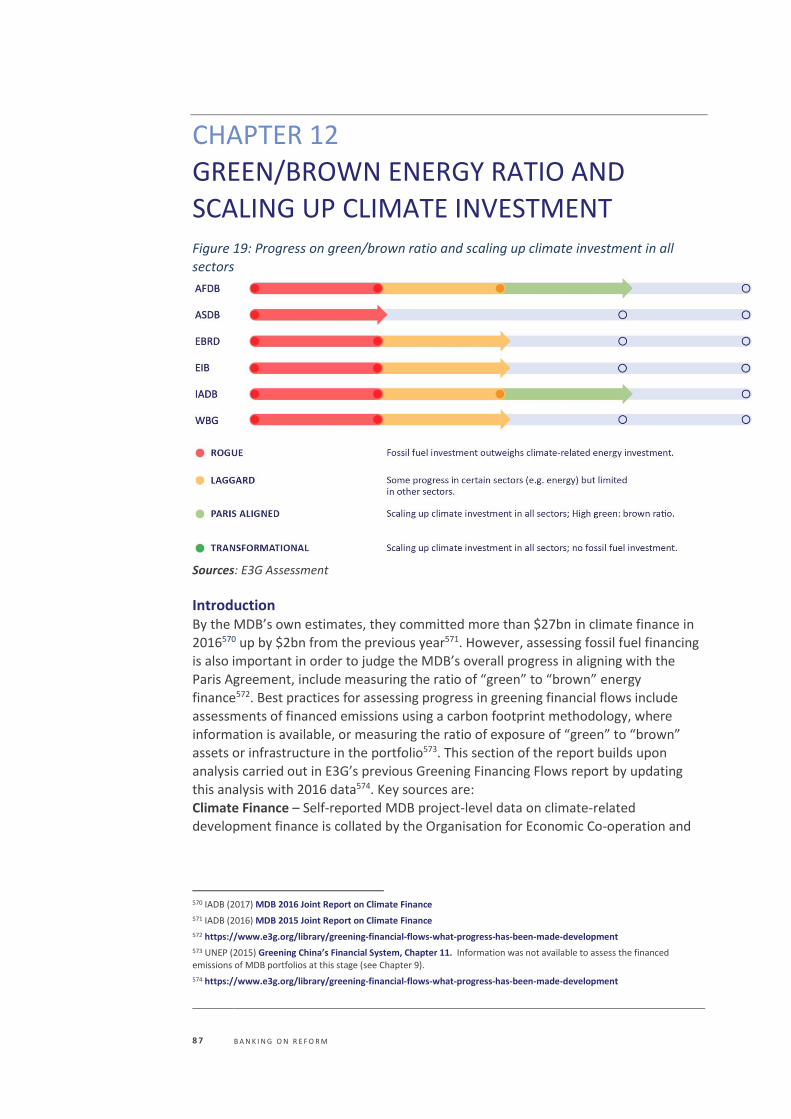
8 7 B A N K I N G O N R E F O R M
CHAPTER 12
GREEN/BROWN ENERGY RATIO AND
SCALING UP CLIMATE INVESTMENT Figure 19: Progress on green/brown ratio and scaling up climate investment in all sectors
Sources: E3G Assessment
Introduction By the MDB’s own estimates, they committed more than $27bn in climate finance in
2016570 up by $2bn from the previous year571. However, assessing fossil fuel financing is also important in order to judge the MDB’s overall progress in aligning with the
Paris Agreement, include measuring the ratio of “green” to “brown” energy finance572. Best practices for assessing progress in greening financial flows include
assessments of financed emissions using a carbon footprint methodology, where information is available, or measuring the ratio of exposure of “green” to “brown” assets or infrastructure in the portfolio573. This section of the report builds upon analysis carried out in E3G’s previous Greening Financing Flows report by updating this analysis with 2016 data574. Key sources are:
Climate Finance – Self-reported MDB project-level data on climate-related development finance is collated by the Organisation for Economic Co-operation and
570 IADB (2017) MDB 2016 Joint Report on Climate Finance
571 IADB (2016) MDB 2015 Joint Report on Climate Finance
572 https://www.e3g.org/library/greening-financial-flows-what-progress-has-been-made-development
573 UNEP (2015) Greening China’s Financial System, Chapter 11. Information was not available to assess the financed emissions of MDB portfolios at this stage (see Chapter 9).
574 https://www.e3g.org/library/greening-financial-flows-what-progress-has-been-made-development
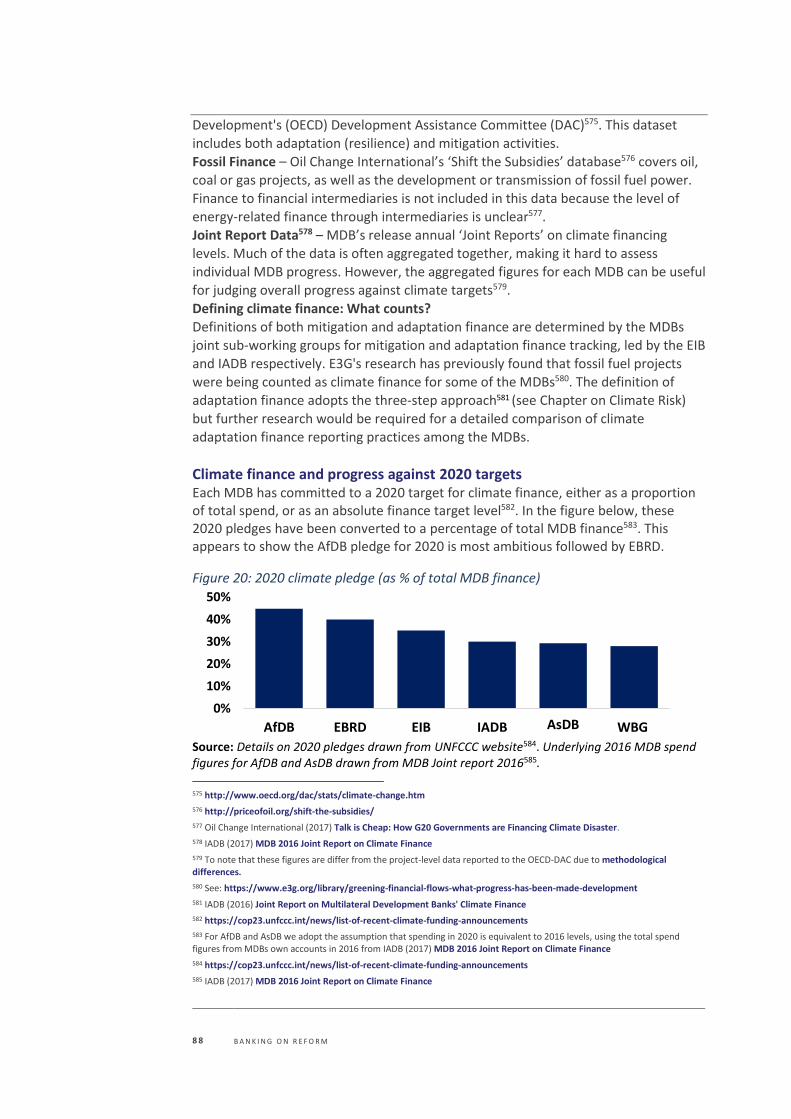
8 8 B A N K I N G O N R E F O R M
Development's (OECD) Development Assistance Committee (DAC)575. This dataset includes both adaptation (resilience) and mitigation activities. Fossil Finance – Oil Change International’s ‘Shift the Subsidies’ database576 covers oil, coal or gas projects, as well as the development or transmission of fossil fuel power. Finance to financial intermediaries is not included in this data because the level of
energy-related finance through intermediaries is unclear577. Joint Report Data578 – MDB’s release annual ‘Joint Reports’ on climate financing levels. Much of the data is often aggregated together, making it hard to assess individual MDB progress. However, the aggregated figures for each MDB can be useful for judging overall progress against climate targets579.
Defining climate finance: What counts? Definitions of both mitigation and adaptation finance are determined by the MDBs
joint sub-working groups for mitigation and adaptation finance tracking, led by the EIB and IADB respectively. E3G's research has previously found that fossil fuel projects were being counted as climate finance for some of the MDBs580. The definition of adaptation finance adopts the three-step approach581 (see Chapter on Climate Risk) but further research would be required for a detailed comparison of climate
adaptation finance reporting practices among the MDBs.
Climate finance and progress against 2020 targets Each MDB has committed to a 2020 target for climate finance, either as a proportion of total spend, or as an absolute finance target level582. In the figure below, these 2020 pledges have been converted to a percentage of total MDB finance583. This appears to show the AfDB pledge for 2020 is most ambitious followed by EBRD.
Figure 20: 2020 climate pledge (as % of total MDB finance)
Source: Details on 2020 pledges drawn from UNFCCC website584. Underlying 2016 MDB spend figures for AfDB and AsDB drawn from MDB Joint report 2016585.
575 http://www.oecd.org/dac/stats/climate-change.htm
576 http://priceofoil.org/shift-the-subsidies/
577 Oil Change International (2017) Talk is Cheap: How G20 Governments are Financing Climate Disaster.
578 IADB (2017) MDB 2016 Joint Report on Climate Finance
579 To note that these figures are differ from the project-level data reported to the OECD-DAC due to methodological differences.
580 See: https://www.e3g.org/library/greening-financial-flows-what-progress-has-been-made-development
581 IADB (2016) Joint Report on Multilateral Development Banks' Climate Finance
582 https://cop23.unfccc.int/news/list-of-recent-climate-funding-announcements
583 For AfDB and AsDB we adopt the assumption that spending in 2020 is equivalent to 2016 levels, using the total spend figures from MDBs own accounts in 2016 from IADB (2017) MDB 2016 Joint Report on Climate Finance
584 https://cop23.unfccc.int/news/list-of-recent-climate-funding-announcements
585 IADB (2017) MDB 2016 Joint Report on Climate Finance
0%
10%
20%
30%
40%
50%
AfDB EBRD EIB IADB ADB WBGAsDB
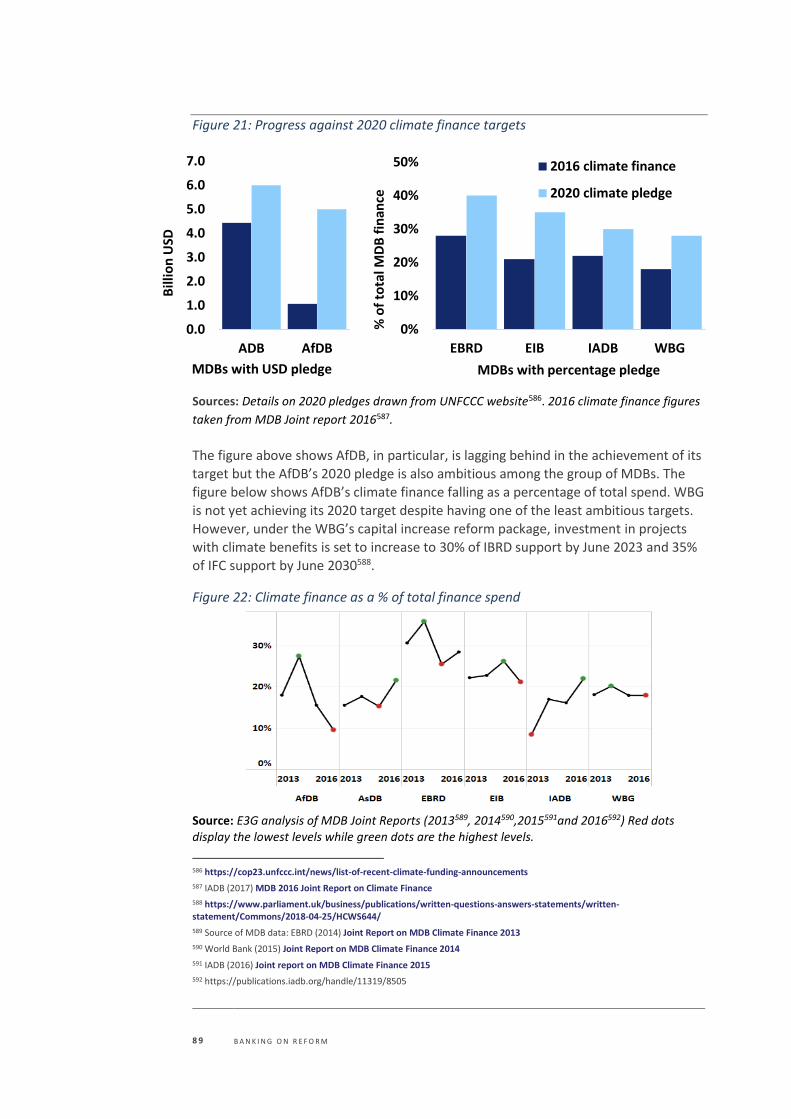
8 9 B A N K I N G O N R E F O R M
Figure 21: Progress against 2020 climate finance targets
Sources: Details on 2020 pledges drawn from UNFCCC website586. 2016 climate finance figures
taken from MDB Joint report 2016587.
The figure above shows AfDB, in particular, is lagging behind in the achievement of its target but the AfDB’s 2020 pledge is also ambitious among the group of MDBs. The figure below shows AfDB’s climate finance falling as a percentage of total spend. WBG
is not yet achieving its 2020 target despite having one of the least ambitious targets.
However, under the WBG’s capital increase reform package, investment in projects with climate benefits is set to increase to 30% of IBRD support by June 2023 and 35% of IFC support by June 2030588.
Figure 22: Climate finance as a % of total finance spend
Source: E3G analysis of MDB Joint Reports (2013589, 2014590,2015591and 2016592) Red dots display the lowest levels while green dots are the highest levels.
586 https://cop23.unfccc.int/news/list-of-recent-climate-funding-announcements
587 IADB (2017) MDB 2016 Joint Report on Climate Finance
588 https://www.parliament.uk/business/publications/written-questions-answers-statements/written-statement/Commons/2018-04-25/HCWS644/
589 Source of MDB data: EBRD (2014) Joint Report on MDB Climate Finance 2013
590 World Bank (2015) Joint Report on MDB Climate Finance 2014
591 IADB (2016) Joint report on MDB Climate Finance 2015
592 https://publications.iadb.org/handle/11319/8505
0%
10%
20%
30%
40%
50%
EBRD EIB IADB WBG
% o
f to
tal M
DB
fin
ance
MDBs with percentage pledge
2016 climate finance
2020 climate pledge
0.0
1.0
2.0
3.0
4.0
5.0
6.0
7.0
ADB AfDB
Bill
ion
USD
MDBs with USD pledge
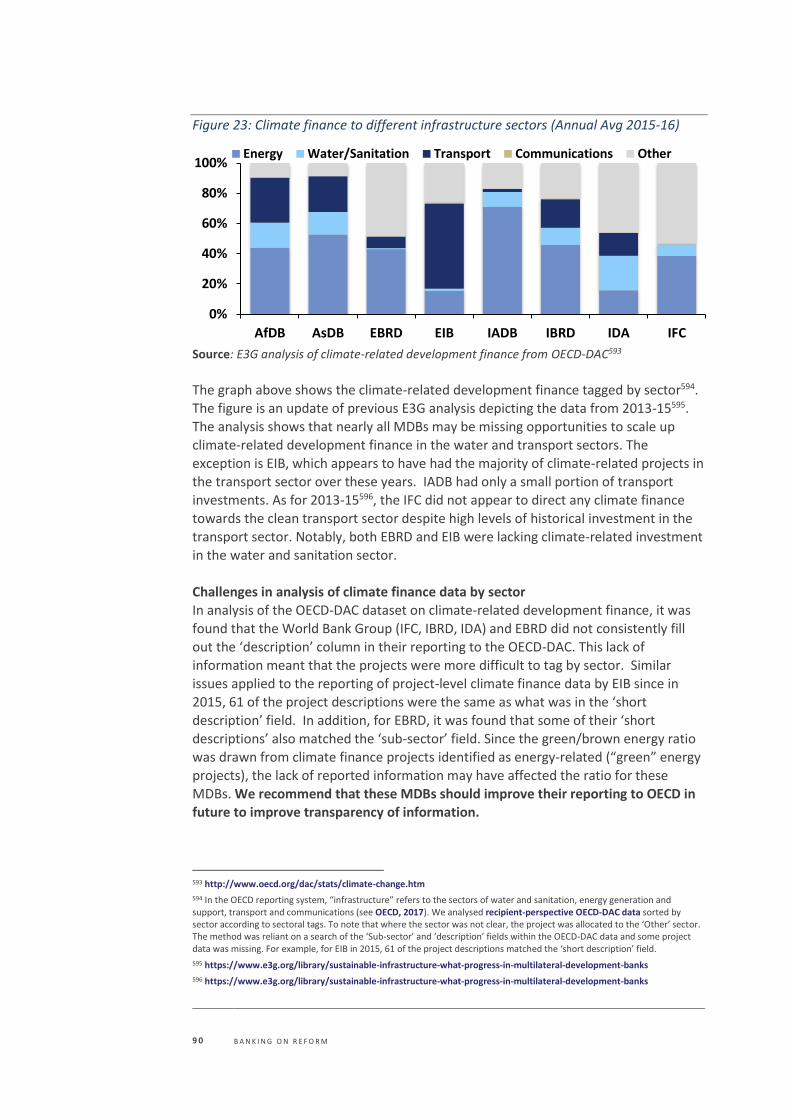
9 0 B A N K I N G O N R E F O R M
Figure 23: Climate finance to different infrastructure sectors (Annual Avg 2015-16)
Source: E3G analysis of climate-related development finance from OECD-DAC593
The graph above shows the climate-related development finance tagged by sector594. The figure is an update of previous E3G analysis depicting the data from 2013-15595. The analysis shows that nearly all MDBs may be missing opportunities to scale up
climate-related development finance in the water and transport sectors. The
exception is EIB, which appears to have had the majority of climate-related projects in the transport sector over these years. IADB had only a small portion of transport investments. As for 2013-15596, the IFC did not appear to direct any climate finance
towards the clean transport sector despite high levels of historical investment in the
transport sector. Notably, both EBRD and EIB were lacking climate-related investment in the water and sanitation sector.
Challenges in analysis of climate finance data by sector In analysis of the OECD-DAC dataset on climate-related development finance, it was
found that the World Bank Group (IFC, IBRD, IDA) and EBRD did not consistently fill out the ‘description’ column in their reporting to the OECD-DAC. This lack of information meant that the projects were more difficult to tag by sector. Similar
issues applied to the reporting of project-level climate finance data by EIB since in 2015, 61 of the project descriptions were the same as what was in the ‘short
description’ field. In addition, for EBRD, it was found that some of their ‘short descriptions’ also matched the ‘sub-sector’ field. Since the green/brown energy ratio was drawn from climate finance projects identified as energy-related (“green” energy
projects), the lack of reported information may have affected the ratio for these MDBs. We recommend that these MDBs should improve their reporting to OECD in
future to improve transparency of information.
593 http://www.oecd.org/dac/stats/climate-change.htm
594 In the OECD reporting system, “infrastructure” refers to the sectors of water and sanitation, energy generation and support, transport and communications (see OECD, 2017). We analysed recipient-perspective OECD-DAC data sorted by sector according to sectoral tags. To note that where the sector was not clear, the project was allocated to the ‘Other’ sector. The method was reliant on a search of the ‘Sub-sector’ and ‘description’ fields within the OECD-DAC data and some project data was missing. For example, for EIB in 2015, 61 of the project descriptions matched the ‘short description’ field.
595 https://www.e3g.org/library/sustainable-infrastructure-what-progress-in-multilateral-development-banks
596 https://www.e3g.org/library/sustainable-infrastructure-what-progress-in-multilateral-development-banks
0%
20%
40%
60%
80%
100%
AfDB AsDB EBRD EIB IADB IBRD IDA IFC
Energy Water/Sanitation Transport Communications Other
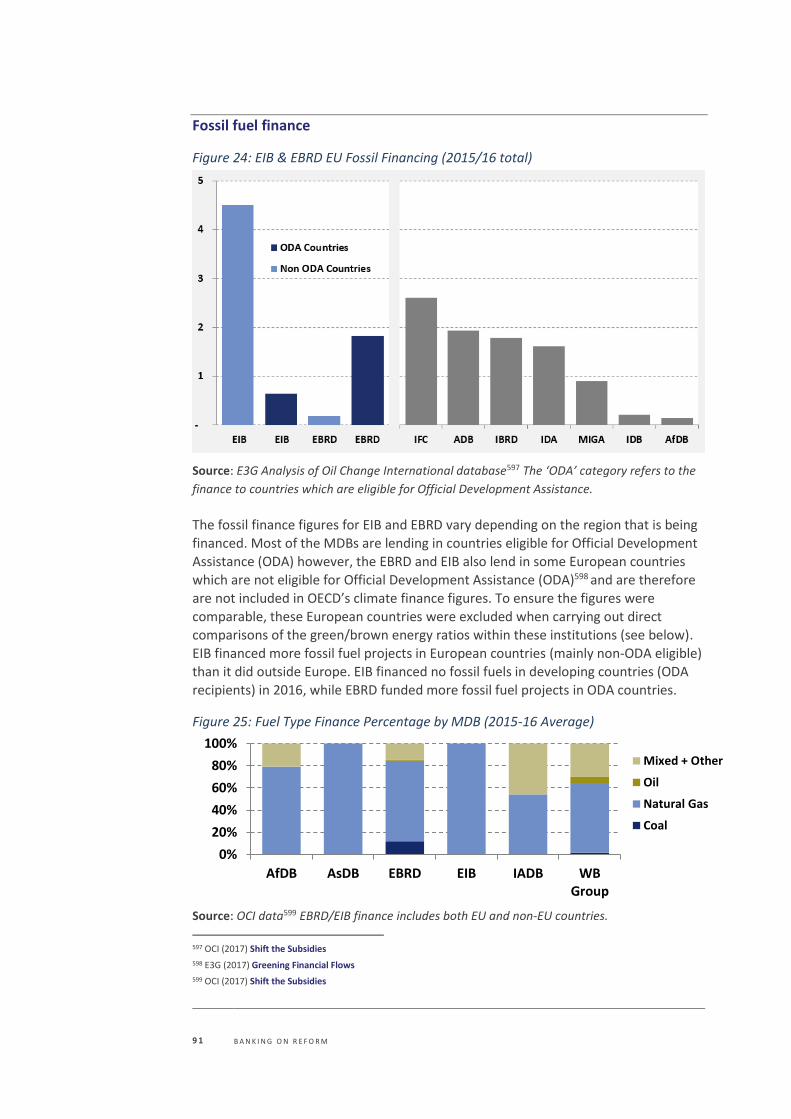
9 1 B A N K I N G O N R E F O R M
Fossil fuel finance
Figure 24: EIB & EBRD EU Fossil Financing (2015/16 total)
Source: E3G Analysis of Oil Change International database597 The ‘ODA’ category refers to the
finance to countries which are eligible for Official Development Assistance.
The fossil finance figures for EIB and EBRD vary depending on the region that is being financed. Most of the MDBs are lending in countries eligible for Official Development Assistance (ODA) however, the EBRD and EIB also lend in some European countries
which are not eligible for Official Development Assistance (ODA)598 and are therefore are not included in OECD’s climate finance figures. To ensure the figures were
comparable, these European countries were excluded when carrying out direct comparisons of the green/brown energy ratios within these institutions (see below). EIB financed more fossil fuel projects in European countries (mainly non-ODA eligible)
than it did outside Europe. EIB financed no fossil fuels in developing countries (ODA recipients) in 2016, while EBRD funded more fossil fuel projects in ODA countries.
Figure 25: Fuel Type Finance Percentage by MDB (2015-16 Average)
Source: OCI data599 EBRD/EIB finance includes both EU and non-EU countries.
597 OCI (2017) Shift the Subsidies
598 E3G (2017) Greening Financial Flows
599 OCI (2017) Shift the Subsidies
0%
20%
40%
60%
80%
100%
AfDB AsDB EBRD EIB IADB WBGroup
Mixed + Other
Oil
Natural Gas
Coal
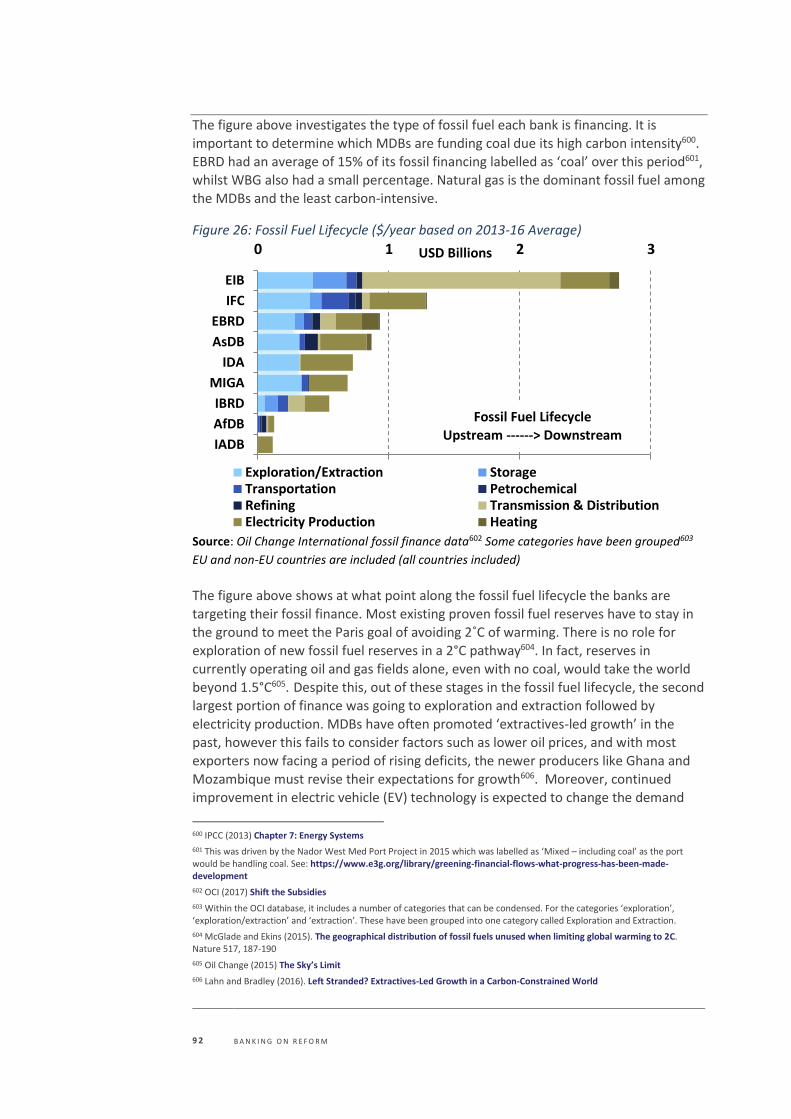
9 2 B A N K I N G O N R E F O R M
The figure above investigates the type of fossil fuel each bank is financing. It is important to determine which MDBs are funding coal due its high carbon intensity600. EBRD had an average of 15% of its fossil financing labelled as ‘coal’ over this period601, whilst WBG also had a small percentage. Natural gas is the dominant fossil fuel among the MDBs and the least carbon-intensive.
Figure 26: Fossil Fuel Lifecycle ($/year based on 2013-16 Average)
Source: Oil Change International fossil finance data602 Some categories have been grouped603
EU and non-EU countries are included (all countries included)
The figure above shows at what point along the fossil fuel lifecycle the banks are
targeting their fossil finance. Most existing proven fossil fuel reserves have to stay in the ground to meet the Paris goal of avoiding 2˚C of warming. There is no role for
exploration of new fossil fuel reserves in a 2°C pathway604. In fact, reserves in currently operating oil and gas fields alone, even with no coal, would take the world
beyond 1.5°C605. Despite this, out of these stages in the fossil fuel lifecycle, the second largest portion of finance was going to exploration and extraction followed by
electricity production. MDBs have often promoted ‘extractives-led growth’ in the past, however this fails to consider factors such as lower oil prices, and with most exporters now facing a period of rising deficits, the newer producers like Ghana and Mozambique must revise their expectations for growth606. Moreover, continued improvement in electric vehicle (EV) technology is expected to change the demand
600 IPCC (2013) Chapter 7: Energy Systems
601 This was driven by the Nador West Med Port Project in 2015 which was labelled as ‘Mixed – including coal’ as the port would be handling coal. See: https://www.e3g.org/library/greening-financial-flows-what-progress-has-been-made-development
602 OCI (2017) Shift the Subsidies
603 Within the OCI database, it includes a number of categories that can be condensed. For the categories ‘exploration’, ‘exploration/extraction’ and ‘extraction’. These have been grouped into one category called Exploration and Extraction.
604 McGlade and Ekins (2015). The geographical distribution of fossil fuels unused when limiting global warming to 2C. Nature 517, 187-190
605 Oil Change (2015) The Sky’s Limit
606 Lahn and Bradley (2016). Left Stranded? Extractives-Led Growth in a Carbon-Constrained World
0 1 2 3
IADB
AfDB
IBRD
MIGA
IDA
AsDB
EBRD
IFC
EIB
USD Billions
Exploration/Extraction StorageTransportation PetrochemicalRefining Transmission & DistributionElectricity Production Heating
Fossil Fuel Lifecycle
Upstream ------> Downstream
9 3 B A N K I N G O N R E F O R M
profile for oil as the transport sector uses oil for 95% of its energy and accounts for 60% of oil use607. The EIB is the biggest funder of fossil fuel transmission and distribution. This highlights a key area of intervention when considering the transition away from fossil fuels at
EIB. IDA, MIGA, AfDB and IADB finance fewer stages in the fossil fuel lifecycle. Interestingly, the focus of IDA and MIGA lending is on exploration/extraction as well as electricity production. The focus of these WBG institutions on exploration and extraction suggests the new policy on exclusion of finance for upstream oil and gas may cause a large reduction in fossil fuel financing for these World Bank
institutions608.
607 HSBC (2015). Energy beyond Paris.
608 World Bank (2017) World Bank Group Announcements at One Planet Summit
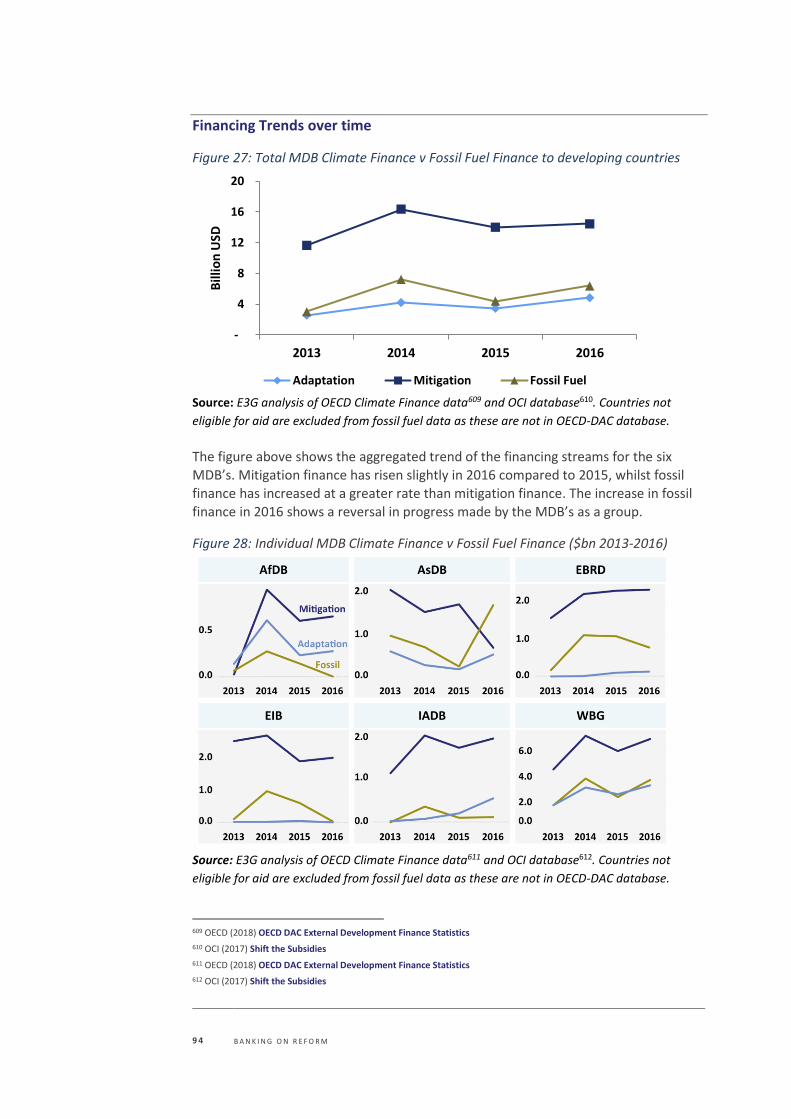
9 4 B A N K I N G O N R E F O R M
Financing Trends over time
Figure 27: Total MDB Climate Finance v Fossil Fuel Finance to developing countries
Source: E3G analysis of OECD Climate Finance data609 and OCI database610. Countries not
eligible for aid are excluded from fossil fuel data as these are not in OECD-DAC database.
The figure above shows the aggregated trend of the financing streams for the six MDB’s. Mitigation finance has risen slightly in 2016 compared to 2015, whilst fossil
finance has increased at a greater rate than mitigation finance. The increase in fossil
finance in 2016 shows a reversal in progress made by the MDB’s as a group.
Figure 28: Individual MDB Climate Finance v Fossil Fuel Finance ($bn 2013-2016)
Source: E3G analysis of OECD Climate Finance data611 and OCI database612. Countries not
eligible for aid are excluded from fossil fuel data as these are not in OECD-DAC database.
609 OECD (2018) OECD DAC External Development Finance Statistics
610 OCI (2017) Shift the Subsidies
611 OECD (2018) OECD DAC External Development Finance Statistics
612 OCI (2017) Shift the Subsidies
-
4
8
12
16
20
2013 2014 2015 2016
Bill
ion
USD
Adaptation Mitigation Fossil Fuel
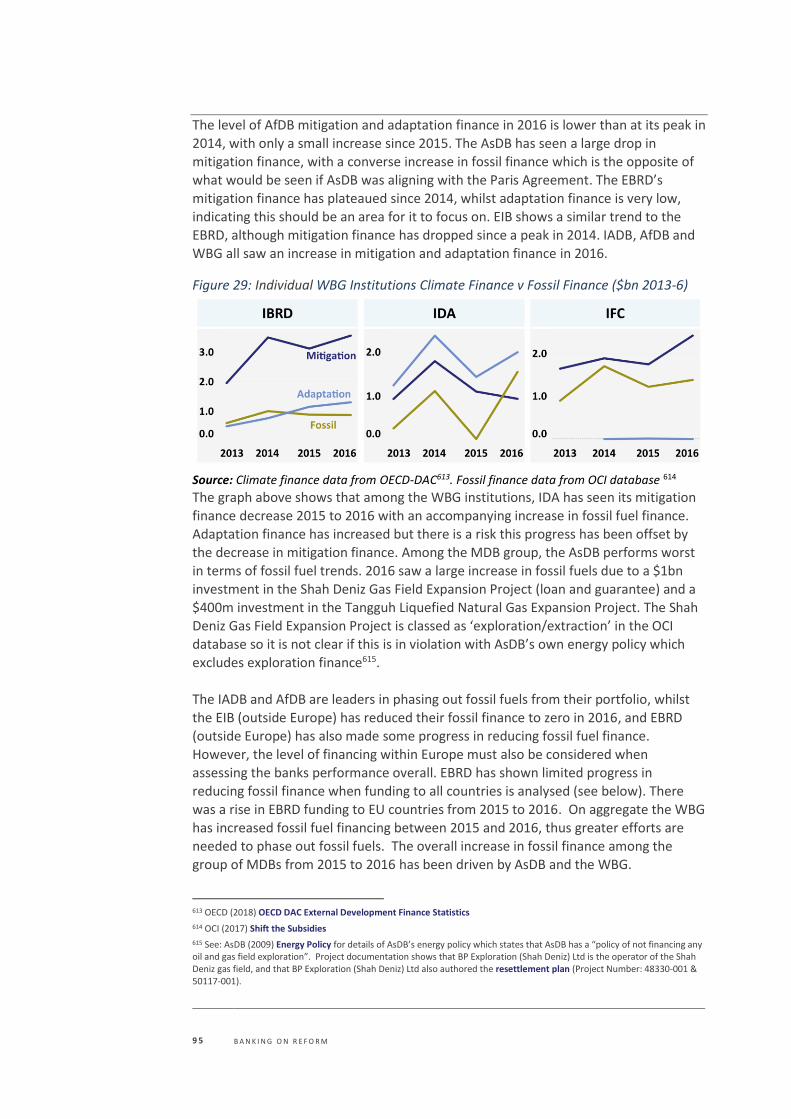
9 5 B A N K I N G O N R E F O R M
The level of AfDB mitigation and adaptation finance in 2016 is lower than at its peak in 2014, with only a small increase since 2015. The AsDB has seen a large drop in mitigation finance, with a converse increase in fossil finance which is the opposite of what would be seen if AsDB was aligning with the Paris Agreement. The EBRD’s mitigation finance has plateaued since 2014, whilst adaptation finance is very low,
indicating this should be an area for it to focus on. EIB shows a similar trend to the EBRD, although mitigation finance has dropped since a peak in 2014. IADB, AfDB and WBG all saw an increase in mitigation and adaptation finance in 2016.
Figure 29: Individual WBG Institutions Climate Finance v Fossil Finance ($bn 2013-6)
Source: Climate finance data from OECD-DAC613. Fossil finance data from OCI database 614
The graph above shows that among the WBG institutions, IDA has seen its mitigation
finance decrease 2015 to 2016 with an accompanying increase in fossil fuel finance.
Adaptation finance has increased but there is a risk this progress has been offset by the decrease in mitigation finance. Among the MDB group, the AsDB performs worst
in terms of fossil fuel trends. 2016 saw a large increase in fossil fuels due to a $1bn investment in the Shah Deniz Gas Field Expansion Project (loan and guarantee) and a $400m investment in the Tangguh Liquefied Natural Gas Expansion Project. The Shah
Deniz Gas Field Expansion Project is classed as ‘exploration/extraction’ in the OCI database so it is not clear if this is in violation with AsDB’s own energy policy which
excludes exploration finance615.
The IADB and AfDB are leaders in phasing out fossil fuels from their portfolio, whilst
the EIB (outside Europe) has reduced their fossil finance to zero in 2016, and EBRD
(outside Europe) has also made some progress in reducing fossil fuel finance. However, the level of financing within Europe must also be considered when assessing the banks performance overall. EBRD has shown limited progress in reducing fossil finance when funding to all countries is analysed (see below). There was a rise in EBRD funding to EU countries from 2015 to 2016. On aggregate the WBG
has increased fossil fuel financing between 2015 and 2016, thus greater efforts are needed to phase out fossil fuels. The overall increase in fossil finance among the group of MDBs from 2015 to 2016 has been driven by AsDB and the WBG.
613 OECD (2018) OECD DAC External Development Finance Statistics
614 OCI (2017) Shift the Subsidies
615 See: AsDB (2009) Energy Policy for details of AsDB’s energy policy which states that AsDB has a “policy of not financing any oil and gas field exploration”. Project documentation shows that BP Exploration (Shah Deniz) Ltd is the operator of the Shah Deniz gas field, and that BP Exploration (Shah Deniz) Ltd also authored the resettlement plan (Project Number: 48330-001 & 50117-001).
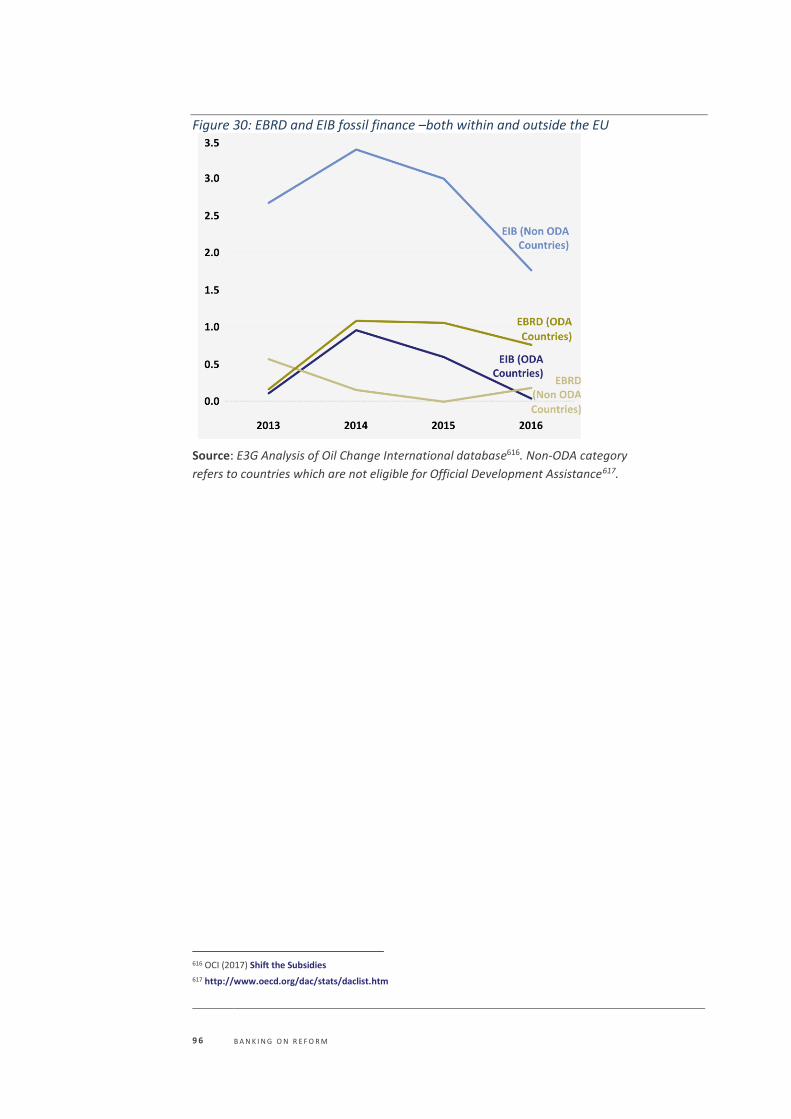
9 6 B A N K I N G O N R E F O R M
Figure 30: EBRD and EIB fossil finance –both within and outside the EU
Source: E3G Analysis of Oil Change International database616. Non-ODA category
refers to countries which are not eligible for Official Development Assistance617.
616 OCI (2017) Shift the Subsidies
617 http://www.oecd.org/dac/stats/daclist.htm
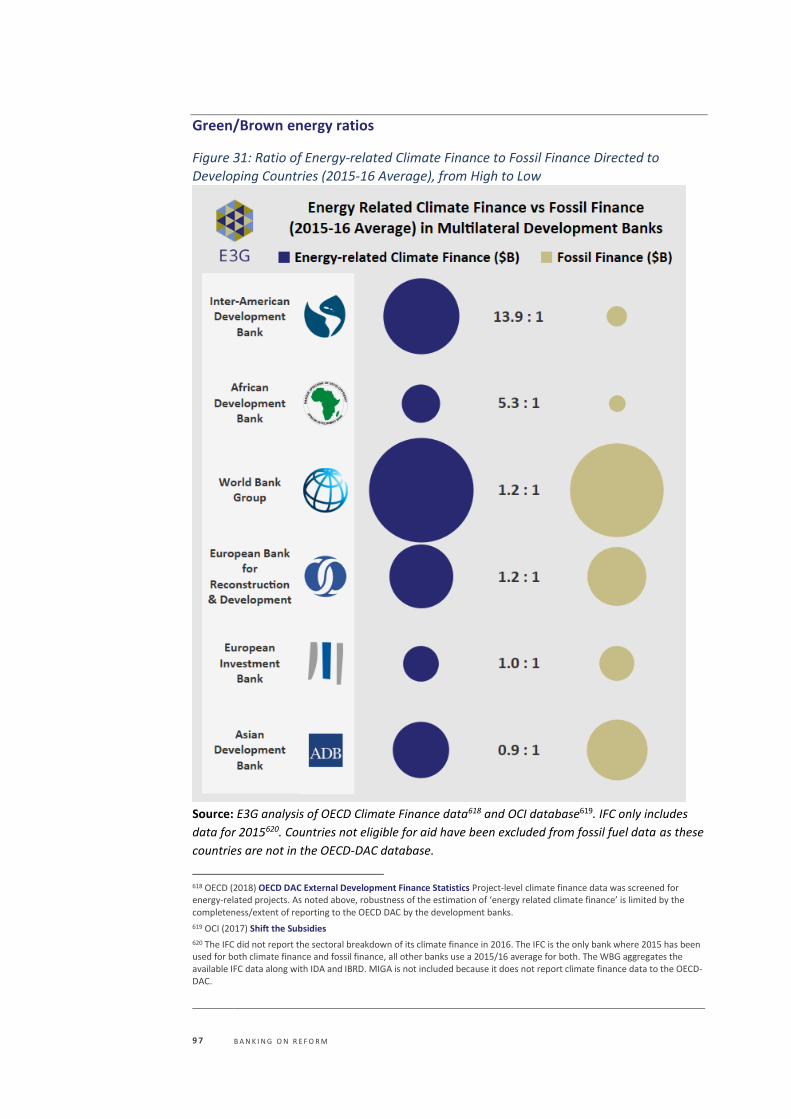
9 7 B A N K I N G O N R E F O R M
Green/Brown energy ratios
Figure 31: Ratio of Energy-related Climate Finance to Fossil Finance Directed to Developing Countries (2015-16 Average), from High to Low
Source: E3G analysis of OECD Climate Finance data618 and OCI database619. IFC only includes
data for 2015620. Countries not eligible for aid have been excluded from fossil fuel data as these
countries are not in the OECD-DAC database.
618 OECD (2018) OECD DAC External Development Finance Statistics Project-level climate finance data was screened for energy-related projects. As noted above, robustness of the estimation of ‘energy related climate finance’ is limited by the completeness/extent of reporting to the OECD DAC by the development banks.
619 OCI (2017) Shift the Subsidies
620 The IFC did not report the sectoral breakdown of its climate finance in 2016. The IFC is the only bank where 2015 has been used for both climate finance and fossil finance, all other banks use a 2015/16 average for both. The WBG aggregates the available IFC data along with IDA and IBRD. MIGA is not included because it does not report climate finance data to the OECD-DAC.
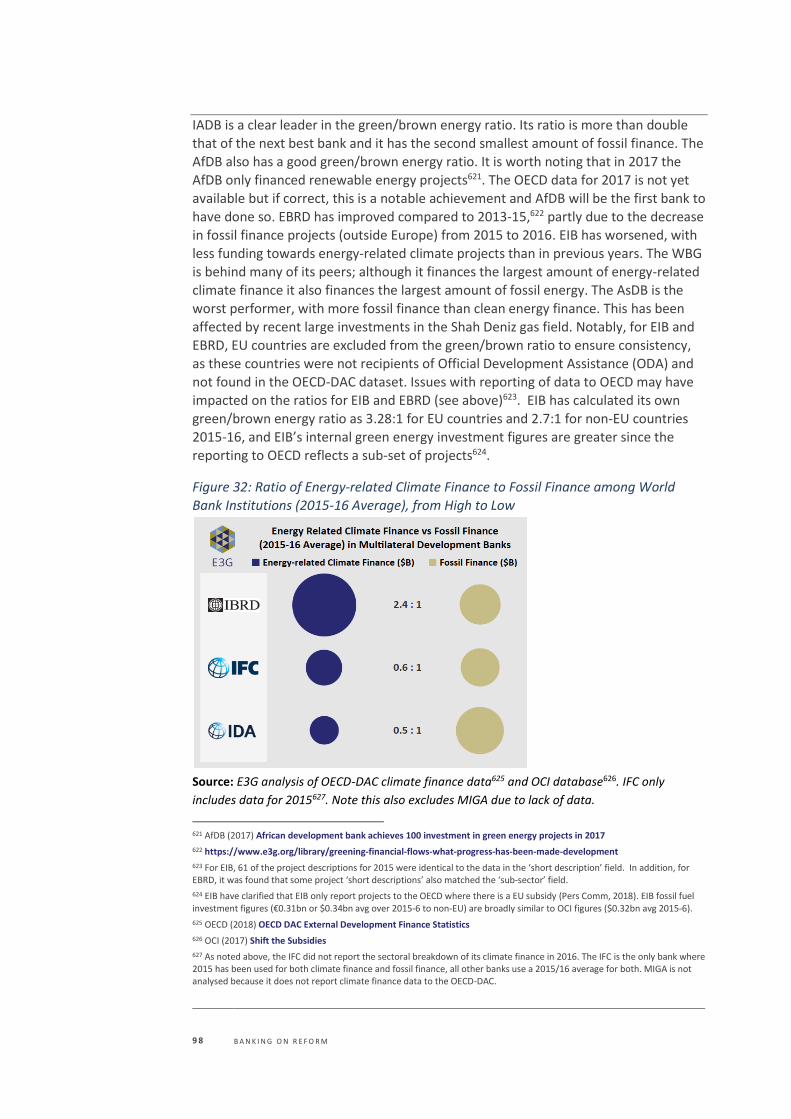
9 8 B A N K I N G O N R E F O R M
IADB is a clear leader in the green/brown energy ratio. Its ratio is more than double that of the next best bank and it has the second smallest amount of fossil finance. The AfDB also has a good green/brown energy ratio. It is worth noting that in 2017 the AfDB only financed renewable energy projects621. The OECD data for 2017 is not yet available but if correct, this is a notable achievement and AfDB will be the first bank to
have done so. EBRD has improved compared to 2013-15,622 partly due to the decrease in fossil finance projects (outside Europe) from 2015 to 2016. EIB has worsened, with less funding towards energy-related climate projects than in previous years. The WBG is behind many of its peers; although it finances the largest amount of energy-related climate finance it also finances the largest amount of fossil energy. The AsDB is the
worst performer, with more fossil finance than clean energy finance. This has been affected by recent large investments in the Shah Deniz gas field. Notably, for EIB and
EBRD, EU countries are excluded from the green/brown ratio to ensure consistency, as these countries were not recipients of Official Development Assistance (ODA) and not found in the OECD-DAC dataset. Issues with reporting of data to OECD may have impacted on the ratios for EIB and EBRD (see above)623. EIB has calculated its own green/brown energy ratio as 3.28:1 for EU countries and 2.7:1 for non-EU countries
2015-16, and EIB’s internal green energy investment figures are greater since the
reporting to OECD reflects a sub-set of projects624.
Figure 32: Ratio of Energy-related Climate Finance to Fossil Finance among World
Bank Institutions (2015-16 Average), from High to Low
Source: E3G analysis of OECD-DAC climate finance data625 and OCI database626. IFC only
includes data for 2015627. Note this also excludes MIGA due to lack of data.
621 AfDB (2017) African development bank achieves 100 investment in green energy projects in 2017
622 https://www.e3g.org/library/greening-financial-flows-what-progress-has-been-made-development
623 For EIB, 61 of the project descriptions for 2015 were identical to the data in the ‘short description’ field. In addition, for EBRD, it was found that some project ‘short descriptions’ also matched the ‘sub-sector’ field.
624 EIB have clarified that EIB only report projects to the OECD where there is a EU subsidy (Pers Comm, 2018). EIB fossil fuel investment figures (€0.31bn or $0.34bn avg over 2015-6 to non-EU) are broadly similar to OCI figures ($0.32bn avg 2015-6).
625 OECD (2018) OECD DAC External Development Finance Statistics
626 OCI (2017) Shift the Subsidies
627 As noted above, the IFC did not report the sectoral breakdown of its climate finance in 2016. The IFC is the only bank where 2015 has been used for both climate finance and fossil finance, all other banks use a 2015/16 average for both. MIGA is not analysed because it does not report climate finance data to the OECD-DAC.
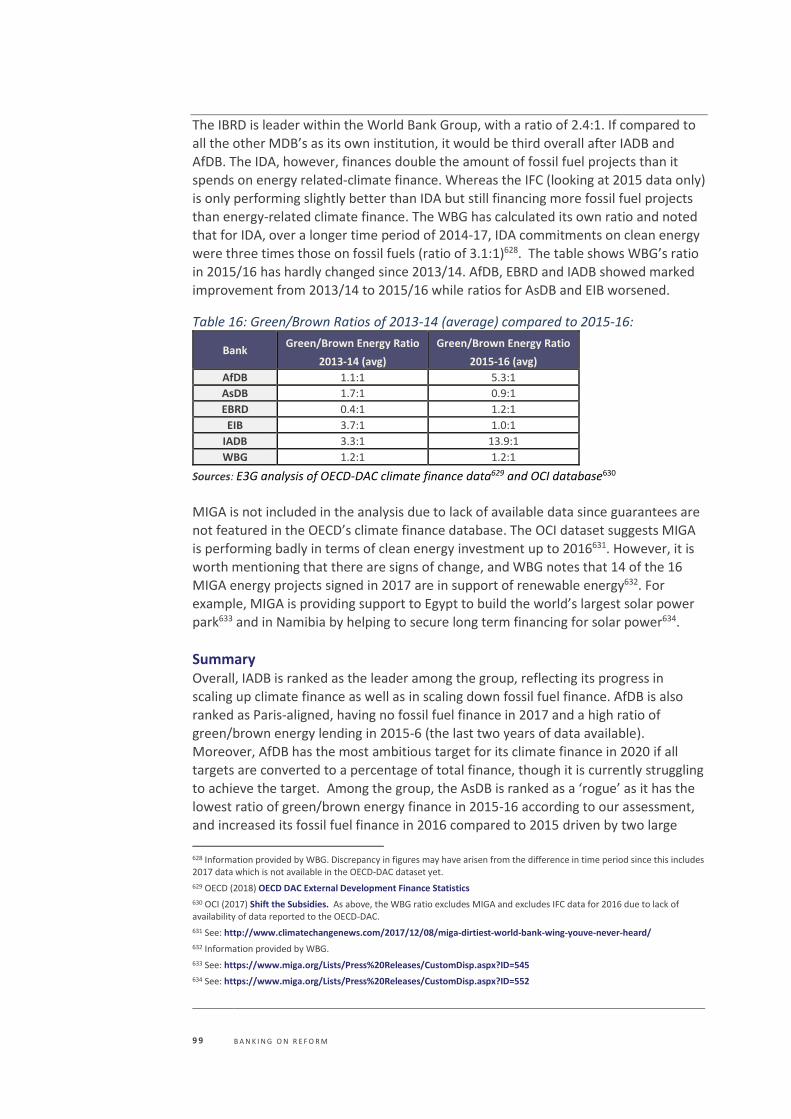
9 9 B A N K I N G O N R E F O R M
The IBRD is leader within the World Bank Group, with a ratio of 2.4:1. If compared to all the other MDB’s as its own institution, it would be third overall after IADB and AfDB. The IDA, however, finances double the amount of fossil fuel projects than it spends on energy related-climate finance. Whereas the IFC (looking at 2015 data only) is only performing slightly better than IDA but still financing more fossil fuel projects
than energy-related climate finance. The WBG has calculated its own ratio and noted that for IDA, over a longer time period of 2014-17, IDA commitments on clean energy were three times those on fossil fuels (ratio of 3.1:1)628. The table shows WBG’s ratio in 2015/16 has hardly changed since 2013/14. AfDB, EBRD and IADB showed marked improvement from 2013/14 to 2015/16 while ratios for AsDB and EIB worsened.
Table 16: Green/Brown Ratios of 2013-14 (average) compared to 2015-16:
Bank Green/Brown Energy Ratio
2013-14 (avg)
Green/Brown Energy Ratio
2015-16 (avg)
AfDB 1.1:1 5.3:1
AsDB 1.7:1 0.9:1
EBRD 0.4:1 1.2:1
EIB 3.7:1 1.0:1
IADB 3.3:1 13.9:1
WBG 1.2:1 1.2:1
Sources: E3G analysis of OECD-DAC climate finance data629 and OCI database630
MIGA is not included in the analysis due to lack of available data since guarantees are not featured in the OECD’s climate finance database. The OCI dataset suggests MIGA is performing badly in terms of clean energy investment up to 2016631. However, it is
worth mentioning that there are signs of change, and WBG notes that 14 of the 16 MIGA energy projects signed in 2017 are in support of renewable energy632. For
example, MIGA is providing support to Egypt to build the world’s largest solar power park633 and in Namibia by helping to secure long term financing for solar power634.
Summary Overall, IADB is ranked as the leader among the group, reflecting its progress in scaling up climate finance as well as in scaling down fossil fuel finance. AfDB is also
ranked as Paris-aligned, having no fossil fuel finance in 2017 and a high ratio of green/brown energy lending in 2015-6 (the last two years of data available).
Moreover, AfDB has the most ambitious target for its climate finance in 2020 if all targets are converted to a percentage of total finance, though it is currently struggling
to achieve the target. Among the group, the AsDB is ranked as a ‘rogue’ as it has the lowest ratio of green/brown energy finance in 2015-16 according to our assessment, and increased its fossil fuel finance in 2016 compared to 2015 driven by two large
628 Information provided by WBG. Discrepancy in figures may have arisen from the difference in time period since this includes 2017 data which is not available in the OECD-DAC dataset yet.
629 OECD (2018) OECD DAC External Development Finance Statistics
630 OCI (2017) Shift the Subsidies. As above, the WBG ratio excludes MIGA and excludes IFC data for 2016 due to lack of availability of data reported to the OECD-DAC.
631 See: http://www.climatechangenews.com/2017/12/08/miga-dirtiest-world-bank-wing-youve-never-heard/
632 Information provided by WBG.
633 See: https://www.miga.org/Lists/Press%20Releases/CustomDisp.aspx?ID=545
634 See: https://www.miga.org/Lists/Press%20Releases/CustomDisp.aspx?ID=552
1 0 0 B A N K I N G O N R E F O R M
investments in the Shah Deniz gas fields. The AsDB’s green/brown energy finance ratio in 2015-6 has also worsened considerably since 2013-4. The other institutions, EBRD, EIB and WBG are ranked as laggards. EBRD is ranked as a laggard because it has insufficiently scaled up its climate-related finance in recent
years and has limited adaptation finance. However, it has recently improved on its green/brown ratio for energy-related climate finance to developing countries. None of the MDBs met their 2020 climate finance target in 2016, demonstrating the need to scale up climate finance among all MDBs. EBRD recently stated that climate investments are already close to 40% of total spend in 2017635, though the OECD data
for 2017 has not been published yet.
The WBG also receives a ‘laggard’ ranking in 2015-16 due to its lack of progress in scaling down its fossil fuel finance. This may improve in coming years due to the recent commitment to end finance to upstream oil and gas projects636. The WBG also has the weakest 2020 target on climate finance if all targets are converted to a percentage of total finance. It is therefore recommended that the WBG increases this
target. Progress has been made under the capital increase discussions, with IBRD’s
investment in projects with climate benefits is set to increase to 30% by 2023 and 35% of IFC support by 2030637.
The EIB has made some progress in reducing its levels of fossil fuel finance to
developing countries in recent years, has taken steps to calculate its own green/brown ratio, and has also a diversified its climate-related investments into the transport sector. However, overall EIB is ranked as a ‘laggard’ as its total mitigation
finance levels in 2016 remained lower than in 2014. In addition, EIB continues to finance fossil fuel projects including upstream projects for fossil fuel exploration and
extraction. This is clearly not aligned with the science which shows that the majority of fossil fuels need to stay in the ground to reach Paris Agreement targets638.
There is insufficient data on green/brown energy ratios available from the MDBs annual reports, therefore we had to draw upon secondary data from OECD-DAC for the ‘green’ energy data and Oil Change data for ‘brown’ energy data. However, there
are limitations in the approach given the OECD-DAC dataset on climate-related development finance only covers ODA recipients (non-EU countries). It is therefore
recommended that the MDBs begin tracking and self-reporting on the green/brown energy ratio within their portfolio, for example in the MDB Joint Report on Climate
Finance.
635 See: http://www.ebrd.com/news/2017/ebrd-president-attended-one-planet-climate-summit-in-paris.html
636 http://www.worldbank.org/en/topic/climatechange/brief/qa-the-world-bank-group-and-upstream-oil-and-gas
637 https://www.parliament.uk/business/publications/written-questions-answers-statements/written-statement/Commons/2018-04-25/HCWS644/
638 McGlade and Ekins (2015). The geographical distribution of fossil fuels unused when limiting global warming to 2C. Nature 517, 187-190
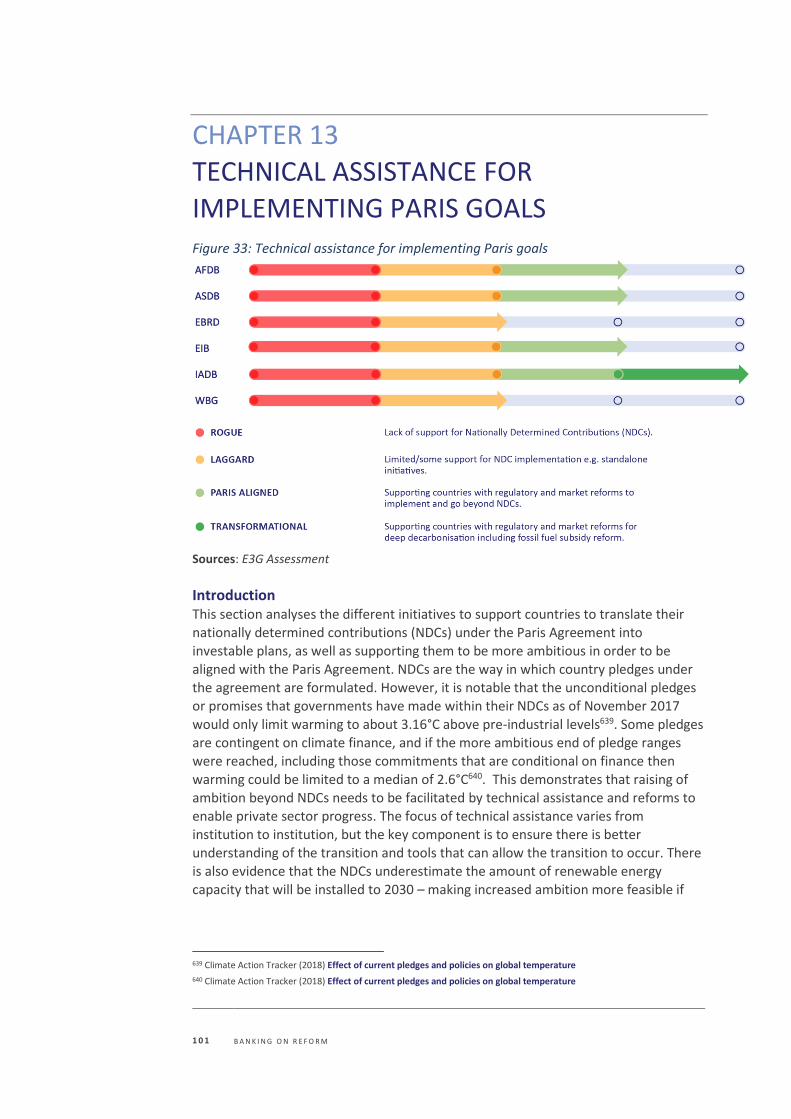
1 0 1 B A N K I N G O N R E F O R M
CHAPTER 13
TECHNICAL ASSISTANCE FOR
IMPLEMENTING PARIS GOALS Figure 33: Technical assistance for implementing Paris goals
Sources: E3G Assessment
Introduction This section analyses the different initiatives to support countries to translate their
nationally determined contributions (NDCs) under the Paris Agreement into investable plans, as well as supporting them to be more ambitious in order to be aligned with the Paris Agreement. NDCs are the way in which country pledges under
the agreement are formulated. However, it is notable that the unconditional pledges or promises that governments have made within their NDCs as of November 2017
would only limit warming to about 3.16°C above pre-industrial levels639. Some pledges are contingent on climate finance, and if the more ambitious end of pledge ranges were reached, including those commitments that are conditional on finance then
warming could be limited to a median of 2.6°C640. This demonstrates that raising of ambition beyond NDCs needs to be facilitated by technical assistance and reforms to
enable private sector progress. The focus of technical assistance varies from institution to institution, but the key component is to ensure there is better understanding of the transition and tools that can allow the transition to occur. There
is also evidence that the NDCs underestimate the amount of renewable energy capacity that will be installed to 2030 – making increased ambition more feasible if
639 Climate Action Tracker (2018) Effect of current pledges and policies on global temperature
640 Climate Action Tracker (2018) Effect of current pledges and policies on global temperature
1 0 2 B A N K I N G O N R E F O R M
country analysts understand what is economically likely based on current trends in renewable energy growth641. Moreover, in this section we look at whether MDBs are supporting client countries with technical assistance on fossil fuel subsidy reform (FFSR). Fossil fuel subsidies still
amounted to around $373bn globally in 2015642, despite some improvement from previous years. The IMF estimates that removal of such subsidies could reduce fossil-fuel related carbon emissions globally by over 20%643. Subsidies act as ‘negative carbon prices’, an incentive acting in the opposite direction to carbon prices644. Such subsidies are also effectively subsidizing unburnable carbon given that all fossil fuels
cannot be exploited without catastrophic climate impacts645. While estimates on the impact of subsidy reform vary, in many oil and gas exporting regions research has
found subsidy removal would lead to bigger reductions than promised by Paris Agreement pledges646. Despite this, only around 13 NDCs included fossil fuel subsidy reform647. It has been argued that getting incentives right and supporting FFSR is one way for climate finance to be ‘transformational’648.
African Development Bank AfDB649 At COP23 in Bonn, AfDB announced the launch of Africa NDC Hub, a platform to support countries to translate their “NDC into actions, without neglecting their
development priorities”650 651. The Hub has 10 partners apart from the AfDB652.
Member countries are provided with a one stop shop on technical assistance. The
NDC hub will also showcase the projects under implementation, with the view of marketing them and facilitating information for investors, particularly institutional investors. In addition, this is restated in the AfDB Climate Change Action Plan (2016-
2020). The Bank is aligning is operations and financing to support countries to achieve NDCs. Several country support activities have been undertaken or are ongoing
(Uganda, Tunisia, Kenya, Namibia) in collaboration with the NDC Partnership653.
641 http://eciu.net/blog/2017/cutting-carbon-why-so-shy
642 OECD (2018) Companion to the Inventory of Support Measures for Fossil Fuels 2018
643 https://www.imf.org/en/News/Articles/2015/09/28/04/53/sonew070215a
644 https://www.e3g.org/library/negative-carbon-pricing-a-shadow-price-we-need-to-know-blog
645 ODI (2014) The fossil fuel bailout: G20 subsidies for oil, gas and coal exploration
646 Jewell et al (2018) Nature volume 554, pages 229–233 (08 February 2018)
647 Terton et al (2015) Fiscal instruments in INDCS
648 WRI (2016) Transformational climate finance
649 See https://www.afdb.org/en/news-and-events/african-development-bank-approves-its-second-climate-change-action-plan-for-2016-2020-17527/
650 See https://www.afdb.org/en/news-and-events/fighting-climate-change-in-africa-afdb-launches-africa-ndc-hub-with-10-partners-17560/
651 See https://www.afdb.org/en/topics-and-sectors/initiatives-partnerships/africa-ndc-hub/
652 The African Union Commission (AUC), the United Nations Economic Commission for Africa (UNECA), the NEPAD Planning and Coordination Agency, the Food and Agriculture Organization of the United Nations (FAO), the United Nations Development Programme (UNDP), the United Nations Environment Programme (UNEP), the Economic Community of West African States (ECOWAS), the World Wildlife Fund (WWF), the International Institute for the Environment and Development (IIED) and the secretariat of the United Nations Framework Convention on Climate Change.
653 Information directly received from AfDB.
1 0 3 B A N K I N G O N R E F O R M
Furthermore, the AfDB has initiated several programmes to support energy subsidy reform including advice for Egypt654, and Tanzania655. However, it is not clear to what extent energy subsidy reform is a key part of advice for countries; and AfDB could explore comprehensively which member countries would benefit the most from energy subsidy reform. It is also recommended that AfDB conduct regional analysis
to support its work, as IADB and AsDB have done.
Asian Development Bank (AsDB) AsDB is working in 2018 to create a platform to support countries with their NDCs, supported by initial funding from the AsDB’s Climate Change Fund. The platform is
going to start a pilot program with selected member countries656. AsDB has already begun to reflect NDCs in country dialogue and Country Partnership Strategies (see Chapter 3) and has published an assessment of how member countries NDC priorities map across AsDB’s operations657. Furthermore, it has done preliminary analysis on
pathways for the low carbon transition in Viet Nam658 and the Philippines659. The work is being considered during country dialogues and programming processes660, and the Viet Nam Country Operations Business Plan (2018-2020) has “improving environmental sustainability and climate change response” as one of three main
pillars661. Given the new climate change operational framework, it will be helpful if the NDC platform will also offer support to countries in designing deep decarbonization
pathways. AsDB may be able to learn from IADB’s current work in this regard.
AsDB has several examples of technical support for energy subsidy reform, including providing advice for policymakers in Thailand’s reform strategies662 as well as in Indonesia663. However further research would need to be done to know to what
extent the policy advice provided was actioned. AsDB has also done analysis on FFSR in several countries, demonstrating that the money freed up by subsidy reform can be
used to compensate poor households and promote sustainable energy664.
European Bank for Reconstruction and Development (EBRD) EBRD, along with other MDBs, is part of the NDC Partnership, showing its commitment to support countries with the implementation of NDCs. The summary of
first year of the NDC partnership states that EBRD has an NDC support programme, which provides technical assistance, capacity building, policy dialogue with
654 See https://www.afdb.org/en/news-and-events/afdb-study-points-way-forward-for-egypts-revived-energy-subsidy-reform-process-9058/
655 See https://www.afdb.org/en/news-and-events/afdb-approves-us-70-5-million-budget-support-operation-for-tanzania-energy-sector-14243/
656 See https://blogs.adb.org/blog/adb-deepens-its-commitment-paris-agreement-climate-change
657 AsDB (2016) Assessing the Intended Nationally Determined Contributions Of ADB Developing Members
658 AsDB (2017). Pathways to Low Carbon Development for Vietnam
659 AsDB (2017). Pathways to Low Carbon Development for the Philippines
660 Information received directly from AsDB
661 AsDB (2017) Country Operations Business Plan, Viet Nam 2018-2020
662 AsDB (2015) Fossil Fuel Subsidies in Thailand: Trends, Impacts, and Reforms
663AsDB (2015) Fossil Fuel Subsidies in Indonesia: Trends, Impacts, and Reforms
664 AsDB (2016) Fossil Fuel Subsidies in Asia: Trends, Impacts, and Reforms - Integrative Report
1 0 4 B A N K I N G O N R E F O R M
governments and the private sector665. It also states that the EBRD is providing support to strengthen countries monitoring, reporting and verification (MRV)666. In addition, EBRD is playing a role in catalysing markets in countries using the private sector. For example, the EBRD’s work in Kazakhstan has involved technical assistance to improve the renewable energy law, ensuring an adequately resourced agency to
implement energy efficiency strategies667. This support has been potentially transformational in helping the country to enhance the bankability of renewable energy and energy efficiency projects668. However, there is not currently any mention of NDC support in the Green Economy Transition (GET) approach, which needs to be updated post-Paris to keep up to date with the demands from their clients and be
ready to support them669. Moreover, additional information on the NDC support programme is not currently available on the EBRD website as of April 2018. As a
result, EBRD is currently positioned as a laggard in our benchmark. However, it is noted that this position is likely to change in future with EBRD’s ranking likely to be updated to a ‘Paris-aligned’ or ‘transformational’ ranking as more information is publicly released about the EBRD’s approach to implementation of the Nationally Determined Contributions (NDCs).
Regarding energy subsidies, EBRD’s Transition Report for 2017-8 covers this topic as well as progress on reducing GHG emissions. It notes that according to the IMF, the EBRD regions fossil fuel subsidies had a total value (excluding tax treatment) of
$112bn in 2013 (equivalent to 1.7% of the region’s GDP)670. EBRD highlights that a
business environment conducive to low carbon investment should “start with the removal of energy subsidies and the introduction of appropriate pricing of carbon emissions”671. EBRD has worked with governments in Egypt and Kazakhstan to better
understand the fiscal implications of a green economy transition including stranded asset risks672.
European Investment Bank (EIB) EIB does not have a specific initiative to support NDCs and it is not part of the NDC Partnership. Nevertheless, it claims in its Climate Strategy to support countries to
achieve their National Adaptation Plans and NDCs673. As mentioned in the Strategy section, EIB climate action is interlinked with EU policy. Therefore, when it comes to
supporting countries with 2050 decarbonisation roadmaps, EIB tends to fall behind as it doesn’t have the mandate to go beyond EU policy. With regards to overall technical assistance, the EIB has a good package of support for countries, including URBIS and the European Fund for Strategic Investment (EFSI). URBIS is an advisory platform for cities within the European Investment Advisory Hub (EIAH) to provide advisory
665 NDC Partnership (XX). Partnership in Action: One year later.
666 NDC Partnership (XX). Partnership in Action: One year later.
667 See: www.ebrd.com/documents/ict/renewable-energy-in-kazakhstan.pdf
668 Ibid
669 Information received directly from EBRD has indicated that a further update is expected in 2020 as the GET Approach covers up until that period.
670 http://2017.tr-ebrd.com/green-growth/
671 http://2017.tr-ebrd.com/green-growth/
672 https://www.slideshare.net/OECD_ENV/session-5-presentation-by-isabel-blanco-ebrd
673 EIB (2015). Climate Strategy
1 0 5 B A N K I N G O N R E F O R M
support to unlock urban investment - including innovative financing approaches674. EFSI is a joint initiative of the EIB and European Commission, focused on mobilising private investment into strategically important areas. Renewable energy and resource efficiency are one of four core strategic areas675. Together, URBIS and EFSI provide examples of proven solutions which can act as catalysts to help accelerate the low
carbon and climate-resilient transition. Other notable technical assistance initiatives include the Cleaner Transport Facility (CTF) which deploys the EIB’s technical and financial capacity to boost opportunities for cleaner transport, including charging infrastructure676. In addition, ELENA is a joint
technical assistance initiative by the EIB and the European Commission providing grants for technical assistance focused on energy efficiency, distributed
renewable energy and urban transport677. However, information could not be found on how EIB is helping countries with energy subsidy reform, or on analysis which EIB had conducted on energy subsidy reform to support its work. We recommend the EIB seek to fill this gap in its technical assistance by providing advice on fossil fuel subsidy reform.
Inter-American Development Bank (IADB) In 2016, IADB launched a one stop shop, NDC Invest678, to support countries in
translating their NDCs into investment plans and bankable projects (see Chapter 3 and
the box below)679.
Box 9: NDC Invest - IADB NDC Invest is the IADB’s collective effort to assist countries to translate Paris pledges – known as nationally determined contributions (NDCs) - into investment plans and bankable projects. It is a one-stop shop with a comprehensive package of assistance for programming, policy development and delivery of investments680 and encompasses four components: (1) NDC Programmer helps public and private sector stakeholders to construct investment plans and on policies and enabling environments to unleash investments at scale; (2) NDC Pipeline Accelerator is carrying out priority studies and additional activities to ensure technical and financial feasibility for bankable and sustainable projects; (3) NDC Market Booster uses additional non-reimbursable and reimbursable grants for innovative business models, financial instruments and market development services, helping private sector clients overcome market and other non-financial barriers; (4) NDC Finance Mobilizer mobilizes funding from internal and external sources together with the private arm of the IDB. Expected Outcome: It has operations in 11 countries and has supported 2 regional initiatives,
one in the Caribbean and one sector focus on clean buses across LAC681. Guided by the vision
of ensuring that best practices and lessons from the past are adequately considered, NDC Invest is putting an emphasis on engaging with ministries of finance and the private sector.
674 EIB (2018) Urbis
675 EIB (2018) EFSI
676 See: http://www.eib.org/projects/sectors/transport/cleaner-transport-facility
677 See: http://www.eib.org/products/advising/elena/index.htm
678 IDB (to be published). IDBG Climate Change Action Plan 2016-2020.
679 See https://www.ndcinvest.org/
680 See https://www.ndcinvest.org/
681 Interview with IADB staff
1 0 6 B A N K I N G O N R E F O R M
Transformational aspect: Interestingly, there are two sides of this program. On one hand it facilitates access to international climate finance and know-how by simplifying the associated cumbersome procedures, providing “bespoke” package support at the early stages. On the other hand, it also ensures that the internal process within the IADB aligns to provide cross-sectoral solutions to respond to the NDC’s objectives and to the Paris Agreement; using their resources in a more effective way, internalising the importance of addressing climate change and seizing opportunities of low carbon development across different divisions. Finally, NDC Invest has an emphasis on supporting a programmatic approach for NDC implementation, moving from a project-by-project basis to a comprehensive approach of portfolio and program
development to deliver low carbon and resilient development682.
IADB has also started a regional project on deep decarbonization pathways in Argentina, Colombia, Costa Rica and Ecuador (see below). This is an important step to build capacity within the country whilst helping policy makers make better informed decisions to shape long-term sustainability – as well as bringing transparency and ownership to the process683. This is in line with IADB’s climate action plan to promote
policy consistency so as to translate NDCs into investment. IADB is the first bank actively working on supporting 2050 pathway planning. Although it is in the early stages, IADB efforts should be commended and other MDBs should learn from this, not only to support client countries but also to provide a more effective financial
support. Therefore, IADB is positioned as a transformational champion.
Box 10: Deep Decarbonisation Pathways for LAC (DPP-LAC) DDP-LAC is a 2-year project684 dedicated to improving the capacity of the Latin America and Caribbean (LAC) region to rely on independent, domestic evaluations to assess their NDCs, emission reduction plans, and climate policies. The project aims to increase the pool of available models and modelers in the region, to (1) Train academic teams and/or think tanks in the development and use of models; (2) Enhance collaboration between local modelers and policymakers; (3) Inform local policy debates about decarbonization pathways and NDC planning, generating emission reduction pathways for their respective countries; (4) Develop a regional community of practice to discuss modelling approaches and assessments of climate policies, share experiences and continue to develop expertise. It is also hoped that in the long term the project will contribute to improve the transparency of international stocktaking on NDCs with a more active participation of experts from LAC685. DDP-LAC is working in collaboration with the 2050 pathway platform, a multi-stakeholder initiative launched at COP 22 to support countries seeking to develop long-term pathways, as well as with the Agence Française de Development (AFD), and IDDRI on knowledge sharing. Expected outcome: The project is already working with experts from universities and think tanks in 4 countries – Argentina, Colombia, Costa Rica, Ecuador - in the development of local models in collaboration with international experts chosen by the local teams. México and Peru are in initial discussions about taking part. Transformational aspect: Countries in LAC need to design their NDCs and the policy packages that will deliver them. Key to the efficacy of the NDCs is their consistence with deep
682 Interview with IADB staff
683 IDB (2017). Deep decarbonization pathways in Latin America and the Caribbean
684 DDP-LAC is working in collaboration with the 2050 pathway platform, a multi-stakeholder initiative launched at COP 22 by High-Level Climate Champions Laurence Tubiana and Hakima El Haite to support countries seeking to develop long-term, net zero-GHG, climate-resilient and sustainable-development pathways. Agence Française de Development is providing some funding and with whom we collaborate more generally on our climate change knowledge agenda. Whilst, IDDRI is coordinating both technical and administrative matters and sharing the experience of the previous DDP Project.
685 Information received from IADB
1 0 7 B A N K I N G O N R E F O R M
decarbonization by the end of the century. To track progress, it is essential to also monitor how emission reductions are delivered, and whether all sectors are making progress. This project is strengthening the capacity of local experts to contribute to understanding of pathways to achieve targets that are consistent with the long-term decarbonization goal of the Paris Agreement.
In terms of fiscal incentives, the IADB has estimated that fossil fuel subsidies in LAC countries amounted to $84bn per year, or 1.6% of regional GDP, before the price of oil fell in late 2014. It also estimates that for every $10 spent on energy subsidies across LAC only $1 reaches the poorest 20% of households686. IADB has supported various member countries in plans to streamline energy subsidies, for example in the
Dominican Republic which receives a $500m loan to finance the country’s plan to do so - a move that will help reduce the fiscal deficit687.
World Bank Group (WBG)688 The World Bank along with other MDBs is part of the NDC Partnership, through which
it has an NDC Support Facility Trust Fund. Over a 2-year pilot (2017-18) this facility will be client-driven and focus on upstream analytical work such as capacity building and investment plan development, leveraging WBG’s other NDC-related support689. For example, in Vietnam the work will focus on transport whereas in Indonesia, it will
focus on land use690. Funds are allocated to 23 projects in 18 countries, and the facility will draw on existing climate funds, some of which will have a NDC “carve out”691. Out
of the 22 projects, 9 directly support mitigation targets, three focus on adaptation strategies, and 10 address both mitigation and adaptation actions692. Existing WBG-
housed trust funds which have been identified as having NDC relevance include the Partnership for Market Readiness (PMR); Transformative Carbon Asset Facility (TCAF)
and the Carbon Partnership Facility (CPF) among others693. Examples of the work by the World Bank NDC Support Facility include strategic
support on efficiency policies and actions in Pakistan, as well as supporting development of a 3-year business plan for Pakistan’s National Energy Efficiency and
Conservation Authority694. In Mali, Morocco and Cote d’Ivoire, the Facility is supporting operationalization of the Adaptation for Agriculture in Africa (AAA)
Initiative, including development of climate smart investment plans, while building the Initiative’s capacity to scale to other African countries695. However, publicly
available information was lacking as the NDC Support Facility Trust Fund does not appear to be have its own website as of April 2018, thus the World Bank is currently 686 See https://blogs.iadb.org/energia/en/2017/11/29/an-opportune-time-for-reforming-energy-subsidies-in-latin-america-and-the-caribbean/
687 See https://www.iadb.org/en/news/news-releases/2009-10-21/dominican-republic-gets-500-million-loan-from-the-idb%2C5802.html
688 World Bank Group (2016). Climate Change Action Plan
689 PMR (x) The NDC Partnership
690 Ibid
691 UNFCCC (x) NDC Implementation Support
692 Information from WBG.
693 PMR (x) The NDC Partnership
694 NDC Partnership (2017) Partnership in Action: One Year On
695 NDC Partnership (2017) Partnership in Action: One Year On
1 0 8 B A N K I N G O N R E F O R M
positioned as a laggard on this benchmark. However, as for EBRD, it is noted that this scoring may change in future and be revised upward as more information is publicly released about the WBG’s support for NDC implementation. For example, as noted in Chapter 3, the World Bank has recently confirmed that it will be taking part in the 2050 Pathways Platform initiative to keep them informed of modelling work and how
countries are exploring how to achieve zero-net emissions in the second half of the century. If further information is provided on the NDC support and long-term planning information from the 2050 Platform is integrated into WBG’s technical assistance work in future, then this could also be ranked as ‘transformational’.
WBG’s support to countries is also provided through the Systematic Country Diagnostic (SCDs) which focuses on the macro challenges and the link between
climate and development and informs the CPF (see Chapter 3 for more details). The latter identifies the development goals of the country and where the WBG could provide support and proposes possible interventions696. NDC support for countries is also mentioned throughout the WBG’s Climate Change Action Plan (CCAP). The WBG has also provided a range of support to countries on fossil fuel subsidy reform
including through ESMAP in Egypt and Ukraine697. Among the MDBs, the WBG is the
only MDB to have signed onto support for the Friends of Fossil Fuel Subsidy Reform Communique698.
696 See http://www.worldbank.org/en/projects-operations/country-strategies#1
697 http://www.worldbank.org/en/news/feature/2017/11/21/reforming-fossil-fuel-subsidies-for-a-cleaner-future
698 See http://fffsr.org/communique/supporters/
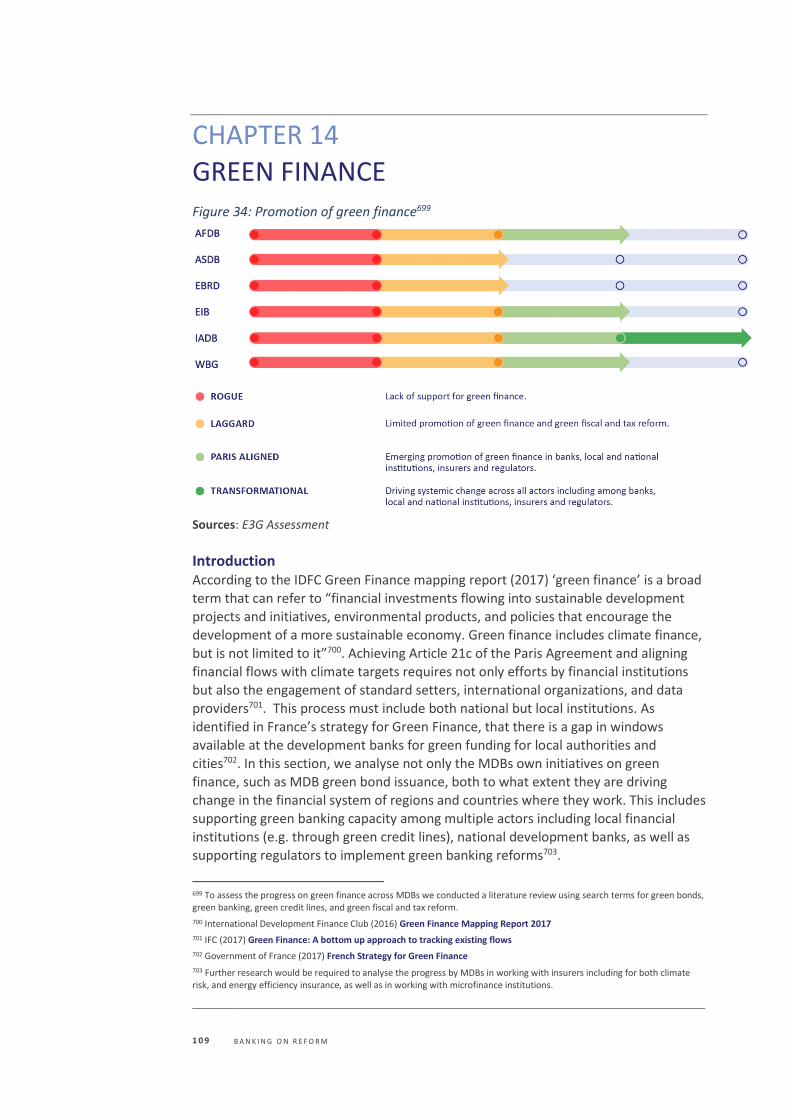
1 0 9 B A N K I N G O N R E F O R M
CHAPTER 14
GREEN FINANCE Figure 34: Promotion of green finance699
Sources: E3G Assessment
Introduction According to the IDFC Green Finance mapping report (2017) ‘green finance’ is a broad term that can refer to “financial investments flowing into sustainable development
projects and initiatives, environmental products, and policies that encourage the development of a more sustainable economy. Green finance includes climate finance, but is not limited to it”700. Achieving Article 21c of the Paris Agreement and aligning
financial flows with climate targets requires not only efforts by financial institutions but also the engagement of standard setters, international organizations, and data providers701. This process must include both national but local institutions. As
identified in France’s strategy for Green Finance, that there is a gap in windows available at the development banks for green funding for local authorities and
cities702. In this section, we analyse not only the MDBs own initiatives on green finance, such as MDB green bond issuance, both to what extent they are driving
change in the financial system of regions and countries where they work. This includes supporting green banking capacity among multiple actors including local financial institutions (e.g. through green credit lines), national development banks, as well as
supporting regulators to implement green banking reforms703.
699 To assess the progress on green finance across MDBs we conducted a literature review using search terms for green bonds, green banking, green credit lines, and green fiscal and tax reform.
700 International Development Finance Club (2016) Green Finance Mapping Report 2017
701 IFC (2017) Green Finance: A bottom up approach to tracking existing flows
702 Government of France (2017) French Strategy for Green Finance
703 Further research would be required to analyse the progress by MDBs in working with insurers including for both climate risk, and energy efficiency insurance, as well as in working with microfinance institutions.
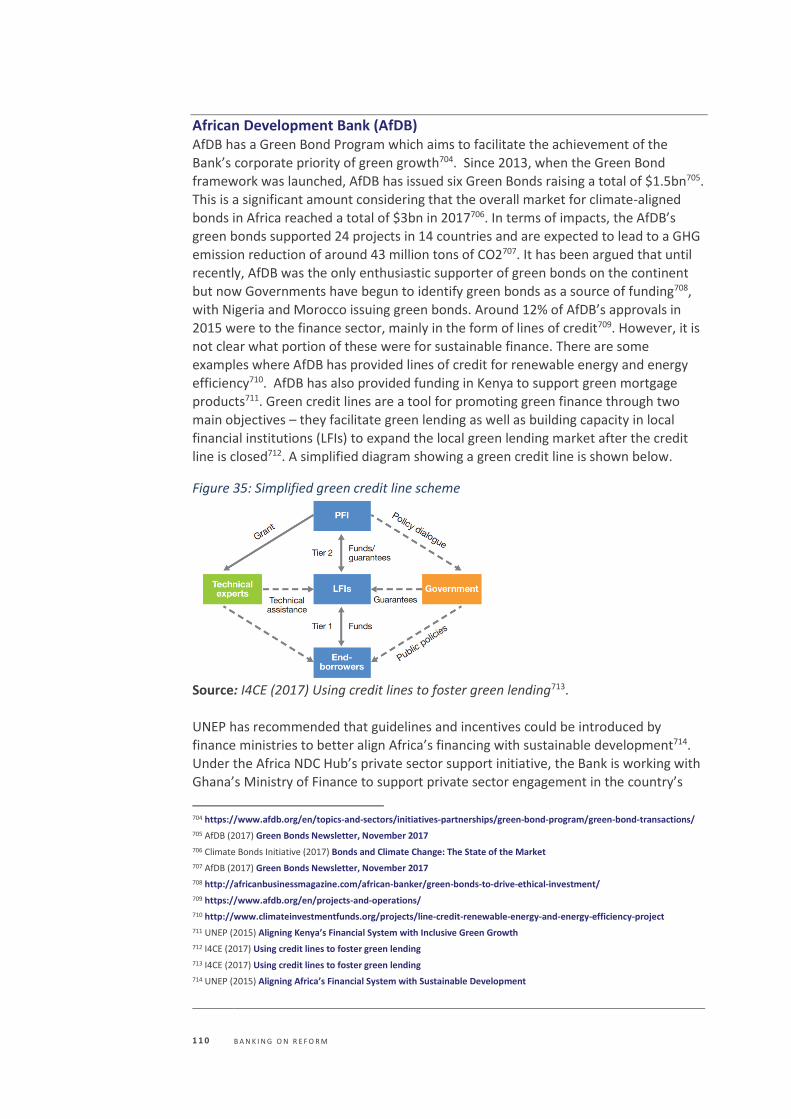
1 1 0 B A N K I N G O N R E F O R M
African Development Bank (AfDB) AfDB has a Green Bond Program which aims to facilitate the achievement of the
Bank’s corporate priority of green growth704. Since 2013, when the Green Bond framework was launched, AfDB has issued six Green Bonds raising a total of $1.5bn705. This is a significant amount considering that the overall market for climate-aligned bonds in Africa reached a total of $3bn in 2017706. In terms of impacts, the AfDB’s green bonds supported 24 projects in 14 countries and are expected to lead to a GHG
emission reduction of around 43 million tons of CO2707. It has been argued that until recently, AfDB was the only enthusiastic supporter of green bonds on the continent but now Governments have begun to identify green bonds as a source of funding708,
with Nigeria and Morocco issuing green bonds. Around 12% of AfDB’s approvals in 2015 were to the finance sector, mainly in the form of lines of credit709. However, it is not clear what portion of these were for sustainable finance. There are some examples where AfDB has provided lines of credit for renewable energy and energy
efficiency710. AfDB has also provided funding in Kenya to support green mortgage products711. Green credit lines are a tool for promoting green finance through two main objectives – they facilitate green lending as well as building capacity in local financial institutions (LFIs) to expand the local green lending market after the credit
line is closed712. A simplified diagram showing a green credit line is shown below.
Figure 35: Simplified green credit line scheme
Source: I4CE (2017) Using credit lines to foster green lending713.
UNEP has recommended that guidelines and incentives could be introduced by finance ministries to better align Africa’s financing with sustainable development714.
Under the Africa NDC Hub’s private sector support initiative, the Bank is working with Ghana’s Ministry of Finance to support private sector engagement in the country’s
704 https://www.afdb.org/en/topics-and-sectors/initiatives-partnerships/green-bond-program/green-bond-transactions/
705 AfDB (2017) Green Bonds Newsletter, November 2017
706 Climate Bonds Initiative (2017) Bonds and Climate Change: The State of the Market
707 AfDB (2017) Green Bonds Newsletter, November 2017
708 http://africanbusinessmagazine.com/african-banker/green-bonds-to-drive-ethical-investment/
709 https://www.afdb.org/en/projects-and-operations/
710 http://www.climateinvestmentfunds.org/projects/line-credit-renewable-energy-and-energy-efficiency-project
711 UNEP (2015) Aligning Kenya’s Financial System with Inclusive Green Growth
712 I4CE (2017) Using credit lines to foster green lending
713 I4CE (2017) Using credit lines to foster green lending
714 UNEP (2015) Aligning Africa’s Financial System with Sustainable Development
1 1 1 B A N K I N G O N R E F O R M
NDCs. Within this framework, the Bank aims to strengthen the application of Sustainable Banking Principles within Ghana’s banking sector. The Bank has also supported the Central Banks of Kenya, Gabon and Nigeria with technical assistance on issuance of sovereign green bonds715.
Asian Development Bank (AsDB) AsDB launched its Green Bond programme in 2015 with a $500m green bond716. In
2016, AsDB launched a dual tranche 3- and 10-year green bond, raising $1.3bn across both tenors717. These bonds have focused mainly on transport and energy. However, AsDB has been relatively slow to enter the green bond market given there has been a
green bond market in the Asia Pacific region for a number of years, and the Asia Pacific was the second largest region for climate-aligned bonds in 2017718. ASEAN+3 policy makers are also exploring options to promote green local currency-denominated bonds including identifying the barriers to green bond market
development719. AsDB has also provided assistance to developing member countries through green financial products from microfinance institutions (MFIs). For example, credit lines for MFIs were offered for energy efficient homes in Tajikistan. However, only a small number of individual projects are listed for MFI assistance720. Other
pioneering projects related to green finance include technical support to Punjab National Bank's to build institutional capacity on rooftop solar investment721, as well
as a project in Thailand aiming to show the viability of nonsubsidized solar power722.
AsDB has recently proposed the concept of a Green Finance Catalyzing Facility (GFCF)
to catalyze blend of financing and generate a pipeline of bankable green infrastructure projects, as well as providing project development and structuring support723. AsDB worked together with experts from the G20 green finance task force
on this724. The facility is currently starting in China, to finance a pool of green projects sponsored by local governments725. It is less clear to what extent the AsDB is working
with regulators on green banking regulation or green fiscal reform, though a recent AsDB paper highlighted the key role of regulatory issues for sustainable finance726.
European Bank for Reconstruction and Development (EBRD) EBRD started issuing green bonds in 2010 and, up to September 2017, has issued 65
Green Bonds totaling €2.3 billion equivalent727. However, this is not a major proportion of the total in the region given that Europe is the largest region in the
715 Information received via AfDB
716 AsDB (2017) ADB Green Bonds
717 Ibid
718 Climate Bonds Initiative (2017) Bonds and Climate Change: The State of the Market
719 See: https://www.adb.org/publications/green-lcy-bonds-infrastructure-development-asean3
720 https://www.adb.org/sectors/finance/microfinance/green-finance
721 https://www.adb.org/projects/49419-001/main#project-pds
722 https://www.adb.org/projects/49087-001/main#project-pds
723 AsDB (2017) Catalyzing Green Finance: A Concept for Leveraging Blended Finance for Green Development
724 https://www.adb.org/news/report-calls-creation-national-green-financing-mechanisms-accelerate-green-growth-asia
725 https://www.adb.org/projects/51194-002/main#project-overview
726 AsDB (2018) Working Paper: Fostering Green Finance For Sustainable Development In Asia
727 http://www.ebrd.com/news/2017/ebrd-issues-usd-500mn-short-4year-global-in-green-bond-format.html
1 1 2 B A N K I N G O N R E F O R M
world in terms of climate-aligned bond issuance728. EBRD is a part of the Green Bond Principles Executive Committee729, and actively contributes to the development of the green bond market. According to the OECD730, credit lines supported by international financial institutions are the main source of long-term funding for green investments in EU Eastern Partnership Countries, and EBRD is the most significant financier. Key
within this is the EBRD Sustainable Energy Finance Facilities (SEFF) programme which operates in 23 countries and extends credit lines to local financial institutions for on-lending to in energy efficiency and small-scale renewable energy projects731. Through its Sustainable Energy Initiative (SEI) from 2006 to 2015, EBRD has worked
with governments to support the development of strong institutional and regulatory frameworks that incentivize sustainable energy investments732. The EBRD has also
been involved in promoting green banking markets within Africa733. Recently EBRD launched a study to assess the potential for a green financial system in Kazakhstan734. Moreover, in Turkey, EBRD has been working with banks and financial regulators on clarifying the role of carbon pricing735. In addition, EBRD’s Green Economy Financing Facility (GEFF) provides credit lines to local financial institutions so that they can
finance green investments736. EBRD’s cooperation with financial intermediaries
includes a strong emphasis on environmental and social risk management including “10 Performance Requirements that cover key areas of E&S issues and impacts”737.
European Investment Bank (EIB) The EIB was one of the pioneers of green bonds. In 2007, the green bond market kicked off with issuance from European Investment Bank (EIB) and World Bank. The following November there was a turning point when the first corporate green bonds
were issued738. Since then EIB has issued a total of €16.2bn in green bonds across 11 currencies - making EIB the world’s largest issuer of green bonds in January 2017739.
EIB was also responsible for the green bond market’s first comprehensive impact report in March 2015740.
728 Climate Bonds Initiative (2017) Bonds and Climate Change: The State of the Market
729 http://www.ebrd.com/cs/Satellite?c=Content&cid=1395257074183&d=Mobile&pagename=EBRD%2FContent%2FContentLayout
730 http://www.oecd.org/publications/environmental-lending-in-eu-eastern-partnership-countries-9789264252189-en.htm
741 See http://www.eib.org/infocentre/press/releases/all/2017/2017-315-eib-and-cdb-commit-usd-24-million-to-post-disaster-reconstruction-in-the-caribbean
742 See http://www.eib.org/infocentre/press/releases/all/2017/2017-129-usd-110-million-of-new-support-for-climate-change-mitigation-adaptation-and-resilience-projects-across-the-caribbean-as-eib-and-cdb-sign-new-financing-agreement
Box 11: Climate Action Framework Loan II to Caribbean Development Bank (CDB)
In 2017, EIB provided a loan to the Caribbean of $120m, with the aim of financing projects to support CDB to mainstream climate action with the aim to provide the necessary low-cost funding to Caribbean countries to address climate change – adaptation, mitigating and resilience projects. Additionally, EIB provided extra funds to CDB ($24m) to help countries after the hurricane events of 2017. The investments eligible for the second tranche of the funding are those projects that integrate climate risk and vulnerability assessment in their design. This is with the view of helping countries to build back better741. Outcome: From the first Climate Action Line of Credit, approximately $65.6 m in 2011, nine projects in seven different countries were financed742. This is expected to support CDB in
1 1 3 B A N K I N G O N R E F O R M
One example of a credit-enhancement mechanism used by the EIB is the Global Energy Efficiency and Renewable Energy Fund (GEEREF) which includes a first-loss provision by donors to cushion risk absorption for senior lenders and private investors743. EIB recently launched a platform to support green growth in the MENA region, leveraging private funds744. EIB has also been undertaking work in partnership
with China on green bonds, including on the development of a common language and terminology on green finance745 746. This work could be transformational with its potential to enhance investor confidence in green finance, increase transparency, and raise standards through the sharing of best practices. In addition, EIB chairs the Green
Bond Principles Executive Committee. While we ranked EIB as transformational on green bonds, there is comparatively less information about whether EIB is working
with Central Banks, Finance Ministries, sub-national or national financial institutions on green finance or green fiscal reform. However, this score could change in future.
Inter-American Development Bank (IADB) The IADB has been involved in pioneering activities to establish a regional green bond market in Latin America and the Caribbean. In 2015, in the first round of allocations from the Green Climate Fund, the IADB established a regional Energy Efficiency Green
Bond Facility with a loan of $400m747. The Regional Green Bond Facility was set up
733 http://www.ebrd.com/news/events/creating-green-banking-markets-in-africa.html
734 http://www.ebrd.com/news/2017/ebrd-and-aifc-launch-study-for-green-financial-system-in-kazakhstan.html
735 http://turkishcarbonmarket.com/library
736 https://ebrdgeff.com/about-seff/
737 UNEPFI (x) Sustainable Banking – presentation by Anna Maria Cronin, EBRD
738 https://www.climatebonds.net/market/history
739 http://www.eib.org/infocentre/press/releases/all/2017/2017-069-european-investment-bank-confirms-new-support-for-climate-investment-across-eight-chinese-provinces-and-joint-green-finance-engagement-with-chinese-investors.htm
740 See: EIB (2016) Green Bond Market Development and EIB
741 See http://www.eib.org/infocentre/press/releases/all/2017/2017-315-eib-and-cdb-commit-usd-24-million-to-post-disaster-reconstruction-in-the-caribbean
742 See http://www.eib.org/infocentre/press/releases/all/2017/2017-129-usd-110-million-of-new-support-for-climate-change-mitigation-adaptation-and-resilience-projects-across-the-caribbean-as-eib-and-cdb-sign-new-financing-agreement
743 IISD (2015) Credit enhancement for green projects
744 http://www.eib.org/infocentre/press/releases/all/2017/2017-322-first-ever-investment-from-luxembourg-eib-climate-finance-platform-to-support-green-for-growth-fund-in-the-mena-region
745 EIB (2017) The need for a common language in Green Finance
746 http://www.eib.org/infocentre/press/releases/all/2017/2017-073-new-peoples-bank-of-china-and-eib-initiative-to-strengthen-green-finance.htm 747 https://www.iadb.org/en/news/news-releases/2015-11-24/latin-america-boosts-energy-efficiency%2C11334.html
mainstreaming climate action when supporting its borrowing member countries, as most of them are highly vulnerable and need to improve their climate resilience. Furthermore, the EIB technical programme has supported the development of a pipeline of climate action projects which may be eligible for funding. Transformational aspect: This is the second operation building on the results from the first Climate Action Credit Line from 2011. In 2012 the CDB Climate Resilience Strategy was approved and EIB has been working closely with the CDB to support it to mainstream climate action across its borrowing member countries. The credit line was complemented with technical assistance which was key to ensuring that projects were considering context-specific climate risks in feasibility studies. This was a way of ensuring that the principle of ‘building back better’ was integrated.
1 1 4 B A N K I N G O N R E F O R M
aiming for creation of a green bond market in the region to enhance private sector initiatives on climate change748, addressing demand-side efficiency and mobilizing institutional funds at scale toward small- and medium-sized energy service companies749. In 2017, IADB supported Colombia with technical cooperation to issue the country’s first green bond of 200 billion pesos750, to fund projects that mitigate
climate impacts as well as improve environmental performance of Colombian companies. Data from the IADB website shows that out of financial market sector lending through sovereign guarantees of $6.17bn over the past five years, around $400m was
dedicated to financing for environmental sustainability751. The Financial Markets Division of IADB has a “beyondBanking: banking on global sustainability” strategy
which promotes sustainable social, environmental and corporate governance practices by financial intermediaries (FIs) in LAC through six strategic pillars, one of which is ‘planet banking’752. IADB has also provided thought leadership on the role of National Development Banks (NDBs) in green investment753. For example, the Latin American and Caribbean Green Financing (LGF) Platform is a platform supported by
IDB that has been developed to respond to demand from National Development
Banks (NDBs) for information and knowledge on green finance754. Other notable initiatives include the Financial Innovation Lab which has created investment vehicles and financial structures that maximize private sector leverage755.
World Bank Group (WBG) Along with EIB, green bonds were pioneered by the World Bank almost a decade ago756. The World Bank launched the first labelled ‘green bond’ in 2008, in order to
respond to specific demand from Scandinavian pension funds seeking to support climate-focused projects, as well as to promote financial innovation757. The market is
now worth around $100bn according to the Climate Bonds Initiative758. The World Bank’s issuances are over $10bn759. The World Bank was the third largest issuer as of 2017, with the World Bank having issued over $10bn and the IFC over $5bn760. In 2013
748 https://www.iadb.org/en/project/rg-x1250
749 http://www.energyefficiencycentre.org/nyheder/2016/09/gcf-and-the-idb-jointly-fund-ee-green-bonds-in-latin-america-and-the-caribbean?id=0e96325b-848f-4e18-804e-4ec59d6d1b82
750 https://www.iadb.org/en/news/news-releases/2017-08-09/green-bonds-in-colombia%2C11865.html
751 https://www.iadb.org/en/sector/financial-markets/overview%2C18340.html
752 https://www.iadb.org/en/resources-for-businesses/beyondbanking/beyondbanking-banking-on-global-sustainability%2C1961.html
753 IADB (2017) Supporting National Development Banks to Drive Investment in the Nationally Determined Contributions of Brazil, Mexico and Chile.
754 https://www.greenfinancelac.org/about-us/
755 https://www.iadb.org/en/fil
756 https://uk.reuters.com/article/uk-markets-greenbonds-ebrd/dont-strangle-green-bond-market-ebrd-urges-regulators-idUKKCN0ZL2CQ
757 http://treasury.worldbank.org/cmd/htm/greenprimer_greens_01.html
758 https://www.climatebonds.net/2017/11/breaking-2017-green-bond-record-100bn-global-issuance-reached-during-cop23
759 http://treasury.worldbank.org/cmd/htm/GreenBondIssuancesToDate.html
760
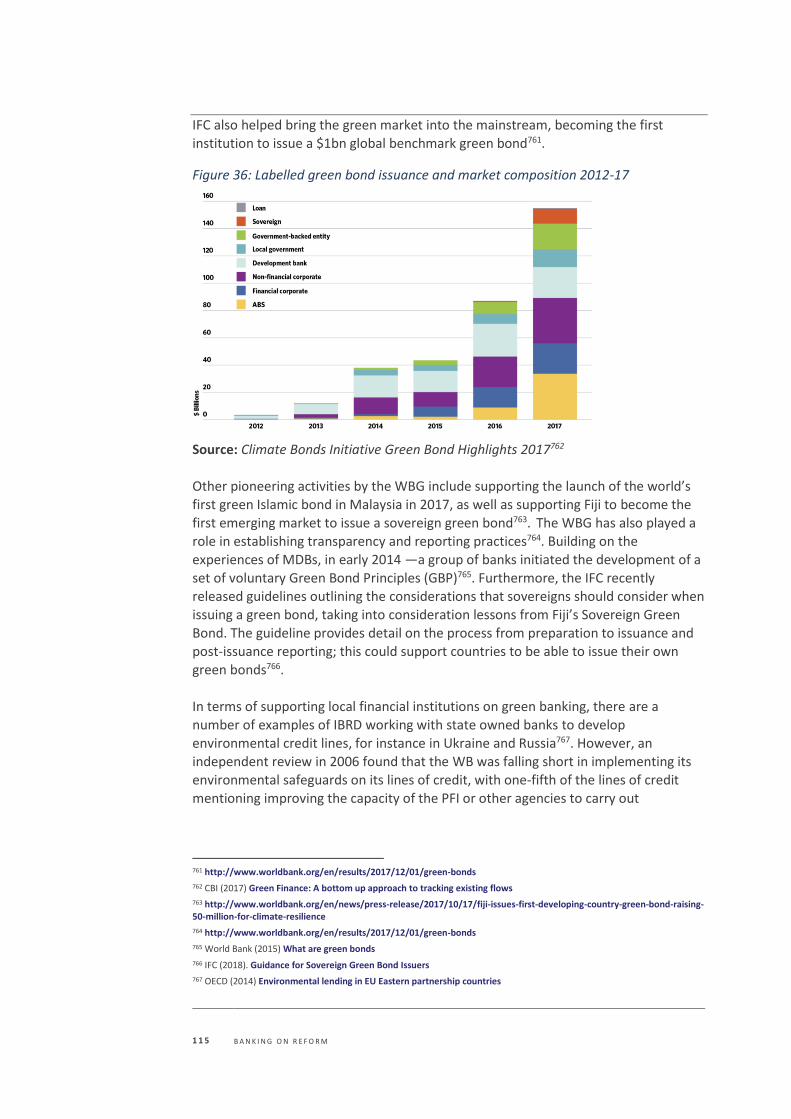
1 1 5 B A N K I N G O N R E F O R M
IFC also helped bring the green market into the mainstream, becoming the first institution to issue a $1bn global benchmark green bond761.
Figure 36: Labelled green bond issuance and market composition 2012-17
Source: Climate Bonds Initiative Green Bond Highlights 2017762 Other pioneering activities by the WBG include supporting the launch of the world’s
first green Islamic bond in Malaysia in 2017, as well as supporting Fiji to become the
first emerging market to issue a sovereign green bond763. The WBG has also played a role in establishing transparency and reporting practices764. Building on the experiences of MDBs, in early 2014 —a group of banks initiated the development of a
set of voluntary Green Bond Principles (GBP)765. Furthermore, the IFC recently released guidelines outlining the considerations that sovereigns should consider when
issuing a green bond, taking into consideration lessons from Fiji’s Sovereign Green Bond. The guideline provides detail on the process from preparation to issuance and post-issuance reporting; this could support countries to be able to issue their own
green bonds766.
In terms of supporting local financial institutions on green banking, there are a
number of examples of IBRD working with state owned banks to develop environmental credit lines, for instance in Ukraine and Russia767. However, an independent review in 2006 found that the WB was falling short in implementing its
environmental safeguards on its lines of credit, with one-fifth of the lines of credit mentioning improving the capacity of the PFI or other agencies to carry out
761 http://www.worldbank.org/en/results/2017/12/01/green-bonds
762 CBI (2017) Green Finance: A bottom up approach to tracking existing flows
763 http://www.worldbank.org/en/news/press-release/2017/10/17/fiji-issues-first-developing-country-green-bond-raising-50-million-for-climate-resilience
764 http://www.worldbank.org/en/results/2017/12/01/green-bonds
765 World Bank (2015) What are green bonds
766 IFC (2018). Guidance for Sovereign Green Bond Issuers
767 OECD (2014) Environmental lending in EU Eastern partnership countries
1 1 6 B A N K I N G O N R E F O R M
environmental screening768. An update on this issue is recommended. In terms of the IFC’s work with financial institutions, it is also unclear how the IFC promotes good practice, although there are signs the IFC is reducing exposure to higher risk activity769, more information is needed about the IFC’s approach to encouraging sustainable practices. More information is needed on how IFC is promoting
sustainability and green finance among FIs. In terms of green banking support for regulators and finance ministries, the IFC hosts the Sustainable Banking Network, a body open to all banking or financial regulatory bodies with an interest in environmental management and green lending770. Through the Climate Action Peer Exchange for Finance Ministries (CAPE) initiative, the World Bank has also
strengthened learning on fiscal policies related to climate including carbon pricing, carbon taxes, and feed-in tariffs771.
768 WBG (2006) World Bank Lending for Lines of Credit, Independent Evaluation Group, 2006. An update of this evaluation would be helpful but could not be identified.
769 See: https://www.devex.com/news/opinion-here-s-how-the-ifc-is-working-with-financial-institutions-91223
770 IFC (2018) Sustainable Banking Network Members
771 http://www.worldbank.org/en/topic/climatechange/brief/cape
772 IFC (2017). IFC, Amundi to Create World’s Largest Green-Bond Fund Dedicated to Emerging Markets
773 Ibid
774 See https://www.fnlondon.com/articles/amundi-and-ifc-close-largest-green-bond-fund-at-1-4bn-20180316
Box 12: IFC - Largest Green Bond Fund dedicated to Emerging Markets
The IFC has partnered with Amundi, Europe’s largest listed asset manager, to create the fund. The objective is to buy green bonds issued by banks in developing countries to deepen local capital markets and expand financing for climate investments by attracting private investment772. Initially it will focus on countries where there is high interest. This fund is complemented with a donor-funded investment support facility led by IFC, working with local financial institutions to strengthen their capacity to issue green bonds, providing training and sharing international best practices. Expected outcome: IFC will invest up to $325m in the new Green Cornerstone Bond Fund, which will buy green bonds issued by banks in Africa, Asia, the Middle East, Latin America, Eastern Europe, and Central Asia. Amundi will raise the rest of the $2bn from institutional investors and provide services in managing emerging-market debt. The fund aims to be fully invested in green bonds within seven years773. Transformational aspect: Amundi and IFC are finding new ways of deepening and greening capital markets in emerging economies by unlocking green finance. The fund is split into three different tranches: junior, mezzanine (mixture of public and private money) and senior (private investors). Overall, the mix is about 80% private money, 20% public774. The fund could also help to develop capital markets in countries by providing technical assistance to those local financial institutions interested in issuing green bonds, strengthening their capacity, and familiarising investors with these instruments.
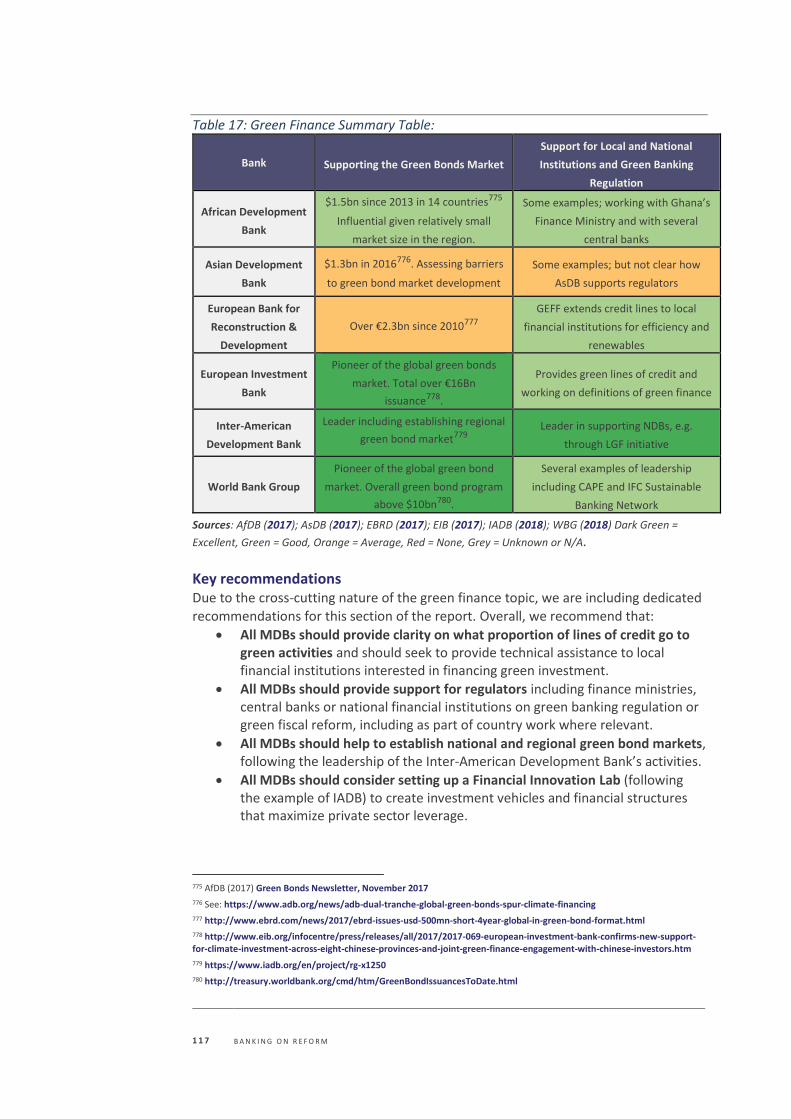
1 1 7 B A N K I N G O N R E F O R M
Table 17: Green Finance Summary Table:
Bank Supporting the Green Bonds Market
Support for Local and National
Institutions and Green Banking
Regulation
African Development
Bank
$1.5bn since 2013 in 14 countries775
Influential given relatively small
market size in the region.
Some examples; working with Ghana’s
Finance Ministry and with several
central banks
Asian Development
Bank
$1.3bn in 2016776. Assessing barriers
to green bond market development
Some examples; but not clear how
AsDB supports regulators
European Bank for
Reconstruction &
Development
Over €2.3bn since 2010777
GEFF extends credit lines to local
financial institutions for efficiency and
renewables
European Investment
Bank
Pioneer of the global green bonds
market. Total over €16Bn
issuance778.
Provides green lines of credit and
working on definitions of green finance
Inter-American
Development Bank
Leader including establishing regional
green bond market779 Leader in supporting NDBs, e.g.
through LGF initiative
World Bank Group
Pioneer of the global green bond
market. Overall green bond program
above $10bn780.
Several examples of leadership
including CAPE and IFC Sustainable
Banking Network
Sources: AfDB (2017); AsDB (2017); EBRD (2017); EIB (2017); IADB (2018); WBG (2018) Dark Green =
Excellent, Green = Good, Orange = Average, Red = None, Grey = Unknown or N/A.
Key recommendations Due to the cross-cutting nature of the green finance topic, we are including dedicated recommendations for this section of the report. Overall, we recommend that:
• All MDBs should provide clarity on what proportion of lines of credit go to green activities and should seek to provide technical assistance to local financial institutions interested in financing green investment.
• All MDBs should provide support for regulators including finance ministries, central banks or national financial institutions on green banking regulation or green fiscal reform, including as part of country work where relevant.
• All MDBs should help to establish national and regional green bond markets, following the leadership of the Inter-American Development Bank’s activities.
• All MDBs should consider setting up a Financial Innovation Lab (following the example of IADB) to create investment vehicles and financial structures that maximize private sector leverage.
775 AfDB (2017) Green Bonds Newsletter, November 2017
776 See: https://www.adb.org/news/adb-dual-tranche-global-green-bonds-spur-climate-financing
777 http://www.ebrd.com/news/2017/ebrd-issues-usd-500mn-short-4year-global-in-green-bond-format.html
778 http://www.eib.org/infocentre/press/releases/all/2017/2017-069-european-investment-bank-confirms-new-support-for-climate-investment-across-eight-chinese-provinces-and-joint-green-finance-engagement-with-chinese-investors.htm
779 https://www.iadb.org/en/project/rg-x1250
780 http://treasury.worldbank.org/cmd/htm/GreenBondIssuancesToDate.html
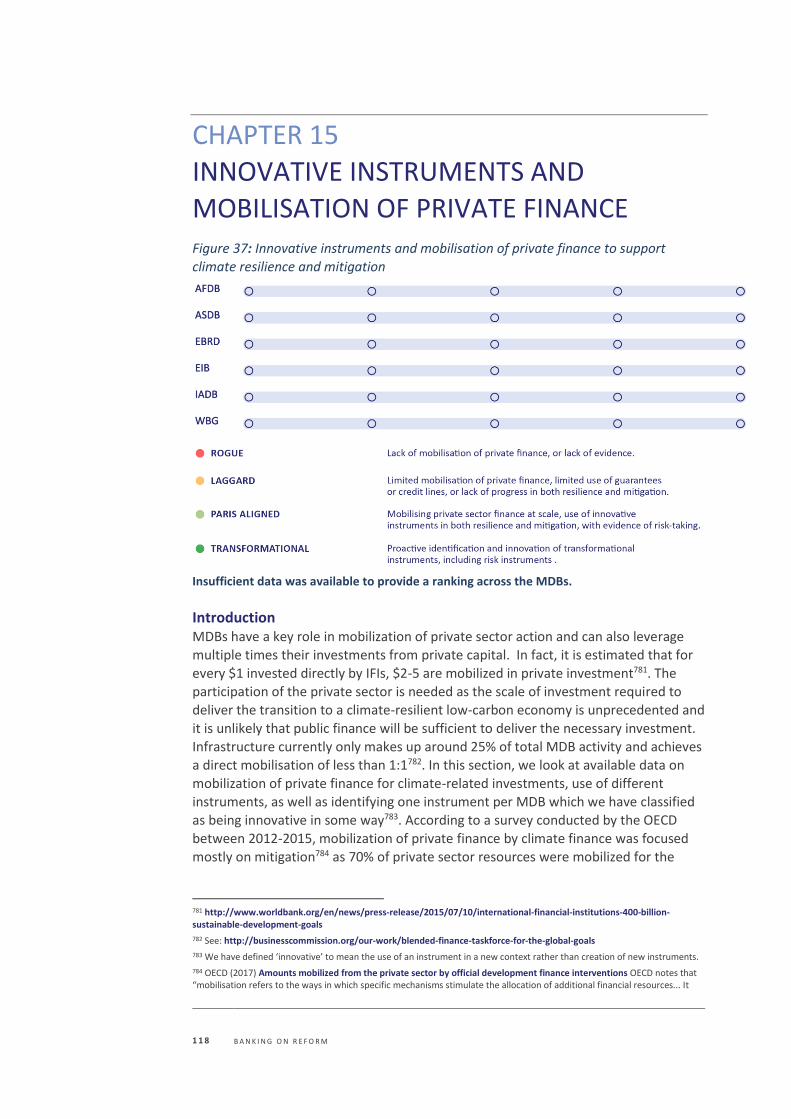
1 1 8 B A N K I N G O N R E F O R M
CHAPTER 15
INNOVATIVE INSTRUMENTS AND
MOBILISATION OF PRIVATE FINANCE Figure 37: Innovative instruments and mobilisation of private finance to support climate resilience and mitigation
Insufficient data was available to provide a ranking across the MDBs.
Introduction MDBs have a key role in mobilization of private sector action and can also leverage multiple times their investments from private capital. In fact, it is estimated that for every $1 invested directly by IFIs, $2-5 are mobilized in private investment781. The
participation of the private sector is needed as the scale of investment required to deliver the transition to a climate-resilient low-carbon economy is unprecedented and
it is unlikely that public finance will be sufficient to deliver the necessary investment. Infrastructure currently only makes up around 25% of total MDB activity and achieves a direct mobilisation of less than 1:1782. In this section, we look at available data on
mobilization of private finance for climate-related investments, use of different instruments, as well as identifying one instrument per MDB which we have classified
as being innovative in some way783. According to a survey conducted by the OECD between 2012-2015, mobilization of private finance by climate finance was focused mostly on mitigation784 as 70% of private sector resources were mobilized for the
781 http://www.worldbank.org/en/news/press-release/2015/07/10/international-financial-institutions-400-billion-sustainable-development-goals
782 See: http://businesscommission.org/our-work/blended-finance-taskforce-for-the-global-goals
783 We have defined ‘innovative’ to mean the use of an instrument in a new context rather than creation of new instruments.
784 OECD (2017) Amounts mobilized from the private sector by official development finance interventions OECD notes that “mobilisation refers to the ways in which specific mechanisms stimulate the allocation of additional financial resources... It
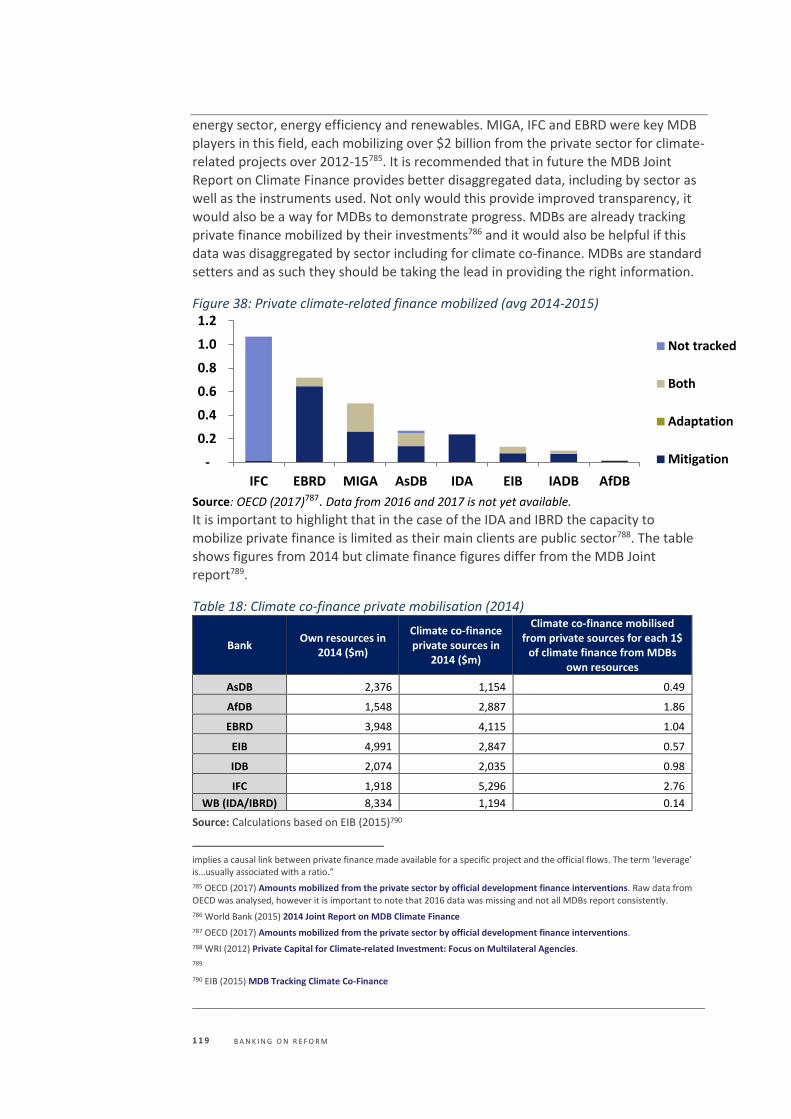
1 1 9 B A N K I N G O N R E F O R M
energy sector, energy efficiency and renewables. MIGA, IFC and EBRD were key MDB players in this field, each mobilizing over $2 billion from the private sector for climate-related projects over 2012-15785. It is recommended that in future the MDB Joint Report on Climate Finance provides better disaggregated data, including by sector as well as the instruments used. Not only would this provide improved transparency, it
would also be a way for MDBs to demonstrate progress. MDBs are already tracking private finance mobilized by their investments786 and it would also be helpful if this data was disaggregated by sector including for climate co-finance. MDBs are standard setters and as such they should be taking the lead in providing the right information.
Figure 38: Private climate-related finance mobilized (avg 2014-2015)
Source: OECD (2017)787. Data from 2016 and 2017 is not yet available.
It is important to highlight that in the case of the IDA and IBRD the capacity to
mobilize private finance is limited as their main clients are public sector788. The table shows figures from 2014 but climate finance figures differ from the MDB Joint
report789.
Table 18: Climate co-finance private mobilisation (2014)
Bank Own resources in
2014 ($m)
Climate co-finance private sources in
2014 ($m)
Climate co-finance mobilised from private sources for each 1$
of climate finance from MDBs own resources
AsDB 2,376 1,154 0.49
AfDB 1,548 2,887 1.86
EBRD 3,948 4,115 1.04
EIB 4,991 2,847 0.57
IDB 2,074 2,035 0.98
IFC 1,918 5,296 2.76
WB (IDA/IBRD) 8,334 1,194 0.14
Source: Calculations based on EIB (2015)790
implies a causal link between private finance made available for a specific project and the official flows. The term ‘leverage’ is…usually associated with a ratio.”
785 OECD (2017) Amounts mobilized from the private sector by official development finance interventions. Raw data from OECD was analysed, however it is important to note that 2016 data was missing and not all MDBs report consistently.
786 World Bank (2015) 2014 Joint Report on MDB Climate Finance
787 OECD (2017) Amounts mobilized from the private sector by official development finance interventions.
788 WRI (2012) Private Capital for Climate-related Investment: Focus on Multilateral Agencies.
789
790 EIB (2015) MDB Tracking Climate Co-Finance
-
0.2
0.4
0.6
0.8
1.0
1.2
IFC EBRD MIGA AsDB IDA EIB IADB AfDB
Not tracked
Both
Adaptation
Mitigation
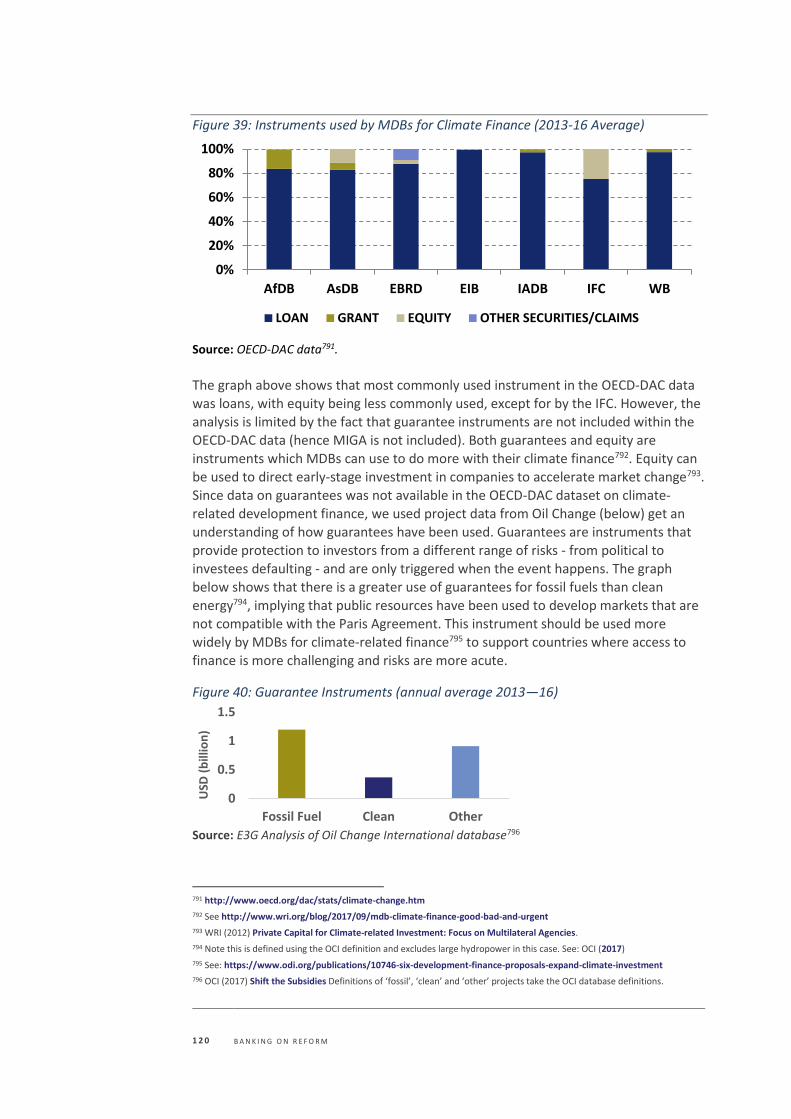
1 2 0 B A N K I N G O N R E F O R M
Figure 39: Instruments used by MDBs for Climate Finance (2013-16 Average)
Source: OECD-DAC data791.
The graph above shows that most commonly used instrument in the OECD-DAC data was loans, with equity being less commonly used, except for by the IFC. However, the analysis is limited by the fact that guarantee instruments are not included within the OECD-DAC data (hence MIGA is not included). Both guarantees and equity are
instruments which MDBs can use to do more with their climate finance792. Equity can be used to direct early-stage investment in companies to accelerate market change793.
Since data on guarantees was not available in the OECD-DAC dataset on climate-
related development finance, we used project data from Oil Change (below) get an
understanding of how guarantees have been used. Guarantees are instruments that provide protection to investors from a different range of risks - from political to
investees defaulting - and are only triggered when the event happens. The graph below shows that there is a greater use of guarantees for fossil fuels than clean energy794, implying that public resources have been used to develop markets that are
not compatible with the Paris Agreement. This instrument should be used more widely by MDBs for climate-related finance795 to support countries where access to
finance is more challenging and risks are more acute.
Figure 40: Guarantee Instruments (annual average 2013—16)
Source: E3G Analysis of Oil Change International database796
791 http://www.oecd.org/dac/stats/climate-change.htm
792 See http://www.wri.org/blog/2017/09/mdb-climate-finance-good-bad-and-urgent
793 WRI (2012) Private Capital for Climate-related Investment: Focus on Multilateral Agencies.
794 Note this is defined using the OCI definition and excludes large hydropower in this case. See: OCI (2017)
795 See: https://www.odi.org/publications/10746-six-development-finance-proposals-expand-climate-investment
796 OCI (2017) Shift the Subsidies Definitions of ‘fossil’, ‘clean’ and ‘other’ projects take the OCI database definitions.
0%
20%
40%
60%
80%
100%
AfDB AsDB EBRD EIB IADB IFC WB
LOAN GRANT EQUITY OTHER SECURITIES/CLAIMS
0
0.5
1
1.5
Fossil Fuel Clean Other
USD
(b
illio
n)
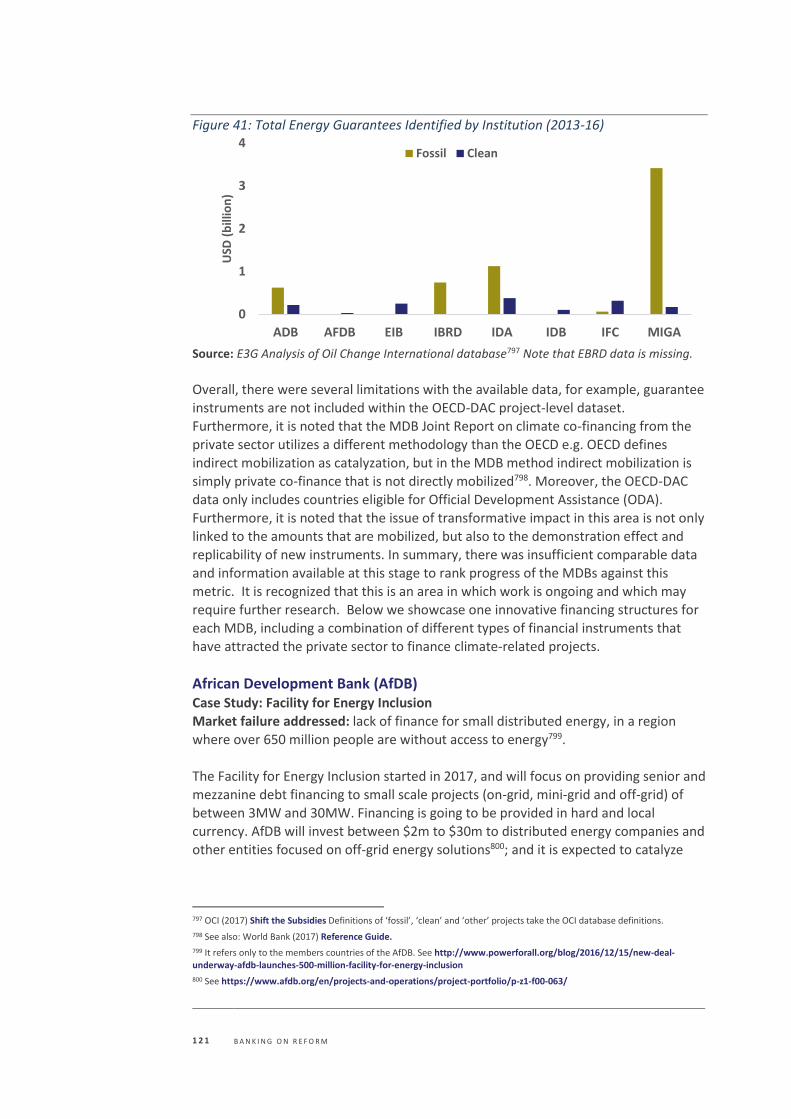
1 2 1 B A N K I N G O N R E F O R M
Figure 41: Total Energy Guarantees Identified by Institution (2013-16)
Source: E3G Analysis of Oil Change International database797 Note that EBRD data is missing.
Overall, there were several limitations with the available data, for example, guarantee instruments are not included within the OECD-DAC project-level dataset. Furthermore, it is noted that the MDB Joint Report on climate co-financing from the
private sector utilizes a different methodology than the OECD e.g. OECD defines indirect mobilization as catalyzation, but in the MDB method indirect mobilization is
simply private co-finance that is not directly mobilized798. Moreover, the OECD-DAC data only includes countries eligible for Official Development Assistance (ODA).
Furthermore, it is noted that the issue of transformative impact in this area is not only linked to the amounts that are mobilized, but also to the demonstration effect and replicability of new instruments. In summary, there was insufficient comparable data
and information available at this stage to rank progress of the MDBs against this metric. It is recognized that this is an area in which work is ongoing and which may
require further research. Below we showcase one innovative financing structures for each MDB, including a combination of different types of financial instruments that have attracted the private sector to finance climate-related projects.
African Development Bank (AfDB) Case Study: Facility for Energy Inclusion
Market failure addressed: lack of finance for small distributed energy, in a region
where over 650 million people are without access to energy799.
The Facility for Energy Inclusion started in 2017, and will focus on providing senior and mezzanine debt financing to small scale projects (on-grid, mini-grid and off-grid) of between 3MW and 30MW. Financing is going to be provided in hard and local
currency. AfDB will invest between $2m to $30m to distributed energy companies and other entities focused on off-grid energy solutions800; and it is expected to catalyze
797 OCI (2017) Shift the Subsidies Definitions of ‘fossil’, ‘clean’ and ‘other’ projects take the OCI database definitions.
798 See also: World Bank (2017) Reference Guide.
799 It refers only to the members countries of the AfDB. See http://www.powerforall.org/blog/2016/12/15/new-deal-underway-afdb-launches-500-million-facility-for-energy-inclusion
800 See https://www.afdb.org/en/projects-and-operations/project-portfolio/p-z1-f00-063/
0
1
2
3
4
ADB AFDB EIB IBRD IDA IDB IFC MIGA
USD
(b
illio
n)
Fossil Clean
1 2 2 B A N K I N G O N R E F O R M
energy access for approximately 3 million people801. The Facility will seek to alleviate the high transaction costs faced by small scale projects and increase the flow of capital to the energy sector. Providing financing in local currency helps SMEs to overcome currency risks and technical barriers to borrowing in hard currency. The fund would also streamline project approvals and shorten the gap between project
conception and completion, which can take from one to three years802. The focus is on removing the barriers to access capital for small to medium companies.
Asian Development Bank (AsDB) Case Study: Partial Credit Guarantee for Geothermal in the Philippines
Market failure addressed: tapping new capital sources – institutional investors803.
In the Philippines, the AsDB provided a partial credit guarantee to support a project bond issuance by AP Renewable Inc (APRI) to refinance capital expenditure on two major geothermal projects (the fourth and seventh largest in the world)804. Together with the Credit Guarantee and Investment Facility (CGIF), the AsDB wrote a partial
credit guarantee and a local currency loan to underpin the project bond. The participation of the AsDB and CGIF allowed the successful placement of the first
Climate Bond in the Asia Pacific region. It is also notable as being the first credit-enhanced bond in the Philippines power sector, and one of the first in South-East Asia
more generally. As such, it introduced a new type of climate finance in the Asia-Pacific
region where previously long-term infrastructure projects have relied on funding from
traditional sources such as banks805.
European Bank for Reconstruction and Development (EBRD) Case Study: Egypt Energy Renewable Financing Framework
Market failure to be addressed: access to finance for project sponsors, perception of first mover risk for project sponsors, infrastructure constraints and limited institutional capacity for administering renewable energy tenders806.
Egypt has significant renewable potential; wind conditions in the Suez Gulf are as favourable as the North Sea and it receives some of the highest solar radiation in the
world807. Furthermore, the policy framework is already in place to attract the necessary investment. However, at present the majority of its renewable energy is
sourced through large-scale hydro, but there is limited potential to expand this, and water scarcity is an issue because of climate change808. The government is proposing to significantly increase renewable output, but at present results have been
insufficient and the only ones which have been successful are directly government-
801 See https://www.afdb.org/en/news-and-events/afdb-approves-usd-50-million-equity-investment-and-usd-50-million-convertible-loan-to-seed-the-establishment-of-the-multi-investor-usd-500-million-facility-for-energy-inclusion-fei-16561/
802 Power For All (2016) Decentralized Renewables: The Fast Track to Universal Energy Access
803 According to the NCE report 2016, there is still scope for attracting institutional investors into infrastructure projects.
804 See https://www.adb.org/projects/48423-001/main
805 See http://www.ifrasia.com/tiwi-makban-heating-up-project-bonds/21243678.fullarticle
806 See https://www.greenclimate.fund/-/gcf-ebrd-egypt-renewable-energy-financing-framework
807 See https://www.export.gov/article?id=Egypt-Renewable-Energy
808 See https://www.greenclimate.fund/-/gcf-ebrd-egypt-renewable-energy-financing-framework
1 2 3 B A N K I N G O N R E F O R M
backed. This framework aims to unlock two other categories of projects – Feed-in-Tariff scheme projects and competitive tenders. A key challenge in sourcing financing for projects is that Egyptian commercial banks cannot provide loans in hard currency when the revenues from the project (the feed-in tariffs) will be in Egyptian Pounds809. This meant that projects relying on the feed-in tariffs were unable to proceed, whilst
competitive tenders to supply electricity directly to the grid have also been unable to progress as they rely on a pricing mechanism to be determined by the feed-in tariff market. The EBRD and Green Climate Fund (GCF) project aims to address this by providing up
to $500m as debt financing for projects, to provide up to 50% of total project costs based on a minimum equity contribution by the project sponsor of 25%, with the
remaining debt sourced from a commercial financial institution – aiming to provide access to a reliable and predictable source of long-term finance to help de-risk projects for first movers. This financing, coupled with technical assistance, has the potential to play a key role in unlocking Egypt’s renewable energy resources. The expected impact is to build on the existing regulatory framework to double the
current renewable energy capacity, which is a part of the Egypt’s’ NDC810.
European Investment Bank (EIB) Case Study: Global Energy Efficiency and Renewable Energy (GEEREF) 811
Market failure addressed: reduce investment risks for private capital
The “funds of funds” of the GEEREF is advised by the EIB. GEEREF is focused on supporting investment into renewable and energy efficiency projects in developing
countries by providing equity to specialist private equity funds, who in turn are able to mobilise additional commercial capital812. GEEREF was established in 2006 as a
public-private partnership and has €222m under management, of which €122m was provided by governments with €110m raised from private investors. This blended capital approach, allowing the sub-funds to raise further private capital, is a way of maximising the leverage of the initial public funds provided.
The fund provides equity to specialist private equity funds for projects requiring up to
€10 million of equity. The GEEREF is aiming to leverage private capital for a mix of small and medium-sized projects such as renewables and energy efficiency projects. The fund of funds is composed of three tiers: a top tier that pools patient capital of public and private investors in a fund-of-funds; an intermediate tier of regional sub-funds which attract co-investors; and a bottom tier of investment projects financed by
equity finance and debt813. The funds of funds enhance the catalytic effect by attracting public investments into the first tier and enabling the commercial investors
809 See http://www.bondsloans.com/news/article/1781/sunny-outlook-for-egypts-renewables-as-dfis-m
810 See https://www.greenclimate.fund/-/gcf-ebrd-egypt-renewable-energy-financing-framework
811 EIB (2015) Climate Strategy
812 See: http://geeref.com/about/what-geeref-is.html
813 See: Monk and Provaggi (2013) Leveraging private investments for renewable energy infrastructure
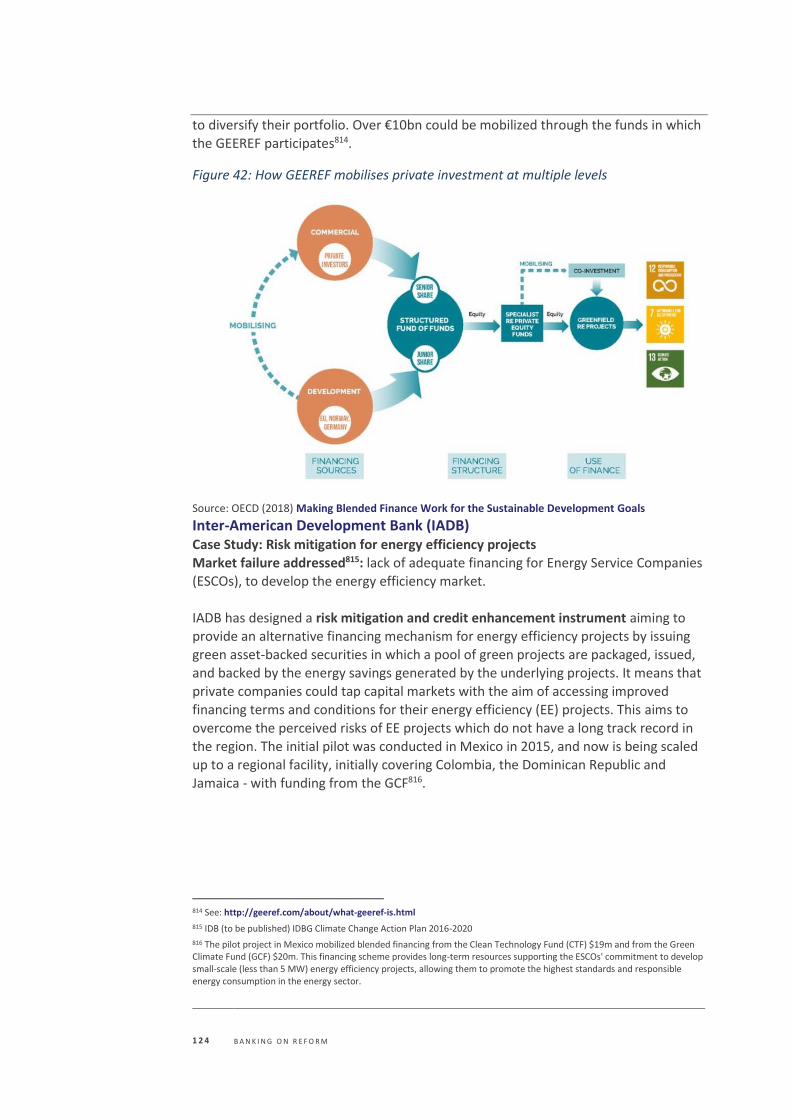
1 2 4 B A N K I N G O N R E F O R M
to diversify their portfolio. Over €10bn could be mobilized through the funds in which the GEEREF participates814.
Figure 42: How GEEREF mobilises private investment at multiple levels
Source: OECD (2018) Making Blended Finance Work for the Sustainable Development Goals
Inter-American Development Bank (IADB) Case Study: Risk mitigation for energy efficiency projects
Market failure addressed815: lack of adequate financing for Energy Service Companies (ESCOs), to develop the energy efficiency market.
IADB has designed a risk mitigation and credit enhancement instrument aiming to provide an alternative financing mechanism for energy efficiency projects by issuing
green asset-backed securities in which a pool of green projects are packaged, issued, and backed by the energy savings generated by the underlying projects. It means that
private companies could tap capital markets with the aim of accessing improved financing terms and conditions for their energy efficiency (EE) projects. This aims to
overcome the perceived risks of EE projects which do not have a long track record in the region. The initial pilot was conducted in Mexico in 2015, and now is being scaled up to a regional facility, initially covering Colombia, the Dominican Republic and Jamaica - with funding from the GCF816.
814 See: http://geeref.com/about/what-geeref-is.html
815 IDB (to be published) IDBG Climate Change Action Plan 2016-2020
816 The pilot project in Mexico mobilized blended financing from the Clean Technology Fund (CTF) $19m and from the Green Climate Fund (GCF) $20m. This financing scheme provides long-term resources supporting the ESCOs' commitment to develop small-scale (less than 5 MW) energy efficiency projects, allowing them to promote the highest standards and responsible energy consumption in the energy sector.
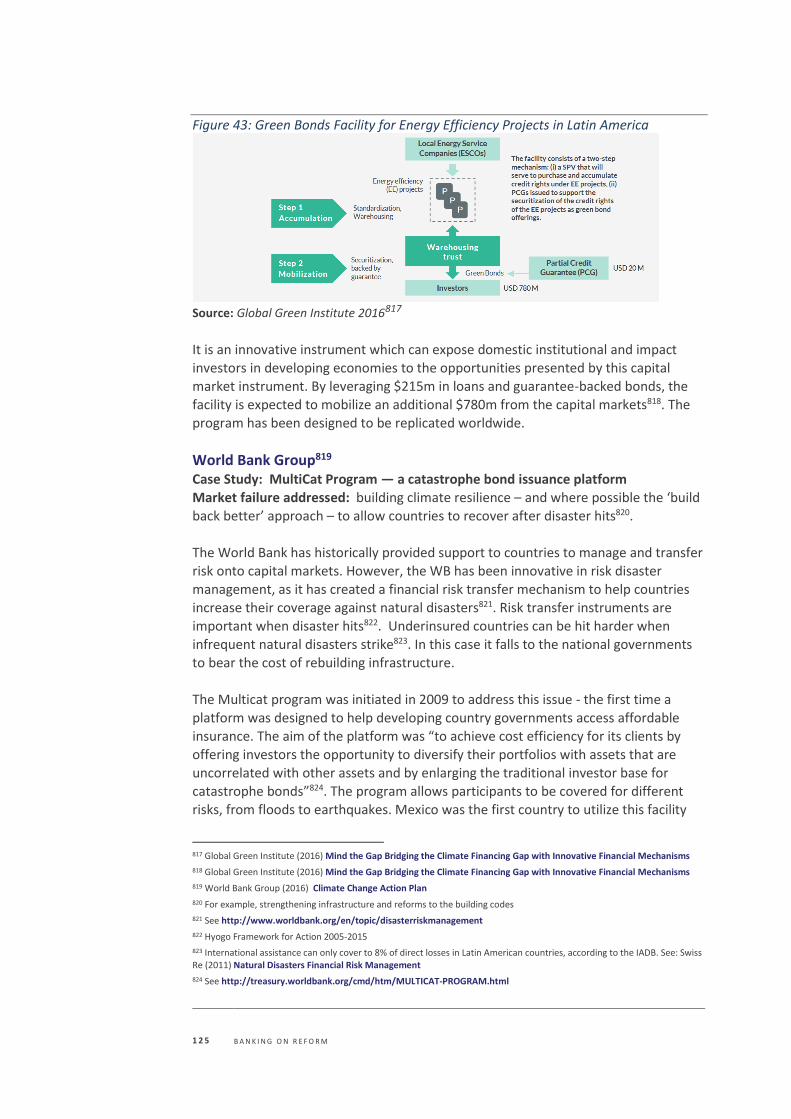
1 2 5 B A N K I N G O N R E F O R M
Figure 43: Green Bonds Facility for Energy Efficiency Projects in Latin America
Source: Global Green Institute 2016817 It is an innovative instrument which can expose domestic institutional and impact investors in developing economies to the opportunities presented by this capital market instrument. By leveraging $215m in loans and guarantee-backed bonds, the facility is expected to mobilize an additional $780m from the capital markets818. The
program has been designed to be replicated worldwide.
World Bank Group819 Case Study: MultiCat Program — a catastrophe bond issuance platform
Market failure addressed: building climate resilience – and where possible the ‘build
back better’ approach – to allow countries to recover after disaster hits820. The World Bank has historically provided support to countries to manage and transfer
risk onto capital markets. However, the WB has been innovative in risk disaster management, as it has created a financial risk transfer mechanism to help countries
increase their coverage against natural disasters821. Risk transfer instruments are important when disaster hits822. Underinsured countries can be hit harder when infrequent natural disasters strike823. In this case it falls to the national governments
to bear the cost of rebuilding infrastructure.
The Multicat program was initiated in 2009 to address this issue - the first time a
platform was designed to help developing country governments access affordable
insurance. The aim of the platform was “to achieve cost efficiency for its clients by offering investors the opportunity to diversify their portfolios with assets that are uncorrelated with other assets and by enlarging the traditional investor base for catastrophe bonds”824. The program allows participants to be covered for different risks, from floods to earthquakes. Mexico was the first country to utilize this facility
817 Global Green Institute (2016) Mind the Gap Bridging the Climate Financing Gap with Innovative Financial Mechanisms
818 Global Green Institute (2016) Mind the Gap Bridging the Climate Financing Gap with Innovative Financial Mechanisms
819 World Bank Group (2016) Climate Change Action Plan
820 For example, strengthening infrastructure and reforms to the building codes
821 See http://www.worldbank.org/en/topic/disasterriskmanagement
822 Hyogo Framework for Action 2005-2015
823 International assistance can only cover to 8% of direct losses in Latin American countries, according to the IADB. See: Swiss Re (2011) Natural Disasters Financial Risk Management
824 See http://treasury.worldbank.org/cmd/htm/MULTICAT-PROGRAM.html
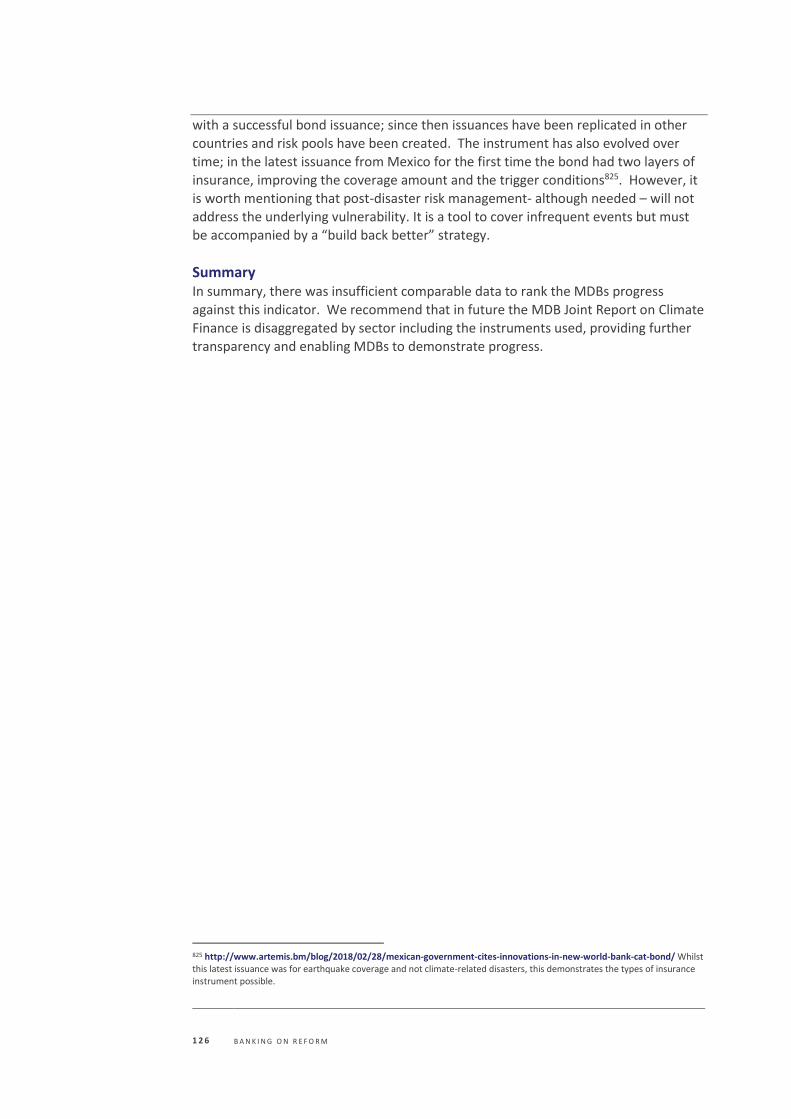
1 2 6 B A N K I N G O N R E F O R M
with a successful bond issuance; since then issuances have been replicated in other countries and risk pools have been created. The instrument has also evolved over time; in the latest issuance from Mexico for the first time the bond had two layers of insurance, improving the coverage amount and the trigger conditions825. However, it is worth mentioning that post-disaster risk management- although needed – will not
address the underlying vulnerability. It is a tool to cover infrequent events but must be accompanied by a “build back better” strategy.
Summary In summary, there was insufficient comparable data to rank the MDBs progress
against this indicator. We recommend that in future the MDB Joint Report on Climate Finance is disaggregated by sector including the instruments used, providing further transparency and enabling MDBs to demonstrate progress.
825 http://www.artemis.bm/blog/2018/02/28/mexican-government-cites-innovations-in-new-world-bank-cat-bond/ Whilst this latest issuance was for earthquake coverage and not climate-related disasters, this demonstrates the types of insurance instrument possible.
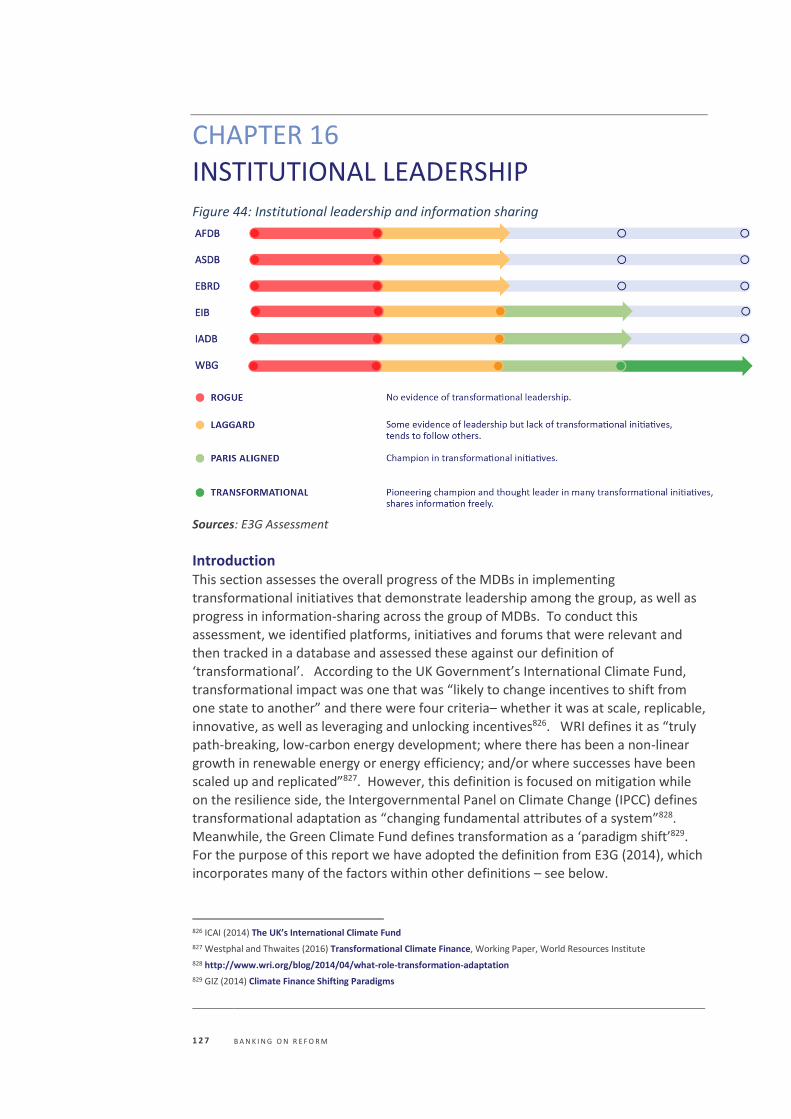
1 2 7 B A N K I N G O N R E F O R M
CHAPTER 16
INSTITUTIONAL LEADERSHIP Figure 44: Institutional leadership and information sharing
Sources: E3G Assessment
Introduction This section assesses the overall progress of the MDBs in implementing
transformational initiatives that demonstrate leadership among the group, as well as progress in information-sharing across the group of MDBs. To conduct this
assessment, we identified platforms, initiatives and forums that were relevant and then tracked in a database and assessed these against our definition of ‘transformational’. According to the UK Government’s International Climate Fund,
transformational impact was one that was “likely to change incentives to shift from one state to another” and there were four criteria– whether it was at scale, replicable,
innovative, as well as leveraging and unlocking incentives826. WRI defines it as “truly path-breaking, low-carbon energy development; where there has been a non-linear growth in renewable energy or energy efficiency; and/or where successes have been scaled up and replicated”827. However, this definition is focused on mitigation while
on the resilience side, the Intergovernmental Panel on Climate Change (IPCC) defines transformational adaptation as “changing fundamental attributes of a system”828. Meanwhile, the Green Climate Fund defines transformation as a ‘paradigm shift’829. For the purpose of this report we have adopted the definition from E3G (2014), which incorporates many of the factors within other definitions – see below.
826 ICAI (2014) The UK’s International Climate Fund
827 Westphal and Thwaites (2016) Transformational Climate Finance, Working Paper, World Resources Institute
828 http://www.wri.org/blog/2014/04/what-role-transformation-adaptation
829 GIZ (2014) Climate Finance Shifting Paradigms
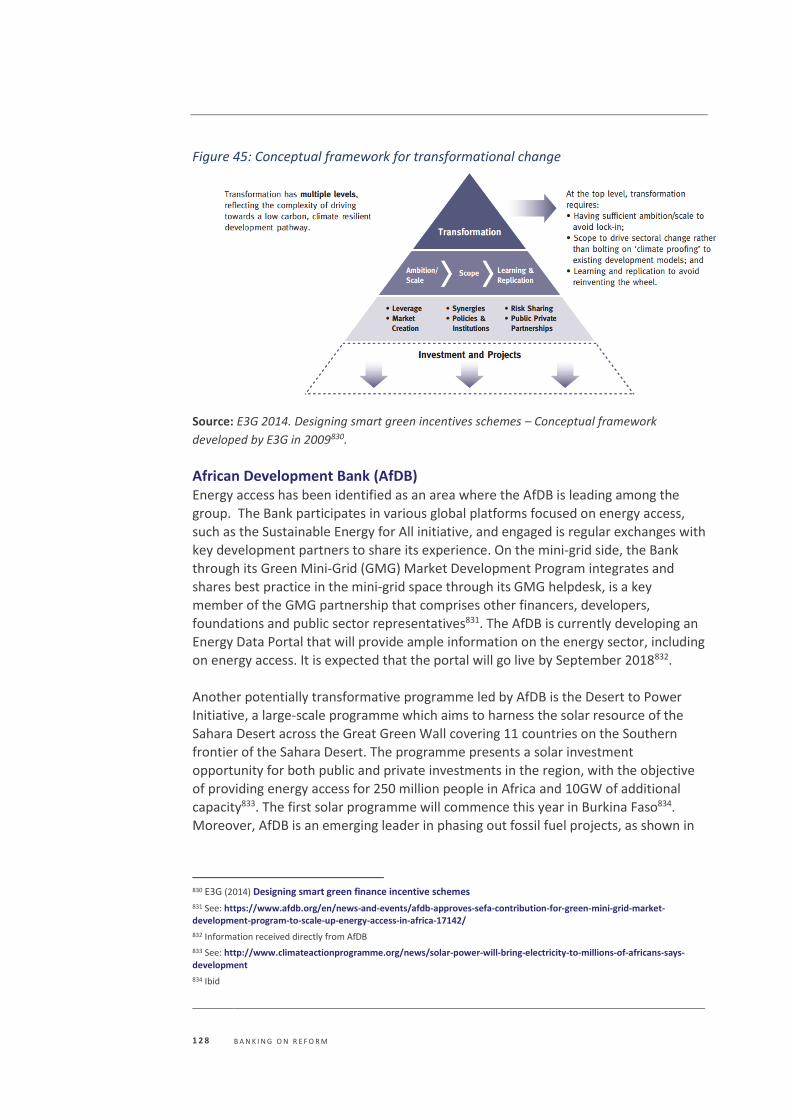
1 2 8 B A N K I N G O N R E F O R M
Figure 45: Conceptual framework for transformational change
Source: E3G 2014. Designing smart green incentives schemes – Conceptual framework
developed by E3G in 2009830.
African Development Bank (AfDB) Energy access has been identified as an area where the AfDB is leading among the
group. The Bank participates in various global platforms focused on energy access, such as the Sustainable Energy for All initiative, and engaged is regular exchanges with
key development partners to share its experience. On the mini-grid side, the Bank through its Green Mini-Grid (GMG) Market Development Program integrates and
shares best practice in the mini-grid space through its GMG helpdesk, is a key member of the GMG partnership that comprises other financers, developers, foundations and public sector representatives831. The AfDB is currently developing an
Energy Data Portal that will provide ample information on the energy sector, including on energy access. It is expected that the portal will go live by September 2018832.
Another potentially transformative programme led by AfDB is the Desert to Power
Initiative, a large-scale programme which aims to harness the solar resource of the Sahara Desert across the Great Green Wall covering 11 countries on the Southern
frontier of the Sahara Desert. The programme presents a solar investment opportunity for both public and private investments in the region, with the objective of providing energy access for 250 million people in Africa and 10GW of additional capacity833. The first solar programme will commence this year in Burkina Faso834. Moreover, AfDB is an emerging leader in phasing out fossil fuel projects, as shown in
830 E3G (2014) Designing smart green finance incentive schemes
831 See: https://www.afdb.org/en/news-and-events/afdb-approves-sefa-contribution-for-green-mini-grid-market-development-program-to-scale-up-energy-access-in-africa-17142/
832 Information received directly from AfDB
833 See: http://www.climateactionprogramme.org/news/solar-power-will-bring-electricity-to-millions-of-africans-says-development
834 Ibid
1 2 9 B A N K I N G O N R E F O R M
Section 12, though the data for 2017 is yet to be available within the Oil Change International database.
Asian Development Bank (AsDB) The Climate Change Operational Framework 2017–2030 approved by AsDB seems to have some ambitious elements including a commitment to reduce portfolio emissions, however we have not ranked this as ‘transformational’ since the plan has
not been fully implemented yet. However, the plan is pioneering since this appears to be the first long-term climate strategy among MDBs that goes beyond 2020. In terms of transparency, we have also identified the AsDB’s provision of transparent climate
finance data within the new Climate Finance Database as another example of leadership among the group835. AsDB is part of many knowledge sharing platforms, for example, the Asia Clean Energy Forum836, and the Asia Leadership Program. However, it is not clear if the AsDB is engaged in sharing information on their portfolio GHG
reduction commitment with other institutions.
European Bank for Reconstruction and Development (EBRD) The EBRD shows most progress on the area of energy efficiency, having demonstrated
leadership in this area. However, it’s not entirely clear whether the EBRD is sharing information with the other development banks or whether it has been involved in
raising energy efficiency standards among the group of development banks as a
whole. EBRD has also demonstrated leadership on the area of climate finance
tracking, providing the Secretariat for climate finance tracking among the MDBs837.
European Investment Bank (EIB) Looking across the full spectrum of activities covered in this report, the EIB stands out
in leadership on the topic of Green Finance, as the world’s largest issuer of Green Bonds and its pioneering issuance of the Climate Awareness Bond (CAB)838. EIB’s work on green finance is also potentially transformational, given the work with the China
Green Finance committee that seeks to facilitate the establishment of a common
language in green finance839 and could lead to the raising of standards. In addition, the EIB has been a pioneer in its use of shadow carbon pricing in cost-benefit analysis
across all investments (see Chapter 11). EIB has also demonstrated leadership in the coordination of the MDB group on climate mitigation methodologies, including on
definitions of climate finance, as well as in reporting and disclosing absolute emissions for projects840.
Inter-American Development Bank (IADB) According to our overall assessment, the IADB has demonstrated thought leadership in a number of areas. This includes, most recently, convening discussions on
835 https://www.adb.org/news/adb-launches-climate-financing-database
836 http://www.asiacleanenergyforum.org
837 Information received directly from EBRD.
838 http://www.eib.org/infocentre/ten-years-of-green-bonds.htm
839 http://www.eib.org/infocentre/press/releases/all/2017/2017-073-new-peoples-bank-of-china-and-eib-initiative-to-strengthen-green-finance.htm 840 EIB has been calling for reporting on absolute emissions by other MDBs and is thus an institutional leader in this regard.
1 3 0 B A N K I N G O N R E F O R M
sustainable infrastructure among various investors and groups, as well as releasing a call to action for government, MDB and investor cooperation to sharply increase sustainable infrastructure investment841. Moreover, IADB’s pioneering leadership on sustainability issues seems to have been raising standards and the level of ambition among the group of development banks as a whole. This is demonstrated in initiatives
such as NDC Invest842, which was the first ‘one stop shop’ NDC support initiative among the group to be outlined. In addition, IADB has demonstrated leadership on supporting countries with climate risk management, including catastrophe bonds843, as well as on green finance with a regional green bond facility844.
World Bank Group (WBG) The World Bank Group, including IFC, has demonstrated leadership in a number of areas. The CAPE initiative is identified as pioneering as this is a forum for peer learning, and mutual advisory support bringing together technical specialists from
finance ministries across the world845. The scope of the initiative includes fiscal risks, fossil fuel subsidy reform, as well as climate budgeting techniques (see below). Moreover, the Carbon Pricing Leadership Coalition (CPLC) is another initiative which is identified as potentially pioneering and transformational,846 as it spurs on efforts to
expand carbon pricing, though until recently, the WBG had not adopted internal carbon pricing within its own project assessment process847. WBG has also been the
first among the group to vocally link the exclusion of upstream gas and oil projects
from its portfolio to climate change commitments. This demonstrates leadership
which will ultimately be adopted by other institutions due to the necessity of ending upstream oil and gas finance, as well as phasing out other fossil fuel investments.
Box 13: Climate Action Peer Exchange (CAPE) Established at COP22 in 2016), the CAPE initiative is a knowledge exchange forum for finance ministries to discuss the fiscal challenges and good practices in implementing the NDCs under the Paris Agreement848. Focus areas of the CAPE initiative include fiscal instruments for low-carbon growth e.g. carbon pricing, emissions-trading systems, fuel taxes, feed-in tariffs; macroeconomic modeling to forecast economic growth and public-debt trajectories under alternative strategies; and fiscal risk assessments849. The work has included a workshop in Shanghai, China with finance ministries of 13 countries covering environmental fiscal policies, energy subsidy reforms and climate budgeting techniques850. It is financed by the NDC Partnership Support Facility and the Bank’s South-South Facility. CAPE is partnered with the Green Fiscal Policy Network, a partnership between UNEP, IMF and GIZ, to facilitate knowledge sharing and dialogue on fiscal policies for an inclusive green economy.
841 https://www.iadb.org/en/news/news-releases/2017-04-20/report-on-sustainable-infrastructure%2C11787.html
842 https://www.ndcinvest.org/
843 https://www.iadb.org/en/topics/natural-disasters/idb-helps-latin-america-to-develop-natural-disaster-insurance%2C2719.html
844 https://www.iadb.org/en/project/rg-x1250
845 http://www.worldbank.org/en/topic/climatechange/brief/cape
846 http://www.worldbank.org/en/news/feature/2017/05/04/cplc-nurtures-leadership-on-carbon-pricing
847 https://www.e3g.org/library/how-are-development-banks-performing-on-shadow-carbon-pricing
848 World Bank (2018) CAPE Initiative
849 World Bank (2018) CAPE Initiative
850 Ibid
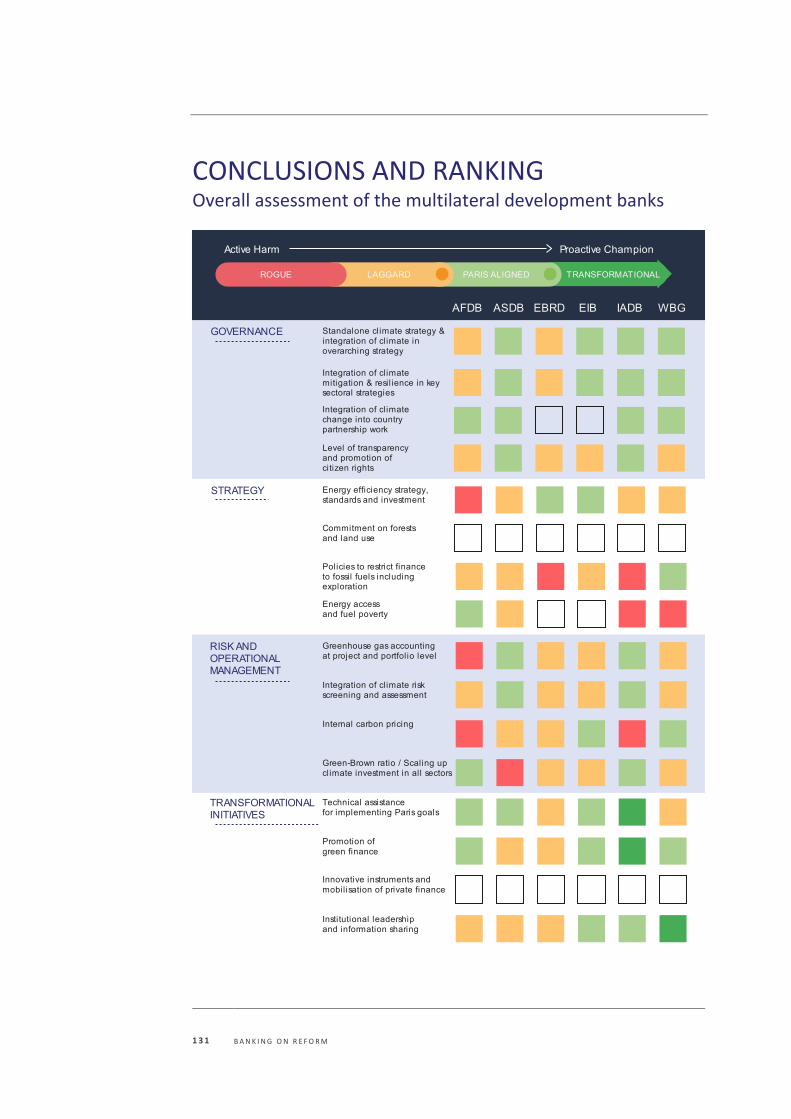
1 3 1 B A N K I N G O N R E F O R M
CONCLUSIONS AND RANKING Overall assessment of the multilateral development banks
1 3 2 B A N K I N G O N R E F O R M
The figure above ranks the overall progress of the MDBs from “Rogue” (red) through to “Transformational” (dark green), according to the benchmarking system described in Annex 1. It must be noted that our benchmarking and ranking system is designed to be dynamic, and thus may be adjusted in future in light of new evidence. In drawing up the final ranking, the MDBs were scored with a simple points system with a score
of ‘3’ for transformational, ‘2’ for Paris-aligned, ‘1’ for laggard and ‘0’ for rogue851. Different weighting systems were tested, which did not significantly affect the final ranking. The final ranking of MDBs from ‘transformational’ to ‘rogue’ using this scoring approach was:
• Inter-American Development Bank (1st) – Overall Score: 23 points
• European Investment Bank 2nd) – Overall Score: 22 points
• World Bank Group (3rd) – Overall Score: 21 points
• Asian Development Bank – Overall Score: 20 points
• African Development Bank – Overall Score: 17 points
• European Bank for Reconstruction & Development - Overall Score: 15 points
Priority Recommendations The analysis and information gathered in this report was used to develop a series of priority recommendations for the MDBs, considering the information across all
categories as well as information from the MDBs themselves852. Since none of the MDBs was ranked as ‘transformational’ across all categories, recommendations are
provided for all MDBs. This includes recommendations for how MDBs which are leading the way on a particular area can continue to drive forward progress.
African Development Bank (AfDB) • AfDB should update sectoral strategies to incorporate climate change, in key
sectors. The transport strategy is set to be revised soon which provides an opportunity for alignment with the Paris Agreement - it is recommended this be updated to include the ‘avoid-shift-improve’ approach.
• AfDB should adopt standards for energy efficiency of power generation and building projects which it supports, including learning from the IFC’s EDGE program. AfDB requires 20% energy savings from energy efficiency projects - a positive signal which could be adopted more widely. AfDB should seek to ensure key infrastructure investments are efficient in terms of energy use.
• AfDB should consider becoming the first MDB to make a commitment on reducing deforestation or increasing afforestation with its finance. This would be particularly significant given the importance of forests for the African region.
• AfDB should disclose the absolute greenhouse gas emissions from projects in high-emitting sectors, as well as reporting on emissions across the portfolio, and considering setting a reduction commitment, as well as considering the usage of shadow carbon pricing for project assessment.
851 EIB and EBRD’s average scores for categories they were ranked on were extrapolated to the total number of criteria so as not to disadvantage them in the scoring system for categories which were not applicable (N/A).
852 We engaged with MDB representatives in finalisation of these recommendations in order to ensure the recommendations had not already, or were planned to be, carried out by the MDBs.
1 3 3 B A N K I N G O N R E F O R M
• AfDB should make additional effort to support countries with climate-resilient policies, particularly given the vulnerability of the region it operates in.
• AfDB should explore which member countries would benefit the most from energy subsidy reform, as other MDBs have done.
• AfDB should continue to support countries with green banking and green bond issuance, building on existing work. AfDB could assess what proportion of its credit lines go to green activities and consider providing technical assistance to local financial institutions interested in financing green investment.
Asian Development Bank (AsDB) • AsDB should continue to integrate climate into its country work following
the Paris Agreement, and support countries with deep decarbonization, as IADB is doing.
• AsDB should require energy efficiency standards for power generation or buildings in AsDB-supported projects, in line with best practice in other MDBs.
• AsDB should consider committing to net zero deforestation or making an equivalent commitment on forests. AsDB’s climate framework notes that AsDB has a very limited portfolio of investments on preventing deforestation and degradation and AsDB should look at filling this gap given the importance of forests for the Paris Agreement goals. Fisheries and oceans may well also be a crucial gap given the importance of fisheries in the Asian region – an area which requires further research.
• AsDB should put restrictions in place to limit oil and gas lending, which would improve the Bank’s green to brown energy lending ratio.
• AsDB should ensure its commitment to reduce portfolio emissions takes into account best practices in terms of disclosing absolute emissions and on project inclusion thresholds.
• AsDB should update its internal carbon price with the recommendations from the High-Level Commission on Carbon Pricing, as the World Bank has recently done.
• AsDB should support regulators on greening the financial system and green fiscal reforms, building on existing work.
European Bank for Reconstruction and Development (EBRD) • On fossil fuel finance, the upcoming revision of EBRD’s Energy Sector
Strategy this year is an opportunity to align with the Paris Agreement. EBRD should immediately rule out oil finance as well as putting in place a timeline for ruling out gas investments by 2020.
• EBRD should consider setting a target for emission reductions to be achieved across its portfolio. IADB and AsDB have already made commitments in this regard. EBRD has a portfolio-wide GHG accounting system in place, providing a suitable basis for setting reduction targets.
• EBRD should consider additional efforts to support clients with climate resilience, as well as scaling up adaptation finance.
1 3 4 B A N K I N G O N R E F O R M
• EBRD should introduce a carbon price across all sectors and update its carbon price in line with levels recommended by the High-Level Commission on Carbon Pricing. EBRD is currently looking into this area and deciding on the application and scope of shadow pricing853.
• EBRD should improve on the quality of reporting of its climate finance data to OECD-DAC. Many climate finance projects were missing the project description and/or short description.
• EBRD should provide technical support on long-term pathway planning for deep decarbonization, as well as in supporting countries and private sector actors to understand stranded asset risks.
• EBRD should provide green finance support for regulators and a broader set of national financial institutions, building on existing work on green bonds and work with local financial institutions.
• EBRD should continue to work with other MDBs to share its learning on financing energy efficiency. The research identified EBRD’s work on energy efficiency as an example of leadership among the MDBs.
European Investment Bank (EIB) • On fossil fuel finance, EIB’s upcoming revision of its’ energy strategy is an
opportunity to align its energy lending with the Paris Agreement. As for EBRD, EIB should immediately rule out oil finance as well as putting in place a timeline for ruling out gas investments by 2020. This would improve EIB’s green to brown energy finance ratio.
• EIB should consider setting a greenhouse gas emission reduction target across its portfolio, as well as measuring the greenhouse gas impacts of its equity investments.
• EIB should make additional efforts to scale up adaptation finance, as well as support climate resilience as part of its technical support.
• As part of the European Investment Advisory Hub (EIAH), EIB should provide advisory support on 2050 pathway planning and support on fossil fuel subsidy reform. Our analysis found that all of the MDBs had provided some form of technical support on fossil fuel subsidy reform, apart from the EIB.
• EIB should work to support regulators and local or national financial institutions on green finance, including continuing to support green bond markets, building on existing work.
• EIB should continue to work on alignment with the Paris Agreement, including sharing the learning and findings with other MDBs. There are signs of progress given that EIB plans to assess the level of alignment with the Paris Agreement as part of its mid-term review of its Climate Strategy 5-year implementation plan.
Inter-American Development Bank (IADB) • IADB should set standards for energy efficiency for investments in relevant
sectors e.g. learning from IFC or EIB. IADB currently does not require the use of a specific energy efficiency standard in buildings financed through its operations (hospitals, schools, offices, housing, etc).
853 Information received from EBRD.
1 3 5 B A N K I N G O N R E F O R M
• IADB should be the first MDB to pledge to net zero deforestation or make an equivalent commitment on reducing deforestation. To address deforestation, IADB could be the first among the MDBs to provide technical advice to support sustainable food consumption, in line with the goal of keeping global temperature rise below 2 degrees.
• IADB should go further than the WBG and rule out oil and gas investment. This commitment would reflect existing progress in greening IADB’s investments whilst setting an example for others.
• IADB should assess whether it should increase its portfolio emission reduction targets. IADB has a target for reducing emissions across its portfolio and should assess whether this target is ambitious enough to support the Paris Agreement goals. IADB should consider pioneering a commitment for alignment of its portfolio with 1.5 degrees. This may require conducting an assessment of its alignment.
• IADB should consider using internal carbon pricing and to align this shadow price with the High-Level Commission recommendations. The IADB is currently reviewing this issue.
World Bank Group (WBG) • WBG should support client countries with long-term economic planning for
2050 pathways and integrate this into their work as well as supporting client countries on understanding stranded asset risks. WBG should seek to provide more publicly available information about its NDC Support Facility to enhance transparency.
• On energy access, WBG should consider setting a target to improve overall progress on sustainable energy access, as well as supporting Climate Vulnerable Forum countries to meet their goal of 100% renewable energy by 2050.
• WBG should ensure its commitment to greenhouse gas reporting integrates best practices across the MDBs. This should include disclosure of absolute project emissions, for all projects with emissions above 25kt of emissions. Based on available evidence, WBG should set a reduction target for gross portfolio-wide greenhouse gas emissions.
• WBG should further strengthen its climate finance target, in line with the ambition in other MDBs.
• IFC should adopt climate risk screening processes, as are already used within the IBRD and IDA.
• IBRD and IDA projects should adopt energy efficiency standards for investments in the power sector and buildings. i.e. IFC standards requiring power plants to be in the top quartile of efficiency, and for buildings to reduce absolute energy use by at least 20% compared to the baseline.
Recommendations for other international financial institutions The findings have implications for other national and international financial institutions. For example, the International Development Finance Club (IDFC) which is
made up of 23 development banks with combined total assets of more than $3.5 trillion have also committed to align their finance with the Paris Climate
1 3 6 B A N K I N G O N R E F O R M
Agreement854. The findings could also have implications for the Green Climate Fund
which was set up with the aim of supporting a paradigm shift in the global response to climate change. Other national and international development finance institutions
should look to adopt the best practices identified within this report. For example, the Asian Infrastructure Investment Bank should look to implement best practices from the MDBs on areas such as portfolio greenhouse gas accounting, climate risk screening, and energy efficiency standards, as well as adopting a shadow carbon price on project appraisal in line with the High-Level Commission on Carbon Pricing855.
Recommendations for the whole group of MDBs Furthermore, on alignment with the Paris Agreement, all of the MDBs have committed to aligning their financial flows with the Paris Agreement. To ensure this commitment is robustly implemented, the MDBs must self-assess their level of alignment, as well as committing to use tools which assess their level of alignment of portfolio spending with the Paris Agreement. European Investment Bank shows emerging signs of leadership in this area, as EIB plans to assess the level of alignment as part of its mid-term review of its Climate Strategy 5 year implementation856. Among the MDBs, there was limited transparency in terms of publicly reported project-level data available with which to estimate the MDBs green/brown energy finance ratio. Therefore, fossil finance spending was drawn from secondary data. To improve transparency on climate-related disclosures it would be helpful if the MDBs Annual Reports and/or Joint Reports would self-report on such information. In line with the Task Force on Climate-Related Financial Disclosures (TCFD)857 , MDBs should assess their exposure to high-carbon assets. The MDBs should also disclose disaggregated data on the instruments used and private finance mobilised. Since country pledges under the Paris Agreements are insufficient to limit global temperature rise to 2°C, we recommend that MDBs should go beyond offering support for Paris goals, and offer technical assistance on long-term pathways that align with the goal of achieving net zero greenhouse gas emissions. On green finance, all MDBs should seek to provide relevant technical assistance on green finance for regulators including finance ministries, central banks and national financial institutions. This should include putting in place robust policies and incentives to build capacity of other institutions to carry out environmental screening and ‘green’ their investments. In addition, MDBs should seek to create investment vehicles and financial structures that maximize private sector leverage, as well as working with local financial institutions. These rankings are likely to change in future, and climate change should be incorporated as sectoral strategies are updated.
854 IDFC-MDB Statement (2017) Together Major Development Finance Institutions Align Financial Flows with Paris Agreement
855 Further research would be required to ascertain the extent to which other development finance institutions have taken up the best practices featured in this report.
856 Information received directly from the EIB.
857 See: www.fsb-tcfd.org
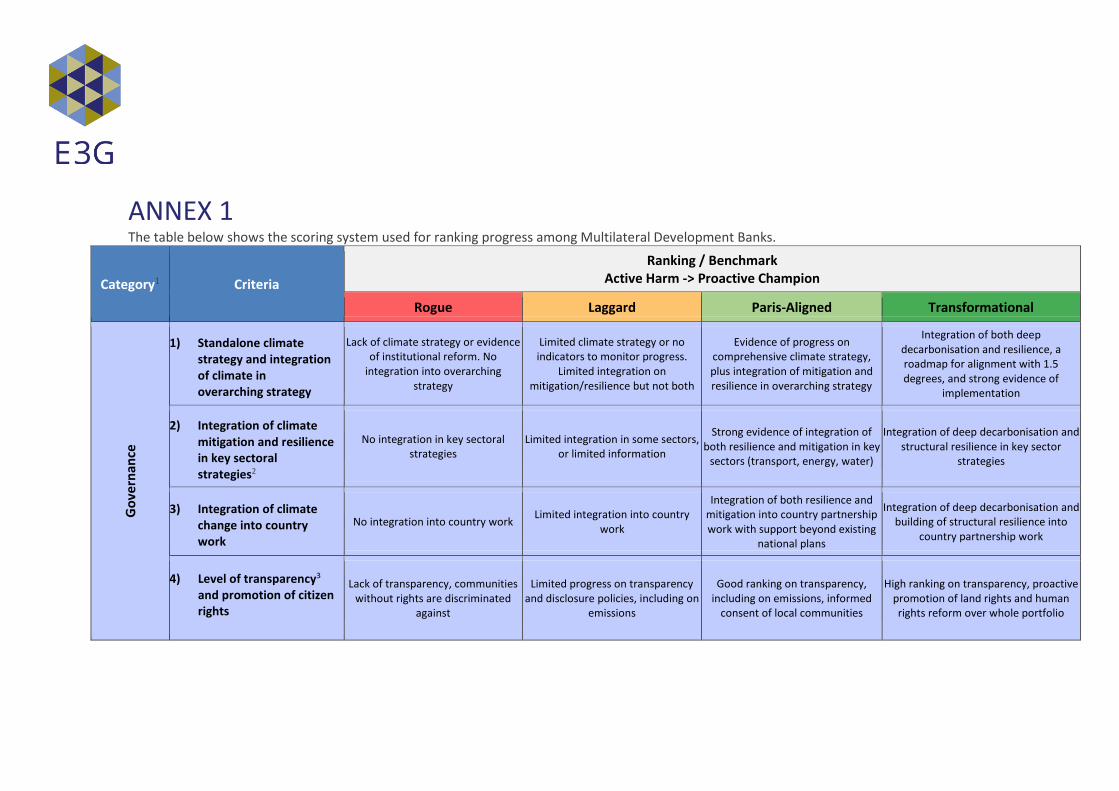
ANNEX 1 The table below shows the scoring system used for ranking progress among Multilateral Development Banks.
Category1 Criteria
Ranking / Benchmark Active Harm -> Proactive Champion
Rogue Laggard Paris-Aligned Transformational
Go
vern
ance
1) Standalone climate strategy and integration of climate in overarching strategy
Lack of climate strategy or evidence of institutional reform. No
integration into overarching strategy
Limited climate strategy or no indicators to monitor progress.
Limited integration on mitigation/resilience but not both
Evidence of progress on comprehensive climate strategy, plus integration of mitigation and resilience in overarching strategy
Integration of both deep decarbonisation and resilience, a roadmap for alignment with 1.5 degrees, and strong evidence of
implementation
2) Integration of climate mitigation and resilience in key sectoral strategies2
No integration in key sectoral strategies
Limited integration in some sectors, or limited information
Strong evidence of integration of both resilience and mitigation in key
sectors (transport, energy, water)
Integration of deep decarbonisation and structural resilience in key sector
strategies
3) Integration of climate change into country work
No integration into country work Limited integration into country
work
Integration of both resilience and mitigation into country partnership work with support beyond existing
national plans
Integration of deep decarbonisation and building of structural resilience into
country partnership work
4) Level of transparency3
and promotion of citizen rights
Lack of transparency, communities without rights are discriminated
against
Limited progress on transparency and disclosure policies, including on
emissions
Good ranking on transparency, including on emissions, informed
consent of local communities
High ranking on transparency, proactive promotion of land rights and human rights reform over whole portfolio
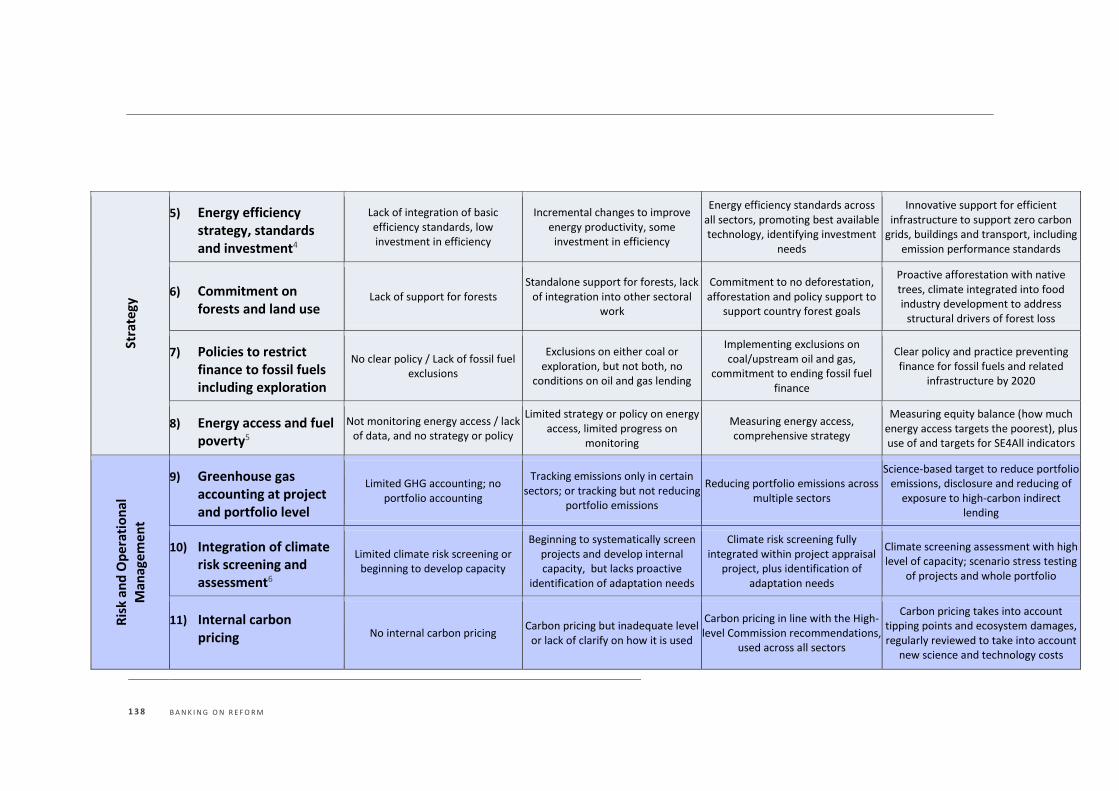
1 3 8 B A N K I N G O N R E F O R M
Stra
tegy
5) Energy efficiency strategy, standards and investment4
Lack of integration of basic efficiency standards, low investment in efficiency
Incremental changes to improve energy productivity, some
investment in efficiency
Energy efficiency standards across all sectors, promoting best available technology, identifying investment
needs
Innovative support for efficient infrastructure to support zero carbon
grids, buildings and transport, including emission performance standards
6) Commitment on forests and land use
Lack of support for forests Standalone support for forests, lack
of integration into other sectoral work
Commitment to no deforestation, afforestation and policy support to
support country forest goals
Proactive afforestation with native trees, climate integrated into food industry development to address
structural drivers of forest loss
7) Policies to restrict finance to fossil fuels including exploration
No clear policy / Lack of fossil fuel exclusions
Exclusions on either coal or exploration, but not both, no
conditions on oil and gas lending
Implementing exclusions on coal/upstream oil and gas,
commitment to ending fossil fuel finance
Clear policy and practice preventing finance for fossil fuels and related
infrastructure by 2020
8) Energy access and fuel poverty5
Not monitoring energy access / lack of data, and no strategy or policy
Limited strategy or policy on energy access, limited progress on
monitoring
Measuring energy access, comprehensive strategy
Measuring equity balance (how much energy access targets the poorest), plus use of and targets for SE4All indicators
Ris
k an
d O
per
atio
nal
M
anag
eme
nt
9) Greenhouse gas accounting at project and portfolio level
Limited GHG accounting; no portfolio accounting
Tracking emissions only in certain sectors; or tracking but not reducing
portfolio emissions
Reducing portfolio emissions across multiple sectors
Science-based target to reduce portfolio emissions, disclosure and reducing of
exposure to high-carbon indirect lending
10) Integration of climate risk screening and assessment6
Limited climate risk screening or beginning to develop capacity
Beginning to systematically screen projects and develop internal capacity, but lacks proactive
identification of adaptation needs
Climate risk screening fully integrated within project appraisal
project, plus identification of adaptation needs
Climate screening assessment with high level of capacity; scenario stress testing
of projects and whole portfolio
11) Internal carbon pricing
No internal carbon pricing Carbon pricing but inadequate level
or lack of clarify on how it is used
Carbon pricing in line with the High-level Commission recommendations,
used across all sectors
Carbon pricing takes into account tipping points and ecosystem damages, regularly reviewed to take into account
new science and technology costs
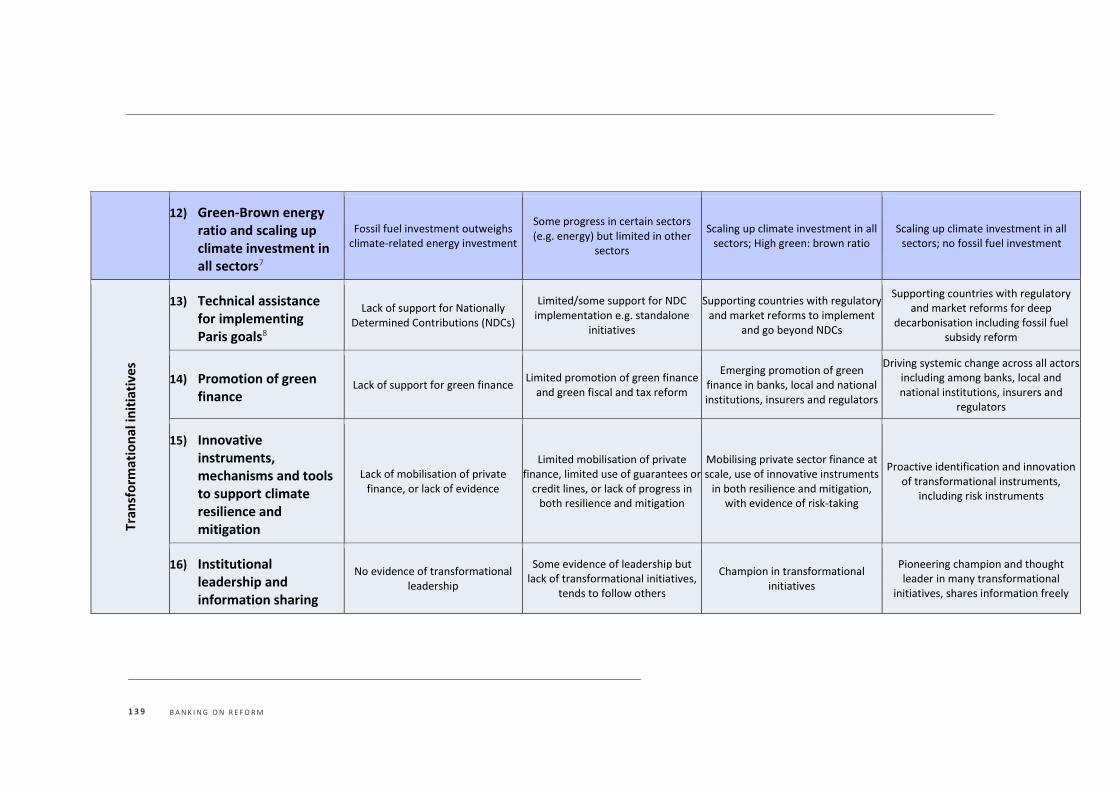
1 3 9 B A N K I N G O N R E F O R M
12) Green-Brown energy
ratio and scaling up climate investment in all sectors7
Fossil fuel investment outweighs climate-related energy investment
Some progress in certain sectors (e.g. energy) but limited in other
sectors
Scaling up climate investment in all sectors; High green: brown ratio
Scaling up climate investment in all sectors; no fossil fuel investment
Tran
sfo
rmat
ion
al in
itia
tive
s
13) Technical assistance for implementing Paris goals8
Lack of support for Nationally Determined Contributions (NDCs)
Limited/some support for NDC implementation e.g. standalone
initiatives
Supporting countries with regulatory and market reforms to implement
and go beyond NDCs
Supporting countries with regulatory and market reforms for deep
decarbonisation including fossil fuel subsidy reform
14) Promotion of green finance
Lack of support for green finance Limited promotion of green finance
and green fiscal and tax reform
Emerging promotion of green finance in banks, local and national institutions, insurers and regulators
Driving systemic change across all actors including among banks, local and national institutions, insurers and
regulators
15) Innovative instruments, mechanisms and tools to support climate resilience and mitigation
Lack of mobilisation of private finance, or lack of evidence
Limited mobilisation of private finance, limited use of guarantees or
credit lines, or lack of progress in both resilience and mitigation
Mobilising private sector finance at scale, use of innovative instruments
in both resilience and mitigation, with evidence of risk-taking
Proactive identification and innovation of transformational instruments,
including risk instruments
16) Institutional leadership and information sharing
No evidence of transformational leadership
Some evidence of leadership but lack of transformational initiatives,
tends to follow others
Champion in transformational initiatives
Pioneering champion and thought leader in many transformational
initiatives, shares information freely
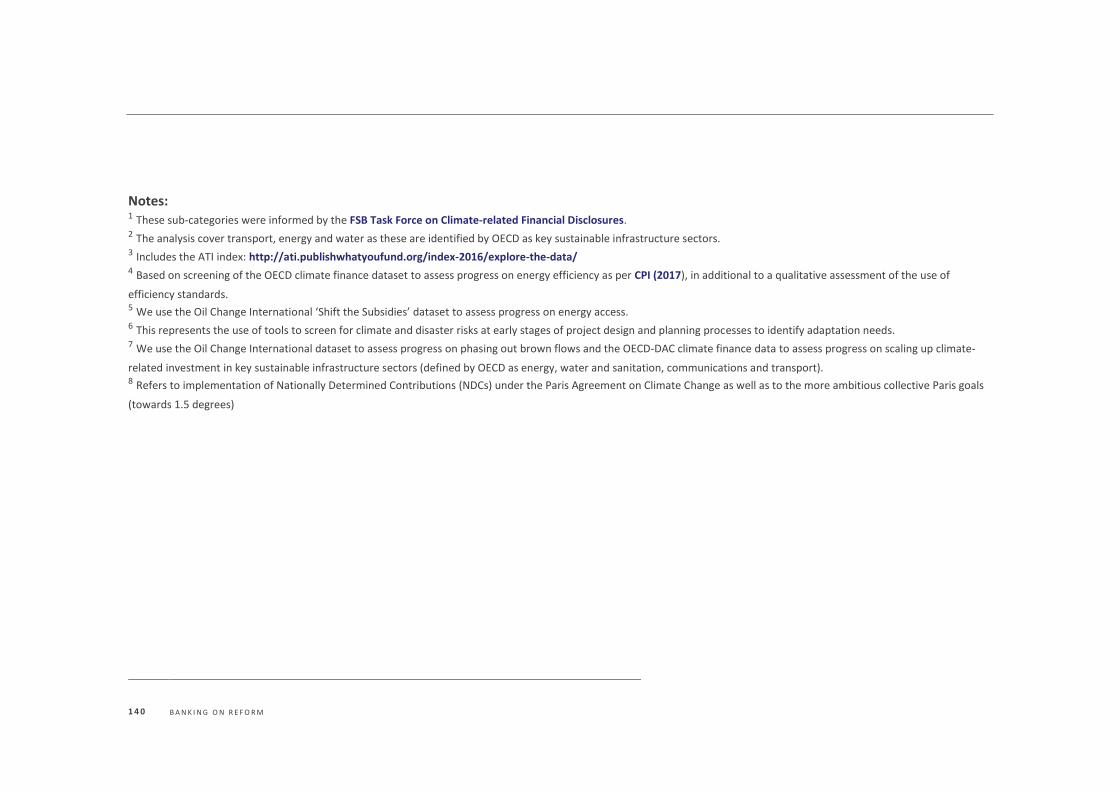
1 4 0 B A N K I N G O N R E F O R M
Notes: 1 These sub-categories were informed by the FSB Task Force on Climate-related Financial Disclosures. 2 The analysis cover transport, energy and water as these are identified by OECD as key sustainable infrastructure sectors. 3 Includes the ATI index: http://ati.publishwhatyoufund.org/index-2016/explore-the-data/ 4 Based on screening of the OECD climate finance dataset to assess progress on energy efficiency as per CPI (2017), in additional to a qualitative assessment of the use of
efficiency standards. 5 We use the Oil Change International ‘Shift the Subsidies’ dataset to assess progress on energy access. 6 This represents the use of tools to screen for climate and disaster risks at early stages of project design and planning processes to identify adaptation needs. 7 We use the Oil Change International dataset to assess progress on phasing out brown flows and the OECD-DAC climate finance data to assess progress on scaling up climate-
related investment in key sustainable infrastructure sectors (defined by OECD as energy, water and sanitation, communications and transport). 8 Refers to implementation of Nationally Determined Contributions (NDCs) under the Paris Agreement on Climate Change as well as to the more ambitious collective Paris goals
(towards 1.5 degrees)
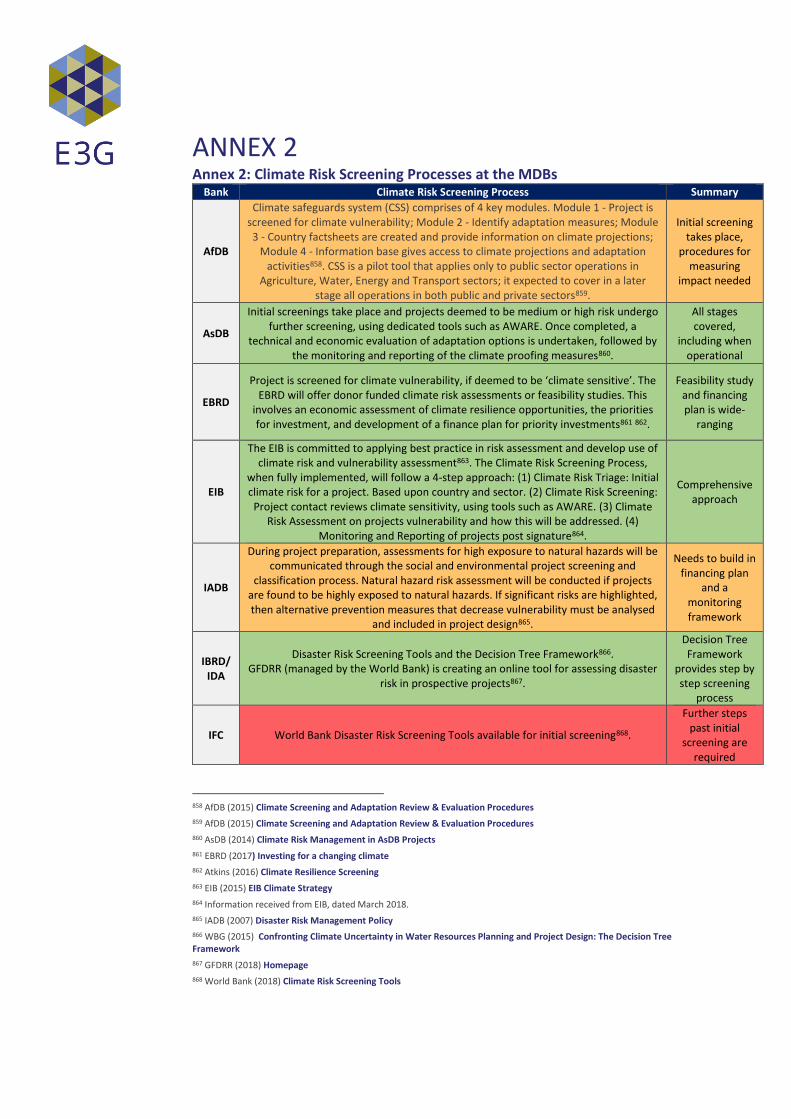
ANNEX 2 Annex 2: Climate Risk Screening Processes at the MDBs
Bank Climate Risk Screening Process Summary
AfDB
Climate safeguards system (CSS) comprises of 4 key modules. Module 1 - Project is screened for climate vulnerability; Module 2 - Identify adaptation measures; Module 3 - Country factsheets are created and provide information on climate projections;
Module 4 - Information base gives access to climate projections and adaptation activities858. CSS is a pilot tool that applies only to public sector operations in
Agriculture, Water, Energy and Transport sectors; it expected to cover in a later stage all operations in both public and private sectors859.
Initial screening takes place,
procedures for measuring
impact needed
AsDB
Initial screenings take place and projects deemed to be medium or high risk undergo further screening, using dedicated tools such as AWARE. Once completed, a
technical and economic evaluation of adaptation options is undertaken, followed by the monitoring and reporting of the climate proofing measures860.
All stages covered,
including when operational
EBRD
Project is screened for climate vulnerability, if deemed to be ‘climate sensitive’. The EBRD will offer donor funded climate risk assessments or feasibility studies. This
involves an economic assessment of climate resilience opportunities, the priorities for investment, and development of a finance plan for priority investments861 862.
Feasibility study and financing plan is wide-
ranging
EIB
The EIB is committed to applying best practice in risk assessment and develop use of climate risk and vulnerability assessment863. The Climate Risk Screening Process,
when fully implemented, will follow a 4-step approach: (1) Climate Risk Triage: Initial climate risk for a project. Based upon country and sector. (2) Climate Risk Screening:
Project contact reviews climate sensitivity, using tools such as AWARE. (3) Climate Risk Assessment on projects vulnerability and how this will be addressed. (4)
Monitoring and Reporting of projects post signature864.
Comprehensive approach
IADB
During project preparation, assessments for high exposure to natural hazards will be communicated through the social and environmental project screening and
classification process. Natural hazard risk assessment will be conducted if projects are found to be highly exposed to natural hazards. If significant risks are highlighted, then alternative prevention measures that decrease vulnerability must be analysed
and included in project design865.
Needs to build in financing plan
and a monitoring framework
IBRD/ IDA
Disaster Risk Screening Tools and the Decision Tree Framework866. GFDRR (managed by the World Bank) is creating an online tool for assessing disaster
risk in prospective projects867.
Decision Tree Framework
provides step by step screening
process
IFC World Bank Disaster Risk Screening Tools available for initial screening868.
Further steps past initial
screening are required
858 AfDB (2015) Climate Screening and Adaptation Review & Evaluation Procedures
859 AfDB (2015) Climate Screening and Adaptation Review & Evaluation Procedures
860 AsDB (2014) Climate Risk Management in AsDB Projects
861 EBRD (2017) Investing for a changing climate
862 Atkins (2016) Climate Resilience Screening
863 EIB (2015) EIB Climate Strategy
864 Information received from EIB, dated March 2018.
865 IADB (2007) Disaster Risk Management Policy
866 WBG (2015) Confronting Climate Uncertainty in Water Resources Planning and Project Design: The Decision Tree Framework
867 GFDRR (2018) Homepage
868 World Bank (2018) Climate Risk Screening Tools
Recommended