ARMZ Uranium Holding: Expanding Global Presence
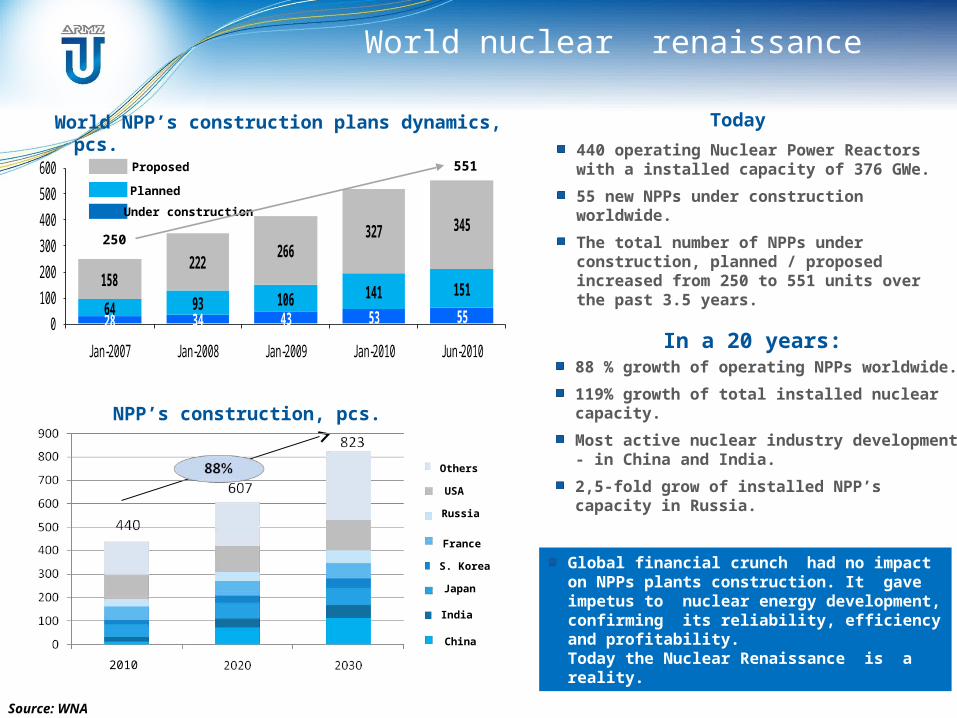
World nuclear renaissance
Today
In a 20 years:
Source: WNA
440 operating Nuclear Power Reactors with a installed capacity of 376 GWe.
55 new NPPs under construction worldwide.
The total number of NPPs under construction, planned / proposed increased from 250 to 551 units over the past 3.5 years.
28 34 43 53 5564 93 106 141 151158222
266327 345
0
100
200
300
400
500
600
Jan-2007 Jan-2008 Jan-2009 Jan-2010 Jun-2010
Under construction
Planned
Proposed
World NPP’s construction plans dynamics, pcs.
250
551
NPP’s construction, pcs.
2010
USA
Russia
Others
China
India
Japan
S. Korea
France
88 % growth of operating NPPs worldwide.
119% growth of total installed nuclear capacity.
Most active nuclear industry development - in China and India.
2,5-fold grow of installed NPP’s capacity in Russia.
Global financial crunch had no impact on NPPs plants construction. It gave impetus to nuclear energy development, confirming its reliability, efficiency and profitability.Today the Nuclear Renaissance is a reality.
33
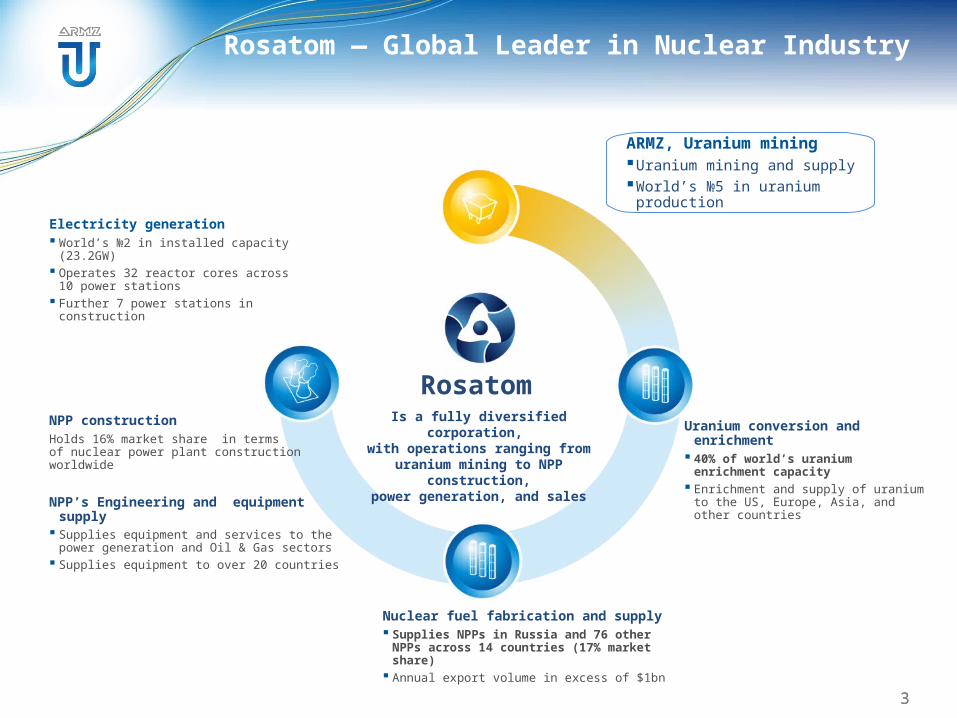
Uranium conversion and enrichment 40% of world’s uranium enrichment
capacity Enrichment and supply of uranium to the
US, Europe, Asia, and other countries
NPP constructionHolds 16% market share in termsof nuclear power plant construction worldwide
RosatomIs a fully diversified corporation,
with operations ranging fromuranium mining to NPP construction,
power generation, and sales
NPP’s Engineering and equipment supply Supplies equipment and services to the power
generation and Oil & Gas sectors Supplies equipment to over 20 countries
Electricity generation World’s №2 in installed capacity (23.2GW) Operates 32 reactor cores across
10 power stations Further 7 power stations in construction
Nuclear fuel fabrication and supply Supplies NPPs in Russia and 76 other NPPs
across 14 countries (17% market share) Annual export volume in excess of $1bn
ARMZ, Uranium miningUranium mining and supplyWorld’s №5 in uranium production
Rosatom — Global Leader in Nuclear Industry
4
PhilippinesBrunei
Taiwan
Malaysia
Vietnam
Sri Lanka
Dschibuti
Qatar
JordanIsrael
Georgia
Cyprus
Togo
Serbia
Guinea-BissauGambia
Belgium
Portugal
Kuwait
Croatia
Albania Armenia
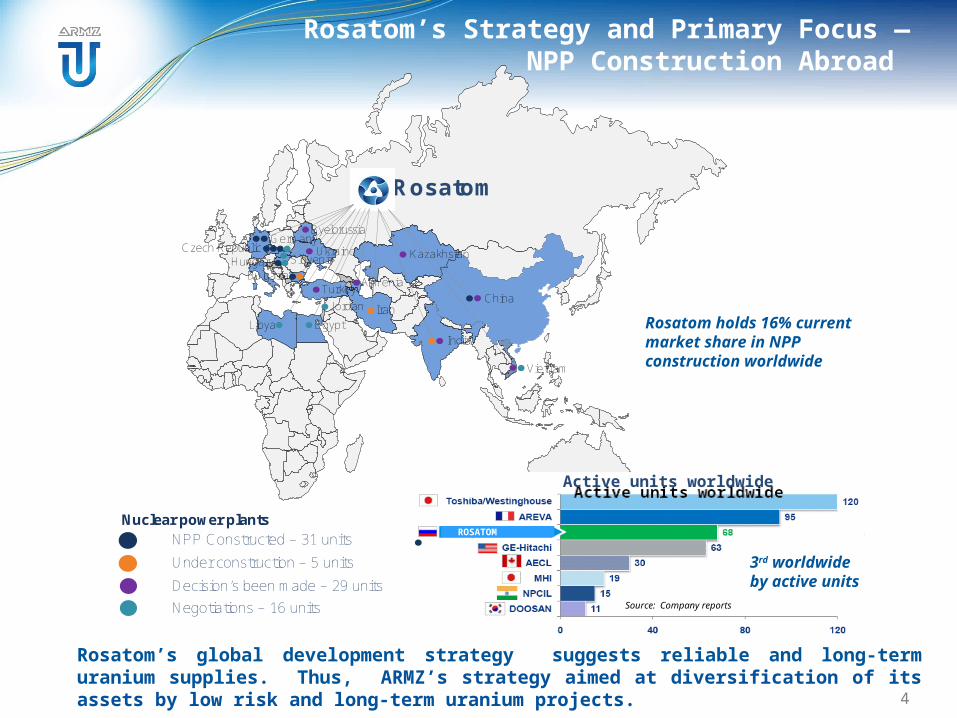
NPP Constructed – 31 units
Under construction – 5 units
Decision’s been made – 29 units
GermanyUkraineCzech Republic
SloveniaHungaryBulgaria
Turkey
Kazakhstan
Byelorussia
Negotiations – 16 units
Armenia
China
India
Vietnam
EgyptLibyaIranJordan
Nuclear power plants
Rosatom
Rosatom’s Strategy and Primary Focus —NPP Construction Abroad
ROSATOM
Active units worldwideActive units worldwide
Rosatom holds 16% current market share in NPP construction worldwide
3rd worldwide by active units
Source: Company reports
Rosatom’s global development strategy suggests reliable and long-term uranium supplies. Thus, ARMZ’s strategy aimed at diversification of its assets by low risk and long-term uranium projects.
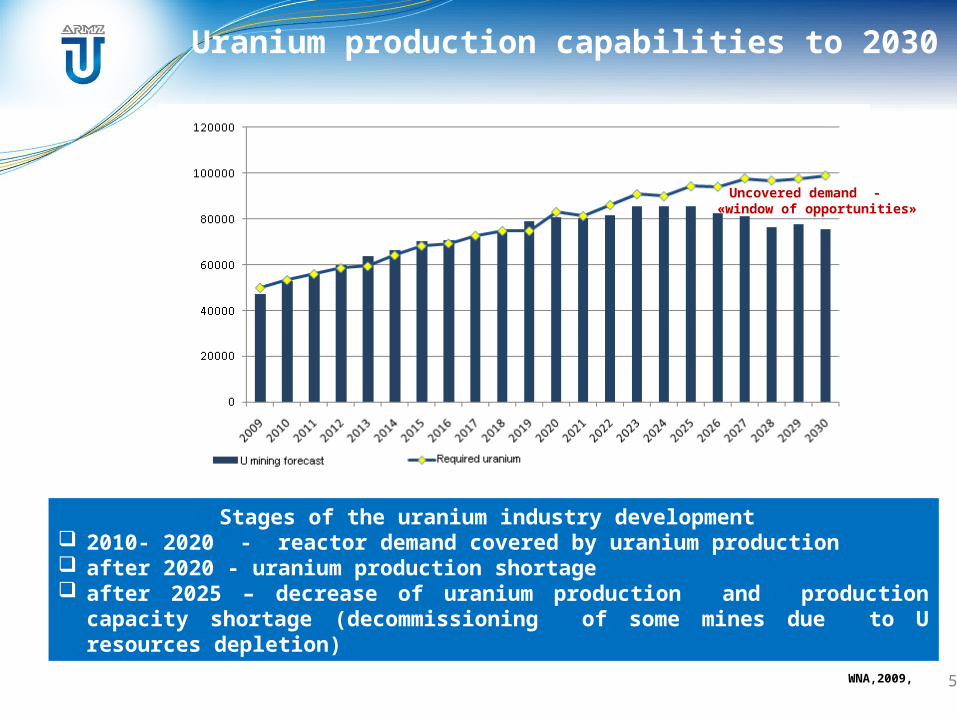
Uranium production capabilities to 2030
5WNA,2009, reference
Stages of the uranium industry development 2010- 2020 - reactor demand covered by uranium production after 2020 - uranium production shortage after 2025 – decrease of uranium production and production capacity shortage
(decommissioning of some mines due to U resources depletion)
Uncovered demand - «window of opportunities»
tU
production
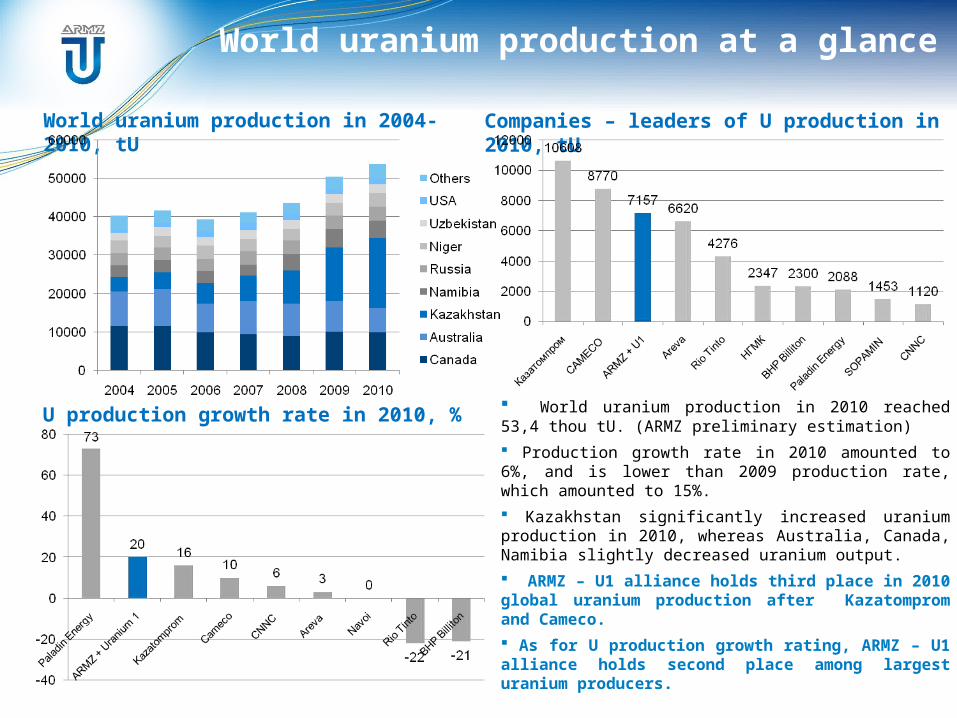
World uranium production at a glance
U production growth rate in 2010, %
World uranium production in 2004-2010, tU Companies – leaders of U production in 2010, tU
40251 4155739357 41102
43648
5030554000
World uranium production in 2010 reached 53,4 thou tU. (ARMZ preliminary estimation)
Production growth rate in 2010 amounted to 6%, and is lower than 2009 production rate, which amounted to 15%.
Kazakhstan significantly increased uranium production in 2010, whereas Australia, Canada, Namibia slightly decreased uranium output.
ARMZ – U1 alliance holds third place in 2010 global uranium production after Kazatomprom and Cameco.
As for U production growth rating, ARMZ – U1 alliance holds second place among largest uranium producers.
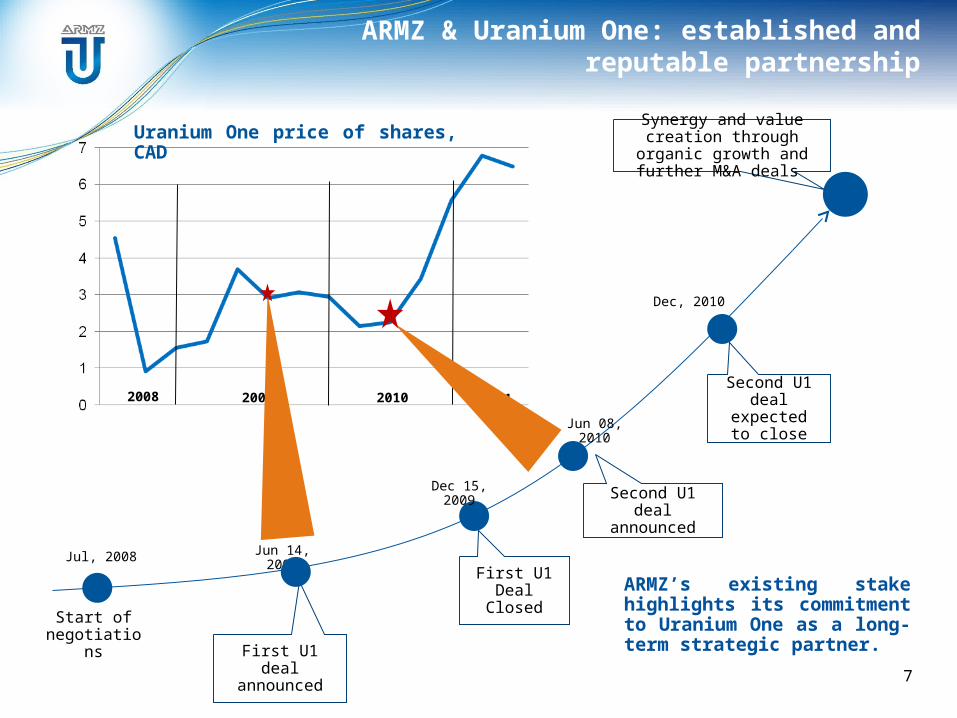
Start of negotiations
Jun 14, 2009
First U1 deal announced
Second U1 deal announced
ARMZ & Uranium One: established and reputable partnership
Synergy and value creation through organic growth and
further M&A deals
First U1 Deal Closed
Dec 15, 2009
ARMZ’s existing stake highlights its commitment to Uranium One as a long-term strategic partner.
Jun 08, 2010
Dec, 2010
Second U1 deal expected
to close
7
Jul, 2008
2008 2009 2010 2011
Uranium One price of shares, CAD
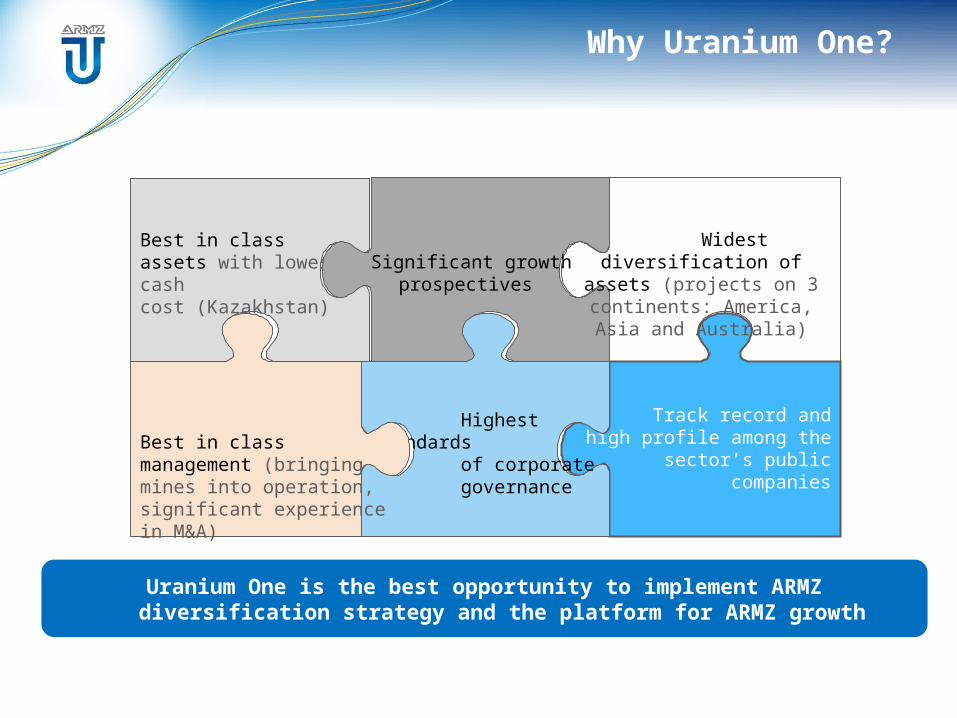
Why Uranium One?
Uranium One is the best opportunity to implement ARMZ diversification strategy and the platform for ARMZ growth
Track record and high profile among the sector’s
public companies
Highest standards of corporate governance
Best in class management (bringing mines into operation, significant experience in M&A)
Best in class assets with lowest cash cost (Kazakhstan)
Significant growth prospectives
Widest diversification of assets (projects on 3
continents: America, Asia and Australia)
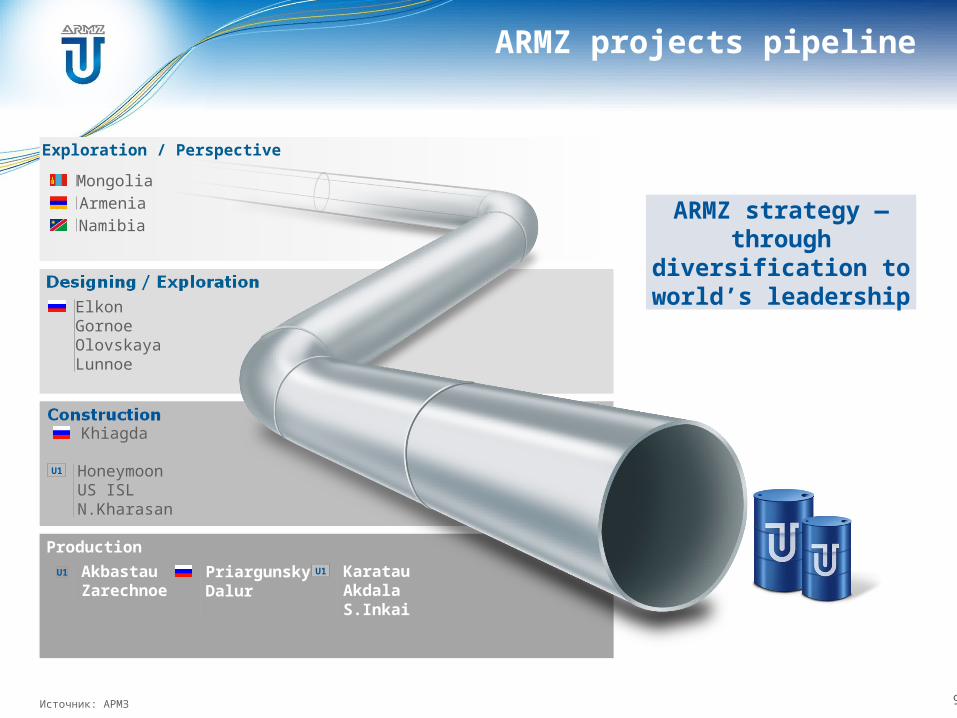
ARMZ projects pipeline
Exploration / Perspective
9Источник: АРМЗ
ARMZ strategy — through
diversification to world’s leadership
Production
AkbastauZarechnoe
ElkonGornoeOlovskayaLunnoe
MongoliaArmeniaNamibia
HoneymoonUS ISLN.Kharasan
U1
PriargunskyDalur
KaratauAkdalaS.Inkai
U1
Khiagda
U1
ARMZ – U1 alliance potential
10
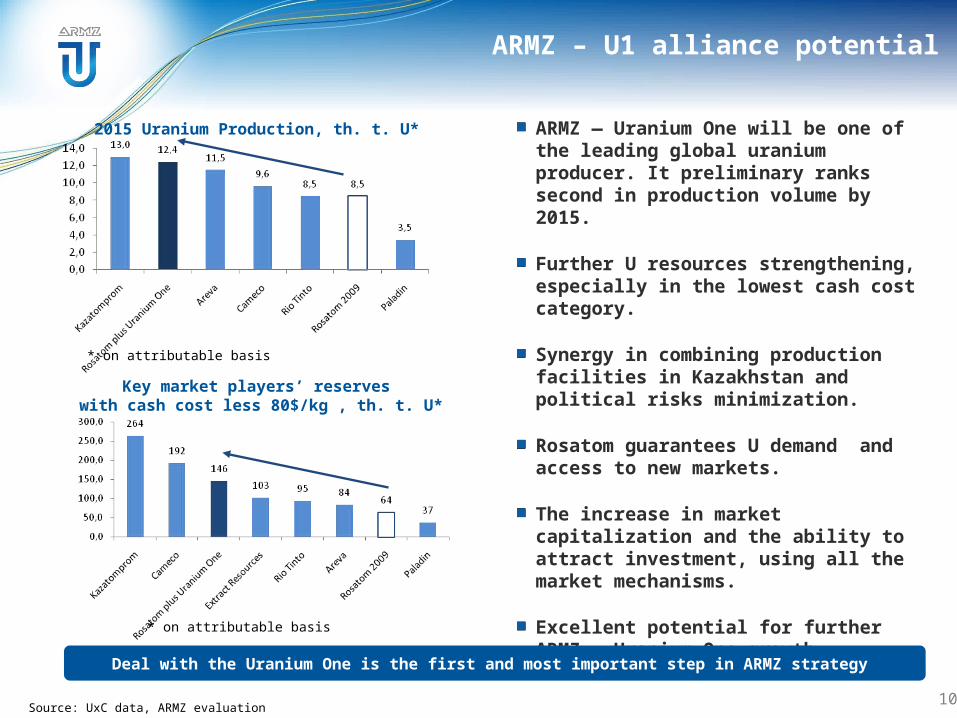
ARMZ — Uranium One will be one of the leading global uranium producer. It preliminary ranks second in production volume by 2015.
Further U resources strengthening, especially in the lowest cash cost category.
Synergy in combining production facilities in Kazakhstan and political risks minimization.
Rosatom guarantees U demand and access to new markets.
The increase in market capitalization and the ability to attract investment, using all the market mechanisms.
Excellent potential for further ARMZ – Uranium One growth.
Deal with the Uranium One is the first and most important step in ARMZ strategy
Source: UxC data, ARMZ evaluation
2015 Uranium Production, th. t. U*
* on attributable basis
Key market players’ reserves with cash cost less 80$/kg , th. t. U*
* on attributable basis
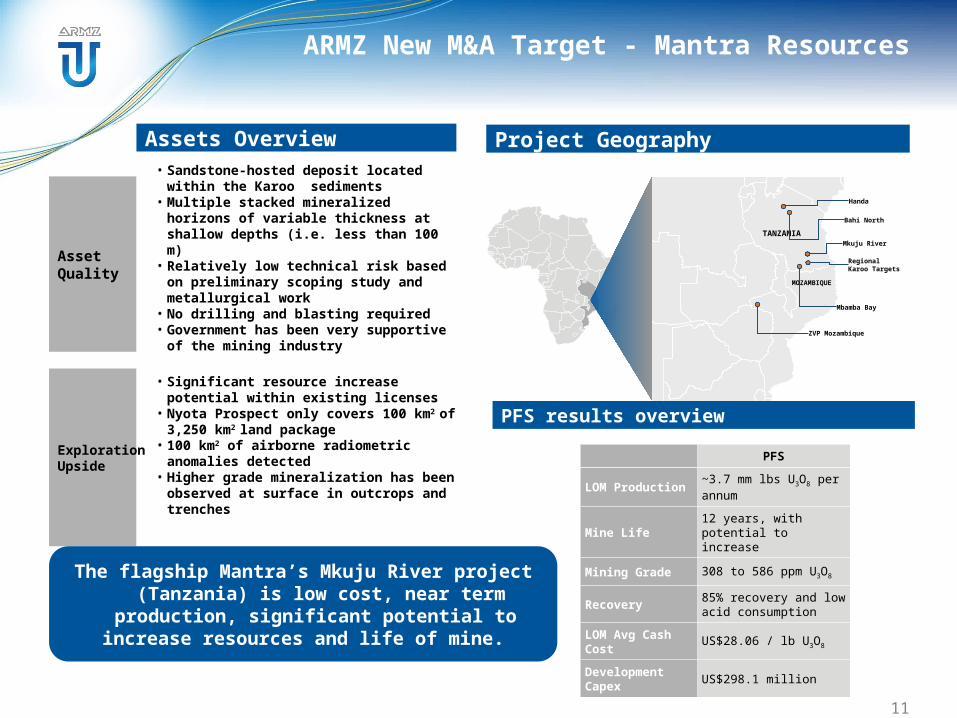
ARMZ New M&A Target - Mantra Resources
AssetQuality
• Sandstone-hosted deposit located within the Karoo sediments
• Multiple stacked mineralized horizons of variable thickness at shallow depths (i.e. less than 100 m)
• Relatively low technical risk based on preliminary scoping study and metallurgical work
• No drilling and blasting required• Government has been very supportive of the
mining industry
Assets Overview
ExplorationUpside
• Significant resource increase potential within existing licenses
• Nyota Prospect only covers 100 km2 of 3,250 km2 land package
• 100 km2 of airborne radiometric anomalies detected
• Higher grade mineralization has been observed at surface in outcrops and trenches
PFS
LOM Production ~3.7 mm lbs U3O8 per annum
Mine Life12 years, with potential to increase
Mining Grade 308 to 586 ppm U3O8
Recovery85% recovery and low acid consumption
LOM Avg Cash Cost
US$28.06 / lb U3O8
Development Capex
US$298.1 million
Handa
Bahi North
Mkuju River
Mbamba Bay
Regional Karoo Targets
ZVP Mozambique
TANZANIA
MOZAMBIQUE
Project Geography
PFS results overview
11
The flagship Mantra’s Mkuju River project (Tanzania) is low cost, near term
production, significant potential to increase resources and life of mine.
Recommended