Ash and AWR
Performance
Data Kellyn Pot’Vin
Sr. Technical Consultant
Enkitec

A Little About Me:
Sr. Technical Consultant for Enkitec
Multi-Platform Tuning Specialist
(Lately) EM12c Specialist
Oracle ACE
Training Days Director for RMOUG
Blog at DBAKevlar.com

Brief History ASH= Active Session History
AWR= Automatic Workload Repository
Introduced in Oracle 10g
Evolution to statspack, requests for performance reporting improvements.
“Always on” approach to performance metrics with requirement of non-locking collection process.
Requires Management Tuning Pack License from Oracle.


AWR Repository Used not only by the AWR reports
Automatic Database Diagnostic Monitor, (ADDM Reporting)
SQL Tuning Advisor
Segment Advisor
By default, snapshots every hour. Retention is for 7 days. Both are modifiable.
Snapshots can be taken at any time: EXEC
DBMS_WORKLOAD_REPOSITORY.create_snapshot;

ASH Data Samples each active database session every
second.
Data is held in buffer in memory.
Built into the Oracle kernel and accessed through the v$active_session_history view.
In an AWR snapshot, 1 row in 10 from ASH buffer is placed into the AWR repository.
Managed by the MMNL, (Memory Monitor Lite)
Should not be used to track occurrence.

Running AWR from Enterprise
Manager

Running ASH Report from EM • ASH is always by time, not snapshot.
• Set start date and time.
• End date and time
• Generate report

HTML Format ASH

Running Reports, Command
Line
$ORACLE_HOME/rdbms/admin/awrrpt.sql;
$ORACLE_HOME/rdbms/admin/ashrpt.sql;
$ORACLE_HOME/rdbms/admin/awrsqlrpt.sql;
Less Known AWR Reports:
awrinfo.sql General AWR Info
awrddrpt.sql Comparison report between snapshots
awrblmig.sql Migrates pre-11g baseline data into 11g Baseline tables.
awrgrpt.sql RAC Aware AWR Report.

AWR Info Report
Snapshot Interval Information
Basic Info on Instances and Nodes
No User or Application Schema info.
Space Usage by SYSAUX
WRH$ and Non- AWR Objects, ordered by
size
Snapshot info and if any errors.
Advisor Tasks

AWR Info Report

ASH Info Report, (cont.)

AWR and ASH in Real Life
Scenario
RAC, 2-nodes, Ver. 10.2.0.5
Application Waits Seen in EM
Performance Page.
Out of the ordinary CPU Resource usage
50 minutes of time for evaluation. AWR
set to 10 min. interval on snapshots.

Run AWR for Timeline Shown in
Enterprise Manager
Who needs a top five when the top 2 are so impacting?

Top SQL by Elapsed Time

AWR Segment Info

Next Steps Using ASH
Limiting from a 50 minute/1 hour view to more definitive view of the database a given timeline.
Top SQL
Top Sessions
Top Waits
Blocking Sessions
Top Objects
Waits by time during sample intervals.
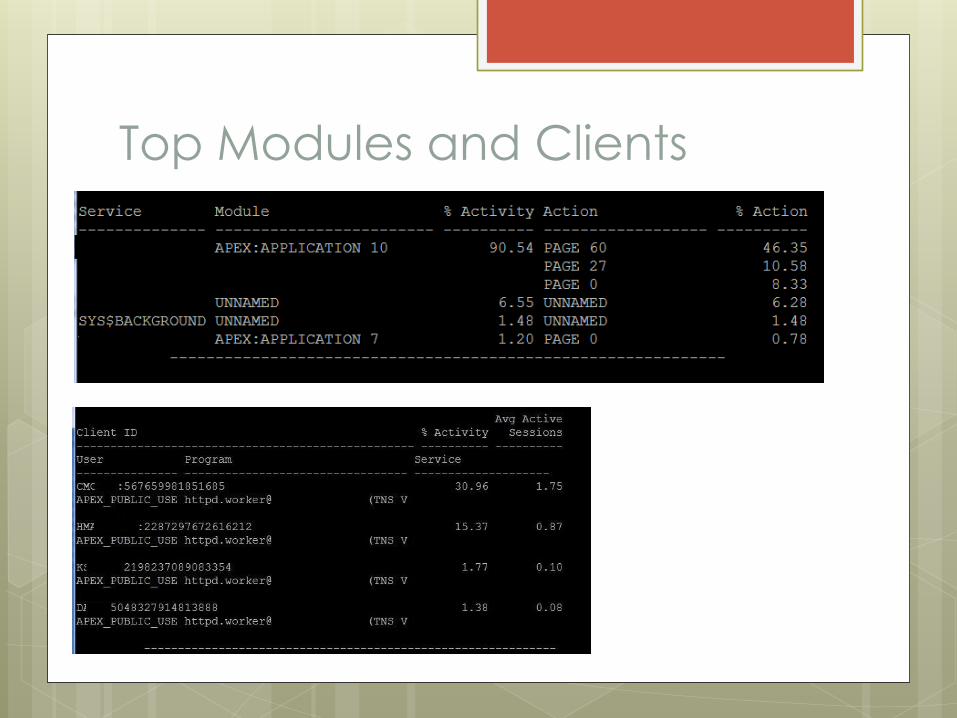
Top Modules and Clients

Top SQL Statements

Blocking Sessions
The Blocking Session, along with Top Object should be noted.

Next Step
Kill Blocking Session?
Investigate Further?
Investigate SQL_ID’s with AWR SQL
Two SQL_ID’s are in question:
4z1vnc0995bm6
b6vaxgxt4wh8v

4z1vnc0995bm6- Update

Update Cont.

B6vaxgxt4wh8v- Select

Select Cont.

Long Story Short….
Subsequent ASH reports showed blocked
sessions became blocking sessions.
Update statement and select belong to same
code. Update is executed, then large select,
no commit until AFTER select is complete.
Request to development to commit before
select and tuning recommendation from
AWR SQL_ID specific report for select
statement.

Querying ASH Data Directly
More defined reporting
No need to pull full report
Detail on waits that are of interest
Join to non-AWR objects
Simple queries presented…

V$ACTIVE_SESSION_HISTORY
• More Column Data in
11g than shown.
• Flags column is for future
development.
• Broken down into usable
sections, easier to query.

Knowing What’s in the ASH
Buffer • Deters from making assumptions on what data is being
queried.
• Know your samples!

Wait Events Across Nodes

Query top
10 SQL_ID’s
in the last
10
minutes?
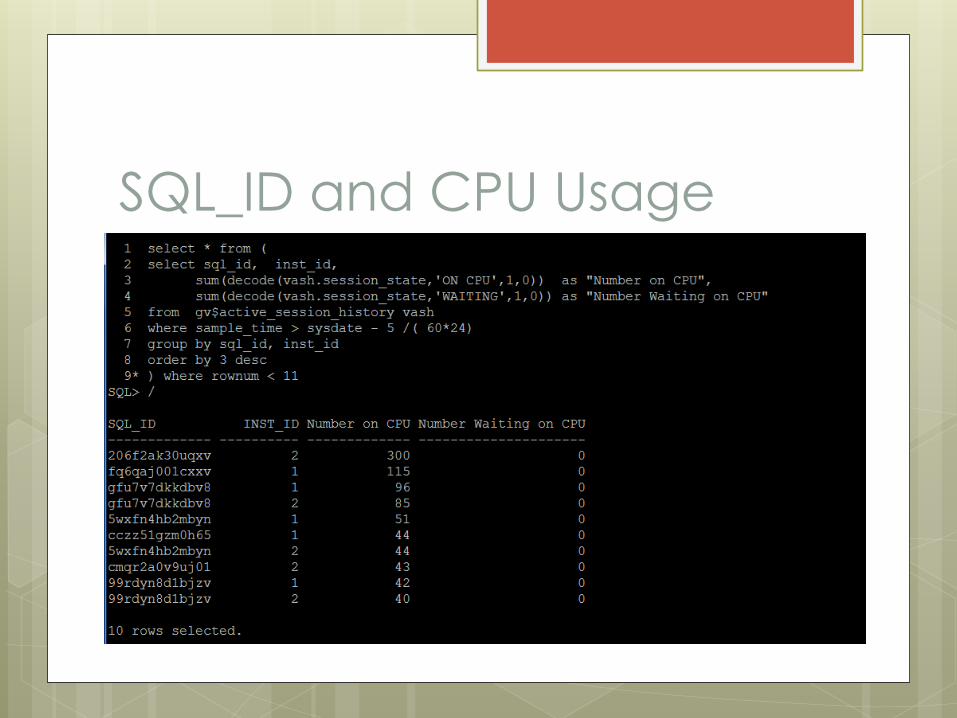
SQL_ID and CPU Usage

IO Waits by Object from ASH

SQL Text with ASH • SQL for most recent five minutes of sample data from ASH

SQL Results • SQL_ID, SQL Text, Sample Time that Process was
captured in.

Tyler Muth ASH Mining Query

ASH Mining Output
Additional Options:
• Physical Read Averages
• Physical Writes, (Max/Averages)
• Redo Info
• Logon Info
• Hard Parsing, etc.
Best Practice When Querying
ASH Data
Keep it Simple and don’t reinvent the wheel.
Samples are an alias for time, not for counts.
Understand what is valuable and compare to
packaged reports.
Be aware on RAC of node specific data.
Take care when querying Obj#, File# and
Block#, (still issues in different versions…)
Check the time that is available in buffer,
don’t assume!

AWR/ASH Links/Blogs
Karl Arao: http://karlarao.wordpress.com
Tyler Muth:
http://tylermuth.wordpress.com/
Kyle Hailey, John Beresniewicz, Graham
Wood: http://ashmasters.com/
Mine- “For the Love of ASH and AWR”
http://dbakevlar.com/2011/02/for-the-
love-of-awr-and-ash/

QUESTIONS
Email: [email protected]
Company: http://enkitec.com
Website: http://dbakevlar.com
User Group: http://www.rmoug.org
Recommended