Conference and Exhibition of the European Association of Virtual and Augmented Reality (2014)G. Zachmann, J. Perret, and A. Amditis (Editors)
Assessment of Virtual Reality Environments for designactivities
Univ. Grenoble Alpes, G-SCOP, F-38000 Grenoble, FranceCNRS, G-SCOP, F-38000 Grenoble, France
AbstractThe aim of this research is the performance assessment of 3D visualization and interaction devices for designactivities. Experiments are expected to determine the virtual environments that best fit the dedicated activities.Classification of technologies is proposed on the basis of its apparent relevance to reach intuitive support tothe design activity but a method to provide a more complete and objective assessment is proposed. To checkthe proposed assessment method, a simple assembly activity has been selected as a use case where the use ofstereoscopic screen versus classical 2D display on one hand and an haptic arm with versus without force feedbackon the other hand must be compared. Experimental measures are performed by the use of objective sensors:duration and gesture instability along the task are tracked. The comparison was done on the assembly of the jigand fixture system. The experimental measures are analysed both with their absolute values and their evolutionwhen training users. This paper is a positioning paper where the intention is to build a framework where moreabstract qualification of virtual environments may be extracted: intuitiveness, tangibility, ergonomic and by theend utility should be the final assessment.
keywords: Virtual Reality, Design, Intuitiveness, Tangibility, Usability, Utility.
1. Introduction
Virtual reality demonstrated applications in professionalfields, especially in design and manufacturing. One criticalpoint is to propose and build virtual environments usefulrather than usable. This paper identifies a process for per-formance assessment of virtual reality (VR) devices whenused for design activities. Designers mainly use CAD sys-tems to create virtual 3D model [EAM*13] and manufac-turing expert use this digital mock-up to assess the man-ufacturing process [CGA*12], but both do not practice somuch virtual reality tools. While virtual environment shouldallow manufacturers and designers to collaborate around themock-up by assembling, disassembling, painting, viewing,and assessing product performance, a low deployment of VRtechnology is observed, due to technology cost but also tothe difficulty to prove the technology added value. That maybe because the technology is not mature enough or becauseit is not perceived as useful. It is thus necessary to go to-wards a performance analysis process. If a lot of studies tryto demonstrate the usability, there are less result about utilityassessment.
Manufacturing industries face a global competition whichleads to a growing pressure about launching new productsin ever shorter cycles especially[TJJ*07] (but not limited to)the automotive and aircraft industries. Virtual reality couldpotentially lead to lower cost [CAM*13], higher qualityproduct, and shorter time-to-market, thus it could improvethe competitiveness [YAN07] of innovative companies. Inthe current study a basic virtual assembly process is used toorganize the assessment process. Virtual assembly processremains one of the key applications in advanced design ofmanufactured [JTR*07] products. It is a promising applica-tion of VR within the manufacturing sector. The study or-ganises an experiment to evaluate the assembly of a systemwith collision detection [DAS09] and kinematics joint con-straints through basic objective criteria: docking finalization,duration of the task and gesture instability. An analysis mod-ule was developed to trace these sensors during a virtual re-ality activity by linking the sensors to specific state valuesof the virtual environment. Four VR configurations for thesame design task were assessed.
But comparison of performance measured by sensors is
c© The Eurographics Association 2014.
C. Trakunsaranakom, P. Marin, and F. Noël
DOI: 10.2312/eurovr.20141336
C. Trakunsaranakom & al. / Assessment of Virtual Reality Environments for design activities
not enough. The basic measures must be consolidated intomore abstract assessment, as intuitiveness [FAS12], tangibil-ity, ergonomic of the virtual environment for the correspond-ing task. It is thus discussed how raw sensor results could bemapped to an abstract assessment level, creating a new clas-sification of devices respect to a design task utility. Such aclassification of technologies may be proposed on the basisof its apparent relevance [Fre12] to reach useful support todesign activities.
2. Use case definition
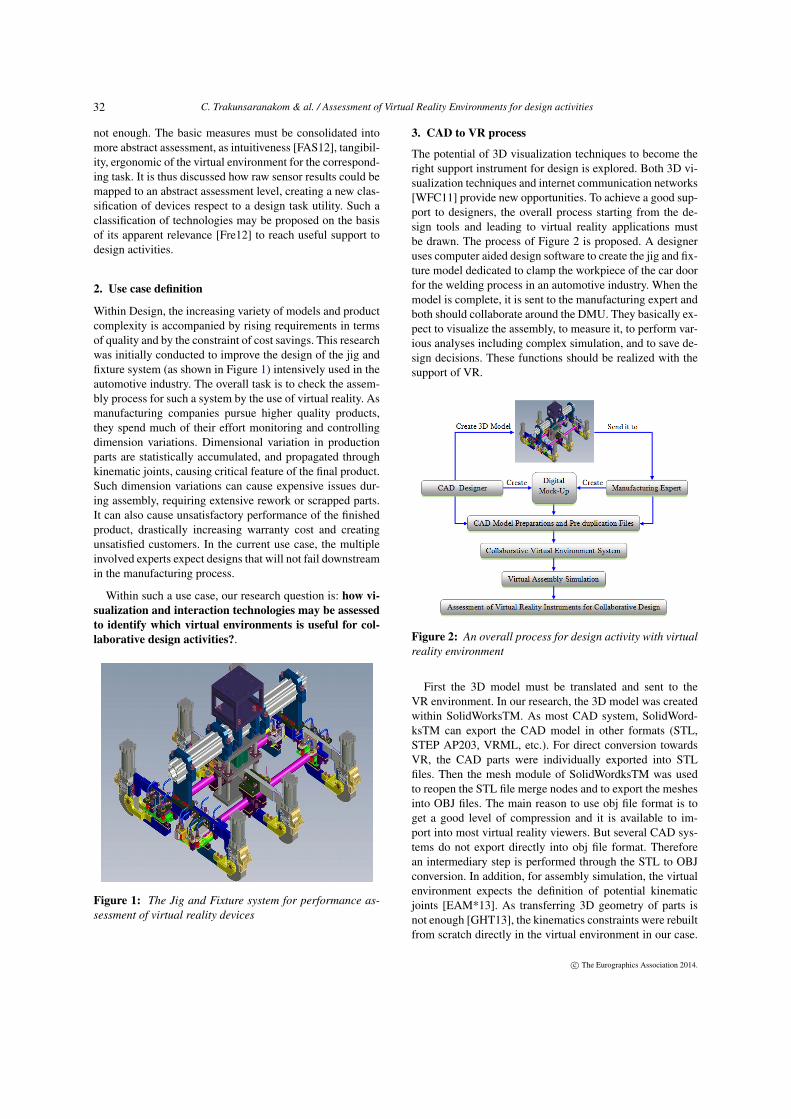
Within Design, the increasing variety of models and productcomplexity is accompanied by rising requirements in termsof quality and by the constraint of cost savings. This researchwas initially conducted to improve the design of the jig andfixture system (as shown in Figure 1) intensively used in theautomotive industry. The overall task is to check the assem-bly process for such a system by the use of virtual reality. Asmanufacturing companies pursue higher quality products,they spend much of their effort monitoring and controllingdimension variations. Dimensional variation in productionparts are statistically accumulated, and propagated throughkinematic joints, causing critical feature of the final product.Such dimension variations can cause expensive issues dur-ing assembly, requiring extensive rework or scrapped parts.It can also cause unsatisfactory performance of the finishedproduct, drastically increasing warranty cost and creatingunsatisfied customers. In the current use case, the multipleinvolved experts expect designs that will not fail downstreamin the manufacturing process.
Within such a use case, our research question is: how vi-sualization and interaction technologies may be assessedto identify which virtual environments is useful for col-laborative design activities?.
Figure 1: The Jig and Fixture system for performance as-sessment of virtual reality devices
3. CAD to VR process
The potential of 3D visualization techniques to become theright support instrument for design is explored. Both 3D vi-sualization techniques and internet communication networks[WFC11] provide new opportunities. To achieve a good sup-port to designers, the overall process starting from the de-sign tools and leading to virtual reality applications mustbe drawn. The process of Figure 2 is proposed. A designeruses computer aided design software to create the jig and fix-ture model dedicated to clamp the workpiece of the car doorfor the welding process in an automotive industry. When themodel is complete, it is sent to the manufacturing expert andboth should collaborate around the DMU. They basically ex-pect to visualize the assembly, to measure it, to perform var-ious analyses including complex simulation, and to save de-sign decisions. These functions should be realized with thesupport of VR.
Figure 2: An overall process for design activity with virtualreality environment
First the 3D model must be translated and sent to theVR environment. In our research, the 3D model was createdwithin SolidWorksTM. As most CAD system, SolidWord-ksTM can export the CAD model in other formats (STL,STEP AP203, VRML, etc.). For direct conversion towardsVR, the CAD parts were individually exported into STLfiles. Then the mesh module of SolidWordksTM was usedto reopen the STL file merge nodes and to export the meshesinto OBJ files. The main reason to use obj file format is toget a good level of compression and it is available to im-port into most virtual reality viewers. But several CAD sys-tems do not export directly into obj file format. Thereforean intermediary step is performed through the STL to OBJconversion. In addition, for assembly simulation, the virtualenvironment expects the definition of potential kinematicjoints [EAM*13]. As transferring 3D geometry of parts isnot enough [GHT13], the kinematics constraints were rebuiltfrom scratch directly in the virtual environment in our case.
c© The Eurographics Association 2014.
32
C. Trakunsaranakom & al. / Assessment of Virtual Reality Environments for design activities
Some works are made to automate this process and to makeit transparent for designers. Here it is just considered thateach part is represented by a single polyhedron in the virtualreality environment, and that the assembly refers to poten-tial kinematic joints which can be activated when parts areproperly aligned.
4. Experimentation framework
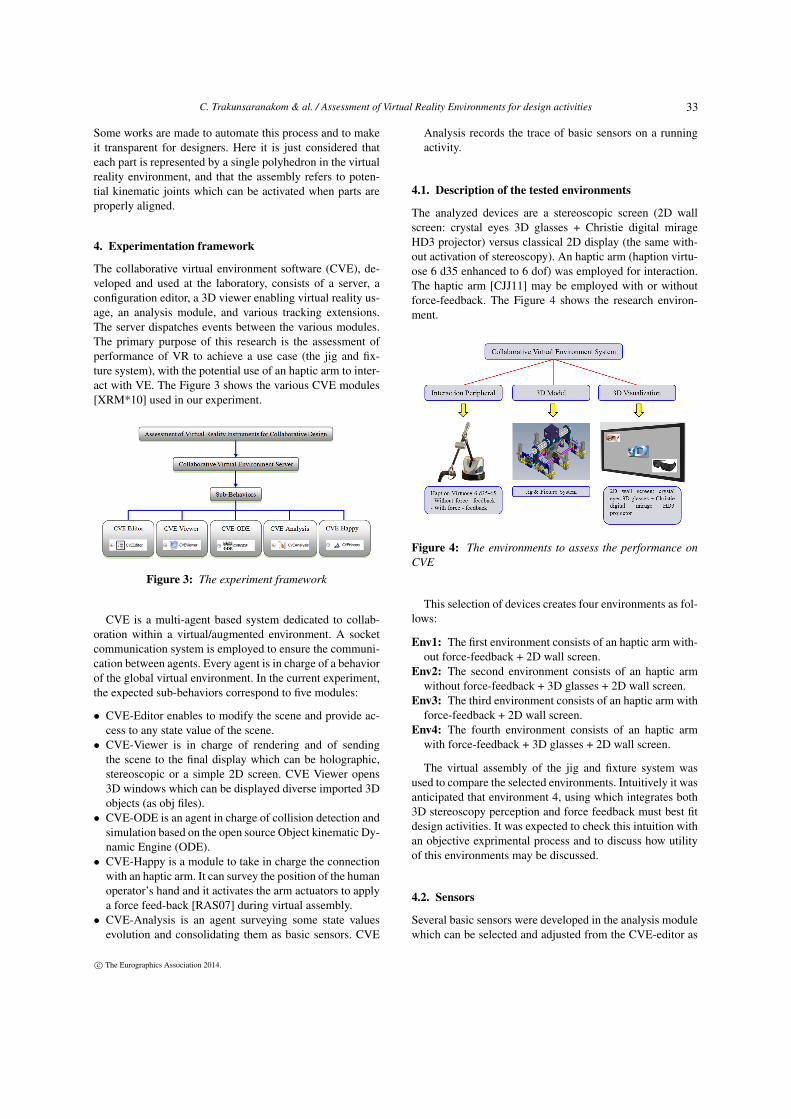
The collaborative virtual environment software (CVE), de-veloped and used at the laboratory, consists of a server, aconfiguration editor, a 3D viewer enabling virtual reality us-age, an analysis module, and various tracking extensions.The server dispatches events between the various modules.The primary purpose of this research is the assessment ofperformance of VR to achieve a use case (the jig and fix-ture system), with the potential use of an haptic arm to inter-act with VE. The Figure 3 shows the various CVE modules[XRM*10] used in our experiment.
Figure 3: The experiment framework
CVE is a multi-agent based system dedicated to collab-oration within a virtual/augmented environment. A socketcommunication system is employed to ensure the communi-cation between agents. Every agent is in charge of a behaviorof the global virtual environment. In the current experiment,the expected sub-behaviors correspond to five modules:
• CVE-Editor enables to modify the scene and provide ac-cess to any state value of the scene.
• CVE-Viewer is in charge of rendering and of sendingthe scene to the final display which can be holographic,stereoscopic or a simple 2D screen. CVE Viewer opens3D windows which can be displayed diverse imported 3Dobjects (as obj files).
• CVE-ODE is an agent in charge of collision detection andsimulation based on the open source Object kinematic Dy-namic Engine (ODE).
• CVE-Happy is a module to take in charge the connectionwith an haptic arm. It can survey the position of the humanoperator’s hand and it activates the arm actuators to applya force feed-back [RAS07] during virtual assembly.
• CVE-Analysis is an agent surveying some state valuesevolution and consolidating them as basic sensors. CVE
Analysis records the trace of basic sensors on a runningactivity.
4.1. Description of the tested environments
The analyzed devices are a stereoscopic screen (2D wallscreen: crystal eyes 3D glasses + Christie digital mirageHD3 projector) versus classical 2D display (the same with-out activation of stereoscopy). An haptic arm (haption virtu-ose 6 d35 enhanced to 6 dof) was employed for interaction.The haptic arm [CJJ11] may be employed with or withoutforce-feedback. The Figure 4 shows the research environ-ment.
Figure 4: The environments to assess the performance onCVE
This selection of devices creates four environments as fol-lows:
Env1: The first environment consists of an haptic arm with-out force-feedback + 2D wall screen.
Env2: The second environment consists of an haptic armwithout force-feedback + 3D glasses + 2D wall screen.
Env3: The third environment consists of an haptic arm withforce-feedback + 2D wall screen.
Env4: The fourth environment consists of an haptic armwith force-feedback + 3D glasses + 2D wall screen.
The virtual assembly of the jig and fixture system wasused to compare the selected environments. Intuitively it wasanticipated that environment 4, using which integrates both3D stereoscopy perception and force feedback must best fitdesign activities. It was expected to check this intuition withan objective exprimental process and to discuss how utilityof this environments may be discussed.
4.2. Sensors
Several basic sensors were developed in the analysis modulewhich can be selected and adjusted from the CVE-editor as
c© The Eurographics Association 2014.
33
C. Trakunsaranakom & al. / Assessment of Virtual Reality Environments for design activities
Figure 5: The sensors in CVE Analysis on the CVE
illustrated in Figure 5. As a first step, in the current experi-ment, two sensors have been employed: the "duration" and"un-stability" sensors.
"Duration" sensor records the overall duration of a task:the interval of the time between the event launching the anal-ysis and the event stopping the analysis.
"Un-Stability" sensor evaluates the gesture instability.The position of two points in a frame defined by a trans-formation matrix is permanently analyzed. The trajectory ofthese points is linearized by small intervals of time and thesensors compare the real path length of the point respect-ing to the linearized trajectory per interval. The ratio givesan idea of the oscillation of the trajectory around a moreefficient path. It depicts the gesture shivers. This ratio isrecorded by the analysis module for every conducted exper-iments.
A task can be defined, processed and repeated severaltimes. A file records the raw result of these basic sensors.
Figure 6: The participants work in a comfortable stand pos-tures
5. Experimentation description
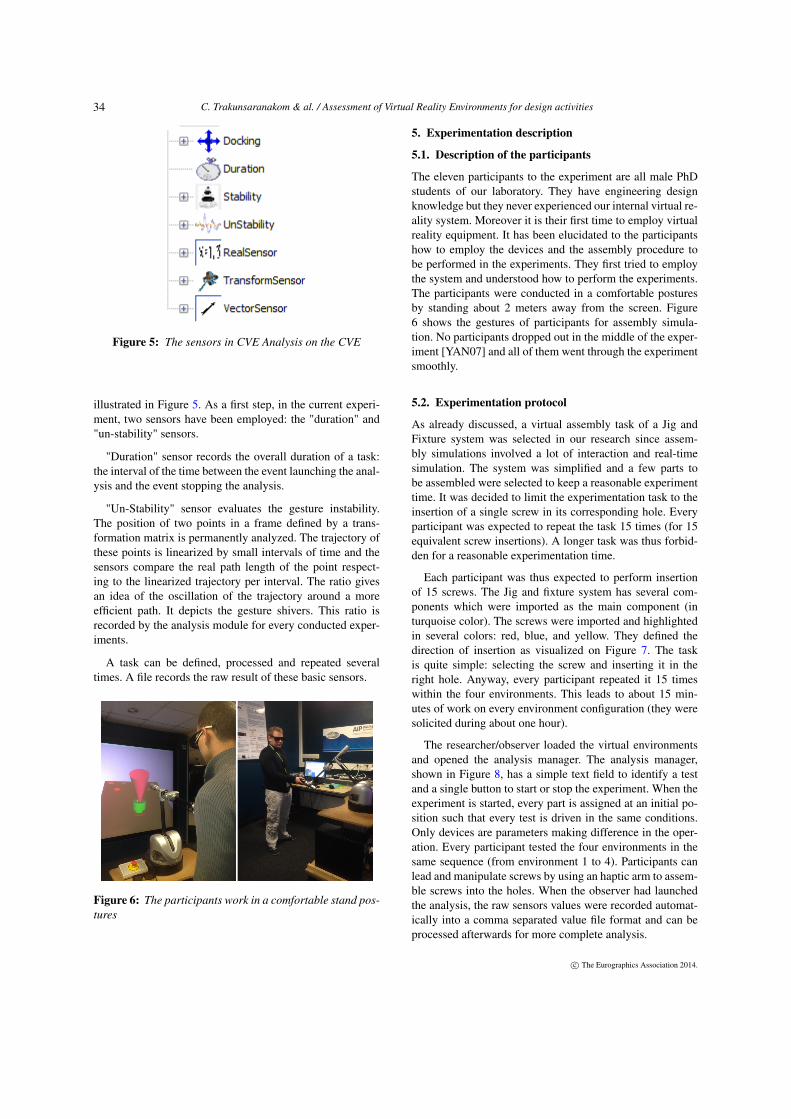
5.1. Description of the participants
The eleven participants to the experiment are all male PhDstudents of our laboratory. They have engineering designknowledge but they never experienced our internal virtual re-ality system. Moreover it is their first time to employ virtualreality equipment. It has been elucidated to the participantshow to employ the devices and the assembly procedure tobe performed in the experiments. They first tried to employthe system and understood how to perform the experiments.The participants were conducted in a comfortable posturesby standing about 2 meters away from the screen. Figure6 shows the gestures of participants for assembly simula-tion. No participants dropped out in the middle of the exper-iment [YAN07] and all of them went through the experimentsmoothly.
5.2. Experimentation protocol
As already discussed, a virtual assembly task of a Jig andFixture system was selected in our research since assem-bly simulations involved a lot of interaction and real-timesimulation. The system was simplified and a few parts tobe assembled were selected to keep a reasonable experimenttime. It was decided to limit the experimentation task to theinsertion of a single screw in its corresponding hole. Everyparticipant was expected to repeat the task 15 times (for 15equivalent screw insertions). A longer task was thus forbid-den for a reasonable experimentation time.
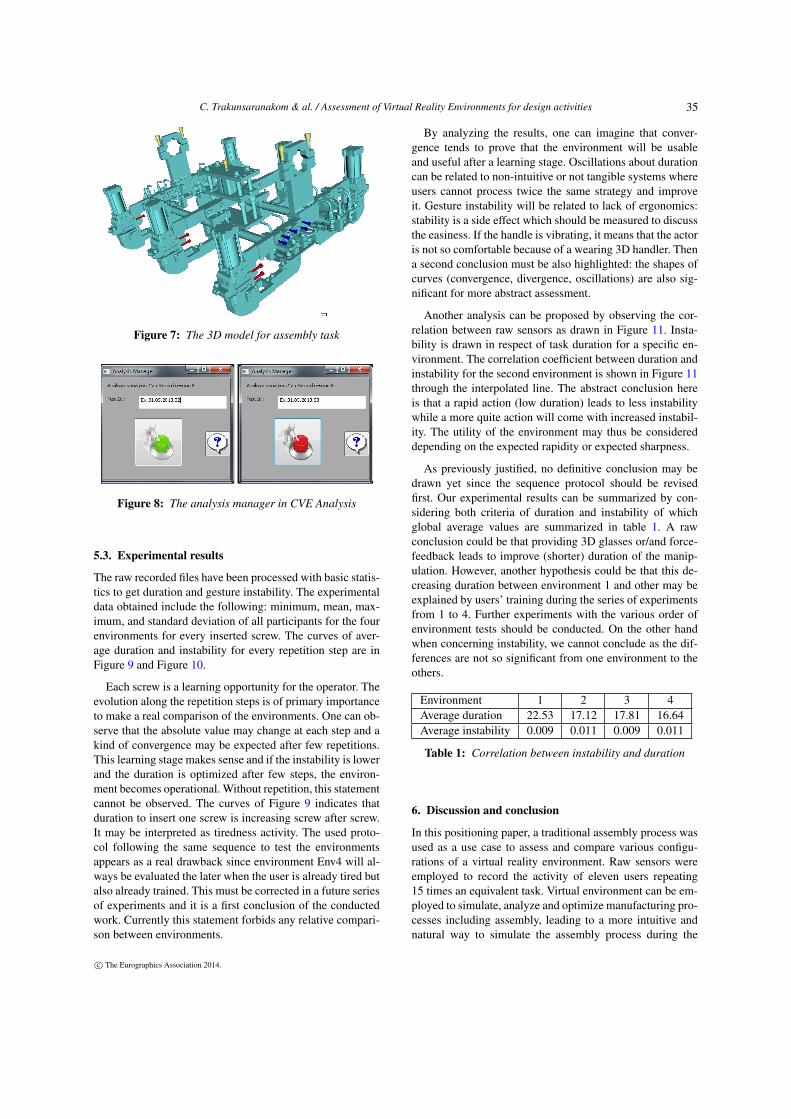
Each participant was thus expected to perform insertionof 15 screws. The Jig and fixture system has several com-ponents which were imported as the main component (inturquoise color). The screws were imported and highlightedin several colors: red, blue, and yellow. They defined thedirection of insertion as visualized on Figure 7. The taskis quite simple: selecting the screw and inserting it in theright hole. Anyway, every participant repeated it 15 timeswithin the four environments. This leads to about 15 min-utes of work on every environment configuration (they weresolicited during about one hour).
The researcher/observer loaded the virtual environmentsand opened the analysis manager. The analysis manager,shown in Figure 8, has a simple text field to identify a testand a single button to start or stop the experiment. When theexperiment is started, every part is assigned at an initial po-sition such that every test is driven in the same conditions.Only devices are parameters making difference in the oper-ation. Every participant tested the four environments in thesame sequence (from environment 1 to 4). Participants canlead and manipulate screws by using an haptic arm to assem-ble screws into the holes. When the observer had launchedthe analysis, the raw sensors values were recorded automat-ically into a comma separated value file format and can beprocessed afterwards for more complete analysis.
c© The Eurographics Association 2014.
34
C. Trakunsaranakom & al. / Assessment of Virtual Reality Environments for design activities
Figure 7: The 3D model for assembly task
Figure 8: The analysis manager in CVE Analysis
5.3. Experimental results
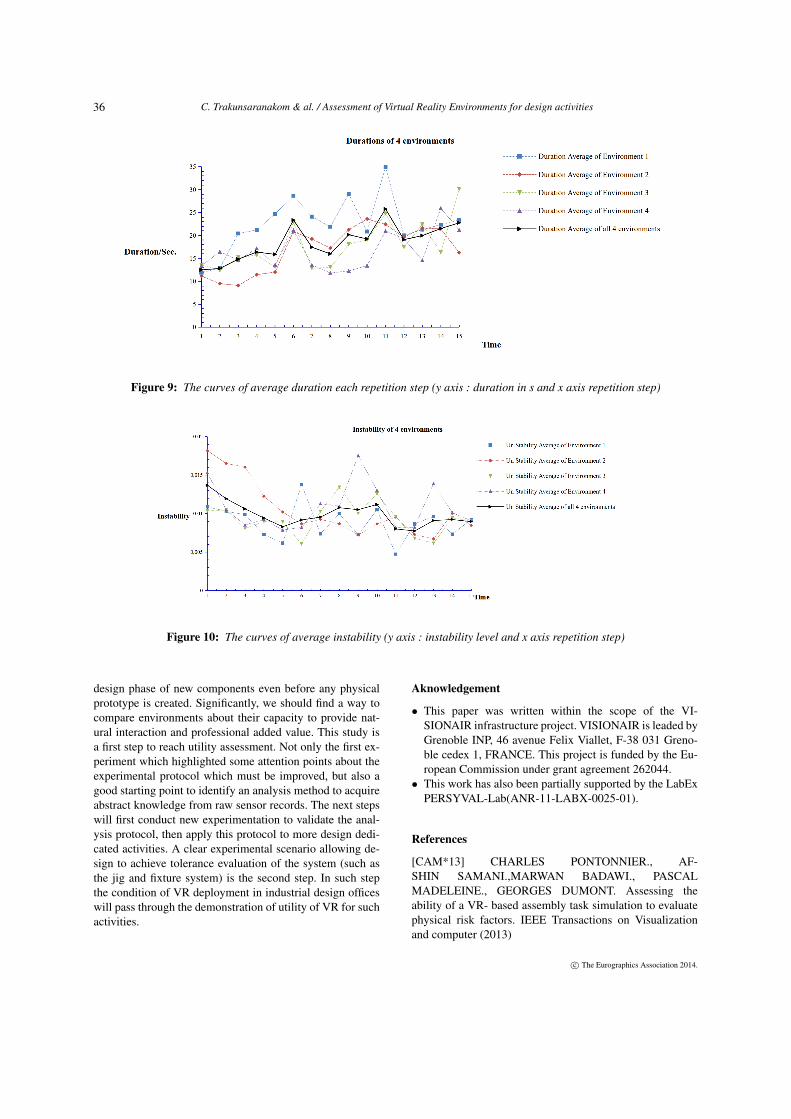
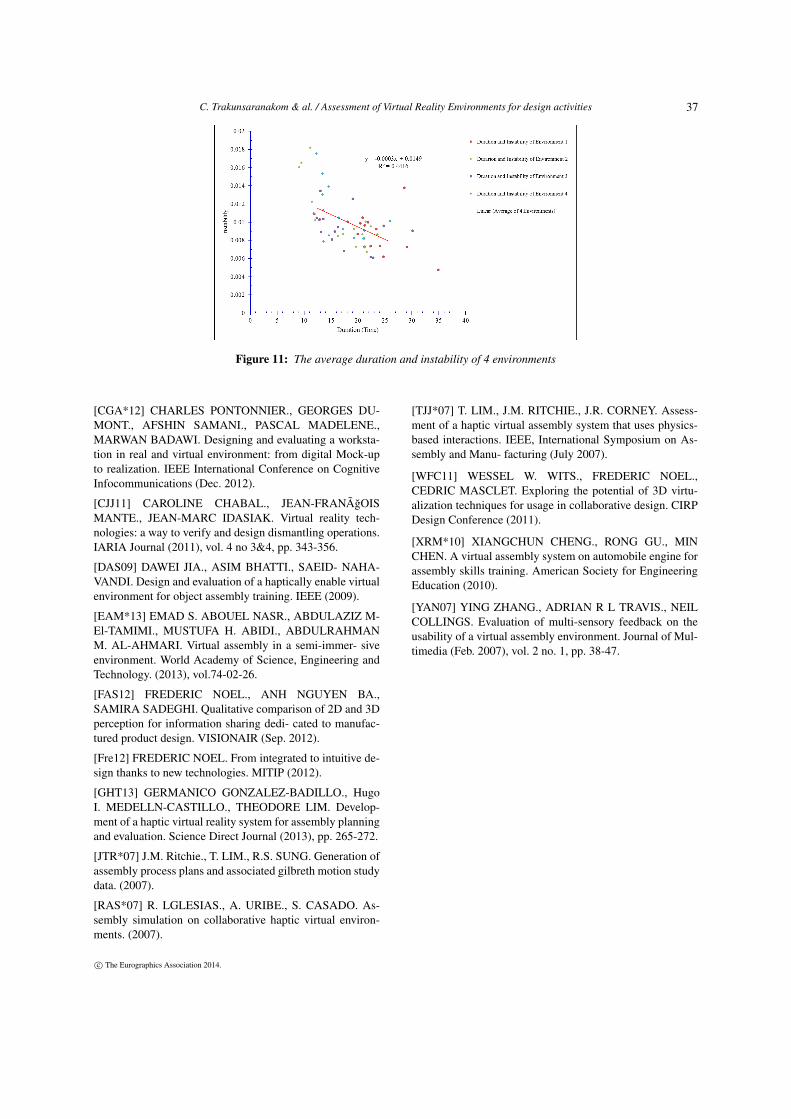
The raw recorded files have been processed with basic statis-tics to get duration and gesture instability. The experimentaldata obtained include the following: minimum, mean, max-imum, and standard deviation of all participants for the fourenvironments for every inserted screw. The curves of aver-age duration and instability for every repetition step are inFigure 9 and Figure 10.
Each screw is a learning opportunity for the operator. Theevolution along the repetition steps is of primary importanceto make a real comparison of the environments. One can ob-serve that the absolute value may change at each step and akind of convergence may be expected after few repetitions.This learning stage makes sense and if the instability is lowerand the duration is optimized after few steps, the environ-ment becomes operational. Without repetition, this statementcannot be observed. The curves of Figure 9 indicates thatduration to insert one screw is increasing screw after screw.It may be interpreted as tiredness activity. The used proto-col following the same sequence to test the environmentsappears as a real drawback since environment Env4 will al-ways be evaluated the later when the user is already tired butalso already trained. This must be corrected in a future seriesof experiments and it is a first conclusion of the conductedwork. Currently this statement forbids any relative compari-son between environments.
By analyzing the results, one can imagine that conver-gence tends to prove that the environment will be usableand useful after a learning stage. Oscillations about durationcan be related to non-intuitive or not tangible systems whereusers cannot process twice the same strategy and improveit. Gesture instability will be related to lack of ergonomics:stability is a side effect which should be measured to discussthe easiness. If the handle is vibrating, it means that the actoris not so comfortable because of a wearing 3D handler. Thena second conclusion must be also highlighted: the shapes ofcurves (convergence, divergence, oscillations) are also sig-nificant for more abstract assessment.
Another analysis can be proposed by observing the cor-relation between raw sensors as drawn in Figure 11. Insta-bility is drawn in respect of task duration for a specific en-vironment. The correlation coefficient between duration andinstability for the second environment is shown in Figure 11through the interpolated line. The abstract conclusion hereis that a rapid action (low duration) leads to less instabilitywhile a more quite action will come with increased instabil-ity. The utility of the environment may thus be considereddepending on the expected rapidity or expected sharpness.
As previously justified, no definitive conclusion may bedrawn yet since the sequence protocol should be revisedfirst. Our experimental results can be summarized by con-sidering both criteria of duration and instability of whichglobal average values are summarized in table 1. A rawconclusion could be that providing 3D glasses or/and force-feedback leads to improve (shorter) duration of the manip-ulation. However, another hypothesis could be that this de-creasing duration between environment 1 and other may beexplained by users’ training during the series of experimentsfrom 1 to 4. Further experiments with the various order ofenvironment tests should be conducted. On the other handwhen concerning instability, we cannot conclude as the dif-ferences are not so significant from one environment to theothers.
Environment 1 2 3 4Average duration 22.53 17.12 17.81 16.64Average instability 0.009 0.011 0.009 0.011
Table 1: Correlation between instability and duration
6. Discussion and conclusion
In this positioning paper, a traditional assembly process wasused as a use case to assess and compare various configu-rations of a virtual reality environment. Raw sensors wereemployed to record the activity of eleven users repeating15 times an equivalent task. Virtual environment can be em-ployed to simulate, analyze and optimize manufacturing pro-cesses including assembly, leading to a more intuitive andnatural way to simulate the assembly process during the
c© The Eurographics Association 2014.
35
C. Trakunsaranakom & al. / Assessment of Virtual Reality Environments for design activities
Figure 9: The curves of average duration each repetition step (y axis : duration in s and x axis repetition step)
Figure 10: The curves of average instability (y axis : instability level and x axis repetition step)
design phase of new components even before any physicalprototype is created. Significantly, we should find a way tocompare environments about their capacity to provide nat-ural interaction and professional added value. This study isa first step to reach utility assessment. Not only the first ex-periment which highlighted some attention points about theexperimental protocol which must be improved, but also agood starting point to identify an analysis method to acquireabstract knowledge from raw sensor records. The next stepswill first conduct new experimentation to validate the anal-ysis protocol, then apply this protocol to more design dedi-cated activities. A clear experimental scenario allowing de-sign to achieve tolerance evaluation of the system (such asthe jig and fixture system) is the second step. In such stepthe condition of VR deployment in industrial design officeswill pass through the demonstration of utility of VR for suchactivities.
Aknowledgement
• This paper was written within the scope of the VI-SIONAIR infrastructure project. VISIONAIR is leaded byGrenoble INP, 46 avenue Felix Viallet, F-38 031 Greno-ble cedex 1, FRANCE. This project is funded by the Eu-ropean Commission under grant agreement 262044.
• This work has also been partially supported by the LabExPERSYVAL-Lab(ANR-11-LABX-0025-01).
References
[CAM*13] CHARLES PONTONNIER., AF-SHIN SAMANI.,MARWAN BADAWI., PASCALMADELEINE., GEORGES DUMONT. Assessing theability of a VR- based assembly task simulation to evaluatephysical risk factors. IEEE Transactions on Visualizationand computer (2013)
c© The Eurographics Association 2014.
36
C. Trakunsaranakom & al. / Assessment of Virtual Reality Environments for design activities
Figure 11: The average duration and instability of 4 environments
[CGA*12] CHARLES PONTONNIER., GEORGES DU-MONT., AFSHIN SAMANI., PASCAL MADELENE.,MARWAN BADAWI. Designing and evaluating a worksta-tion in real and virtual environment: from digital Mock-upto realization. IEEE International Conference on CognitiveInfocommunications (Dec. 2012).
[CJJ11] CAROLINE CHABAL., JEAN-FRANÃgOISMANTE., JEAN-MARC IDASIAK. Virtual reality tech-nologies: a way to verify and design dismantling operations.IARIA Journal (2011), vol. 4 no 3&4, pp. 343-356.
[DAS09] DAWEI JIA., ASIM BHATTI., SAEID- NAHA-VANDI. Design and evaluation of a haptically enable virtualenvironment for object assembly training. IEEE (2009).
[EAM*13] EMAD S. ABOUEL NASR., ABDULAZIZ M-El-TAMIMI., MUSTUFA H. ABIDI., ABDULRAHMANM. AL-AHMARI. Virtual assembly in a semi-immer- siveenvironment. World Academy of Science, Engineering andTechnology. (2013), vol.74-02-26.
[FAS12] FREDERIC NOEL., ANH NGUYEN BA.,SAMIRA SADEGHI. Qualitative comparison of 2D and 3Dperception for information sharing dedi- cated to manufac-tured product design. VISIONAIR (Sep. 2012).
[Fre12] FREDERIC NOEL. From integrated to intuitive de-sign thanks to new technologies. MITIP (2012).
[GHT13] GERMANICO GONZALEZ-BADILLO., HugoI. MEDELLN-CASTILLO., THEODORE LIM. Develop-ment of a haptic virtual reality system for assembly planningand evaluation. Science Direct Journal (2013), pp. 265-272.
[JTR*07] J.M. Ritchie., T. LIM., R.S. SUNG. Generation ofassembly process plans and associated gilbreth motion studydata. (2007).
[RAS*07] R. LGLESIAS., A. URIBE., S. CASADO. As-sembly simulation on collaborative haptic virtual environ-ments. (2007).
[TJJ*07] T. LIM., J.M. RITCHIE., J.R. CORNEY. Assess-ment of a haptic virtual assembly system that uses physics-based interactions. IEEE, International Symposium on As-sembly and Manu- facturing (July 2007).
[WFC11] WESSEL W. WITS., FREDERIC NOEL.,CEDRIC MASCLET. Exploring the potential of 3D virtu-alization techniques for usage in collaborative design. CIRPDesign Conference (2011).
[XRM*10] XIANGCHUN CHENG., RONG GU., MINCHEN. A virtual assembly system on automobile engine forassembly skills training. American Society for EngineeringEducation (2010).
[YAN07] YING ZHANG., ADRIAN R L TRAVIS., NEILCOLLINGS. Evaluation of multi-sensory feedback on theusability of a virtual assembly environment. Journal of Mul-timedia (Feb. 2007), vol. 2 no. 1, pp. 38-47.
c© The Eurographics Association 2014.
37
Recommended


![City Ads: Embedding Virtual Worlds and Augmented Reality ...€¦ · 3D Virtual Worlds (3DVWs) and Augmented Reality (AR) are immersive environments [Dede 2009] that have been explored](https://img.pdfslide.net/doc/110x75/5f1c97fc321a4e3ba301b740/city-ads-embedding-virtual-worlds-and-augmented-reality-3d-virtual-worlds-3dvws.jpg)