Technical Analysis
A beginner application to current market situation
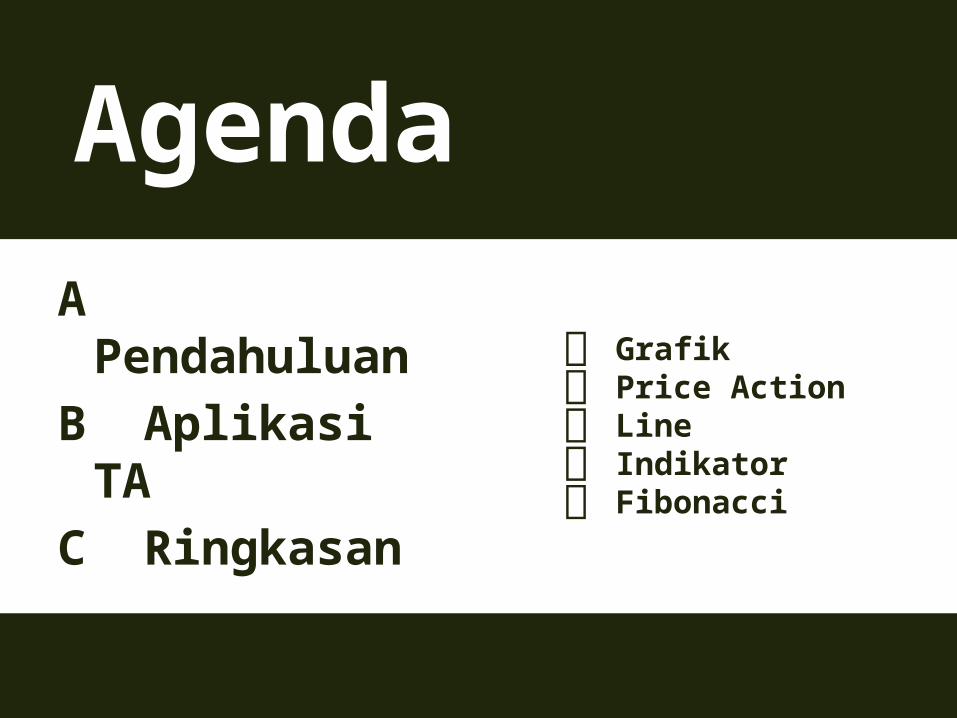
Agenda
A PendahuluanB Aplikasi TAC Ringkasan
๏ Grafik ๏ Price Action ๏ Line ๏ Indikator ๏ Fibonacci

A. Perkenalan TA
1. Dapatkah Anda mengenali tanda hujan sebelum turun?
2. Kapan musim hujan akan tiba? Dan berapa lama akan bertahan?
3
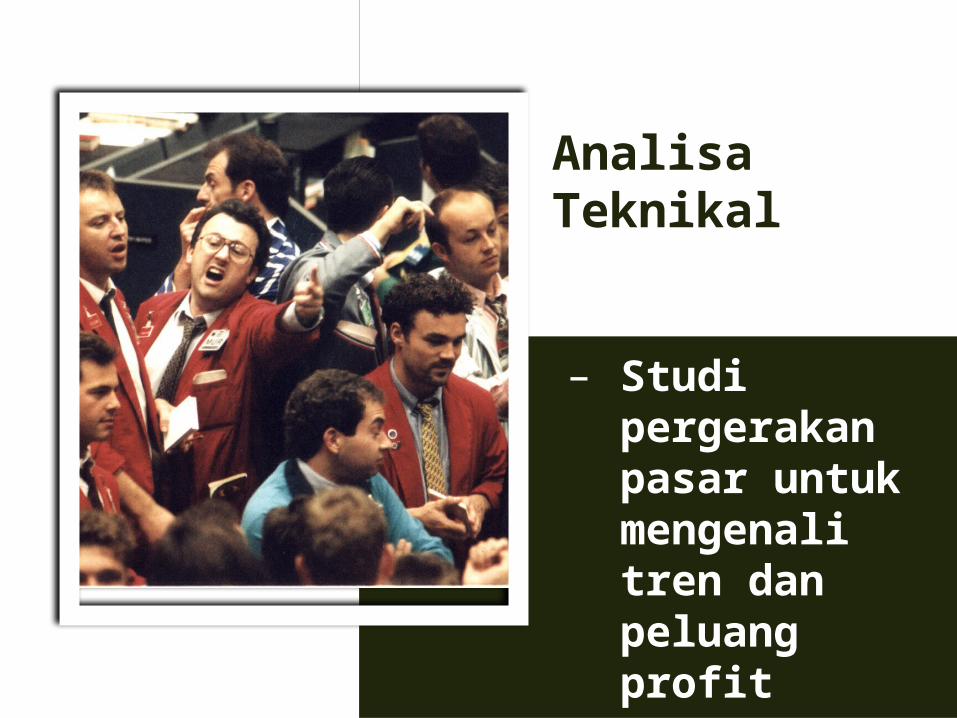
Analisa Teknikal
– Studi pergerakan pasar untuk mengenali tren dan peluang profit
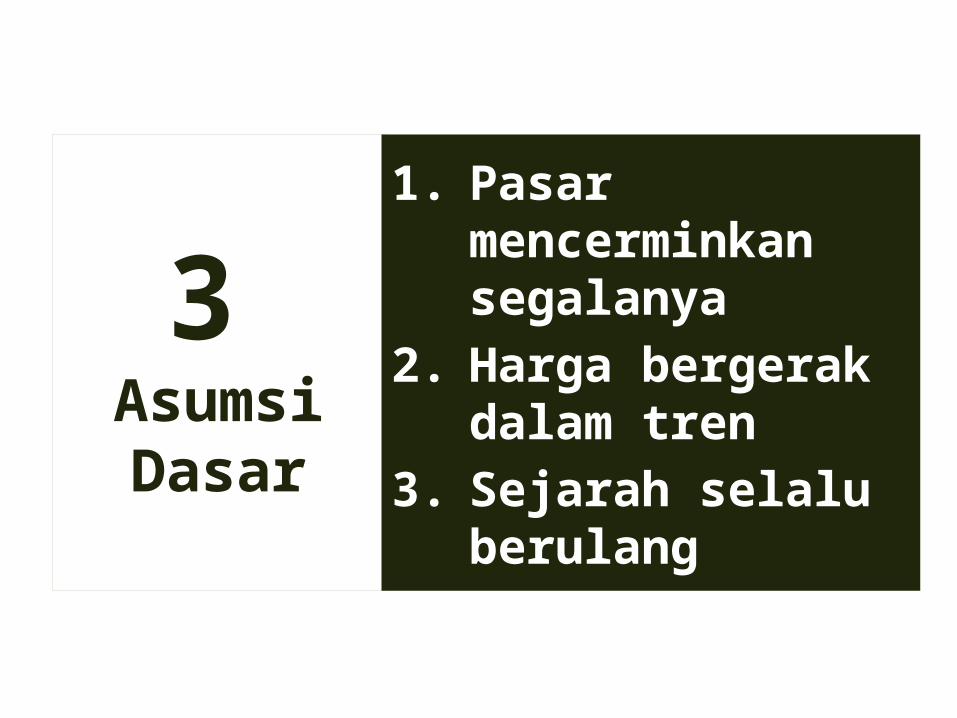
3 AsumsiDasar
1. Pasar mencerminkan segalanya
2. Harga bergerak dalam tren
3. Sejarah selalu berulang
• Identifikasi tren dan kualitasnya• Identifikasi spesifik level entry dan exit
“Membantu penyusunan sistem trading”
Manfaat Analisa Teknikal
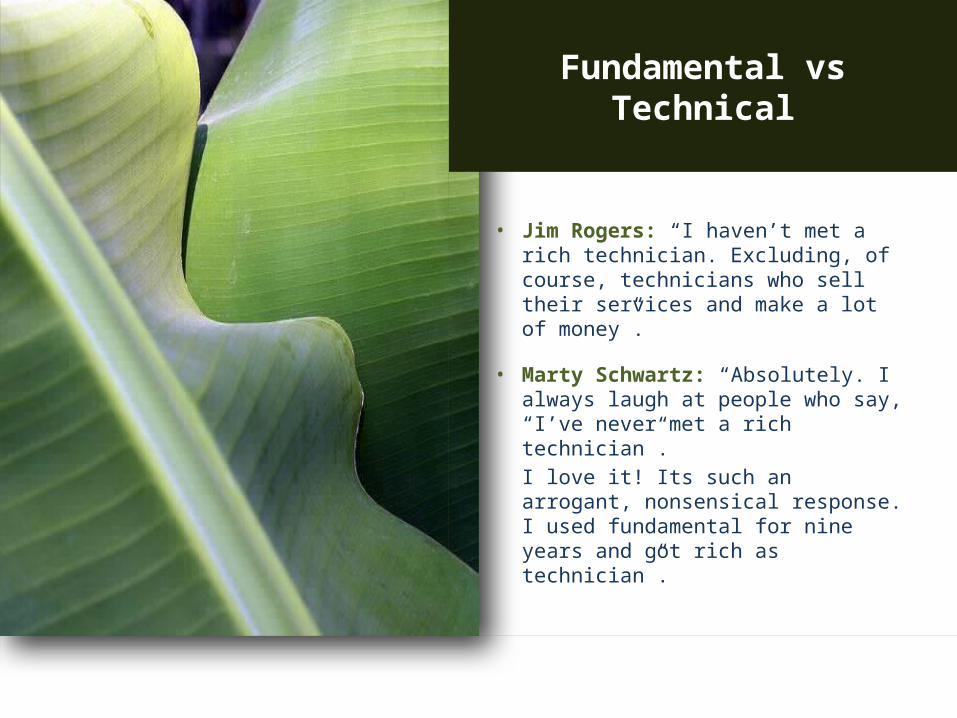
Fundamental vs Technical
• Jim Rogers: “I haven’t met a rich technician. Excluding, of course, technicians who sell their services and make a lot of money”.
• Marty Schwartz: “Absolutely. I always laugh at people who say, “I’ve never met a rich technician”. I love it! Its such an arrogant, nonsensical response. I used fundamental for nine years and got rich as technician”.
A – Selesai
Q & A…Perbedaan dengan analisa fundamental?
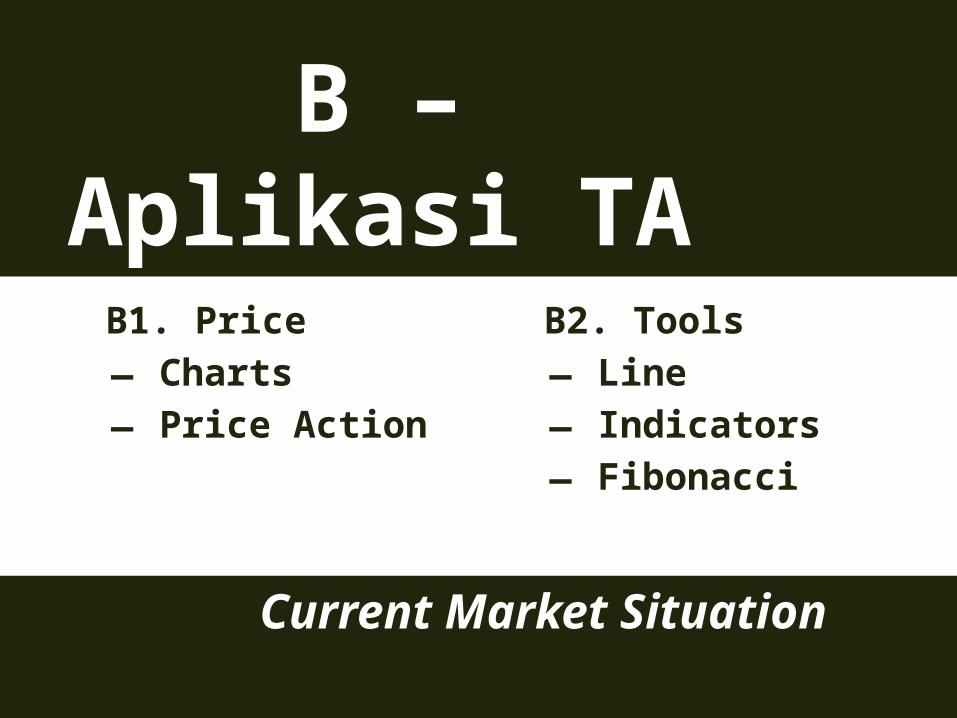
B – Aplikasi TAB1. Price– Charts – Price Action
B2. Tools– Line – Indicators – Fibonacci
Current Market Situation
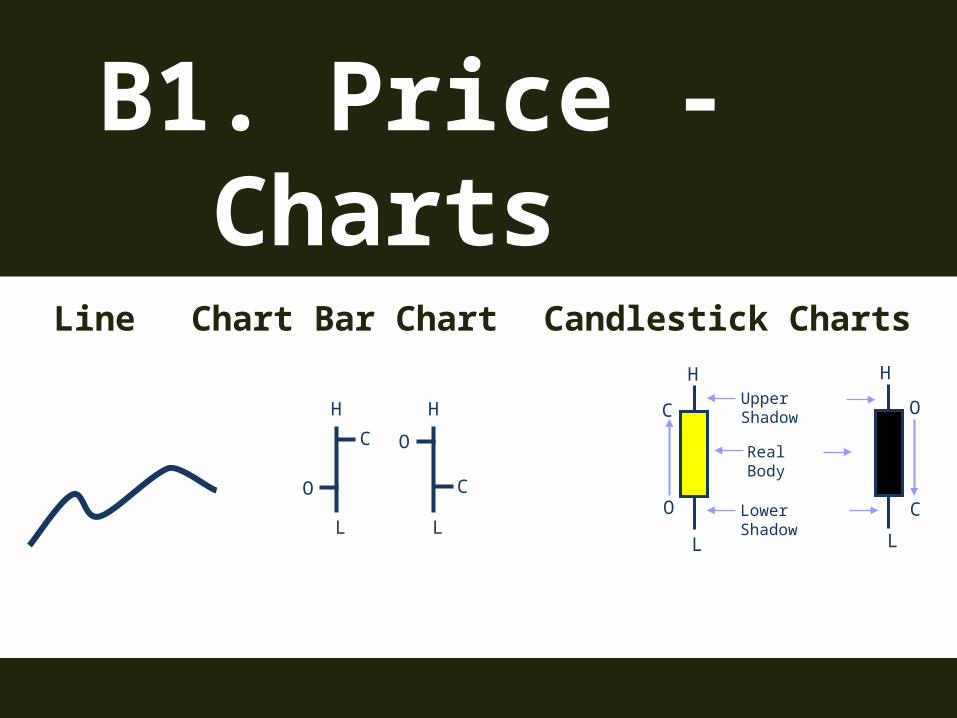
B1. Price - Charts Line Chart Bar Chart Candlestick Charts
O
H
L
C O
H
L
C
C
O
L
H
O
C
L
HUpper Shadow
Lower Shadow
Real Body
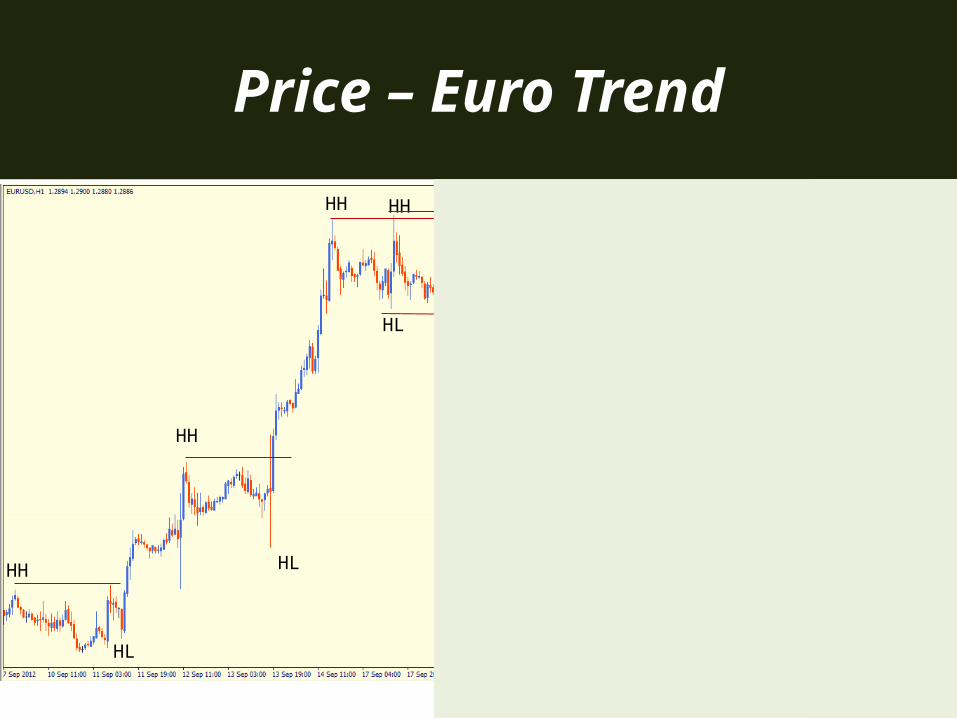
Price – Euro Trend
HH
HL
HH
HL
HH
HL
HH
LL
LH
LL
LH
LL
LH
LL
LH
LL
HH
LL
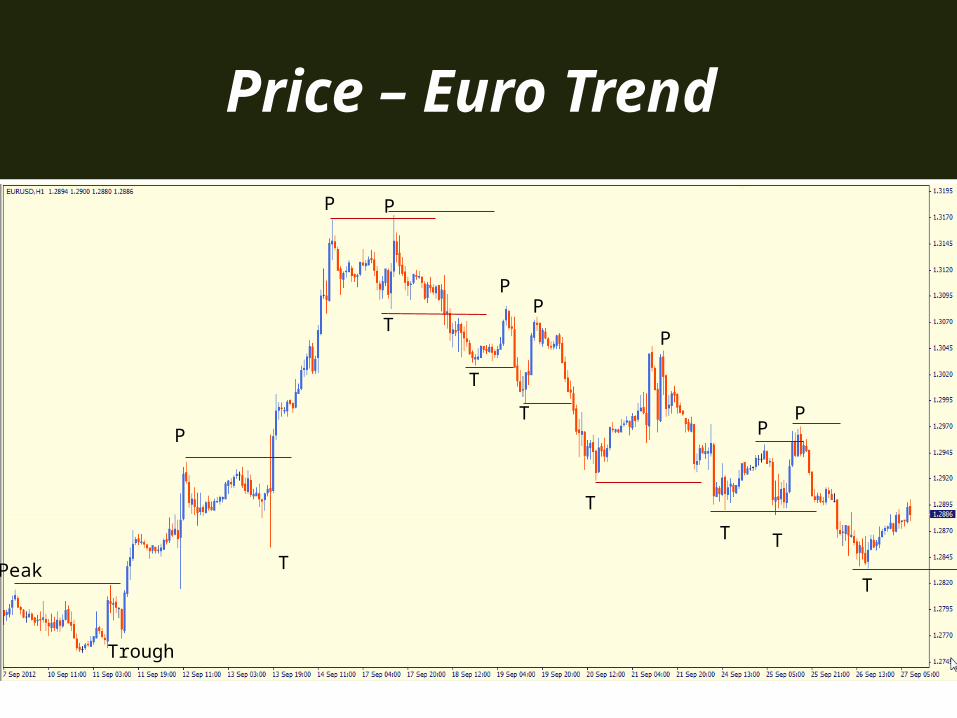
Price – Euro Trend
Peak
Trough
P
T
P
T
P
T
P
T
P
T
P
T
P
T
P
T
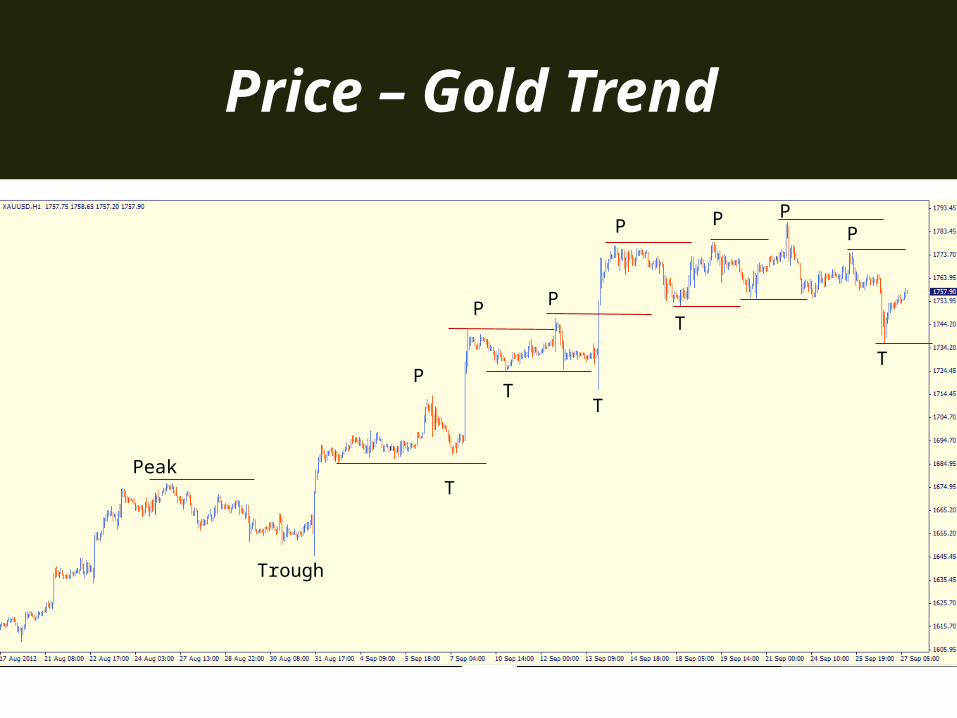
Price – Gold Trend
Peak
Trough
P
T
P
T
P
T
P
T
PP
T
P
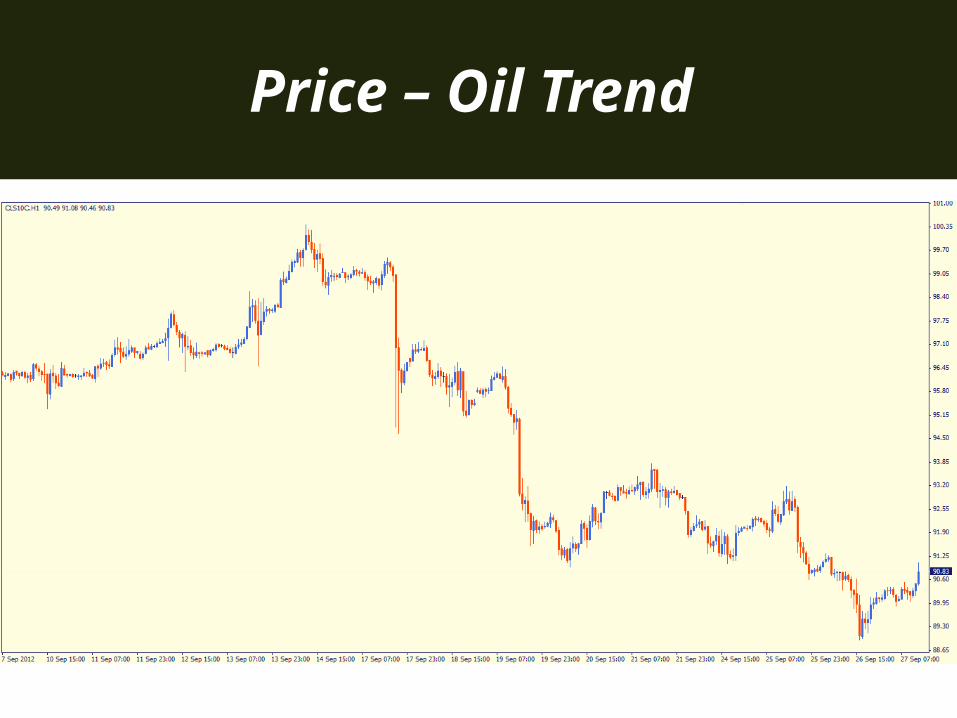
Price – Oil Trend
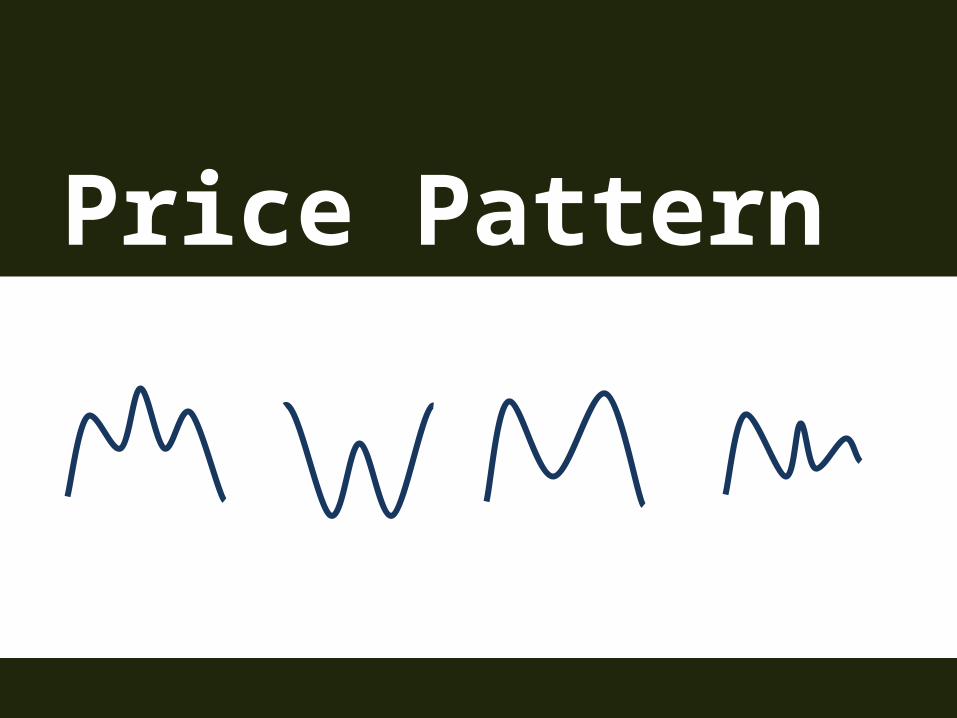
Price Pattern
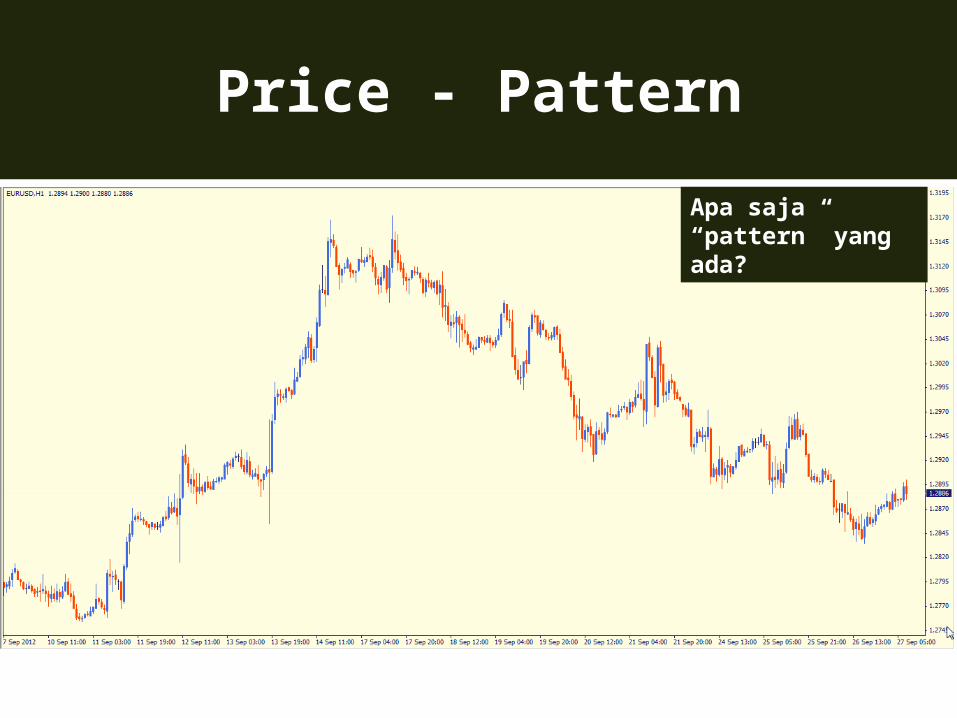
Price - Pattern
Apa saja “pattern” yang ada?
B1 – Selesai
Q & A…Membaca grafik?
B2. Tools TA– Line – Indicators – Fibonacci
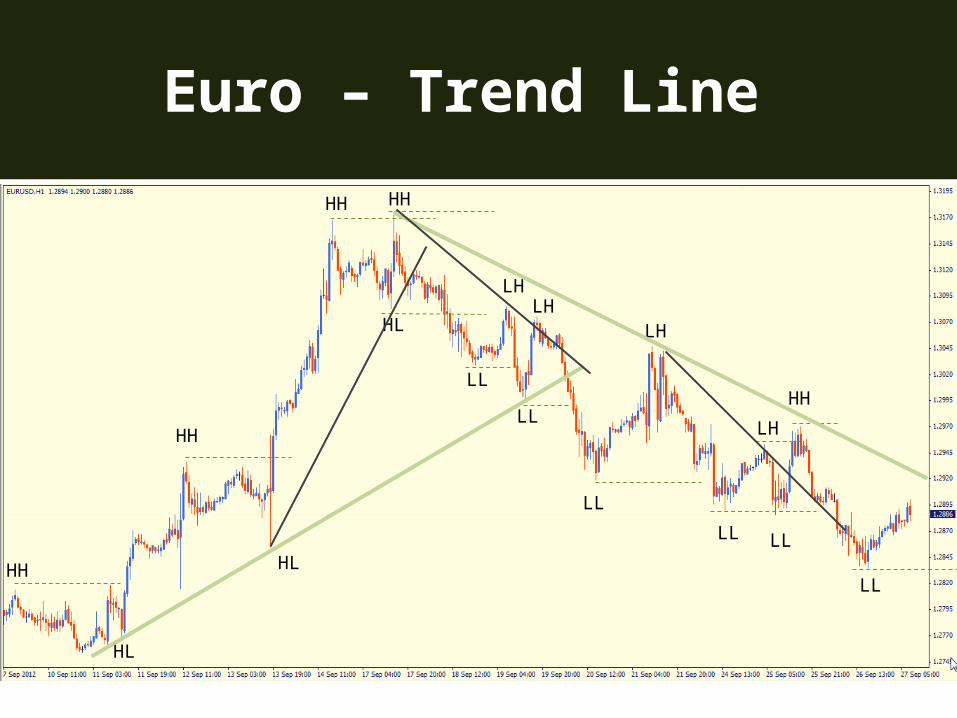
Euro – Trend Line
HH
HL
HH
HL
HH
HL
HH
LL
LH
LL
LH
LL
LH
LL
LH
LL
HH
LL
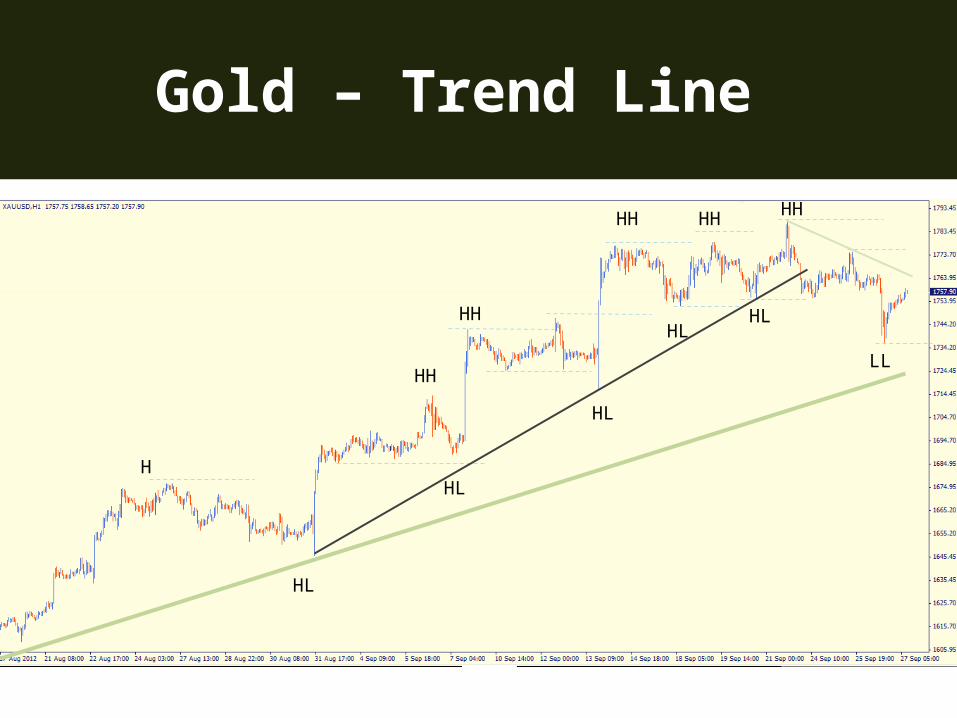
Gold – Trend Line
H
HL
HH
HL
HH
HL
HH
HLHL
HH HH
LL
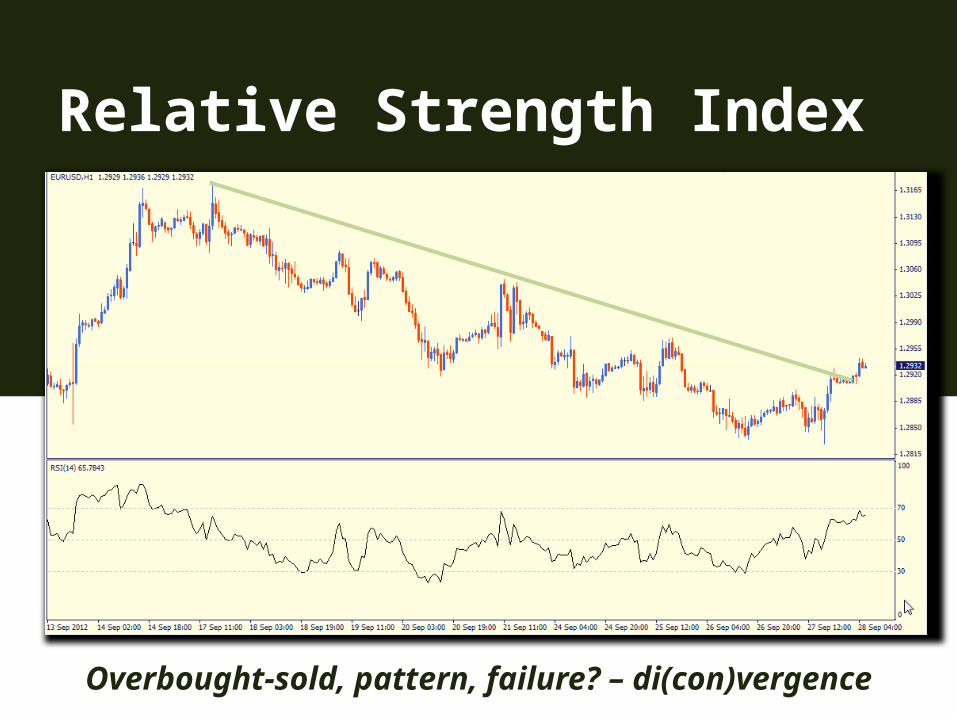
Relative Strength Index
Overbought-sold, pattern, failure? – di(con)vergence
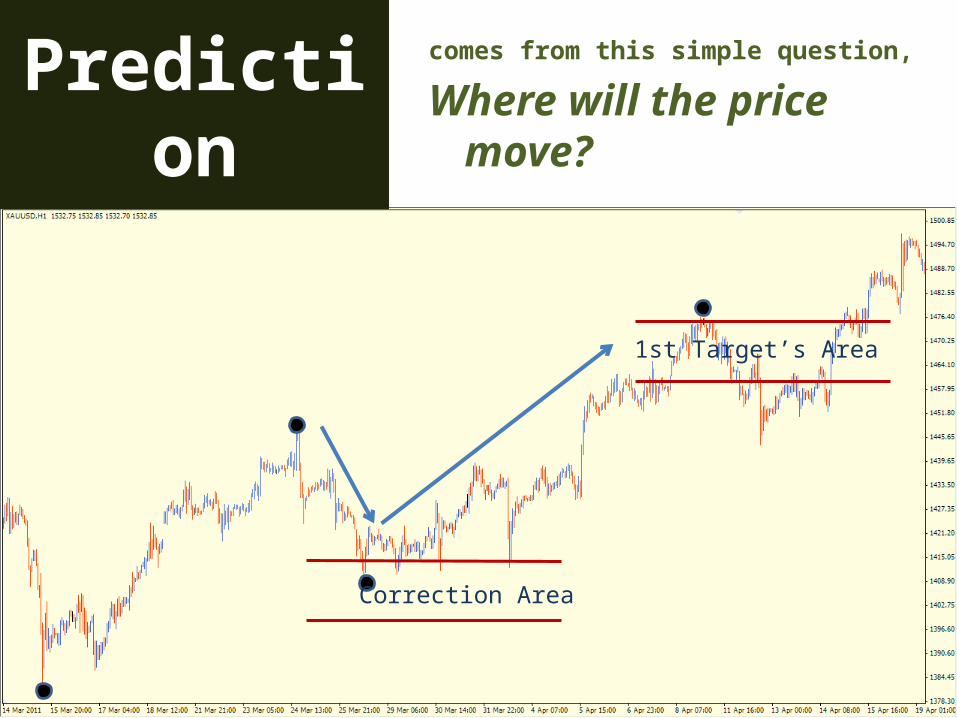
Predictioncomes from this simple question,
Where will the price move?
Correction Area
1st Target’s Area
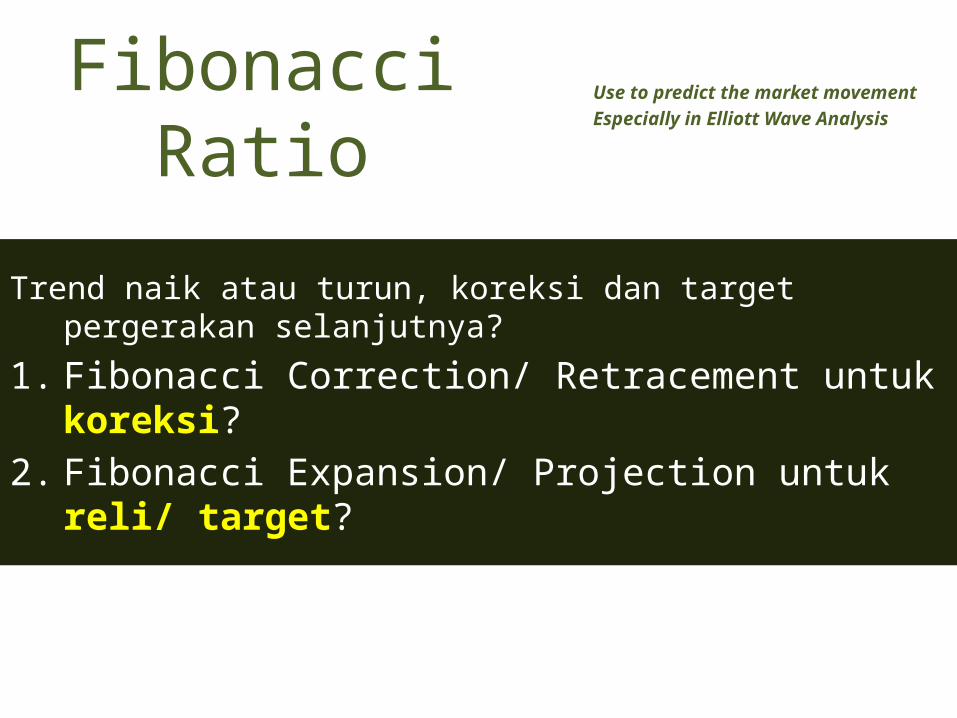
Fibonacci Ratio Use to predict the market movement Especially in Elliott Wave Analysis
Trend naik atau turun, koreksi dan target pergerakan selanjutnya?
1. Fibonacci Correction/ Retracement untuk koreksi?2. Fibonacci Expansion/ Projection untuk reli/ target?
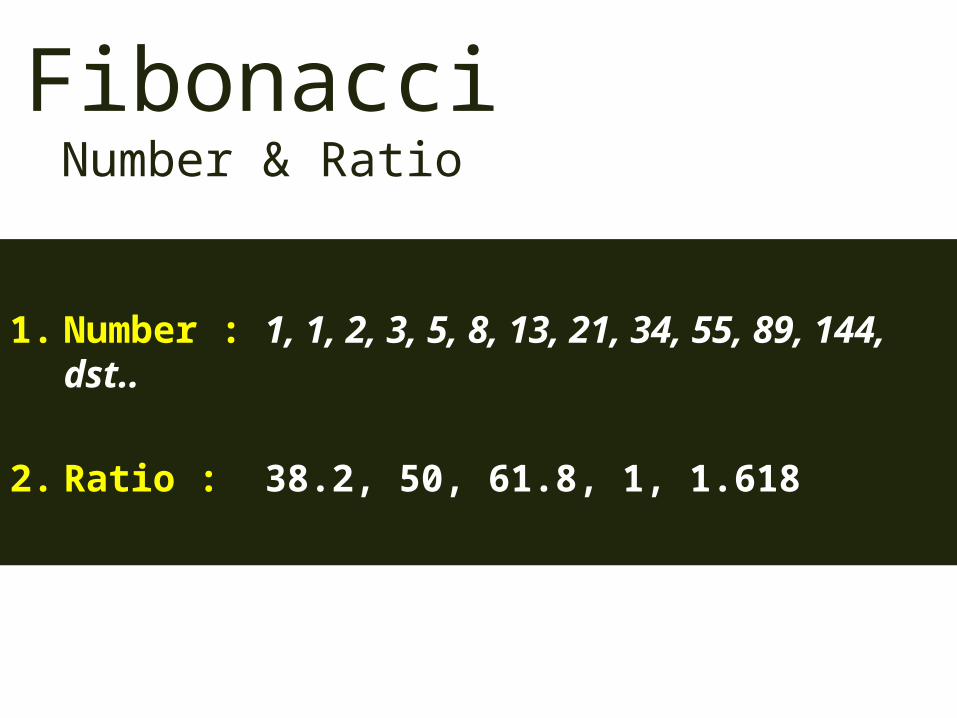
FibonacciNumber & Ratio
1. Number : 1, 1, 2, 3, 5, 8, 13, 21, 34, 55, 89, 144, dst..
2. Ratio : 38.2, 50, 61.8, 1, 1.618
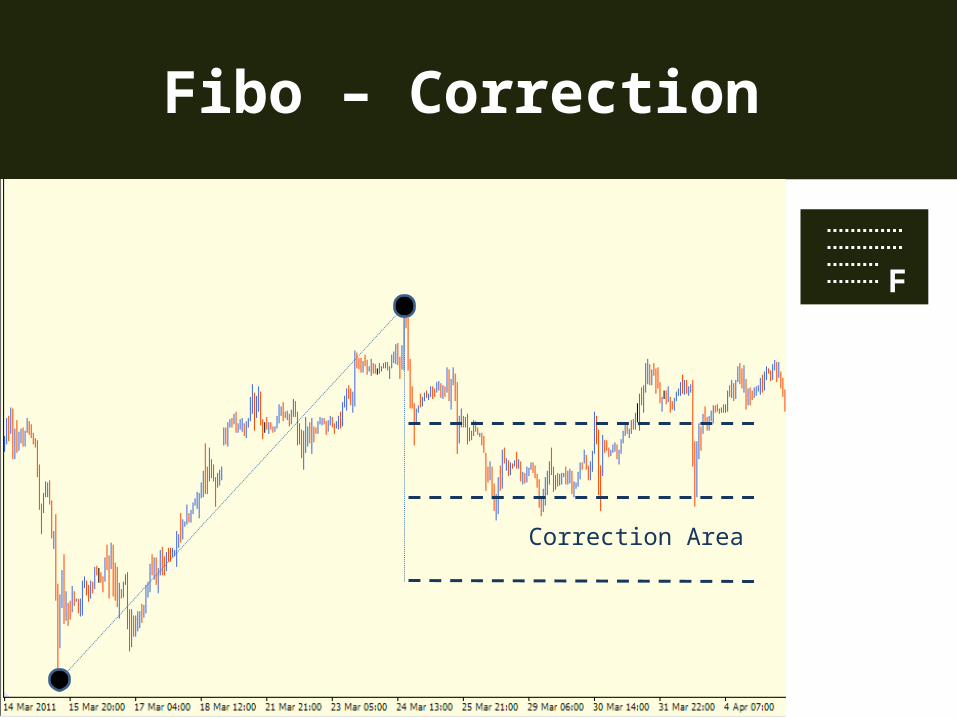
Fibo – Correction
Correction Area
F
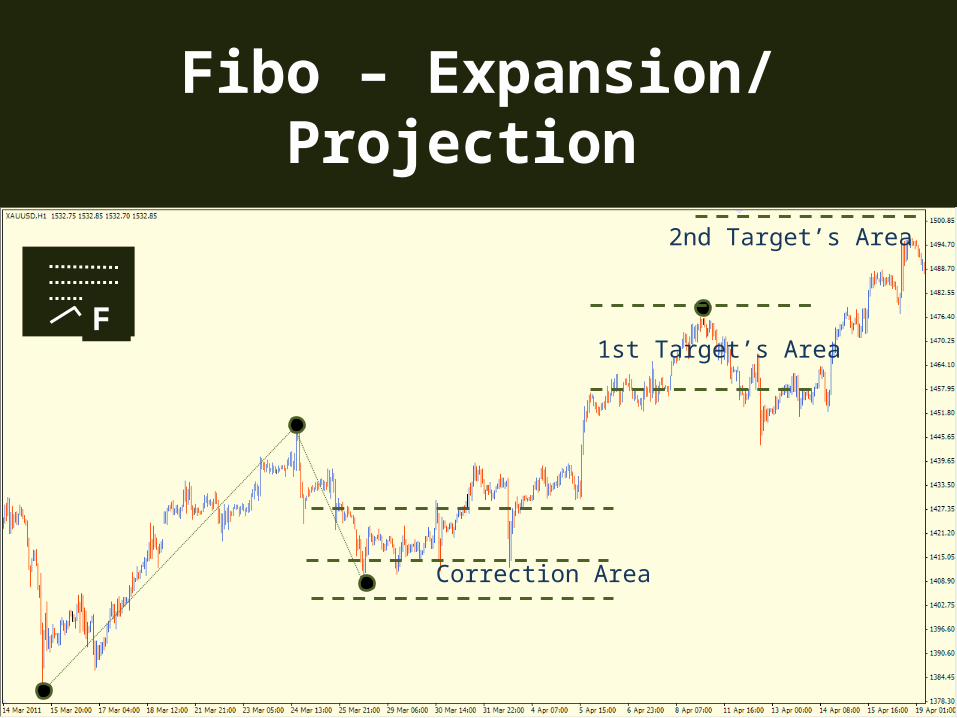
Fibo – Expansion/ Projection
Correction Area
1st Target’s AreaF
2nd Target’s Area
C – Summary
Q & A…

Thank [email protected]
Recommended