ARTICLE IN PRESS
0360-1323/$ - se
doi:10.1016/j.bu
�CorrespondE-mail addr
(S. Tokgoz), ak
(T. Baran).
Building and Environment 43 (2008) 1109–1120
www.elsevier.com/locate/buildenv
Behaviour of reinforced and concrete-encased composite columnssubjected to biaxial bending and axial load
Cengiz Dundar�, Serkan Tokgoz, A. Kamil Tanrikulu, Tarik Baran
Civil Engineering Department, Cukurova University, 01330 Adana, Turkey
Received 3 February 2006; received in revised form 26 January 2007; accepted 2 February 2007
Abstract
An experimental investigation of the behaviour of reinforced concrete columns and a theoretical procedure for analysis of both short
and slender reinforced and composite columns of arbitrarily shaped cross section subjected to biaxial bending and axial load are
presented. In the proposed procedure, nonlinear stress–strain relations are assumed for concrete, reinforcing steel and structural steel
materials. The compression zone of the concrete section and the entire section of the structural steel are divided into adequate number of
segments in order to use various stress–strain models for the analysis. The slenderness effect of the member is taken into account by using
the Moment Magnification Method. The proposed procedure was compared with test results of 12 square and three L-shaped reinforced
concrete columns subjected to short-term axial load and biaxial bending, and also some experimental results available in the literature for
composite columns compared with the theoretical results obtained by the proposed procedure and a good degree of accuracy was
obtained.
r 2007 Elsevier Ltd. All rights reserved.
Keywords: Reinforced concrete column; Composite column; Biaxial loading; Ultimate strength; Stress–strain models
1. Introduction
Reinforced and concrete-encased composite columns ofarbitrarily shaped cross section subjected to biaxialbending and axial load are commonly used in manystructures, such as buildings and bridges. A compositecolumn is a combination of concrete, structural steel andreinforcing steel to provide an adequate load carryingcapacity of the member. Thus, such composite memberscan provide rigidity, usable floor areas and cost economyfor mid-to-high buildings. Many experimental and analy-tical studies have been carried out on reinforced andcomposite members in the past years. Furlong [1] hascarried out analytical and experimental studies on re-inforced concrete columns using well-known rectangularstress block for the concrete compression zone in the
e front matter r 2007 Elsevier Ltd. All rights reserved.
ildenv.2007.02.010
ing author. Tel.: +90 322 338 6762; fax: +90 322 338 6702.
esses: [email protected] (C. Dundar), [email protected]
[email protected] (A.K. Tanrikulu), [email protected]
analysis. Brondum-Nielsen [2] has proposed a method ofcalculating the ultimate strength capacity of crackedpolygonal concrete sections using rectangular stress blockin the concrete compression zone of the section underbiaxial bending. Hsu [3,4] has presented theoretical andexperimental results for L-shaped and channel shapedreinforced concrete sections. Dundar [5] has studiedreinforced concrete box sections under biaxial bendingand axial load. Rangan [6] has presented a method tocalculate the strength of reinforced concrete slendercolumns including creep deflection due to sustained loadas an additional eccentricity and the method comparedwith ACI 318-Building Code Method [7]. Dundar andSahin [8] have researched arbitrarily shaped reinforcedconcrete sections subjected to biaxial bending and axialload using Whitney’s stress block [9] in the compressionzone of the concrete section. Rodriguez and Ochoa [10] andFafitis [11] have suggested numerical methods for thecomputation of the failure surface for reinforced concretesections of arbitrary shape. Hong [12] has proposed asimple approach for estimating the strength of slender
ARTICLE IN PRESSC. Dundar et al. / Building and Environment 43 (2008) 1109–11201110
reinforced concrete columns with arbitrarily shaped crosssection using nonlinear stress–strain relationship for thematerials. Saatcioglu and Razvi [13] have presented anexperimental research to investigate the behaviour of highstrength concrete columns confined by rectilinear reinfor-cement under concentric compression. Furlong et al. [14]have examined several design procedures for ultimatestrength analysis of reinforced concrete columns andcompared with many short and slender experimentalcolumns under short-term axial load and biaxial bending.Morino et al. [15] have presented a series of experimentalresults on short and slender square composite columns.Roik and Bergmann [16] have proposed a simplified designmethod based on the strength interaction curve andreported test results for short and slender compositecolumns with unsymmetrical square and rectangularshaped cross sections. Virdi and Dowling [17] havepresented a numerical method and test results for squarecomposite columns to predict the ultimate strengthcapacity of the composite column members under biaxialbending and axial load. Mirza [18] has examined the effectsof variables, such as the confinement effect, the ratio ofstructural steel to gross area, the compressive strength ofconcrete, the yield strength of steel and the slendernessratio, on the ultimate strength of composite columns.Mirza and Skrabek [19] have carried out a statisticalanalysis on the variability of ultimate strength capacity ofslender composite beam-columns. Munoz [20] and Munozand Hsu [21,22] have presented an experimental and atheoretical study based on the finite differences method,including confinement effect for the concrete, on squareand rectangular cross sections of short and slendercomposite columns under biaxial load. Weng and Yen[23] have investigated the differences between the ACI [7]and AISC [24] approaches for the design of concrete-encased composite columns. Lachance [25], Chen et al. [26]and Sfakianakis [27] have proposed a numerical analysismethod for short composite columns of arbitrarily shapedcross section.
Confinement provided by lateral ties increases theultimate strength capacity and ductility of reinforcedconcrete columns under combined biaxial bending andaxial load. Strength and ductility gain in concrete areobtained by many confinement parameters e.g., thecompressive strength of concrete, longitudinal reinforce-ment, type and the yield strength of lateral ties, tiespacing, etc. Because of such parameters, determinationof mechanical behaviour of confined concrete is not as easyas unconfined concrete. Some researchers for instance,Kent and Park [28], Sheikh and Uzumeri [29], Saatciogluand Razvi [30], Chung et al. [31] have presented astress–strain relationship to describe the confined concretebehaviour.
The main objective of this paper is to present an iterativecomputing procedure for the rapid design and ultimatestrength analysis of arbitrarily shaped both short andslender reinforced, and concrete-encased composite mem-
bers having arbitrarily located reinforcing steel bars andstructural steel elements subjected to biaxial bending andaxial load. For this aim a computer program has beendeveloped which considers various confined or unconfinedconcrete stress–strain models for the concrete compressionzone for both short and slender reinforced and compositecolumns. Thus, results of the ultimate strength analysis,with various concrete models, can be compared with eachother.In the experimental part of the study, 12 square and
three L-shaped short and slender reinforced concretecolumns were tested to determine the ultimate strengthcapacity, load-deflection behaviour, load-axial strain be-haviour and confinement effect of column members. Thetest results were compared with the theoretical resultsobtained by the developed computer program which usesvarious stress–strain models for the confined concrete orunconfined concrete in the compression zone of themember.Finally, the theoretical results obtained using the
proposed procedure were also compared with the testresults available in the literature for short and slendercomposite columns.
2. Experimental program
An experimental investigation of the behaviour ofreinforced concrete columns under short-term axial loadand biaxial bending is presented. The primary objective ofthis investigation was to examine the ultimate strengthcapacity and load-deflection behaviour of short and slenderreinforced concrete columns and to compare the test resultsof ultimate strength capacities of specimens with the resultsobtained by the proposed theoretical procedure usingvarious stress–strain models for the materials. For thisreason, reinforced concrete specimens were designed withdifferent length, dimension and cross section with differentdiameter and arrangement of longitudinal and lateralreinforcements.
2.1. Test specimens
The experimental program includes 15 reinforced con-crete columns. Five specimens are short square tiedcolumns (C1–C5), seven specimens are slender square tiedcolumns (C11–C14, C21–C23) and the other three areL-shaped section slender tied columns (LC1–LC3). Thecross section details and dimensions of each specimen areshown in Fig. 1.The reinforced concrete column specimens were cast
horizontally inside a formwork in Structural Laboratory atCukurova University, Adana. Maximum 20mm diameterlocal aggregate and Normal Portland Cement were used inall concrete batches. Three standard cylinder specimens(150mm in diameter by 300mm long) were cast from eachcolumn specimen concrete mix and cured under the samecondition as the column specimen in the Structural
ARTICLE IN PRESS
17.5 17.5
100 mm
17.5
17.5
100 mm 6 mm (C1−C5)
8 mm (C11−C14)
25 25
150 mm
25
25
150 mm8 mm
150 mm
150 mm
100
100 x
y
G
17.5
6 mm
17.5
(C1−C5, C11−C14) (C21−C23)
LC1−LC3
Fig. 1. Reinforced concrete column specimen cross sections.
0
10
20
30
40
50
0 0.002 0.0035
Stress-Strain Relation (LC3)
Str
ess (
MP
a)
Strain
0.0005 0.001 0.0015 0.0025 0.003 0.004
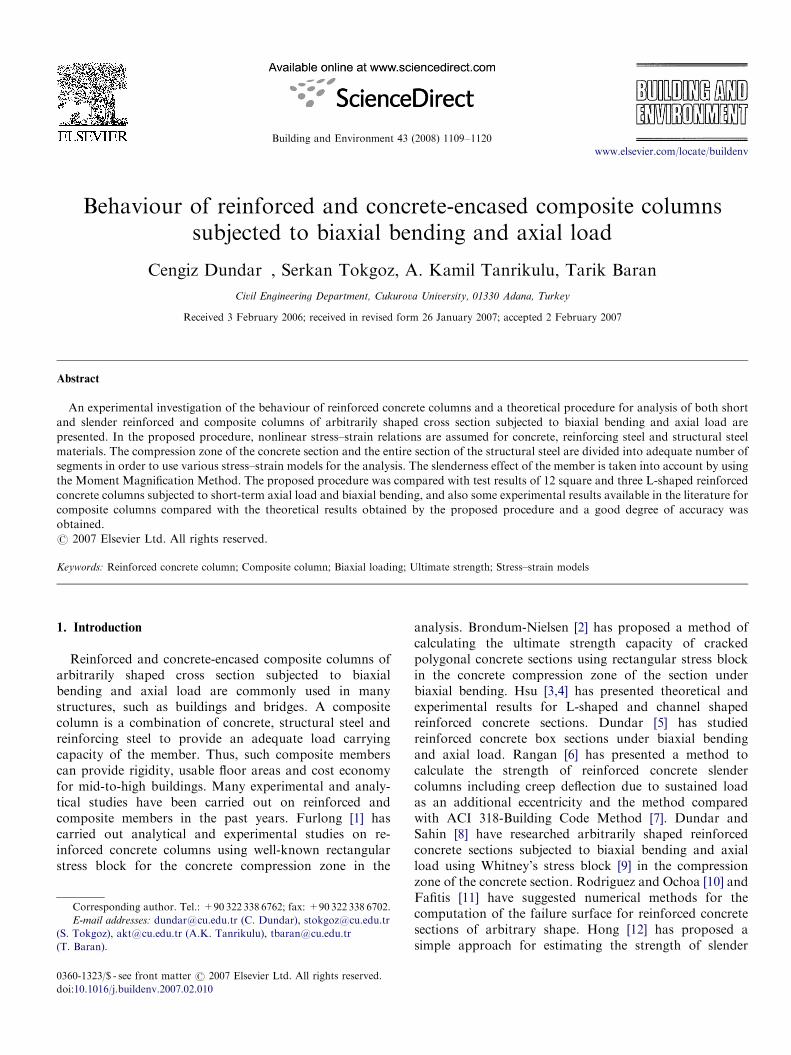
Fig. 2. Experimental concrete stress–strain relationship for specimen LC3.
Table 1
Specimen details of reinforced concrete columns
Specimen no. L (mm) f c (MPa) ex (mm) ey (mm) f=s (mm/cm)
C1 870 19.18 25 25 6/12.5
C2 870 31.54 25 25 6/15
C3 870 28.13 25 25 6/10
C4 870 26.92 30 30 6/8
C5 870 25.02 30 30 6/10
C11 1300 32.27 35 35 6.5/10.5
C12 1300 47.86 40 40 6.5/10.5
C13 1300 33.10 35 35 6.5/10.5
C14 1300 29.87 45 45 6.5/12.5
C21 1300 31.70 40 40 6.5/10.5
C22 1300 40.76 50 50 6.5/10.5
C23 1300 34.32 50 50 6.5/10.5
LC1 1300 35.12 36.25 36.25 6/10
LC2 1300 32.77 41.25 41.25 6/11
LC3 1300 44.88 46.25 46.25 6/13
C. Dundar et al. / Building and Environment 43 (2008) 1109–1120 1111
Laboratory. The concrete cylinder specimens were tested atthe same day of that column specimen in order todetermine the mean compressive strength of concrete andto attain a stress–strain relationship for each columnspecimen to use in the analysis. A typical concretestress–strain relationship obtained experimentally is givenin Fig. 2.
The longitudinal reinforcement consisted of 6 and 8mmdiameter of deformed bars with the yield strength of 630and 550MPa, respectively. Lateral reinforcements werearranged using 6 and 6.5mm diameter of deformedreinforcing bars with the yield strength of 630MPa forthe specimens. The lateral ties were bent into 135� hooks atthe ends. The overall length ðLÞ, the mean compressivestrength of the concrete ðf cÞ, the eccentricities of theapplied load (ex and ey) and the lateral reinforcementarrangements of the specimens (diameter + and spacing s)are presented in Table 1.
2.2. Test procedure
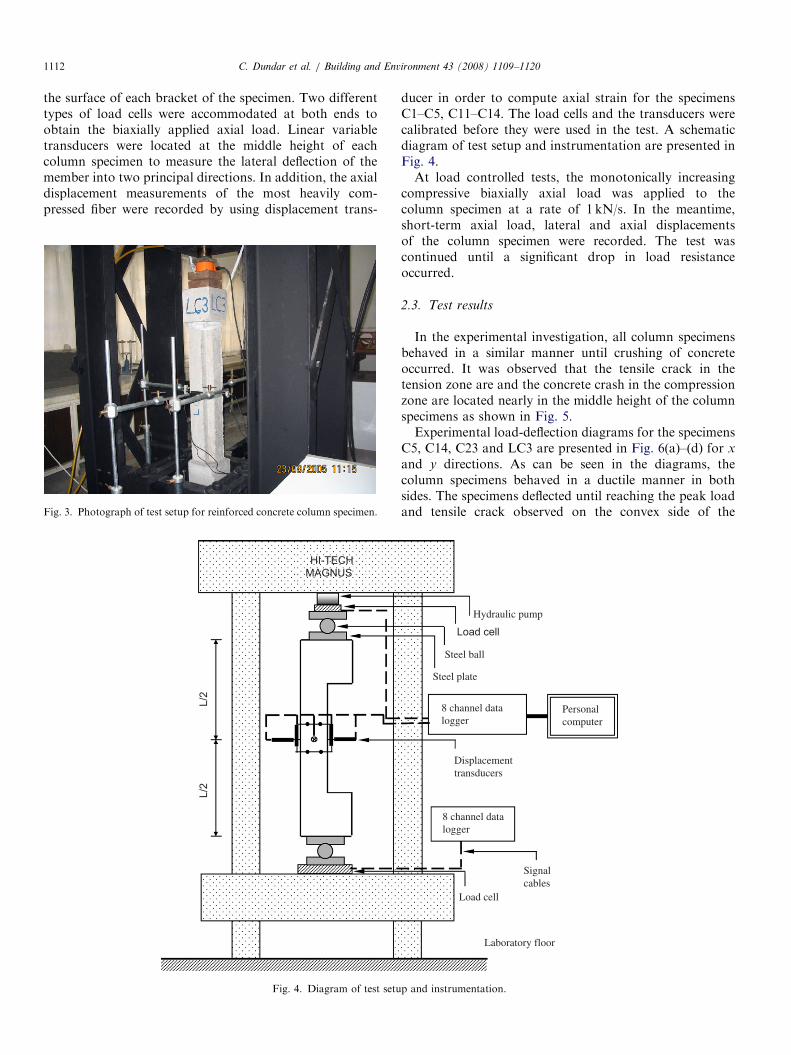
The specimens were tested with pinned conditions atboth ends using 400 kN capacity HI-TECH MAGNUShydraulic testing machine in the Structural Laboratory atCukurova University. A photograph of test setup forreinforced concrete column specimen is shown in Fig. 3.For the application of the biaxially eccentric load to the
column specimen in the vertical position, the heavilyreinforced brackets were designed for both ends of thespecimen to prevent local failures. The point of the appliedbiaxially eccentric axial load was sensitively marked up on
ARTICLE IN PRESSC. Dundar et al. / Building and Environment 43 (2008) 1109–11201112
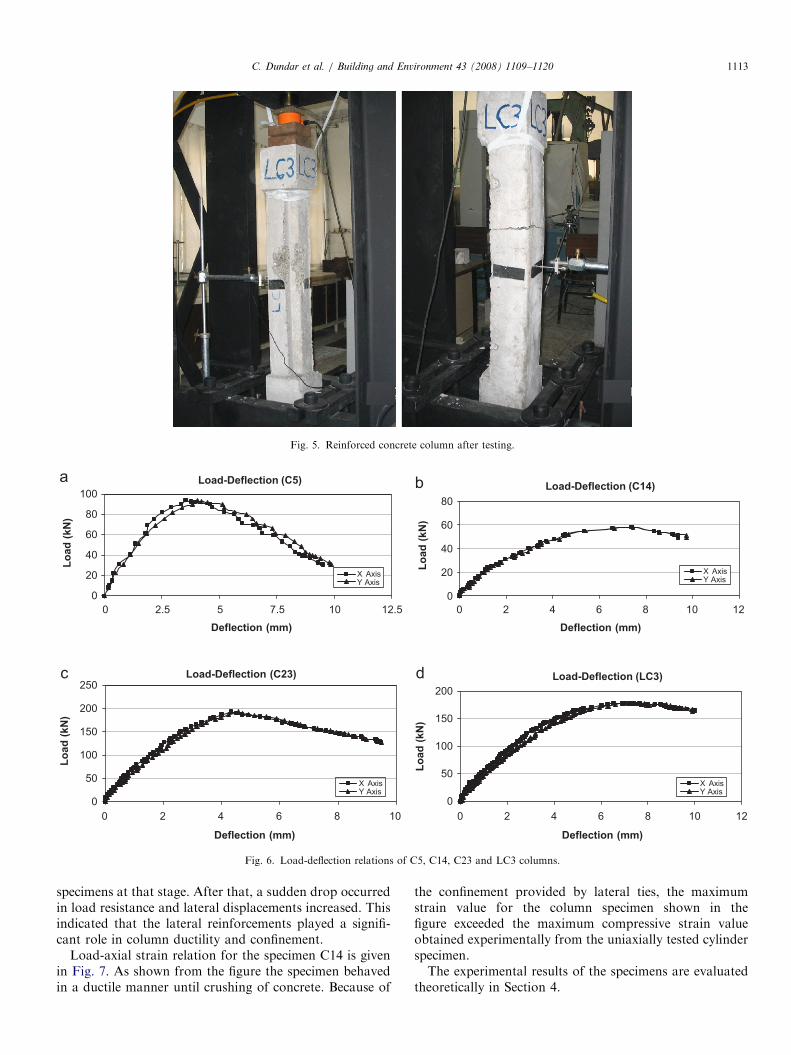
the surface of each bracket of the specimen. Two differenttypes of load cells were accommodated at both ends toobtain the biaxially applied axial load. Linear variabletransducers were located at the middle height of eachcolumn specimen to measure the lateral deflection of themember into two principal directions. In addition, the axialdisplacement measurements of the most heavily com-pressed fiber were recorded by using displacement trans-
Fig. 3. Photograph of test setup for reinforced concrete column specimen.
L/2
L/2
HI-TECH
MAGNUS
Fig. 4. Diagram of test setu
ducer in order to compute axial strain for the specimensC1–C5, C11–C14. The load cells and the transducers werecalibrated before they were used in the test. A schematicdiagram of test setup and instrumentation are presented inFig. 4.At load controlled tests, the monotonically increasing
compressive biaxially axial load was applied to thecolumn specimen at a rate of 1 kN/s. In the meantime,short-term axial load, lateral and axial displacementsof the column specimen were recorded. The test wascontinued until a significant drop in load resistanceoccurred.
2.3. Test results
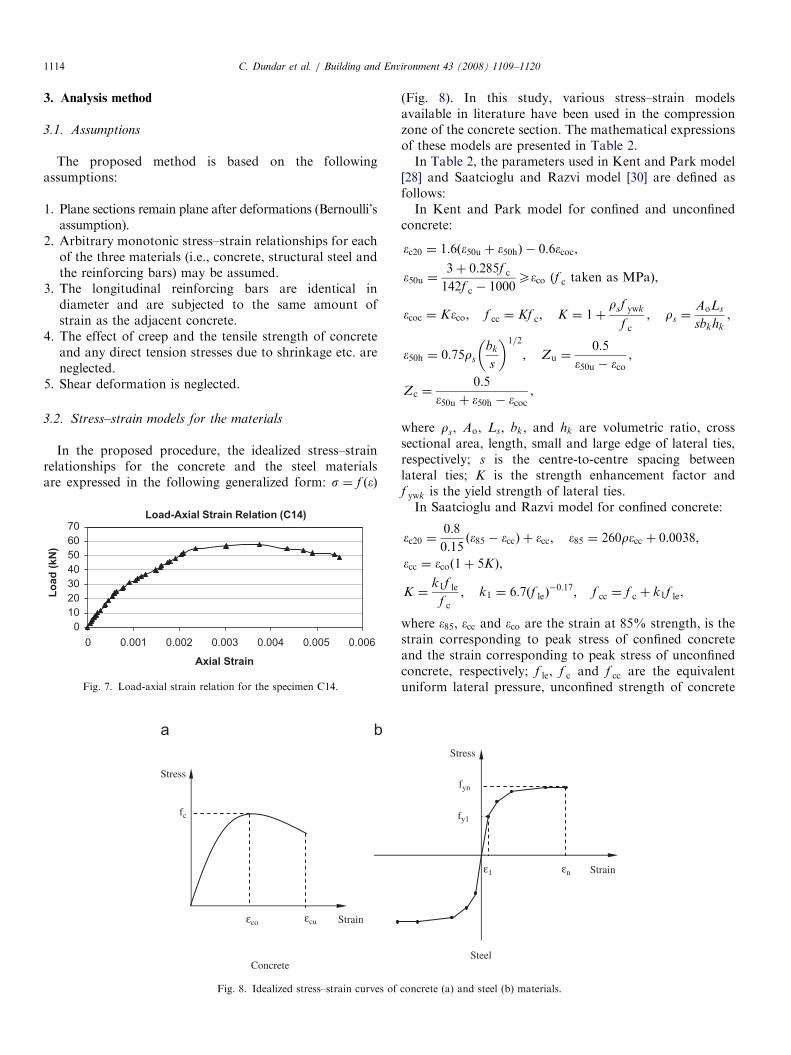
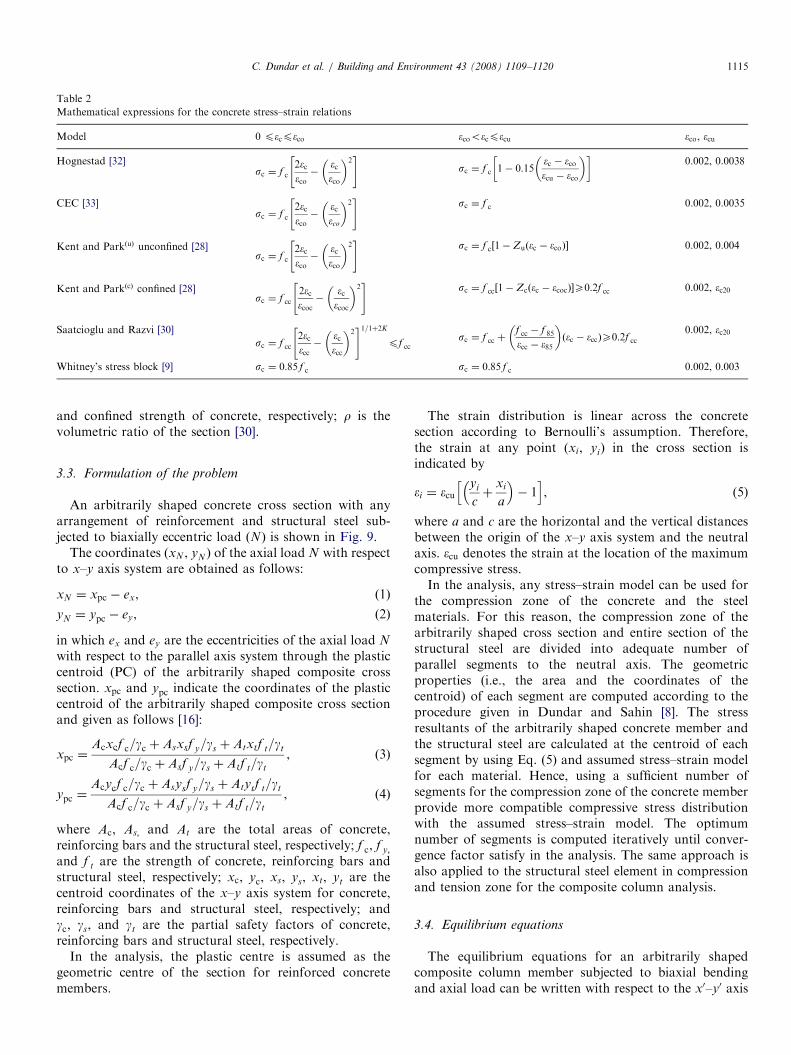
In the experimental investigation, all column specimensbehaved in a similar manner until crushing of concreteoccurred. It was observed that the tensile crack in thetension zone are and the concrete crash in the compressionzone are located nearly in the middle height of the columnspecimens as shown in Fig. 5.Experimental load-deflection diagrams for the specimens
C5, C14, C23 and LC3 are presented in Fig. 6(a)–(d) for x
and y directions. As can be seen in the diagrams, thecolumn specimens behaved in a ductile manner in bothsides. The specimens deflected until reaching the peak loadand tensile crack observed on the convex side of the
8 channel data logger
Personal computer
Steel plate
Hydraulic pump
Laboratory floor
Load cell
Displacement transducers
Signal cables
Steel ball
Load cell
8 channel data logger
p and instrumentation.
ARTICLE IN PRESS
Fig. 5. Reinforced concrete column after testing.
0
20
40
60
80
100
0 5
Lo
ad
(kN
)
X Axis
Y Axis
0
20
40
60
80
0 4
Lo
ad
(kN
)
Load-Deflection (C5)
Deflection (mm)
Load-Deflection (C14)
Deflection (mm)
6 8 10 1222.5 7.5 10 12.5
X Axis
Y Axis
X Axis
Y Axis
X Axis
Y Axis
0
50
100
150
200
250
0 4 8
Lo
ad
(kN
)
0
50
100
150
200
0 4
Lo
ad
(kN
)
2
Deflection (mm)
6 10
Load-Deflection (LC3)
2 6 8
Deflection (mm)
10 12
Load-Deflection (C23)
Fig. 6. Load-deflection relations of C5, C14, C23 and LC3 columns.
C. Dundar et al. / Building and Environment 43 (2008) 1109–1120 1113
specimens at that stage. After that, a sudden drop occurredin load resistance and lateral displacements increased. Thisindicated that the lateral reinforcements played a signifi-cant role in column ductility and confinement.
Load-axial strain relation for the specimen C14 is givenin Fig. 7. As shown from the figure the specimen behavedin a ductile manner until crushing of concrete. Because of
the confinement provided by lateral ties, the maximumstrain value for the column specimen shown in thefigure exceeded the maximum compressive strain valueobtained experimentally from the uniaxially tested cylinderspecimen.The experimental results of the specimens are evaluated
theoretically in Section 4.
ARTICLE IN PRESSC. Dundar et al. / Building and Environment 43 (2008) 1109–11201114
3. Analysis method
3.1. Assumptions
The proposed method is based on the followingassumptions:
1.
Plane sections remain plane after deformations (Bernoulli’sassumption).2.
Arbitrary monotonic stress–strain relationships for eachof the three materials (i.e., concrete, structural steel andthe reinforcing bars) may be assumed.3.
The longitudinal reinforcing bars are identical indiameter and are subjected to the same amount ofstrain as the adjacent concrete.4.
The effect of creep and the tensile strength of concreteand any direct tension stresses due to shrinkage etc. areneglected.5.
Shear deformation is neglected.3.2. Stress–strain models for the materials
In the proposed procedure, the idealized stress–strainrelationships for the concrete and the steel materialsare expressed in the following generalized form: s ¼ f ð�Þ
0
10
20
30
40
50
60
70
0
Lo
ad
(kN
)
Load-Axial Strain Relation (C14)
Axial Strain
0.0020.001 0.003 0.004 0.005 0.006
Fig. 7. Load-axial strain relation for the specimen C14.
Concrete
Strain
Stress
εcu εco
fc
a b
Fig. 8. Idealized stress–strain curves of
(Fig. 8). In this study, various stress–strain modelsavailable in literature have been used in the compressionzone of the concrete section. The mathematical expressionsof these models are presented in Table 2.In Table 2, the parameters used in Kent and Park model
[28] and Saatcioglu and Razvi model [30] are defined asfollows:In Kent and Park model for confined and unconfined
concrete:
�c20 ¼ 1:6ð�50u þ �50hÞ � 0:6�coc,
�50u ¼3þ 0:285f c
142f c � 1000X�co ðf c taken as MPaÞ,
�coc ¼ K�co; f cc ¼ Kf c; K ¼ 1þrsf ywk
f c
; rs ¼AoLs
sbkhk
,
�50h ¼ 0:75rs
bk
s
� �1=2
; Zu ¼0:5
�50u � �co,
Zc ¼0:5
�50u þ �50h � �coc,
where rs, Ao, Ls, bk, and hk are volumetric ratio, crosssectional area, length, small and large edge of lateral ties,respectively; s is the centre-to-centre spacing betweenlateral ties; K is the strength enhancement factor andf ywk is the yield strength of lateral ties.In Saatcioglu and Razvi model for confined concrete:
�c20 ¼0:8
0:15ð�85 � �ccÞ þ �cc; �85 ¼ 260r�cc þ 0:0038,
�cc ¼ �coð1þ 5KÞ,
K ¼k1f le
f c
; k1 ¼ 6:7ðf leÞ�0:17; f cc ¼ f c þ k1f le,
where �85, �cc and �co are the strain at 85% strength, is thestrain corresponding to peak stress of confined concreteand the strain corresponding to peak stress of unconfinedconcrete, respectively; f le, f c and f cc are the equivalentuniform lateral pressure, unconfined strength of concrete
Steel
Strain
Stress
fy1
ε1 εn
fyn
concrete (a) and steel (b) materials.
ARTICLE IN PRESS
Table 2
Mathematical expressions for the concrete stress–strain relations
Model 0 p�cp�co �coo�cp�cu �co, �cu
Hognestad [32]sc ¼ f c
2�c�co�
�c�co
� �2" #
sc ¼ f c 1� 0:15�c � �co�cu � �co
� �� �0.002, 0.0038
CEC [33]sc ¼ f c
2�c�co�
�c�co
� �2" #
sc ¼ f c 0.002, 0.0035
Kent and ParkðuÞ unconfined [28]sc ¼ f c
2�c�co�
�c�co
� �2" #
sc ¼ f c 1� Zu �c � �coð Þ½ � 0.002, 0.004
Kent and ParkðcÞ confined [28]sc ¼ f cc
2�c�coc�
�c�coc
� �2" #
sc ¼ f cc 1� Zc �c � �cocð Þ½ �X0:2f cc 0.002, �c20
Saatcioglu and Razvi [30]
sc ¼ f cc
2�c�cc�
�c�cc
� �2" #1=1þ2K
pf ccsc ¼ f cc þ
f cc � f 85
�cc � �85
� ��c � �ccð ÞX0:2f cc
0.002, �c20
Whitney’s stress block [9] sc ¼ 0:85 f c sc ¼ 0:85 f c 0.002, 0.003
C. Dundar et al. / Building and Environment 43 (2008) 1109–1120 1115
and confined strength of concrete, respectively; r is thevolumetric ratio of the section [30].
3.3. Formulation of the problem
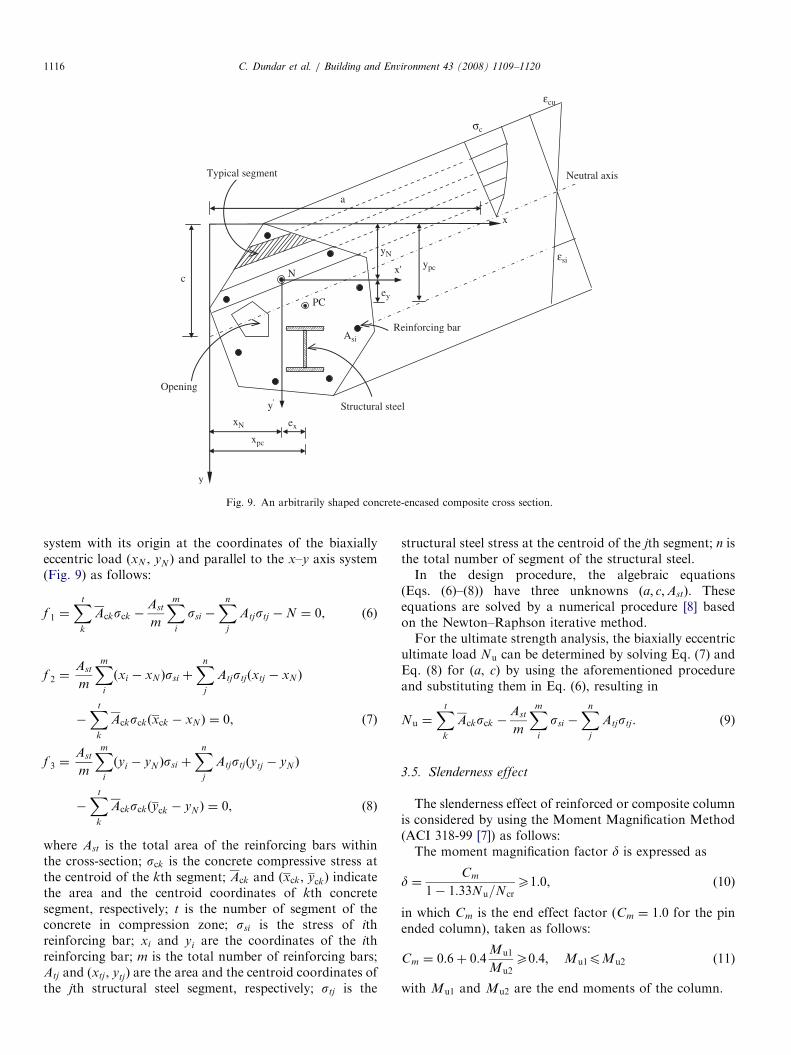
An arbitrarily shaped concrete cross section with anyarrangement of reinforcement and structural steel sub-jected to biaxially eccentric load ðNÞ is shown in Fig. 9.
The coordinates (xN , yN ) of the axial load N with respectto x–y axis system are obtained as follows:
xN ¼ xpc � ex, ð1Þ
yN ¼ ypc � ey, ð2Þ
in which ex and ey are the eccentricities of the axial load N
with respect to the parallel axis system through the plasticcentroid (PC) of the arbitrarily shaped composite crosssection. xpc and ypc indicate the coordinates of the plasticcentroid of the arbitrarily shaped composite cross sectionand given as follows [16]:
xpc ¼Acxcf c=gc þ Asxsf y=gs þ Atxtf t=gt
Acf c=gc þ Asf y=gs þ Atf t=gt
, ð3Þ
ypc ¼Acycf c=gc þ Asysf y=gs þ Atytf t=gt
Acf c=gc þ Asf y=gs þ Atf t=gt
, ð4Þ
where Ac, As; and At are the total areas of concrete,reinforcing bars and the structural steel, respectively; f c, f y;
and f t are the strength of concrete, reinforcing bars andstructural steel, respectively; xc, yc, xs, ys, xt, yt are thecentroid coordinates of the x–y axis system for concrete,reinforcing bars and structural steel, respectively; andgc, gs, and gt are the partial safety factors of concrete,reinforcing bars and structural steel, respectively.
In the analysis, the plastic centre is assumed as thegeometric centre of the section for reinforced concretemembers.
The strain distribution is linear across the concretesection according to Bernoulli’s assumption. Therefore,the strain at any point (xi, yi) in the cross section isindicated by
�i ¼ �cuyi
cþ
xi
a
� �� 1
h i, (5)
where a and c are the horizontal and the vertical distancesbetween the origin of the x–y axis system and the neutralaxis. �cu denotes the strain at the location of the maximumcompressive stress.In the analysis, any stress–strain model can be used for
the compression zone of the concrete and the steelmaterials. For this reason, the compression zone of thearbitrarily shaped cross section and entire section of thestructural steel are divided into adequate number ofparallel segments to the neutral axis. The geometricproperties (i.e., the area and the coordinates of thecentroid) of each segment are computed according to theprocedure given in Dundar and Sahin [8]. The stressresultants of the arbitrarily shaped concrete member andthe structural steel are calculated at the centroid of eachsegment by using Eq. (5) and assumed stress–strain modelfor each material. Hence, using a sufficient number ofsegments for the compression zone of the concrete memberprovide more compatible compressive stress distributionwith the assumed stress–strain model. The optimumnumber of segments is computed iteratively until conver-gence factor satisfy in the analysis. The same approach isalso applied to the structural steel element in compressionand tension zone for the composite column analysis.
3.4. Equilibrium equations
The equilibrium equations for an arbitrarily shapedcomposite column member subjected to biaxial bendingand axial load can be written with respect to the x0–y0 axis
ARTICLE IN PRESS
σc
εcu
εsi
Asi
x'
y'
x
y
N
Neutral axis
c
a
Typical segment
Opening
Structural steel
Reinforcing bar
PC
xN
yN
ex
ey
xpc
ypc
Fig. 9. An arbitrarily shaped concrete-encased composite cross section.
C. Dundar et al. / Building and Environment 43 (2008) 1109–11201116
system with its origin at the coordinates of the biaxiallyeccentric load (xN , yN ) and parallel to the x–y axis system(Fig. 9) as follows:
f 1 ¼Xt
k
Acksck �Ast
m
Xm
i
ssi �Xn
j
Atjstj �N ¼ 0, (6)
f 2 ¼Ast
m
Xm
i
ðxi � xNÞssi þXn
j
Atjstjðxtj � xN Þ
�Xt
k
Acksckðxck � xNÞ ¼ 0, ð7Þ
f 3 ¼Ast
m
Xm
i
ðyi � yN Þssi þXn
j
Atjstjðytj � yN Þ
�Xt
k
Acksckðyck � yNÞ ¼ 0, ð8Þ
where Ast is the total area of the reinforcing bars withinthe cross-section; sck is the concrete compressive stress atthe centroid of the kth segment; Ack and (xck, yck) indicatethe area and the centroid coordinates of kth concretesegment, respectively; t is the number of segment of theconcrete in compression zone; ssi is the stress of ithreinforcing bar; xi and yi are the coordinates of the ithreinforcing bar; m is the total number of reinforcing bars;Atj and (xtj , ytj) are the area and the centroid coordinates ofthe jth structural steel segment, respectively; stj is the
structural steel stress at the centroid of the jth segment; n isthe total number of segment of the structural steel.In the design procedure, the algebraic equations
(Eqs. (6)–(8)) have three unknowns ða; c;AstÞ. Theseequations are solved by a numerical procedure [8] basedon the Newton–Raphson iterative method.For the ultimate strength analysis, the biaxially eccentric
ultimate load Nu can be determined by solving Eq. (7) andEq. (8) for (a, c) by using the aforementioned procedureand substituting them in Eq. (6), resulting in
Nu ¼Xt
k
Acksck �Ast
m
Xm
i
ssi �Xn
j
Atjstj. (9)
3.5. Slenderness effect
The slenderness effect of reinforced or composite columnis considered by using the Moment Magnification Method(ACI 318-99 [7]) as follows:The moment magnification factor d is expressed as
d ¼Cm
1� 1:33Nu=NcrX1:0, (10)
in which Cm is the end effect factor (Cm ¼ 1:0 for the pinended column), taken as follows:
Cm ¼ 0:6þ 0:4Mu1
Mu2X0:4; Mu1pMu2 (11)
with Mu1 and Mu2 are the end moments of the column.
ARTICLE IN PRESS
Read Input Data: Material properties, Column geometrical properties Initial parameters (a, c, t)
Calculate cross section properties (Area, Geometric centre coordinates)
Iterative calculation for Nu or Ast Calculate segment stresses Calculate reinforcement bar stresses Calculate structural steel stresses
Satisfying equilibrium equations?
Derive new values for neutral axis parameters (a, c)
No
Yes
≤εBi
Bi - Bi-1
Yes
Store results to output file
Increase number of segment (t = t +1)
No
Fig. 10. Flow chart of the computer program.
C. Dundar et al. / Building and Environment 43 (2008) 1109–1120 1117
Ncr is the elastic buckling load of column:
Ncr ¼p2EI
ðkLÞ2, (12)
where ðkLÞ is the effective length and EI is the effectiveflexural rigidity of the column section. The effectiveflexural rigidity of the section plays an important role onthe computation of the ultimate strength capacity ofslender reinforced and composite columns and may bedetermined as follows:
For reinforced concrete columns (ACI 318-99 [7]):
EI ¼0:2EcIg
1þ bdþ EsIs (13)
or
EI ¼0:4EcIg
1þ bd(14)
where Ec and Es are the modulus of elasticity of theconcrete and the steel materials, respectively; Ig is themoment of inertia of gross concrete section of the column;Is is the moment of inertia of reinforcement aboutcentroidal axis of member cross section; bd is the sustainedload factor (bd ¼ 0 for short-term axial load).
For composite columns [16]:
EI ¼ EceI ce þ EsIs þ EtIt, (15)
where
Ece ¼ 600f c. (16)
In Eq. (15), I ce, Is and I t are the moments of inertia ofthe uncracked concrete, the reinforcement and the struc-tural steel section, calculated with respect to the elasticcentroidal axis, respectively. Es and Et are the modulus ofelasticity of reinforcement and structural steel, respectively.
For the arbitrarily shaped composite cross section, thecoordinates of the elastic centre may be expressed withrespect to the x–y axis system as [16]:
xec ¼AcEcxc þ AsEsxs þ AtEtxt
AcEc þ AsEs þ AtEt
, ð17Þ
yec ¼AcEcyc þ AsEsys þ AtEtyt
AcEc þ AsEs þ AtEt
, ð18Þ
in which Ec is the modulus of elasticity of the concrete (TS500 [34]), given as
Ec ¼ 3250ffiffiffiffiffif c
pþ 14 000 ðMPaÞ. (19)
For biaxial bending, ACI 318-99 [7] recommends thatthe moment magnification factors shall be computed foreach axis separately and multiplied by the correspondingmoments as follows:
Mux ¼ dxNuey; Muy ¼ dyNuex. (20)
To reach the ultimate strength value ðNuÞ of a slendercolumn, dx and dy are computed for each iteration untilsatisfying the equilibrium equations.
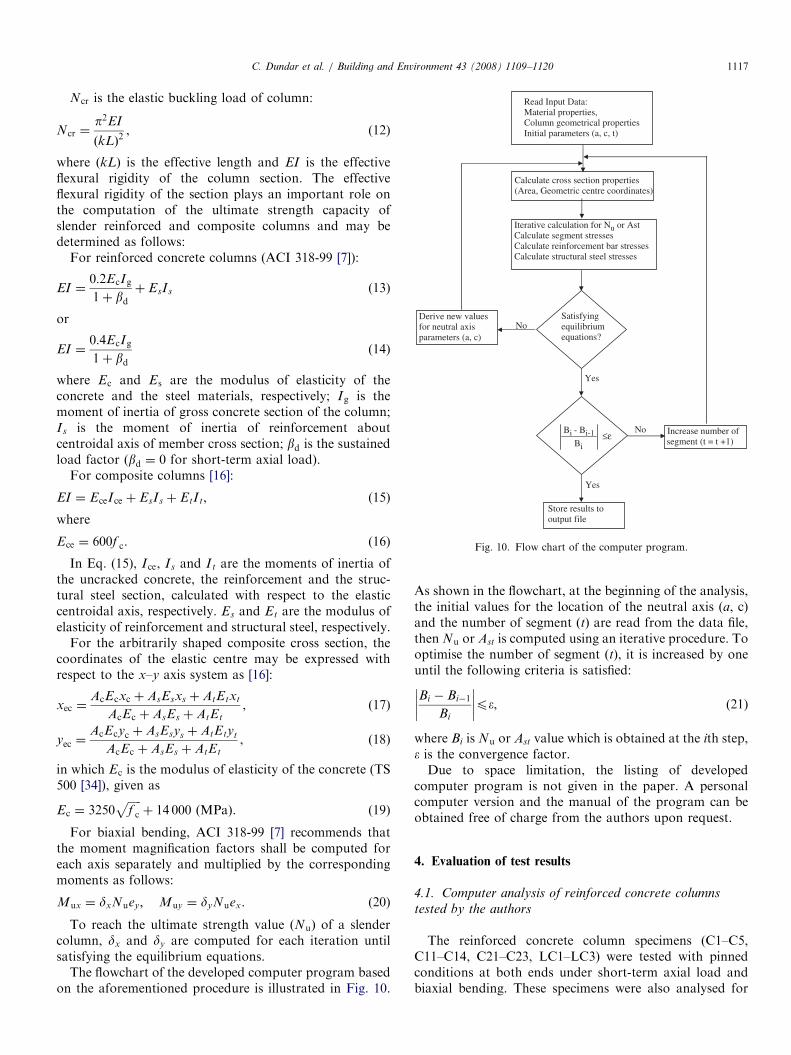
The flowchart of the developed computer program basedon the aforementioned procedure is illustrated in Fig. 10.
As shown in the flowchart, at the beginning of the analysis,the initial values for the location of the neutral axis (a, c)and the number of segment ðtÞ are read from the data file,then Nu or Ast is computed using an iterative procedure. Tooptimise the number of segment ðtÞ, it is increased by oneuntil the following criteria is satisfied:
Bi � Bi�1
Bi
p�, (21)
where Bi is Nu or Ast value which is obtained at the ith step,� is the convergence factor.Due to space limitation, the listing of developed
computer program is not given in the paper. A personalcomputer version and the manual of the program can beobtained free of charge from the authors upon request.
4. Evaluation of test results
4.1. Computer analysis of reinforced concrete columns
tested by the authors
The reinforced concrete column specimens (C1–C5,C11–C14, C21–C23, LC1–LC3) were tested with pinnedconditions at both ends under short-term axial load andbiaxial bending. These specimens were also analysed for
ARTICLE IN PRESS
Table 4
Comparative results for the reinforced concrete column specimens
Column no. Ratio
B/A C/A D/A E/A F/A G/A H/A
C1 1.016 0.999 1.008 1.173 0.991 0.895 —
C2 1.058 1.048 0.981 1.077 0.910 0.942 0.990
C3 0.943 0.932 0.892 1.016 0.845 0.838 0.876
C4 0.962 0.945 0.922 1.082 0.886 0.845 0.954
C5 0.962 0.945 0.933 1.068 0.891 0.846 0.952
C11 0.870 0.854 0.835 0.890 0.792 0.776 0.802
C12 1.045 0.962 0.987 1.041 0.922 0.867 0.930
C13 0.934 0.918 0.894 0.966 0.849 0.835 0.849
C14 1.094 1.086 1.058 1.170 1.026 1.044 1.105
C21 0.993 0.981 0.924 0.942 0.830 0.890 0.863
C22 1.049 1.049 0.949 1.033 0.920 0.944 1.029
C23 0.987 0.986 0.917 0.981 0.871 0.918 0.913
LC1 0.956 0.918 0.969 1.308 — 0.871 0.992
LC2 0.881 0.843 0.896 1.184 — 0.842 0.871
LC3 0.934 0.891 0.953 1.210 — 0.842 0.924
Mean ratio 0.979 0.957 0.941 1.076 0.894 0.880 0.932
14.3 14.3
63.5 mm
63.5 mm
14.3
14.3 19.05
19.05
25.4
19.05 19.05 25.4
Fig. 11. Composite column cross section of MC1–MC4.
C. Dundar et al. / Building and Environment 43 (2008) 1109–11201118
the ultimate strength capacities using the computerprogram.
In the ultimate strength analysis, various stress–strainmodels, Hognestad (HOG) [32], CEC [33], Kent and Parkunconfined [28] ðK&PðuÞÞ, Kent and Park confined [28]ðK&PðcÞÞ, Saatcioglu and Razvi [30] (S&R), Whitney StressBlock [9] (WSB) and experimental stress–strain relation-ships obtained from the cylinder specimens of the columnsby the authors (EXP), were used for the concretecompression zone in order to compute the theoreticalultimate strength capacity and to compare with theexperimental results of the column specimens. Experimen-tal results and obtained theoretical capacities according toeach stress–strain model are presented in Table 3,comparative ratios of the theoretical load to the experi-mental test load for the specimens are given in Table 4.
A good degree of accuracy has been obtained betweenthe theoretical results according to each concrete stress–strain models and the experimental results. The maximumpermissible strain assumed in the K&PðcÞ model for theconcrete compression zone is affected by confinementprovided by lateral ties. Most of the calculated loads byusing this model are higher than the test results andthe results of the other models. The mean ratios ofthe comparative results indicate that the shape of theconcrete stress–strain relationship has little effect on theultimate strength capacity of the column members as seenin Table 4. On the other hand, the maximum permissiblestrain plays the most important role on the ultimatestrength capacity.
4.2. Computer analysis of composite columns tested by
Munoz and Hsu
Munoz and Hsu [21] presented one short (MC1) andthree slender composite columns (MC2–MC4) with pinned
Table 3
Ultimate strength capacities of reinforced concrete columns
Column
no.
N test
(kN) (A)
Nu (theoretical)
HOG
(B)
CEC
(C)K&PðuÞ
(D)
K&PðcÞ
(E)
S&R
(F)
WSB
(G)
EXP
(H)
C1 89 90.45 88.95 89.75 104.44 88.18 79.66 —
C2 121 127.98 126.78 118.76 130.29 110.15 114.04 119.85
C3 125 117.83 116.51 111.45 127.00 105.63 104.71 109.45
C4 99 95.21 93.57 91.25 107.14 87.76 83.67 94.46
C5 94 90.47 88.83 87.70 100.42 83.78 79.55 89.46
C11 104 90.53 88.81 86.86 92.54 82.38 80.71 83.45
C12 95 99.24 91.39 93.74 98.96 87.63 82.38 88.31
C13 98 91.51 90.00 87.58 94.73 83.22 81.81 83.23
C14 58 63.46 63.02 61.38 67.88 59.51 60.57 64.10
C21 238 236.45 233.41 219.86 224.17 197.44 211.89 205.46
C22 199 208.82 208.83 188.86 205.71 183.00 187.88 204.78
C23 192 189.46 189.38 176.12 188.41 167.15 176.35 175.26
LC1 196 187.47 179.96 190.02 256.35 — 170.68 194.54
LC2 182 160.30 153.38 163.21 215.52 — 153.23 158.53
LC3 178 166.28 158.53 169.61 215.40 — 149.91 164.47
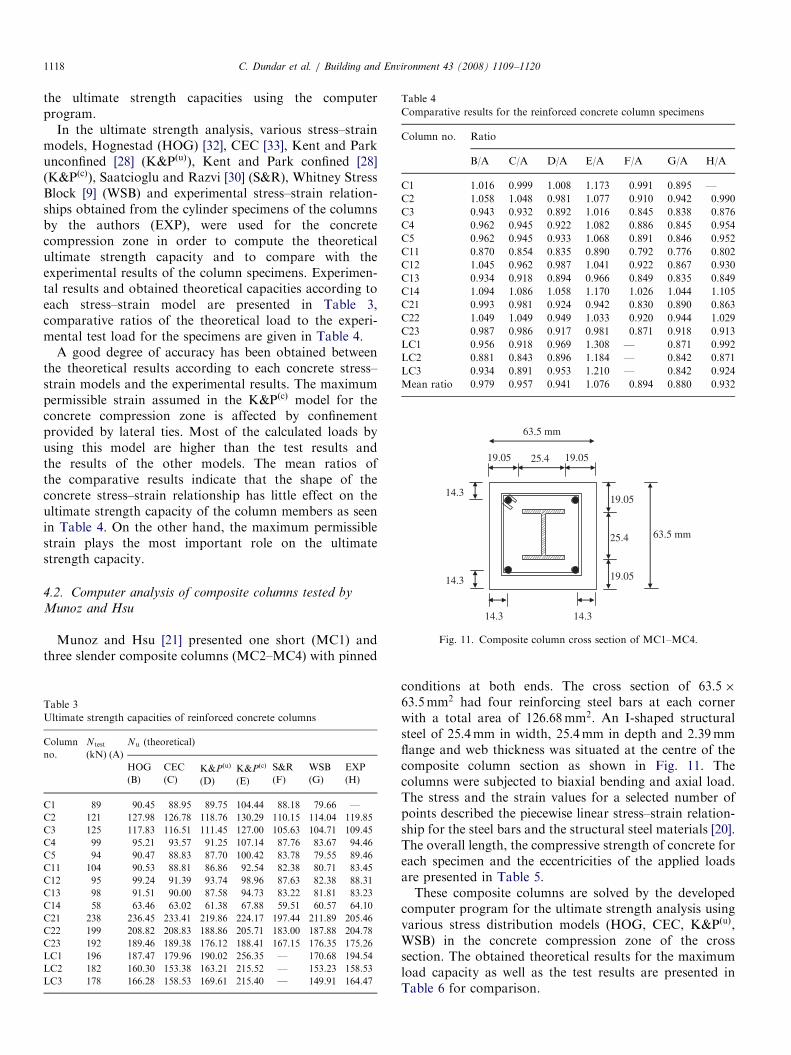
conditions at both ends. The cross section of 63:5�63:5mm2 had four reinforcing steel bars at each cornerwith a total area of 126:68mm2. An I-shaped structuralsteel of 25.4mm in width, 25.4mm in depth and 2.39mmflange and web thickness was situated at the centre of thecomposite column section as shown in Fig. 11. Thecolumns were subjected to biaxial bending and axial load.The stress and the strain values for a selected number ofpoints described the piecewise linear stress–strain relation-ship for the steel bars and the structural steel materials [20].The overall length, the compressive strength of concrete foreach specimen and the eccentricities of the applied loadsare presented in Table 5.These composite columns are solved by the developed
computer program for the ultimate strength analysis usingvarious stress distribution models (HOG, CEC, K&PðuÞ,WSB) in the concrete compression zone of the crosssection. The obtained theoretical results for the maximumload capacity as well as the test results are presented inTable 6 for comparison.
ARTICLE IN PRESS
Table 5
Specimen details of MC1–MC4
Column L (mm) f c (MPa) ex (mm) ey (mm)
MC1 812.8 36.77 38.10 38.10
MC2 1219.2 30.97 31.75 31.75
MC3 1219.2 25.83 25.40 25.40
MC4 1219.2 27.51 38.10 38.10
Table 6
Comparative results for the composite column specimens MC1–MC4
Column N test
(kN) (A)
Nu (theoretical) (kN) Ratio
HOG
(B)
CEC
(C)K&PðuÞ
(D)
WSB
(E)
B/A C/A D/A E/A
MC1 28.17 29.01 28.19 27.65 25.29 1.029 1.001 0.981 0.897
MC2 26.48 27.81 27.02 27.15 24.41 1.050 1.020 1.025 0.922
MC3 29.06 30.17 29.31 29.92 26.55 1.038 1.008 1.029 0.913
MC4 22.03 22.19 21.54 21.88 19.43 1.007 0.978 0.993 0.882
Mean
ratio
1.031 1.002 1.007 0.903
160 mm
160 mm
6 mm
4 mm
H-100×100×6×8 mm
30
30
100
3030 100
19 19
19
19
Fig. 12. Composite column cross section.
Table 7
Load carrying capacities and test results of composite columns
Column ex
(mm)
ey
(mm)
Ntest
(kN)
Nu (theoretical) (kN)
HOG CEC K&PðcÞ S&R
A4-00 40 0 499.91 488.37 497.82 492.69 473.82
A4-30 34.64 20 513.44 488.37 482.16 511.88 485.92
A4-45 28.28 28.28 518.83 507.22 500.10 541.82 511.98
A4-60 20 34.64 524.25 544.40 537.35 581.47 552.39
A4-90 0 40 740.44 635.28 645.67 584.12 479.29
B4-00 40 0 371.04 396.32 383.38 409.22 371.57
B4-30 34.64 20 392.62 410.89 406.42 422.39 405.46
B4-45 28.28 28.28 389.64 428.81 423.07 447.12 428.58
B4-60 20 34.64 436.41 461.39 455.33 482.60 464.06
B4-90 0 40 503.56 559.18 564.19 513.29 491.49
C4-00 40 0 274.61 313.95 311.97 293.34 311.03
C4-30 34.64 20 283.55 308.83 306.48 314.64 306.54
C4-45 28.28 28.28 304.47 322.10 319.04 331.83 323.38
C4-60 20 34.64 340.29 346.69 343.07 357.39 350.42
C4-90 0 40 411.94 435.75 429.75 416.51 410.14
C. Dundar et al. / Building and Environment 43 (2008) 1109–1120 1119
As can be seen from Table 6 the results obtained byusing WSB model are below the test results, sincemaximum permissible strain ð�cuÞ in concrete plays animportant role to achieve the ultimate strength capacity ofthe composite column section. Comparative results byusing the other stress–strain models show an excellentdegree of accuracy with the test results reported by Munozand Hsu [21].
4.3. Computer analysis of composite columns tested by
Morino et al.
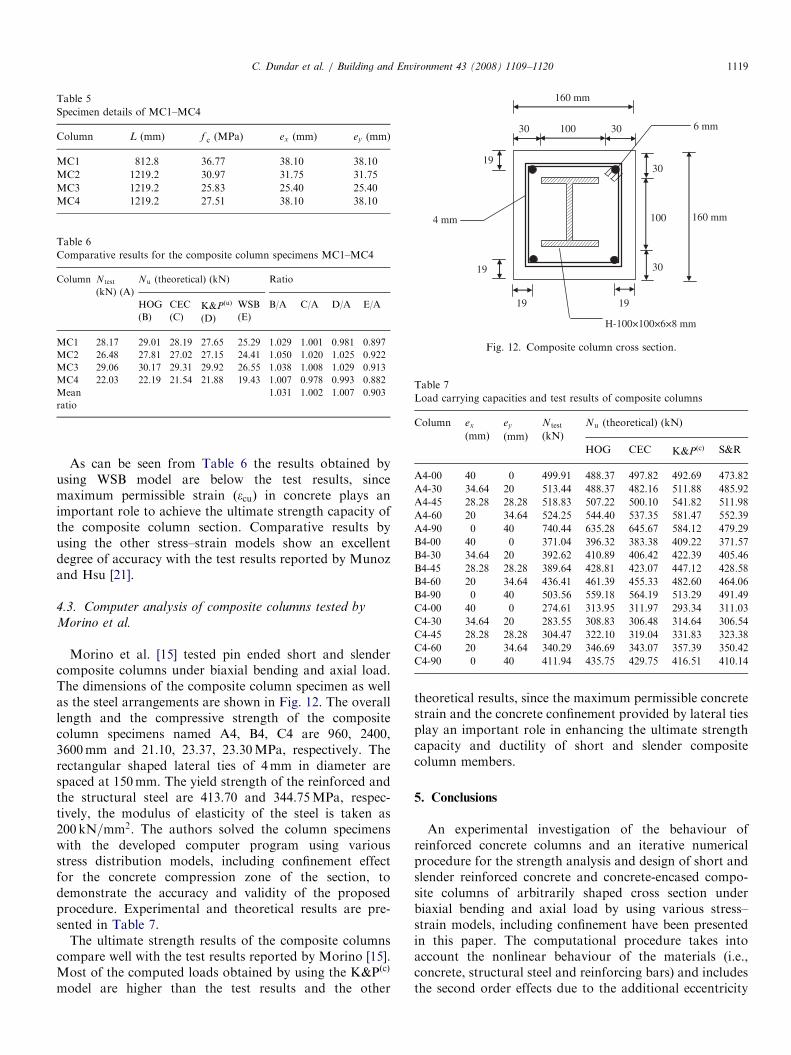
Morino et al. [15] tested pin ended short and slendercomposite columns under biaxial bending and axial load.The dimensions of the composite column specimen as wellas the steel arrangements are shown in Fig. 12. The overalllength and the compressive strength of the compositecolumn specimens named A4, B4, C4 are 960, 2400,3600mm and 21.10, 23.37, 23.30MPa, respectively. Therectangular shaped lateral ties of 4mm in diameter arespaced at 150mm. The yield strength of the reinforced andthe structural steel are 413.70 and 344.75MPa, respec-tively, the modulus of elasticity of the steel is taken as200 kN=mm2. The authors solved the column specimenswith the developed computer program using variousstress distribution models, including confinement effectfor the concrete compression zone of the section, todemonstrate the accuracy and validity of the proposedprocedure. Experimental and theoretical results are pre-sented in Table 7.
The ultimate strength results of the composite columnscompare well with the test results reported by Morino [15].Most of the computed loads obtained by using the K&PðcÞ
model are higher than the test results and the other
theoretical results, since the maximum permissible concretestrain and the concrete confinement provided by lateral tiesplay an important role in enhancing the ultimate strengthcapacity and ductility of short and slender compositecolumn members.
5. Conclusions
An experimental investigation of the behaviour ofreinforced concrete columns and an iterative numericalprocedure for the strength analysis and design of short andslender reinforced concrete and concrete-encased compo-site columns of arbitrarily shaped cross section underbiaxial bending and axial load by using various stress–strain models, including confinement have been presentedin this paper. The computational procedure takes intoaccount the nonlinear behaviour of the materials (i.e.,concrete, structural steel and reinforcing bars) and includesthe second order effects due to the additional eccentricity
ARTICLE IN PRESSC. Dundar et al. / Building and Environment 43 (2008) 1109–11201120
of the applied axial load by the Moment MagnificationMethod.
The capability and the reliability of the proposedprocedure and its computer program have been tested bymeans of comparisons with the experimental resultsreported by the authors of this study and other researchers.The theoretical and experimental results show that thecompressive strength of concrete and its correspondingcompressive strain are the most effective parameters on theultimate strength capacity of column members. However,the shape of the concrete stress–strain relationship has littleeffect on the ultimate strength capacity of the columnmembers.
Consequently, the ratio of computed axial load toexperimental load for different cross section of reinforcedand composite column members indicate that the resultsobtained by the proposed procedure have been in goodagreement with the test results of columns subjected tobiaxial bending and axial load.
References
[1] Furlong RW. Concrete columns under biaxially eccentric thrust. ACI
Journal October 1979:1093–118.
[2] Brondum-Nielsen T. Ultimate flexural capacity of fully prestressed,
partially prestressed, arbitrary concrete sections under symmetric
bending. ACI Journal 1986;83:29–35.
[3] Hsu CTT. Biaxially loaded L-shaped reinforced concrete columns.
Journal of Structural Engineering ASCE 1985;111(12):2576–95.
[4] Hsu CTT. Channel-shaped reinforced concrete compression members
under biaxial bending. ACI Structural Journal 1987;84:201–11.
[5] Dundar C. Concrete box sections under biaxial bending and axial
load. Journal of Structural Engineering 1990;116:860–5.
[6] Rangan BV. Strength of reinforced concrete slender columns. ACI
Structural Journal 1990;87(1):32–8.
[7] Building code requirements for structural concrete (ACI 318-99).
Detroit (MI): American Concrete Institute (ACI); 1999.
[8] Dundar C, Sahin B. Arbitrarily shaped reinforced concrete members
subjected to biaxial bending and axial load. Computers and
Structures 1993;49:643–62.
[9] Whitney CS. Plastic theory of reinforced concrete design. Transac-
tions, ASCE 1940;107:251–60.
[10] Rodriguez JA, Aristizabal-Ochoa JD. Biaxial interaction diagrams
for short RC columns of any cross section. Journal of Structural
Engineering 1999;125(6):672–83.
[11] Fafitis A. Interaction surfaces of reinforced-concrete sections in
biaxial bending. Journal of Structural Engineering 2001;127(7):840–6.
[12] Hong HP. Strength of slender reinforced concrete columns under
biaxial bending. Journal of Structural Engineering 2001;127(7):
758–62.
[13] Saatcioglu M, Razvi SR. High-strength concrete columns with
square sections under concentric compression. Journal of Structural
Engineering 1998;124(12):1438–47.
[14] Furlong RW, Hsu CTT, Mirza SA. Analysis and design of concrete
columns for biaxial bending-overview. ACI Structural Journal
2004;101(3):413–23.
[15] Morino S, Matsui C, Watanabe H. Strength of biaxially loaded
SRC columns. In: Proceedings of the US/Japan joint seminar on
composite and mixed construction. New York, NY: ASCE; 1984.
p. 185–94.
[16] Roik K, Bergmann R. Design method for composite columns
with unsymmetrical cross-sections. Journal of Constructional Steel
Research 1990;15:153–68.
[17] Virdi KS, Dowling PJ. The ultimate strength of composite columns in
biaxial bending. In: Proceedings of the institution of civil engineers,
Part 2; 1973. p. 251–72.
[18] Mirza SA. Parametric study of composite column strength varia-
bility. Journal of Constructional Steel Research 1989;14:121–37.
[19] Mirza SA, Skrabek W. Statistical analysis of slender composite beam-
column strength. Journal of Structural Engineering 1992;118(1):
1312–31.
[20] Munoz PR, Behavior of biaxially loaded concrete-encased composite
columns. PhD thesis, New Jersey Institute of Technology; 1994.
[21] Munoz PR, Hsu CT. Behavior of biaxially loaded concrete-encased
composite columns. Journal of Structural Engineering 1997;123(9):
1163–71.
[22] Munoz PR, Hsu CT. Biaxially loaded concrete-encased composite
columns: design equation. Journal of Structural Engineering 1997;
123(12):1576–85.
[23] Weng CC, Yen SI. Comparisons of concrete-encased composite
column strength provisions of ACI code and AISC specifications.
Engineering Structures 2002;24:59–72.
[24] Load and resistance factor design specification for structural steel
buildings. 2nd ed. Chicago, IL: American Institute of Steel
Construction (AISC); 1993.
[25] Lachance L. Ultimate strength of biaxially loaded composite sections.
Journal of Structural Division, ASCE 1982;108:2313–29.
[26] Chen SF, Teng JG, Chan SL. Design of biaxially loaded short
composite columns of arbitrary section. Journal of Structural
Engineering 2001;127(6):678–85.
[27] Sfakianakis MG. Biaxial bending with axial force of reinforced,
composite and repaired concrete sections of arbitrary shape by fiber
model and computer graphics. Advances in Engineering Software
2002;33:227–42.
[28] Kent DC, Park R. Flexural members with confined concrete. Journal
of Structural Division ASCE 1971;97(7):1969–90.
[29] Sheikh SA, Uzumeri SM. Analytical model for concrete confinement
in tied columns. Journal of Structural Division ASCE 1982;108(12):
2703–22.
[30] Saatcioglu M, Razvi SR. Strength and ductility of confined concrete.
Journal of Structural Engineering 1992;118(6):1590–607.
[31] Chung HS, Yang KH, Lee YH, Eun HC. Stress–strain curve
of laterally confined concrete. Engineering Structures 2002;24:
1153–63.
[32] Hognestad E, Hanson NW, McHenry D. Concrete stress distribution
in ultimate stress design. ACI Journal 1955;27(4):455–79.
[33] Commission of the European Communities (CEC). Design of
composite steel and concrete structures. Brussels: Eurocode 4; 1984.
[34] Building code requirements for reinforced concrete (TS 500). Ankara:
Turkish Standards Institution; 2000.
Recommended
![Experimental behaviour and strength of concrete-encased … · 2019-03-27 · bending and axial compressive load [3–6], and behaviour under biaxial bending and axial compressive](https://img.pdfslide.net/doc/110x75/5e54a910ee6ea919d33e4e9a/experimental-behaviour-and-strength-of-concrete-encased-2019-03-27-bending-and.jpg)