Calculation of PNEC for changed grain size based on data from MOD
Report APN-411.3088.1

N-9296 Tromsø, Norway Tel. +47 77 75 03 00 Fax +47 77 75 03 01
Rapporttittel /Report title
Calculation of PNEC for changed grain size
based on data from MOD
Forfatter(e) / Author(s) Akvaplan-niva rapport nr / report no: Hilde C. Trannum APN-411.3088.1 Dato / Date: 15/12/04 Antall sider / No. of pages 9 Distribusjon / Distribution Begrenset/Restricted Oppdragsgiver / Client Oppdragsg. ref. / Client ref. SINTEF Ivar Singsaas Sammendrag / Summary
This report presents the results of PNEC calculations for changed grain size based on data available in the Norwegian shelf off-shore monitoring database (MOD). The PNEC-values will be used in the development of an EIF (Environmental Impact Factor) for drilling discharges, where effect of changed grain size is one of the disturbance factors that will be taken into account. The benthic species of the Norwegian and Barents Seas seem to more robust to changes in grain size as compared to the benthic species of the North Sea; however, it is highly recommended to control this preliminary result using a larger dataset. Emneord: Key words:
ERMS ERMS PNEC PNEC SSD SSD Kornstørrelse Grain size MOD MOD Prosjektleder / Project manager Kvalitetskontroll / Quality control
Hilde C. Trannum Salve Dahle
© 2006 Akvaplan-niva
Calculation of PNEC for changed grain size based on data from MOD
Akvaplan-niva AS. Report APN-411.3088.1
Table of Content 1 Introduction 5 2 Methodology 5
2.1 Selection of stations 5 2.2 Selection of species 5
3 Results 6 3.1 PNEC for regions I – IV (North Sea) 6 3.2 PNEC for region VI, Trøndelag (Norwegian Sea) 7 3.3 PNEC for region IX, Finnmark (Barents Sea) 7
4 Discussion and recommendations 8
4
Calculation of PNEC for changed grain size based on data from MOD
Akvaplan-niva AS. Report APN-411.3088.1
1 Introduction Within the ERMS project, an Environmental Impact Factor for drilling discharges will be developed, taking account of both toxic and non-toxic impacts. The non-toxic impacts to the sea floor consider the settlement of particles to the sediment surface, resulting in burial of organisms, reduced oxygen concentrations in the sediment and changed grain size of the upper sediment layer. This report deals with effects to the benthic organisms of changed grain size. In this context, PNEC represents “Predicted No Environmental Change” rather than “Predicted No Effect Concentrations”, which is used for toxic impacts. Based on the species sensitivity distribution (SSD), TNO has calculated the PNEC for changed grain size based on a review of benthic surveys in the Dutch sector of the North Sea (Holtaus et al., 2003). The aim of this study is to provide similar information for stations available in MOD (database containing the data from the offshore environmental monitoring on the Norwegian shelf, and encompasses stations in the North Sea, the Norwegian Sea and the Barents Sea), and to investigate whether there are regional differences that should be taken into account.
2 Methodology A detailed description of the mathematical base for the PNEC derivation is not given here as the calculations are based on the methodology in Holtaus et al. (2003). However, it can short be mentioned that the basis for the method is that the cumulative distribution of the species sensitivity is plotted against the coefficient of variance (COV) (standard deviation divided by the average grain size)) for the grain size. The coefficient of variance is used as an indicator of the percentage of change that will be tolerated by a species. In the same plot a fitted curve showing the normal distribution is given. Given that the true data show a good fit to this curve, the value where 5% of the species are likely to be affected, can be calculated. The calculations are based on the grain size in µm because this measure was used in Holtaus et al. (2003). In the Norwegian offshore surveys the grain size is measured in phi (φ), where φ = -log2d (d = particle diameter in mm). These values were therefore transformed to µm.
2.1 Selection of stations To ensure that only stations that are undisturbed by the offshore drilling activities are included, only the regional stations and the reference stations are used. Baseline field data (monitoring surveys carried out prior to the initiation of oil and gas production) may also fulfil this criterion, and such stations may eventually be included in a follow-up project to increase the reliability of the calculations.
2.2 Selection of species In each monitoring region, species that were abundant on approximately 10% of the stations or more were included. Only animals identified to species level were included in the analyses, taxa identified to a higher taxonomic level were thus excluded. On the reference stations ten replicates are sampled, in contrast to five replicates on the other stations, including the regional stations. To give each station the same weight, only the first five replicates from the reference stations are included in the analyses.
5
Calculation of PNEC for changed grain size based on data from MOD
Akvaplan-niva AS. Report APN-411.3088.1
3 Results
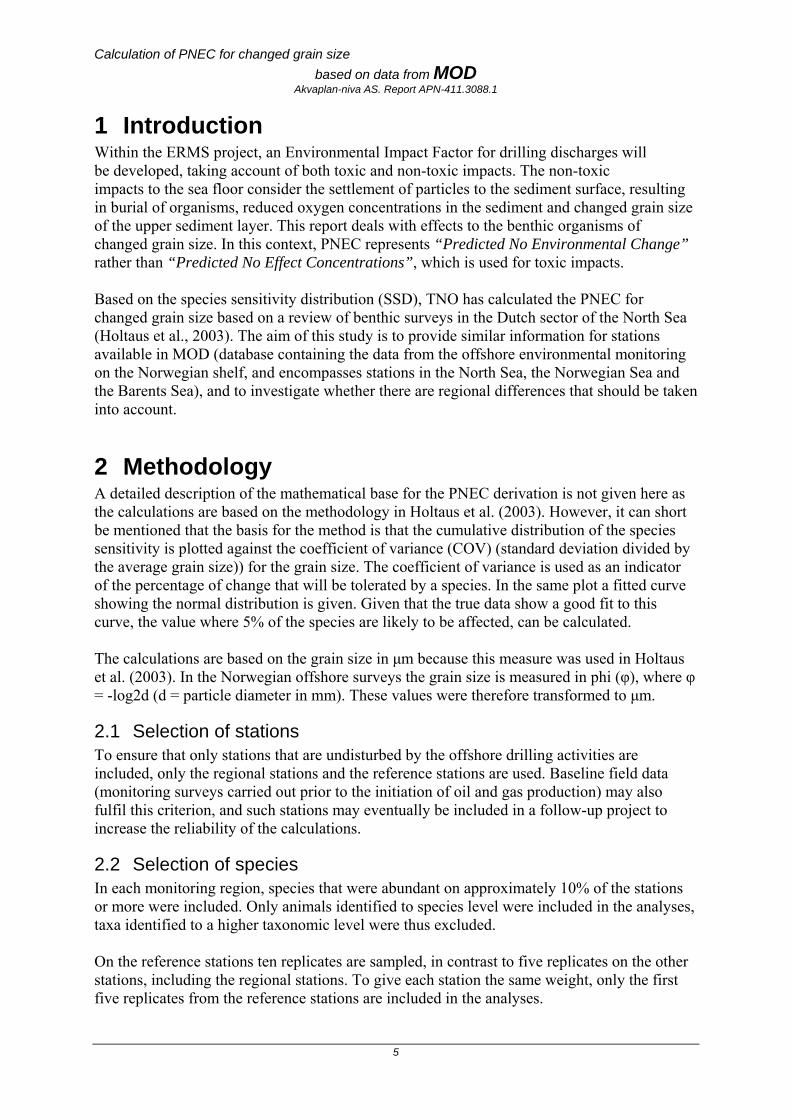
3.1 PNEC for regions I – IV (North Sea) The stations from regions I – IV were treated together as they all belong to the North Sea. The area ranges from 56º - 62º N. In total 78 regional and reference stations contained data on both the median grain size and species data for the same year. The station depth varies between 65 m and 356 m. The dataset contained 933 taxa, and 324 taxa were recorded at more than 8 stations. When taxa identified to genus level or higher were excluded, 246 species remained, and represent the basis for the calculations. The cumulative distribution of the species sensitivity for regions I-IV is shown in Figure 1. The curve of the true data shows a very good correlation to the normal distribution curve, which means that one can assume that the data have a normal distribution, and use the formula for the normal distribution curve to calculate the PNEC value. When the risk is 5%, the PNEC for changed grain size is determined at the level of 21.1% change. This is exactly the same as Holtaus et al. (2003) calculated for the Dutch sector of the North Sea.
Cumulative distribution of species sensitivity to altered grain sizes - region I-IV (North Sea)
0,00,10,20,30,40,50,60,70,80,91,0
0,01 0,10 1,00 10,00COV grain size
Ris
k true datanormal distribution curve
PNEC = 21.1%
Figure 1. Species Sensitivity Distribution (SSD) of species sensitivity to grain size in regions I-IV. Data on the x-axis are log scaled.
The COV for grain size ranges from 0.02 to 9.66. This means that the variation in the grain size ranges for each species generally was large. It is interesting to note that the scale in COV for grain size for the Dutch sector ranges from 0.14 to only 0.49. Despite of these differences, the calculated PNECs were the same for the Dutch and Norwegian sectors of the North Sea (21%).
6
Calculation of PNEC for changed grain size based on data from MOD
Akvaplan-niva AS. Report APN-411.3088.1
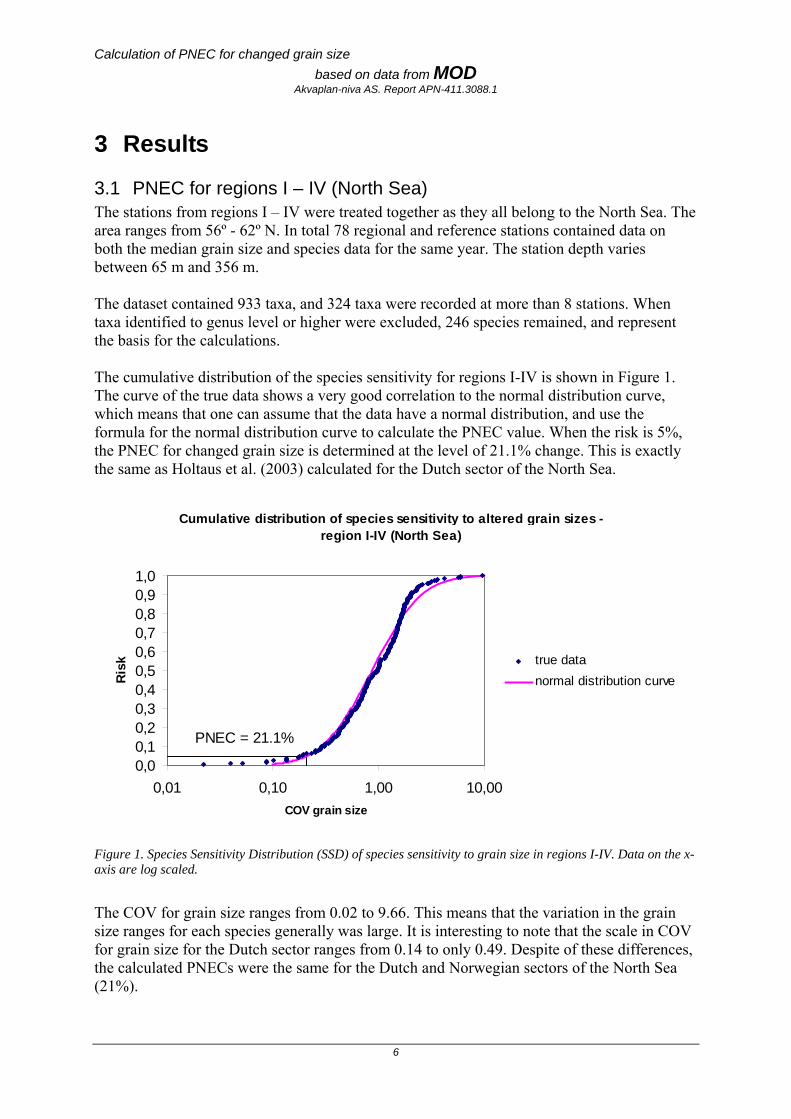
3.2 PNEC for region VI, Trøndelag (Norwegian Sea) Region VI, Trøndelag, covers an area from 64º - 66º N. As this area is less exploited than the North Sea, only 21 reference and regional stations from this region were available in MOD. The station depth varies between 133 - 434 m. 415 taxa were recorded at the 21 stations, and 177 taxa were recorded at more than 3 stations. 147 species remained when taxa identified to genus level or higher were excluded, and these species represent the basis for the calculations. The cumulative distribution of the species sensitivity for Region VI is shown in Figure 2. The curve of the true data slightly deviates from the normal distribution curve. However, based on that curve, the PNEC for changed grain size is determined at the level of 42.2% change when the risk is 5%.
Cumulative distribution of species sensitivity to altered grain sizes - region VI (Norwegian Sea)
0,00,10,20,30,40,50,60,70,80,91,0
0,01 0,10 1,00 10,00COV grain size
Risk True data
normal distribution curve
PNEC = 42.2%
Figure 2. Species Sensitivity Distribution (SSD) of species sensitivity to grain size in Region VI. Data on the x-axis are log scaled.
It is assumed that the field data deviation from the normal distribution is connected to a limited data set. Not more than 21 stations were available for the calculations, and some species were present at only 3 stations. In order to be sure that the calculations are based on a sufficient data basis, it is therefore recommended to include more stations, i.e. baseline field data, where this is available.
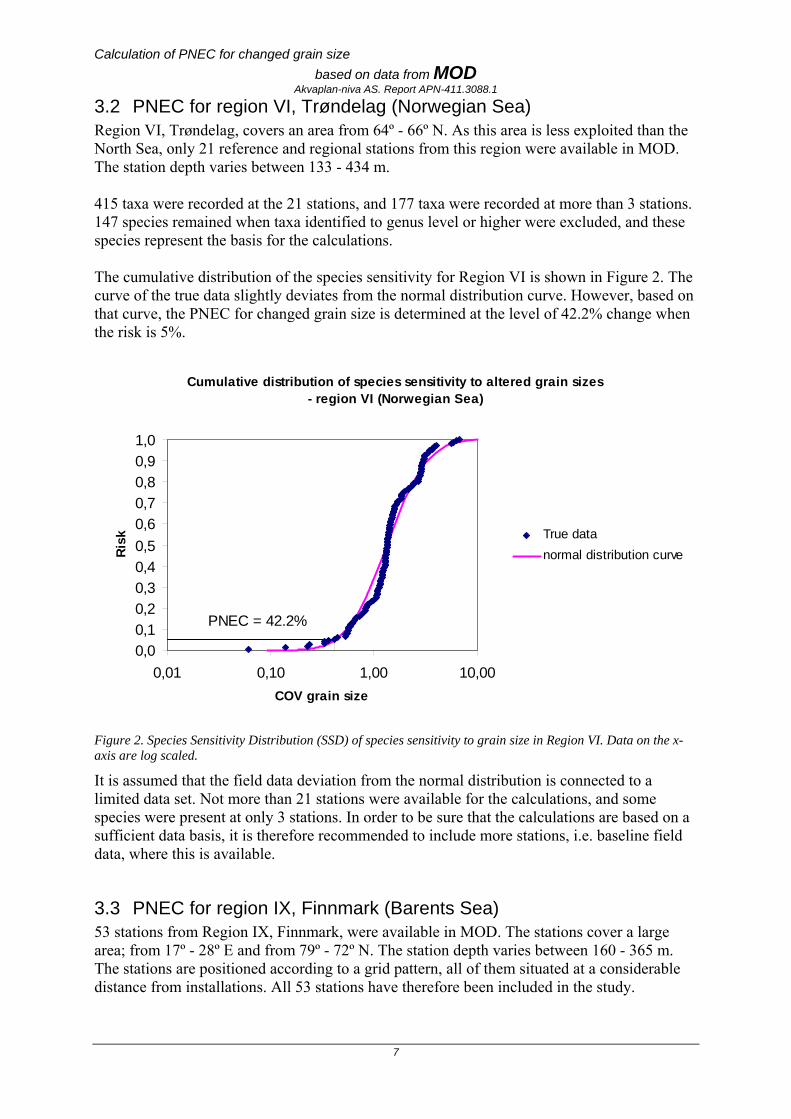
3.3 PNEC for region IX, Finnmark (Barents Sea) 53 stations from Region IX, Finnmark, were available in MOD. The stations cover a large area; from 17º - 28º E and from 79º - 72º N. The station depth varies between 160 - 365 m. The stations are positioned according to a grid pattern, all of them situated at a considerable distance from installations. All 53 stations have therefore been included in the study.
7
Calculation of PNEC for changed grain size based on data from MOD
Akvaplan-niva AS. Report APN-411.3088.1 586 taxa were recorded at the 53 stations, and 292 taxa were recorded at more than 5 stations. 245 species remained when taxa identified to genus level or higher were excluded, and these species represent the base for the calculations. The cumulative distribution of the species sensitivity is shown in Figure 3. The curve of the true data showed a very good correlation to the normal distribution curve, which means that one can assume that the data have a normal distribution, and use the formula for that curve to calculate the PNEC value. When the risk is 5%, the PNEC for changed grain size is determined at the level of 39.7% change.
Cumulative distribution of species sensitivity to altered grain sizes - region IX (Barents Sea)
0,00,10,20,30,40,50,60,70,80,91,0
0,01 0,10 1,00 10,00COV grain size
Risk true data
normal distribution curve
PNEC = 39.7%
Figure 3. Species Sensitivity Distribution (SSD) of species sensitivity to grain size in Region IX. Data on the x-axis are log scaled.
4 Discussion and recommendations According to the results of this study, it appears that the benthic communities in the Norwegian and Barents Sea are more tolerant to changed grain size than the benthic communities in the North Sea (Norwegian and Dutch sectors). However, it is important to be aware of the fact that the data base for the calculations is much sparser for the northern areas. For all areas there was a tendency that both the species in the lower (apparently low tolerance) and upper part (apparently high tolerance) of the SSD curve were accounted on only a few stations. When having fewer observations as input data, the influence of statistical outliers is greatly increased. Particularly for Region VI (Trøndelag) it is therefore recommended to include more data, i.e. baseline field data. At the present stage it is considered too early to conclude that northern benthic communities are more robust towards altered grain size than communities further south.
8
Calculation of PNEC for changed grain size based on data from MOD
Akvaplan-niva AS. Report APN-411.3088.1 During the ERMS workshop in Rome in September 2004, it was recommended to derive depth dependent PNECs. This was because the tolerance towards changed grain size is assumed to depend more on the sediment regime the species live in, which again is highly dependent on depth, than the actual geographical region. Depth data will always be available when doing a risk assessment of a particular field, and should therefore be used as an input factor. It is also recommended to examine whether the most sensitive species (the 5% group of this study where impacts are “accepted”), belong to a particular group or have a particular ecological function. Some species have key functional roles and their removal may therefore have cascading effects in the ecosystem, which means that one ends up with more than 5% risk. Furthermore, if one particular functional group (e.g. species living at the sediment surface) is affected, pelagic species depending on the benthos as a food source may also be affected. Regarding MOD we want to mention that the free version was not available to us, which means that the extraction of data was very time-consuming. If we had received the open version, we would have had the opportunity to use more data in the calculations. However, in another ERMS project we have now received MOD-data from UiO, who has access to the open MOD-version, which means that eventual calculations based on more data will be far less time-consuming than in the present project. References Holtaus, K.I.E., J.E. Tamis, M.G.D. Smit and R.G. Jak, 2003. SSD approach applied to three types of Sediment Disturbances related to Drilling Discharges. TNO-report 33980. Draft.
9
Recommended