13
2 Economic outlook
In brief • GDP growth is projected to increase from 1.8 per cent in 2013 to 3.5 per cent in 2016.
• The medium-term outlook is supported by investment in electricity and transport that will lift output constraints, an expected pick-up in private investment and low real interest rates.
• The stronger global recovery presents new opportunities to increase exports, provided that the domestic economy can raise productivity and competitiveness.
• The weaker rand exchange rate is a risk to the inflation outlook, but sustained real depreciation can increase export competitiveness. This will require monetary and fiscal choices to ensure low and stable inflation.
• In line with the National Development Plan (NDP), government continues to invest in economic infrastructure, and supports a range of microeconomic reforms to boost potential growth.
Overview
hile moderate economic growth continues and the outlook improves over the next several years, the South African economy is performing below its potential. Over the period
ahead, new power plants and transport infrastructure will lift constraints to output, a stronger global recovery will support exports, and growth in sub-Saharan Africa will promote expanded trade and investment. The macroeconomic framework is resilient, supported by healthy public finances. To grow the economy at a faster rate that can rapidly reduce unemployment and poverty requires bold decisions to increase competitiveness and innovation in a fast-changing world.
Government has adopted the NDP as its framework for economic and social development. The plan’s success depends on partnerships between business, labour, government and civil society. The integrated actions proposed in the NDP will boost long-term growth and job creation.
South Africa needs to become more competitive and innovative in a fast-changing world economy
W
2014 BUDGET REVIEW
14
20 years of transforming the economy Despite the significant development challenges that it continues to face, South Africa today is a wealthier society than it was in 1994, with greater access to economic opportunities and reduced levels of poverty.
Macroeconomic stability – anchored in prudent fiscal management, inflation targeting and a flexible exchange rate – has translated into declining interest rates, stable inflation, improving government finances, higher investment and exports, and rising GDP per person. Inflation, which averaged 14 per cent in the decade prior to 1994, fell to an average of 5.5 per cent between 2003 and 2013. Improved government finances contributed to a broad decline in borrowing costs across the economy.
South Africa has become integrated into the world economy. Other African and emerging economies account for a growing share of trade and investment. Large firms have access to capital and have expanded operations to other jurisdictions. Local equity and bond markets have drawn in large domestic and global capital flows, contributing to investments that have benefited the economy as a whole.
Black ownership of Johannesburg Stock Exchange (JSE) listed shares increased from 5 per cent in 1995 to 21 per cent in 2012. The percentage of executive managers who are black (both public and private sector) increased from 13 per cent in 2000 to 32 per cent in 2012, and senior managers who are black increased from 19 per cent in 2000 to 39 per cent in 2012. Africans now make up the majority of South Africa’s middle class.
Revised economic outlook
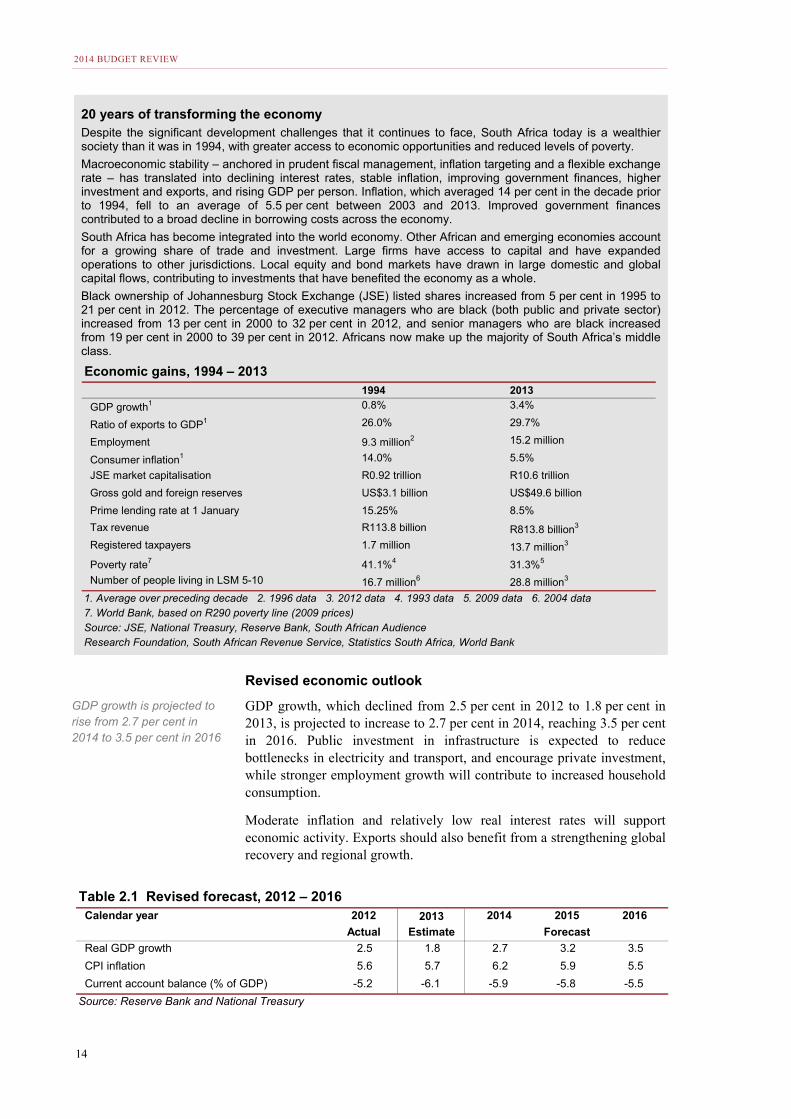
GDP growth, which declined from 2.5 per cent in 2012 to 1.8 per cent in 2013, is projected to increase to 2.7 per cent in 2014, reaching 3.5 per cent in 2016. Public investment in infrastructure is expected to reduce bottlenecks in electricity and transport, and encourage private investment, while stronger employment growth will contribute to increased household consumption.
Moderate inflation and relatively low real interest rates will support economic activity. Exports should also benefit from a strengthening global recovery and regional growth.
Economic gains, 1994 – 20131994 2013
GDP growth1 0.8% 3.4%
Ratio of exports to GDP1 26.0% 29.7%
Employment 9.3 million2 15.2 million
Consumer inflation1 14.0% 5.5%
JSE market capitalisation R0.92 trillion R10.6 trillion
Gross gold and foreign reserves US$3.1 billion US$49.6 billion
Prime lending rate at 1 January 15.25% 8.5%
Tax revenue R113.8 billion R813.8 billion3
Registered taxpayers 1.7 million 13.7 million3
Poverty rate7 41.1%4 31.3%5
Number of people living in LSM 5-10 16.7 million6 28.8 million3
1. Average over preceding decade 2. 1996 data 3. 2012 data 4. 1993 data 5. 2009 data 6. 2004 data7. World Bank, based on R290 poverty line (2009 prices)Source: JSE, National Treasury, Reserve Bank, South African Audience Research Foundation, South African Revenue Service, Statistics South Africa, World Bank
Table 2.1 Revised forecast, 2012 – 2016Calendar year 2012 2013 2014 2015 2016
Actual Estimate Forecast
Real GDP growth 2.5 1.8 2.7 3.2 3.5
CPI inflation 5.6 5.7 6.2 5.9 5.5
Current account balance (% of GDP) -5.2 -6.1 -5.9 -5.8 -5.5
Source: Reserve Bank and National Treasury
GDP growth is projected to rise from 2.7 per cent in 2014 to 3.5 per cent in 2016
CHAPTER 2: ECONOMIC OUTLOOK
15
Global outlook
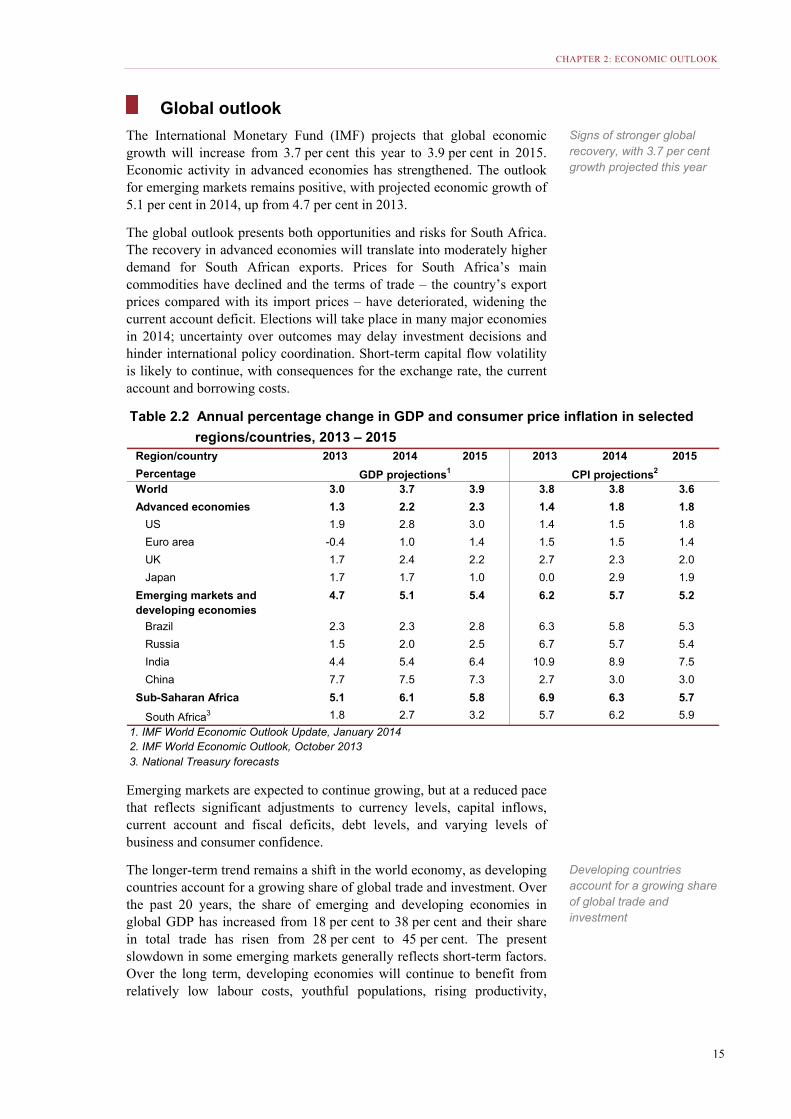
The International Monetary Fund (IMF) projects that global economic growth will increase from 3.7 per cent this year to 3.9 per cent in 2015. Economic activity in advanced economies has strengthened. The outlook for emerging markets remains positive, with projected economic growth of 5.1 per cent in 2014, up from 4.7 per cent in 2013.
The global outlook presents both opportunities and risks for South Africa. The recovery in advanced economies will translate into moderately higher demand for South African exports. Prices for South Africa’s main commodities have declined and the terms of trade – the country’s export prices compared with its import prices – have deteriorated, widening the current account deficit. Elections will take place in many major economies in 2014; uncertainty over outcomes may delay investment decisions and hinder international policy coordination. Short-term capital flow volatility is likely to continue, with consequences for the exchange rate, the current account and borrowing costs.
Emerging markets are expected to continue growing, but at a reduced pace that reflects significant adjustments to currency levels, capital inflows, current account and fiscal deficits, debt levels, and varying levels of business and consumer confidence.
The longer-term trend remains a shift in the world economy, as developing countries account for a growing share of global trade and investment. Over the past 20 years, the share of emerging and developing economies in global GDP has increased from 18 per cent to 38 per cent and their share in total trade has risen from 28 per cent to 45 per cent. The present slowdown in some emerging markets generally reflects short-term factors. Over the long term, developing economies will continue to benefit from relatively low labour costs, youthful populations, rising productivity,
Table 2.2 Annual percentage change in GDP and consumer price inflation in selected
regions/countries, 2013 – 2015Region/country 2013 2014 2015 2013 2014 2015
PercentageWorld 3.0 3.7 3.9 3.8 3.8 3.6
Advanced economies 1.3 2.2 2.3 1.4 1.8 1.8
US 1.9 2.8 3.0 1.4 1.5 1.8
Euro area -0.4 1.0 1.4 1.5 1.5 1.4
UK 1.7 2.4 2.2 2.7 2.3 2.0
Japan 1.7 1.7 1.0 0.0 2.9 1.9
Emerging markets and developing economies
4.7 5.1 5.4 6.2 5.7 5.2
Brazil 2.3 2.3 2.8 6.3 5.8 5.3
Russia 1.5 2.0 2.5 6.7 5.7 5.4
India 4.4 5.4 6.4 10.9 8.9 7.5
China 7.7 7.5 7.3 2.7 3.0 3.0
Sub-Saharan Africa 5.1 6.1 5.8 6.9 6.3 5.7
South Africa3 1.8 2.7 3.2 5.7 6.2 5.9
1. IMF World Economic Outlook Update, January 2014 2. IMF World Economic Outlook, October 20133. National Treasury forecasts
CPI projections2GDP projections1
Signs of stronger global recovery, with 3.7 per cent growth projected this year
Developing countries account for a growing share of global trade and investment
2014 BUDGET REVIEW
16
further improvements in communication and transport, and growing middle classes.
On balance, the South African economy continues to draw strength from emerging-market trends. Slowing growth in China, and its shift away from investment-led growth, may lower the prices of South Africa’s commodity exports. However, China’s shift towards greater consumption, along with regulatory reform in India and investment expansion in Africa, provides new opportunities for South African firms to export manufactured goods and services, and to strengthen regional linkages.
Advanced economies
United States – The US economy is expected to grow by 2.8 per cent in 2014, up from 1.9 per cent in 2013. Improving housing and labour markets provide a favourable backdrop for domestic demand growth. While unemployment has declined, the number of people who are no longer counted as part of the workforce has increased. The pace of monetary tightening is a risk to the outlook.
Europe – In the euro monetary area, South Africa’s second-largest market for non-mineral exports, growth is projected to improve marginally to 1 per cent in 2014. In the United Kingdom, GDP growth of 2.4 per cent is expected in 2014, up from 1.7 per cent in 2013. The recovery remains anaemic and uneven across Europe, with persistently high unemployment in France, Spain, Greece and Italy. The banking system remains undercapitalised, posing a risk to financial stability and the recovery.
Japan – Japan accounts for 6.6 per cent of South Africa’s exports. GDP growth reached 1.7 per cent in 2013 and is projected to remain at that level in 2014. Rising government debt could put pressure on the fiscus.
Developing economies
Sub-Saharan Africa – This is expected to remain the second fastest growing region in economic terms, with growth of 6.1 per cent in 2014 and 5.8 per cent in 2015. The region recorded 16.2 per cent growth in net foreign direct investment in 2013, concentrated in natural resources and services. Over the next 10 years, the region’s real per capita income is expected to increase by over 30 per cent. The primary risks for the region relate to moderating commodity prices due to slower growth in China.
China – The Chinese economy, now the world’s second largest, continues to grow strongly, but at a reduced pace. GDP growth is projected at 7.7 per cent in 2013, 7.5 per cent in 2014 and 7.3 per cent in 2015. The model on which the country has relied for rapid economic growth has come under pressure owing to demographic shifts and rising demand for higher wages. A rebalancing of the economy from investment-led growth towards greater consumption is under way. High debt levels, rising borrowing costs and bank liquidity concerns are risks to the outlook.
India – GDP growth of 5.4 per cent is projected for 2014, up from 4.4 per cent in 2013. High inflation, rising interest rates, and continued market and capital flow volatility are risks to the outlook.
Brazil – The economy will benefit from improving export growth and strong public investment for the 2014 soccer World Cup and the 2016
South African economy continues to draw strength from emerging-market trends
Growth in Europe expected to improve marginally to 1 per cent in 2014
Sub-Saharan Africa expected to grow by 6.1 per cent in 2014
CHAPTER 2: ECONOMIC OUTLOOK
17
summer Olympics. GDP growth is projected at 2.3 per cent in 2014 and 2.8 per cent in 2015. Capital flow volatility and rising interest rates are risks to the outlook.
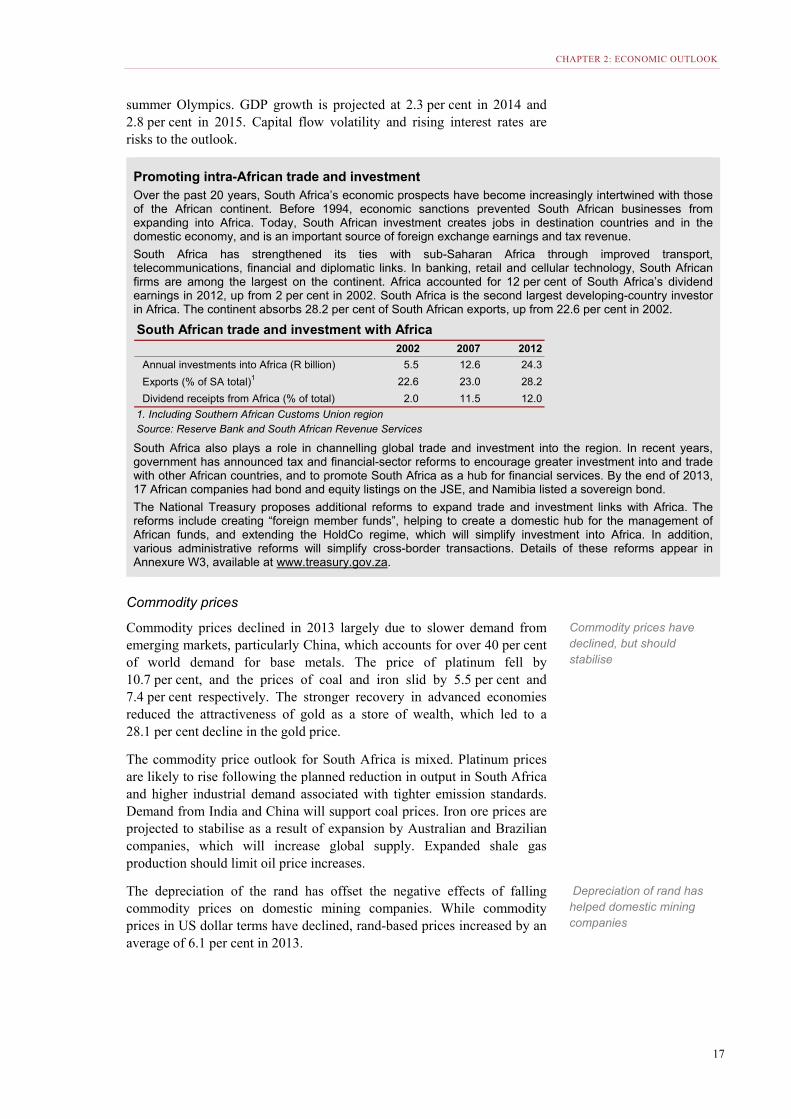
Promoting intra-African trade and investment Over the past 20 years, South Africa’s economic prospects have become increasingly intertwined with those of the African continent. Before 1994, economic sanctions prevented South African businesses from expanding into Africa. Today, South African investment creates jobs in destination countries and in the domestic economy, and is an important source of foreign exchange earnings and tax revenue.
South Africa has strengthened its ties with sub-Saharan Africa through improved transport, telecommunications, financial and diplomatic links. In banking, retail and cellular technology, South African firms are among the largest on the continent. Africa accounted for 12 per cent of South Africa’s dividend earnings in 2012, up from 2 per cent in 2002. South Africa is the second largest developing-country investor in Africa. The continent absorbs 28.2 per cent of South African exports, up from 22.6 per cent in 2002.
South Africa also plays a role in channelling global trade and investment into the region. In recent years, government has announced tax and financial-sector reforms to encourage greater investment into and trade with other African countries, and to promote South Africa as a hub for financial services. By the end of 2013, 17 African companies had bond and equity listings on the JSE, and Namibia listed a sovereign bond.
The National Treasury proposes additional reforms to expand trade and investment links with Africa. The reforms include creating “foreign member funds”, helping to create a domestic hub for the management of African funds, and extending the HoldCo regime, which will simplify investment into Africa. In addition, various administrative reforms will simplify cross-border transactions. Details of these reforms appear in Annexure W3, available at www.treasury.gov.za.
Commodity prices
Commodity prices declined in 2013 largely due to slower demand from emerging markets, particularly China, which accounts for over 40 per cent of world demand for base metals. The price of platinum fell by 10.7 per cent, and the prices of coal and iron slid by 5.5 per cent and 7.4 per cent respectively. The stronger recovery in advanced economies reduced the attractiveness of gold as a store of wealth, which led to a 28.1 per cent decline in the gold price.
The commodity price outlook for South Africa is mixed. Platinum prices are likely to rise following the planned reduction in output in South Africa and higher industrial demand associated with tighter emission standards. Demand from India and China will support coal prices. Iron ore prices are projected to stabilise as a result of expansion by Australian and Brazilian companies, which will increase global supply. Expanded shale gas production should limit oil price increases.
The depreciation of the rand has offset the negative effects of falling commodity prices on domestic mining companies. While commodity prices in US dollar terms have declined, rand-based prices increased by an average of 6.1 per cent in 2013.
South African trade and investment with Africa 2002 2007 2012
Annual investments into Africa (R billion) 5.5 12.6 24.3
Exports (% of SA total)1 22.6 23.0 28.2
Dividend receipts from Africa (% of total) 2.0 11.5 12.0
1. Including Southern African Customs Union regionSource: Reserve Bank and South African Revenue Services
Commodity prices have declined, but should stabilise
Depreciation of rand has helped domestic mining companies
2014 BUDGET REVIEW
18
Capital flows, exchange rates and inflation
Volatile capital flows have contributed to a depreciation of the rand, putting upward pressure on inflation. A sharp reduction in capital inflows during 2013 reflected the general pullback from emerging markets, as well as domestic factors such as industrial action in mining and manufacturing, a decline in business and consumer confidence, and electricity shortages. The rand was also affected by a widening current account deficit. As in previous episodes of capital flow volatility, South Africa’s flexible exchange rate and the inflation-targeting framework have acted as shock absorbers, allowing the economy to adjust to external developments.
Capital flows
Capital flows into emerging markets fell sharply after the May 2013 announcement by the US Federal Reserve that it would begin to reduce its asset-purchase programme. Emerging markets recorded outflows of over US$100 billion between June and December. The pace of outflows accelerated in January 2014 when the Fed announced a further reduction in its quantitative easing programme to US$65 billion per month.
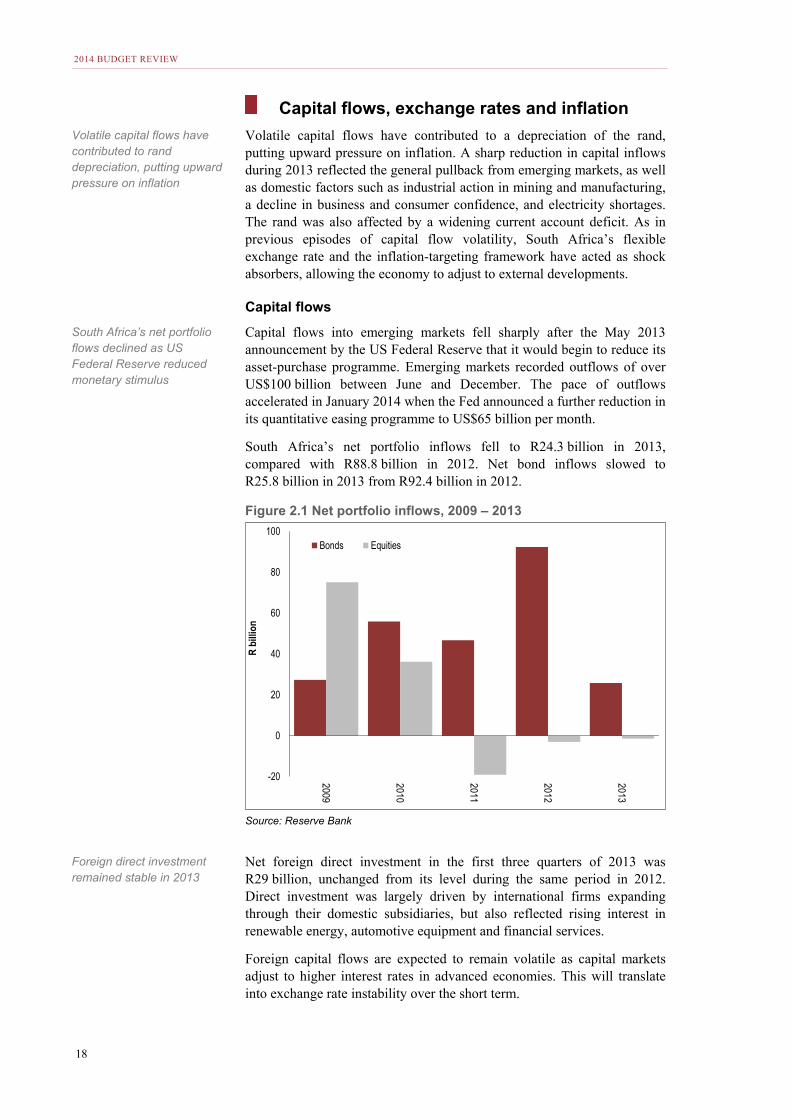
South Africa’s net portfolio inflows fell to R24.3 billion in 2013, compared with R88.8 billion in 2012. Net bond inflows slowed to R25.8 billion in 2013 from R92.4 billion in 2012.
Figure 2.1 Net portfolio inflows, 2009 – 2013
Source: Reserve Bank
Net foreign direct investment in the first three quarters of 2013 was R29 billion, unchanged from its level during the same period in 2012. Direct investment was largely driven by international firms expanding through their domestic subsidiaries, but also reflected rising interest in renewable energy, automotive equipment and financial services.
Foreign capital flows are expected to remain volatile as capital markets adjust to higher interest rates in advanced economies. This will translate into exchange rate instability over the short term.
-20
0
20
40
60
80
100
2009
2010
2011
2012
2013
R bi
llion
Bonds Equities
Volatile capital flows have contributed to rand depreciation, putting upward pressure on inflation
South Africa’s net portfolio flows declined as US Federal Reserve reduced monetary stimulus
Foreign direct investment remained stable in 2013
CHAPTER 2: ECONOMIC OUTLOOK
19
In January 2014, the Reserve Bank held total gross foreign exchange reserves of US$49.4 billion, equivalent to about 19 weeks of import cover.
Exchange rates
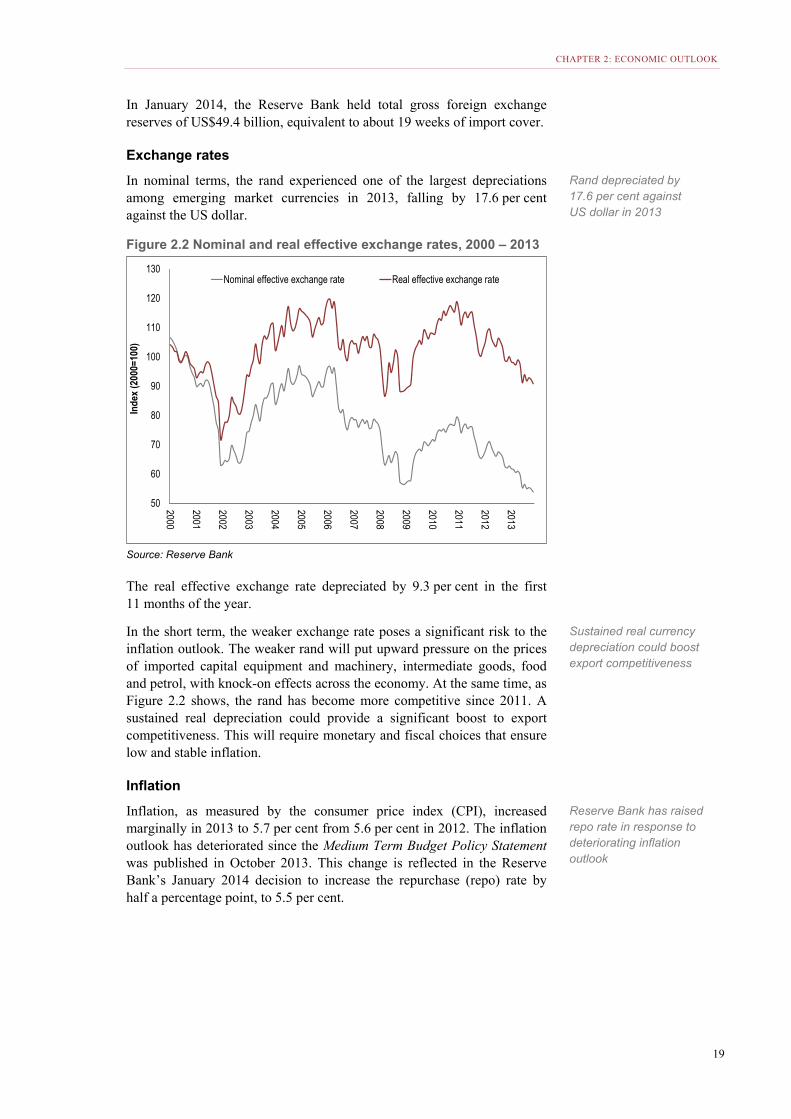
In nominal terms, the rand experienced one of the largest depreciations among emerging market currencies in 2013, falling by 17.6 per cent against the US dollar.
Figure 2.2 Nominal and real effective exchange rates, 2000 – 2013
Source: Reserve Bank
The real effective exchange rate depreciated by 9.3 per cent in the first 11 months of the year.
In the short term, the weaker exchange rate poses a significant risk to the inflation outlook. The weaker rand will put upward pressure on the prices of imported capital equipment and machinery, intermediate goods, food and petrol, with knock-on effects across the economy. At the same time, as Figure 2.2 shows, the rand has become more competitive since 2011. A sustained real depreciation could provide a significant boost to export competitiveness. This will require monetary and fiscal choices that ensure low and stable inflation.
Inflation
Inflation, as measured by the consumer price index (CPI), increased marginally in 2013 to 5.7 per cent from 5.6 per cent in 2012. The inflation outlook has deteriorated since the Medium Term Budget Policy Statement was published in October 2013. This change is reflected in the Reserve Bank’s January 2014 decision to increase the repurchase (repo) rate by half a percentage point, to 5.5 per cent.
50
60
70
80
90
100
110
120
130
2000
2001
2002
2003
2004
2005
2006
2007
2008
2009
2010
2011
2012
2013
Inde
x (2
000=
100)
Nominal effective exchange rate Real effective exchange rate
Rand depreciated by 17.6 per cent against US dollar in 2013
Sustained real currency depreciation could boost export competitiveness
Reserve Bank has raised repo rate in response to deteriorating inflation outlook
2014 BUDGET REVIEW
20
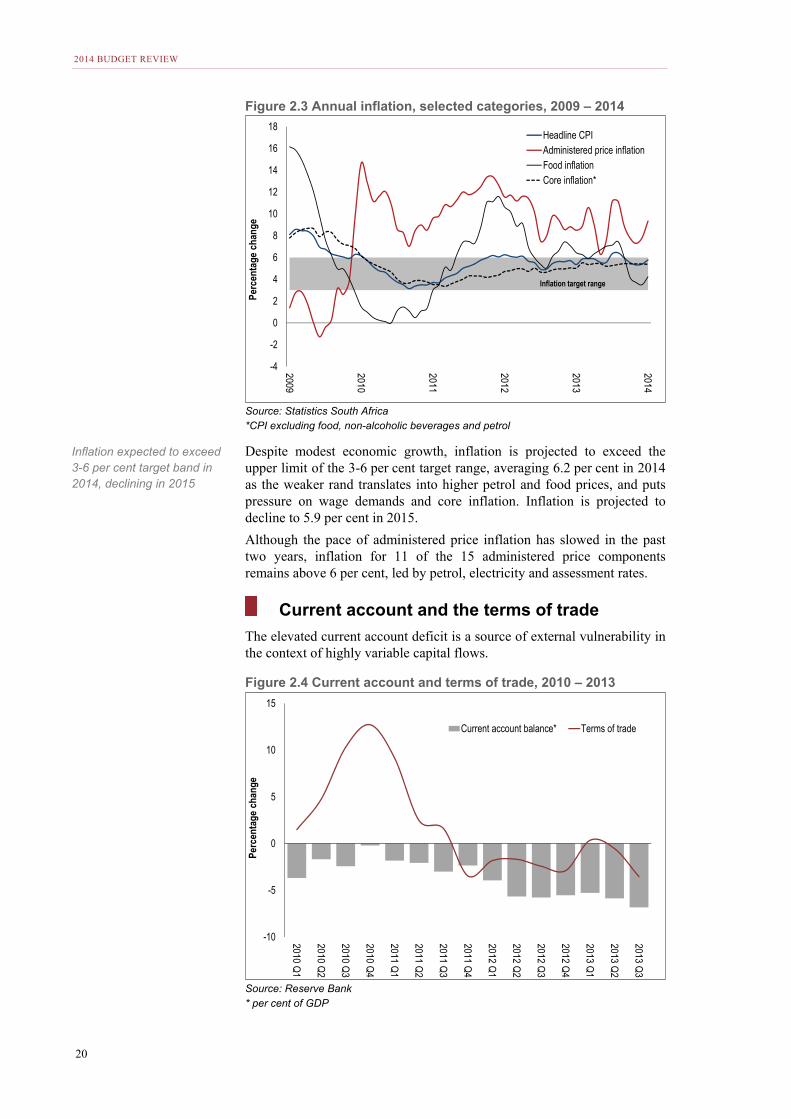
Figure 2.3 Annual inflation, selected categories, 2009 – 2014
Source: Statistics South Africa *CPI excluding food, non-alcoholic beverages and petrol
Despite modest economic growth, inflation is projected to exceed the upper limit of the 3-6 per cent target range, averaging 6.2 per cent in 2014 as the weaker rand translates into higher petrol and food prices, and puts pressure on wage demands and core inflation. Inflation is projected to decline to 5.9 per cent in 2015.
Although the pace of administered price inflation has slowed in the past two years, inflation for 11 of the 15 administered price components remains above 6 per cent, led by petrol, electricity and assessment rates.
Current account and the terms of trade
The elevated current account deficit is a source of external vulnerability in the context of highly variable capital flows.
Figure 2.4 Current account and terms of trade, 2010 – 2013
Source: Reserve Bank * per cent of GDP
-4
-2
0
2
4
6
8
10
12
14
16
18
2009
2010
2011
2012
2013
2014
Perc
enta
ge c
hang
e
Headline CPIAdministered price inflationFood inflationCore inflation*
Inflation target range
-10
-5
0
5
10
15
2010 Q1
2010 Q2
2010 Q3
2010 Q4
2011 Q1
2011 Q2
2011 Q3
2011 Q4
2012 Q1
2012 Q2
2012 Q3
2012 Q4
2013 Q1
2013 Q2
2013 Q3
Perc
enta
ge c
hang
e
Current account balance* Terms of trade
Inflation expected to exceed 3-6 per cent target band in 2014, declining in 2015
CHAPTER 2: ECONOMIC OUTLOOK
21
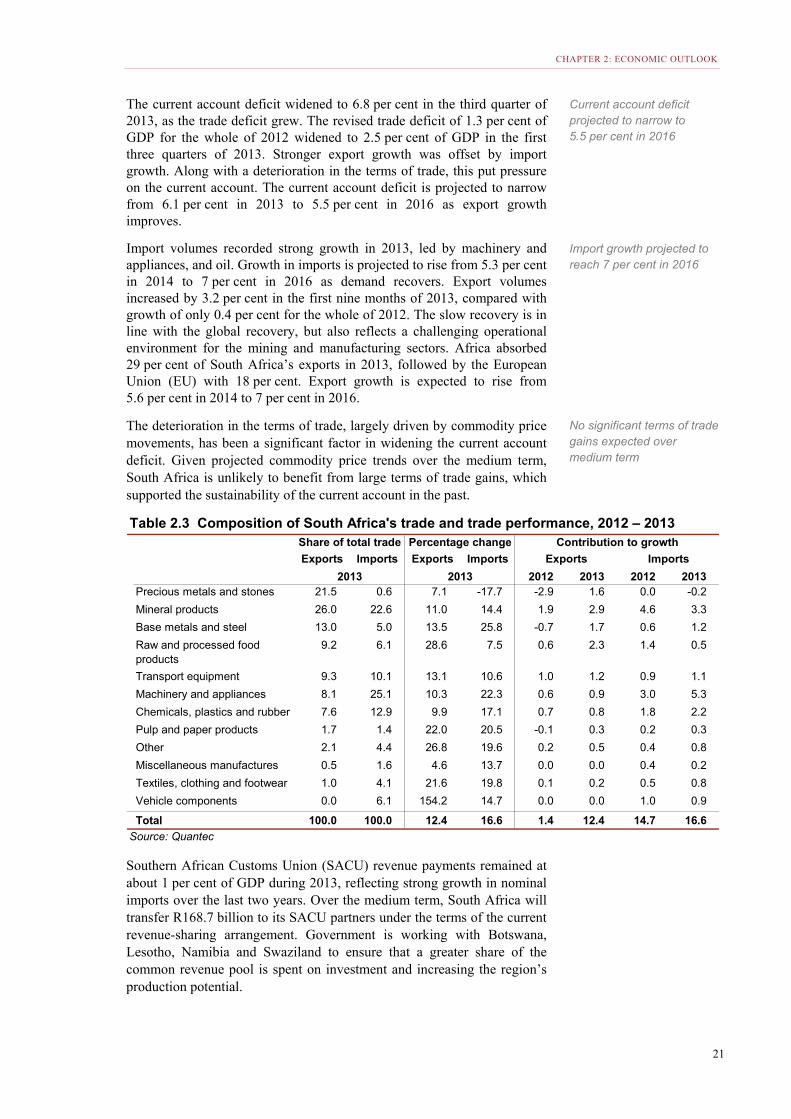
The current account deficit widened to 6.8 per cent in the third quarter of 2013, as the trade deficit grew. The revised trade deficit of 1.3 per cent of GDP for the whole of 2012 widened to 2.5 per cent of GDP in the first three quarters of 2013. Stronger export growth was offset by import growth. Along with a deterioration in the terms of trade, this put pressure on the current account. The current account deficit is projected to narrow from 6.1 per cent in 2013 to 5.5 per cent in 2016 as export growth improves.
Import volumes recorded strong growth in 2013, led by machinery and appliances, and oil. Growth in imports is projected to rise from 5.3 per cent in 2014 to 7 per cent in 2016 as demand recovers. Export volumes increased by 3.2 per cent in the first nine months of 2013, compared with growth of only 0.4 per cent for the whole of 2012. The slow recovery is in line with the global recovery, but also reflects a challenging operational environment for the mining and manufacturing sectors. Africa absorbed 29 per cent of South Africa’s exports in 2013, followed by the European Union (EU) with 18 per cent. Export growth is expected to rise from 5.6 per cent in 2014 to 7 per cent in 2016.
The deterioration in the terms of trade, largely driven by commodity price movements, has been a significant factor in widening the current account deficit. Given projected commodity price trends over the medium term, South Africa is unlikely to benefit from large terms of trade gains, which supported the sustainability of the current account in the past.
Southern African Customs Union (SACU) revenue payments remained at about 1 per cent of GDP during 2013, reflecting strong growth in nominal imports over the last two years. Over the medium term, South Africa will transfer R168.7 billion to its SACU partners under the terms of the current revenue-sharing arrangement. Government is working with Botswana, Lesotho, Namibia and Swaziland to ensure that a greater share of the common revenue pool is spent on investment and increasing the region’s production potential.
Table 2.3 Composition of South Africa's trade and trade performance, 2012 – 2013
Exports Imports Exports Imports Exports Imports
2012 2013 2012 2013Precious metals and stones 21.5 0.6 7.1 -17.7 -2.9 1.6 0.0 -0.2
Mineral products 26.0 22.6 11.0 14.4 1.9 2.9 4.6 3.3
Base metals and steel 13.0 5.0 13.5 25.8 -0.7 1.7 0.6 1.2
Raw and processed food products
9.2 6.1 28.6 7.5 0.6 2.3 1.4 0.5
Transport equipment 9.3 10.1 13.1 10.6 1.0 1.2 0.9 1.1
Machinery and appliances 8.1 25.1 10.3 22.3 0.6 0.9 3.0 5.3
Chemicals, plastics and rubber 7.6 12.9 9.9 17.1 0.7 0.8 1.8 2.2
Pulp and paper products 1.7 1.4 22.0 20.5 -0.1 0.3 0.2 0.3
Other 2.1 4.4 26.8 19.6 0.2 0.5 0.4 0.8
Miscellaneous manufactures 0.5 1.6 4.6 13.7 0.0 0.0 0.4 0.2
Textiles, clothing and footwear 1.0 4.1 21.6 19.8 0.1 0.2 0.5 0.8
Vehicle components 0.0 6.1 154.2 14.7 0.0 0.0 1.0 0.9
Total 100.0 100.0 12.4 16.6 1.4 12.4 14.7 16.6
Source: Quantec
Contribution to growth
2013 2013
Share of total trade Percentage change
Current account deficit projected to narrow to 5.5 per cent in 2016
Import growth projected to reach 7 per cent in 2016
No significant terms of trade gains expected over medium term
2014 BUDGET REVIEW
22
Domestic outlook and real economy trends
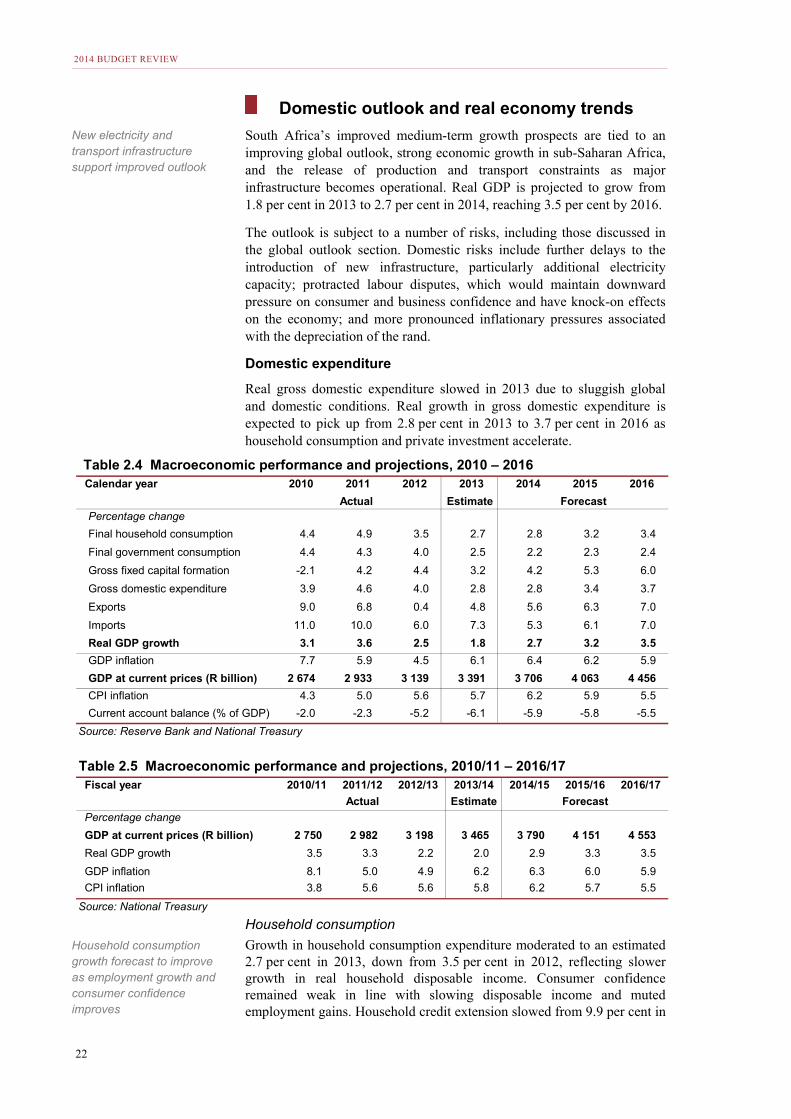
South Africa’s improved medium-term growth prospects are tied to an improving global outlook, strong economic growth in sub-Saharan Africa, and the release of production and transport constraints as major infrastructure becomes operational. Real GDP is projected to grow from 1.8 per cent in 2013 to 2.7 per cent in 2014, reaching 3.5 per cent by 2016.
The outlook is subject to a number of risks, including those discussed in the global outlook section. Domestic risks include further delays to the introduction of new infrastructure, particularly additional electricity capacity; protracted labour disputes, which would maintain downward pressure on consumer and business confidence and have knock-on effects on the economy; and more pronounced inflationary pressures associated with the depreciation of the rand.
Domestic expenditure
Real gross domestic expenditure slowed in 2013 due to sluggish global and domestic conditions. Real growth in gross domestic expenditure is expected to pick up from 2.8 per cent in 2013 to 3.7 per cent in 2016 as household consumption and private investment accelerate.
Household consumption
Growth in household consumption expenditure moderated to an estimated 2.7 per cent in 2013, down from 3.5 per cent in 2012, reflecting slower growth in real household disposable income. Consumer confidence remained weak in line with slowing disposable income and muted employment gains. Household credit extension slowed from 9.9 per cent in
Table 2.4 Macroeconomic performance and projections, 2010 – 2016Calendar year 2010 2011 2012 2013 2014 2015 2016
Actual Estimate ForecastPercentage change
Final household consumption 4.4 4.9 3.5 2.7 2.8 3.2 3.4
Final government consumption 4.4 4.3 4.0 2.5 2.2 2.3 2.4
Gross fixed capital formation -2.1 4.2 4.4 3.2 4.2 5.3 6.0
Gross domestic expenditure 3.9 4.6 4.0 2.8 2.8 3.4 3.7
Exports 9.0 6.8 0.4 4.8 5.6 6.3 7.0
Imports 11.0 10.0 6.0 7.3 5.3 6.1 7.0
Real GDP growth 3.1 3.6 2.5 1.8 2.7 3.2 3.5
GDP inflation 7.7 5.9 4.5 6.1 6.4 6.2 5.9
GDP at current prices (R billion) 2 674 2 933 3 139 3 391 3 706 4 063 4 456
CPI inflation 4.3 5.0 5.6 5.7 6.2 5.9 5.5
Current account balance (% of GDP) -2.0 -2.3 -5.2 -6.1 -5.9 -5.8 -5.5
Source: Reserve Bank and National Treasury
Table 2.5 Macroeconomic performance and projections, 2010/11 – 2016/17Fiscal year 2010/11 2011/12 2012/13 2013/14 2014/15 2015/16 2016/17
Actual Estimate Forecast
Percentage change
GDP at current prices (R billion) 2 750 2 982 3 198 3 465 3 790 4 151 4 553
Real GDP growth 3.5 3.3 2.2 2.0 2.9 3.3 3.5
GDP inflation 8.1 5.0 4.9 6.2 6.3 6.0 5.9
CPI inflation 3.8 5.6 5.6 5.8 6.2 5.7 5.5
Source: National Treasury
New electricity and transport infrastructure support improved outlook
Household consumption growth forecast to improve as employment growth and consumer confidence improves
CHAPTER 2: ECONOMIC OUTLOOK
23
2012 to 5.5 per cent growth in 2013 due to tighter lending criteria and impaired credit records. Household indebtedness remains high at 75.5 per cent of net disposable income, though it has declined from the high of 82.4 per cent in 2008. Spending growth on durables such as vehicles slowed, but remained stable for non-durables such as food.
Growth in real household consumption expenditure is projected to increase from 2.7 per cent in 2013 to 3.4 per cent in 2016, supported by stronger employment growth and reduced household debt levels.
Progress report on major infrastructure: delivering on the NDP Government’s infrastructure programme promotes higher levels of economic growth and job creation in the medium term, and will boost long-term growth potential.
Further details of capital spending are provided in Chapter 5 (state-owned companies) and Chapter 7 (infrastructure in provinces and municipalities). Major projects reflected in Table 2.6, found later in this chapter, include the following:
Electricity
• The first unit of the Medupi power station is expected to be completed towards the end of 2014. Eskom has scaled down its medium-term capital expenditure plans – though they remain significant – given a lower revenue forecast.
• Contracts for 47 renewable energy projects were concluded in 2012 and 2013, with most under construction. These are expected to add generation capacity of 2 459 MW between 2014 and 2016. The third procurement round is finalising another 1 457 MW of capacity from 17 projects with higher local content and lower costs.
• In 2013, through the Integrated National Electrification Programme, Eskom and government provided 200 000 households with electricity connections, constructed 350km of medium voltage lines, upgraded an additional 220km of lines, and upgraded 10 substations.
• A 75 MW solar plant in Kalkbut, Northern Cape, was connected to the grid in September 2013. In Cookhouse, Eastern Cape, Africa’s largest wind farm (135 MW) will be fully commissioned by May 2014.
• South Africa’s first baseload gas-fired power plant was recently commissioned by Sasol. Some of the plant’s 140 MW capacity will be fed into the national grid. This project is funded by Sasol.
Transport
• Transnet has increased capacity on its coal line, boosting annual capacity by 10 million tonnes to 81 million tonnes. In 2013, Transnet took delivery of 143 locomotives and has built or refurbished 1 944 wagons since 2012.
• Plans to expand the coal, iron ore and manganese lines are at an advanced stage of feasibility assessment.
• Seven new cranes were installed at the Durban container terminal, increasing efficiency by 27 per cent.
• The Passenger Rail Agency of South Africa refurbished 500 Metrorail coaches in 2013.
• The South African National Roads Agency Limited invested R137.4 billion over the period 2010/11–2013/14 to maintain and improve existing roads, and to develop new road infrastructure.
• Large metros are investing heavily in integrated public transport. Cape Town and Johannesburg have begun operating stations, depots, buses and dedicated bus lanes. Tshwane, Mbombela, Nelson Mandela Bay, eThekwini, Rustenburg and George have started constructing similar infrastructure.
Water Investments in bulk water infrastructure address both growing household demand and the needs of the mining, manufacturing and agricultural sectors, which are heavily reliant on water for production.
• Government has spent over R8 billion on water resources and bulk water infrastructure in 2013/14. This includes expenditure on large projects such as the construction of the new Nwamitwa dam, raising the walls of the Tzaneen and Clanwilliam dams, developing the Mokolo and Crocodile River water augmentation project, and developing and upgrading water treatment facilities and bulk water infrastructure at various sites.
• Government’s dam safety rehabilitation project ensures the continued structural and operational safety of the 316 dams owned by the Department of Water Affairs.
2014 BUDGET REVIEW
24
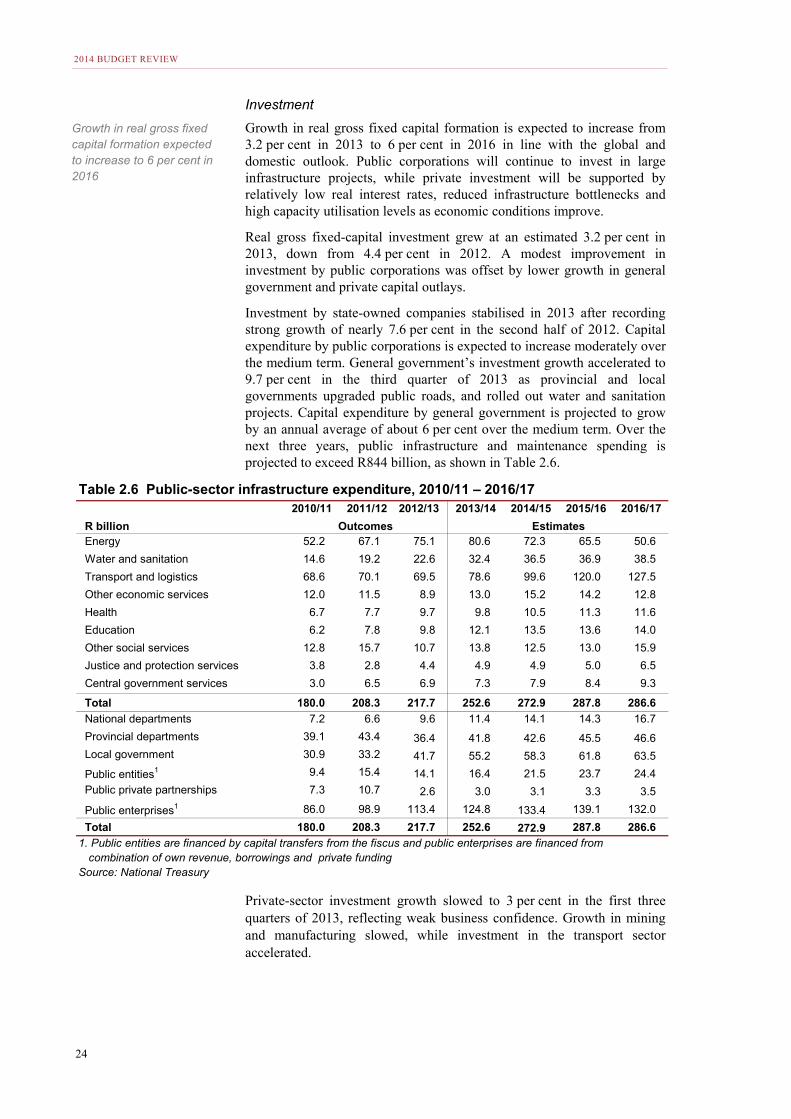
Investment
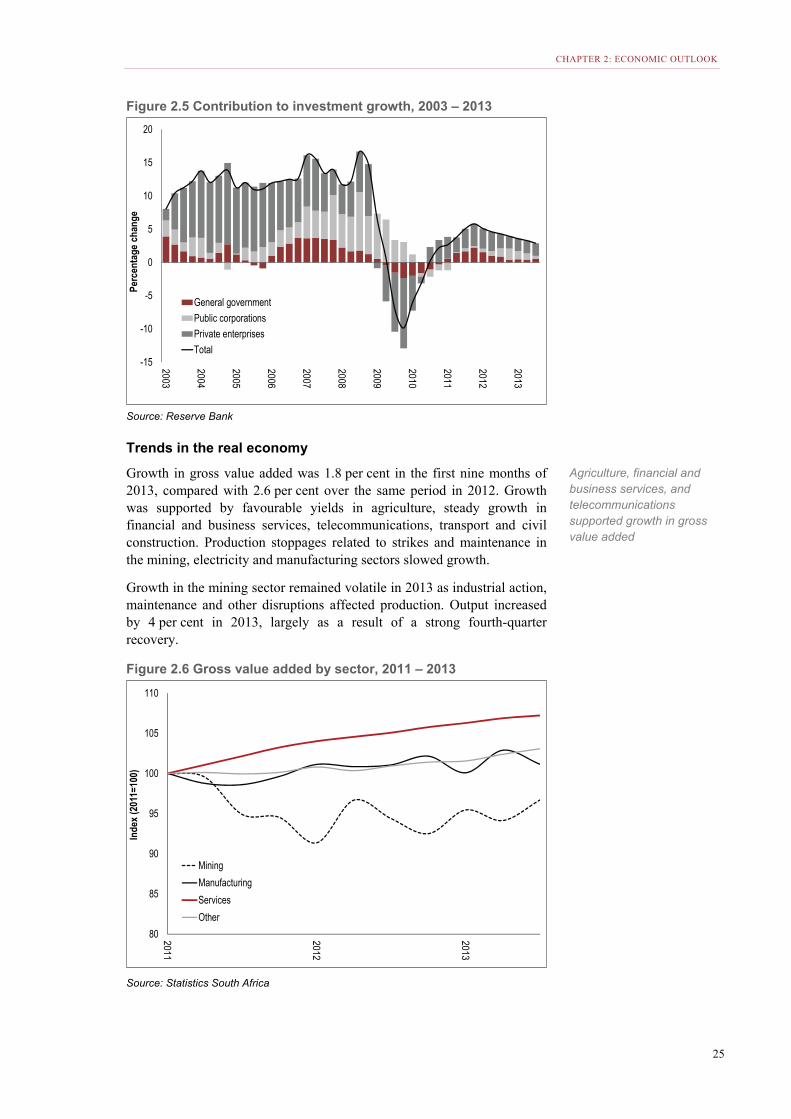
Growth in real gross fixed capital formation is expected to increase from 3.2 per cent in 2013 to 6 per cent in 2016 in line with the global and domestic outlook. Public corporations will continue to invest in large infrastructure projects, while private investment will be supported by relatively low real interest rates, reduced infrastructure bottlenecks and high capacity utilisation levels as economic conditions improve.
Real gross fixed-capital investment grew at an estimated 3.2 per cent in 2013, down from 4.4 per cent in 2012. A modest improvement in investment by public corporations was offset by lower growth in general government and private capital outlays.
Investment by state-owned companies stabilised in 2013 after recording strong growth of nearly 7.6 per cent in the second half of 2012. Capital expenditure by public corporations is expected to increase moderately over the medium term. General government’s investment growth accelerated to 9.7 per cent in the third quarter of 2013 as provincial and local governments upgraded public roads, and rolled out water and sanitation projects. Capital expenditure by general government is projected to grow by an annual average of about 6 per cent over the medium term. Over the next three years, public infrastructure and maintenance spending is projected to exceed R844 billion, as shown in Table 2.6.
Private-sector investment growth slowed to 3 per cent in the first three quarters of 2013, reflecting weak business confidence. Growth in mining and manufacturing slowed, while investment in the transport sector accelerated.
Table 2.6 Public-sector infrastructure expenditure, 2010/11 – 2016/17 2010/11 2011/12 2012/13 2013/14 2014/15 2015/16 2016/17
R billion Outcomes EstimatesEnergy 52.2 67.1 75.1 80.6 72.3 65.5 50.6
Water and sanitation 14.6 19.2 22.6 32.4 36.5 36.9 38.5
Transport and logistics 68.6 70.1 69.5 78.6 99.6 120.0 127.5
Other economic services 12.0 11.5 8.9 13.0 15.2 14.2 12.8
Health 6.7 7.7 9.7 9.8 10.5 11.3 11.6
Education 6.2 7.8 9.8 12.1 13.5 13.6 14.0
Other social services 12.8 15.7 10.7 13.8 12.5 13.0 15.9
Justice and protection services 3.8 2.8 4.4 4.9 4.9 5.0 6.5
Central government services 3.0 6.5 6.9 7.3 7.9 8.4 9.3
Total 180.0 208.3 217.7 252.6 272.9 287.8 286.6
National departments 7.2 6.6 9.6 11.4 14.1 14.3 16.7
Provincial departments 39.1 43.4 36.4 41.8 42.6 45.5 46.6
Local government 30.9 33.2 41.7 55.2 58.3 61.8 63.5
Public entities1 9.4 15.4 14.1 16.4 21.5 23.7 24.4
Public private partnerships 7.3 10.7 2.6 3.0 3.1 3.3 3.5
Public enterprises1 86.0 98.9 113.4 124.8 133.4 139.1 132.0
Total 180.0 208.3 217.7 252.6 272.9 287.8 286.6
1. Public entities are financed by capital transfers from the fiscus and public enterprises are financed from combination of own revenue, borrowings and private funding
Source: National Treasury
Growth in real gross fixed capital formation expected to increase to 6 per cent in 2016
CHAPTER 2: ECONOMIC OUTLOOK
25
Figure 2.5 Contribution to investment growth, 2003 – 2013
Source: Reserve Bank
Trends in the real economy
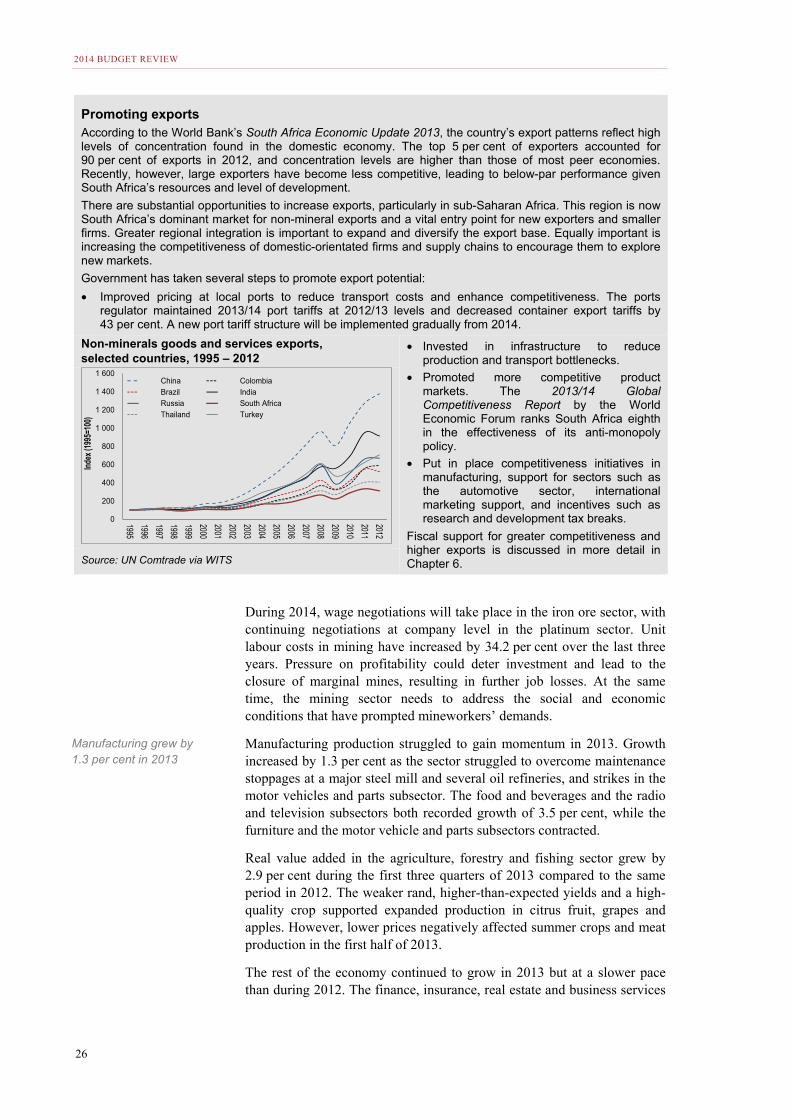
Growth in gross value added was 1.8 per cent in the first nine months of 2013, compared with 2.6 per cent over the same period in 2012. Growth was supported by favourable yields in agriculture, steady growth in financial and business services, telecommunications, transport and civil construction. Production stoppages related to strikes and maintenance in the mining, electricity and manufacturing sectors slowed growth.
Growth in the mining sector remained volatile in 2013 as industrial action, maintenance and other disruptions affected production. Output increased by 4 per cent in 2013, largely as a result of a strong fourth-quarter recovery.
Figure 2.6 Gross value added by sector, 2011 – 2013
Source: Statistics South Africa
-15
-10
-5
0
5
10
15
20
2003
2004
2005
2006
2007
2008
2009
2010
2011
2012
2013
Perc
enta
ge c
hang
e
General government
Public corporations
Private enterprises
Total
80
85
90
95
100
105
110
2011
2012
2013
Inde
x (2
011=
100)
Mining
Manufacturing
Services
Other
Agriculture, financial and business services, and telecommunications supported growth in gross value added
2014 BUDGET REVIEW
26
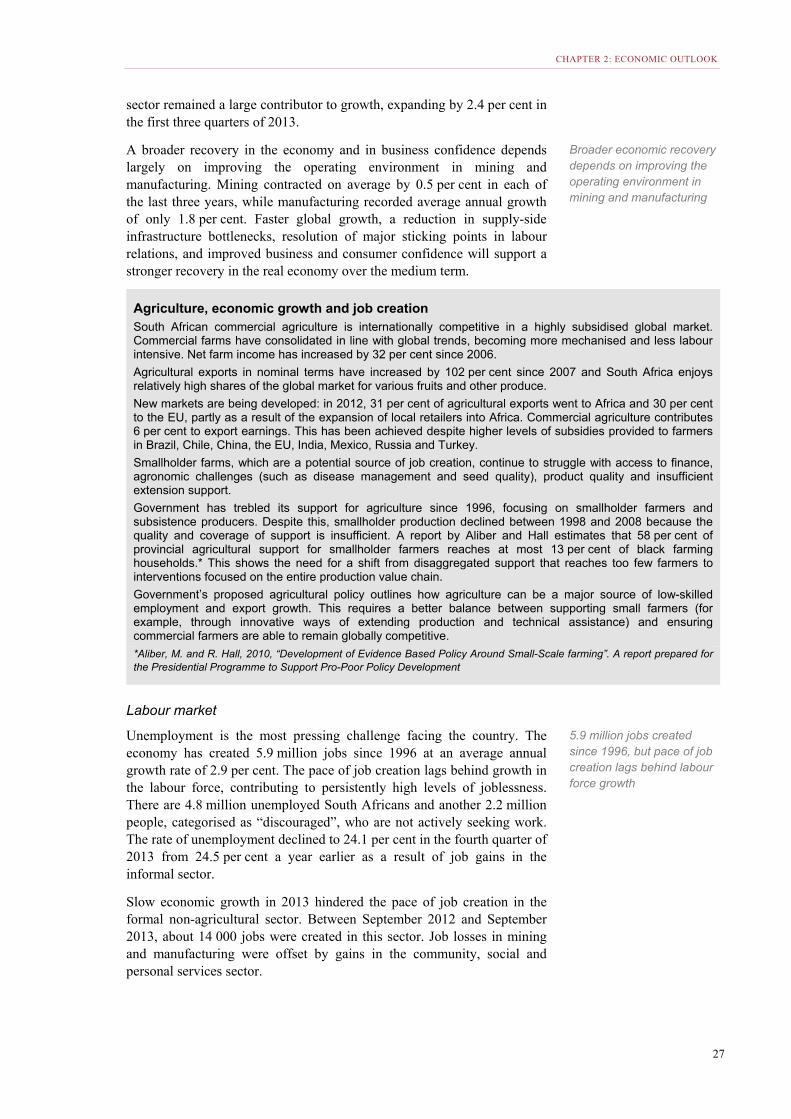
Promoting exports According to the World Bank’s South Africa Economic Update 2013, the country’s export patterns reflect high levels of concentration found in the domestic economy. The top 5 per cent of exporters accounted for 90 per cent of exports in 2012, and concentration levels are higher than those of most peer economies. Recently, however, large exporters have become less competitive, leading to below-par performance given South Africa’s resources and level of development.
There are substantial opportunities to increase exports, particularly in sub-Saharan Africa. This region is now South Africa’s dominant market for non-mineral exports and a vital entry point for new exporters and smaller firms. Greater regional integration is important to expand and diversify the export base. Equally important is increasing the competitiveness of domestic-orientated firms and supply chains to encourage them to explore new markets.
Government has taken several steps to promote export potential:
• Improved pricing at local ports to reduce transport costs and enhance competitiveness. The ports regulator maintained 2013/14 port tariffs at 2012/13 levels and decreased container export tariffs by 43 per cent. A new port tariff structure will be implemented gradually from 2014.
Non-minerals goods and services exports, selected countries, 1995 – 2012
• Invested in infrastructure to reduce production and transport bottlenecks.
• Promoted more competitive product markets. The 2013/14 Global Competitiveness Report by the World Economic Forum ranks South Africa eighth in the effectiveness of its anti-monopoly policy.
• Put in place competitiveness initiatives in manufacturing, support for sectors such as the automotive sector, international marketing support, and incentives such as research and development tax breaks.
Fiscal support for greater competitiveness and higher exports is discussed in more detail in Chapter 6.
Source: UN Comtrade via WITS
During 2014, wage negotiations will take place in the iron ore sector, with continuing negotiations at company level in the platinum sector. Unit labour costs in mining have increased by 34.2 per cent over the last three years. Pressure on profitability could deter investment and lead to the closure of marginal mines, resulting in further job losses. At the same time, the mining sector needs to address the social and economic conditions that have prompted mineworkers’ demands.
Manufacturing production struggled to gain momentum in 2013. Growth increased by 1.3 per cent as the sector struggled to overcome maintenance stoppages at a major steel mill and several oil refineries, and strikes in the motor vehicles and parts subsector. The food and beverages and the radio and television subsectors both recorded growth of 3.5 per cent, while the furniture and the motor vehicle and parts subsectors contracted.
Real value added in the agriculture, forestry and fishing sector grew by 2.9 per cent during the first three quarters of 2013 compared to the same period in 2012. The weaker rand, higher-than-expected yields and a high-quality crop supported expanded production in citrus fruit, grapes and apples. However, lower prices negatively affected summer crops and meat production in the first half of 2013.
The rest of the economy continued to grow in 2013 but at a slower pace than during 2012. The finance, insurance, real estate and business services
0
200
400
600
800
1 000
1 200
1 400
1 600
1995
1996
1997
1998
1999
2000
2001
2002
2003
2004
2005
2006
2007
2008
2009
2010
2011
2012
Index
(199
5=10
0)
China Colombia Brazil India Russia South Africa Thailand Turkey
Manufacturing grew by 1.3 per cent in 2013
CHAPTER 2: ECONOMIC OUTLOOK
27
sector remained a large contributor to growth, expanding by 2.4 per cent in the first three quarters of 2013.
A broader recovery in the economy and in business confidence depends largely on improving the operating environment in mining and manufacturing. Mining contracted on average by 0.5 per cent in each of the last three years, while manufacturing recorded average annual growth of only 1.8 per cent. Faster global growth, a reduction in supply-side infrastructure bottlenecks, resolution of major sticking points in labour relations, and improved business and consumer confidence will support a stronger recovery in the real economy over the medium term.
Agriculture, economic growth and job creation South African commercial agriculture is internationally competitive in a highly subsidised global market. Commercial farms have consolidated in line with global trends, becoming more mechanised and less labour intensive. Net farm income has increased by 32 per cent since 2006.
Agricultural exports in nominal terms have increased by 102 per cent since 2007 and South Africa enjoys relatively high shares of the global market for various fruits and other produce.
New markets are being developed: in 2012, 31 per cent of agricultural exports went to Africa and 30 per cent to the EU, partly as a result of the expansion of local retailers into Africa. Commercial agriculture contributes 6 per cent to export earnings. This has been achieved despite higher levels of subsidies provided to farmers in Brazil, Chile, China, the EU, India, Mexico, Russia and Turkey.
Smallholder farms, which are a potential source of job creation, continue to struggle with access to finance, agronomic challenges (such as disease management and seed quality), product quality and insufficient extension support.
Government has trebled its support for agriculture since 1996, focusing on smallholder farmers and subsistence producers. Despite this, smallholder production declined between 1998 and 2008 because the quality and coverage of support is insufficient. A report by Aliber and Hall estimates that 58 per cent of provincial agricultural support for smallholder farmers reaches at most 13 per cent of black farming households.* This shows the need for a shift from disaggregated support that reaches too few farmers to interventions focused on the entire production value chain.
Government’s proposed agricultural policy outlines how agriculture can be a major source of low-skilled employment and export growth. This requires a better balance between supporting small farmers (for example, through innovative ways of extending production and technical assistance) and ensuring commercial farmers are able to remain globally competitive.
*Aliber, M. and R. Hall, 2010, “Development of Evidence Based Policy Around Small-Scale farming”. A report prepared for the Presidential Programme to Support Pro-Poor Policy Development
Labour market
Unemployment is the most pressing challenge facing the country. The economy has created 5.9 million jobs since 1996 at an average annual growth rate of 2.9 per cent. The pace of job creation lags behind growth in the labour force, contributing to persistently high levels of joblessness. There are 4.8 million unemployed South Africans and another 2.2 million people, categorised as “discouraged”, who are not actively seeking work. The rate of unemployment declined to 24.1 per cent in the fourth quarter of 2013 from 24.5 per cent a year earlier as a result of job gains in the informal sector.
Slow economic growth in 2013 hindered the pace of job creation in the formal non-agricultural sector. Between September 2012 and September 2013, about 14 000 jobs were created in this sector. Job losses in mining and manufacturing were offset by gains in the community, social and personal services sector.
Broader economic recovery depends on improving the operating environment in mining and manufacturing
5.9 million jobs created since 1996, but pace of job creation lags behind labour force growth
2014 BUDGET REVIEW
28
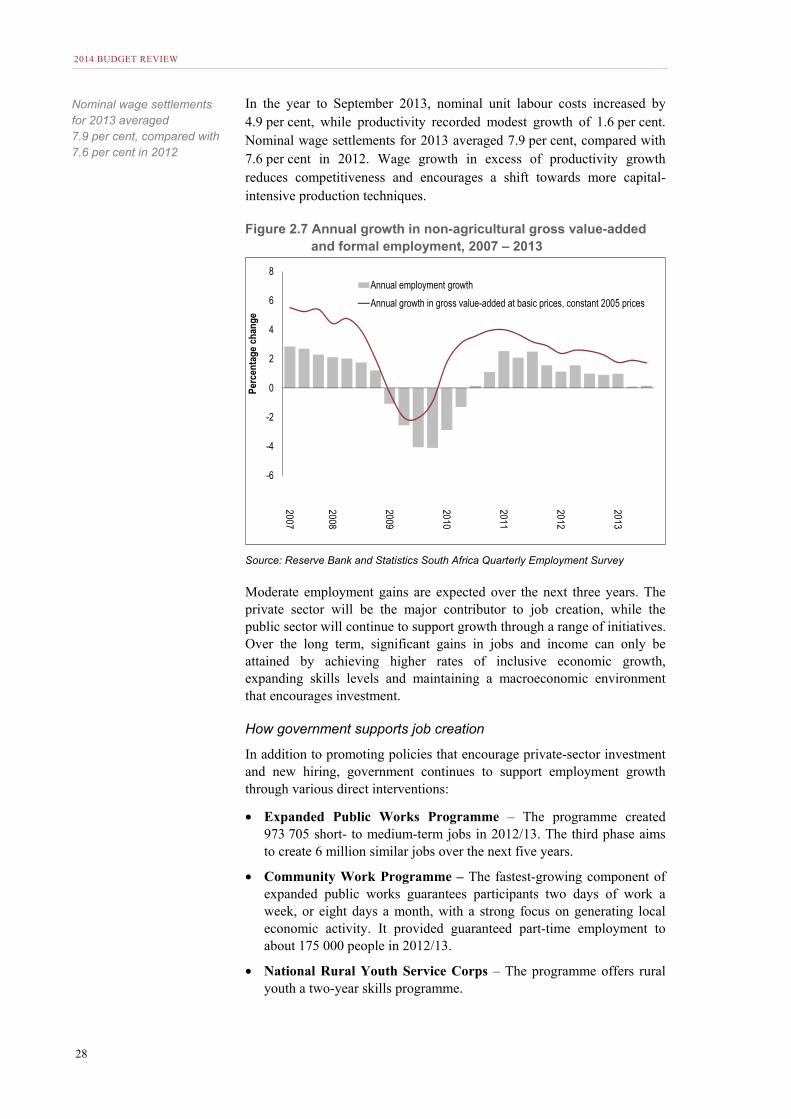
In the year to September 2013, nominal unit labour costs increased by 4.9 per cent, while productivity recorded modest growth of 1.6 per cent. Nominal wage settlements for 2013 averaged 7.9 per cent, compared with 7.6 per cent in 2012. Wage growth in excess of productivity growth reduces competitiveness and encourages a shift towards more capital-intensive production techniques.
Figure 2.7 Annual growth in non-agricultural gross value-added and formal employment, 2007 – 2013
Source: Reserve Bank and Statistics South Africa Quarterly Employment Survey
Moderate employment gains are expected over the next three years. The private sector will be the major contributor to job creation, while the public sector will continue to support growth through a range of initiatives. Over the long term, significant gains in jobs and income can only be attained by achieving higher rates of inclusive economic growth, expanding skills levels and maintaining a macroeconomic environment that encourages investment.
How government supports job creation
In addition to promoting policies that encourage private-sector investment and new hiring, government continues to support employment growth through various direct interventions:
• Expanded Public Works Programme – The programme created 973 705 short- to medium-term jobs in 2012/13. The third phase aims to create 6 million similar jobs over the next five years.
• Community Work Programme – The fastest-growing component of expanded public works guarantees participants two days of work a week, or eight days a month, with a strong focus on generating local economic activity. It provided guaranteed part-time employment to about 175 000 people in 2012/13.
• National Rural Youth Service Corps – The programme offers rural youth a two-year skills programme.
-6
-4
-2
0
2
4
6
8
2007
2008
2009
2010
2011
2012
2013
Perc
enta
ge c
hang
e
Annual employment growth
Annual growth in gross value-added at basic prices, constant 2005 prices
Nominal wage settlements for 2013 averaged 7.9 per cent, compared with 7.6 per cent in 2012
CHAPTER 2: ECONOMIC OUTLOOK
29
• Employment tax incentive – Launched in January 2014, the incentive subsidises the salaries of newly recruited workers aged between 18 and 29. This initiative should support a total of 240 000 jobs over the medium term.
• Jobs Fund – Launched in 2011 with the goal of co-financing projects to generate sustainable employment and catalyse economic activity. To date, projects supported by the fund have created 12 184 new jobs. Projects over the next three years will create 96 000 new, permanent jobs.
• National Youth Service Programme – Trains young people to be artisans for the built environment, while Vuk’uphile trains contractors in labour-intensive construction techniques.
• Skills development – A Department of Higher Education and Training white paper targets improved and expanded access to skills development and training, especially vocational training. In addition, employers are still eligible for tax incentives focused on learnership programmes and bursaries.
Elements of the youth employment accord, supported by government, business, labour and communities, have been incorporated into existing programmes, while others are being developed.
Conclusion
While the medium-term economic outlook improves in response to a stronger global recovery, new infrastructure and growing trade with Africa, South Africa needs higher levels of growth to address the challenges of unemployment, poverty and inequality.
Faster economic growth over the medium term requires bold decisions to change the structure of the economy to increase the level of competition and innovation, raise the level of savings, reduce the cost of transportation
Microeconomic reforms to change the structure of the economy The NDP identifies a number of microeconomic reforms needed to boost economic growth:
• Reducing the cost of living for poor households and the costs of doing business. South Africa has made significant progress in anti-monopoly policy, as reflected in the 2013/14 Global Competitiveness Report by the World Economic Forum, which ranks the country eighth in this area. Recent actions by the competition authorities have reduced prices on the communications network. Interventions in the food and agricultural value chains, including milling, bread and grain storage, are likely to contribute to lower food price inflation.
• Support for small, medium and micro enterprises (SMMEs), entrepreneurs and business start-ups. The Small Enterprise Development Agency and the Small Enterprise Finance Agency provide support to small businesses. The Tax Review Committee is investigating the impact of the tax system on SMMEs.
• A greener and more sustainable economy. The Renewable Energy Programme is under way. The forthcoming carbon tax and progress toward cost-reflective electricity prices will support the shift to a sustainable economy.
• Support for local production and employment through government procurement. The Customised Sector Development Programme for state-owned enterprises sets minimum local content requirements for designated products. The Preferential Procurement Policy Framework Act (2000) is under review.
• Broadening and strengthening industrial development. In addition to sector support programmes, such as those in the motor industry, cross-cutting incentives include the Manufacturing Competitiveness Enhancement Programme, research and development programmes, support centres, skills training and the employment tax incentive.

2014 BUDGET REVIEW
30
and communication, improve regional trade and integrate into global supply chains.
Increasing cooperation between government, business and labour in implementing the NDP will help to realise faster economic growth and job creation.
Recommended