121
6 MONITORING CYCLES, JOBS, AND THE PRICE LEVEL**
* * This is Chapter 22 in Economics.
C h a p t e r K e y I d e a s
Vital Signs
A. The last U.S. recession began in March 2001 and ended in November 2001. What defines a recession, who makes the decision that we are in one, and how?
B. How do we measure unemployment and what other data do we use to monitor the labor market?
C. Being employed alone does not determine standard of living; the cost of living also matters, so we also need to know what the Consumer Price Index is, and how that is measured and used.
O u t l i n e
I. The Business Cycle
A. The business cycle is the periodic but irregular up-and-down movement in production and jobs.
1. The National Bureau of Economic Research (NBER) defines a recession somewhat differently than the common definition. The NBER says “A recession is a significant decline in activity spread across the economy, lasting more than a few months, visible in industrial production, employment, real income, and wholesale-retail trade.”
2. The NBER’s Business Cycle Dating Committee identifies and dates them for the United States.
C h a p t e r
1 2 2 C H A P T E R 6
B. Business Cycle Dates
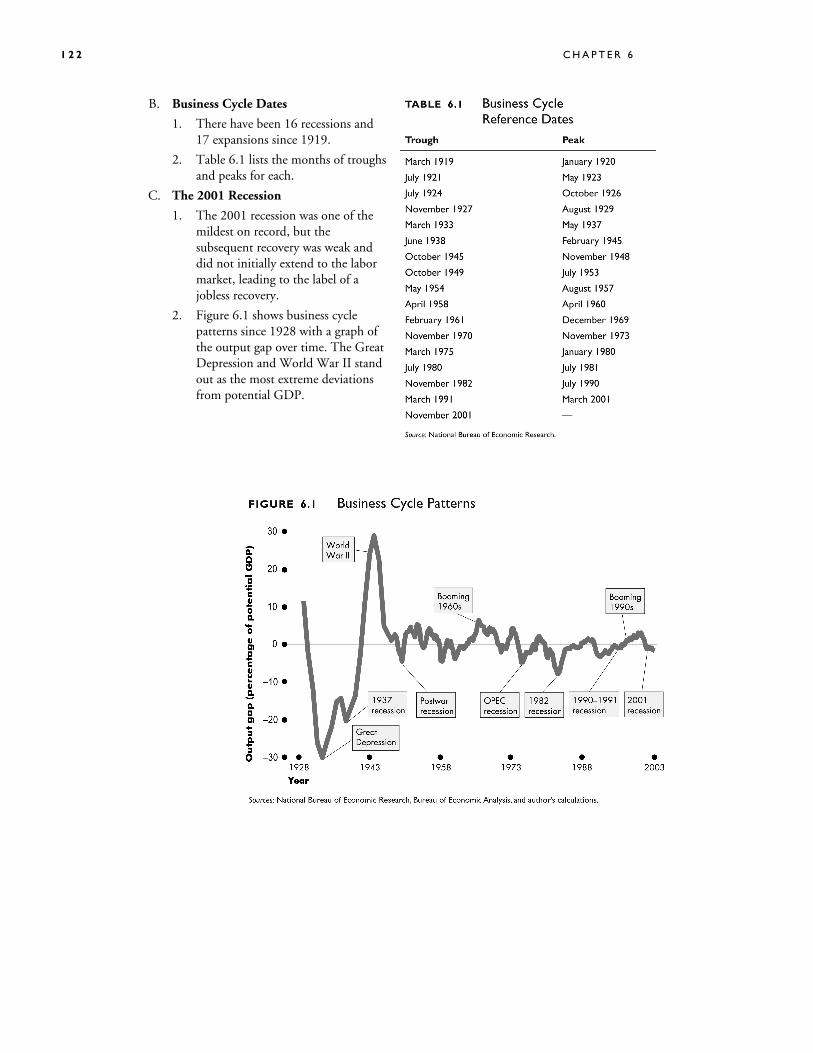
1. There have been 16 recessions and 17 expansions since 1919.
2. Table 6.1 lists the months of troughs and peaks for each.
C. The 2001 Recession
1. The 2001 recession was one of the mildest on record, but the subsequent recovery was weak and did not initially extend to the labor market, leading to the label of a jobless recovery.
2. Figure 6.1 shows business cycle patterns since 1928 with a graph of the output gap over time. The Great Depression and World War II stand out as the most extreme deviations from potential GDP.
M O N I T O R I N G C Y C L E S , J O B S , A N D T H E P R I C E L E V E L 1 2 3
II. Jobs and Wages
A. Population Survey
1. The U.S. Census Bureau conducts monthly surveys to determine the status of the labor force in the United States.
2. United States population is divided into two groups
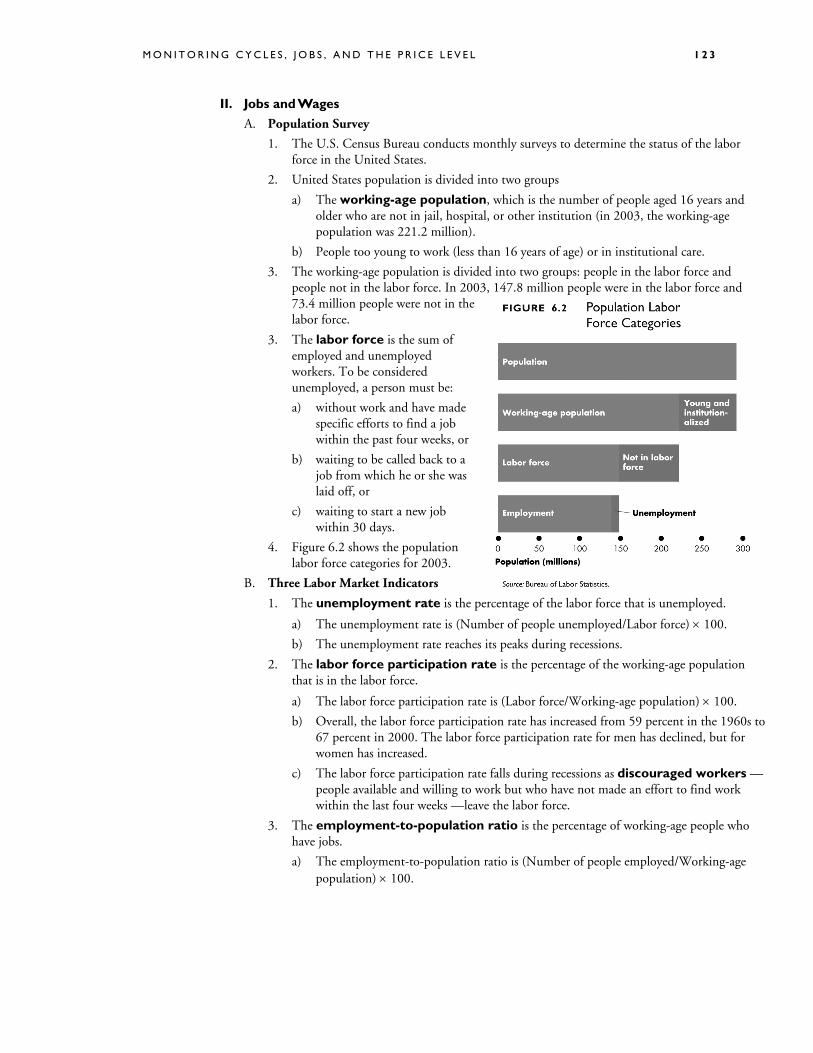
a) The working-age population, which is the number of people aged 16 years and older who are not in jail, hospital, or other institution (in 2003, the working-age population was 221.2 million).
b) People too young to work (less than 16 years of age) or in institutional care.
3. The working-age population is divided into two groups: people in the labor force and people not in the labor force. In 2003, 147.8 million people were in the labor force and 73.4 million people were not in the labor force.
3. The labor force is the sum of employed and unemployed workers. To be considered unemployed, a person must be:
a) without work and have made specific efforts to find a job within the past four weeks, or
b) waiting to be called back to a job from which he or she was laid off, or
c) waiting to start a new job within 30 days.
4. Figure 6.2 shows the population labor force categories for 2003.
B. Three Labor Market Indicators
1. The unemployment rate is the percentage of the labor force that is unemployed.
a) The unemployment rate is (Number of people unemployed/Labor force) × 100.
b) The unemployment rate reaches its peaks during recessions.
2. The labor force participation rate is the percentage of the working-age population that is in the labor force.
a) The labor force participation rate is (Labor force/Working-age population) × 100.
b) Overall, the labor force participation rate has increased from 59 percent in the 1960s to 67 percent in 2000. The labor force participation rate for men has declined, but for women has increased.
c) The labor force participation rate falls during recessions as discouraged workers —people available and willing to work but who have not made an effort to find work within the last four weeks —leave the labor force.
3. The employment-to-population ratio is the percentage of working-age people who have jobs.
a) The employment-to-population ratio is (Number of people employed/Working-age population) × 100.
1 2 4 C H A P T E R 6
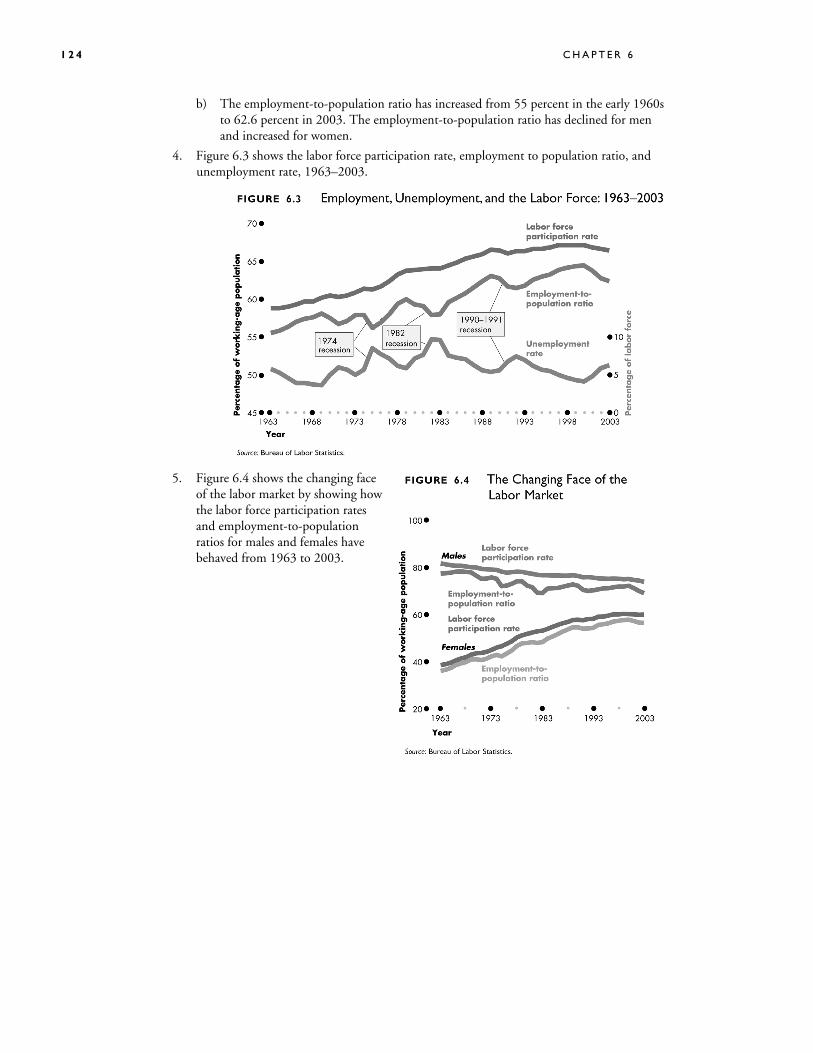
b) The employment-to-population ratio has increased from 55 percent in the early 1960s to 62.6 percent in 2003. The employment-to-population ratio has declined for men and increased for women.
4. Figure 6.3 shows the labor force participation rate, employment to population ratio, and unemployment rate, 1963–2003.
5. Figure 6.4 shows the changing face of the labor market by showing how the labor force participation rates and employment-to-population ratios for males and females have behaved from 1963 to 2003.
M O N I T O R I N G C Y C L E S , J O B S , A N D T H E P R I C E L E V E L 1 2 5
C. Aggregate Hours
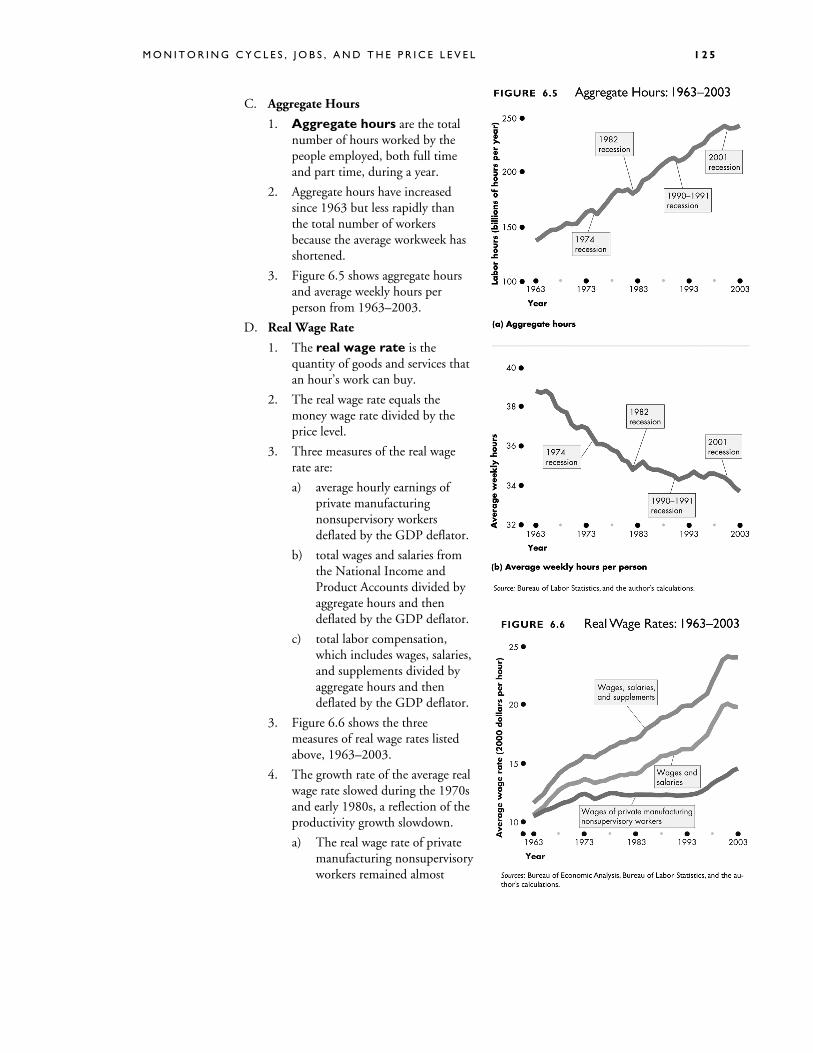
1. Aggregate hours are the total number of hours worked by the people employed, both full time and part time, during a year.
2. Aggregate hours have increased since 1963 but less rapidly than the total number of workers because the average workweek has shortened.
3. Figure 6.5 shows aggregate hours and average weekly hours per person from 1963–2003.
D. Real Wage Rate
1. The real wage rate is the quantity of goods and services that an hour’s work can buy.
2. The real wage rate equals the money wage rate divided by the price level.
3. Three measures of the real wage rate are:
a) average hourly earnings of private manufacturing nonsupervisory workers deflated by the GDP deflator.
b) total wages and salaries from the National Income and Product Accounts divided by aggregate hours and then deflated by the GDP deflator.
c) total labor compensation, which includes wages, salaries, and supplements divided by aggregate hours and then deflated by the GDP deflator.
3. Figure 6.6 shows the three measures of real wage rates listed above, 1963–2003.
4. The growth rate of the average real wage rate slowed during the 1970s and early 1980s, a reflection of the productivity growth slowdown.
a) The real wage rate of private manufacturing nonsupervisory workers remained almost
1 2 6 C H A P T E R 6
constant throughout the 1970s and 1980s, but started to increase again in the mid-1990s.
b) The growth of the real wage rate, measured by total wages and salaries divided by total hours, slowed substantially during the mid-1970s, grew rapidly in the 1990s, but fell slightly after 2000.
c) The real wage rate, measured by total labor compensation (which includes fringe benefits) divided by total hours, also grew more slowly in the mid-1970s, but the slowdown was less than for the real wage rate measured by wages and salaries only.
III. Unemployment and Full Employment
A. The Anatomy of Unemployment
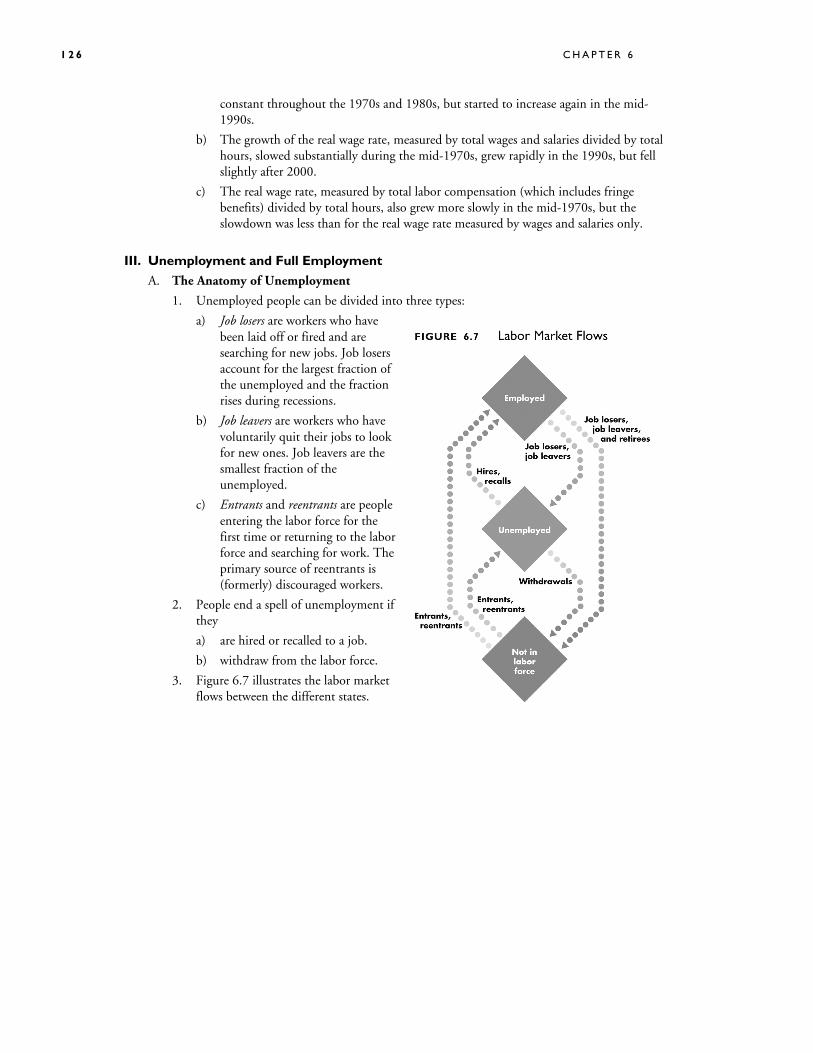
1. Unemployed people can be divided into three types:
a) Job losers are workers who have been laid off or fired and are searching for new jobs. Job losers account for the largest fraction of the unemployed and the fraction rises during recessions.
b) Job leavers are workers who have voluntarily quit their jobs to look for new ones. Job leavers are the smallest fraction of the unemployed.
c) Entrants and reentrants are people entering the labor force for the first time or returning to the labor force and searching for work. The primary source of reentrants is (formerly) discouraged workers.
2. People end a spell of unemployment if they
a) are hired or recalled to a job.
b) withdraw from the labor force.
3. Figure 6.7 illustrates the labor market flows between the different states.
M O N I T O R I N G C Y C L E S , J O B S , A N D T H E P R I C E L E V E L 1 2 7
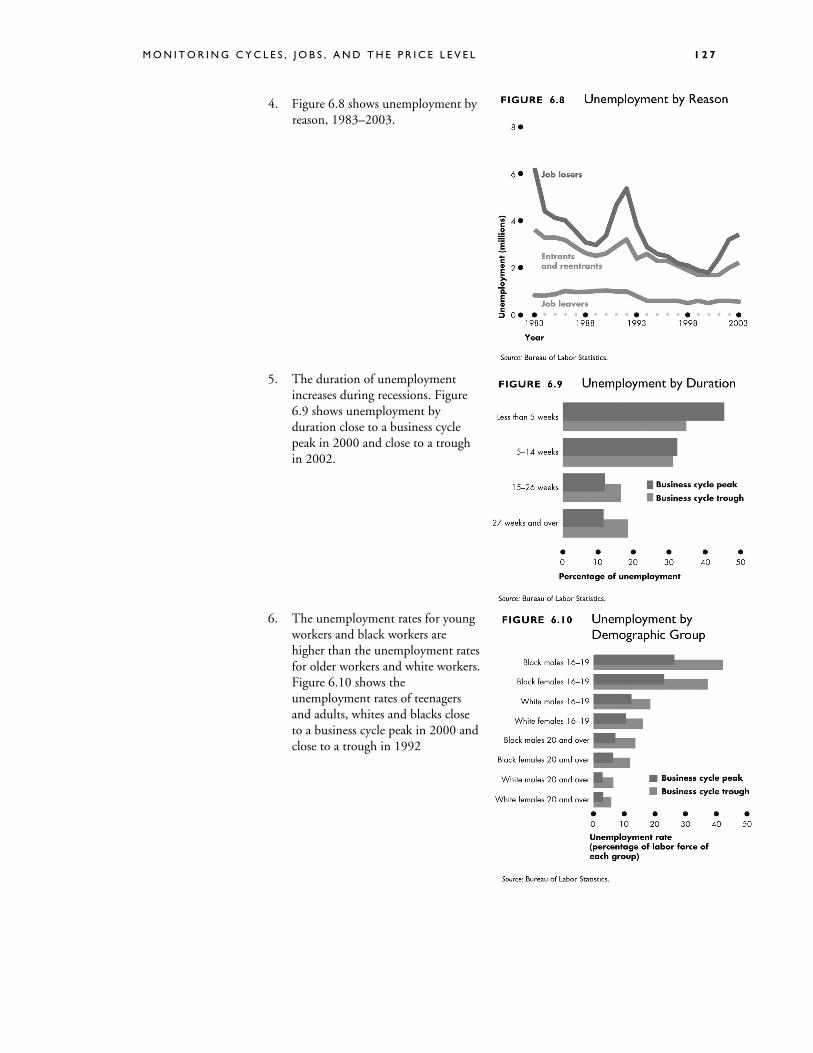
4. Figure 6.8 shows unemployment by reason, 1983–2003.
5. The duration of unemployment increases during recessions. Figure 6.9 shows unemployment by duration close to a business cycle peak in 2000 and close to a trough in 2002.
6. The unemployment rates for young workers and black workers are higher than the unemployment rates for older workers and white workers. Figure 6.10 shows the unemployment rates of teenagers and adults, whites and blacks close to a business cycle peak in 2000 and close to a trough in 1992
1 2 8 C H A P T E R 6
B. Types of Unemployment
Unemployment can be classified into three types:
1. Frictional unemployment is unemployment that arises from normal labor market turnover, that is, from people entering and leaving the labor force and from the ongoing creation and destruction of jobs.
a) The creation and destruction of jobs requires that unemployed workers search for new jobs.
b) Increases in the number of young people entering the labor force and increases in unemployment benefit payments raise frictional unemployment.
2. Structural unemployment is unemployment that arises when changes in technology or international competition change the skills needed to perform jobs or changer the locations of jobs.
3. Cyclical unemployment is the fluctuation in unemployment over the business cycle.
C. Full Employment
1. Full employment occurs when there is no cyclical unemployment or, equivalently, when all unemployment is frictional or structural.
2. The unemployment rate at full employment is called the natural rate of unemployment. The natural rate of unemployment is not zero because some jobs are always being created and destroyed and some people are always entering the labor force or changing jobs.
D. Real GDP and Unemployment Over the Cycle
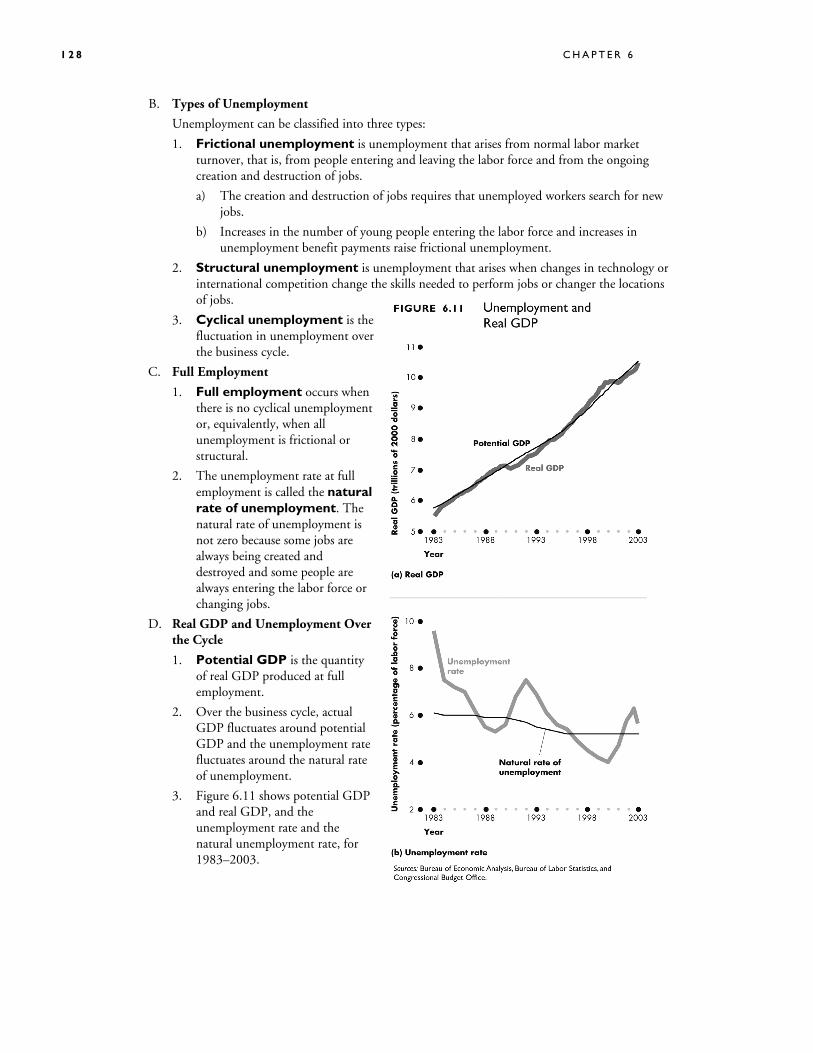
1. Potential GDP is the quantity of real GDP produced at full employment.
2. Over the business cycle, actual GDP fluctuates around potential GDP and the unemployment rate fluctuates around the natural rate of unemployment.
3. Figure 6.11 shows potential GDP and real GDP, and the unemployment rate and the natural unemployment rate, for 1983–2003.
M O N I T O R I N G C Y C L E S , J O B S , A N D T H E P R I C E L E V E L 1 2 9
IV. The Consumer Price Index
A. The Consumer Price Index, or CPI, is a measure of the average of the prices paid by urban consumers for a fixed “basket” of consumer goods and services.
B. Reading the CPI Numbers
1. The CPI is defined to equal 100 for a period called the reference base period. Currently the reference base period is 1982-1984.
2. The difference between value of the CPI for any period and the CPI in the reference base period (100) is the percentage change in the average of the prices in the current period compared to the base period.
B. Constructing the CPI
1. Constructing the CPI involves three stages:
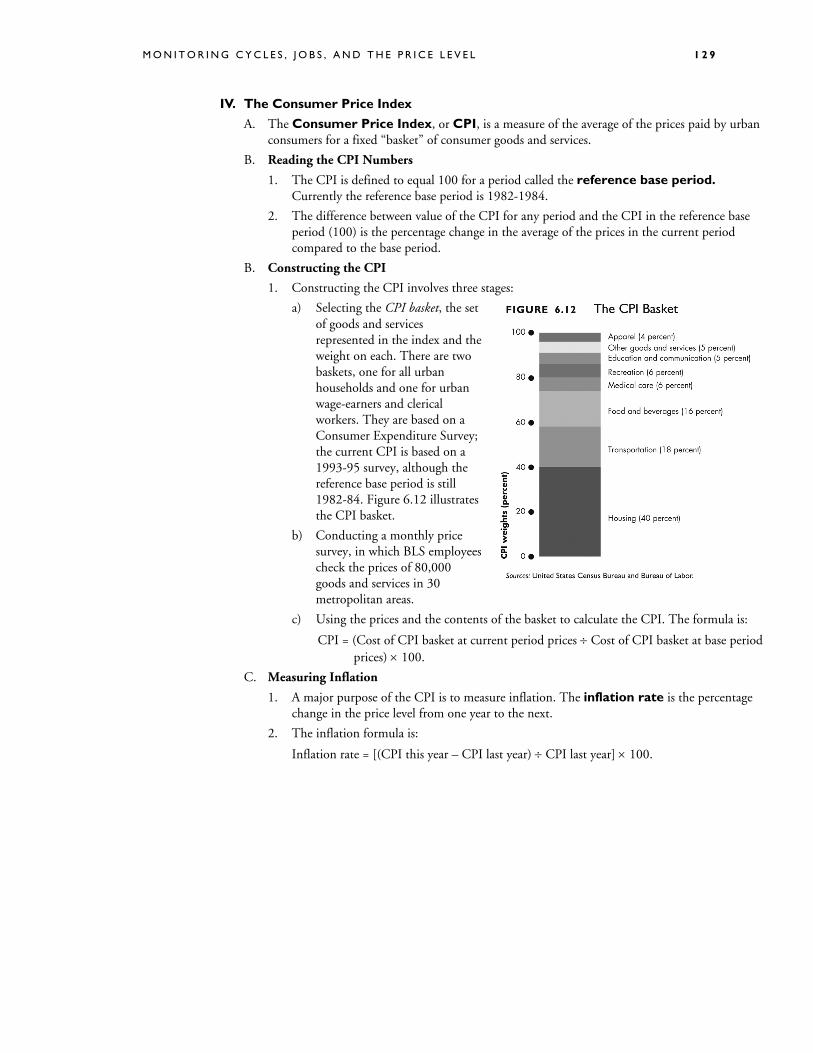
a) Selecting the CPI basket, the set of goods and services represented in the index and the weight on each. There are two baskets, one for all urban households and one for urban wage-earners and clerical workers. They are based on a Consumer Expenditure Survey; the current CPI is based on a 1993-95 survey, although the reference base period is still 1982-84. Figure 6.12 illustrates the CPI basket.
b) Conducting a monthly price survey, in which BLS employees check the prices of 80,000 goods and services in 30 metropolitan areas.
c) Using the prices and the contents of the basket to calculate the CPI. The formula is:
CPI = (Cost of CPI basket at current period prices ÷ Cost of CPI basket at base period prices) × 100.
C. Measuring Inflation
1. A major purpose of the CPI is to measure inflation. The inflation rate is the percentage change in the price level from one year to the next.
2. The inflation formula is:
Inflation rate = [(CPI this year – CPI last year) ÷ CPI last year] × 100.
1 3 0 C H A P T E R 6
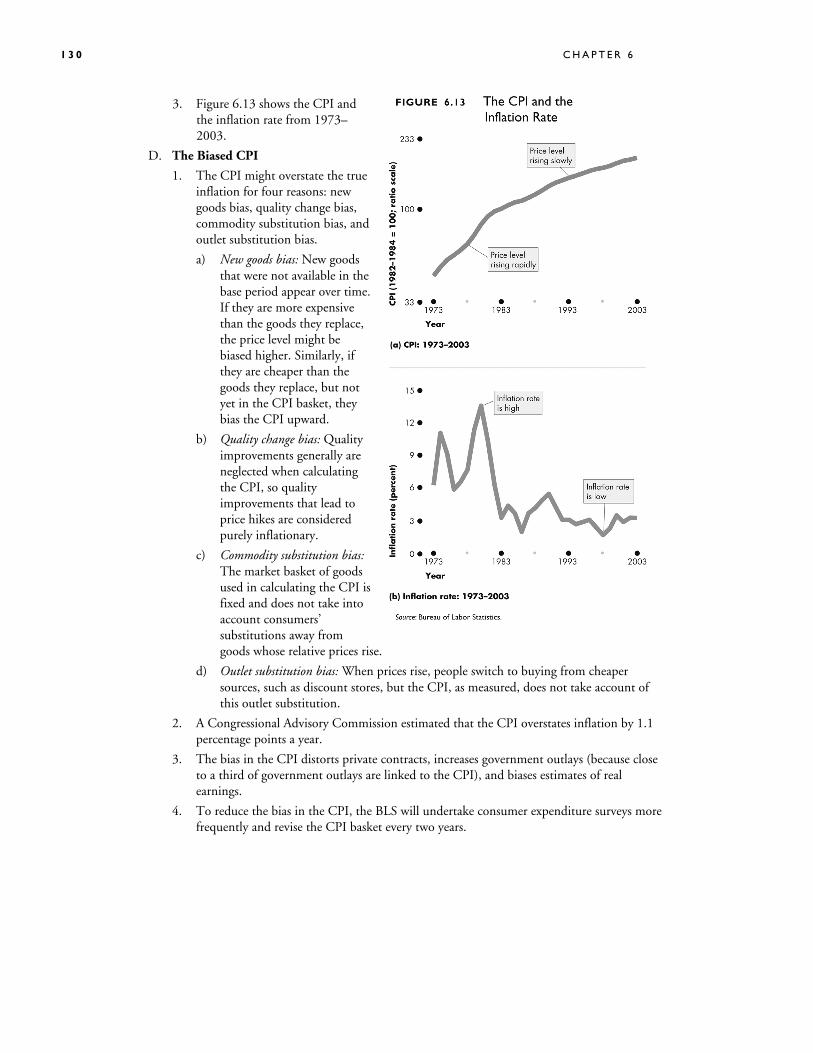
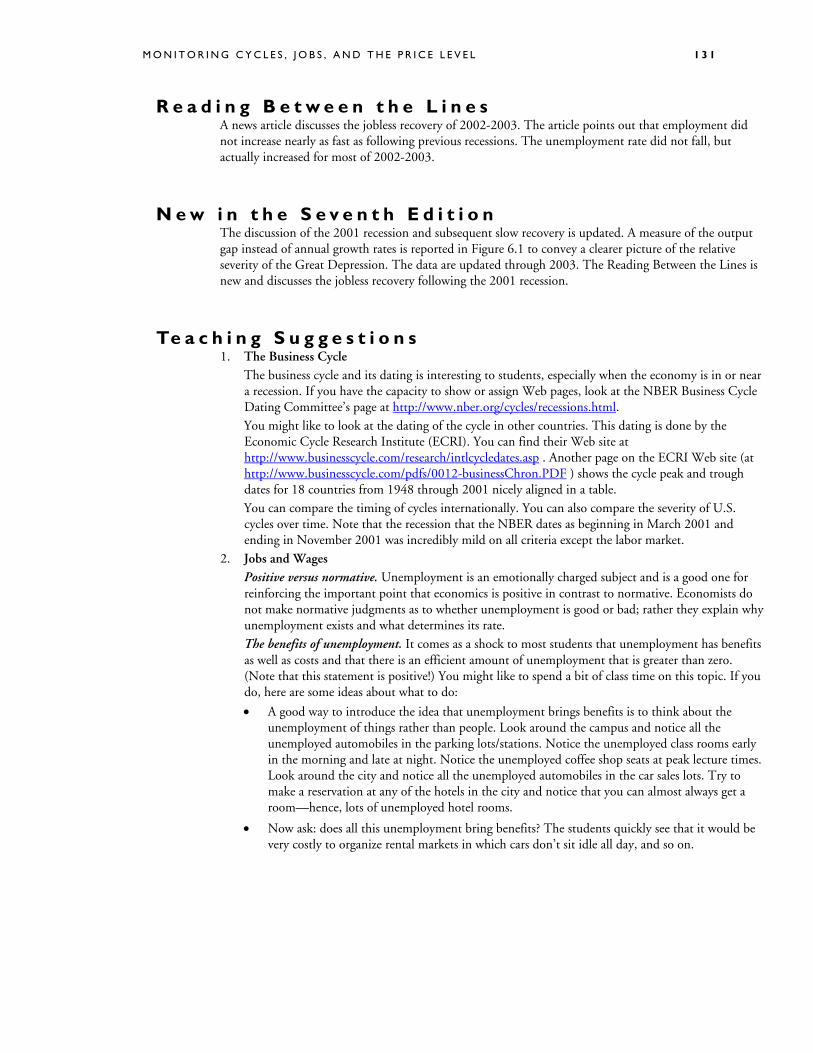
3. Figure 6.13 shows the CPI and the inflation rate from 1973–2003.
D. The Biased CPI
1. The CPI might overstate the true inflation for four reasons: new goods bias, quality change bias, commodity substitution bias, and outlet substitution bias.
a) New goods bias: New goods that were not available in the base period appear over time. If they are more expensive than the goods they replace, the price level might be biased higher. Similarly, if they are cheaper than the goods they replace, but not yet in the CPI basket, they bias the CPI upward.
b) Quality change bias: Quality improvements generally are neglected when calculating the CPI, so quality improvements that lead to price hikes are considered purely inflationary.
c) Commodity substitution bias: The market basket of goods used in calculating the CPI is fixed and does not take into account consumers’ substitutions away from goods whose relative prices rise.
d) Outlet substitution bias: When prices rise, people switch to buying from cheaper sources, such as discount stores, but the CPI, as measured, does not take account of this outlet substitution.
2. A Congressional Advisory Commission estimated that the CPI overstates inflation by 1.1 percentage points a year.
3. The bias in the CPI distorts private contracts, increases government outlays (because close to a third of government outlays are linked to the CPI), and biases estimates of real earnings.
4. To reduce the bias in the CPI, the BLS will undertake consumer expenditure surveys more frequently and revise the CPI basket every two years.
M O N I T O R I N G C Y C L E S , J O B S , A N D T H E P R I C E L E V E L 1 3 1
R e a d i n g B e t w e e n t h e L i n e s A news article discusses the jobless recovery of 2002-2003. The article points out that employment did not increase nearly as fast as following previous recessions. The unemployment rate did not fall, but actually increased for most of 2002-2003.
N e w i n t h e S e v e n t h E d i t i o n The discussion of the 2001 recession and subsequent slow recovery is updated. A measure of the output gap instead of annual growth rates is reported in Figure 6.1 to convey a clearer picture of the relative severity of the Great Depression. The data are updated through 2003. The Reading Between the Lines is new and discusses the jobless recovery following the 2001 recession.
Te a c h i n g S u g g e s t i o n s 1. The Business Cycle The business cycle and its dating is interesting to students, especially when the economy is in or near
a recession. If you have the capacity to show or assign Web pages, look at the NBER Business Cycle Dating Committee’s page at http://www.nber.org/cycles/recessions.html.
You might like to look at the dating of the cycle in other countries. This dating is done by the Economic Cycle Research Institute (ECRI). You can find their Web site at http://www.businesscycle.com/research/intlcycledates.asp . Another page on the ECRI Web site (at http://www.businesscycle.com/pdfs/0012-businessChron.PDF ) shows the cycle peak and trough dates for 18 countries from 1948 through 2001 nicely aligned in a table.
You can compare the timing of cycles internationally. You can also compare the severity of U.S. cycles over time. Note that the recession that the NBER dates as beginning in March 2001 and ending in November 2001 was incredibly mild on all criteria except the labor market.
2. Jobs and Wages Positive versus normative. Unemployment is an emotionally charged subject and is a good one for
reinforcing the important point that economics is positive in contrast to normative. Economists do not make normative judgments as to whether unemployment is good or bad; rather they explain why unemployment exists and what determines its rate.
The benefits of unemployment. It comes as a shock to most students that unemployment has benefits as well as costs and that there is an efficient amount of unemployment that is greater than zero. (Note that this statement is positive!) You might like to spend a bit of class time on this topic. If you do, here are some ideas about what to do:
• A good way to introduce the idea that unemployment brings benefits is to think about the unemployment of things rather than people. Look around the campus and notice all the unemployed automobiles in the parking lots/stations. Notice the unemployed class rooms early in the morning and late at night. Notice the unemployed coffee shop seats at peak lecture times. Look around the city and notice all the unemployed automobiles in the car sales lots. Try to make a reservation at any of the hotels in the city and notice that you can almost always get a room—hence, lots of unemployed hotel rooms.
• Now ask: does all this unemployment bring benefits? The students quickly see that it would be very costly to organize rental markets in which cars don’t sit idle all day, and so on.
1 3 2 C H A P T E R 6
• Now ask: do the same ideas apply to unemployed people? (Be sure to be compassionate about the misery that unemployment can bring. You are not claiming that it is not costly. You’re trying to identify the benefits, if any.)
• You’ll quickly get your students to see that imagining an economy without any unemployment is nearly impossible. If consumers are free to change their decisions about what they want to buy, some goods and services must fall out of favor when others come into favor. The firms making the unfavored products fall on hard times and often their workers are fired or laid off.
• Sure, these laid off workers could start work right away, cleaning shoes or selling flowers at intersections. But they are better off (in their own opinion) being frictionally unemployed and searching for new jobs. To eliminate this source of unemployment we would need to forbid consumers from changing their buying plans or insist that no one remain idle and get on with doing any job even if it doesn’t earn a wage.
• Note that if this is how we ran our economy, we’d still be using coal-fired stoves and the pony express, and we’d be wearing coonskin caps. There would be no McDonald’s, Federal Express, or Nike shoes.
Male-female differences in the labor market. Students are interested in the different behavior of the male labor force participation rate and the female labor force participation rate. Students will probably believe that the reason for the increasing female participation rate is social, not economic. They will identify changing social attitudes toward women as the major source and probably see the women’s liberation movement as the driving force for this change. While not to deny the importance of attitudes, this area is a good one in which to get students to explore the economic forces that lie behind social attitudes and change. Get them to think about the technological advances that have contributed to more women being in the labor force. Many goods that were previously produced in the household are now mass-produced and available for purchase—most items of prepared food, for example. New appliances have increased productivity in the home enabling household production in less time—laundry, kitchen, and cleaning equipment for example. The market provides new goods and services that households want but can’t readily make at home—home entertainment equipment (TV, CD, DVD, etc) for example. These changes lead to many families deciding to have two income-earners rather than the older tradition of one. It is interesting to let students discuss what they think will happen to the labor force participation rates in the future and whether or not they think they will ever be equal—or unequal in the opposite direction!
Jobs and home production. It is interesting to ask students to think about appropriate measures of labor force participation over long periods of time or in very different economic arrangements. The technical definition involves spending time working for gain, or seeking work for gain. In the United States, this usually equates to work outside the home. Ask students whether women who are unpaid family workers on farms are in or out of the labor force; and then ask whether they are if they don’t work outside the home, but cook, make and wash clothing, and otherwise maintain the household for a large family.
3. Unemployment and Full Employment Labor turnover and unemployment. Ask in class how many students have jobs and how many of
them have changed their job within the last 12 months. You can now discuss the constant movement in and out of the labor market and the consequence that frictional unemployment will always exist.
Identifying frictional, structural, and cyclical unemployment. Ask your class if anyone they know has been laid off. Then discuss whether losing a job creates frictional, structural, or cyclical unemployment. Look at your local examples. If you live in a steel-producing area, for example, you can talk about local structural unemployment arising from the closing of a steel manufacturer due to international competition. For cyclical unemployment, ask students how they think the business cycle and cyclical unemployment is related to full-time enrollments at higher education institutions.
M O N I T O R I N G C Y C L E S , J O B S , A N D T H E P R I C E L E V E L 1 3 3
Students often don’t think there is any relationship. But nationally during a recession, the growth rate of full-time enrollments increases. Ask students if they can explain this relationship. The answer is that during a recession and due to the increase in cyclical unemployment, the opportunity cost of school decreases. This is a great way to keep students thinking about marginal benefits and costs.
4. The Consumer Price Index The CPI—an average. It is important for students to understand that the CPI is based on the average
expenditure basket, not the expenditure pattern of any given household. Displaying the detailed press releases on the BLS Web site helps make this point very forcibly: students often do not realize until they see the numbers that the CPI must include both costs of owning a house and costs of renting one; costs of buying a car and costs of public transportation; and so on.
Making the CPI personal. If you have time (or want to make time) you can get your students to construct their own CPI basket. Each student makes a statement of her/his expenditure in the same categories as the CPI basked in Figure 6.12. Students then compare their expenditure patterns to the average of the CPI basket.
CPI biases—concrete illustrations. New goods bias can be illustrated with MP3 music rather than CDs; quality change with computers and cars; commodity substitution with movies versus videos; and outlet substitution by the growth of Wal-mart, Target, and shopping on the internet.
T h e B i g P i c t u r e
Where we are going
Chapter 6 continues to introduce macroeconomic issues and the measurements of key macroeconomic variables. The link between employment and real GDP is an important concept that helps serve as a foundation for the presentation of aggregate supply and demand in Chapter 7. Chapter 6 also sets the stage for Chapter 8, which explains the labor market and how full employment and the equilibrium real wage are determined.
Where we have been
This chapter fills in details of a number of issues touched on in Chapter 4. It explains how business cycles are defined and measured. It also increases students’ understanding of the types and causes of unemployment. It also provides students detail on the use of the CPI to measure inflation, which can be contrasted with the GDP deflator as a measure of inflation discussed in Chapter 5.
O v e r h e a d Tr a n s p a r e n c i e s
Transparency Text figure Transparency title
31 Figure 6.1 Business Cycle Patterns
32 Figure 6.2 Population Labor Force Categories
33 Figure 6.7 Labor Market Flows
34 Figure 6.11 Unemployment and Real GDP
35 Figure 6.12 The CPI Basket
1 3 4 C H A P T E R 6
E l e c t r o n i c S u p p l e m e n t s MyEconLab
MyEconLab provides pre- and post-tests for each chapter so that students can assess their own progress. Results on these tests feed an individualized study plan that helps students focus their attention in the areas where they most need help.
Instructors can create and assign tests, quizzes, or graded homework assignments that incorporate graphing questions. Questions are automatically graded and results are tracked using an online grade book.
PowerPoint Lecture Notes
PowerPoint Electronic Lecture Notes with speaking notes are available and offer a full summary of the chapter.
PowerPoint Electronic Lecture Notes for students are available in MyEconLab.
Instructor CD-ROM with Computerized Test Banks
This CD-ROM contains Computerized Test Bank Files, Test Bank, and Instructor’s Manual files in Microsoft Word, and PowerPoint files. All test banks are available in Test Generator Software.
A d d i t i o n a l D i s c u s s i o n Q u e s t i o n s 11. Should discouraged workers be counted as part of the unemployment rate? 12. “Unemployment is bad for the unemployed individual and bad for the nation. Hence the
government should force the unemployment rate to 0 percent.” Comment on this assertion, discussing both its feasibility and its desirability.
13. How can the unemployment rate be less than the natural rate? 14. Is it worse to have eight workers, each unemployed for a month, or one worker unemployed for eight
months? Why? 15. Why is total labor compensation a better measure of the real wage? 16. How does a change in productivity change the real wage rate? 17. How does the business cycle affect the duration of unemployment? 18. Identify reasons for the existence of unemployment. State whether each reason is most likely to
contribute to frictional, structural, or cyclical unemployment. 19. Why is a change in the age structure of the population, increasing the proportions of young or old
workers in the labor force, likely to change the natural rate of unemployment? 10. What is the natural rate of unemployment? What is the controversy concerning its measurement? 11. What should be included in the basket of goods and services if you were trying to construct a price
index for the students in your class? How would you do it? 12. Does it matter if the CPI has an upward bias? Why?
M O N I T O R I N G C Y C L E S , J O B S , A N D T H E P R I C E L E V E L 1 3 5
A n s w e r s t o t h e R e v i e w Q u i z z e s
Page 129 (page 501 in Economics) 1. The phases of the business cycle are expansion and recession.
2. We know a recession has begun when the NBER Business Cycle Dating Committee determines that there has been “a significant decline in activity spread across the economy, lasting more than a few months, visible in industrial production, employment, real income, and wholesale-retail trade. Usually, there will also be a two quarters decline in real GDP.
3. We know a recession has ended when the NBER Business Cycle Dating Committee determines that there has been a sufficiently clear expansion to know that a trough has occurred.
4. Recessions have tended to become shorter and milder, not worse.
5. Real GDP fell by only 0.6 percent from peak to trough.
Page 134 (page 506 in Economics) 1. The unemployment rate had an upward trend during the 1970s and a downward trend during the
1980s and 1990s. The labor force participation rate and the employment-to-population ratio have an upward trend.
2. The unemployment rate increases with recession and decreases with expansions, with a lag of about six months (so unemployment often continues to increase for the first couple of quarters of a recovery). The labor force participation rate fluctuates the least over the business cycle but decreases during recessions and increases during expansions. The employment-to-population ratio decreases during recessions and increases during expansions.
3. The female labor force participation ratio has increased, but the male participation ratio has decreased.
4. Aggregate hours have not grown as quickly as the number of people employed because the average workweek has shortened.
5. Average hourly real wage rates have fallen slightly in the early 2000s.
Page 139 (page 511 in Economics) 1. People become unemployed for three reasons: losing a job, leaving a job, and entering or
reentering the labor force. Job losers account for the largest fraction of the unemployed and also are the source of most of the variation.
2. Frictional unemployment is the unemployment that arises from the “frictions” in the labor market, that is, normal labor market turnover. For instance, newly graduated students entering the labor market looking for work are frictionally unemployed. Structural unemployment represents the unemployment created by “structural” changes in the economy. For instance, workers are structurally unemployed if they lose their jobs because of changes in technology or the amount of foreign competition and if they have different skills from those required by new jobs or if they live in a different region of the country from those where new jobs are being created. Finally, cyclical unemployment is the unemployment caused by business cycle fluctuations in economic activity (for instance, a worker laid off in 2001 because of the recession).
3. The natural rate of unemployment is the unemployment rate when no cyclical unemployment exists. That is, when all unemployment is frictional or structural the unemployment rate equals to natural rate of unemployment. Full employment occurs when there is no cyclical unemployment and the unemployment rate equals the natural rate of unemployment.
1 3 6 C H A P T E R 6
4. Changes in the natural rate of unemployment arise because of demographic changes in the population, such as a rise in the number of young workers, who have weak initial attachment to the labor force and high job turnover; changes in the technology and structure of the labor market, such as the growth of the Internet as a means of job search; and because of a change in the rate of technical change or of comparative advantage of the United States that change the level of structural unemployment.
5. The unemployment rate rises during recessions and the first part of an expansion; the unemployment rate falls during expansions and often during the first part of a recession. This pattern in the unemployment rate arises because employers are reluctant to change the size of their permanent labor force as soon as output changes because it is costly to hire and fire workers. Instead employer change their output by adjusting the hours per worker or by hiring temporary part-time workers. Only when the change in output appears to be permanent, do employers start to hire or fire workers. So changes in unemployment tend to lag behind changes in real GDP by around six months.
Page 143 (page 515 in Economics) 1. The CPI is the Consumer Price Index. It is the ratio of the cost of a fixed basket of goods and
services, which represents average expenditure by urban households based on an expenditure survey, to the ratio of the cost of the same basket in a fixed base reference period, multiplied by 100. It is the common measure of the cost of living, and the basis for the most common measures of inflation.
2. The inflation rate is the percentage change in a price index from one year to the next. The rate of change of the CPI is often used as a measure of inflation as faced by consumers. The rate of change of the GDP deflator is a broader measure of inflation.
3. The CPI is biased upward because of new goods; quality change; commodity substitution; and outlet substitution.
4. Upward bias in the CPI distorts private contracts and government outlays that include formulas based on CPI change as a measure of inflation. If the intent is to maintain the real value of a payment, indexing payments to the CPI will in fact increase the real value of payments over time if the CPI has an upward bias. In one year, it may not be much, but it will cumulate over time and close to one third of federal government outlays are indexed to the CPI.
M O N I T O R I N G C Y C L E S , J O B S , A N D T H E P R I C E L E V E L 1 3 7
A n s w e r s t o t h e P r o b l e m s 1. a. Unemployment rate is 4.0 percent.
The unemployment rate is the percentage of the labor force that is unemployed. The labor force is the sum of the people unemployed and the people employed. So the number of people who are unemployed is 141,544,000 minus 135,888,000, which is 5,656,000. The unemployment rate equals (the number of people unemployed divided by the labor force) multiplied by 100. That is, (5,656,000/141,544,000) × 100, which is 4.0 percent.
b. The labor force participation rate is 67.2 percent. The labor force participation rate is the percentage of the working-age population that is in the labor force. The working-age population is 210,743,000 and the labor force is 141,544,000, so the labor force participation rate equals (141,544,000/210,743,000) ×100, which equals 67.2 percent.
c. The employment-to-population ratio is 64.5 percent. The employment-to-population ratio is the percentage of the people of working age who have jobs. The employment-to-population ratio is equal to the number of people employed divided by the working-age population all multiplied by 100. The employment-to-population ratio is (135,888,000/210,743,000) × 100, which is 64.5 percent.
2. a. Unemployment rate is 5.8 percent. The unemployment rate is the percentage of the labor force that is unemployed. The labor force is the sum of the people unemployed and the people employed. So the number of people who are unemployed is 142,314,000 minus 134,055,000, which is 8,259,000. The unemployment rate equals (the number of people unemployed divided by the labor force) multiplied by 100. That is, (8,259,000/142,314,000) × 100, which is 5.8 percent.
b. The labor force participation rate is 66.8 percent. The labor force participation rate is the percentage of the working-age population that is in the labor force. The working-age population is 212,927,000 and the labor force is 142,314,000, so the labor force participation rate equals (142,314,000/212,927,000) ×100, which equals 66.8 percent.
c. The employment-to-population ratio is 63 percent. The employment-to-population ratio is the percentage of the people of working age who have jobs. The employment-to-population ratio is equal to the number of people employed divided by the working-age population all multiplied by 100. The employment-to-population ratio is (134,055,000/212,927,000) × 100, which is 63 percent.
3. Unemployment decreased by 64,000. The number of people not in the labor force increased by 600,000. During 2000, employment in the United States increased by 1,375,000 and the labor force increased by 1,311,000. The number of unemployed is calculated as the labor force minus the number employed. When the labor force increased by 1,311,000 and employment increased by 1,375,000, unemployment decreased by 64,000.
4. Unemployment increased by 2,603,000. The number of people not in the labor force increased by 1,414,000. During 2001, employment in the United States decreased by 1,833,000 and the labor force increased by 770,000. The number of unemployed is calculated as the labor force minus the number employed. When the labor force increased by 770,000 and employment decreased by 1,833,000, unemployment increased by 2,603,000.
1 3 8 C H A P T E R 6
5. a. The number of job losers probably increased. The number of job leavers probably did not change much. The increase in the unemployment rate is an indication that the economy was slowing and possibly going into recession. Normally, in a recession, the number of job losers increases but the number of job leavers does not change much.
b. Labor force entrants and reentrants probably decreased. In a recession, discouraged workers remain outside the labor force. So it is likely that entrants and reentrants decreased.
6. a. The solutions to this problem are the same as those for Problem 5. But the increase in the unemployment rate was 1.4 percentage points, so the changes in labor market flows would be larger.
b. Again, the economy is possibly in a recession, so we expect the labor force entrants and reentrants to have decreased.
7. a. The labor force in July is 11,000. It is the number employed plus the number unemployed. b. The unemployment rate in July is 9.1 percent. It is the number unemployed as a percentage of
the labor force. c. The working-age population is 16,000. It is the sum of the labor force and the number of people
who are not in the labor force. d. The employment-to-population ratio is 62.5. It is the number employed as a percentage of the
working-age population. e. The number of people who are unemployed at the end of August is 940. It equals the number
unemployed in July plus job losers, job leavers, entrants, and reentrants minus hires, recalls, and withdrawals.
f. The number of people who are employed at the end of August is 10,050. It equals the number employed in July minus job losers and job leavers plus hires and recalls.
g. The labor force at the end of August is 10,990. It equals the number employed plus the number unemployed.
h. The unemployment rate at the end of August is 8.6 percent. It equals the number unemployed as a percentage of the labor force.
8. a. The labor force in July is 11,900. It is the number employed plus the number unemployed. b. The unemployment rate in July is 7.6 percent. It is the number unemployed as a percentage of
the labor force. c. The working-age population is 16,900. It is the sum of the labor force and the number of people
who are not in the labor force. d. The employment-to-population ratio is 65.1. It is the number employed as a percentage of the
working-age population. e. The number of people who are unemployed at the end of August is 810. It equals the number
unemployed in July plus job losers, job leavers, entrants, and reentrants minus hires, recalls, and withdrawals.
f. The number of people who are employed at the end of August is 11,130. It equals the number employed in July minus job losers and job leavers plus hires and recalls.
g. The labor force at the end of August is 11,940. It equals the number employed plus the number unemployed.
h. The unemployment rate at the end of August is 6. 8 percent. It equals the number unemployed as a percentage of the labor force.
9. a. The CPI basket is 10 bottles of juice and 5 lengths of cloth.
M O N I T O R I N G C Y C L E S , J O B S , A N D T H E P R I C E L E V E L 1 3 9
b. The CPI in the current year is 107.7. To calculate the CPI, multiply the value of the CPI basket in current year prices by 100 and divide by the base year value of the CPI basket. The value of the CPI basket in current year prices is: ($4 × 10) + ($6 × 5) = $70. The value in base year prices is $40 + $25 (provided in the question), which equals $65. So the CPI is ($70/$65) × 100 = 107.7.
c. The inflation rate in the current year is 7.7 percent. The inflation rate equals the CPI in the current year minus the CPI in the base year expressed as a percentage of the base year CPI. Because the base year CPI is 100, the inflation rate is [(107.7 – 100)×100]/100 = 7.7 percent.
10. a. The CPI basket is 10 mangoes of juice and 20 bags of nuts. b. The CPI in the current year is 135.7.
To calculate the CPI multiply the value of the CPI basket in current year prices by 100 and divide by the base year value of the CPI basket. The value of the CPI basket in current year prices is: ($1.50 × 10) + ($4 × 20) = $95. The value in base year prices is $60 + $10 (provided in the question), which equals $70. So the CPI is ($95/$70) × 100 = 135.7.
c. The inflation rate in the current year is 35.7 percent. The inflation rate equals the CPI in the current year minus the CPI in the base year expressed as a percentage of the base year CPI. Because the base year CPI is 100, the inflation rate is [(135.7 – 100) × 100]/100 = 35.7 percent.

Recommended