DI
SC
US
SI
ON
P
AP
ER
S
ER
IE
S
Forschungsinstitut zur Zukunft der ArbeitInstitute for the Study of Labor
Climate Change, Natural Disasters and Migration: An Empirical Analysis in Developing Countries
IZA DP No. 5927
August 2011
Alassane DraboLinguère Mously Mbaye
Climate Change, Natural Disasters and
Migration: An Empirical Analysis in Developing Countries
Alassane Drabo CERDI, Université d’Auvergne
Linguère Mously Mbaye
CERDI, Université d’Auvergne and IZA
Discussion Paper No. 5927 August 2011
IZA
P.O. Box 7240 53072 Bonn
Germany
Phone: +49-228-3894-0 Fax: +49-228-3894-180
E-mail: [email protected]
Any opinions expressed here are those of the author(s) and not those of IZA. Research published in this series may include views on policy, but the institute itself takes no institutional policy positions. The Institute for the Study of Labor (IZA) in Bonn is a local and virtual international research center and a place of communication between science, politics and business. IZA is an independent nonprofit organization supported by Deutsche Post Foundation. The center is associated with the University of Bonn and offers a stimulating research environment through its international network, workshops and conferences, data service, project support, research visits and doctoral program. IZA engages in (i) original and internationally competitive research in all fields of labor economics, (ii) development of policy concepts, and (iii) dissemination of research results and concepts to the interested public. IZA Discussion Papers often represent preliminary work and are circulated to encourage discussion. Citation of such a paper should account for its provisional character. A revised version may be available directly from the author.
IZA Discussion Paper No. 5927 August 2011
ABSTRACT
Climate Change, Natural Disasters and Migration: An Empirical Analysis in Developing Countries
The aim of this paper is to assess the relationship between natural disasters caused by climate change and migration by examining migration rates and levels of education in developing countries. Many studies such as the Stern review (2007) or the Intergovernmental Panel on Climate Change (IPCC, 2007) predict an intensification of climate change for future years. Thus climate change has taken an essential place in world governance. The relationship between climate change, natural disasters and migration is crucial; developed countries need to manage the increasingly complicated issues of additional incoming migratory flows caused by environmental degradation. We investigate this relationship by using panel data from developing countries in order to see the effect of natural disasters on migration rates and how that varies according to the level of education. Estimations are made with a country fixed effects estimator through an accurate econometric model. The results confirm previous studies, namely that natural disasters are positively associated with emigration rates. But beyond this result, the main contribution of this paper is to show that natural disasters due to climate change exacerbate the brain drain in developing countries characterized by the migration of highly skilled people just when those countries are at their most vulnerable and need greater support from skilled workers to deal with the damage associated with natural disasters. The paper also shows that this effect varies depending on geographical location. JEL Classification: O15, Q54 Keywords: climate change, natural disasters, migration Corresponding author: Linguère Mously Mbaye CERDI – CNRS Université d’Auvergne 65 Bd François Mitterrand 63000 Clermont-Ferrand France E-mail: [email protected]
2
1. Introduction
International migration is of great concern to developing countries. The movement of
human capital is led by economic, demographic, political, social, cultural and environmental
factors in both the sending country (push factors) as well as in destination countries (pull
factors). The main reason for international migration found in the theoretical and the
empirical literature is differences in economic opportunities or, more precisely, wages
differential (Harris and Todaro, 1970; Ghatak et al. 1996). Beyond the wages differential,
migration is considered as a way to diversify income sources (Stark, 1991), to deal with bad
political institutions, large social disparities, conflicts, and the lack of good infrastructure.
People also migrate for family reunification or to join relatives abroad. Finally, because of
globalization, there is a decreasing of the uncertainty caused by modern communication
technologies such as the internet and satellite TV, which might be an explanation for
persistently rising migration in recent decades. In a word, migration is a possibility for people
to improve their quality of life and all the factors previously named can be affected directly or
indirectly by climate change and natural disasters.
History demonstrates that climate change is often associated with massive movements of
population and that the natural environment is probably the oldest determinant of migration
and population displacement. Many studies such as the Stern report (2007) and the
Intergovernmental Panel on Climate Change (IPCC, 2007) predict an intensification of
climate change for the forthcoming years. According to the International Organization for
Migration (IOM), by the half century, 200 million people (equal to the current estimate of
international migrants) could be permanent or temporary environmental migrants2 within their
countries or overseas. Climate change has, thus, taken an important place in world
governance. But the partial failure of the Copenhagen Conference (2009) shows that it is
difficult for the states to agree on the strategy to adopt in order to reduce their impact on the
environment. The interests and the means of action are different according to each nation’s
level of development. Indeed, developed countries are responsible for an important part3 of
pollution and greenhouse gas emission compared to developing countries, which bear the
brunt of this environmental degradation and are disproportionately affected because of their
2 We consider the term “environmental migrants”, because it is larger and inclusive than environmental refugees. It takes into account the forced population displacement due to environmental reasons; with push factors largely more determinant then pull factors (see Appendix 1 for other definitions).
3 Rich countries will be responsible for 60-80% of gas emission by 2050 (Stern, 2007)
3
economic vulnerability and their lack of means due to poverty. This environmental decline
can induce natural disasters among other problems and, for the population of those countries,
migration is one of the solutions to confront this issue. The management of supplementary
migratory flows due to environmental degradation are made more complicated for developed
countries by issues of migration from developing countries. Environmental migration is often
at the origin of population displacement which can affect the stability of the hosting areas in
many ways. It can induce conflicts with local populations by putting pressure on employment
and local wages, trade and natural resources such as water, especially if those regions are
already poor.
Since the second half of the eighties, many studies have been conducted on the effect of
climate change on involuntary population displacement. In recent decades, Reuveny (2007)
argues that the effects of climate change on migration can be predicted by exploring the
effects of environmental problems on migration. People can adapt to these problems by either
staying in place and doing nothing, staying in place and mitigating the problems, or by
leaving the affected areas, depending on the extent of problems and the mitigation
capabilities. According to Smith (2007) migration on a permanent or temporary basis has
always been one of the most important survival strategies adopted by people confronted by
natural or human-caused disasters. Naudé (2008) shows in the Sub-Saharan Africa context
that environmental pressure has an impact on migration through the frequency of natural
disasters. Poston et al (2009) show the effect of climate change on in-migration, out-
migration and net migration among 50 states of the United States of America and their results
are confirmed by Reuveny and Moore (2009) who demonstrate that environmental decline
plays a statistically significant role in out-migration, pushing people to leave their homes and
move to other countries. Finally, Marchiori and Schumacher (2011) found that minor impacts
of climate change have major impacts on the numbers of migrants.
Relative to this literature, the main contribution and the aim of this paper is to examine the
relationship between climate change and migration by studying the effect on migration rates
of natural disasters caused by climate change but above all, and different from previous
studies, by examining the effect of natural disasters on migration in the context of the level of
people’s education.
The paper then investigates the relationship between climate change, migration and
natural disasters by using panel data from developing countries. Estimationss are made with a
4
country fixed effects estimator through an accurate econometric model and the results confirm
previous studies, namely that natural disasters are positively associated with emigration rates.
But, beyond this, the paper shows that natural disasters due to climate change exacerbate the
brain drain in developing countries by involving the migration of highly skilled people, and
this effect varies depending on the geographical location of the countries.
The next section presents a literature review on the climate change issue in developing
countries and the relationship between climate change, natural disasters and migration. In
Section 3 we present the empirical design while the estimations results and robustness checks
are discussed in Section 4. Concluding remarks and implications are provided in the last
section.
2. Literature Review
The forecasts concerning environmental issues due to climate change are alarming.
According to Dyson (2005), there will inevitably be a major rise in atmospheric CO2 during
the 21st century due among other causes to the momentum in economic and demographic
processes. Stern (2007) warns that, by 2035, a rise in temperature of over 2°C induced by a
rapid increase of greenhouse gas emissions could be doubled compared with its pre-industrial
level4. In the long term, the temperature rise may exceed 5°C, which is equivalent to the
change in average temperatures from the last ice age to today. Marine eco-systems and food
stocks are threatened by oceanic acidification due to carbon dioxide levels. Due to global
warming, the Arctic will be ice-free in summer by 2100 because of a reduction of sea ice, and
15 to 40% of its species may become extinct. Melting glaciers will result in a rise in sea
levels, particularly in the subtropics (Meehl and al., 2006), putting pressure on coastal areas
and small islands. It will also threaten 4 million km² of land representing home to 5% of the
world’s population, and may increase flood risks during wet seasons and reduced water
supplies to one sixth of the world’s population. Global warming, by altering the environment,
has a significant effect on human health and infectious diseases (Schrag and Wiener, 1995;
Khasnis and Nettleman, 2005). It entails natural disasters which affect housing,
infrastructure, crop yield and livestock and consequently weakens economies (Perch-Nielsen,
et al., 2008).
4 According to this report, average global temperatures could increase by 2-3°C within the next fifty years.
5
2.1 Climate change issue in developing countries
Climate has a significant effect on well-being and levels of happiness. Rehdanz and
Maddison (2005) show that temperature changes benefit high latitude countries whereas they
negatively affect low latitude countries. Indeed, a small amount of global warming would
increase the happiness of those living in Northern countries, whereas it is the reverse for
people living in high temperature regions. According to Stern (2007), predictions for
developing countries reveal alarming future agricultural output and a reduction in crop yields,
food security and issues related to water. Climate change involves droughts which are
responsible for an increase in food prices, disease, and consequently an increase in health
expenditure. Moreover, populations have to deal with the issue of water, the most climate
sensitive economic resource for these countries. In South Asia, for example, climate change
will increase rainfall and flooding with a direct effect on agricultural production, and with
serious consequences in a region with a high population growth. In Latin America and
Caribbean areas, serious threats exist to the rainforests with direct consequences for the
subsistence of populations depending on the Amazonian forest. In Sub-Saharan Africa, an
increase in sea level threatens coastal cities when higher temperatures raise risks of
malnutrition, starvation and malaria, decreased river flow and the subsequent availability of
water. In the Nile Basin, the Middle East and North African countries, water stress and severe
droughts could cause migration and violent conflicts5.
The poorest countries have also to cope with the economic consequences of climate
change. Climate change weakens States and decreases their ability to provide opportunities
and services to help people become less vulnerable, above all if those people already live in
marginalized areas. Indeed, the economy of many developing countries is essentially based
on agriculture and primary goods which are one of the main sectors directly touched by
climate change and natural disasters. As well as their poverty, developing countries are in a
disadvantageous situation due to their rapid population growth, their massive urbanization and
their geographical environment, which make them more vulnerable and less able to adapt to
climate change. It decreases GDP growth, increases the deficit and the external debt of
countries often already weakened economically. Moreover, their low income levels and their
underdeveloped financial markets make for unattainable insurances and credits to cover them
5 In SSA, on 80 million people suffering of starvation due to environmental factors, 7 million migrated to obtain food (Myers, 2005). The increasing in temperature of 2°C involve an increasing in population affected by malaria in Africa of 40-80 million people (70-80 million people affected with an increasing of 3°C-4°C). By 2020, between 75 and 250 million of African people will be exposed to water stress caused by climate change (Stern, 2007).
6
in case of climatic shocks, which increase their vulnerability at individual and national levels.
Climate change is, then, a constraint to the achievement of the Millennium Development
goals and to sustainable development in general (Stern, 2007). Many developing countries
are experiencing an increase in the frequency and costs of natural disasters which are
estimated on average at 5% of their GDP between 1997 and 2001 (IMF, 2003). In India and
South East Asia the reduction in GDP due to climate change is estimated at between 9 and
13% by 2100 compared with a situation without climate change. The cost of adaptation for
these countries will be at least between 5% and 10% of GDP and will weigh on government
budgets, all the more so since less than 1% of losses from natural disasters were insured in
low-income countries from 1985 to 1999. The frequency of climate events does not give time
to rebuild or reconstitute their patrimony, keeping them in a poverty trap. There is a
crowding-out effect because the poorest are obliged to reallocate their resources to deal with
the consequences of climate change instead of investing in human capital expenditure such as
children’s education or other productive investments. Immediate and strong reactions are
then necessary for these specific countries to limit the serious impact of climate change on
them. They suffer a “double penalty” because, in the current context, less-developed
countries may be trapped in a vicious circle: their poverty makes them more vulnerable in the
face of climate change and due to their poverty, climate change will have serious
consequences on health, income and growth prospects and will trigger their poverty and
vulnerability. In spite of this situation described previously, climate change is unfortunately
considered as a long-term problem and future impacts of climate change do not have priority.
Concerning this point, Ikeme (2003) analyzes the low capacity adaptation of Sub-Saharan
Africa (SSA) countries to cope with climate change effects. Indeed, low adaptive capacity
increases vulnerability, social and economic costs which affect human capital and the
development levels of these areas, which constitute transmission channels for migration. For
these countries, adaptation does not appear to be urgent issue and is underestimated by these
most vulnerable countries. Indeed, even if adaptation is globally recognized as a means to
preventing and coping with the impacts of climate change, there is a relative indifference and
insufficient measures in order to reinforce the capacity of adaptation. Indeed, they are often
in a difficult context with problems such as poverty, institutional weakness, low levels of
education and skills or an inexistence of welfare systems; they are then obliged to act in
emergency in case of climate effects (Washington and al., 2006). Moreover, developing
countries, particularly in SSA, consider the developed countries to be the major cause of
climate change, and wish to let them take the responsibility to manage them.
7
2.2 How Climate change and natural disasters can affect migration?
Migration is considered as a possible adaptive response to risks associated with
climate change (Mcleman and Smit, 2006). Using Northern Ethiopia as an example, Meze-
Hausken (2000) shows how climate change triggers migration in dryland areas of less
developed countries. The impact of drought on migration depends on the intensity of the
change, the vulnerability of the individual who suffers the change and the availability of
survival strategies. The intensity of the climate change includes damage caused by the
combination of natural, socio-economic, technological and perceived conditions. The
vulnerability means an individual’s risk of exposure to the severe consequences of climatic
disaster and the incapacity to cope with its consequences. Survival strategies are actions
taken to avert and to manage the climatic disaster after the event. At the beginning of a
drought, not all people are equally vulnerable in the face of the climatic change. Families
with more survival strategies manage to resist migration longer than those with fewer survival
strategies. But there comes a time after which survival strategies are reduced for all members
of society at which point all people are affected in similar ways and are obliged to migrate.
Migration is a solution to the failure of different survival strategies. Nevertheless it is
important to recognize that, in regions already with a high level of poverty and difficult living
conditions, climatic change is a triggering factor of migration.
Notwithstanding this, views differ on whether migration could be considered as
adaptation. Some characterize migration as a failure of, rather than as a form of, adaptation.
Some operational organizations and academics point out the role that migration may play in
helping home communities to adapt themselves, using the resources from migrant remittances
(IOM, 2007; Barnett and Jones, 2002). Others express the view that migration is a
maladaptive response because the migration may trigger an increased risk for those who move
and also possibly for areas towards which migrants move (Oliver-Smith, 2009). Socially
some factors including governance help determine whether people, threatened by rapid or
slow onset environmental change, can remain in their homes or return once the threat has
passed. For instance, in the aftermath of Hurricane Katrina, out of the 1.5 million people
displaced, only one-third returned and governance played a large role in that instance,
8
underlining the need to understand how social and ecological factors interact and shape
human mobility in the face of global environmental change (Warner, 2009).
According to Naudé (2008), climate change affects and can intensify migration
through three channels, namely scarcity of water and land, natural hazards, and conflicts over
natural resources. Indeed, migration towards new areas is often one of the main factors of
environmental conflicts (Baechler, 1999b; Swain, 1993; Swain, 1996). Climate change may
cause tensions and conflicts in communities receiving migrants (Adger and Barnett, 2007).
McGregor (1994), studying the link between environmental change, migration and food
security, shows that the displacement of a population due to climate change can induce
conflicts linked to the food security of the hosting areas. Food aid given to the refugees may
destabilize food prices and the local production of the host economy, which in turn can cause
malnutrition in refugee camps or weaken some regions already affected by food shortages.
In general, the main channel leading to conflict is the way that climate change affects
the livelihood of host populations by exerting pressure on local wages, by increasing
competition for job opportunities, resulting in ethnic tension, mistrust, and friction and by
affecting available resources, for instance by reducing access to land or to natural capital in
general through deforestation.
2.3 Some stylized facts
Many stylized facts illustrate the relationship between climate change, natural disasters
and migration. In Chinese ancient history, between 3550 and 2200 BC, during China’s
Bronze Age, the settled Zhou tribes experienced conflicts with the nomadic Rong and Di
tribes and were relocated five times. Historians attributed these migrations only to political
and military reasons whereas the movement of populations was also caused by climate
change. Those migrations were a means to protect agriculture by conserving resources in
order to economize food production threatened by drought (Huang and Su, 2008). The
climatic factor also influenced Polynesian migrations between 300 and 1400 (Bridgman,
1983).
Similarly in Asia in 1975, as a method of increasing self-reliance and to provide food
security to its population, India constructed the Farraka dam on the River Ganges permitting
large-scale irrigation of state land. But this project, by over-exploiting the river and diverting
most of the Ganges’ dry-season water, and without consulting Bangladesh which shares the
9
river, induced serious ecological and political consequences. The consequential
environmental degradation affected the living conditions of Bangladeshis through the
destabilization of their ecosystem, the destruction of their essential sources of livelihood such
as agriculture, industrial production and fishing. The environmental destruction caused by the
Indian dam firstly affected the rural ecosystem and then displaced the Bangladesh population
towards urban areas. But the low absorption capacity of Bangladesh cities made migration to
India the only viable alternative. Subsequently the environmentally-caused displacement of
the Bangladeshi migrants constituted a burden for Indian society, putting pressure on the
availability of food and the labor market. Since these migrants were Muslims yet the major
proportion of the receiving country was Hindu, problems were intensified by ethnic and
political issues. Tensions between migrants and natives of the host country resulted in
regional conflict which then spread to other parts of India (Swain, 1996). In Mali in the 1970s
and 1980s, drought caused the migration of Tuareg people towards other countries. When
they returned to Mali they were marginalized by the competition between nomad and settled
people, resulting in a rebellion in 1990 (Meier and Bond, 2007). The El Niño events between
the 1970s and 1990s caused extended droughts in Ethiopia. They were followed by famine
and political turmoil that resulted in radical changes of government, secession, and a massive
program of population redistribution. The consequences of government-imposed migration
policies, whose catalyst was climate change caused by repeated El Niño events, were certain
changes in the ethnic composition and the geographic pattern of population growth of certain
Ethiopian regions (Comenetz and Caviedes, 2002). Repeated droughts in the Senegal River
basin triggered a conflict between Senegal and Mauritania which started when the river began
to recede (Niasse, 2005). In 1996-1997 a severe drought induced a mass migration from
Kenya to Somalia and Ethiopia. Because of a lack of adaptation and efficient measures,
countries such as Madagascar, Zimbabwe and Kenya viewed their economies seriously
affected respectively by droughts in 1992, floods in 1998, and cyclones in 2000. Nigeria,
Senegal and Angola are all vulnerable to rises in sea level and flooding which affected
thousands of people (Ikeme, 2003; Benson and Clay, 1998; Ngecu and Mathu, 1999). In
2004, the tsunami in Indonesia displaced 500,000 people whereas Hurricane Katrina in 2005
had serious consequences on human displacement with tens of thousands of migrants in 26
states of the USA. Hurricane Mitch, like Katrina, had a devastating effect on the most
vulnerable people and increased male migration from Honduras to Nicaragua (Smith, 2007).
10
3. Empirical design
The empirical framework is developed in this section and, before presenting the data, the
three main specifications showing the different relationships between natural disasters and
migration are discussed.
3.1 Methodology
Firstly, the effect of natural disasters caused by climate change on net migration rates is estimated using the following specification:
(1)
Where migi,t and disasteri,t are respectively the migration and natural disaster variables
for the country i at the period t; Xk,i,t is the vector of control variables generally used in
migration estimations; µi represents the countries’ fixed effects and εi,t the error term. The
coefficient of natural disasters is expected to be positive.
Secondly, the analysis is specified by taking migration rates according to the education
levels. We are interested in this point because we assume that natural disasters caused by
climate change may affect the migration of people who are more educated or those who are
more skilled. Often they are those who get a job and a salary so they have the means to go
abroad, to be safe, and to provide an insurance for their family back in the affected country.
With respect to policy implications, they can induce a brain drain whose effects will be more
serious in this context where countries need large support for rebuilding and have a special
need for skilled workers. We assume that this effect is higher for the most highly educated.
So we have:
(2)
Where is the migration rate associated with each educational level j (j=
low, medium and high educational levels).
The two objectives already discussed are estimated by using country OLS fixed effects
estimator through an accurate econometric model. However, one may assume some
endogeneity issues caused by measurement errors of the variable of interest or by a potential
simultaneity bias between migration and natural disasters. But in our case we do not have
11
these problems because we eliminate the measurement errors by using the CRED data which
identifies the number of natural disasters each time such events arrive. Secondly, we assume
that migration at the period t cannot cause natural disasters at t or before t, but only in the
future. Since we estimate the effect of the number of natural disasters at the period t on the
migration rate at the same period, we do not have a double causality issue.
3.2 Data
The objective of this paper is to assess the effect of natural disasters caused by climate
change on global migration rates and on migration rates according to the level of education.
This relationship is investigated by using panel data with countries as unit observations. The
dependent variables are the net migration rates between 1950 and 2010 made available by the
United Nations Population Division and measured as the number of immigrants minus the
number of emigrants over the period, divided by the person-years lived by the population of
the receiving country over that period. It is expressed as the net number of migrants per 1,000
population. However, we choose to use the opposite of this measure (the difference between
the total number of emigrants minus the number of immigrants divided by the person-years
lived by the population of the receiving country over that period) to be in conformity with the
other migration indicators with regard to their sign: indeed, a higher level of these variables
indicates a higher level of migration.
We also use the Panel Data on International Migration of M. Schiff and M.C Sjöblom
(2008) (World Bank Databases), which measures international migration from 1975 to 2000
of the six main destination countries: Australia, Canada, France, Germany, UK and USA.
They measure emigration rates through the stocks of migrants from sending countries to these
countries for three educational levels, namely low, medium and high, divided by the stock of
adults (+25) corresponding to the same educational level, in the country of origin plus the
stock of migrants of sending countries. We prefer this database to that produced by Docquier
and Marfouk (2006); the latter uses the same measure but for all OECD countries in 1990 and
2000, whereas the former has a larger temporal dimension and thus more observations.
For the climate change indicators representing the variables of interest, we use the
Centre for Research on the Epidemiology of Disaster (CRED) data (2010) from 1900 to 2010.
Firstly we use the total number of natural disasters in a country in a five year period.
Secondly we are interested in: meteorological disasters using a variable which considers the
number of events caused by storms; hydrological disasters using a variable which groups
12
together the number of events caused by floods and other wet mass movements; and drought,
wildfire and climatological disasters through a variable which measures the number of
disasters caused by extremely high temperatures. We are interested in these three measures
because they are the natural disasters which are mainly caused by climate change.
Other factors, such as the GDP per capita, the demographic pressure through variables
such as young population and population density, the availability of arable land, the quality of
the institutional situation in the country through political rights and civil war variables, can all
influence migration and constitute the controls (see Table B.1 and Table B.2 in Appendix B
for variables definition and sources, and summary statistics).
4. Results
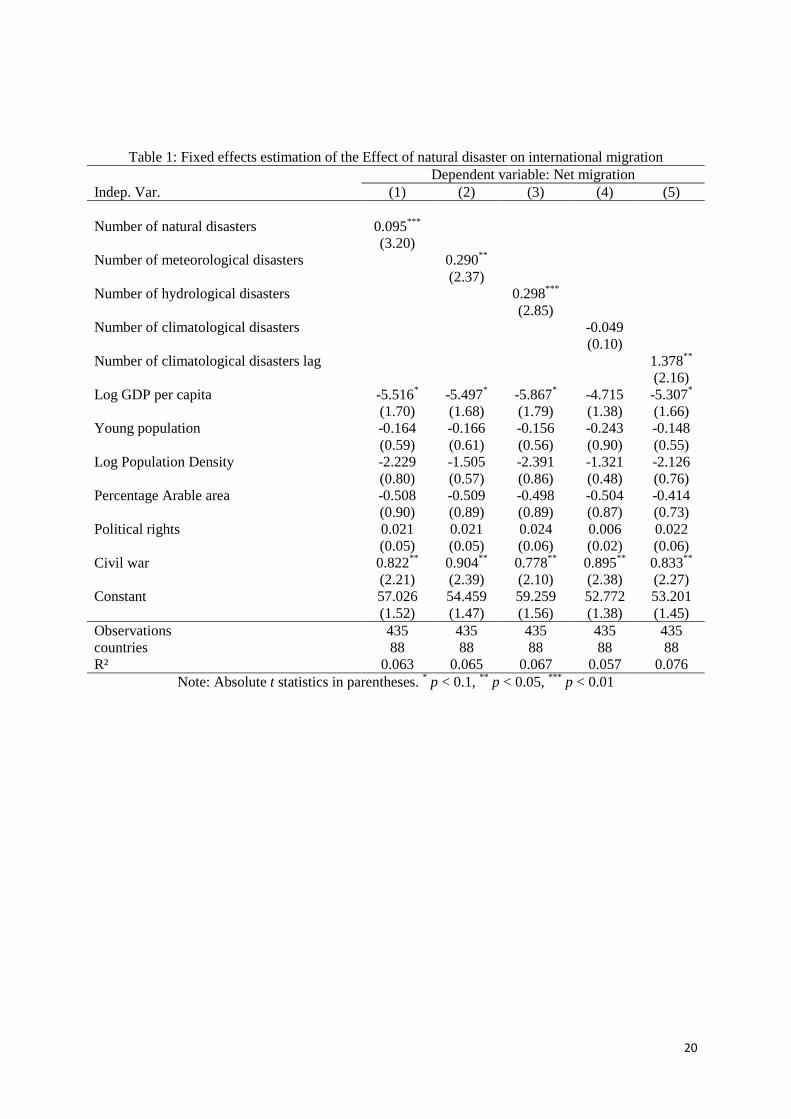
4.1 Natural disasters and net migration rates Estimations are made for poor and middle-to-lower income countries. Table 1 shows the
results of the effect of natural disasters on net migration rates. Natural disasters are captured
by four indicators expressed in logarithm: the total number of natural disasters (Column 1)
and its desegregated components, namely meteorological, hydrological and climatological
disasters (Column 2 to 4). The number of natural disasters has a significant positive impact
on net migration rates confirming previously documented results (Naudé, 2008; Reuveny and
Moore, 2009). This result is confirmed by the sub-components of natural disasters except for
the climatological variable which becomes significant with one period lag (column 5).
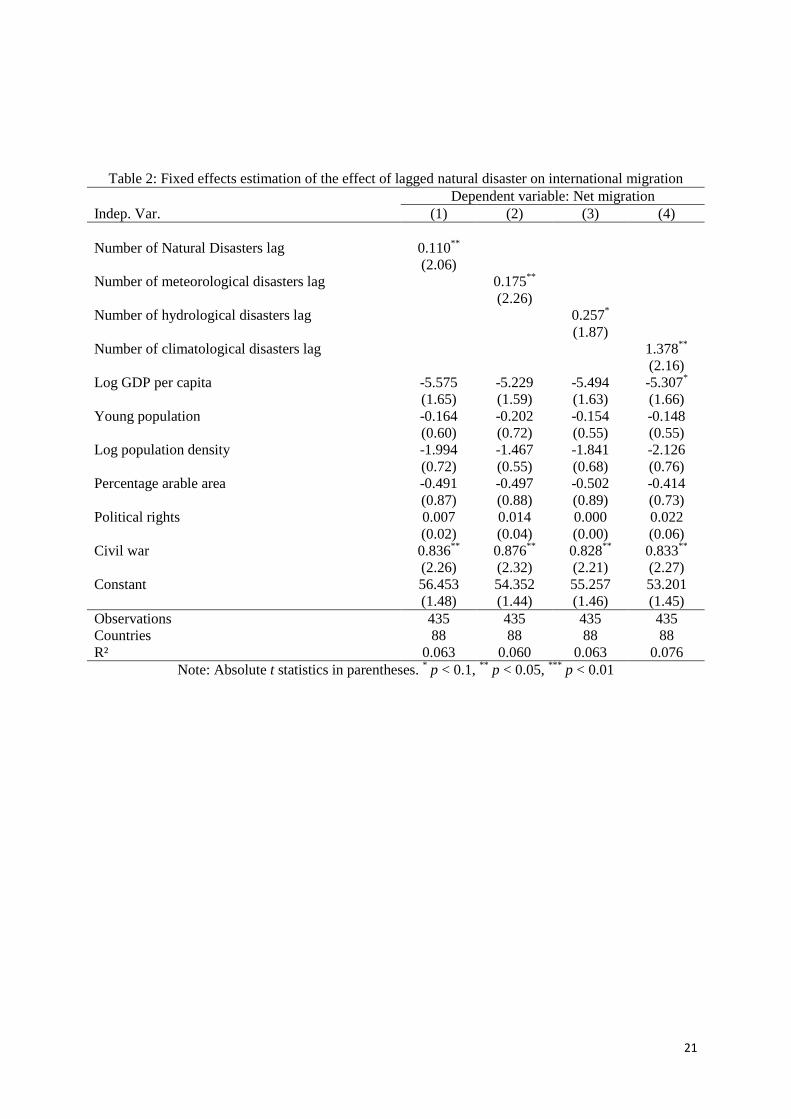
Moreover, if we introduce natural disasters and their disaggregated variables with one period
lag (Table 2), it appears that all these variables are significant and positive. In a word, natural
disasters have a contemporaneous and lagged effect except for climatological events. This is
due to the fact that for storms, included in meteorological disasters, or floods and wet mass
movements included in hydrological events, the mitigation and adaptation capabilities are less
available for these types of events than for extreme temperatures events or droughts which are
in the climatological category. Indeed, during short term hydrological events, people have
less choice to stay, whereas climatological events permit them time to prepare their migration
in the future.
13
4.2 The effect of the intensity of natural disasters on migration
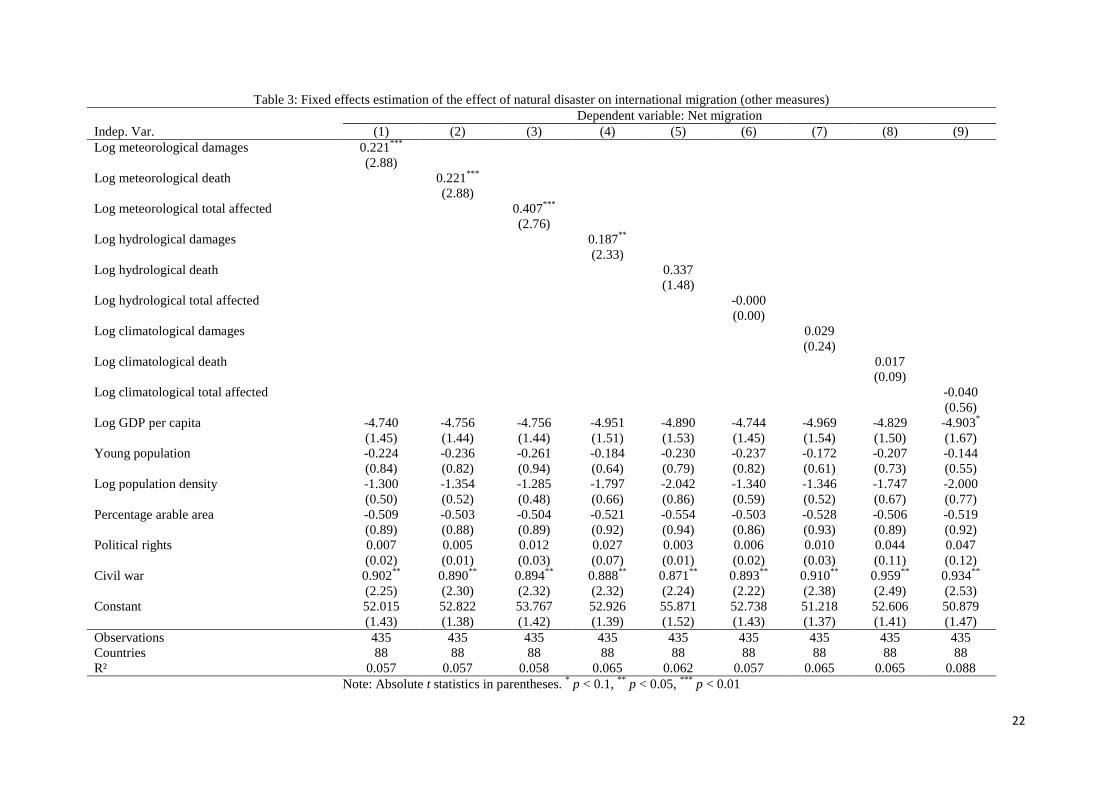
Even though the occurrence of natural disasters is a good measure, one could assume that
the intensity is more relevant in assessing the relationship between climate change and
migration. Thus, to check the robustness of the previous results, we make our estimations by
using, for each sub-group of natural disasters (meteorological, hydrological and
climatological variables), the costs representing total damages in US$; the number of deaths
and the number of people injured, made homeless and otherwise affected. Estimations in
Table 3 confirm the previous results in Table 1 except for the number of deaths and the
number of people affected by hydrological disasters which are not significant. Indeed, the
contemporaneous effect of the intensity variables of natural disasters on net migration exists
for meteorological events, but only the damage caused by hydrological events increase net
migration rates.
4.3 The effect of natural disasters on migration according to the education level
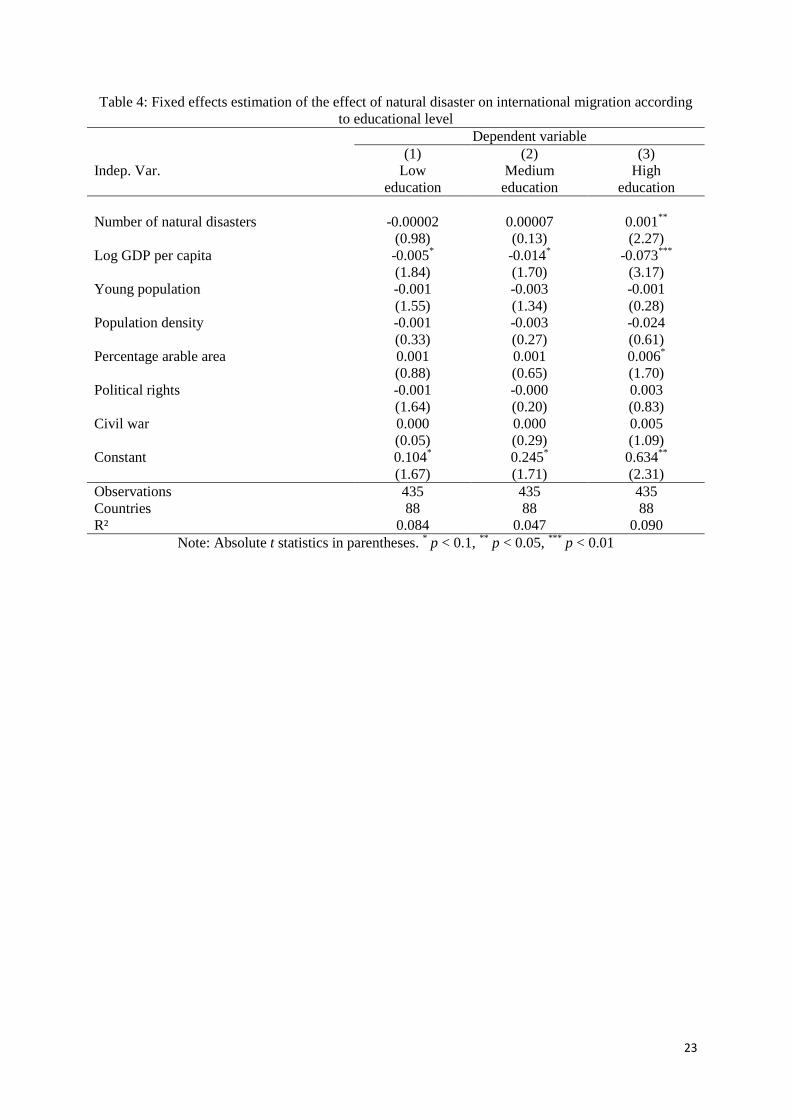
The effect of natural disasters on migration according to the educational level is
presented in Table 4. The dependent variables are emigration rates with respectively low,
medium and high educational levels. The interest variable remains the number of natural
disasters. Only those individuals with a high level of education migrate in the case of an
increased incidence in the number of natural disasters. It means that natural disasters due to
climate change heighten the brain drain phenomenon in developing countries just when they
need the most skilled and qualified people to deal with the damage caused by natural disaster.
4.4 Robustness check: the effect of natural disasters on highly educated migrants
according to geographical location
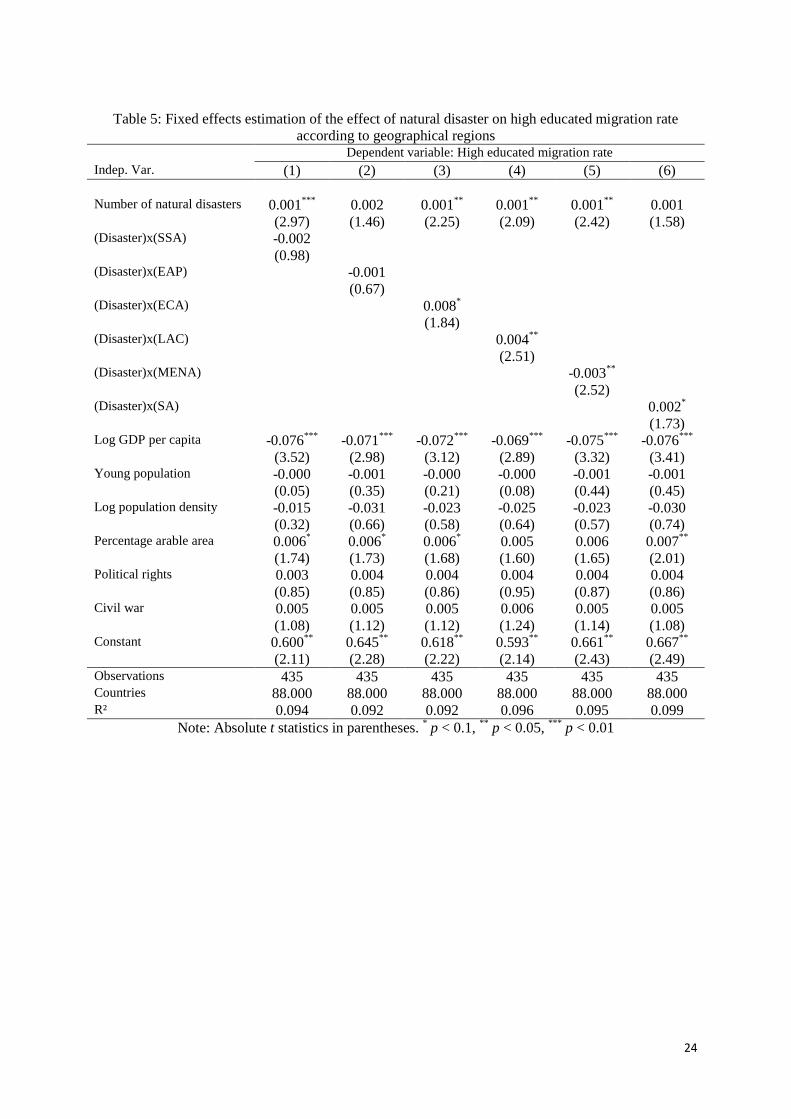
Even if natural disasters affect all countries, it is interesting to test if the behavior of
highly educated people in the face of migration depends on the geographical location of the
countries. The dependent variable is the migration of highly educated populations and the
variables of interest are the number of natural disasters and some interaction terms between
the number of natural disasters and geographical dummies6. We find in Table 5 some
differences in migration behavior in Europe and Central Asia (ECA), Latin America and
Caribbean (LAC), Middle East and North Africa (MENA) and South Asia (SA) regions. The
effect is positive for ECA, LAC and SA regions, where we observe increased migration rates 6 We do not run the estimations for each sub-region dummy because of their low sample size.
14
of highly skilled people caused by natural disasters. For ECA and LAC regions, the
explanation may be that the receiving countries will be more tolerant in accepting them on
account of their cultural and geographical proximity compared to other sending countries.
For South Asia, the reason for this result may be due to the high frequency of natural disasters
in this area and the low resilience of these countries. In these two cases, migrants will be
integrated more easily in the job market of the receiving countries if they are qualified.
Despite the geographical proximity with some receiving countries there is a negative
relationship between the variable MENA and the migration variable. However, if we observe
the coefficient of the variable numbers of natural disasters, it appears that the effect is almost
equal to 0. Therefore it is very unlikely that highly skilled people from the MENA region
migrate because of natural disasters.
5. Concluding Remarks and Implications
Climate change is one of the main challenges of the twenty-first century for all countries
in the world in general, and in particular for developing countries which are more sensitive to
its effects. This paper assesses the relationship between natural disasters caused by climate
change and migration by examining migration rates and levels of education. Results, from a
fixed effects estimator, show that natural disasters have a significant and positive effect on net
migration rates. But this effect is different according to the disaster type. Climatological
disasters have only a positive lagged effect of one period on migration, unlike the other types
of disaster which have a contemporaneous and lagged positive impact on migration. We also
find that the effect is not the same for the different educational levels. Natural disasters have
an effect only on the migration of people with a high level of education. Finally, we find
some differences in migration behavior between highly educated people in European Central
Asia, Latin America and Caribbean, Middle, East and North Africa and South Asia regions.
Natural disasters due to climate change raise equity issues for developing countries by
heightening the brain drain effect and by taking away qualifications and skills just when these
countries are at their most vulnerable. Developing countries have, of course, to make some
efforts, but developed countries must provide more support and increase their political will to
combat climate change and its damaging consequences above all in the poorest countries, for
it is the latter, rather than more affluent countries, which contribute the least towards climate
change and yet which suffer the greatest consequences.
15
References
Baechler, G. (1999b): Environmental degradation and violent conflict: hypotheses, research
agendas and theory building Ecology, In M. Suliman: Ecology, Politics and Violent Conflict,
Zed Books, London and New York (1999), 76–112.
Barnett, J. and Adger, W. N. (2007): “Climate change, human security and violent conflict”,
Political Geography, 26 (6), 639-655.
Barnett, J. and Jones, R. (2002): “Forced migration: the influence of environmental security”,
Global Change, 7 (4), 3.
Bates, D. (2002): “Environmental Refugees? Classifying Human Migrations Caused by
Environmental Change”, Population and Environment, 23 (5), 465-477.
Benson, C. and Clay, E. (1998): “The impact of drought on sub-Saharan Economies”, World
Bank Technical Paper No. 401, Technical report, Washington DC, World Bank.
Bridgman, H. (1983): “Could climatic change have had an influence on the polynesian
migrations?”, Palaeogeography, Palaeoclimatology, Palaeoecology, 41, 193-206.
Comenetz, J. and Caviedes, C. (2002): “Climate variability, political crises, and historical
population displacements in Ethiopia”, Environmental Hazards, 4, 113-127.
CRED (2010): EM-DAT. Centre for Research on the Epidemiology of Disasters, Brussels:
University of Louvain.
Docquier, F. and Marfouk, A. (2006): International Migration by Educational Attainment, In
C. Ozden and M. Schiff (eds). International Migration, Remittances and the Brain Drain,
Palgrave Macmillan: New York (2006).Dudley L. Poston, D.; Zhang, L.; Gotcher, D. and Gu,
Y. (2009): “The effect of climate on migration: United States, 1995–2000”, Social Science
Research, 38, 743–753.
16
Dyson, T. (2006): “On Development, Demography and Climate Change: The End of the
World as We Know it?”, Population and Environment, 27(2), 117-149.
El-Hinnawi, E. (1985): “Environmental Refugees”, Technical report, Nairobi, Kenya: United
Nations Environmental Programme.
Ghatak, S.; Levine, P. & Price, S. W. (1996), “Migration Theories and Evidence: an Assessment”, Journal of Economic Surveys 10(2), 159-198.
Gleditsch et al. (2002), Uppsala Conflict Data Program (UCDP)/Centre for the Study of Civil
Wars, International Peace Research Institute, Oslo (PRIO) Armed Conflict Dataset Codebook.
Harris, J. R. and Todaro, M. P. (1970): “Migration, Unemployment and Development: A
Two-Sector Analysis”, The American Economic Review, 60(1), 126-142.
Huang, C. and Su, H. (2009): “Climate change and Zhou relocations in early Chinese
history”, Journal of Historical Geography, 35, 297–310.
Hunter, L. (2005): “Migration and Environmental Hazards”, Population and Environment, 26
(4), 273-302.
Hunter, L.; White, M. and Sutton, J. (2003), “Environmental Hazards, Migration, and Race”,
Population and Environment, 25 (1), 23-39.
Ikeme, J. (2003): “Climate Change Adaptational Deficiencies in Developing Countries: the
Case of Sub-Saharan Africa”, Mitigation and Adaptation Strategies for Global Change, 8(1),
29-52.
IMF (2003): “Fund assistance for countries facing exogeneous shocks”, prepared by the
Policy Development and Review Departement (In consultation with the Area, Finance and
Fiscal Affairs Departements) International Monetary Fund, Technical report, Washington,DC,
IMF.
17
IOM (2007): “Migration and the Environment”, IOM (International Organization for
Migration), Technical report, International Organization for Migration, Geneva.
IPCC (2007): Fourth Assessment Report: Climate Change 2007: The AR4 Synthesis Report,
Geneva: IPCC.
Khasnis, A. and Nettleman, M. (2005): “Global Warming and Infectious Disease”, Archives
of Medical Research, 36, 689–696.
Marchiori, L. and Schumacher, I. (2011): “When nature rebels: international migration,
climate change, and inequality”, Journal of Population Economics, 24, 569-600.
McGregor, J. (1994): “Climate change and involuntary migration: implications for food
security”, Food Policy, 19 (2), 120-132.
Mcleman, R. and Smit, B. (2006): “Migration as an adaptation to Climate Change”, Climatic
Change, 76, 31–53.
Meehl, G. A.; Washington, W. M.; Santer, B. D.; Collins, W. D.; Arblaster, J. M.; Hu, A.;
Lawrence, D. M.; Teng, H.; Buja, L. E. and Strand, W. G. (2006): “Climate Change
Projections for the Twenty-First Century and Climate Change Commitment in the CCSM3”,
Journal of Climate, 19, 2597-2616.
Meier, P., D. Bond. 2007. “The Influence of Environmental Factors on Conflict in the Horn of
Africa,” Journal of Political Geography (in press).
Meze-Hausken, E. (2000): “Migration caused by climate change: how vulnerable are people
in dryland areas?”, Mitigation and Adaptation Strategies for Global Change, 5, 379–406.
Mortreux, C. & Barnett, J. (2009): “Climate change, migration and adaptation in Funafuti,
Tuvalu”, Global Environmental Change, 19, 105–112.
Myers, N. (2005): “Environmental Refugees, an emergent security issue”, Paper presented to
the 13th Economic Forum, Prague, Czech Republic, 23-27 May 2005
18
Naude, W. (2008): “Conflict, Disasters, and No Jobs: Reasons for International Migration
from Sub-Saharan Africa”, Working paper RP2008/85, World Institute for Development
Economic Research (UNU-WIDER).
Ngecu, W. and Mathu, E. (1999): “The El Nino-triggered landslides and their socioeconomic
impact on Kenya”, Environmental Geology, 38 (4), 277–284.
Niasse, M. (June 2005): “Climate-Induced Water Conflict Risks in West Africa: Recognizing
and Coping with Increasing Climate Impacts on Shared Watercourses”, paper presented to the
International Workshop on Human Security and Climate Change, Asker, Oslo.
Oliver-Smith, A. (2009): Sea level rise and the vulnerability of coastal peoples: responding to
the local challenges of global climate change in the 21st century, InterSections No. 7, United
Nations University Institute for Environment and Human Security, Bonn.
Perch-Nielsen, S.; Bättig, M. and Imboden, D. (2008): “Exploring the link between climate
change and migration”, Climatic Change, 91, 375–393.
Rehdanz, K. and Maddison, D. (2005): “Climate and happiness”, Ecological Economics,
52(1), 111-125.
Reuveny, R. (2007): “Climate change-induced migration and violent conflict”, Political
Geography, 26, 656-673.
Reuveny, R. and Moore, W. H. (2009): “Does Environmental Degradation Influence
Migration? Emigration to Developed Countries in the Late 1980s and 1990s”, Social Science
Quarterly, 90(3), 461-479.
Schrag, S. and Wiener, P. (1995): “Emerging infectious disease: what are the relative roles of
ecology and evolution?”, Trends in Ecology & Evolution, 10 (8).
Schiff, M. and Sjöblom, M. (2008): Panel Data on International Migration 1975-2000, World
Bank databases.
19
Smith, P. (2007): Climate Change, Mass Migration and the Military Response, Foreign Policy
Research Institute.
Stark, O. (1991): “The Migration of Labor”, London: Basil Blackwell.
Stark, O. and Levhari, D. (1982): “On Migration and Risk in LDCs”, Economic Development
and Cultural Change, 31(1), 191-96.
Stark, O. and Lucas, R. E. B. (1988): “Migration, Remittances, and the Family”, Economic
Development and Cultural Change, 36(3), pp. 465-481.
Stern, N. (2007): “The Economics of Climate Change”: The Stern Review, Cambridge
University Press.
Swain, A. (Dec.1993): “Conflicts over Water: The Ganges Water Dispute”, Security Dialogue
(Oslo), 24(4), 429-439.
Swain, A. (Dec.1996): “Environmental Migration and Conflict Dynamics: Focus on
Developing Regions”, Third World Quarterly, 17 (5), 959-973.
Swain, A. (May. 1996): “Displacing the Conflict: Environmental Destruction in Bangladesh
and Ethnic Conflict in India”, Journal of Peace Research, 33 (2), 189-204.
United Nations Population Division (2009): International Migration flows to and from
selected countries: the 2008 revision.
Warner, K. (2010): “Global environmental change and migration: Governance challenges”,
Global Environmental Change, 20 (3), 402-413.
Washington, R.; Harrison, M.; Conway, D.; Black, E.; Challinor, A.; Grimes, D.; Jones, R.;
Morse, A.; Kay, G. and Todd, M. (2006): “African Climate change: taking the shorter Route”,
Bulletin of the American Meteorological Society, 87, 10, 1355-1366.
20
Table 1: Fixed effects estimation of the Effect of natural disaster on international migration Dependent variable: Net migration Indep. Var. (1) (2) (3) (4) (5) Number of natural disasters 0.095*** (3.20) Number of meteorological disasters 0.290** (2.37) Number of hydrological disasters 0.298*** (2.85) Number of climatological disasters -0.049 (0.10) Number of climatological disasters lag 1.378** (2.16) Log GDP per capita -5.516* -5.497* -5.867* -4.715 -5.307* (1.70) (1.68) (1.79) (1.38) (1.66) Young population -0.164 -0.166 -0.156 -0.243 -0.148 (0.59) (0.61) (0.56) (0.90) (0.55) Log Population Density -2.229 -1.505 -2.391 -1.321 -2.126 (0.80) (0.57) (0.86) (0.48) (0.76) Percentage Arable area -0.508 -0.509 -0.498 -0.504 -0.414 (0.90) (0.89) (0.89) (0.87) (0.73) Political rights 0.021 0.021 0.024 0.006 0.022 (0.05) (0.05) (0.06) (0.02) (0.06) Civil war 0.822** 0.904** 0.778** 0.895** 0.833** (2.21) (2.39) (2.10) (2.38) (2.27) Constant 57.026 54.459 59.259 52.772 53.201 (1.52) (1.47) (1.56) (1.38) (1.45) Observations 435 435 435 435 435 countries 88 88 88 88 88 R² 0.063 0.065 0.067 0.057 0.076
Note: Absolute t statistics in parentheses. * p < 0.1, ** p < 0.05, *** p < 0.01
21
Table 2: Fixed effects estimation of the effect of lagged natural disaster on international migration Dependent variable: Net migration Indep. Var. (1) (2) (3) (4) Number of Natural Disasters lag 0.110** (2.06) Number of meteorological disasters lag 0.175** (2.26) Number of hydrological disasters lag 0.257* (1.87) Number of climatological disasters lag 1.378** (2.16) Log GDP per capita -5.575 -5.229 -5.494 -5.307* (1.65) (1.59) (1.63) (1.66) Young population -0.164 -0.202 -0.154 -0.148 (0.60) (0.72) (0.55) (0.55) Log population density -1.994 -1.467 -1.841 -2.126 (0.72) (0.55) (0.68) (0.76) Percentage arable area -0.491 -0.497 -0.502 -0.414 (0.87) (0.88) (0.89) (0.73) Political rights 0.007 0.014 0.000 0.022 (0.02) (0.04) (0.00) (0.06) Civil war 0.836** 0.876** 0.828** 0.833** (2.26) (2.32) (2.21) (2.27) Constant 56.453 54.352 55.257 53.201 (1.48) (1.44) (1.46) (1.45) Observations 435 435 435 435 Countries 88 88 88 88 R² 0.063 0.060 0.063 0.076
Note: Absolute t statistics in parentheses. * p < 0.1, ** p < 0.05, *** p < 0.01
22
Table 3: Fixed effects estimation of the effect of natural disaster on international migration (other measures) Dependent variable: Net migration Indep. Var. (1) (2) (3) (4) (5) (6) (7) (8) (9) Log meteorological damages 0.221*** (2.88) Log meteorological death 0.221*** (2.88) Log meteorological total affected 0.407*** (2.76) Log hydrological damages 0.187** (2.33) Log hydrological death 0.337 (1.48) Log hydrological total affected -0.000 (0.00) Log climatological damages 0.029 (0.24) Log climatological death 0.017 (0.09) Log climatological total affected -0.040 (0.56) Log GDP per capita -4.740 -4.756 -4.756 -4.951 -4.890 -4.744 -4.969 -4.829 -4.903* (1.45) (1.44) (1.44) (1.51) (1.53) (1.45) (1.54) (1.50) (1.67) Young population -0.224 -0.236 -0.261 -0.184 -0.230 -0.237 -0.172 -0.207 -0.144 (0.84) (0.82) (0.94) (0.64) (0.79) (0.82) (0.61) (0.73) (0.55) Log population density -1.300 -1.354 -1.285 -1.797 -2.042 -1.340 -1.346 -1.747 -2.000 (0.50) (0.52) (0.48) (0.66) (0.86) (0.59) (0.52) (0.67) (0.77) Percentage arable area -0.509 -0.503 -0.504 -0.521 -0.554 -0.503 -0.528 -0.506 -0.519 (0.89) (0.88) (0.89) (0.92) (0.94) (0.86) (0.93) (0.89) (0.92) Political rights 0.007 0.005 0.012 0.027 0.003 0.006 0.010 0.044 0.047 (0.02) (0.01) (0.03) (0.07) (0.01) (0.02) (0.03) (0.11) (0.12) Civil war 0.902** 0.890** 0.894** 0.888** 0.871** 0.893** 0.910** 0.959** 0.934** (2.25) (2.30) (2.32) (2.32) (2.24) (2.22) (2.38) (2.49) (2.53) Constant 52.015 52.822 53.767 52.926 55.871 52.738 51.218 52.606 50.879 (1.43) (1.38) (1.42) (1.39) (1.52) (1.43) (1.37) (1.41) (1.47) Observations 435 435 435 435 435 435 435 435 435 Countries 88 88 88 88 88 88 88 88 88 R² 0.057 0.057 0.058 0.065 0.062 0.057 0.065 0.065 0.088
Note: Absolute t statistics in parentheses. * p < 0.1, ** p < 0.05, *** p < 0.01
23
Table 4: Fixed effects estimation of the effect of natural disaster on international migration according to educational level
Dependent variable (1) (2) (3) Indep. Var. Low
education Medium education
High education
Number of natural disasters -0.00002 0.00007 0.001** (0.98) (0.13) (2.27) Log GDP per capita -0.005* -0.014* -0.073*** (1.84) (1.70) (3.17) Young population -0.001 -0.003 -0.001 (1.55) (1.34) (0.28) Population density -0.001 -0.003 -0.024 (0.33) (0.27) (0.61) Percentage arable area 0.001 0.001 0.006* (0.88) (0.65) (1.70) Political rights -0.001 -0.000 0.003 (1.64) (0.20) (0.83) Civil war 0.000 0.000 0.005 (0.05) (0.29) (1.09) Constant 0.104* 0.245* 0.634** (1.67) (1.71) (2.31) Observations 435 435 435 Countries 88 88 88 R² 0.084 0.047 0.090
Note: Absolute t statistics in parentheses. * p < 0.1, ** p < 0.05, *** p < 0.01
24
Table 5: Fixed effects estimation of the effect of natural disaster on high educated migration rate
according to geographical regions Dependent variable: High educated migration rate Indep. Var. (1) (2) (3) (4) (5) (6) Number of natural disasters 0.001*** 0.002 0.001** 0.001** 0.001** 0.001 (2.97) (1.46) (2.25) (2.09) (2.42) (1.58) (Disaster)x(SSA) -0.002 (0.98) (Disaster)x(EAP) -0.001 (0.67) (Disaster)x(ECA) 0.008* (1.84) (Disaster)x(LAC) 0.004** (2.51) (Disaster)x(MENA) -0.003** (2.52) (Disaster)x(SA) 0.002* (1.73) Log GDP per capita -0.076*** -0.071*** -0.072*** -0.069*** -0.075*** -0.076*** (3.52) (2.98) (3.12) (2.89) (3.32) (3.41) Young population -0.000 -0.001 -0.000 -0.000 -0.001 -0.001 (0.05) (0.35) (0.21) (0.08) (0.44) (0.45) Log population density -0.015 -0.031 -0.023 -0.025 -0.023 -0.030 (0.32) (0.66) (0.58) (0.64) (0.57) (0.74) Percentage arable area 0.006* 0.006* 0.006* 0.005 0.006 0.007** (1.74) (1.73) (1.68) (1.60) (1.65) (2.01) Political rights 0.003 0.004 0.004 0.004 0.004 0.004 (0.85) (0.85) (0.86) (0.95) (0.87) (0.86) Civil war 0.005 0.005 0.005 0.006 0.005 0.005 (1.08) (1.12) (1.12) (1.24) (1.14) (1.08) Constant 0.600** 0.645** 0.618** 0.593** 0.661** 0.667** (2.11) (2.28) (2.22) (2.14) (2.43) (2.49) Observations 435 435 435 435 435 435 Countries 88.000 88.000 88.000 88.000 88.000 88.000 R² 0.094 0.092 0.092 0.096 0.095 0.099
Note: Absolute t statistics in parentheses. * p < 0.1, ** p < 0.05, *** p < 0.01
25
Appendix A: Definitions
A.1 Intergovernmental Panel on Climate Change (IPCC, 2007)) definition
“ Climate change in IPCC usage refers to a change in the state of the climate that can be
identified (e.g. using statistical tests) by changes in the mean and/or the variability of its
properties, and that persists for an extended period, typically decades or longer. It refers to
any change in climate over time, whether due to natural variability or as a result of human
activity. This usage differs from that in the United Nations Framework Convention on Climate
Change (UNFCCC), where climate change refers to a change of climate that is attributed
directly or indirectly to human activity that alters the composition of the global atmosphere
and that is in addition to natural climate variability observed over comparable time periods”.
A.2 Definitions of environmental migrants/ refugees
El Hinnawi (1985): Environmental migrants are “people who have been forced to
leave their traditional habitat, temporarily or permanently, because of a marked
environmental disruption that jeopardized their existence or seriously affected the quality of
their life”.
Bates (2002) criticizes the definition and classification of environmental migration of
El-Hinnawi in the UNEP 1985 report. For Bates this definition does not provide generic
criteria distinguishing environmental refugees from other types of migrants and not specify
differences between types of environmental refugees. It makes no distinction between
refugees who flee volcanic eruptions and those who gradually leave their homes as soil
quality declines. For Bates “a working definition of environmental refugees includes people
who migrate from their usual residence due to changes in their ambient non-human
environment”. This definition remains necessarily vague in order to incorporate the two most
important features of environmental refugees: the transformation of the environment to one
less suitable for human occupation and the acknowledgment that this causes migration. The
author establishes a classification of environmental refugees according to the causes of
migration. One distinguishes three categories of human migration due to environmental
change: (i) Environmental refugees due to disasters caused by natural or technological events.
Those people are short-term refugees in geographically limited areas. Natural disasters,
which include hurricanes, floods, tornadoes, earthquakes or events that made a place
inhabitable temporarily or permanently are considered, alongside technological disasters
26
resulting from human choices, as unintentional migration. (ii) Environmental refugees due to
expropriation of the environment are people who leave their habitat permanently to allow land
use. The expropriation of the environment can be due on one hand to economic development
such as the construction of hydroelectric dams or roads and, on the other hand, to warfare and
the destruction of the environment, strategically displacing the population during war
incorporating, for instance, land mines. (iii) Environmental refugees due to the deterioration
of the environment: the migration of these people is caused by the anthropogenic degradation
of their environment: one talks about environmental migrants. The effect of environmental
degradation ripples through the local economy context to affect migration. While disasters
and expropriation refugees do not possess any real means to control environmental change,
environmental migrants can decide the strategies to cope with environmental change.
27
Appendix B: Tables
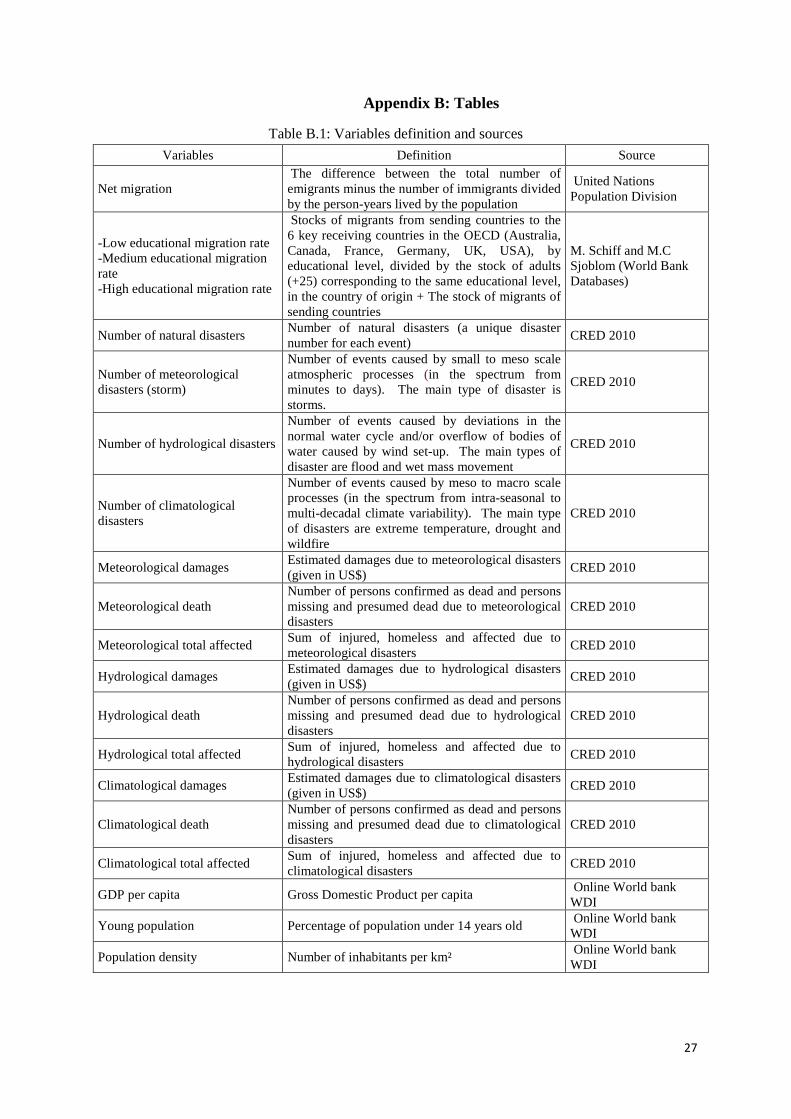
Table B.1: Variables definition and sources
Variables Definition Source
Net migration The difference between the total number of emigrants minus the number of immigrants divided by the person-years lived by the population
United Nations Population Division
-Low educational migration rate -Medium educational migration rate -High educational migration rate
Stocks of migrants from sending countries to the 6 key receiving countries in the OECD (Australia, Canada, France, Germany, UK, USA), by educational level, divided by the stock of adults (+25) corresponding to the same educational level, in the country of origin + The stock of migrants of sending countries
M. Schiff and M.C Sjoblom (World Bank Databases)
Number of natural disasters Number of natural disasters (a unique disaster number for each event)
CRED 2010
Number of meteorological disasters (storm)
Number of events caused by small to meso scale atmospheric processes (in the spectrum from minutes to days). The main type of disaster is storms.
CRED 2010
Number of hydrological disasters
Number of events caused by deviations in the normal water cycle and/or overflow of bodies of water caused by wind set-up. The main types of disaster are flood and wet mass movement
CRED 2010
Number of climatological disasters
Number of events caused by meso to macro scale processes (in the spectrum from intra-seasonal to multi-decadal climate variability). The main type of disasters are extreme temperature, drought and wildfire
CRED 2010
Meteorological damages Estimated damages due to meteorological disasters (given in US$)
CRED 2010
Meteorological death Number of persons confirmed as dead and persons missing and presumed dead due to meteorological disasters
CRED 2010
Meteorological total affected Sum of injured, homeless and affected due to meteorological disasters
CRED 2010
Hydrological damages Estimated damages due to hydrological disasters (given in US$)
CRED 2010
Hydrological death Number of persons confirmed as dead and persons missing and presumed dead due to hydrological disasters
CRED 2010
Hydrological total affected Sum of injured, homeless and affected due to hydrological disasters
CRED 2010
Climatological damages Estimated damages due to climatological disasters (given in US$)
CRED 2010
Climatological death Number of persons confirmed as dead and persons missing and presumed dead due to climatological disasters
CRED 2010
Climatological total affected Sum of injured, homeless and affected due to climatological disasters
CRED 2010
GDP per capita Gross Domestic Product per capita Online World bank WDI
Young population Percentage of population under 14 years old Online World bank WDI
Population density Number of inhabitants per km² Online World bank WDI

28
Table B.1 continued
Variables Definition Source
Percentage arable area Arable area as percentage of total land area Online World bank WDI
Political rights Political Rights are measured on a one-to-seven scale, with one representing the highest degree of Freedom and seven the lowest.
Freedom House
Civil war Dummy variable taking the value 1 for a minimum of 25 battle-related deaths per year and 0 otherwise.
UCDP/PRIO Armed Conflict Dataset
29
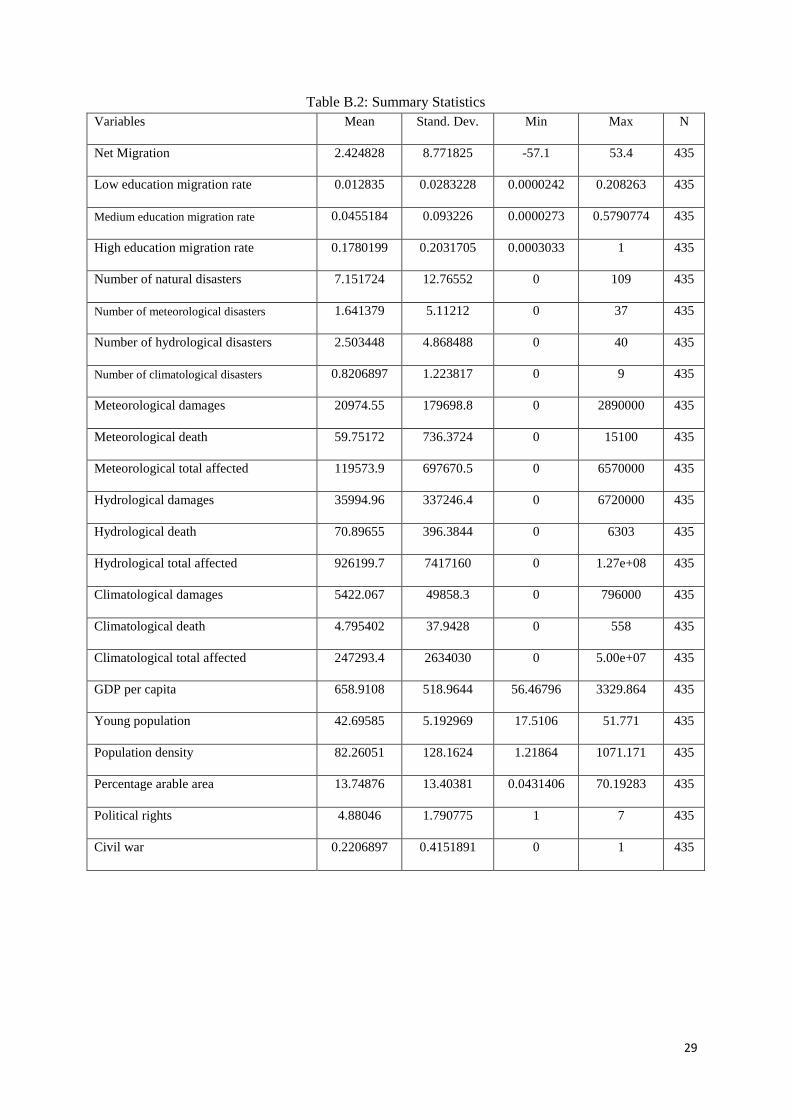
Table B.2: Summary Statistics Variables Mean Stand. Dev. Min Max N
Net Migration 2.424828 8.771825 -57.1 53.4 435
Low education migration rate 0.012835 0.0283228 0.0000242 0.208263 435
Medium education migration rate 0.0455184 0.093226 0.0000273 0.5790774 435
High education migration rate 0.1780199 0.2031705 0.0003033 1 435
Number of natural disasters 7.151724 12.76552 0 109 435
Number of meteorological disasters 1.641379 5.11212 0 37 435
Number of hydrological disasters 2.503448 4.868488 0 40 435
Number of climatological disasters 0.8206897 1.223817 0 9 435
Meteorological damages 20974.55 179698.8 0 2890000 435
Meteorological death 59.75172 736.3724 0 15100 435
Meteorological total affected 119573.9 697670.5 0 6570000 435
Hydrological damages 35994.96 337246.4 0 6720000 435
Hydrological death 70.89655 396.3844 0 6303 435
Hydrological total affected 926199.7 7417160 0 1.27e+08 435
Climatological damages 5422.067 49858.3 0 796000 435
Climatological death 4.795402 37.9428 0 558 435
Climatological total affected 247293.4 2634030 0 5.00e+07 435
GDP per capita 658.9108 518.9644 56.46796 3329.864 435
Young population 42.69585 5.192969 17.5106 51.771 435
Population density 82.26051 128.1624 1.21864 1071.171 435
Percentage arable area 13.74876 13.40381 0.0431406 70.19283 435
Political rights 4.88046 1.790775 1 7 435
Civil war 0.2206897 0.4151891 0 1 435
30
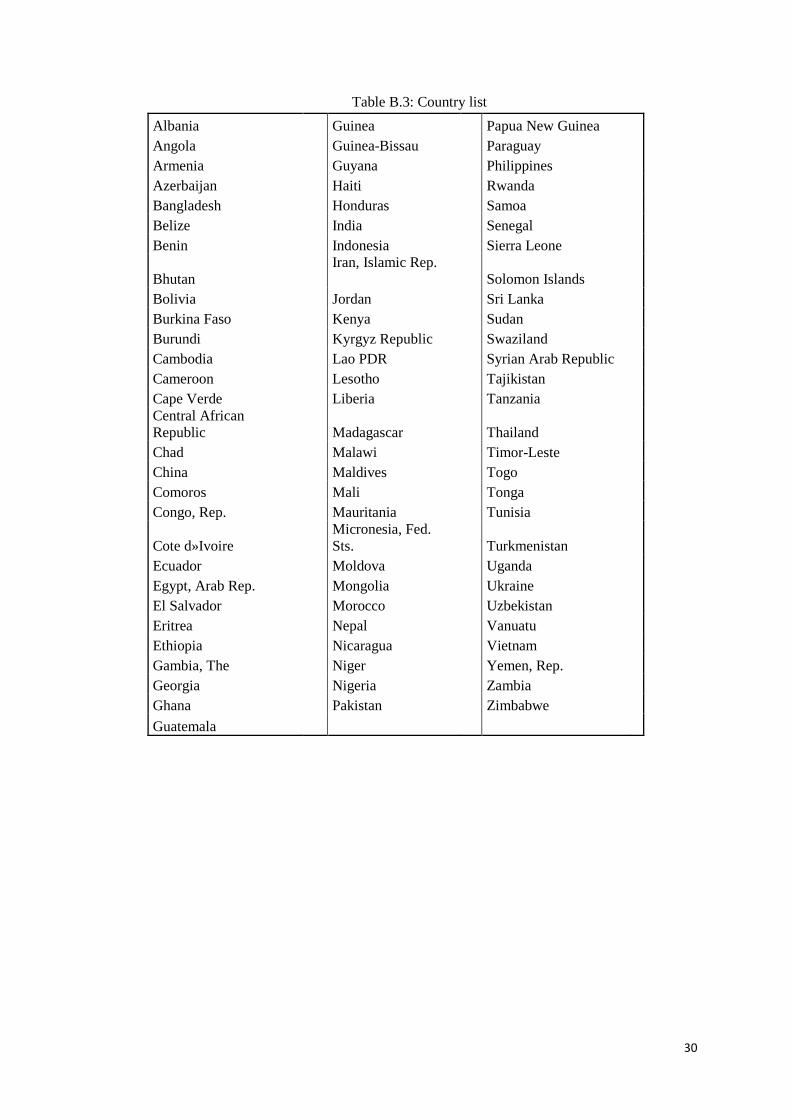
Table B.3: Country list
Albania Guinea Papua New Guinea Angola Guinea-Bissau Paraguay Armenia Guyana Philippines Azerbaijan Haiti Rwanda Bangladesh Honduras Samoa Belize India Senegal Benin Indonesia Sierra Leone
Bhutan Iran, Islamic Rep. Solomon Islands
Bolivia Jordan Sri Lanka Burkina Faso Kenya Sudan Burundi Kyrgyz Republic Swaziland Cambodia Lao PDR Syrian Arab Republic Cameroon Lesotho Tajikistan Cape Verde Liberia Tanzania Central African Republic Madagascar Thailand Chad Malawi Timor-Leste China Maldives Togo Comoros Mali Tonga Congo, Rep. Mauritania Tunisia
Cote d»Ivoire Micronesia, Fed. Sts. Turkmenistan
Ecuador Moldova Uganda Egypt, Arab Rep. Mongolia Ukraine El Salvador Morocco Uzbekistan Eritrea Nepal Vanuatu Ethiopia Nicaragua Vietnam Gambia, The Niger Yemen, Rep. Georgia Nigeria Zambia Ghana Pakistan Zimbabwe
Guatemala
Recommended


![Climate Change & Disasters. Climate Change and Disasters “The report [Impacts, Adaptation & Vulnerability, IPCC 2007] confirms our worst fears – vulnerable](https://img.pdfslide.net/doc/110x75/56649e6b5503460f94b69049/climate-change-disasters-climate-change-and-disasters-the-report-impacts.jpg)