Com Hem
Stockholm, November 4, 2014
Q3 2014 Results
Disclosure Regarding Forward-Looking Statements
This presentation includes forward-looking statements. Forward-looking statements can be identified by the use of forward-
looking terminology, including words such as “believes,” “estimates,” “anticipates,” “expects,” “intends,” “may,” “will”, “could” or
“should” or, in each case, their negative or other variations thereof or comparable terminology. These forward-looking statements
include all matters that are not historical facts. They appear in a number of places throughout this presentation and include
statements regarding, or based upon, our Management’s current intentions, beliefs or expectations concerning, among other
things, our future results of operations, financial condition, liquidity, prospects, growth, strategies, potential acquisitions, or
developments in the industry in which we operate.
Forward-looking statements are based upon assumptions and estimates about future events or circumstances, and are subject to
risks and uncertainties. Although we believe that the expectations reflected in these forward-looking statements are reasonable,
we cannot assure you that these expectations will materialize. Accordingly, our actual results may differ materially from those
expressed or implied thereby.
Unless otherwise specified, forward-looking statements herein speak only as of the date of this presentation. We undertake no
obligation, and do not intend, to publicly update or revise any forward-looking statements, whether as a result of new information,
future events or otherwise. All subsequent written and oral forward-looking statements attributable to us or to persons acting on
our behalf are expressly qualified in their entirety by the cautionary statements referred to above. Readers are cautioned not to
place undue reliance on any forward-looking statements.
Disclaimer
2
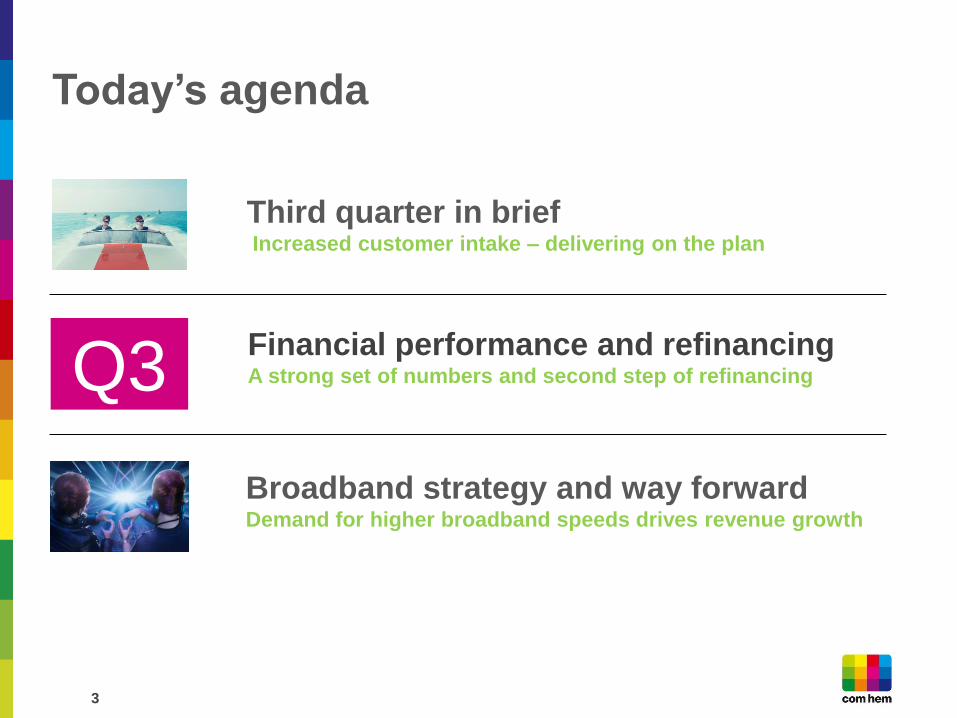
Today’s agenda
Third quarter in brief Increased customer intake – delivering on the plan
Financial performance and refinancing A strong set of numbers and second step of refinancing
Broadband strategy and way forward Demand for higher broadband speeds drives revenue growth
Q3
3
Third quarter in brief and
operational development Anders Nilsson, CEO
4
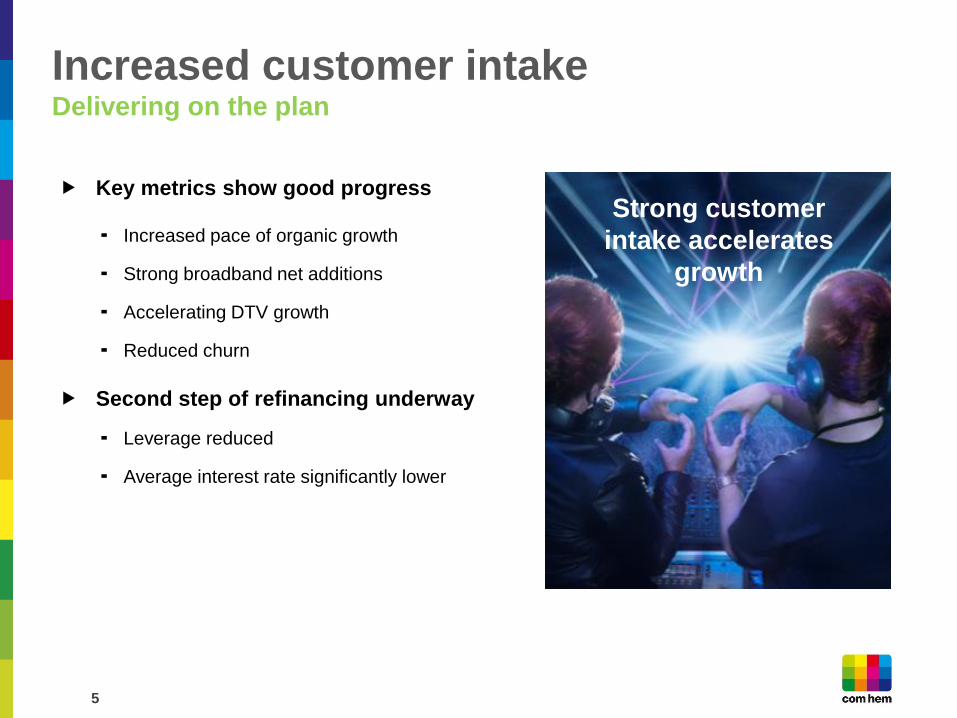
Strong customer
intake accelerates
growth
Increased customer intake Delivering on the plan
Key metrics show good progress
Increased pace of organic growth
Strong broadband net additions
Accelerating DTV growth
Reduced churn
Second step of refinancing underway
Leverage reduced
Average interest rate significantly lower
5
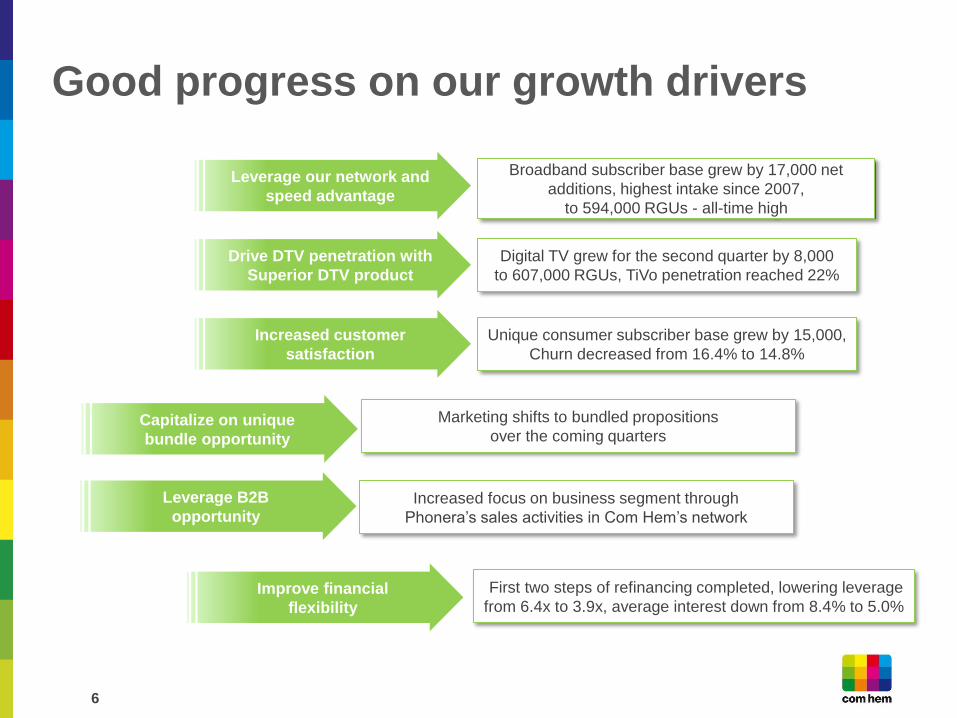
Good progress on our growth drivers
Broadband subscriber base grew by 17,000 net
additions, highest intake since 2007,
to 594,000 RGUs - all-time high
Digital TV grew for the second quarter by 8,000
to 607,000 RGUs, TiVo penetration reached 22%
Unique consumer subscriber base grew by 15,000,
Churn decreased from 16.4% to 14.8%
Marketing shifts to bundled propositions
over the coming quarters
Increased focus on business segment through
Phonera’s sales activities in Com Hem’s network
First two steps of refinancing completed, lowering leverage
from 6.4x to 3.9x, average interest down from 8.4% to 5.0%
Leverage our network and
speed advantage
Drive DTV penetration with
Superior DTV product
Increased customer
satisfaction
Improve financial
flexibility
6
Capitalize on unique
bundle opportunity
Leverage B2B
opportunity
Total growth
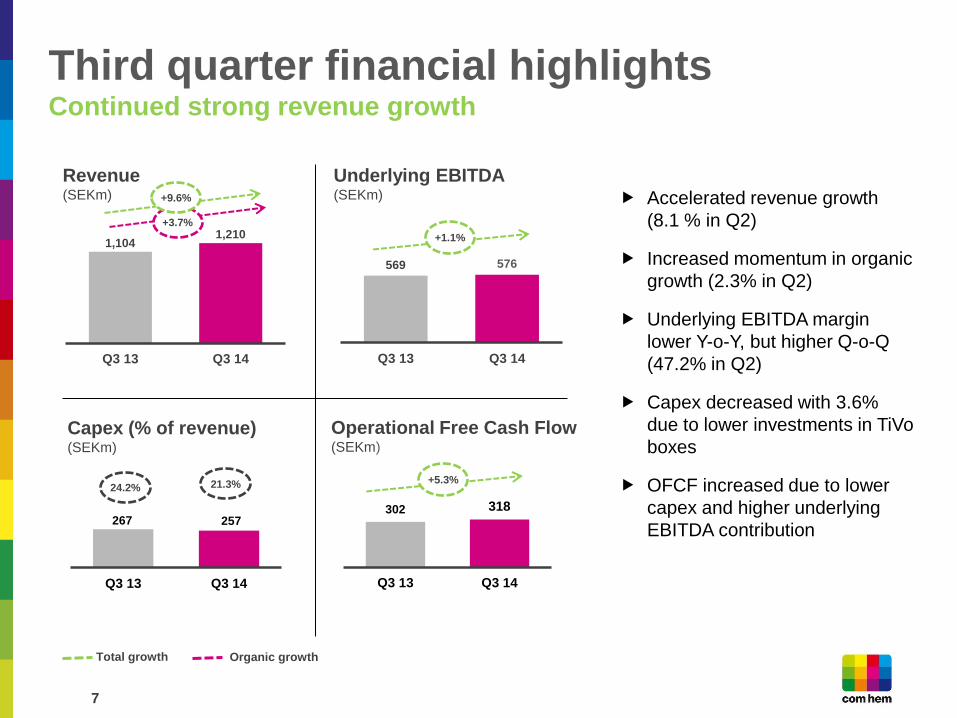
1,104 1,210
Q3 13 Q3 14
Revenue (SEKm)
Underlying EBITDA (SEKm)
Operational Free Cash Flow (SEKm)
Capex (% of revenue) (SEKm)
569 576
Q3 13 Q3 14
302 318
Q3 13 Q3 14
267 257
Q3 13 Q3 14
Third quarter financial highlights Continued strong revenue growth
Accelerated revenue growth
(8.1 % in Q2)
Increased momentum in organic
growth (2.3% in Q2)
Underlying EBITDA margin
lower Y-o-Y, but higher Q-o-Q
(47.2% in Q2)
Capex decreased with 3.6%
due to lower investments in TiVo
boxes
OFCF increased due to lower
capex and higher underlying
EBITDA contribution
+1.1%
24.2%
+3.7%
+9.6%
7
+5.3% 21.3%
Organic growth
51 51
5 6
Q2 14 Q3 14
On Net
Off Net
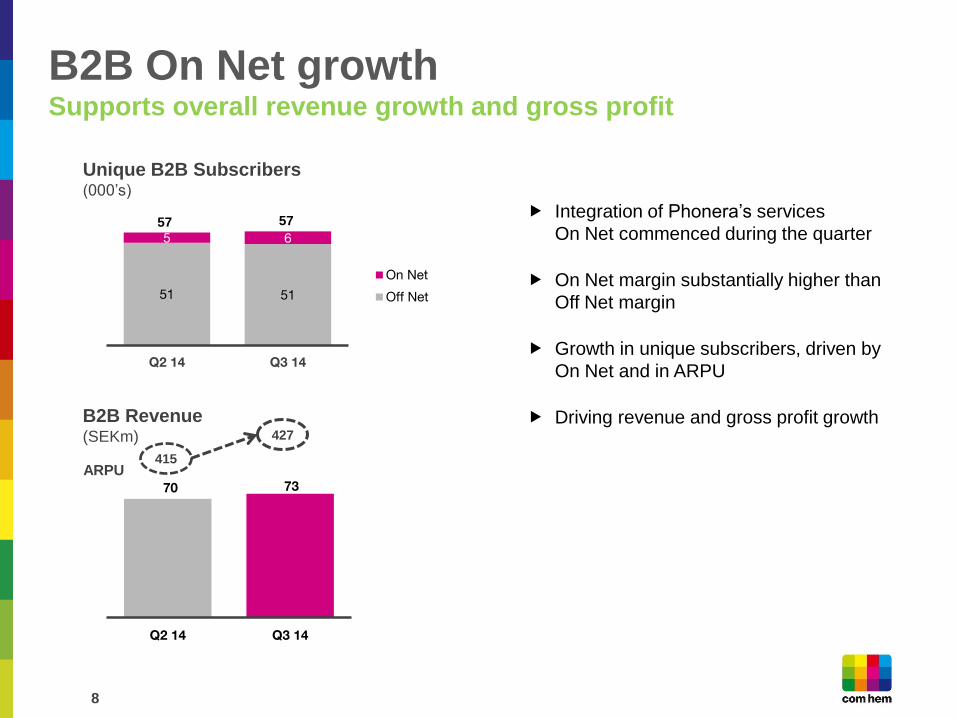
Unique B2B Subscribers (000’s)
B2B On Net growth Supports overall revenue growth and gross profit
Integration of Phonera’s services
On Net commenced during the quarter
On Net margin substantially higher than
Off Net margin
Growth in unique subscribers, driven by
On Net and in ARPU
Driving revenue and gross profit growth
8
57 57
B2B Revenue (SEKm)
415
427
ARPU 70 73
Q2 14 Q3 14
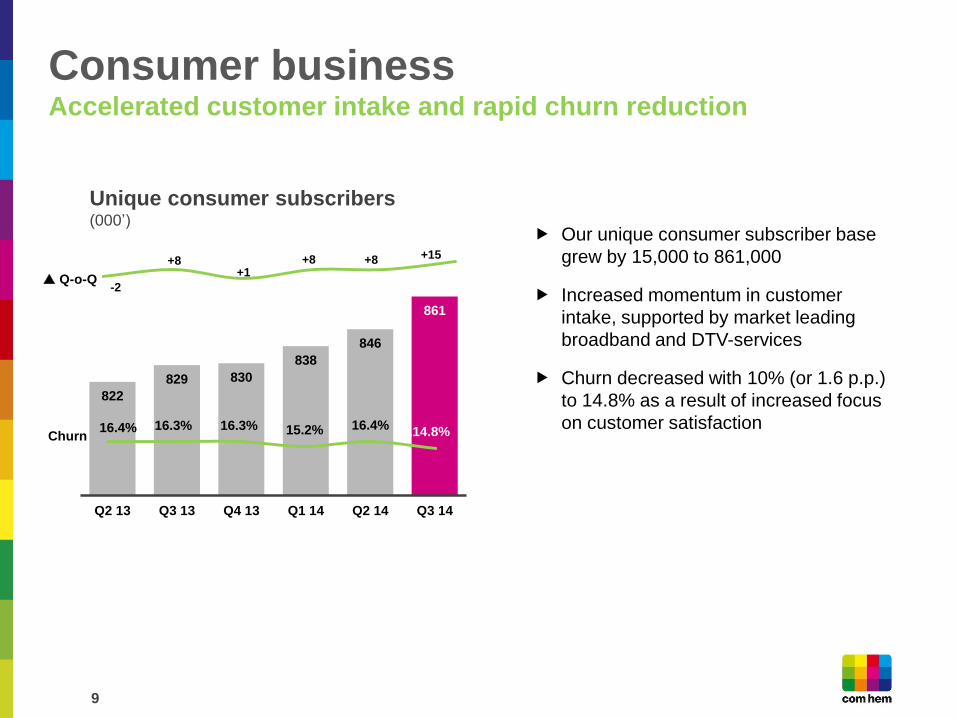
822
829 830
838
846
861
Q2 13 Q3 13 Q4 13 Q1 14 Q2 14 Q3 14
-2
+8 +1
+8 +8 +15
Consumer business Accelerated customer intake and rapid churn reduction
Our unique consumer subscriber base
grew by 15,000 to 861,000
Increased momentum in customer
intake, supported by market leading
broadband and DTV-services
Churn decreased with 10% (or 1.6 p.p.)
to 14.8% as a result of increased focus
on customer satisfaction
Unique consumer subscribers (000’)
16.4% 16.3% 16.3% 15.2% 16.4% .14.8% Churn
Q-o-Q
9
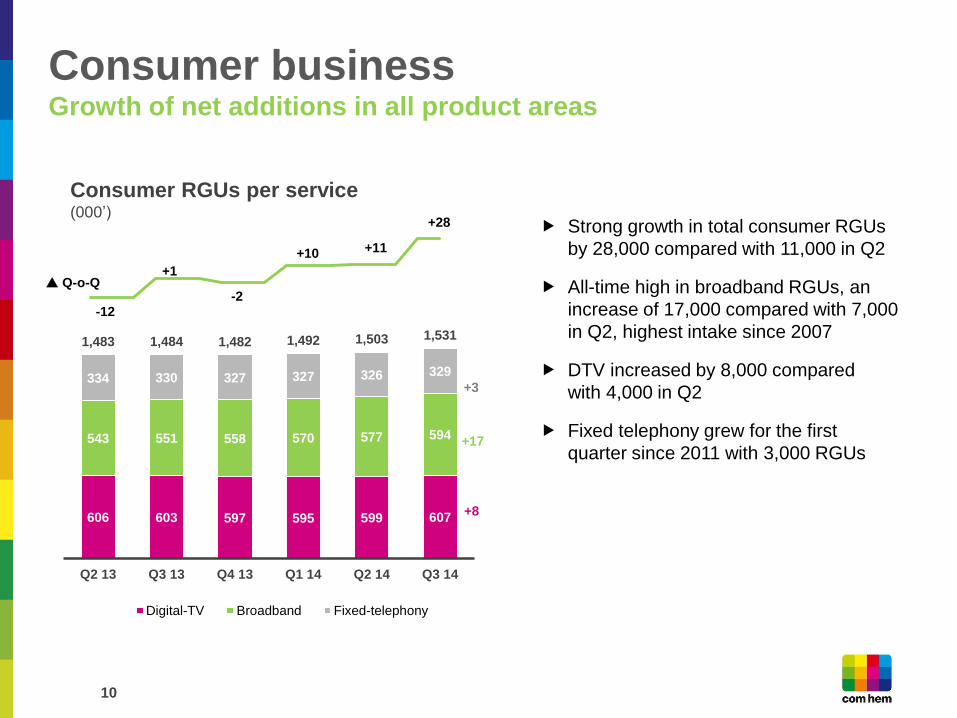
606 603 597 595 599 607
543 551 558 570 577 594
334 330 327 327 326 329
1,483 1,484 1,482 1,492 1,503 1,531
Q2 13 Q3 13 Q4 13 Q1 14 Q2 14 Q3 14
Digital-TV Broadband Fixed-telephony
Consumer business Growth of net additions in all product areas
Consumer RGUs per service (000’)
Strong growth in total consumer RGUs
by 28,000 compared with 11,000 in Q2
All-time high in broadband RGUs, an
increase of 17,000 compared with 7,000
in Q2, highest intake since 2007
DTV increased by 8,000 compared
with 4,000 in Q2
Fixed telephony grew for the first
quarter since 2011 with 3,000 RGUs
+8
+17
+3
10
Q-o-Q
-12
+1
-2
+10 +11
+28
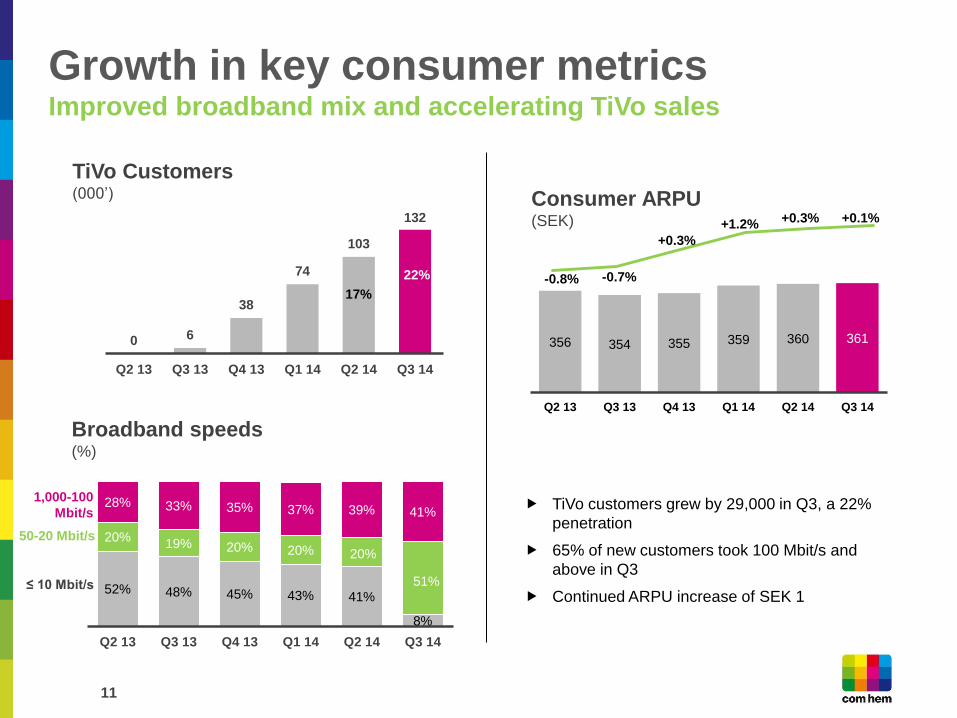
356 354 355 359 360 361
Q2 13 Q3 13 Q4 13 Q1 14 Q2 14 Q3 14
Growth in key consumer metrics Improved broadband mix and accelerating TiVo sales
Consumer ARPU (SEK)
TiVo Customers (000’)
0 6
38
74
103
132
Q2 13 Q3 13 Q4 13 Q1 14 Q2 14 Q3 14
Broadband speeds (%)
52% 48% 45% 43% 41%
8%
20% 19% 20% 20% 20%
51%
28% 33% 35% 37% 39% 41%
Q2 13 Q3 13 Q4 13 Q1 14 Q2 14 Q3 14
1,000-100
Mbit/s
≤ 10 Mbit/s
50-20 Mbit/s
TiVo customers grew by 29,000 in Q3, a 22%
penetration
65% of new customers took 100 Mbit/s and
above in Q3
Continued ARPU increase of SEK 1
11
17%
22% -0.8% -0.7%
+0.3%
+1.2% +0.3% +0.1%
Q3 Financial performance
& Refinancing Daniel Johansson, Head of Financial Control
12
-1.3% -0.4%
+0.9% +0.9% +0.9% +1.0%
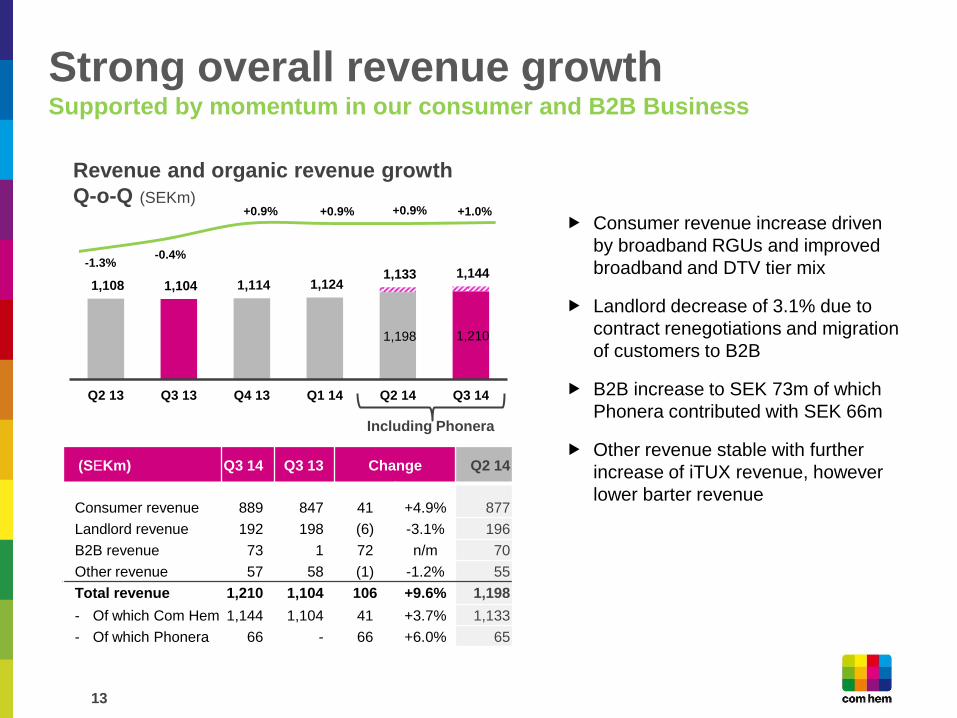
Revenue and organic revenue growth
Q-o-Q (SEKm)
Including Phonera
(SEKm) Q3 14 Q3 13 Change Q2 14
Consumer revenue 889 847 41 +4.9% 877
Landlord revenue 192 198 (6) -3.1% 196
B2B revenue 73 1 72 n/m 70
Other revenue 57 58 (1) -1.2% 55
Total revenue 1,210 1,104 106 +9.6% 1,198
- Of which Com Hem 1,144 1,104 41 +3.7% 1,133
- Of which Phonera 66 - 66 +6.0% 65
Strong overall revenue growth Supported by momentum in our consumer and B2B Business
Consumer revenue increase driven
by broadband RGUs and improved
broadband and DTV tier mix
Landlord decrease of 3.1% due to
contract renegotiations and migration
of customers to B2B
B2B increase to SEK 73m of which
Phonera contributed with SEK 66m
Other revenue stable with further
increase of iTUX revenue, however
lower barter revenue
13
1,198 1,210
1,108 1,104 1,114 1,124 1,133 1,144
Q2 13 Q3 13 Q4 13 Q1 14 Q2 14 Q3 14
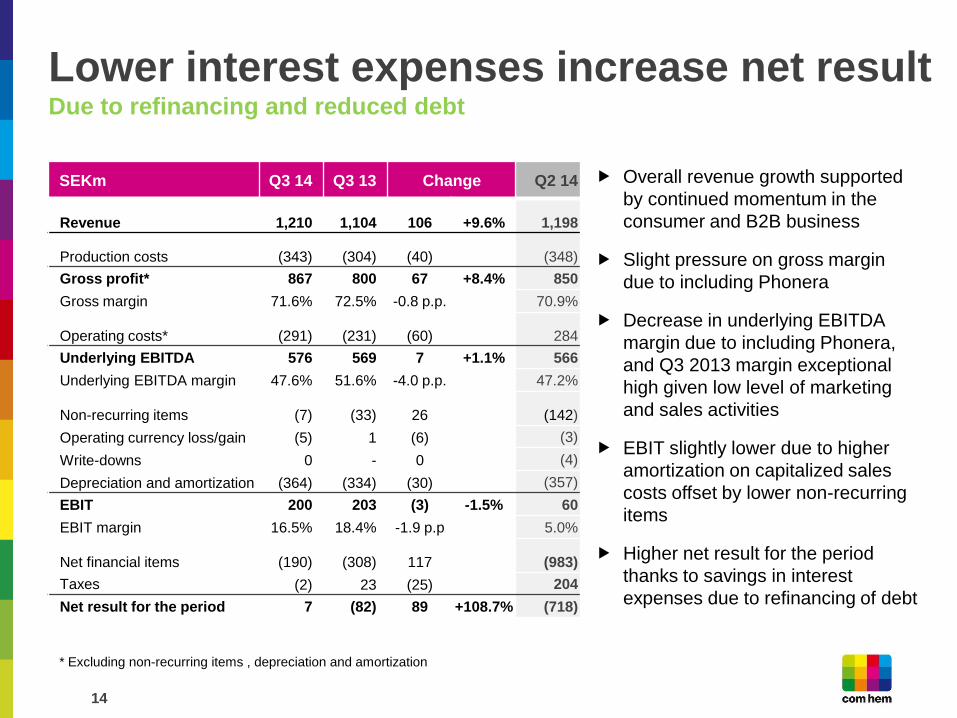
SEKm Q3 14 Q3 13 Change Q2 14
Revenue 1,210 1,104 106 +9.6% 1,198
Production costs (343) (304) (40) (348)
Gross profit* 867 800 67 +8.4% 850
Gross margin 71.6% 72.5% -0.8 p.p. 70.9%
Operating costs* (291) (231) (60) 284
Underlying EBITDA 576 569 7 +1.1% 566
Underlying EBITDA margin 47.6% 51.6% -4.0 p.p. 47.2%
Non-recurring items (7) (33) 26 (142)
Operating currency loss/gain (5) 1 (6) (3)
Write-downs 0 - 0 (4)
Depreciation and amortization (364) (334) (30) (357)
EBIT 200 203 (3) -1.5% 60
EBIT margin 16.5% 18.4% -1.9 p.p 5.0%
Net financial items (190) (308) 117 (983)
Taxes (2) 23 (25) 204
Net result for the period 7 (82) 89 +108.7% (718)
Overall revenue growth supported
by continued momentum in the
consumer and B2B business
Slight pressure on gross margin
due to including Phonera
Decrease in underlying EBITDA
margin due to including Phonera,
and Q3 2013 margin exceptional
high given low level of marketing
and sales activities
EBIT slightly lower due to higher
amortization on capitalized sales
costs offset by lower non-recurring
items
Higher net result for the period
thanks to savings in interest
expenses due to refinancing of debt
Lower interest expenses increase net result Due to refinancing and reduced debt
* Excluding non-recurring items , depreciation and amortization
14
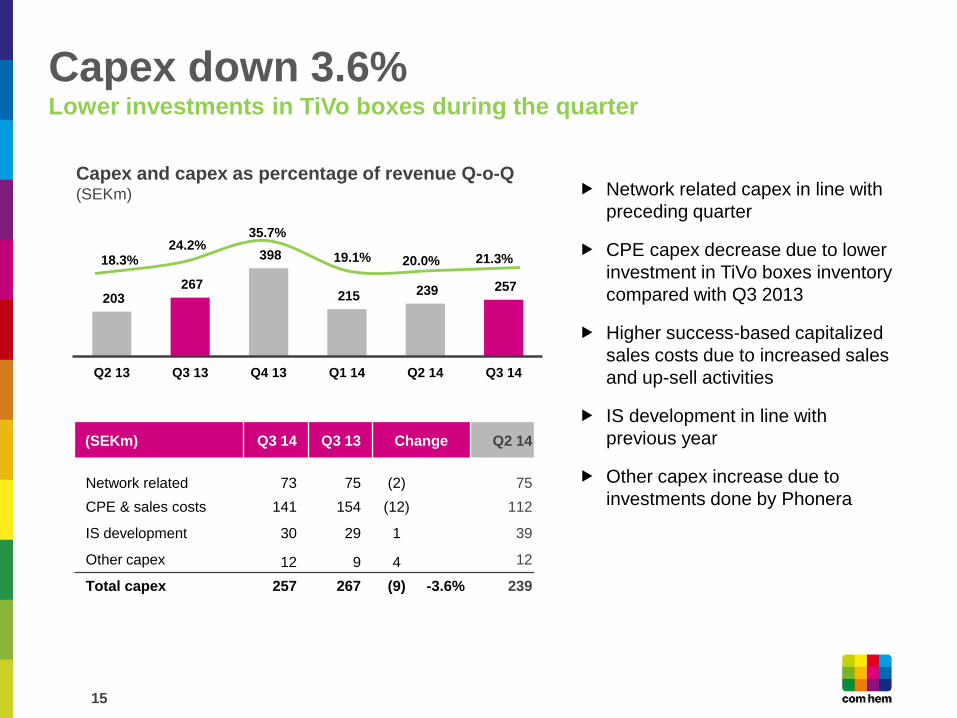
(SEKm) Q3 14 Q3 13 Change Q2 14
Network related 73 75 (2) 75
CPE & sales costs 141 154 (12) 112
IS development 30 29 1 39
Other capex 12 9 4 12
Total capex 257 267 (9) -3.6% 239
18.3% 24.2%
35.7%
19.1% 20.0% 21.3%
Capex and capex as percentage of revenue Q-o-Q (SEKm) Network related capex in line with
preceding quarter
CPE capex decrease due to lower
investment in TiVo boxes inventory
compared with Q3 2013
Higher success-based capitalized
sales costs due to increased sales
and up-sell activities
IS development in line with
previous year
Other capex increase due to
investments done by Phonera
15
Capex down 3.6% Lower investments in TiVo boxes during the quarter
203 267
398
215 239 257
Q2 13 Q3 13 Q4 13 Q1 14 Q2 14 Q3 14
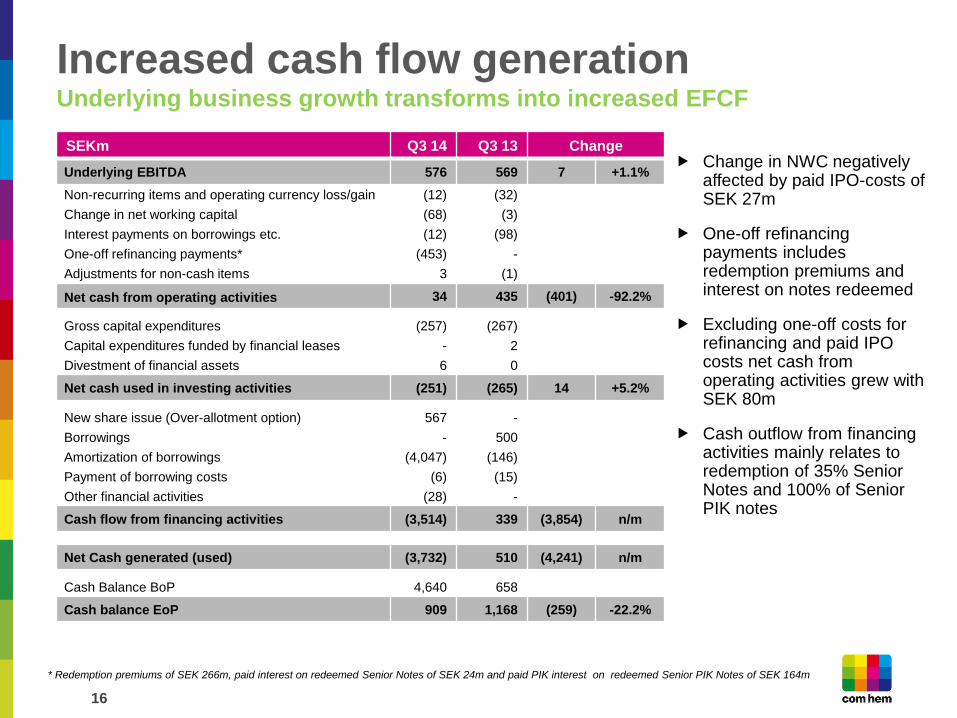
Increased cash flow generation Underlying business growth transforms into increased EFCF
* Redemption premiums of SEK 266m, paid interest on redeemed Senior Notes of SEK 24m and paid PIK interest on redeemed Senior PIK Notes of SEK 164m
Change in NWC negatively affected by paid IPO-costs of SEK 27m
One-off refinancing payments includes redemption premiums and interest on notes redeemed
Excluding one-off costs for refinancing and paid IPO costs net cash from operating activities grew with SEK 80m
Cash outflow from financing activities mainly relates to redemption of 35% Senior Notes and 100% of Senior PIK notes
16
SEKm Q3 14 Q3 13 Change
Underlying EBITDA 576 569 7 +1.1%
Non-recurring items and operating currency loss/gain (12) (32)
Change in net working capital (68) (3)
Interest payments on borrowings etc. (12) (98)
One-off refinancing payments* (453) -
Adjustments for non-cash items 3 (1)
Net cash from operating activities 34 435 (401) -92.2%
Gross capital expenditures (257) (267)
Capital expenditures funded by financial leases - 2
Divestment of financial assets 6 0
Net cash used in investing activities (251) (265) 14 +5.2%
New share issue (Over-allotment option) 567 -
Borrowings - 500
Amortization of borrowings (4,047) (146)
Payment of borrowing costs (6) (15)
Other financial activities (28) -
Cash flow from financing activities (3,514) 339 (3,854) n/m
Net Cash generated (used) (3,732) 510 (4,241) n/m
Cash Balance BoP 4,640 658
Cash balance EoP 909 1,168 (259) -22.2%
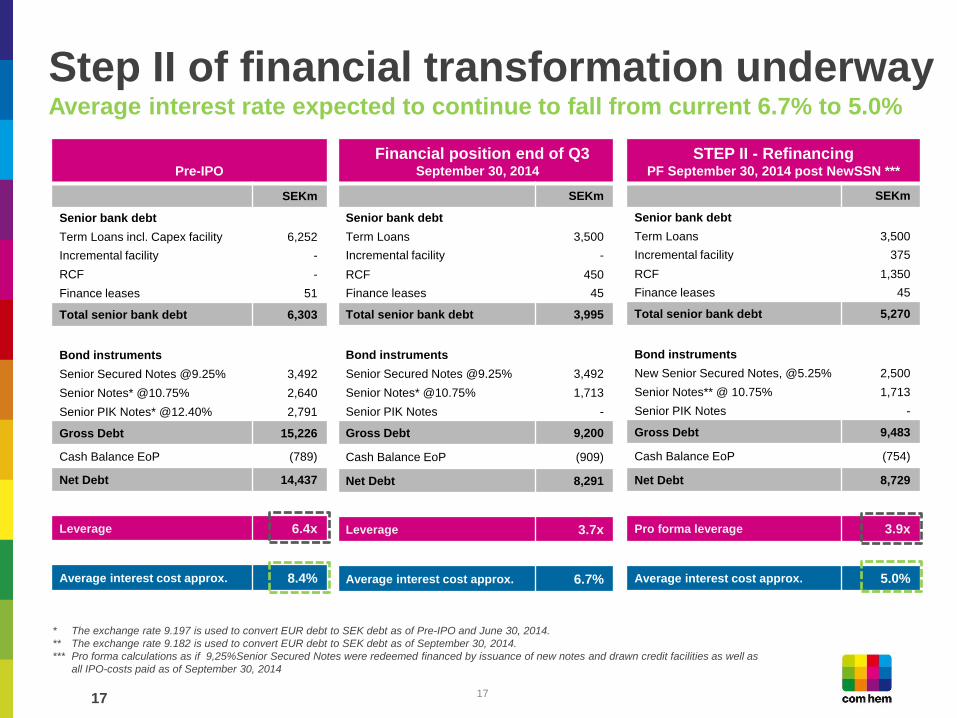
STEP II - Refinancing PF September 30, 2014 post NewSSN ***
SEKm
Senior bank debt
Term Loans 3,500
Incremental facility 375
RCF 1,350
Finance leases 45
Total senior bank debt 5,270
Bond instruments
New Senior Secured Notes, @5.25% 2,500
Senior Notes** @ 10.75% 1,713
Senior PIK Notes -
Gross Debt 9,483
Cash Balance EoP (754)
Net Debt 8,729
Pro forma leverage 3.9x
Average interest cost approx. 5.0%
Pre-IPO
SEKm
Senior bank debt
Term Loans incl. Capex facility 6,252
Incremental facility -
RCF -
Finance leases 51
Total senior bank debt 6,303
Bond instruments
Senior Secured Notes @9.25% 3,492
Senior Notes* @10.75% 2,640
Senior PIK Notes* @12.40% 2,791
Gross Debt 15,226
Cash Balance EoP (789)
Net Debt 14,437
Leverage 6.4x
Average interest cost approx. 8.4%
Financial position end of Q3 September 30, 2014
SEKm
Senior bank debt
Term Loans 3,500
Incremental facility -
RCF 450
Finance leases 45
Total senior bank debt 3,995
Bond instruments
Senior Secured Notes @9.25% 3,492
Senior Notes* @10.75% 1,713
Senior PIK Notes -
Gross Debt 9,200
Cash Balance EoP (909)
Net Debt 8,291
Leverage 3.7x
Average interest cost approx. 6.7%
* The exchange rate 9.197 is used to convert EUR debt to SEK debt as of Pre-IPO and June 30, 2014.
** The exchange rate 9.182 is used to convert EUR debt to SEK debt as of September 30, 2014.
*** Pro forma calculations as if 9,25%Senior Secured Notes were redeemed financed by issuance of new notes and drawn credit facilities as well as
all IPO-costs paid as of September 30, 2014
17
Step II of financial transformation underway Average interest rate expected to continue to fall from current 6.7% to 5.0%
17
Broadband strategy Jon James, COO
18
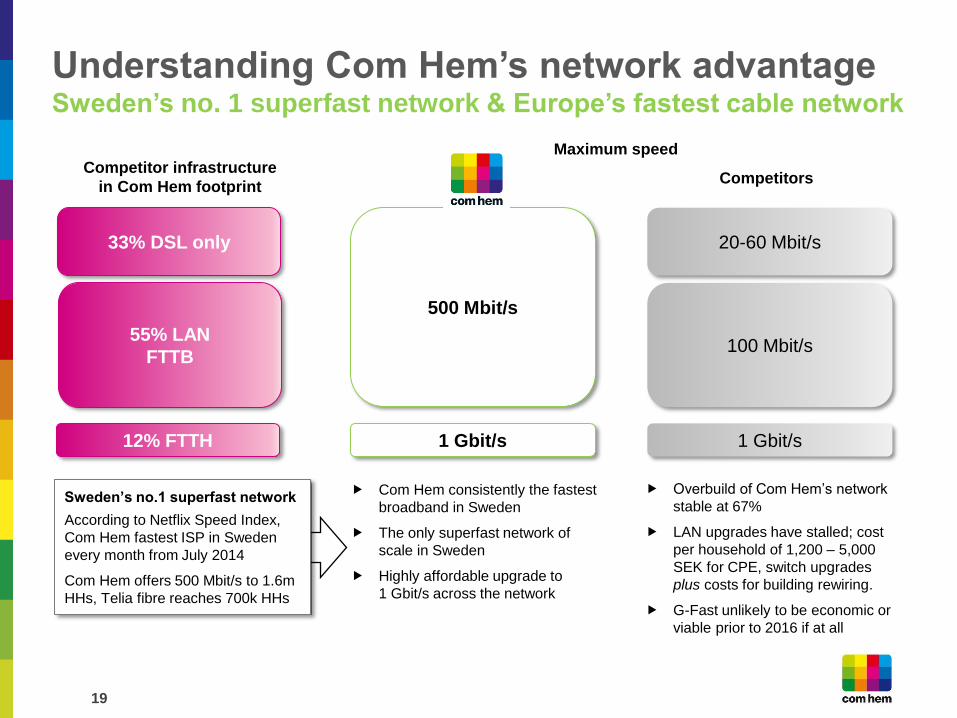
Understanding Com Hem’s network advantage Sweden’s no. 1 superfast network & Europe’s fastest cable network
Maximum speed
33% DSL only
55% LAN
FTTB
12% FTTH
20-60 Mbit/s
100 Mbit/s
1 Gbit/s 1 Gbit/s
500 Mbit/s
Competitor infrastructure
in Com Hem footprint
Sweden’s no.1 superfast network
According to Netflix Speed Index,
Com Hem fastest ISP in Sweden
every month from July 2014
Com Hem offers 500 Mbit/s to 1.6m
HHs, Telia fibre reaches 700k HHs
Com Hem consistently the fastest
broadband in Sweden
The only superfast network of
scale in Sweden
Highly affordable upgrade to
1 Gbit/s across the network
Overbuild of Com Hem’s network
stable at 67%
LAN upgrades have stalled; cost
per household of 1,200 – 5,000
SEK for CPE, switch upgrades
plus costs for building rewiring.
G-Fast unlikely to be economic or
viable prior to 2016 if at all
19
Competitors
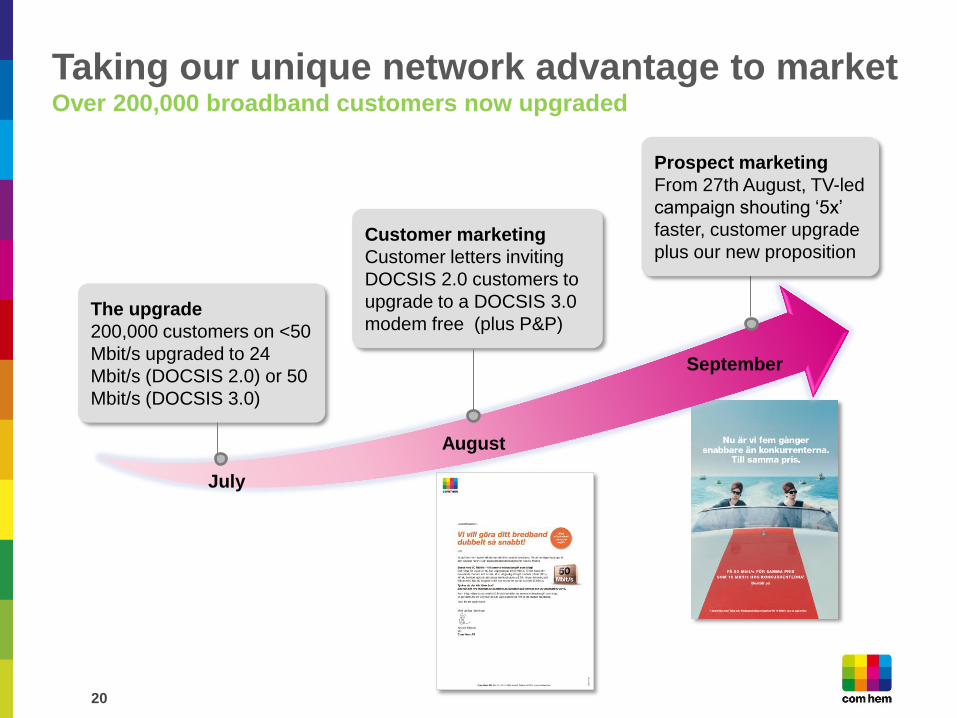
Taking our unique network advantage to market Over 200,000 broadband customers now upgraded
The upgrade
200,000 customers on <50
Mbit/s upgraded to 24
Mbit/s (DOCSIS 2.0) or 50
Mbit/s (DOCSIS 3.0)
August
July
September
Customer marketing
Customer letters inviting
DOCSIS 2.0 customers to
upgrade to a DOCSIS 3.0
modem free (plus P&P)
20
Prospect marketing
From 27th August, TV-led
campaign shouting ‘5x’
faster, customer upgrade
plus our new proposition
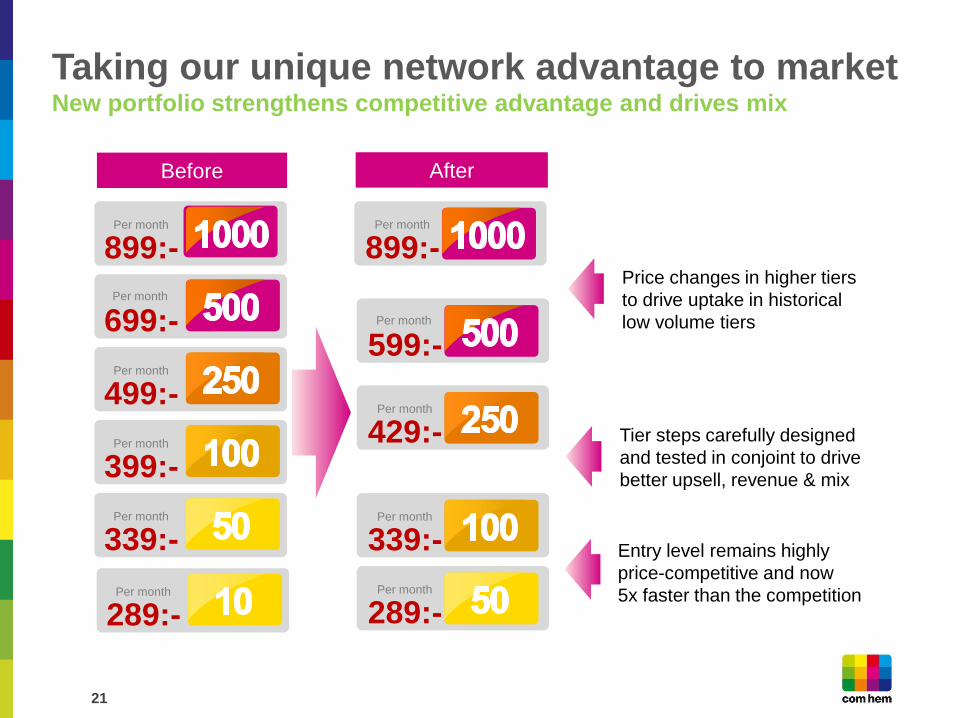
Before After
899:- Per month
599:-
429:- Per month
339:- Per month
289:- Per month
Per month
899:- Per month
699:-
499:- Per month
399:- Per month
339:- Per month
Per month
289:- Per month
Tier steps carefully designed
and tested in conjoint to drive
better upsell, revenue & mix
Entry level remains highly
price-competitive and now
5x faster than the competition
Price changes in higher tiers
to drive uptake in historical
low volume tiers
Taking our unique network advantage to market New portfolio strengthens competitive advantage and drives mix
21
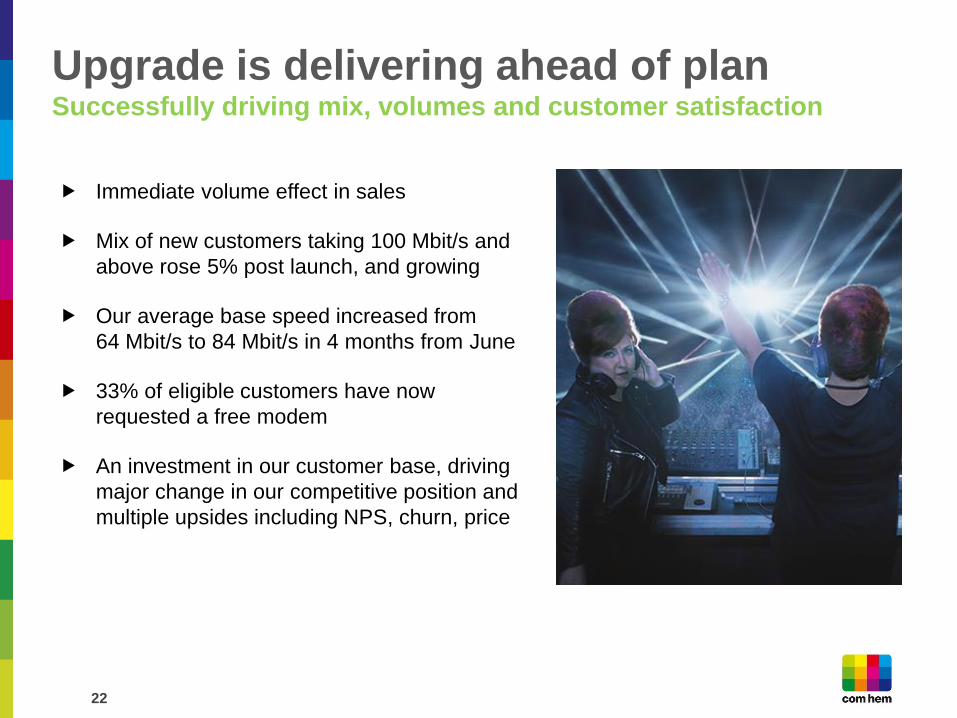
Upgrade is delivering ahead of plan Successfully driving mix, volumes and customer satisfaction
22
Immediate volume effect in sales
Mix of new customers taking 100 Mbit/s and
above rose 5% post launch, and growing
Our average base speed increased from
64 Mbit/s to 84 Mbit/s in 4 months from June
33% of eligible customers have now
requested a free modem
An investment in our customer base, driving
major change in our competitive position and
multiple upsides including NPS, churn, price
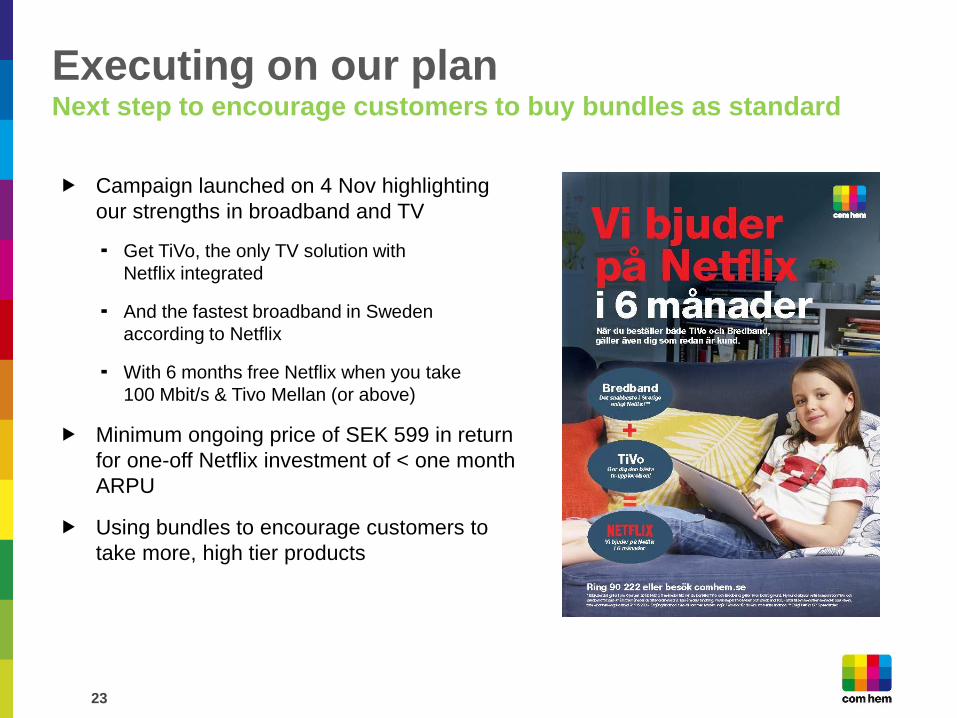
Executing on our plan Next step to encourage customers to buy bundles as standard
23
Campaign launched on 4 Nov highlighting
our strengths in broadband and TV
Get TiVo, the only TV solution with
Netflix integrated
And the fastest broadband in Sweden
according to Netflix
With 6 months free Netflix when you take
100 Mbit/s & Tivo Mellan (or above)
Minimum ongoing price of SEK 599 in return
for one-off Netflix investment of < one month
ARPU
Using bundles to encourage customers to
take more, high tier products
Conclusions and way forward
24
Continued execution of the IPO plan
Our growth initiatives:
Leading TV and broadband offerings
Increased customer satisfaction
Introduce bundles of leading TV and broadband
products
B2B gearing up for On-Net growth going forward
The significantly reduced cost of debt
translates to high cash generation
25
Q&A
Year-End results published on February 10, 2015
25
Recommended