Comparison of Plaque Burden in Tg2576 Mice Using the Aperio and TurboScan Imaging Platforms
A.J. Milici

Alzheimer’s Disease
Alzheimer’s Disease (AD) is a progressive neurodegenerative disorder of the brain and is the most common form of dementia.
Major contributing factor for increased risk is old age.
After 65 a doubling of risk occurs every 5 years effecting ~30% of people >80 years old.
Two histopathological changes within the brain.• Neurofibrillary Tangles
• Amyloid Plaques
Amyloid Plaque
Amyloid plaque occurs extracellular to the neuron cell body and is diagnostic of Alzheimer’s disease (AD).
Plaque made up of a 42 amino acid amyloid peptide (A42).
A42 originates from abnormal processing of Amyloid Precursor Protein (APP).
APP is a transmembrane cell surface protein with functional roles in:
• Neurite outgrowth
• Cell adhesion
• Synaptic functions
• Induction of apoptosis
What has been previously done to quantify Amyloid?
Many previous studies have sampled a few fields from cortex and hippocampus• Issues
o Variability of transgene expressiono Small N o Selective field sampling bias
Methods
Hemibrains were fixed ON in NBF Routinely processed and embedded in Paraffin 15 m serial sections were collected Sections were routinely stained with 6E10
antibody Images were captured:
• @10x using TurboScan on a Nikon--- microscope• @20x using an AperioXT system
TurboScan images were analyzed using ImagePro
Aperio images were analyzed using the Positive Pixel Algorithm
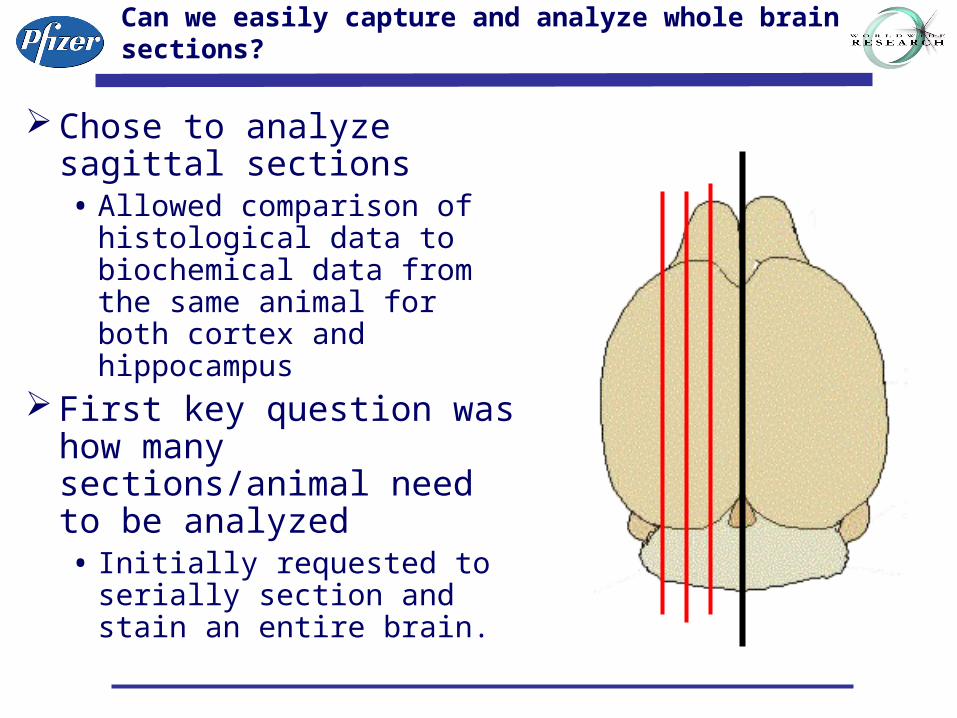
Can we easily capture and analyze whole brain sections?
Chose to analyze sagittal sections• Allowed comparison of
histological data to biochemical data from the same animal for both cortex and hippocampus
First key question was how many sections/animal need to be analyzed• Initially requested to serially
section and stain an entire brain.
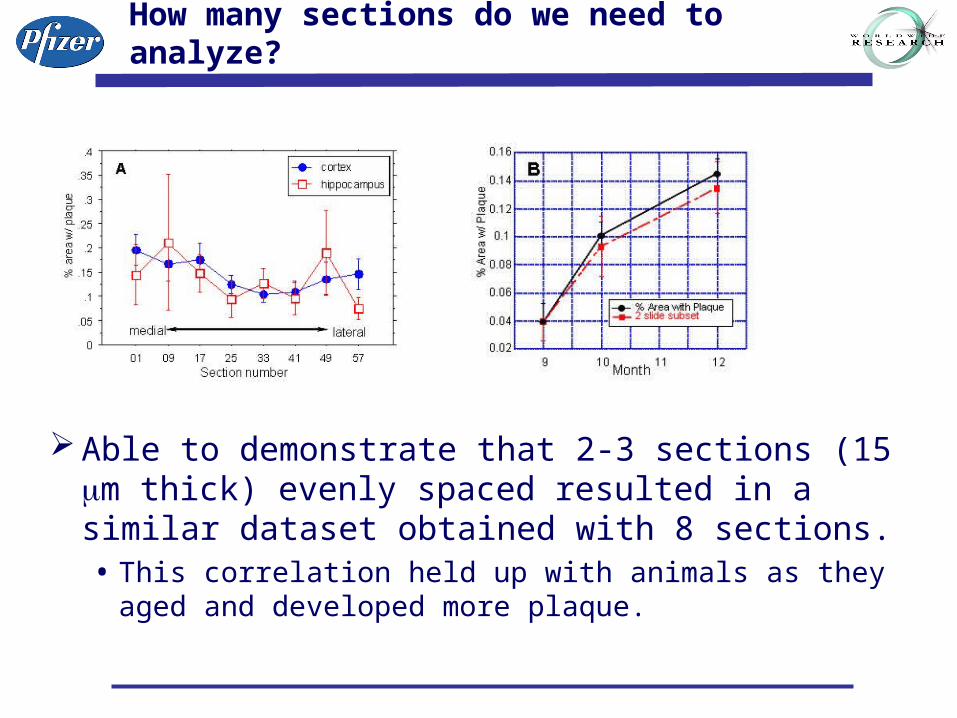
How many sections do we need to analyze?
Able to demonstrate that 2-3 sections (15 m thick) evenly spaced resulted in a similar dataset obtained with 8 sections.• This correlation held up with animals as they aged and
developed more plaque.
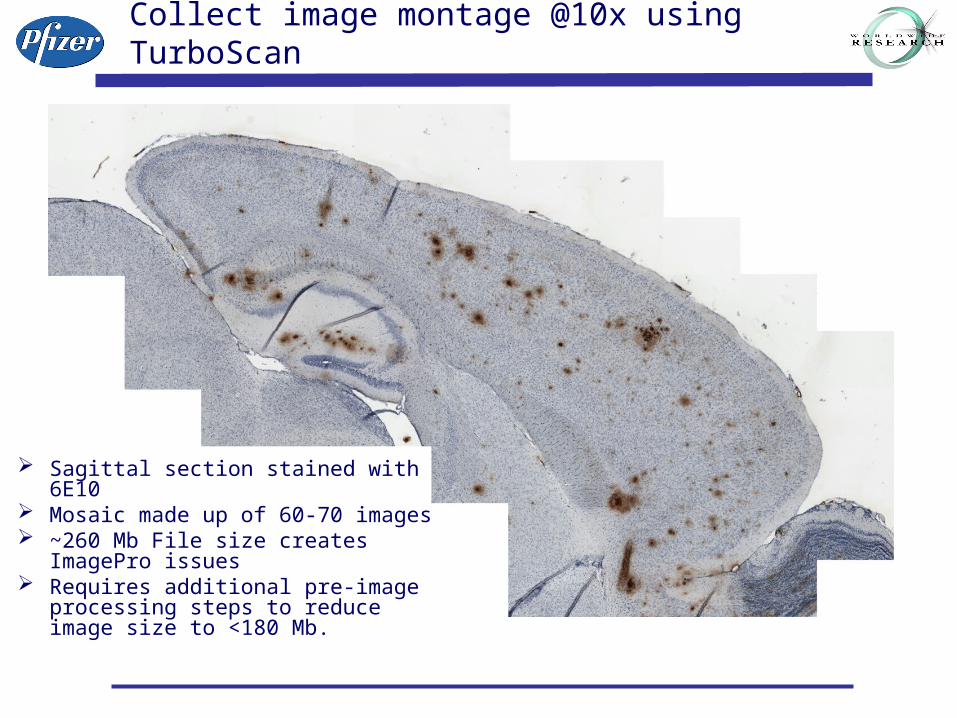
Collect image montage @10x using TurboScan
Sagittal section stained with 6E10 Mosaic made up of 60-70 images ~260 Mb File size creates ImagePro
issues Requires additional pre-image
processing steps to reduce image size to <180 Mb.
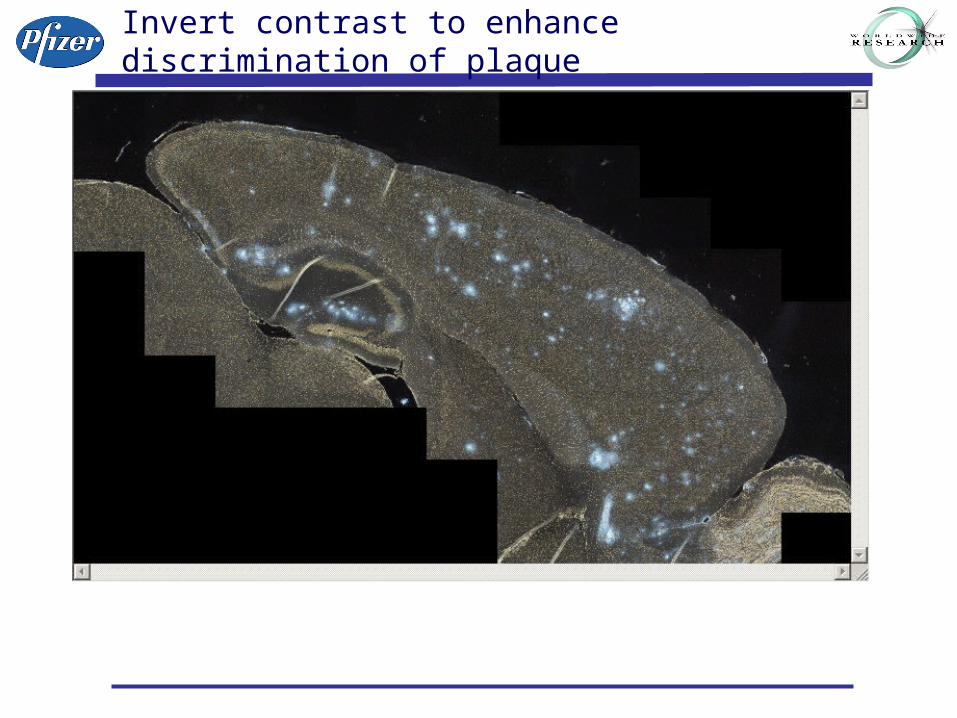
Invert contrast to enhance discrimination of plaque
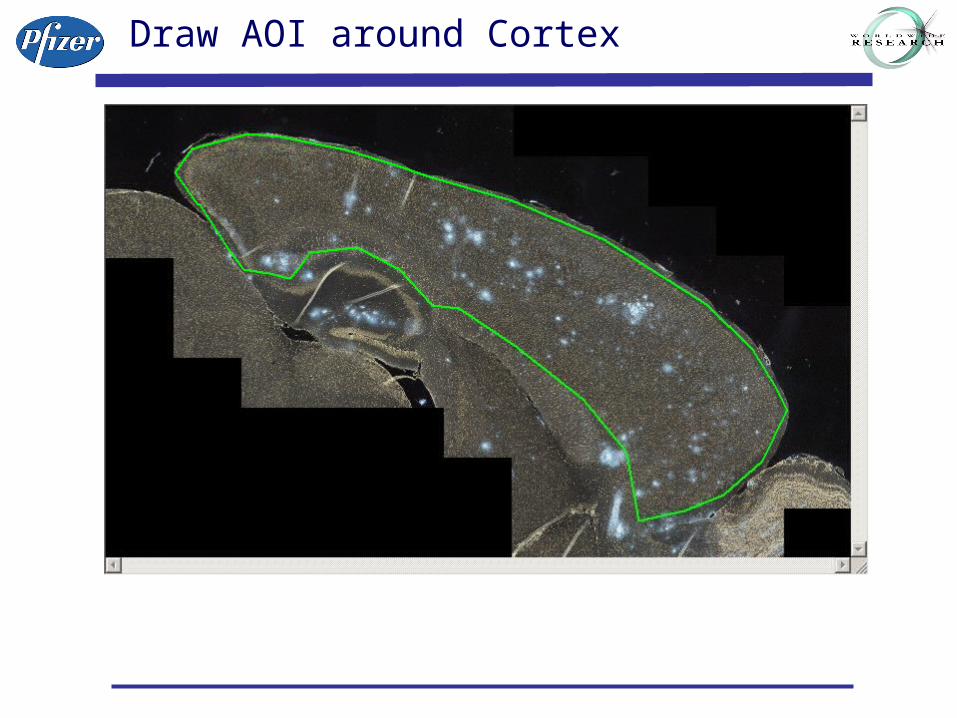
Draw AOI around Cortex
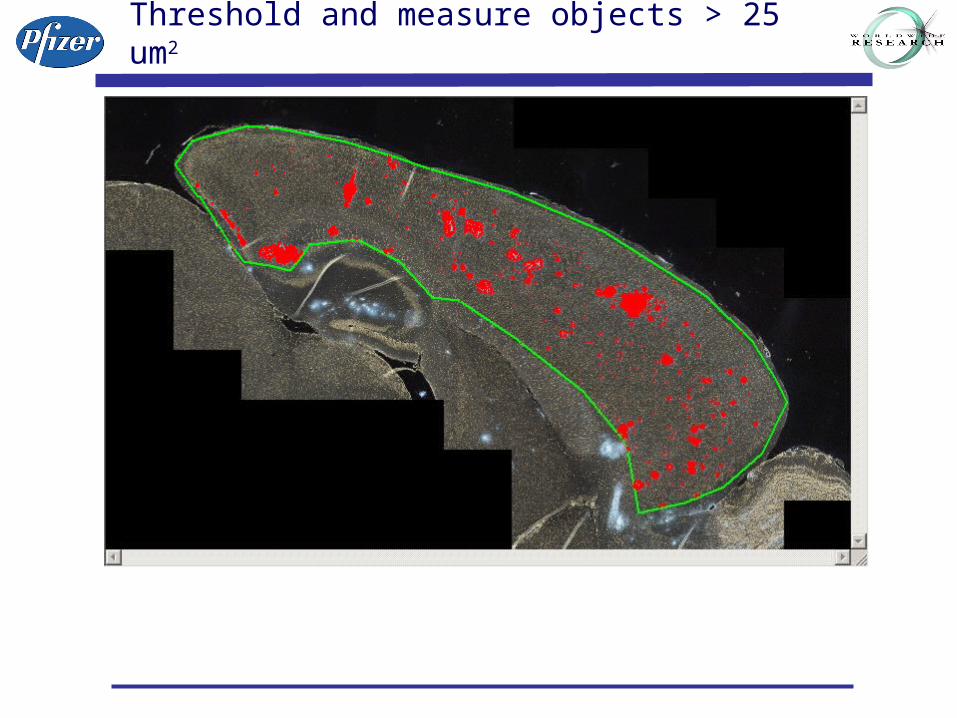
Threshold and measure objects > 25 um2
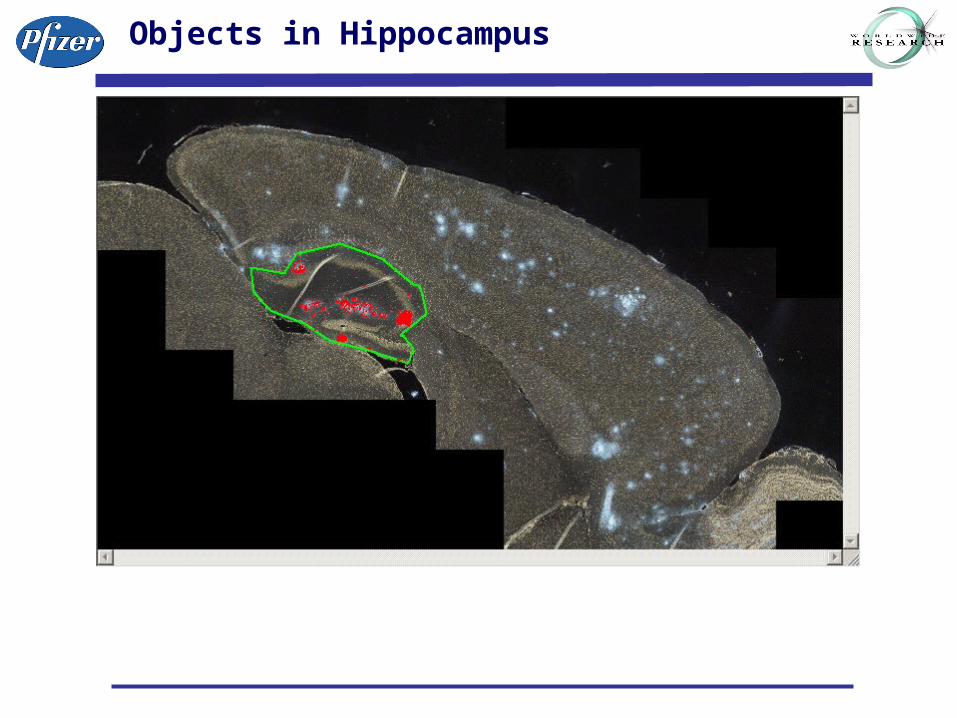
Objects in Hippocampus
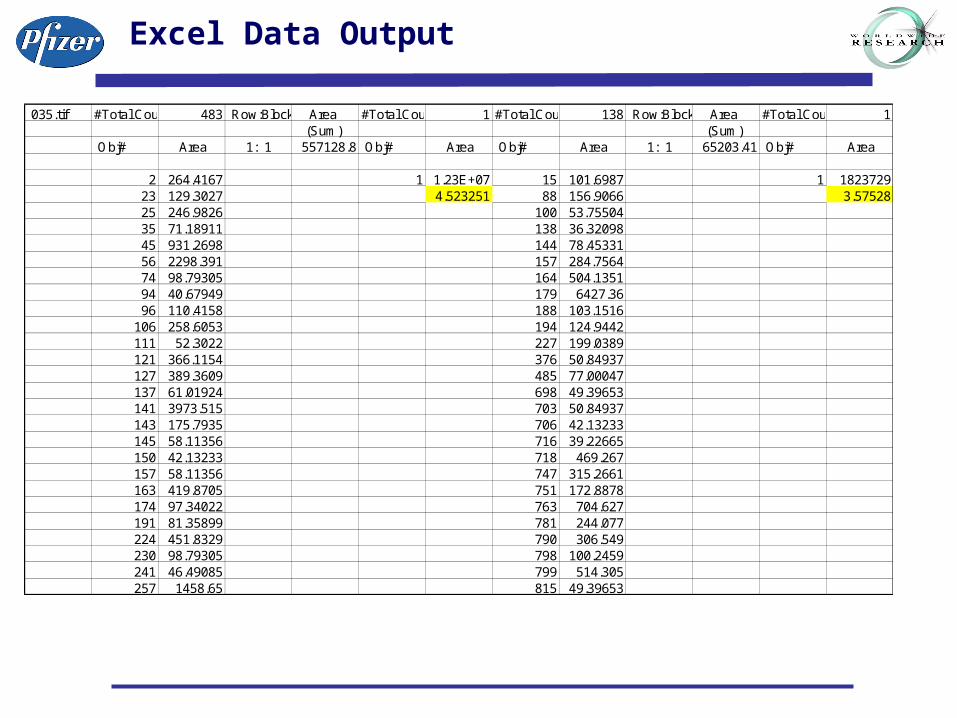
Excel Data Output
035.tif #Total Count: 483 Row:Block Area #Total Count: 1 #Total Count: 138 Row:Block Area #Total Count: 1 (Sum) (Sum)
Obj# Area 1: 1 557128.8 Obj# Area Obj# Area 1: 1 65203.41 Obj# Area
2 264.4167 1 1.23E+07 15 101.6987 1 182372923 129.3027 4.523251 88 156.9066 3.5752825 246.9826 100 53.7550435 71.18911 138 36.3209845 931.2698 144 78.4533156 2298.391 157 284.756474 98.79305 164 504.135194 40.67949 179 6427.3696 110.4158 188 103.1516
106 258.6053 194 124.9442111 52.3022 227 199.0389121 366.1154 376 50.84937127 389.3609 485 77.00047137 61.01924 698 49.39653141 3973.515 703 50.84937143 175.7935 706 42.13233145 58.11356 716 39.22665150 42.13233 718 469.267157 58.11356 747 315.2661163 419.8705 751 172.8878174 97.34022 763 704.627191 81.35899 781 244.077224 451.8329 790 306.549230 98.79305 798 100.2459241 46.49085 799 514.305257 1458.65 815 49.39653
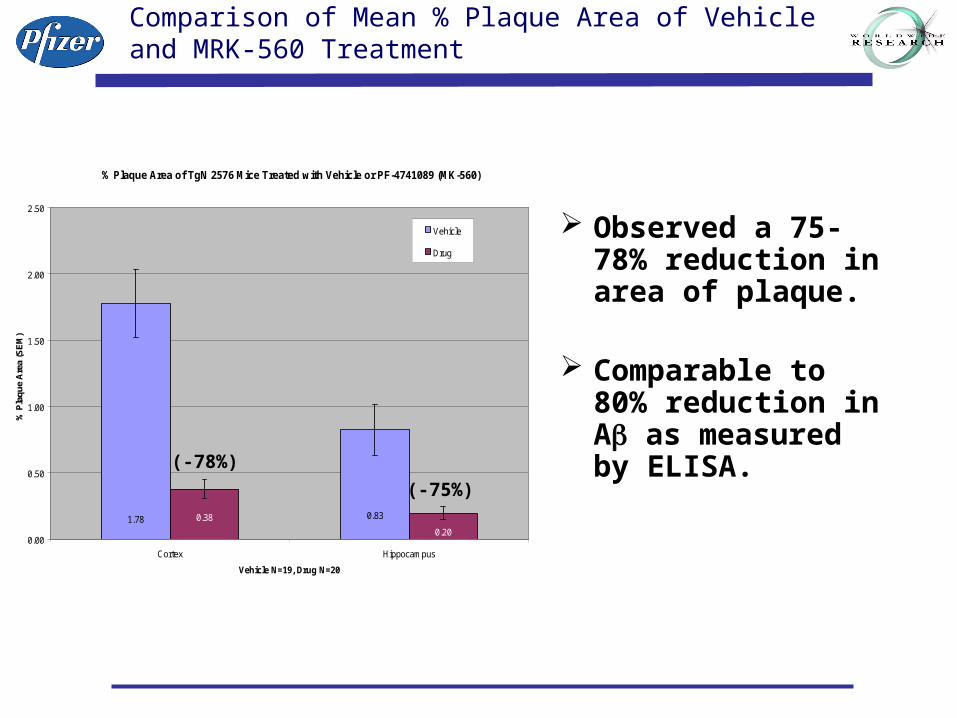
Comparison of Mean % Plaque Area of Vehicle and MRK-560 Treatment
Observed a 75-78% reduction in area of plaque.
Comparable to 80% reduction in A as measured by ELISA.
% Plaque Area of TgN 2576 Mice Treated with Vehicle or PF-4741089 (MK-560)
0.831.780.20
0.38
0.00
0.50
1.00
1.50
2.00
2.50
Cortex Hippocampus
Vehicle N=19, Drug N=20
% P
laq
ue
Are
a (S
EM
)
Vehicle
Drug
(-78%)
(-75%)
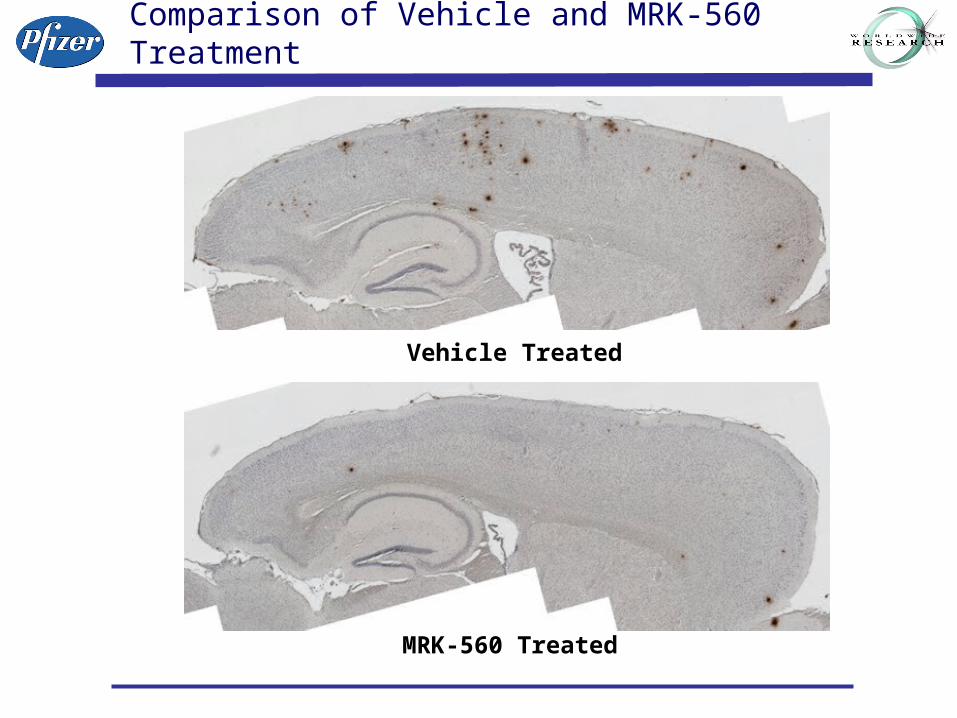
Comparison of Vehicle and MRK-560 Treatment
Vehicle Treated
MRK-560 Treated
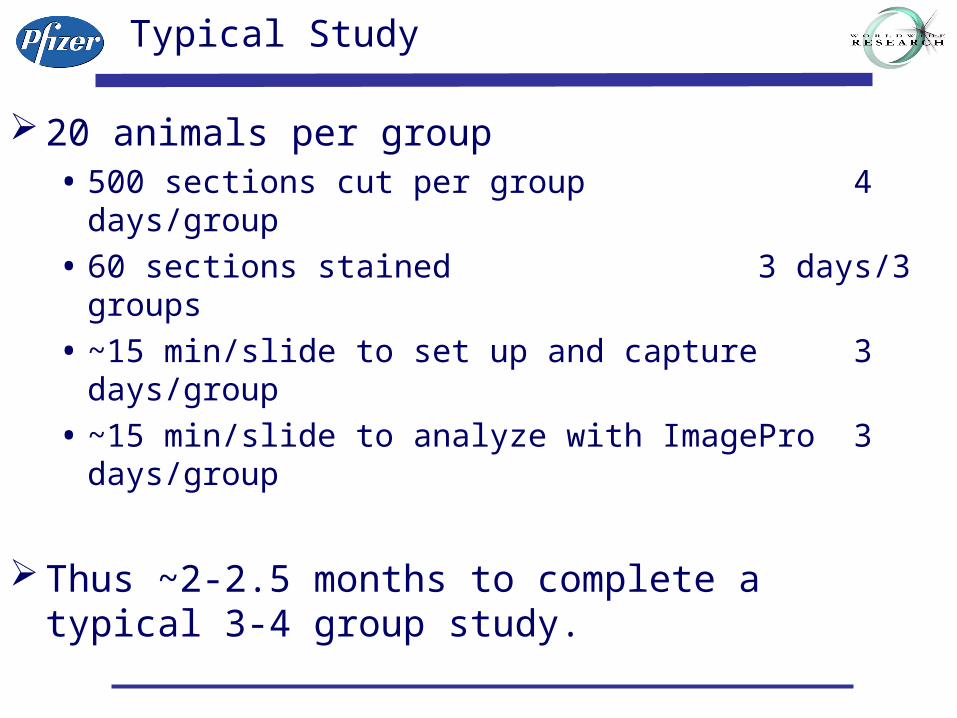
Typical Study
20 animals per group• 500 sections cut per group 4 days/group
• 60 sections stained 3 days/3 groups
• ~15 min/slide to set up and capture 3 days/group
• ~15 min/slide to analyze with ImagePro 3 days/group
Thus ~2-2.5 months to complete a typical 3-4 group study.
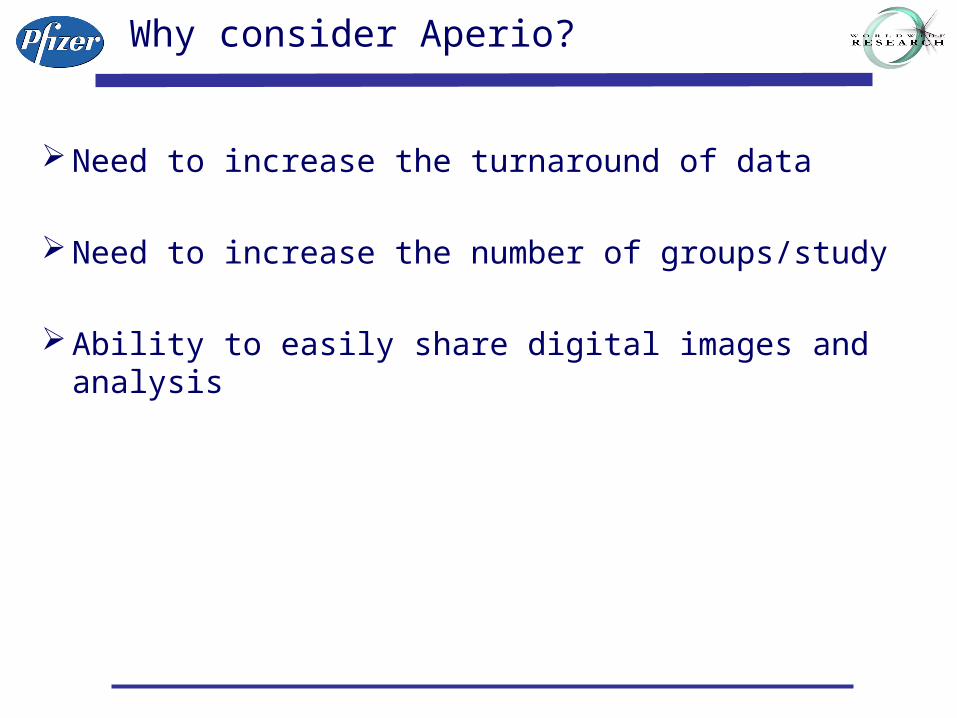
Why consider Aperio?
Need to increase the turnaround of data
Need to increase the number of groups/study
Ability to easily share digital images and analysis
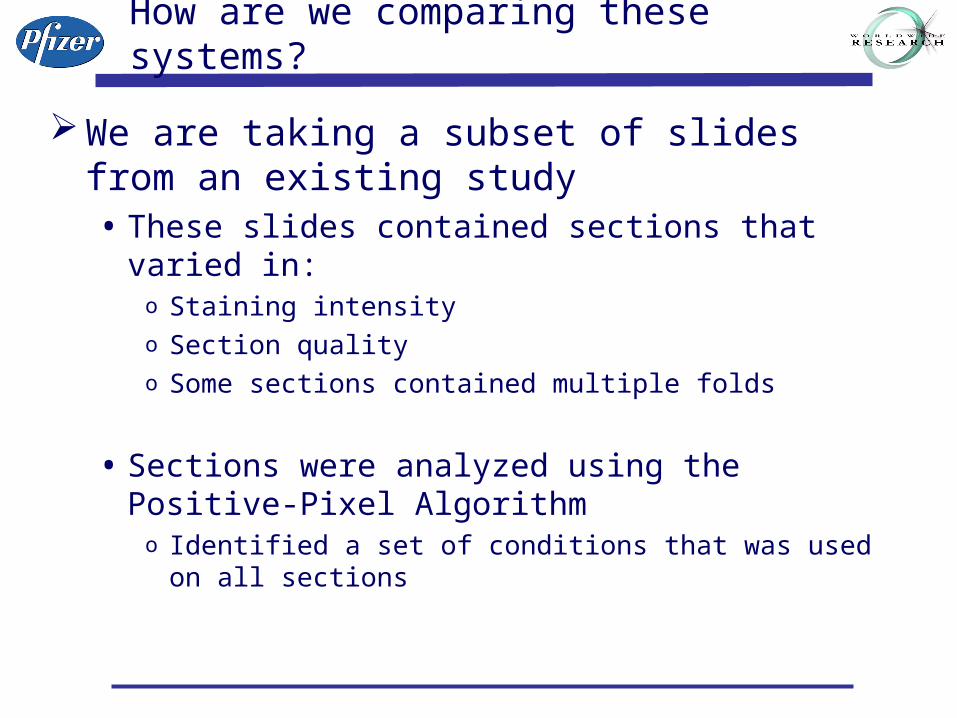
How are we comparing these systems?
We are taking a subset of slides from an existing study• These slides contained sections that varied in:
o Staining intensityo Section qualityo Some sections contained multiple folds
• Sections were analyzed using the Positive-Pixel Algorithm
o Identified a set of conditions that was used on all sections
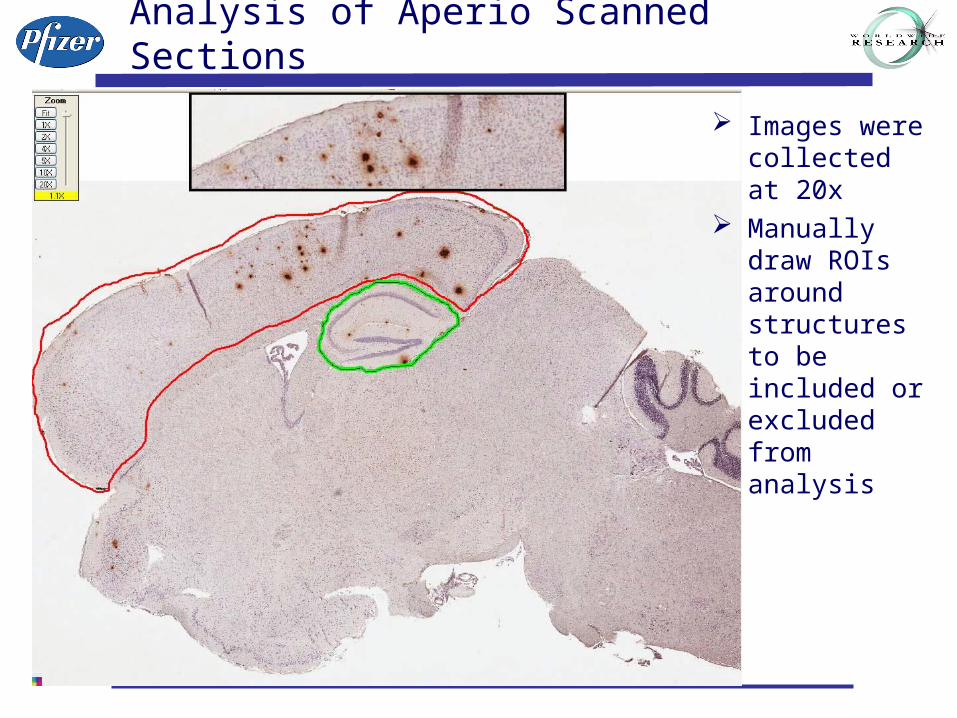
Analysis of Aperio Scanned Sections
Images were collected at 20x
Manually draw ROIs around structures to be included or excluded from analysis
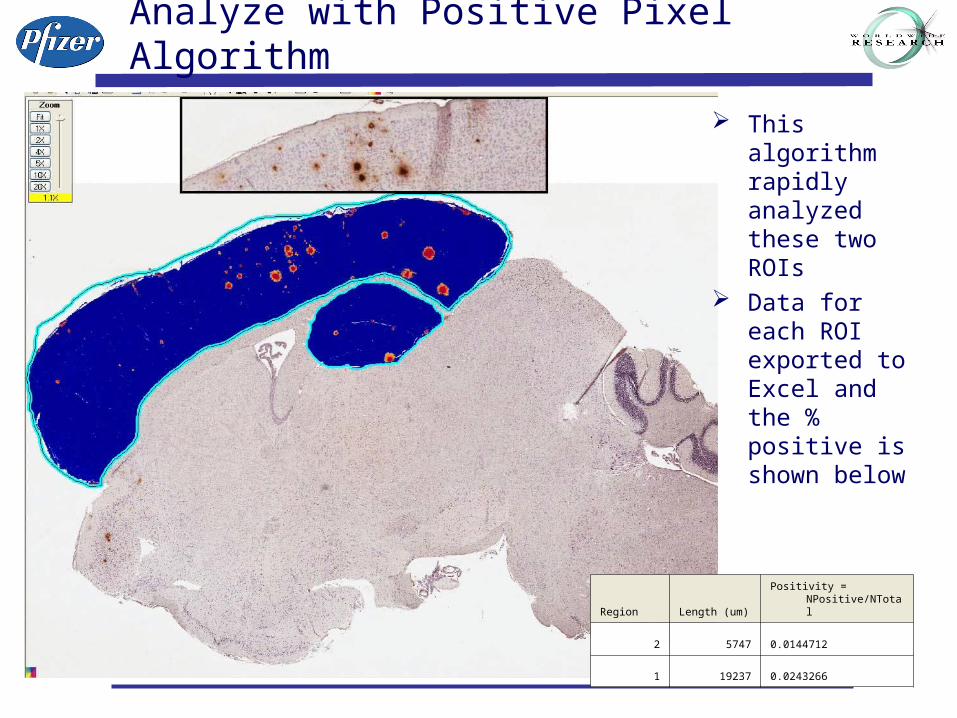
Analyze with Positive Pixel Algorithm
Region Length (um)
Positivity = NPositive/NTotal
2 5747 0.0144712
1 19237 0.0243266
This algorithm rapidly analyzed these two ROIs
Data for each ROI exported to Excel and the % positive is shown below
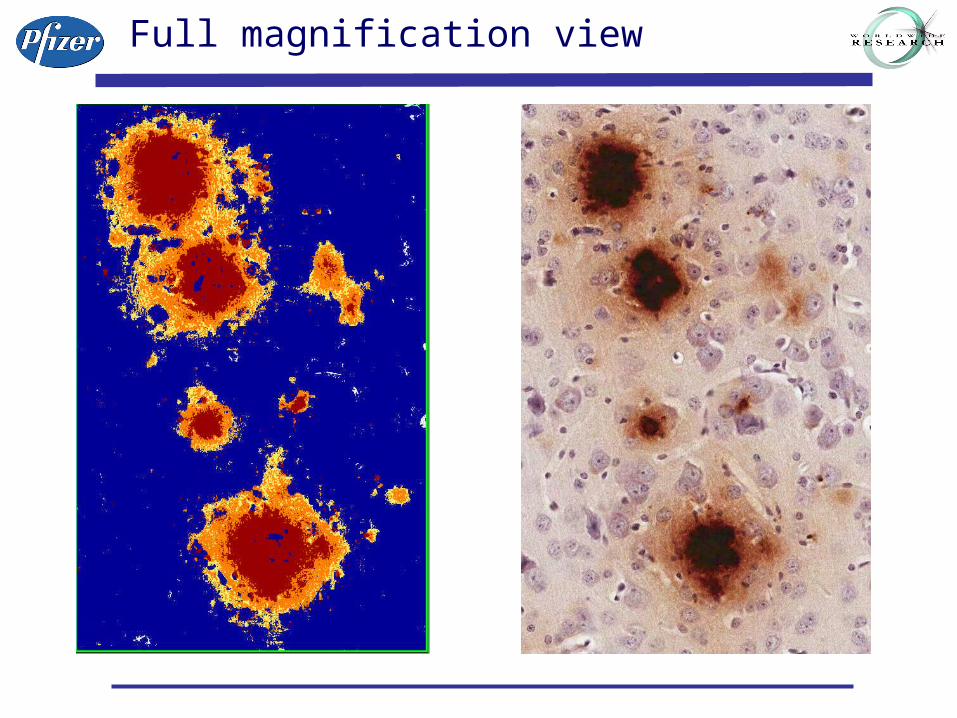
Full magnification view
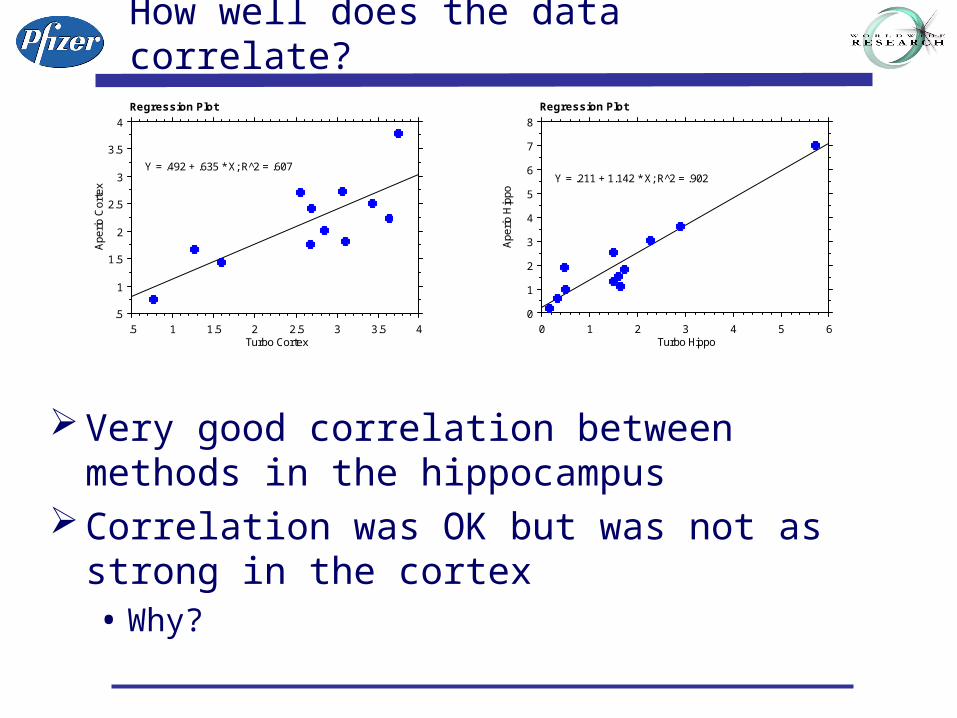
How well does the data correlate?
Very good correlation between methods in the hippocampus
Correlation was OK but was not as strong in the cortex• Why?
.5
1
1.5
2
2.5
3
3.5
4
Ape
rio C
orte
x
.5 1 1.5 2 2.5 3 3.5 4Turbo Cortex
Y = .492 + .635 * X; R^2 = .607
Regression Plot
0
1
2
3
4
5
6
7
8
Ape
rio H
ippo
0 1 2 3 4 5 6Turbo Hippo
Y = .211 + 1.142 * X; R^2 = .902
Regression Plot
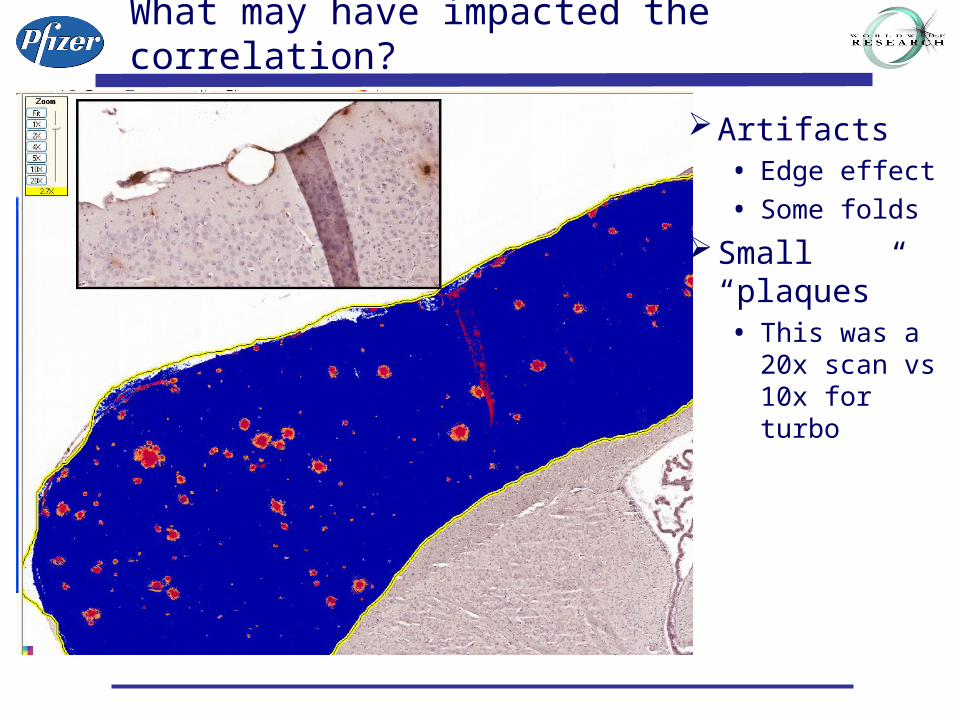
What may have impacted the correlation?
Artifacts• Edge effect
• Some folds
Small “plaques”• This was a 20x
scan vs 10x for turbo
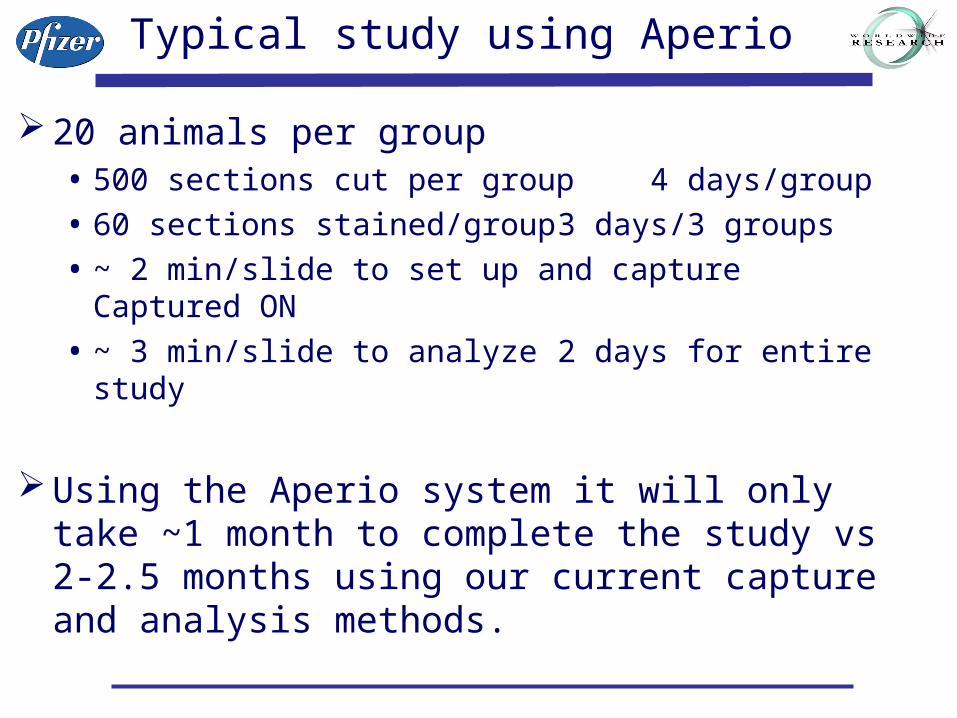
Typical study using Aperio
20 animals per group• 500 sections cut per group 4 days/group
• 60 sections stained/group 3 days/3 groups
• ~ 2 min/slide to set up and capture Captured ON
• ~ 3 min/slide to analyze 2 days for entire study
Using the Aperio system it will only take ~1 month to complete the study vs 2-2.5 months using our current capture and analysis methods.
Acknowledgements
Pfizer Aperio
Tom Kawabe Steve Potts
Barbara Tate
Tom Lanz
Diane Stephenson
Recommended


![,,DRINA OSIGURANIE AD MILICI Brol 46/2014 Datum, 17. 09. osiguranja/UO-46-18 Usl za... · [4] Ako je protiv osiguranika, odnosno korisnika, pokrenut prekrsajni ili drugi postupak](https://img.pdfslide.net/doc/110x75/5e10e7b479eadc0ef23955e9/drina-osiguranie-ad-milici-brol-462014-datum-17-09-osiguranjauo-46-18-usl.jpg)