COMPUTER APPLICATIONS
Computer-aided detection of pulmonary nodules: a comparativestudy using the public LIDC/IDRI database
Colin Jacobs1 & Eva M. van Rikxoort1,2 & Keelin Murphy4 & Mathias Prokop1&
Cornelia M. Schaefer-Prokop1,3& Bram van Ginneken1,2
Received: 12 June 2015 /Revised: 20 July 2015 /Accepted: 14 September 2015 /Published online: 6 October 2015# The Author(s) 2015. This article is published with open access at Springerlink.com
AbstractObjectives To benchmark the performance of state-of-the-artcomputer-aided detection (CAD) of pulmonary nodules usingthe largest publicly available annotated CT database(LIDC/IDRI), and to show that CAD finds lesions not identi-fied by the LIDC’s four-fold double reading process.Methods The LIDC/IDRI database contains 888 thoracic CTscans with a section thickness of 2.5 mm or lower. We reportperformance of two commercial and one academic CAD sys-tem. The influence of presence of contrast, section thickness,and reconstruction kernel on CAD performance was assessed.Four radiologists independently analyzed the false positiveCAD marks of the best CAD system.Results The updated commercial CAD system showed the bestperformance with a sensitivity of 82 % at an average of 3.1 falsepositive detections per scan. Forty-five false positive CADmarkswere scored as nodules by all four radiologists in our study.Conclusions On the largest publicly available reference data-base for lung nodule detection in chest CT, the updated com-mercial CAD system locates the vast majority of pulmonarynodules at a low false positive rate. Potential for CAD is sub-stantiated by the fact that it identifies pulmonary nodules that
were not marked during the extensive four-fold LIDC anno-tation process.Key Points• CAD systems should be validated on public, heterogeneousdatabases.
• The LIDC/IDRI database is an excellent database forbenchmarking nodule CAD.
•CAD can identify the majority of pulmonary nodules at a lowfalse positive rate.
• CAD can identify nodules missed by an extensive two-stageannotation process.
Keywords Computer-assisted diagnosis . Imageinterpretation, computer-assisted . Lung cancer . Solitarypulmonary nodule . Lung
AbbreviationsCAD Computer-aided detectionCT Computed tomographyLIDC Lung image database consortiumIDRI Image database resource initiative
Introduction
The last two decades have shown substantial research intocomputer-aided detection (CAD) of pulmonary nodules inthoracic computed tomography (CT) scans [1, 2]. Althoughmany academic and several commercial CAD algorithmshave been developed, CAD for lung nodules is still not com-monly used in daily clinical practice. Possible explanations forthis are a lack of reimbursement, technical impediments tointegration into PACS systems, but also low sensitivity andhigh false positive rates. The recent positive results of the
* Colin [email protected]
1 Diagnostic Image Analysis Group, Department of Radiology andNuclear Medicine, Radboud University Medical Center, GeertGrooteplein 10, 6525 GA, Nijmegen, The Netherlands
2 Fraunhofer MEVIS, Bremen, Germany3 Department of Radiology, Meander Medical Center,
Amersfoort, The Netherlands4 Irish Centre for Fetal and Neonatal Translational Research,
University College Cork, Cork, Ireland
Eur Radiol (2016) 26:2139–2147DOI 10.1007/s00330-015-4030-7
NLST lung cancer screening trial [3] and the subsequent de-velopments towards implementation of lung cancer screeningin the United States [4, 5] have renewed the interest into CADfor pulmonary nodules. If lung cancer screening will be im-plemented on a large scale, the burden on radiologists will besubstantial and CAD could play an important role in reducingreading time and thereby improving cost-effectiveness [6, 7].
Following the general demand for open and reproduciblescience, public databases have been established to facilitateobjective measures of CAD performance, and to move CADdevelopment to a next level [8–10]. In 2011, the completeLIDC/IDRI (Lung Image Database Consortium / Image Da-tabase Resource Initiative) database was released [10]. Thisdataset provides by far the largest public resource to assess theperformance of algorithms for the detection of pulmonarynodules in thoracic CT scans. A large effort has gone intothe collection of annotations on these cases, but CAD wasnot used to assist the readers [10].
In this paper, we apply two commercial and one state-of-the-art academic nodule detection systems on the LIDC/IDRIdatabase with the aim to set a first benchmark performance onthe full database. To our knowledge, this is the first paper,which reports the performance of CAD systems on the fullLIDC/IDRI database. We performed an extensive analysis ofthe performance of the applied CAD systems and make ourevaluation publicly available so that other CAD developerscan compare with this benchmark. Furthermore, we hypothe-size that CAD can find lesions, which were not detected in theextensive LIDC annotation process consisting of a blindedand unblinded review by four radiologists. To investigate thelatter, we evaluated the false positives of the best CAD systemusing a similar reading protocol as had been used in LIDC.
Materials and methods
Data
This study used the LIDC/IDRI data set [10], consisting of 1,018 helical thoracic CT scans collected retrospectively fromseven academic centres. Nine cases with inconsistent slicespacing or missing slices were excluded. In addition, 121CT scans, which had a section thickness of 3 mm and higher,were excluded since thick section data is not optimal for CADanalysis. This resulted in 888 CT cases available for evalua-tion. In Tables 1, 2, and 3, the characteristics of the input dataare shown.
LIDC/IDRI image annotation
The LIDC/IDRI employed a two-phase image annotation pro-cess [10]. In the first phase (the blind phase), four radiologistsindependently reviewed all cases. In the second phase (the
unblinded phase), all annotations of the other three radiolo-gists were made available and each radiologist independentlyreviewed their marks along with the anonymized marks oftheir colleagues. Findings were annotated and categorized intonodule≥3 mm, nodule<3 mm, or non-nodule. Non-nodulemarks were used to indicate abnormalities in the scan, whichwere not considered a nodule. Using this two-phase process,the LIDC investigators aimed to identify as completely aspossible all lung nodules, without forcing consensus amongthe readers. More details about the annotation process can befound in [10]. An XML file with the annotations is publiclyavailable for every case.
Nodule selection and purpose
In this study, we included all annotations available in the XMLfiles for the 888 scans. The focus of this study was on the
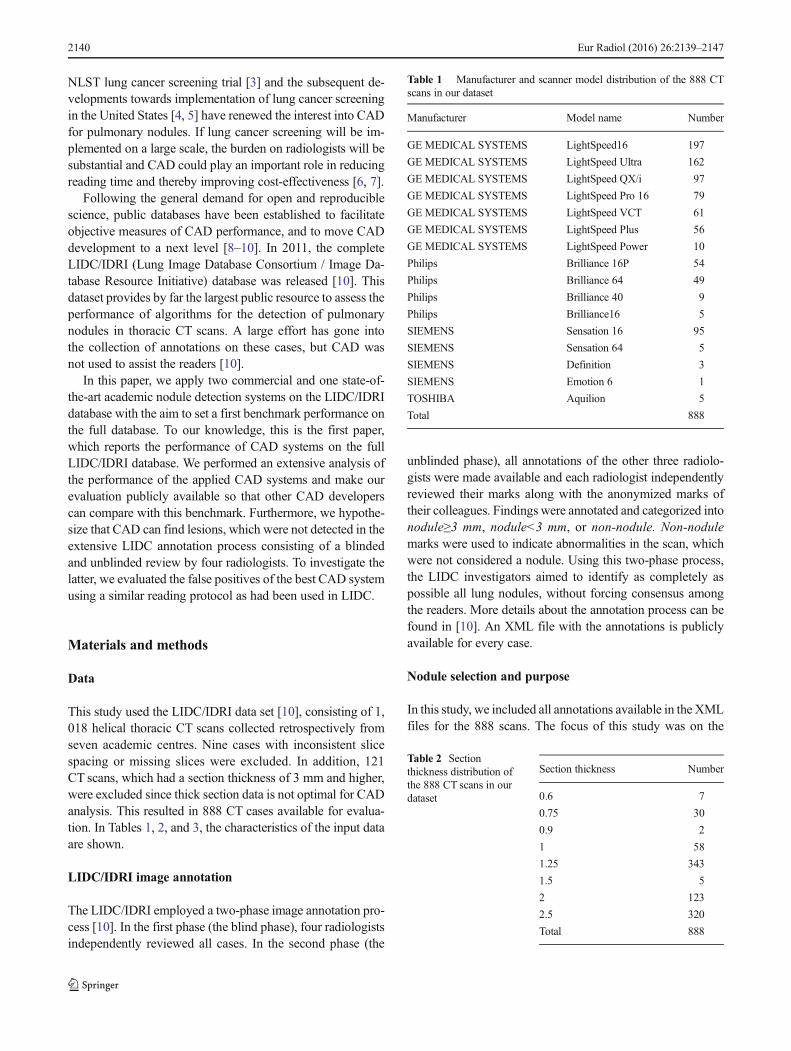
Table 1 Manufacturer and scanner model distribution of the 888 CTscans in our dataset
Manufacturer Model name Number
GE MEDICAL SYSTEMS LightSpeed16 197
GE MEDICAL SYSTEMS LightSpeed Ultra 162
GE MEDICAL SYSTEMS LightSpeed QX/i 97
GE MEDICAL SYSTEMS LightSpeed Pro 16 79
GE MEDICAL SYSTEMS LightSpeed VCT 61
GE MEDICAL SYSTEMS LightSpeed Plus 56
GE MEDICAL SYSTEMS LightSpeed Power 10
Philips Brilliance 16P 54
Philips Brilliance 64 49
Philips Brilliance 40 9
Philips Brilliance16 5
SIEMENS Sensation 16 95
SIEMENS Sensation 64 5
SIEMENS Definition 3
SIEMENS Emotion 6 1
TOSHIBA Aquilion 5
Total 888
Table 2 Sectionthickness distribution ofthe 888 CT scans in ourdataset
Section thickness Number
0.6 7
0.75 30
0.9 2
1 58
1.25 343
1.5 5
2 123
2.5 320
Total 888
2140 Eur Radiol (2016) 26:2139–2147
nodule≥3 mm group. As a result of the LIDC/IDRI imageannotation process, each nodule≥3 mm had been annotatedby one, two, three, or four radiologists. In total, the data setof this study included 777 locations, which were marked asnodule≥3 mm by all four radiologists. The 777 nodule≥3 mmannotations marked by all four radiologists can be categorizedby size as follows: 22 nodules <4 mm, 228 nodules 4–6 mm,199 nodules 6–8mm, and 328 nodules >8mm. The number ofnodules per scan ranged between 1 and 8.
The purpose of this study was twofold. First, we aimed toassess the performance of three state-of-the-art nodule CAD
systems. Secondly, we performed an observer experiment toinvestigate whether CAD can find additional lesions, missedduring the extensive LIDC annotation process.
CAD systems
Three CAD systems were used: a commercial CAD sys-tem Visia (MeVis Medical Solutions AG, Bremen, Ger-many), a commercial prototype CAD system Herakles(MeVis Medical Solutions AG, Bremen, Germany), andan academic nodule CAD system ISICAD (Utrecht Med-ical Center, Utrecht, the Netherlands) [11]. ISICAD wasthe leading academic CAD system in the ANODE09nodule detection challenge [9]. For all three CAD sys-tems, a list of candidate marks per CT scan was obtain-ed. Each CAD candidate is described by a 3D location.Additionally, Herakles and ISICAD also provide a CADscore per CAD candidate. The CAD score is the outputof the internal classification scheme of the CAD systemand is a measure of the likelihood that a candidate is apulmonary nodule. An internal threshold on the CADscores determines which candidates are active CADmarks and, hence, will be shown to the user, and whichcandidates are not shown. Since different thresholds canbe applied on the CAD score, a CAD system can havemultiple operating points. A low threshold generatesmore CAD marks, thereby typically increasing sensitiv-ity at the cost of more false positive detections. A highthreshold will generate less false positives but may re-duce the sensitivity of a CAD system. For all threeCAD systems, one fixed operating point is internallyset which we will refer to as the system operating point.
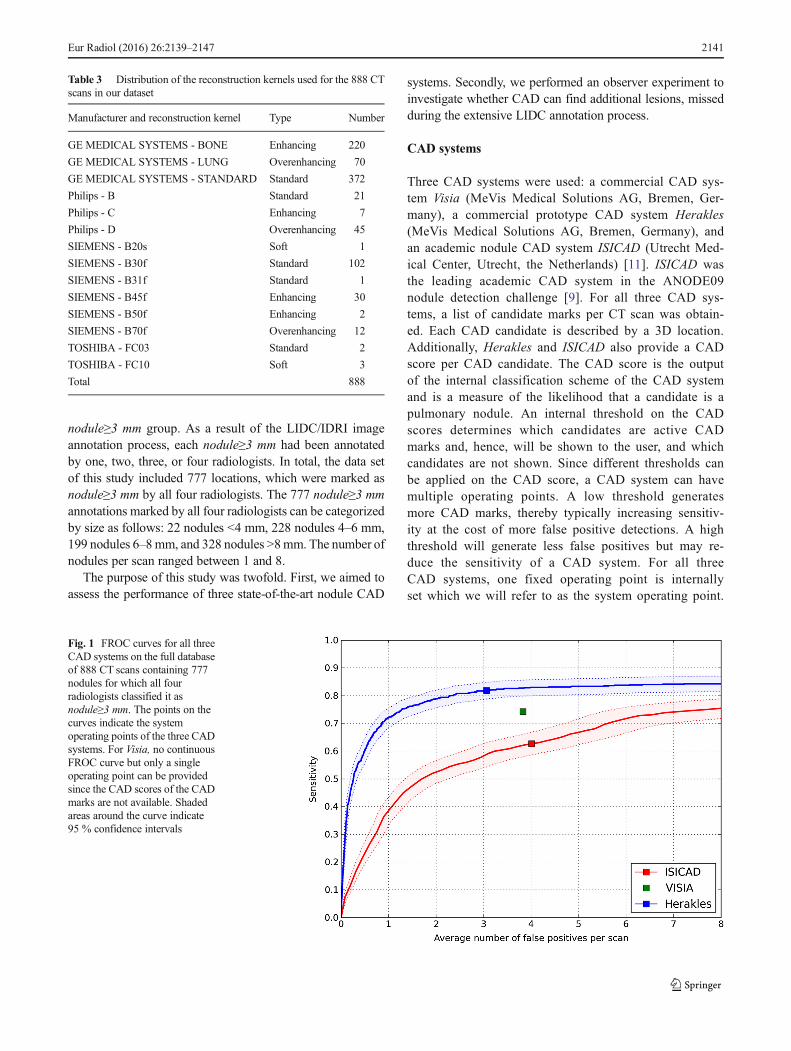
Fig. 1 FROC curves for all threeCAD systems on the full databaseof 888 CT scans containing 777nodules for which all fourradiologists classified it asnodule≥3 mm. The points on thecurves indicate the systemoperating points of the three CADsystems. For Visia, no continuousFROC curve but only a singleoperating point can be providedsince the CAD scores of the CADmarks are not available. Shadedareas around the curve indicate95 % confidence intervals
Table 3 Distribution of the reconstruction kernels used for the 888 CTscans in our dataset
Manufacturer and reconstruction kernel Type Number
GE MEDICAL SYSTEMS - BONE Enhancing 220
GE MEDICAL SYSTEMS - LUNG Overenhancing 70
GE MEDICAL SYSTEMS - STANDARD Standard 372
Philips - B Standard 21
Philips - C Enhancing 7
Philips - D Overenhancing 45
SIEMENS - B20s Soft 1
SIEMENS - B30f Standard 102
SIEMENS - B31f Standard 1
SIEMENS - B45f Enhancing 30
SIEMENS - B50f Enhancing 2
SIEMENS - B70f Overenhancing 12
TOSHIBA - FC03 Standard 2
TOSHIBA - FC10 Soft 3
Total 888
Eur Radiol (2016) 26:2139–2147 2141
Evaluation
The performance of the CAD systems was analyzed on the setof 777 nodules annotated by 4/4 radiologists as anodule≥3 mm. We employed free-response operating charac-teristic (FROC) analysis [12] where detection sensitivity isplotted against the average number of false positive detectionsper scan. Confidence intervals were estimated usingbootstrapping with 5,000 iterations [13]. If a CAD systemmarked locations which were annotated by three or fewerradiologists as nodule≥3 mm, as nodule<3 mm, and as non-nodules, these CAD marks were counted as false positives.For Visia, no CAD scores were available for the CAD candi-dates. Consequently, only one operating point and not a fullFROC curve could be generated for Visia.
To gain more insight into which type of nodules weremissed by CAD, we looked at the characteristics, as scoredby the LIDC readers, for all nodule≥3 mm findings, of thefalse negatives. We defined subsolid nodules as nodules forwhich the majority of the radiologists gave a texture scoresmaller than 5 (1=ground-glass/non-solid, 3=part-solid,5=solid). Subtle nodules were defined as nodules for whichthe majority of the radiologists gave a subtlety score smaller orequal than 3 (1=extremely subtle, 5=obvious).
To assess the robustness of the CAD algorithms, we alsoevaluated the CAD results on different subsets of the data. TheLIDC-IDRI data set is a heterogeneous set of CT scans andCAD algorithms that could conceivably exhibit a differentperformance on different types of data. We analyzed the fol-lowing factors: (1) presence of contrast material, i.e., non-
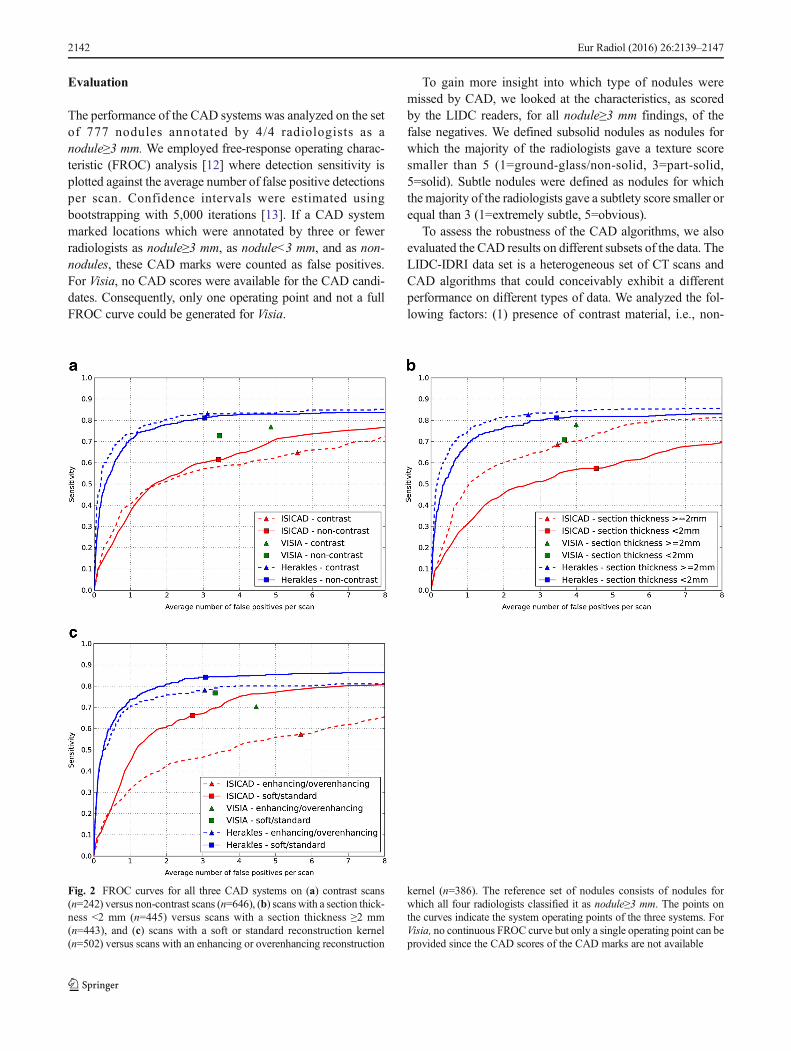
Fig. 2 FROC curves for all three CAD systems on (a) contrast scans(n=242) versus non-contrast scans (n=646), (b) scans with a section thick-ness <2 mm (n=445) versus scans with a section thickness ≥2 mm(n=443), and (c) scans with a soft or standard reconstruction kernel(n=502) versus scans with an enhancing or overenhancing reconstruction
kernel (n=386). The reference set of nodules consists of nodules forwhich all four radiologists classified it as nodule≥3 mm. The points onthe curves indicate the system operating points of the three systems. ForVisia, no continuous FROC curve but only a single operating point can beprovided since the CAD scores of the CAD marks are not available
2142 Eur Radiol (2016) 26:2139–2147
contrast versus contrast enhanced scans, (2) section thickness,i.e., cases with section thickness <2 mm versus section thick-ness ≥2 mm, and (3) reconstruction kernel, i.e., soft/standardversus enhancing/overenhancing kernels.
Observer study
In order to evaluate whether CAD can find lesions missedduring the extensive annotation process of the LIDC/IDRIdatabase, we considered the CAD marks of the best CADalgorithm , which were counted as false positives at itssystem operating point. Two conditions were differentiat-ed: the location of the CAD mark had in fact been markedin the LIDC annotation process, but not by all fourreaders as nodule≥3 mm as warranted for being countedas a true positive. The second condition comprised thoseCAD marks that had no corresponding LIDC marks at all.The CAD marks corresponding to the first condition canbe subdivided according to the LIDC readings. The latterCAD marks were independently inspected by four chestradiologists, since these are potentially nodulesoverlooked by all four LIDC readers. Thus, we mimicthe original LIDC annotation process as though CADhad been included as another independent reader in thefirst phase of the image annotation process. CAD markswere categorized as nodule≥3 mm, nodule<3 mm, non-nodules, or false positive. Electronic measurement toolswere available to measure size. To reduce the workloadfor the radiologists, a research scientist (5 years experi-ence in nodule CAD research) first removed the markswhich were obviously not a nodule. CAD marks whichwere marked as nodule>3 mm by all four radiologists in
our study were independently evaluated by an experi-enced radiologist that scored subtlety, location, type, andattachment to other structures. Subtlety was scored on afive-point scale (1=extremely subtle, 5=obvious).
Results
Comparative CAD performance
The performance of the three CAD systems is depicted inFig. 1. From the FROC curves it is evident that Heraklesperformed best. The system performances were significantlydifferent (p<0.001). At its system operating point, Heraklesreached a sensitivity of 82 % at an average of 3.1 false posi-tives per scan for nodules all four LIDC readers had agreed on.
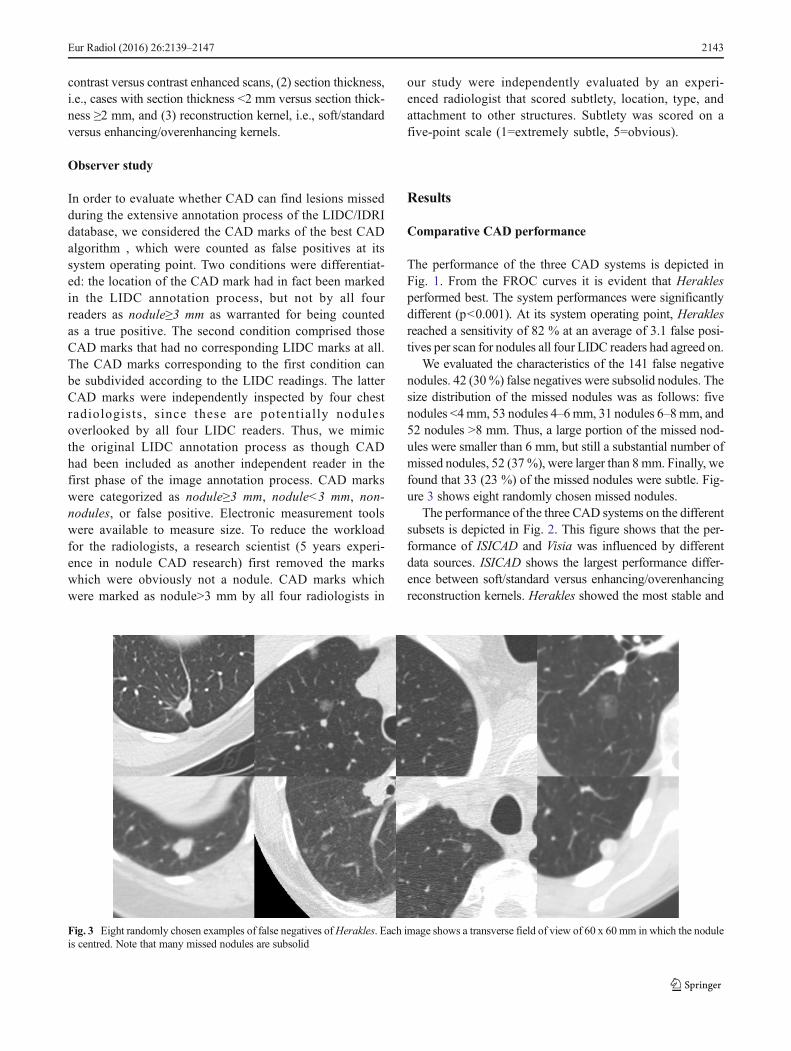
We evaluated the characteristics of the 141 false negativenodules. 42 (30%) false negatives were subsolid nodules. Thesize distribution of the missed nodules was as follows: fivenodules <4mm, 53 nodules 4–6mm, 31 nodules 6–8mm, and52 nodules >8 mm. Thus, a large portion of the missed nod-ules were smaller than 6 mm, but still a substantial number ofmissed nodules, 52 (37%), were larger than 8 mm. Finally, wefound that 33 (23 %) of the missed nodules were subtle. Fig-ure 3 shows eight randomly chosen missed nodules.
The performance of the three CAD systems on the differentsubsets is depicted in Fig. 2. This figure shows that the per-formance of ISICAD and Visia was influenced by differentdata sources. ISICAD shows the largest performance differ-ence between soft/standard versus enhancing/overenhancingreconstruction kernels. Herakles showed the most stable and
Fig. 3 Eight randomly chosen examples of false negatives ofHerakles. Each image shows a transverse field of view of 60 x 60 mm in which the noduleis centred. Note that many missed nodules are subsolid
Eur Radiol (2016) 26:2139–2147 2143
robust performance for all different data sources and consis-tently outperformed the other two CAD systems.
We categorized the CAD marks of Herakles, which werecounted as false positives at its system operating point. Intotal, there were 2,720 false positive CAD marks in the 888cases (Table 4). The majority of the CAD marks, 1,612 out of2,720 (59 %), had at least one corresponding mark from theLIDC readers. These CAD marks can be further categorizedinto marks on annotations marked as nodule≥3 mm by threeout of four radiologists, two out of four radiologists, one out offour radiologists; and annotations marked as nodule<3 mm byat least one radiologist (and, hence, no nodule≥3 mm annota-tions); and finally annotations marked as non-nodule by atleast one out of four radiologists (and, hence, no nodule≥3 mmor nodule<3 mm annotations). Table 4 shows how the CADmarks were further split out into these categories. The remain-ing 1,108 false positive CAD marks had no correspondingmark from the LIDC readers.
Observer study results
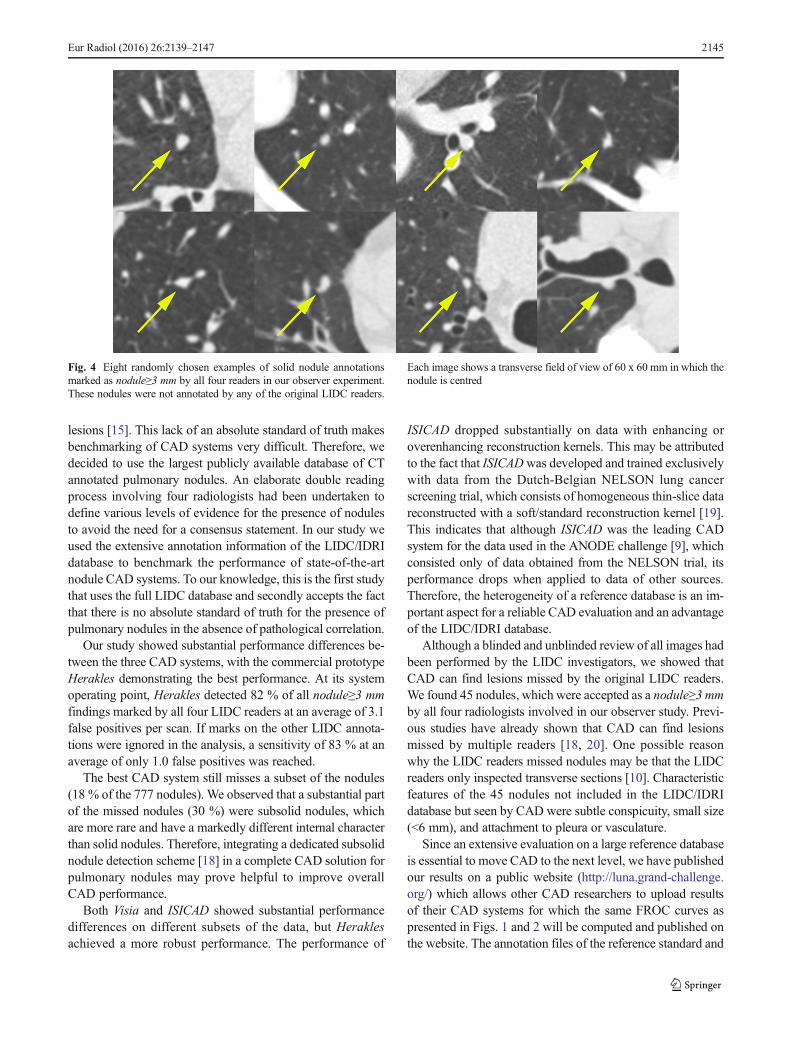
In our observer experiment, we focused on these 1,108 falsepositive CAD marks of Herakles, which had no correspond-ing mark from any of the LIDC readers. These are locations,which were potentially overlooked by all four LIDC readers.After CAD marks, which were obviously not a nodule hadbeen removed by the research scientist, 269 CAD marks wereleft for analysis by the four radiologists. Common sources offalse positive detections removed by the research scientistincluded fissure thickening at the chest wall, vessel bifurca-tions and (micro-)atelectasis. Table 5 depicts how each of theobservers scored these 269 CAD marks. In total, 45 CADmarks were considered to be a nodule≥3 mm by all four radi-ologists; 177 CAD marks were considered to be anodule≥3 mm by at least one of the radiologists. The sizedistribution of the 45 CAD marks was as follows: nine nod-ules <4 mm, 27 nodules 4-6 mm, seven nodules 6-8 mm, andtwo nodules >8 mm. Subtlety was scored lower or equal than3 for 32 (71 %) nodules. Location was scored as central for 11nodules, peripheral for 11 nodules, and in-between for 23nodules. Nodule type was scored as follows: 32 solid, 2ground-glass, 1 part-solid, and 10 calcified. Vascular, pleuralor fissural attachment was found for 18 (40 %) nodules. Fig-ure 4 shows eight randomly chosen examples of CAD marks,which were considered a nodule≥3 mm by all four radiologistsand were scored as solid. In addition, 169 marks were consid-ered a nodule≥ 3 mm or a nodule<3 mm by all four radiolo-gists; 250 marks were considered a nodule≥3 mm or anodule<3 mm by at least one of the radiologists. Thus, follow-ing the reference of the 4-reader agreement and adding these45 CADmarks to the set of nodules, the updated performanceof Herakles at its system operating point would reach a sen-sitivity of 83 % at an average of 3.0 false positive detections
per scan. In this FROC analysis, CAD marks on locationsmarked as nodule≥3 mm by three out of four radiologists,two out of four radiologist, one out of four radiologists, or asnodule<3 mm by at least one radiologist were counted as falsepositives. Evidently, one could argue whether CAD marks onthese locations should be counted as false positives or not. IfCAD marks on these locations were not to be counted as falsepositives but ignored in the FROC analysis, a performance of83 % sensitivity at an average of only 1.0 false positives perscan would be reached.
Discussion
Though clear definitions are available for what represents apulmonary nodule (Fleischner Glossary [14]), the literaturelists a number of publications demonstrating the lack of ob-server agreement of what indeed represents a pulmonary nod-ule [15–17]. Not surprisingly this effect is larger for small
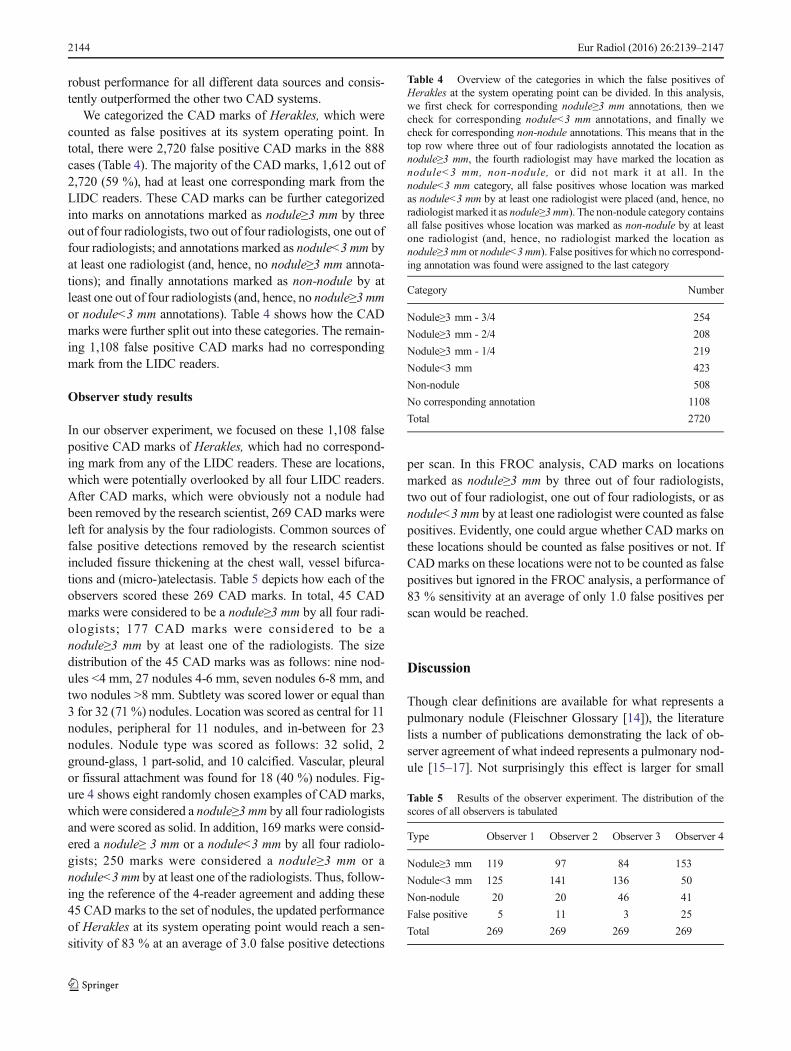
Table 4 Overview of the categories in which the false positives ofHerakles at the system operating point can be divided. In this analysis,we first check for corresponding nodule≥3 mm annotations, then wecheck for corresponding nodule<3 mm annotations, and finally wecheck for corresponding non-nodule annotations. This means that in thetop row where three out of four radiologists annotated the location asnodule≥3 mm, the fourth radiologist may have marked the location asnodule<3 mm, non-nodule, or did not mark it at all. In thenodule<3 mm category, all false positives whose location was markedas nodule<3 mm by at least one radiologist were placed (and, hence, noradiologist marked it as nodule≥3 mm). The non-nodule category containsall false positives whose location was marked as non-nodule by at leastone radiologist (and, hence, no radiologist marked the location asnodule≥3 mm or nodule<3mm). False positives for which no correspond-ing annotation was found were assigned to the last category
Category Number
Nodule≥3 mm - 3/4 254
Nodule≥3 mm - 2/4 208
Nodule≥3 mm - 1/4 219
Nodule<3 mm 423
Non-nodule 508
No corresponding annotation 1108
Total 2720
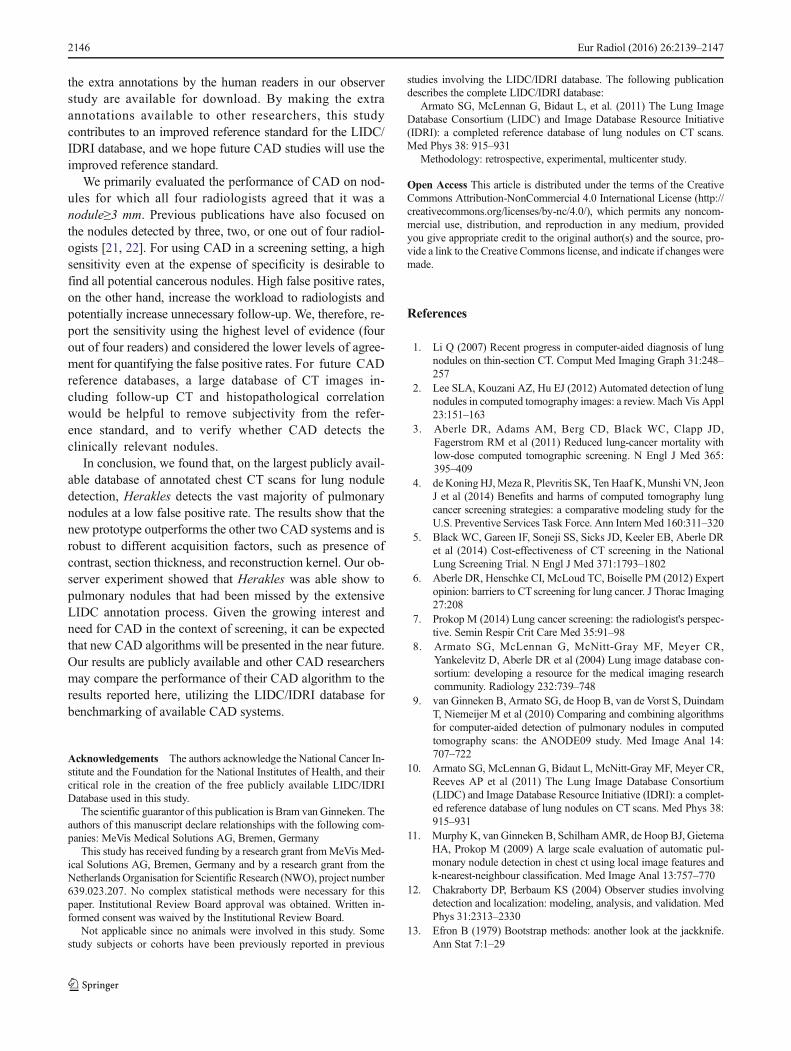
Table 5 Results of the observer experiment. The distribution of thescores of all observers is tabulated
Type Observer 1 Observer 2 Observer 3 Observer 4
Nodule≥3 mm 119 97 84 153
Nodule<3 mm 125 141 136 50
Non-nodule 20 20 46 41
False positive 5 11 3 25
Total 269 269 269 269
2144 Eur Radiol (2016) 26:2139–2147
lesions [15]. This lack of an absolute standard of truth makesbenchmarking of CAD systems very difficult. Therefore, wedecided to use the largest publicly available database of CTannotated pulmonary nodules. An elaborate double readingprocess involving four radiologists had been undertaken todefine various levels of evidence for the presence of nodulesto avoid the need for a consensus statement. In our study weused the extensive annotation information of the LIDC/IDRIdatabase to benchmark the performance of state-of-the-artnodule CAD systems. To our knowledge, this is the first studythat uses the full LIDC database and secondly accepts the factthat there is no absolute standard of truth for the presence ofpulmonary nodules in the absence of pathological correlation.
Our study showed substantial performance differences be-tween the three CAD systems, with the commercial prototypeHerakles demonstrating the best performance. At its systemoperating point, Herakles detected 82 % of all nodule≥3 mmfindings marked by all four LIDC readers at an average of 3.1false positives per scan. If marks on the other LIDC annota-tions were ignored in the analysis, a sensitivity of 83 % at anaverage of only 1.0 false positives was reached.
The best CAD system still misses a subset of the nodules(18 % of the 777 nodules). We observed that a substantial partof the missed nodules (30 %) were subsolid nodules, whichare more rare and have a markedly different internal characterthan solid nodules. Therefore, integrating a dedicated subsolidnodule detection scheme [18] in a complete CAD solution forpulmonary nodules may prove helpful to improve overallCAD performance.
Both Visia and ISICAD showed substantial performancedifferences on different subsets of the data, but Heraklesachieved a more robust performance. The performance of
ISICAD dropped substantially on data with enhancing oroverenhancing reconstruction kernels. This may be attributedto the fact that ISICADwas developed and trained exclusivelywith data from the Dutch-Belgian NELSON lung cancerscreening trial, which consists of homogeneous thin-slice datareconstructed with a soft/standard reconstruction kernel [19].This indicates that although ISICAD was the leading CADsystem for the data used in the ANODE challenge [9], whichconsisted only of data obtained from the NELSON trial, itsperformance drops when applied to data of other sources.Therefore, the heterogeneity of a reference database is an im-portant aspect for a reliable CAD evaluation and an advantageof the LIDC/IDRI database.
Although a blinded and unblinded review of all images hadbeen performed by the LIDC investigators, we showed thatCAD can find lesions missed by the original LIDC readers.We found 45 nodules, which were accepted as a nodule≥3 mmby all four radiologists involved in our observer study. Previ-ous studies have already shown that CAD can find lesionsmissed by multiple readers [18, 20]. One possible reasonwhy the LIDC readers missed nodules may be that the LIDCreaders only inspected transverse sections [10]. Characteristicfeatures of the 45 nodules not included in the LIDC/IDRIdatabase but seen by CAD were subtle conspicuity, small size(<6 mm), and attachment to pleura or vasculature.
Since an extensive evaluation on a large reference databaseis essential to move CAD to the next level, we have publishedour results on a public website (http://luna.grand-challenge.org/) which allows other CAD researchers to upload resultsof their CAD systems for which the same FROC curves aspresented in Figs. 1 and 2 will be computed and published onthe website. The annotation files of the reference standard and
Fig. 4 Eight randomly chosen examples of solid nodule annotationsmarked as nodule≥3 mm by all four readers in our observer experiment.These nodules were not annotated by any of the original LIDC readers.
Each image shows a transverse field of view of 60 x 60 mm in which thenodule is centred
Eur Radiol (2016) 26:2139–2147 2145
the extra annotations by the human readers in our observerstudy are available for download. By making the extraannotations available to other researchers, this studycontributes to an improved reference standard for the LIDC/IDRI database, and we hope future CAD studies will use theimproved reference standard.
We primarily evaluated the performance of CAD on nod-ules for which all four radiologists agreed that it was anodule≥3 mm. Previous publications have also focused onthe nodules detected by three, two, or one out of four radiol-ogists [21, 22]. For using CAD in a screening setting, a highsensitivity even at the expense of specificity is desirable tofind all potential cancerous nodules. High false positive rates,on the other hand, increase the workload to radiologists andpotentially increase unnecessary follow-up. We, therefore, re-port the sensitivity using the highest level of evidence (fourout of four readers) and considered the lower levels of agree-ment for quantifying the false positive rates. For future CADreference databases, a large database of CT images in-cluding follow-up CT and histopathological correlationwould be helpful to remove subjectivity from the refer-ence standard, and to verify whether CAD detects theclinically relevant nodules.
In conclusion, we found that, on the largest publicly avail-able database of annotated chest CT scans for lung noduledetection, Herakles detects the vast majority of pulmonarynodules at a low false positive rate. The results show that thenew prototype outperforms the other two CAD systems and isrobust to different acquisition factors, such as presence ofcontrast, section thickness, and reconstruction kernel. Our ob-server experiment showed that Herakles was able show topulmonary nodules that had been missed by the extensiveLIDC annotation process. Given the growing interest andneed for CAD in the context of screening, it can be expectedthat new CAD algorithms will be presented in the near future.Our results are publicly available and other CAD researchersmay compare the performance of their CAD algorithm to theresults reported here, utilizing the LIDC/IDRI database forbenchmarking of available CAD systems.
Acknowledgements The authors acknowledge the National Cancer In-stitute and the Foundation for the National Institutes of Health, and theircritical role in the creation of the free publicly available LIDC/IDRIDatabase used in this study.
The scientific guarantor of this publication is Bram van Ginneken. Theauthors of this manuscript declare relationships with the following com-panies: MeVis Medical Solutions AG, Bremen, Germany
This study has received funding by a research grant fromMeVis Med-ical Solutions AG, Bremen, Germany and by a research grant from theNetherlands Organisation for Scientific Research (NWO), project number639.023.207. No complex statistical methods were necessary for thispaper. Institutional Review Board approval was obtained. Written in-formed consent was waived by the Institutional Review Board.
Not applicable since no animals were involved in this study. Somestudy subjects or cohorts have been previously reported in previous
studies involving the LIDC/IDRI database. The following publicationdescribes the complete LIDC/IDRI database:
Armato SG, McLennan G, Bidaut L, et al. (2011) The Lung ImageDatabase Consortium (LIDC) and Image Database Resource Initiative(IDRI): a completed reference database of lung nodules on CT scans.Med Phys 38: 915–931
Methodology: retrospective, experimental, multicenter study.
Open Access This article is distributed under the terms of the CreativeCommons Attribution-NonCommercial 4.0 International License (http://creativecommons.org/licenses/by-nc/4.0/), which permits any noncom-mercial use, distribution, and reproduction in any medium, providedyou give appropriate credit to the original author(s) and the source, pro-vide a link to the Creative Commons license, and indicate if changes weremade.
References
1. Li Q (2007) Recent progress in computer-aided diagnosis of lungnodules on thin-section CT. Comput Med Imaging Graph 31:248–257
2. Lee SLA, Kouzani AZ, Hu EJ (2012) Automated detection of lungnodules in computed tomography images: a review. Mach Vis Appl23:151–163
3. Aberle DR, Adams AM, Berg CD, Black WC, Clapp JD,Fagerstrom RM et al (2011) Reduced lung-cancer mortality withlow-dose computed tomographic screening. N Engl J Med 365:395–409
4. deKoningHJ,Meza R, Plevritis SK, Ten Haaf K,Munshi VN, JeonJ et al (2014) Benefits and harms of computed tomography lungcancer screening strategies: a comparative modeling study for theU.S. Preventive Services Task Force. Ann InternMed 160:311–320
5. Black WC, Gareen IF, Soneji SS, Sicks JD, Keeler EB, Aberle DRet al (2014) Cost-effectiveness of CT screening in the NationalLung Screening Trial. N Engl J Med 371:1793–1802
6. Aberle DR, Henschke CI, McLoud TC, Boiselle PM (2012) Expertopinion: barriers to CTscreening for lung cancer. J Thorac Imaging27:208
7. Prokop M (2014) Lung cancer screening: the radiologist's perspec-tive. Semin Respir Crit Care Med 35:91–98
8. Armato SG, McLennan G, McNitt-Gray MF, Meyer CR,Yankelevitz D, Aberle DR et al (2004) Lung image database con-sortium: developing a resource for the medical imaging researchcommunity. Radiology 232:739–748
9. van Ginneken B, Armato SG, de Hoop B, van de Vorst S, DuindamT, Niemeijer M et al (2010) Comparing and combining algorithmsfor computer-aided detection of pulmonary nodules in computedtomography scans: the ANODE09 study. Med Image Anal 14:707–722
10. Armato SG, McLennan G, Bidaut L, McNitt-Gray MF, Meyer CR,Reeves AP et al (2011) The Lung Image Database Consortium(LIDC) and Image Database Resource Initiative (IDRI): a complet-ed reference database of lung nodules on CT scans. Med Phys 38:915–931
11. Murphy K, van Ginneken B, SchilhamAMR, de Hoop BJ, GietemaHA, Prokop M (2009) A large scale evaluation of automatic pul-monary nodule detection in chest ct using local image features andk-nearest-neighbour classification. Med Image Anal 13:757–770
12. Chakraborty DP, Berbaum KS (2004) Observer studies involvingdetection and localization: modeling, analysis, and validation. MedPhys 31:2313–2330
13. Efron B (1979) Bootstrap methods: another look at the jackknife.Ann Stat 7:1–29
2146 Eur Radiol (2016) 26:2139–2147
14. Hansell DM, Bankier AA, MacMahon H,McLoud TC,Müller NL,Remy J (2008) Fleischner society: glossary of terms for thoracicimaging. Radiology 246:697–722
15. Armato SG, Roberts RY, Kocherginsky M, Aberle DR, KazerooniEA, Macmahon H et al (2009) Assessment of radiologist perfor-mance in the detection of lung nodules: dependence on the defini-tion of Btruth^. Acad Radiol 16:28–38
16. Armato SG, McNitt-Gray MF, Reeves AP, Meyer CR, McLennanG, Aberle DR et al (2007) The Lung Image Database Consortium(LIDC): an evaluation of radiologist variability in the identificationof lung nodules on CT scans. Acad Radiol 14:1409–1421
17. Rubin GD, Lyo JK, Paik DS, Sherbondy AJ, Chow LC, Leung ANet al (2005) Pulmonary nodules on multi-detector row CT scans:performance comparison of radiologists and computer-aided detec-tion. Radiology 234:274–283
18. Jacobs C, van Rikxoort EM, Twellmann T, Scholten ET, de JongPA, Kuhnigk JM et al (2014) Automatic detection of subsolid
pulmonary nodules in thoracic computed tomography images.Med Image Anal 18:374–384
19. van Klaveren RJ, Oudkerk M, Prokop M, Scholten ET,Nackaerts K et al (2009) Management of lung nodules de-tected by volume CT scanning. N Engl J Med 361:2221–2222
20. Drew T, VoML, Olwal A, Jacobson F, Seltzer SE,Wolfe JM (2013)Scanners and drillers: characterizing expert visual search throughvolumetric images. J Vis 13:1–13
21. Camarlinghi N (2013) Automatic detection of lung nodulesin computed tomography images: training and validation ofalgorithms using public research databases. Eur Phys J Plus128:1–21
22. Tan M, Deklerck R, Cornelis J, Jansen B (2013) Phased searchingwith NEAT in a time-scaled framework: experiments on acomputer-aided detection system for lung nodules. Artif IntellMed 59:157–167
Eur Radiol (2016) 26:2139–2147 2147
Recommended