Congenital Malformations Registry Congenital Malformations Registry Monitoring for Changes in Birth Defects PrevalenceMonitoring for Changes in Birth Defects Prevalence
NBDPN 10th Annual MeetingSan Antonio, TexasFebruary 4-7, 2007
Congenital Malformations RegistryCongenital Malformations RegistryBackground Background
•Established October, 1982
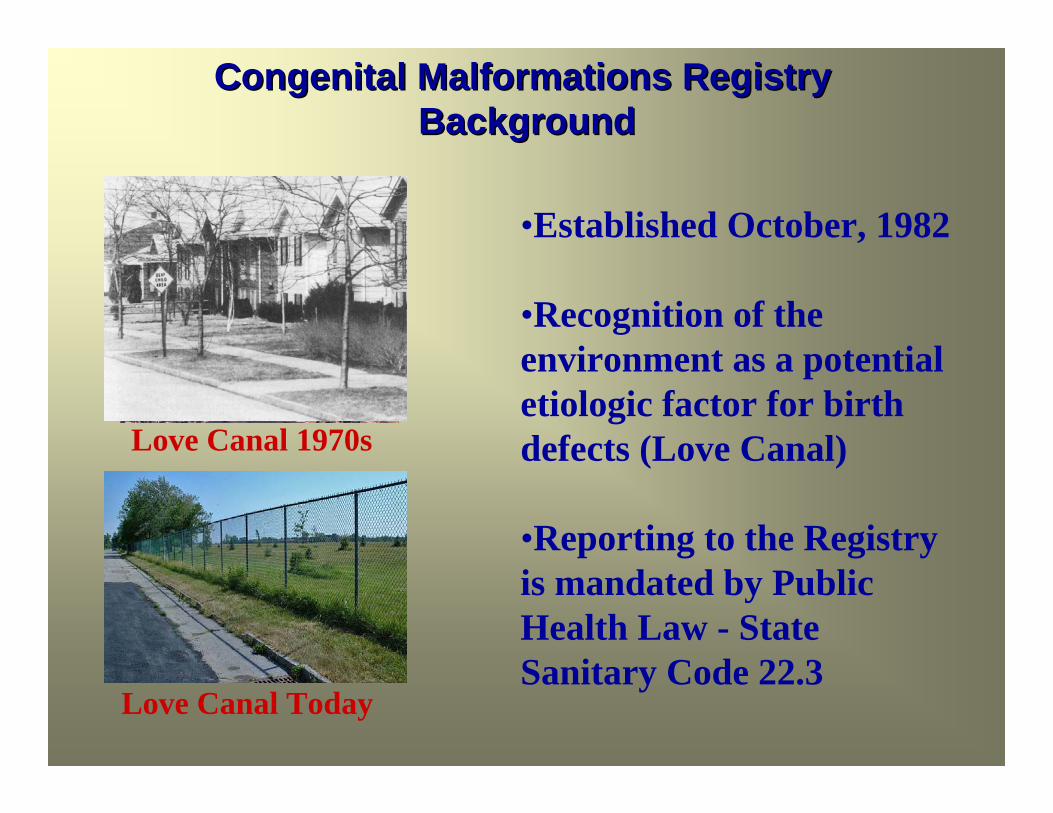
•Recognition of the environment as a potential etiologic factor for birth defects (Love Canal)
•Reporting to the Registry is mandated by Public Health Law - State Sanitary Code 22.3
Love Canal 1970s
Love Canal Today
Congenital Malformations RegistryCongenital Malformations RegistryBackgroundBackground
Population Coverage: Statewide approximately 260,000 to 300,000 births annually
Designed for surveillance, research & to provide data to health programs to aid in the development of needsassessment
Full time staff - 7.5Grant funded positions - 12
Congenital Malformations Registry Surveillance SystemCongenital Malformations Registry Surveillance System
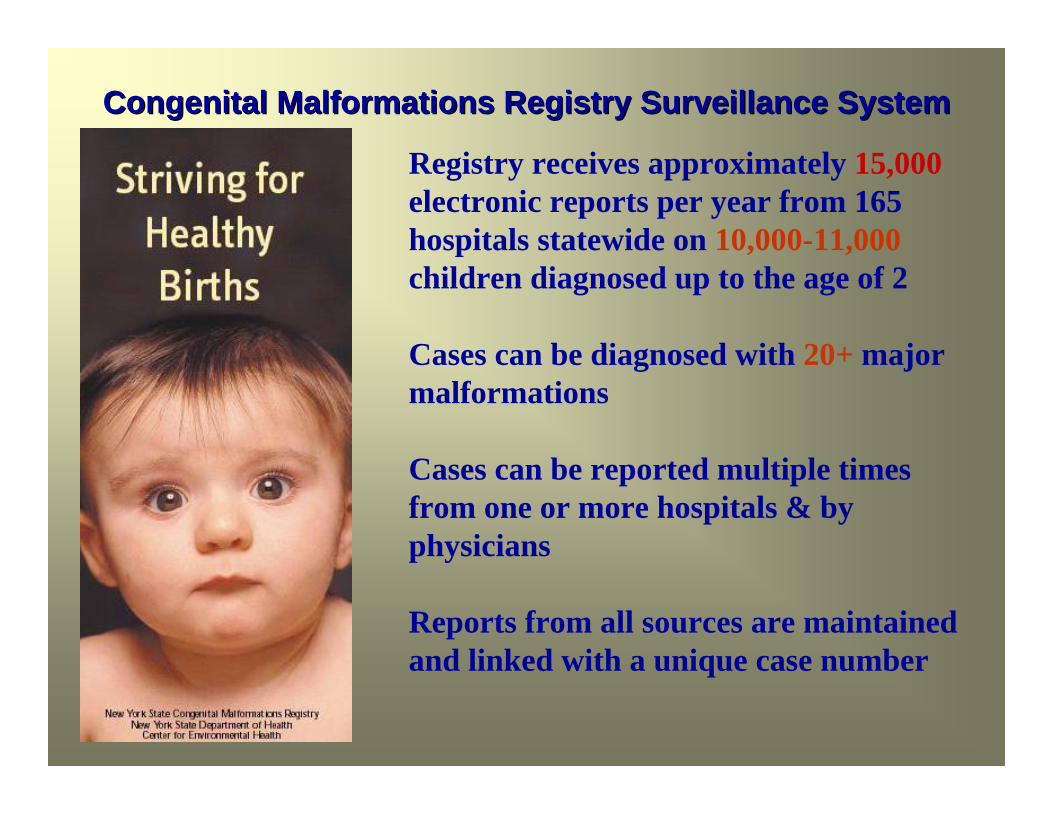
Registry receives approximately 15,000electronic reports per year from 165 hospitals statewide on 10,000-11,000children diagnosed up to the age of 2
Cases can be diagnosed with 20+ major malformations
Cases can be reported multiple times from one or more hospitals & by physicians
Reports from all sources are maintained and linked with a unique case number
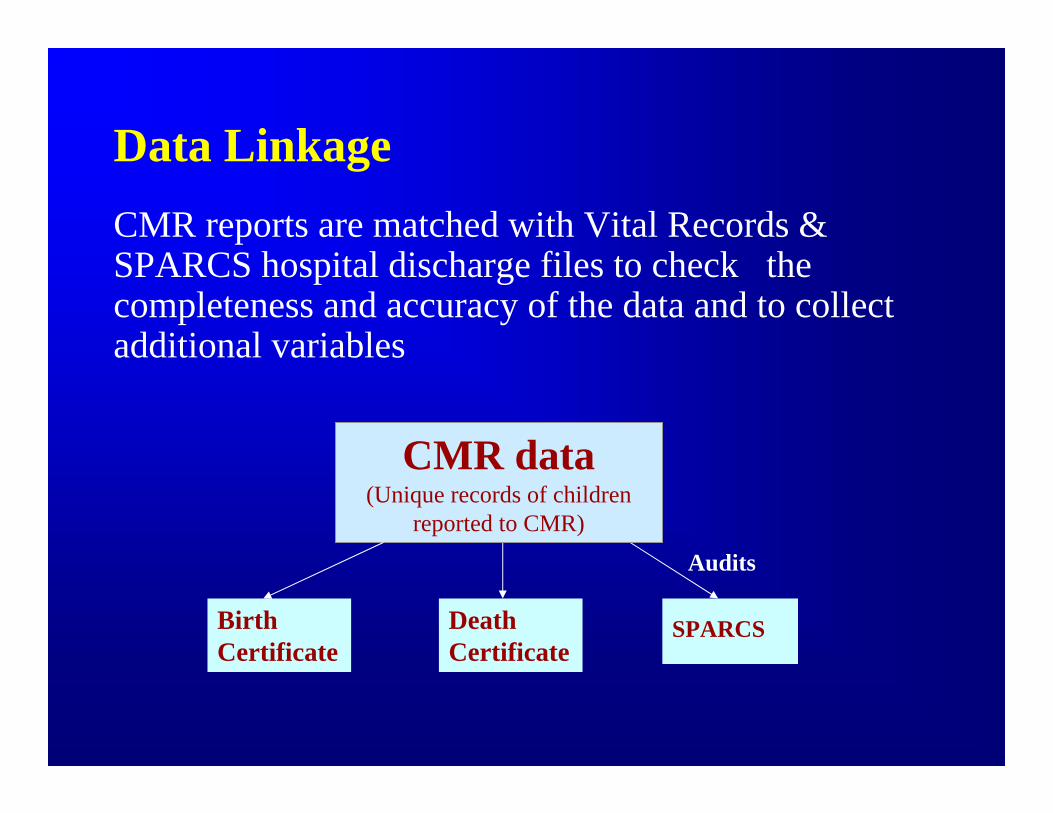
Data LinkageCMR reports are matched with Vital Records & SPARCS hospital discharge files to check the completeness and accuracy of the data and to collect additional variables
Birth Certificate
Death Certificate
CMR data(Unique records of children
reported to CMR)
SPARCS
Audits
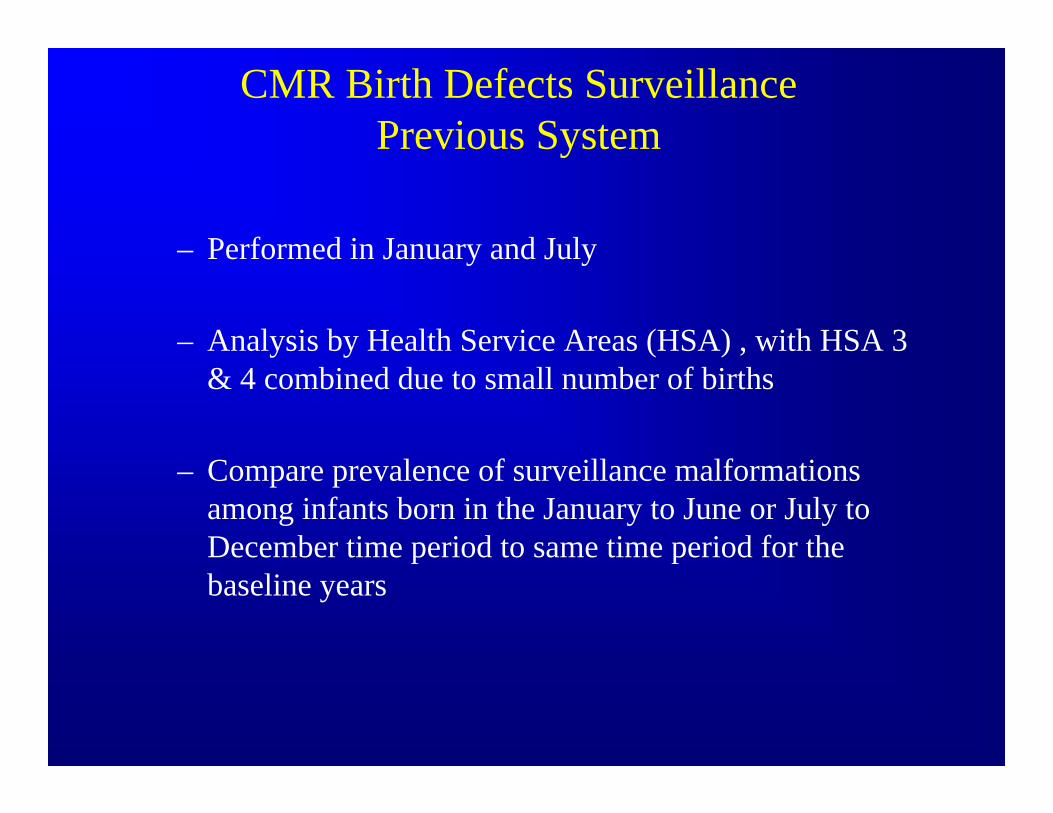
CMR Birth Defects SurveillancePrevious System
– Performed in January and July
– Analysis by Health Service Areas (HSA) , with HSA 3 & 4 combined due to small number of births
– Compare prevalence of surveillance malformations among infants born in the January to June or July to December time period to same time period for the baseline years
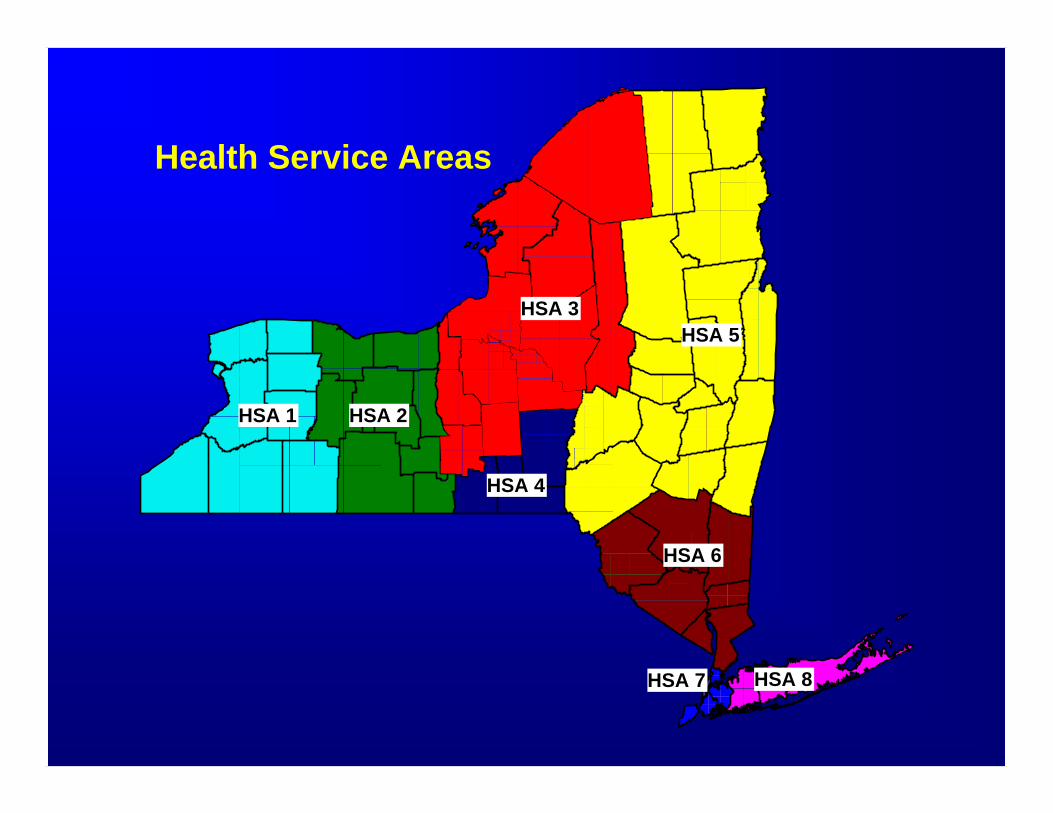
Health Service Areas
HSA 1 HSA 2
HSA 4
HSA 3
HSA 6
HSA 5
HSA 8 HSA 7
Why change to monitoring for variationsin space and changes in time & space?
Mapping and spatial analysis software are readily availableand becoming more user friendly
Increasing availability of geo-referenced environmental and sociodemographic data - State Health Departments
Can be used as a tool to assess completeness of reporting and detect potential deficiencies
Additional way to monitor birth defects reporting statewideand to target hospitals for site visits and audits
Why change to monitoring for variationsin space and changes in time & space?
Having procedures in place allows for an informed and quick response to community concerns about possible clusters and environmental exposures
Small area spatial analysis allows for the investigation of identified geographically localized potential hazards
Provide guidance for public health interventions
Ultimate goal of being able to detect significant clusters from a statistical and public health point of view
Caveat *1a: a warning enjoining one from certain acts or practices 1b: an explanation to prevent misinterpretation
* Webster’s New Collegiate Dictionary
detecting clustering of birth defects remains a challenge whenhealth events are rare, poorly diagnosed or not adequately reported
need to avoid generating a multitude of statistically significant results with limited ability to follow-up
caution should be taken in interpreting maps & results of spatialanalysis as errors in registry or vital statistics data could result inerroneous conclusions
Congenital Malformations Registry Congenital Malformations Registry Monitoring for Changes in Birth Defects PrevalenceMonitoring for Changes in Birth Defects Prevalence
NBDPN 10th Annual MeetingSan Antonio, TexasFebruary 4-7, 2007

Congenital Malformations RegistryCongenital Malformations RegistryBackground Background
•Established October, 1982
•Recognition of the environment as a potential etiologic factor for birth defects (Love Canal)
•Reporting to the Registry is mandated by Public Health Law - State Sanitary Code 22.3
Love Canal 1970s
Love Canal Today
Caveats
geographic bias/errors can be introduced through the use of automated geocoding software (Gregorio et al 1999)
costly and time consuming to accurately geocode large health outcome data sets particularly in rural areas where exact streetaddress information is unavailable
data collection must ensure that the data are complete and valid
identification of cause or knowledge about etiology is unlikely to arise from the study of most clusters (Sever, 1994)
recommend involving experts from various backgrounds to work together to avoid the caveats of GIS (Kirby, 1996)
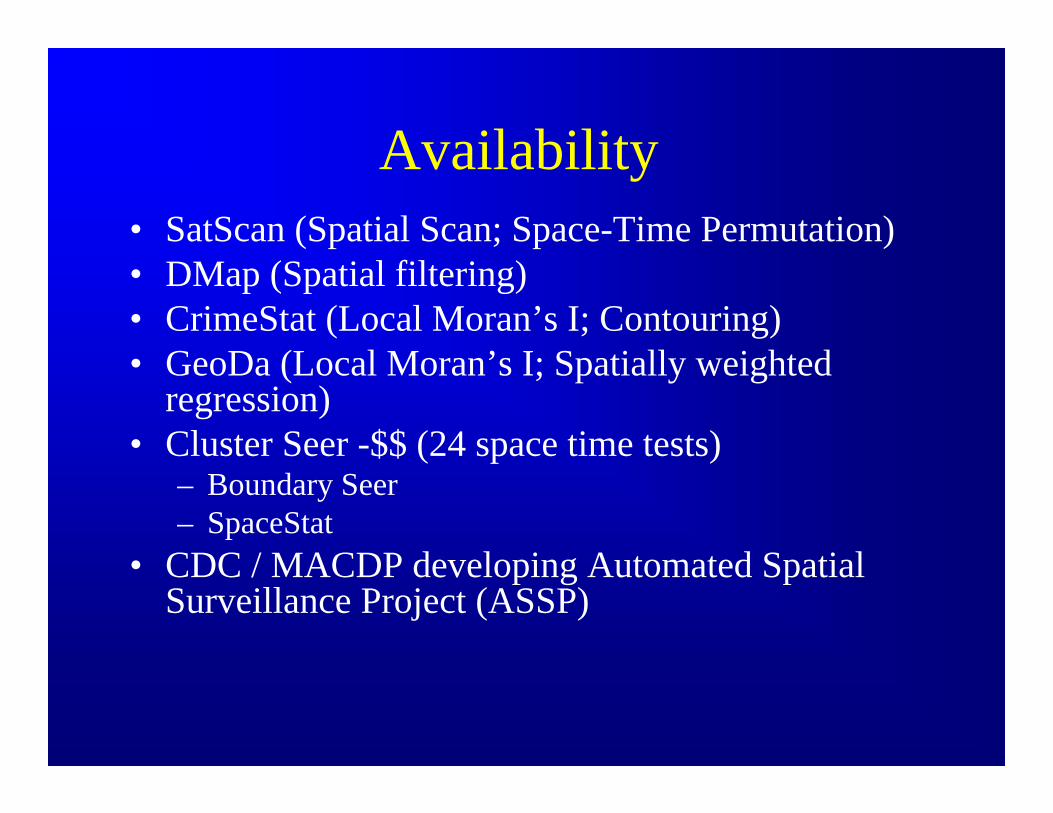
Availability• SatScan (Spatial Scan; Space-Time Permutation)• DMap (Spatial filtering)• CrimeStat (Local Moran’s I; Contouring)• GeoDa (Local Moran’s I; Spatially weighted
regression) • Cluster Seer -$$ (24 space time tests)
– Boundary Seer– SpaceStat
• CDC / MACDP developing Automated Spatial Surveillance Project (ASSP)
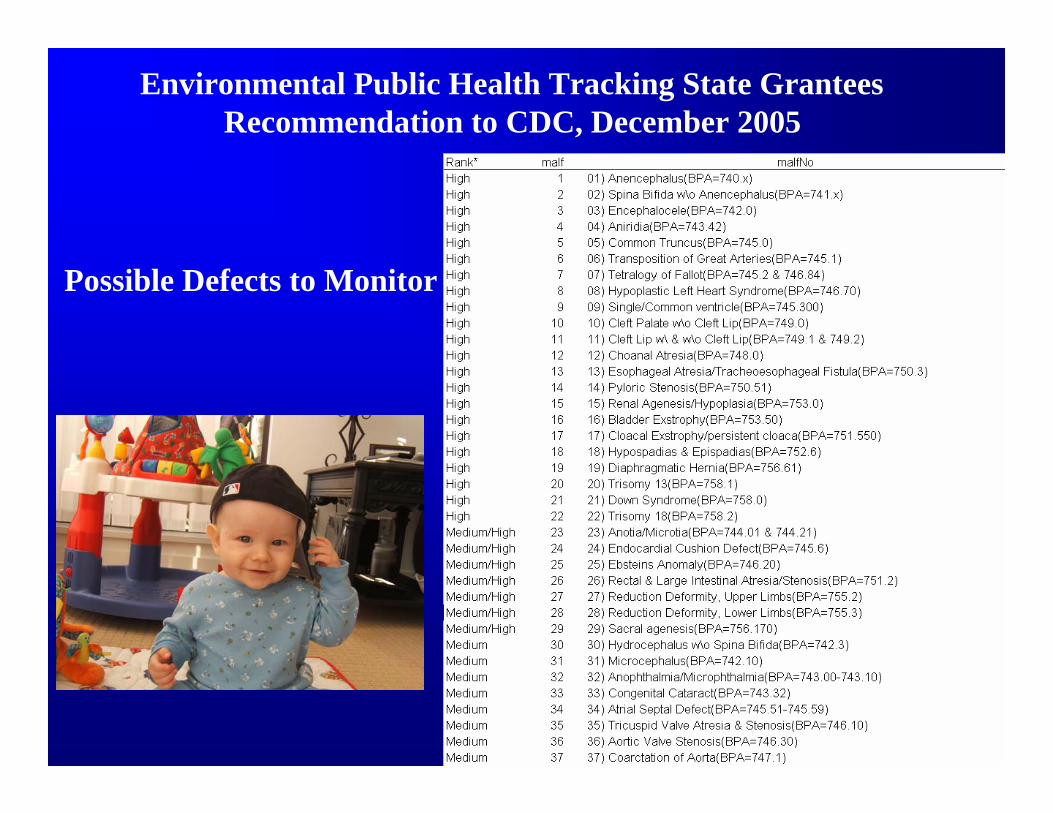
Possible Defects to Monitor
Environmental Public Health Tracking State GranteesRecommendation to CDC, December 2005
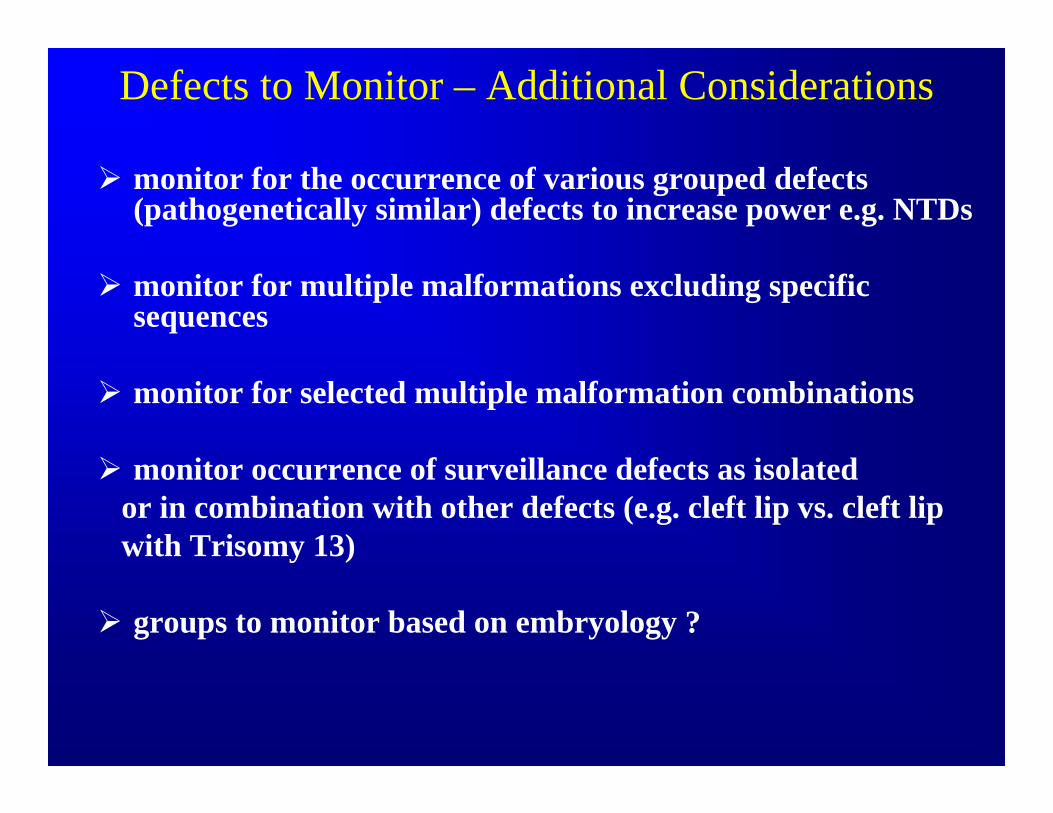
Defects to Monitor – Additional Considerations
monitor for the occurrence of various grouped defects (pathogenetically similar) defects to increase power e.g. NTDs
monitor for multiple malformations excluding specific sequences
monitor for selected multiple malformation combinations
monitor occurrence of surveillance defects as isolated or in combination with other defects (e.g. cleft lip vs. cleft lipwith Trisomy 13)
groups to monitor based on embryology ?
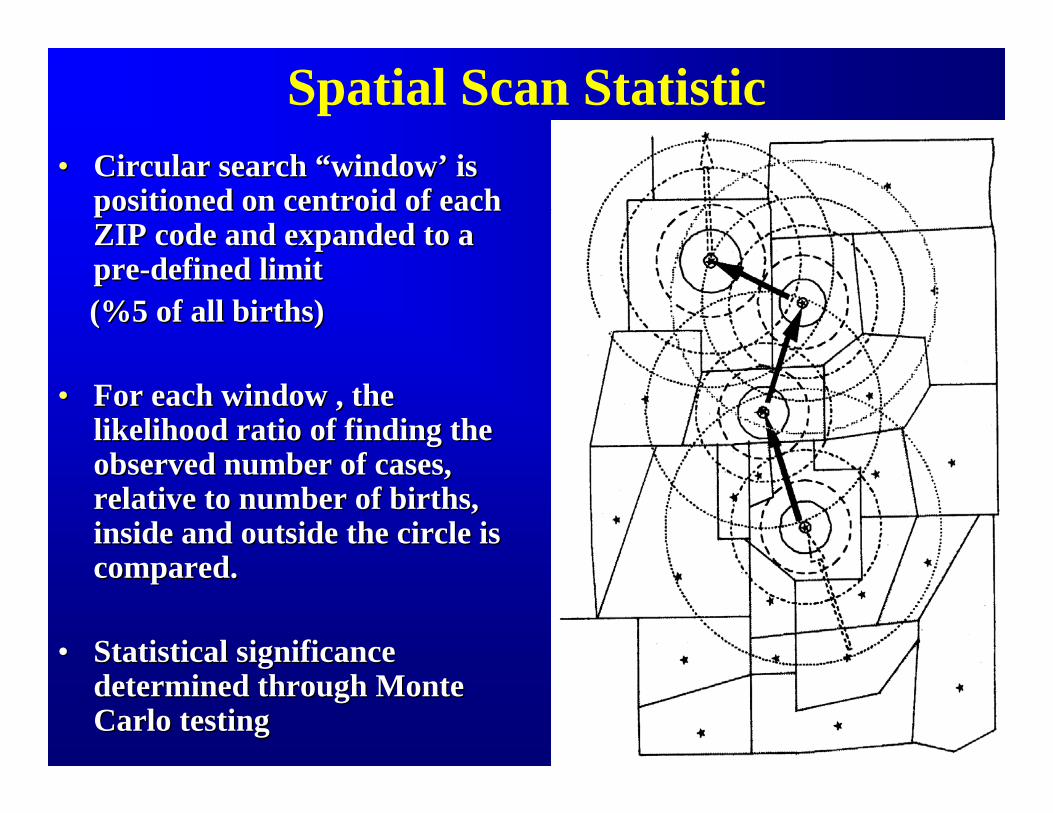
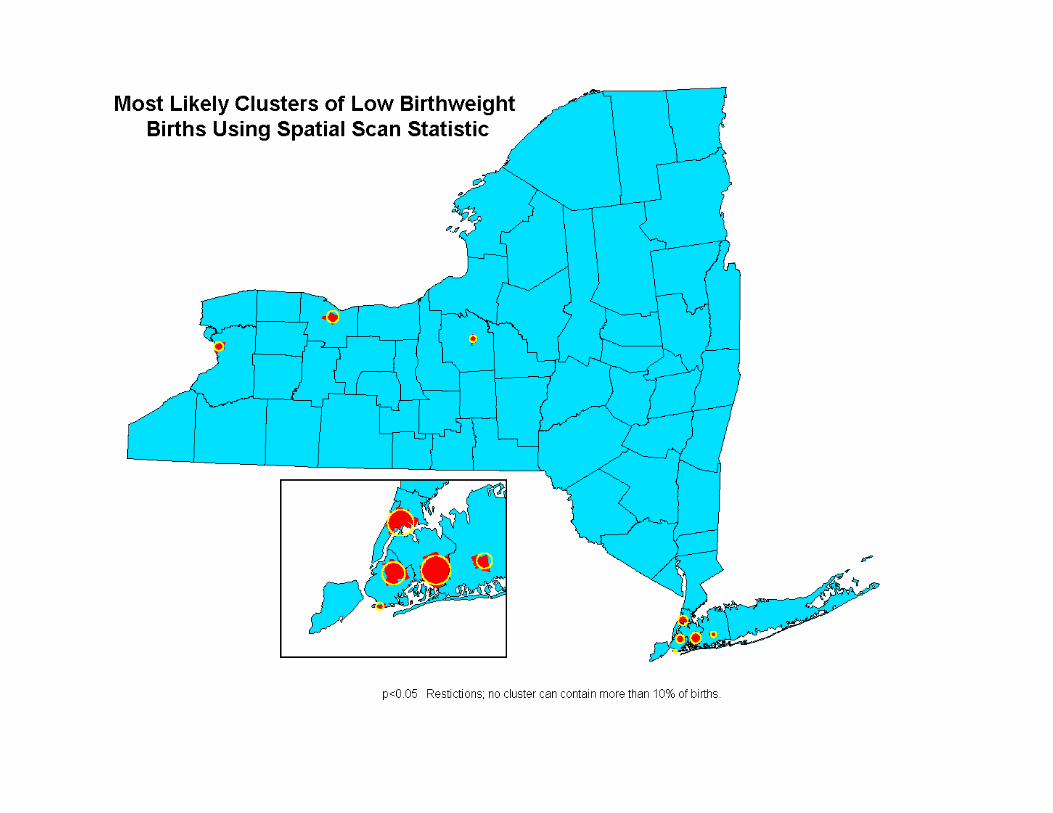
Spatial Scan Statistic•• Circular search Circular search ““windowwindow’’ is is
positioned on centroid of each positioned on centroid of each ZIP code and expanded to a ZIP code and expanded to a prepre--defined limitdefined limit(%5 of all births)(%5 of all births)
•• For each window , the For each window , the likelihood ratio of finding the likelihood ratio of finding the observed number of cases, observed number of cases, relative to number of births, relative to number of births, inside and outside the circle is inside and outside the circle is compared. compared.
•• Statistical significance Statistical significance determined through Monte determined through Monte Carlo testing Carlo testing
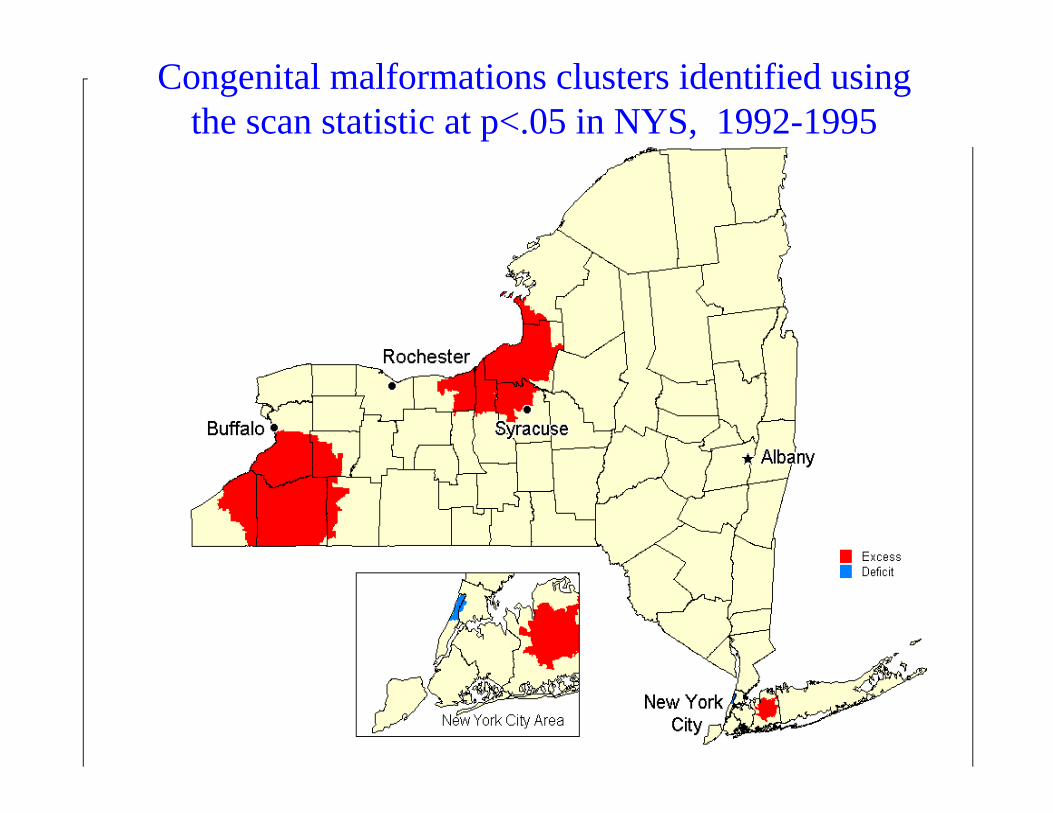
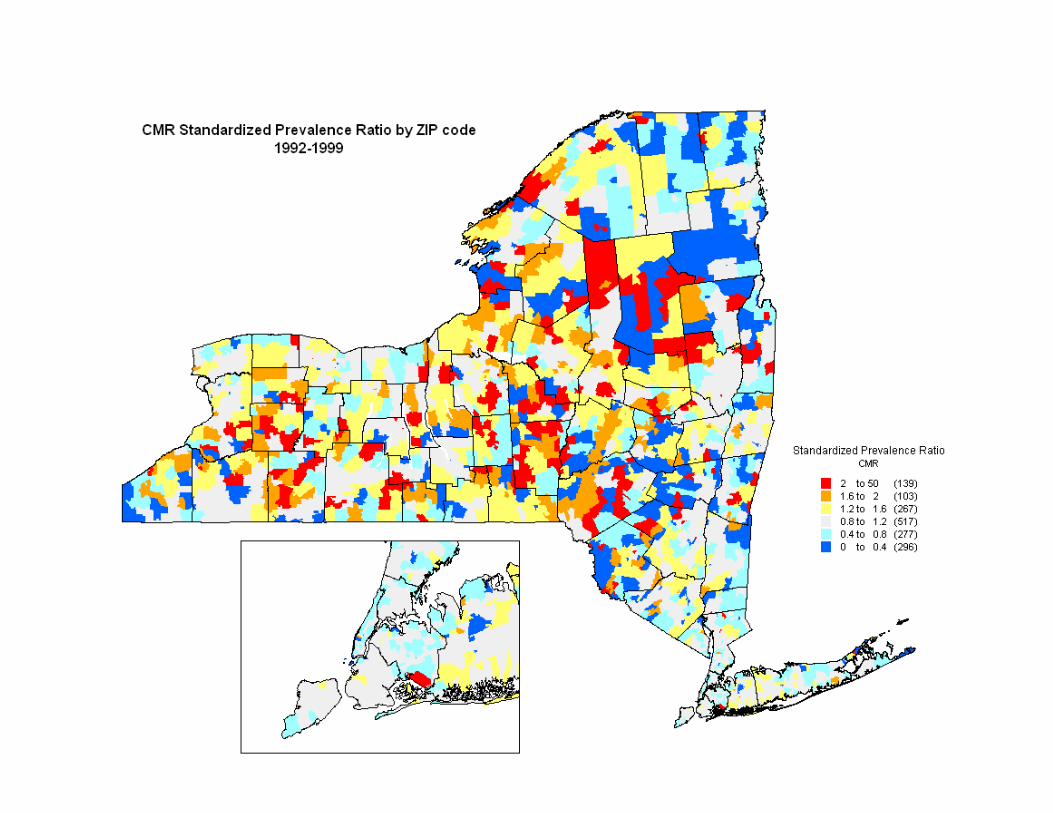
Congenital malformations clusters identified using the scan statistic at p<.05 in NYS, 1992-1995
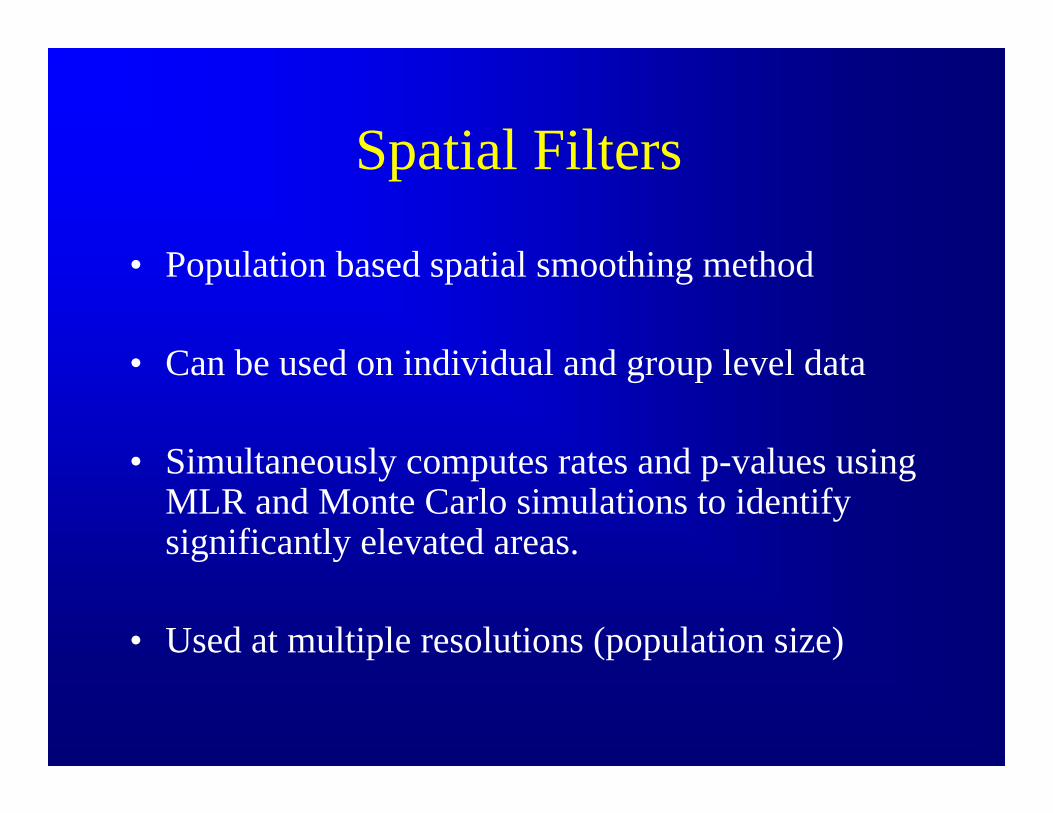
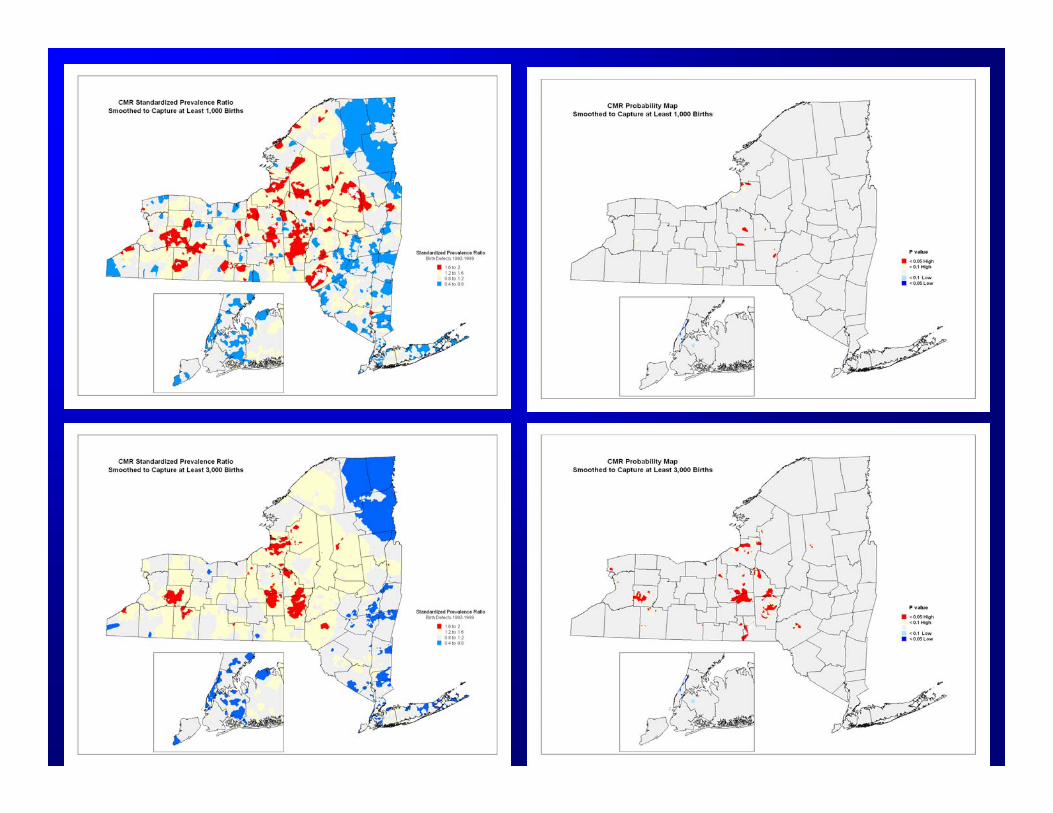
Spatial Filters
• Population based spatial smoothing method
• Can be used on individual and group level data
• Simultaneously computes rates and p-values using MLR and Monte Carlo simulations to identify significantly elevated areas.
• Used at multiple resolutions (population size)
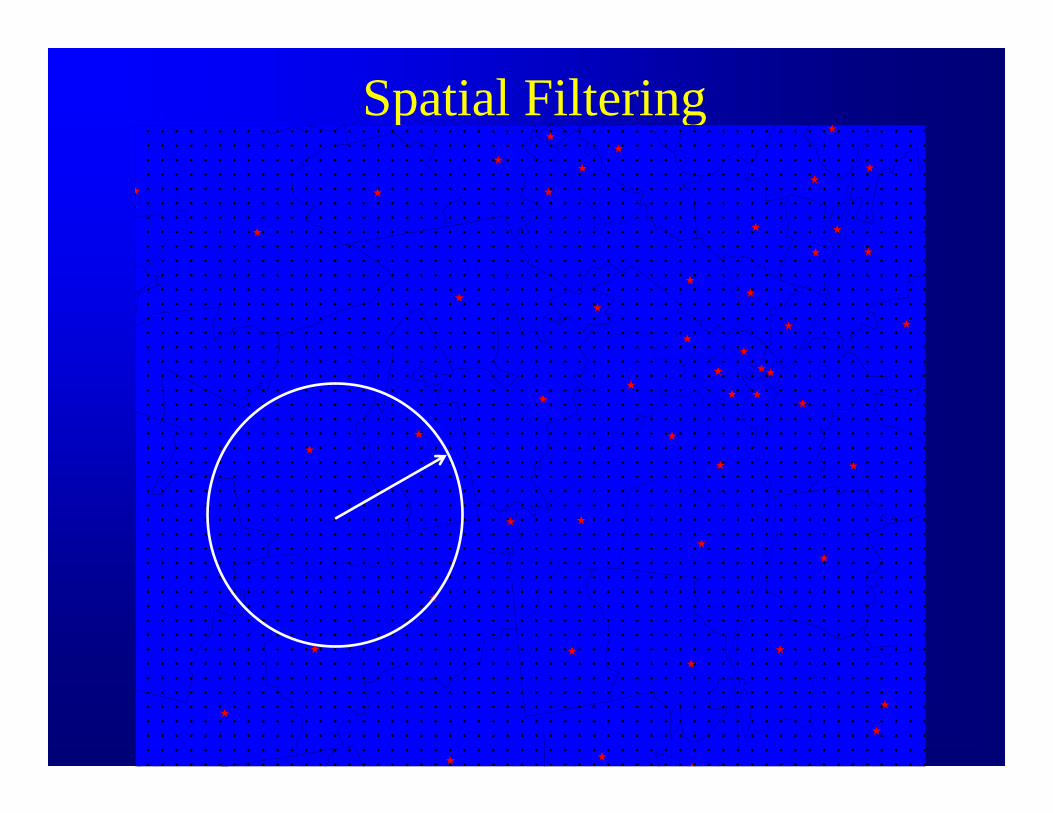
Spatial Filtering
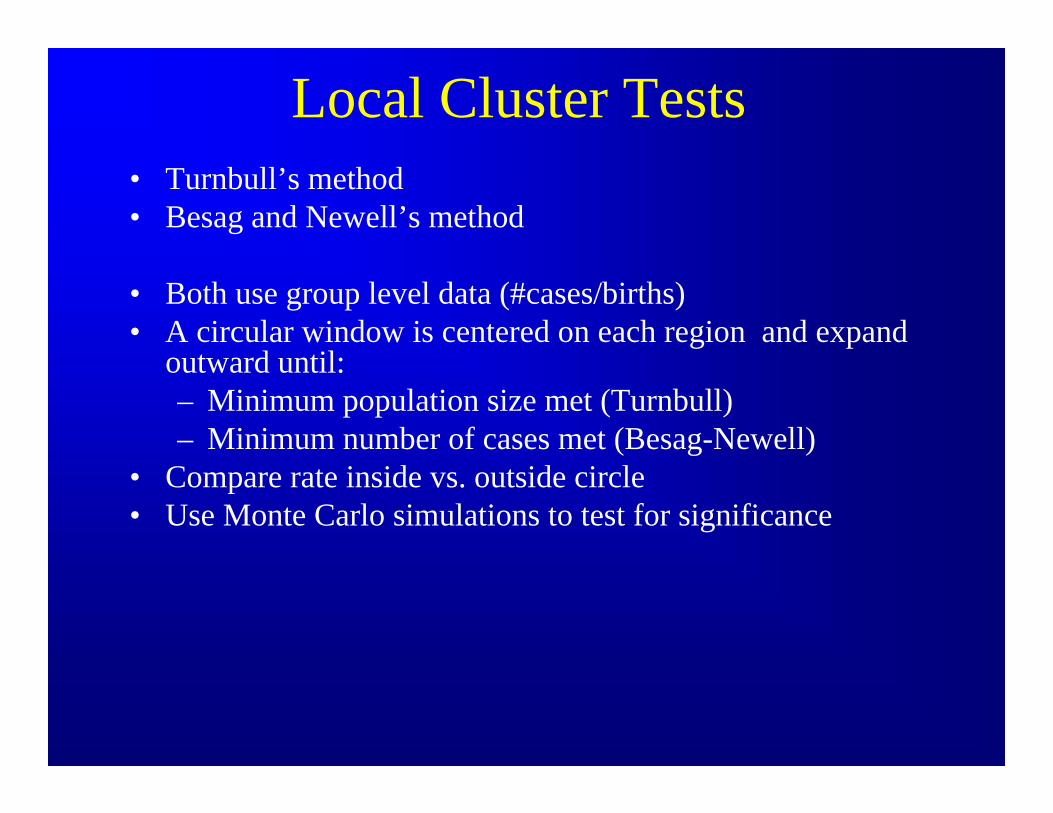
Local Cluster Tests• Turnbull’s method • Besag and Newell’s method
• Both use group level data (#cases/births)• A circular window is centered on each region and expand
outward until:– Minimum population size met (Turnbull)– Minimum number of cases met (Besag-Newell)
• Compare rate inside vs. outside circle• Use Monte Carlo simulations to test for significance
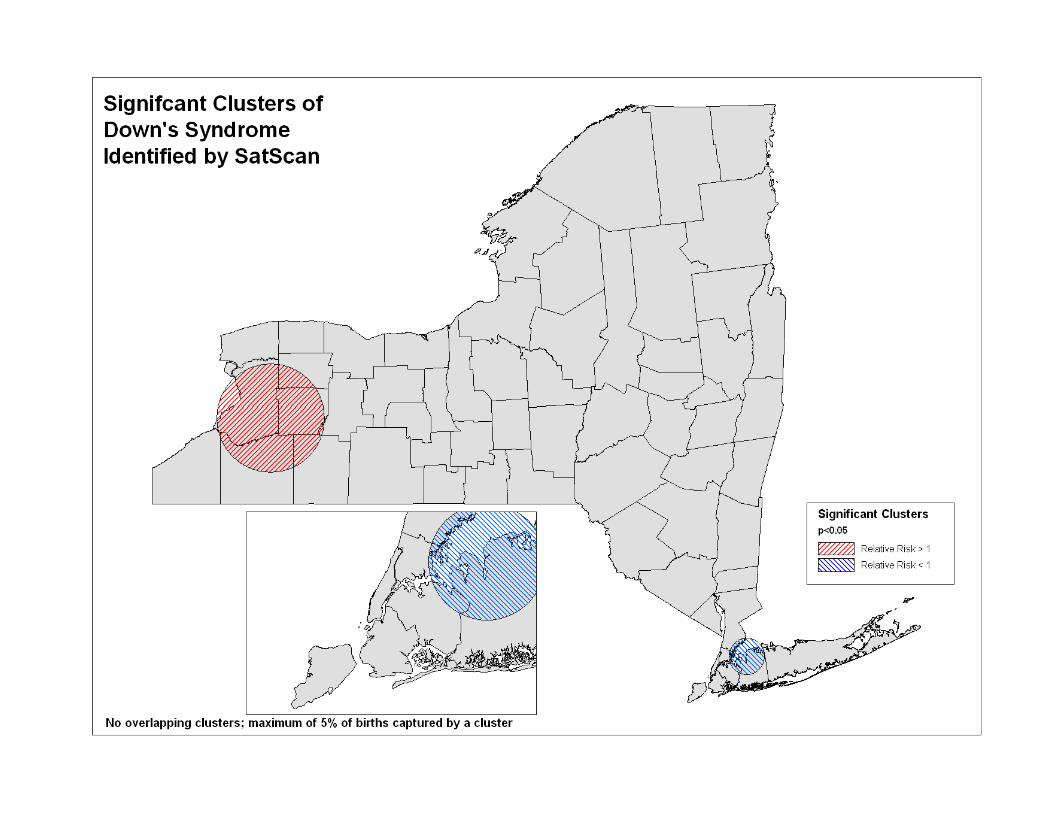
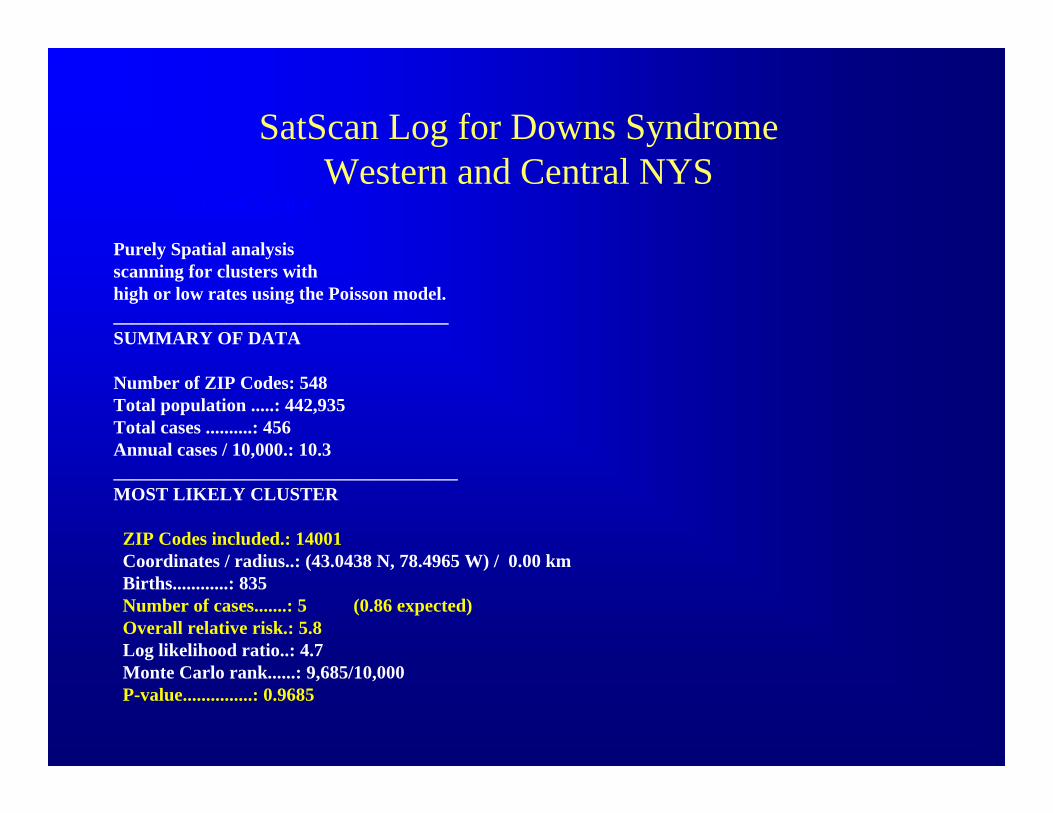
SatScan Log for Downs Syndrome Western and Central NYS
SaTScan V.3.0.4
Purely Spatial analysisscanning for clusters with high or low rates using the Poisson model.____________________________________SUMMARY OF DATA
Number of ZIP Codes: 548Total population .....: 442,935Total cases ..........: 456Annual cases / 10,000.: 10.3_____________________________________MOST LIKELY CLUSTER
ZIP Codes included.: 14001Coordinates / radius..: (43.0438 N, 78.4965 W) / 0.00 kmBirths............: 835 Number of cases.......: 5 (0.86 expected)Overall relative risk.: 5.8Log likelihood ratio..: 4.7Monte Carlo rank......: 9,685/10,000P-value...............: 0.9685
Recommendations• Evaluate the results of several clustering programs
and compare and contrast the results
• Check data quality by region to assure consistency across the state
• To investigate clusters around a putative source of pollution use a focused test.
• Cluster detection methods are most suitable for exploratory data analysis(hypothesis generating)– Once hypotheses have been generated they need to be
tested with more formal epidemiological studies
Recommendations• Many time-space clusters will be due to chance and care must be
taken in selecting which alarms to follow-up
• Consideration given to not only to statistical significance but to the absolute number of events
• To investigate a “significant” cluster recommend following methodology similar to that outlined by the CBDMP (Harris et. al., 1999) also a NCBDDD paper in Teratology by (Williams et.al., 2002)
• Recommend article by Siffel et. al. 2006 in Birth Defects Research Part A-describes role of GIS in birth defects surveillance & research

Philip Cross, DirectorCongenital Malformations RegistryNew York State Department of HealthFlanigan Square, Room 200547 River StreetTroy, New York 12180 Office Phone: (518) 402-7990Email: [email protected]
Recommended