Garofalo, J., Drier, H., Harper, S., Timmerman, M.A., & Shockey, T. (2000). Promotingappropriate uses of technology in mathematics teacher preparation. Contemporary Issues inTechnology and Teacher Education, 1(1), 66-88.
Promoting Appropriate Uses ofTechnology in Mathematics Teacher
PreparationJoe Garofalo, Hollylynne Stohl Drier, Suzanne Harper, and
Maria A. Timmerman, University of Virginia
Tod Shockey, University of Wisconsin—Stevens Point
In the Principles and Standards of School Mathematics the National Council of Teachers ofMathematics (NCTM) identified the "Technology Principle" as one of six principles of highquality mathematics education (NCTM, 2000). This principle states: "Technology is essential inteaching and learning mathematics; it influences the mathematics that is taught and enhancesstudents' learning" (p. 24). There is widespread agreement that mathematics teachers, nottechnological tools, are the key change agents to bringing about reform in mathematics teachingwith technology (Kaput, 1992; NCTM 1991, 2000). Yet, preparing teachers to use technologyappropriately is a complex task for teacher educators (Mergendoller, 1994). Waits and Demana(2000) argue that adoption of technology by teachers requires professional development thatfocuses on both conceptual and pedagogical issues, ongoing support in terms of "intensive start-upassistance and regular follow-up activities" and a desire to change from within the profession (p.53). In addition, studies of teachers' implementation of educational technology document that atleast three to five years are needed for teachers to become competent and confident in teachingwith technology (Dwyer, Ringstaff, & Sandholtz, 1991; Means & Olson, 1994).
The Curry Center for Technology and Teacher Education at the University of Virginia isdeveloping materials to help preservice secondary mathematics, social studies, and scienceteachers (PSTs) learn to incorporate technology appropriately into their teaching. The focus of themathematics team is to devise activities that will prepare secondary teachers to use technology toenhance and extend their students' learning of mathematics. In this article we discuss the approachto developing and using materials for this purpose.
Use of Technology in Teacher Education
Technology is being incorporated into teacher education in numerous ways. Not surprisingly,there are different ways to categorize the various approaches taken by teacher educators to bringtechnology into their programs. One way to categorize these approaches is according to theprimary user or controller of the technology—the teacher educator, the teacher, or the student. Insome uses of technology in teacher education, the teacher educator is the primary user of thetechnology. For example, some teacher educators use multi-media case studies of rich teachingepisodes to help PSTs analyze teaching and learning environments, and some use technology topresent information or to demonstrate explorations. In many teacher education programs theteacher is being prepared to be the primary user of technology. For example, PSTs are being
66
prepared to use technology productivity tools for word processing, grade and record keeping, webpage production, and presentations. Also, many PSTs are using subject-specific software andwebsites to create presentations, lectures, lessons, and assessments. A third approach toincorporating technology in teacher education is to prepare PSTs to have their future students usetechnology to investigate concepts and solve meaningful problems in the content areas. Forexample, in the area of mathematics, PSTs are learning how to guide their students to usetechnologies such as spreadsheets, graphing calculators, dynamic geometry programs, andplayable websites to explore mathematics concepts and use mathematics to solve problems inapplied contexts.
The three uses of technology in teacher education presented above are connected with differentpurposes and all can lead to better teacher effectiveness and improved student learning. Thus, allare important. However, it has been our experience that the most direct and effective way to usetechnology to bring about enhanced student learning of mathematics is to prepare PSTs toincorporate into their teaching an array of activities that engage students in mathematical thinkingfacilitated by technological tools. Hence, in our preparation of secondary PSTs we emphasize thethird use, in which ultimately the student is the primary user, and to some degree, the second use,in which the teacher is the primary user. Our materials reflect these emphases and thus are beingdeveloped around significant mathematical activities for school students.
In our classes, PSTs complete activities that, with some modification, are appropriate forsecondary mathematics courses. We then use these completed activities to anchor classdiscussions of issues connected with secondary curriculum and instruction, national and statestandards, sequencing of topics, the role of technology, and assessment. In the course ofcompleting these activities, PSTs not only learn how to use the technology, but also how toincorporate technology into their teaching.
Guidelines for Technology-Based ActivityDevelopment
In the early phase of our work, we devised a set of guidelines to shape our development ofmathematics activities and materials (Garofalo, Shockey, Harper, & Drier, 1999). The fiveguidelines below reflect what we believe to be appropriate uses of technology in mathematicsteaching:
introduce technology in context●
address worthwhile mathematics with appropriate pedagogy●
take advantage of technology●
connect mathematics topics●
incorporate multiple representations●
Each of these guidelines is discussed below and illustrated with one or more of our activities.
Introduce Technology in Context
Features of technology, whether mathematics-specific or more generic, should be introduced andillustrated in the context of meaningful content-based activities. Teaching a set of technology orsoftware-based skills and then trying to find mathematical topics for which they might be useful iscomparable to teaching a set of procedural mathematical skills and then giving a collection of
67
"word problems" to solve using the procedures. Such an approach can obscure the purpose oflearning and using technology, make mathematics appear as an afterthought, and lead to contrivedactivities. The use of technology in mathematics teaching is not for the purpose of teaching abouttechnology, but for the purpose of enhancing mathematics teaching and learning with technology.Furthermore, in our experience, teachers who learn to use technology while exploring relevantmathematics topics are more likely to see its potential benefits and use it in their subsequentteaching. This guideline is in accord with the first recommendation of the President's Committeeof Advisors on Science and Technology, Panel on Educational Technology (1997): "Focus onlearning with technology, not about technology" (p. 7).
Example: Simulating Freefall With Parametric Quadratic Equations
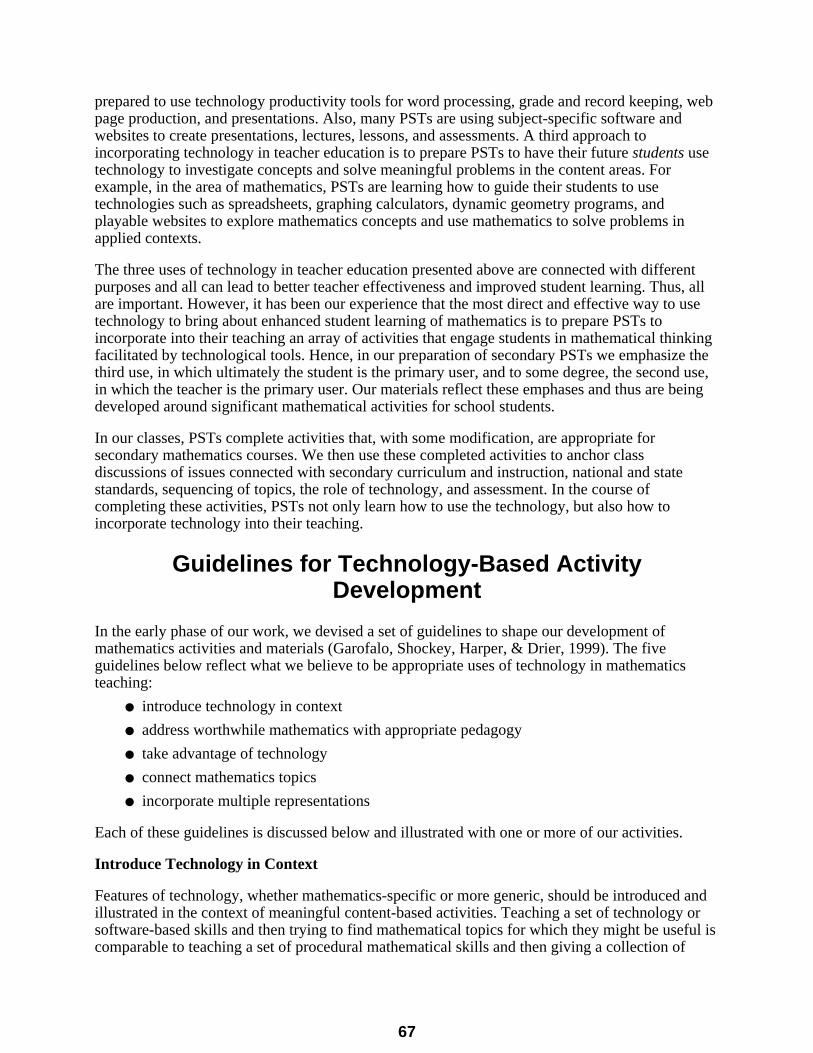
In this activity connecting quadratic equations and projectile motion, PSTs are introduced to theparametric graphing features of graphing calculators. PSTs are asked to derive an expression forthe height of an object dropped from 500m above the surface of the Earth, as a function of time.They are then asked to construct a graph of this relationship, first with paper and pencil and thenwith graphing calculators. Our PSTs are able to derive a correct equation and generate a graphsimilar to those in Figure 1. (Click on the caption of the screenshot of the graph in the figure to seethe graph being drawn.)
Figure 1. Casio 9850 Plus graphing calculator screenshots of freefall equation and graph
The graph in Figure 1 is appropriate, considering that the x-axis represents time and the y-axisrepresents the height of the object. However, many students often fail to fully attend to axisvariables and sometimes interpret such a graph as a picture of the situation being represented.They interpret this graph as implying that the path of the object is outward and downward ratherthan as straight downward. Such a misinterpretation is referred to as an iconic interpretation(Kerslake, 1977; Leinhardt, Zaslavsky, & Stein, 1990) and is prevalent with secondary schoolstudents. We challenge our PSTs to generate a graph that simulates the actual path of a freefallingobject. This involves use of parametric equations, which all of our PSTs have studied in calculus,but most have forgotten or have not considered for high school use. Rather than teach PSTs to usethe graphing calculator parametric features ahead of time and apply here, we introduce thesefeatures in this context, where PSTs can see its direct applicability and usefulness. Figure 2 showsthe parametric equation and graph that simulates the object's path. (Click on the caption of thegraph screenshot in the figure to see the graph being drawn.)
68
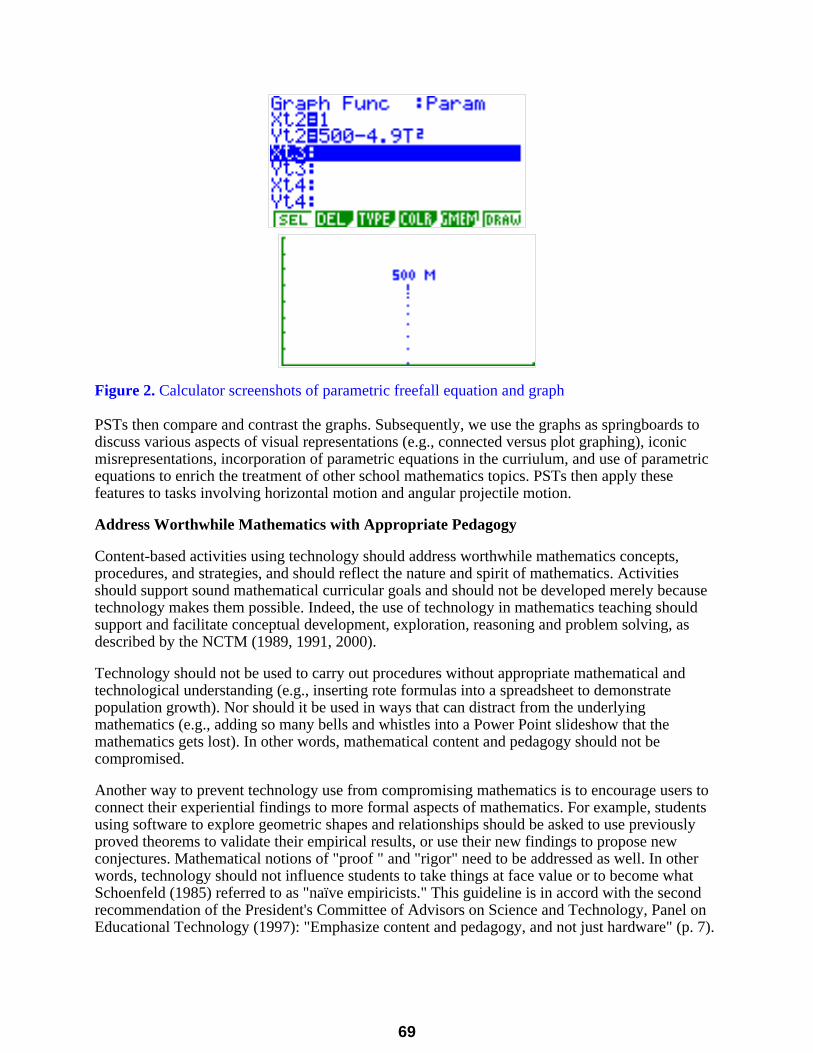
Figure 2. Calculator screenshots of parametric freefall equation and graph
PSTs then compare and contrast the graphs. Subsequently, we use the graphs as springboards todiscuss various aspects of visual representations (e.g., connected versus plot graphing), iconicmisrepresentations, incorporation of parametric equations in the curriulum, and use of parametricequations to enrich the treatment of other school mathematics topics. PSTs then apply thesefeatures to tasks involving horizontal motion and angular projectile motion.
Address Worthwhile Mathematics with Appropriate Pedagogy
Content-based activities using technology should address worthwhile mathematics concepts,procedures, and strategies, and should reflect the nature and spirit of mathematics. Activitiesshould support sound mathematical curricular goals and should not be developed merely becausetechnology makes them possible. Indeed, the use of technology in mathematics teaching shouldsupport and facilitate conceptual development, exploration, reasoning and problem solving, asdescribed by the NCTM (1989, 1991, 2000).
Technology should not be used to carry out procedures without appropriate mathematical andtechnological understanding (e.g., inserting rote formulas into a spreadsheet to demonstratepopulation growth). Nor should it be used in ways that can distract from the underlyingmathematics (e.g., adding so many bells and whistles into a Power Point slideshow that themathematics gets lost). In other words, mathematical content and pedagogy should not becompromised.
Another way to prevent technology use from compromising mathematics is to encourage users toconnect their experiential findings to more formal aspects of mathematics. For example, studentsusing software to explore geometric shapes and relationships should be asked to use previouslyproved theorems to validate their empirical results, or use their new findings to propose newconjectures. Mathematical notions of "proof " and "rigor" need to be addressed as well. In otherwords, technology should not influence students to take things at face value or to become whatSchoenfeld (1985) referred to as "naïve empiricists." This guideline is in accord with the secondrecommendation of the President's Committee of Advisors on Science and Technology, Panel onEducational Technology (1997): "Emphasize content and pedagogy, and not just hardware" (p. 7).
69
Example: Exploring the Pythagorean Theorem
On way we explore issues regarding appropriate pedagogy with technology with our PSTs is withthe following activity. The emphasis of the activity is more on the principles of teaching themathematics than on the mathematics itself. PSTs discuss how this topic is traditionally taught tostudents, as a rote memorization of a2 + b2 = c2 without any conceptual understanding that a2, b2
and c2 represent areas of squares with sides length a, b, and c. We then discuss how technologycould be used to enhance the students' understanding of the theorem, and guide them through amodel lesson of how the Pythagorean theorem could be taught using The Geometer's Sketchpad(Jackiw, 1997).
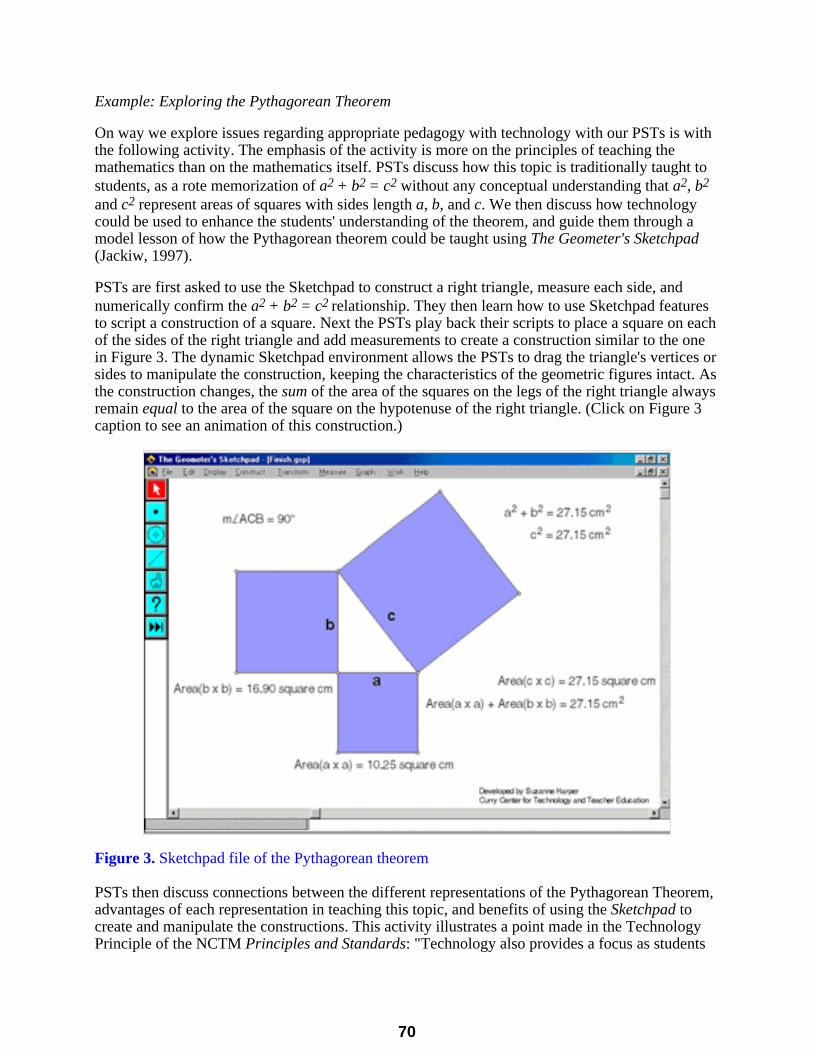
PSTs are first asked to use the Sketchpad to construct a right triangle, measure each side, andnumerically confirm the a2 + b2 = c2 relationship. They then learn how to use Sketchpad featuresto script a construction of a square. Next the PSTs play back their scripts to place a square on eachof the sides of the right triangle and add measurements to create a construction similar to the onein Figure 3. The dynamic Sketchpad environment allows the PSTs to drag the triangle's vertices orsides to manipulate the construction, keeping the characteristics of the geometric figures intact. Asthe construction changes, the sum of the area of the squares on the legs of the right triangle alwaysremain equal to the area of the square on the hypotenuse of the right triangle. (Click on Figure 3caption to see an animation of this construction.)
Figure 3. Sketchpad file of the Pythagorean theorem
PSTs then discuss connections between the different representations of the Pythagorean Theorem,advantages of each representation in teaching this topic, and benefits of using the Sketchpad tocreate and manipulate the constructions. This activity illustrates a point made in the TechnologyPrinciple of the NCTM Principles and Standards: "Technology also provides a focus as students
70
discuss with one another and with their teacher the objects on the screen and the effects of thevarious dynamic transformations that technology allows (NCTM, 2000, p. 24)."
We typically pose the following question to our PSTs: Does the manipulation of this constructionconstitute a mathematical proof of the Pythagorean theorem? One semester we received four typesof responses: "I think it's a proof;" "I don't know if this is a proof;" "I hope it's a proof;" and "Ofcourse this is not a proof!" These responses gave us the perfect opportunity to discuss the notionof an "informal" geometry proof, the role of technology in an informal proof, and the necessity ofa formal proof. It is important for PSTs to engage in such discussions since they will be helpingtheir future students "select and use various types of reasoning and methods of proof" (NCTM,2000, p. 342). Subsequently, we investigate other dynamic constructions of geometricrepresentations of the Pythagorean theorem and associated formal proofs to help PSTs see otherrepresentations of the mathematical structure of the Pythagorean theorem.
Take Advantage of Technology
Activities should take advantage of the capabilities of technology, and hence should extendbeyond or significantly enhance what could be done without technology. Technology enablesusers to explore topics in more depth (e.g., interconnect mathematics topics, write programs,devise multiple proofs and solutions) and in more interactive ways (e.g., simulations, datacollection with probes). Technology also makes accessible the study of mathematics topics thatwere previously impractical, such as recursion and regression, by removing computationalconstraints.
Using technology to teach the same mathematical topics in fundamentally the same ways thatcould be taught without technology does not strengthen students' learning of mathematics andbelies the usefulness of technology. Furthermore, using technology to perform tasks that are justas easily or even better carried out without technology may actually be a hindrance to learning.Such uses of technology may convince teachers and administrators that preparing teachers to usetechnology is not worth the considerable effort and expense necessary to do so.
This guideline supports the Technology Principle of the NCTM Principles and Standards forSchool Mathematics. "Teachers should use technology to enhance their students learningopportunities by selecting or creating mathematical tasks that take advantage of what technologycan do efficiently and well—graphing, visualizing, and computing" (NCTM, 2000, p. 25).
Example: Exploring Sierpinski Polygons
The following activity introduces our PSTs to Sierpinski Triangles and related fractals.Sierpinski's Triangle, first introduced by Waclaw Sierpinski in 1916, can be constructed in severalways. One way is to start with an equilateral triangle and a randomly chosen point inside, on, oroutside the triangle. Next, randomly choose a vertex of the triangle and place a new point half waybetween the initial point and the randomly chosen vertex. Then, again randomly choose a vertex ofthe triangle and place a third point half way between the second point and the randomly chosenvertex. The triangle is constructed by continuing this recursive process, that is, by randomlychoosing a vertex of the triangle and placing a point half way between that vertex and the previouspoint.
We ask our PSTs to construct a Sierpinski Triangle of 20 points using a triangle template andtossing one die to randomly determine vertices, observe their results, and predict what the trianglewould look like if they were able to continue the process for a total of 5,000 points. Clearly,
71
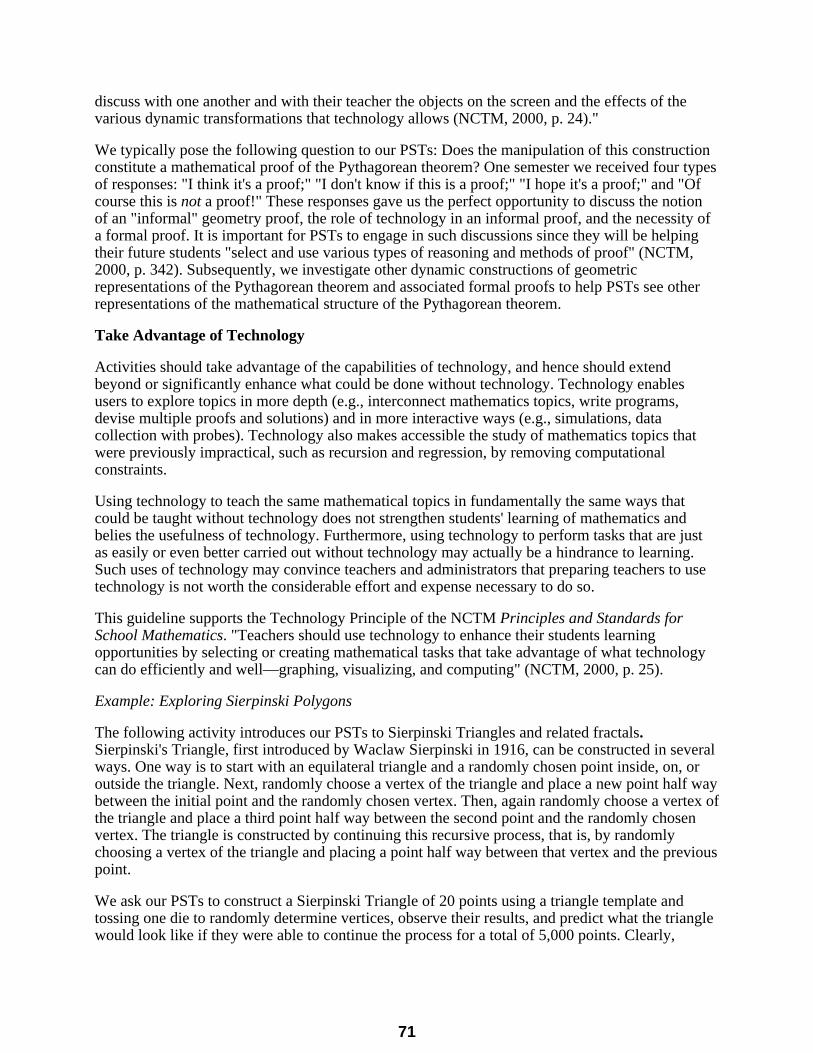
plotting 5,000 points is impractical to do by hand, so we developed our Sierpinski Polygonprogram in MicroWorlds (Logo Computer Systems, Inc., 1997) to carry out this process. Figure 4shows Sierpinski's triangle constructed with 7,525 points. (Click on the figure caption to see ananimation of the construction.
Figure 4. Sierpinski's Triangle
We ask our PSTs to analyze this triangle and comment on their observations. Next, we ask them tomake predictions about and use the program to investigate various "What if" questions (e.g., Whatif we started with a hexagon? What if we used a ratio of one third instead of one-half? What if weused ratios greater than one?). They then explore various shapes and ratios, and determine theratio, as a function of the number of sides of a polygon, which gives the "best" Sierpinski polygon.Figure 5 shows a triangle constructed with a ratio of 1.5. (Click on the figure caption to see ananimation of the construction.
72
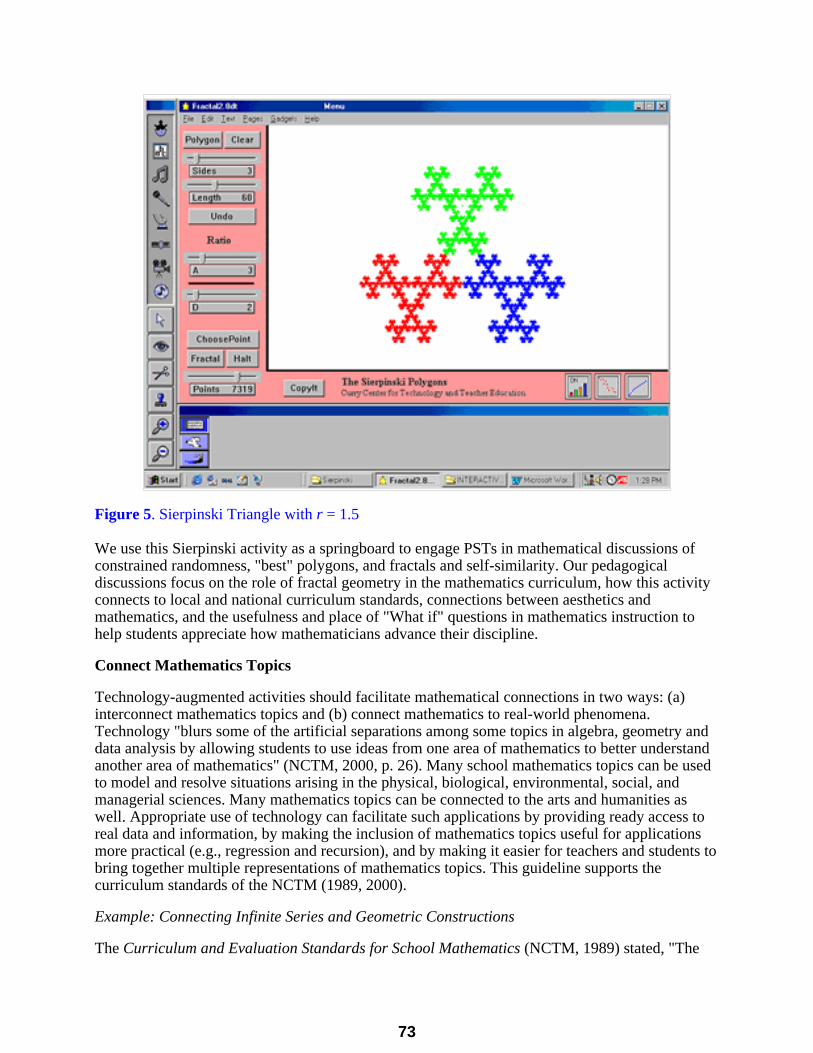
Figure 5. Sierpinski Triangle with r = 1.5
We use this Sierpinski activity as a springboard to engage PSTs in mathematical discussions ofconstrained randomness, "best" polygons, and fractals and self-similarity. Our pedagogicaldiscussions focus on the role of fractal geometry in the mathematics curriculum, how this activityconnects to local and national curriculum standards, connections between aesthetics andmathematics, and the usefulness and place of "What if" questions in mathematics instruction tohelp students appreciate how mathematicians advance their discipline.
Connect Mathematics Topics
Technology-augmented activities should facilitate mathematical connections in two ways: (a)interconnect mathematics topics and (b) connect mathematics to real-world phenomena.Technology "blurs some of the artificial separations among some topics in algebra, geometry anddata analysis by allowing students to use ideas from one area of mathematics to better understandanother area of mathematics" (NCTM, 2000, p. 26). Many school mathematics topics can be usedto model and resolve situations arising in the physical, biological, environmental, social, andmanagerial sciences. Many mathematics topics can be connected to the arts and humanities aswell. Appropriate use of technology can facilitate such applications by providing ready access toreal data and information, by making the inclusion of mathematics topics useful for applicationsmore practical (e.g., regression and recursion), and by making it easier for teachers and students tobring together multiple representations of mathematics topics. This guideline supports thecurriculum standards of the NCTM (1989, 2000).
Example: Connecting Infinite Series and Geometric Constructions
The Curriculum and Evaluation Standards for School Mathematics (NCTM, 1989) stated, "The
73
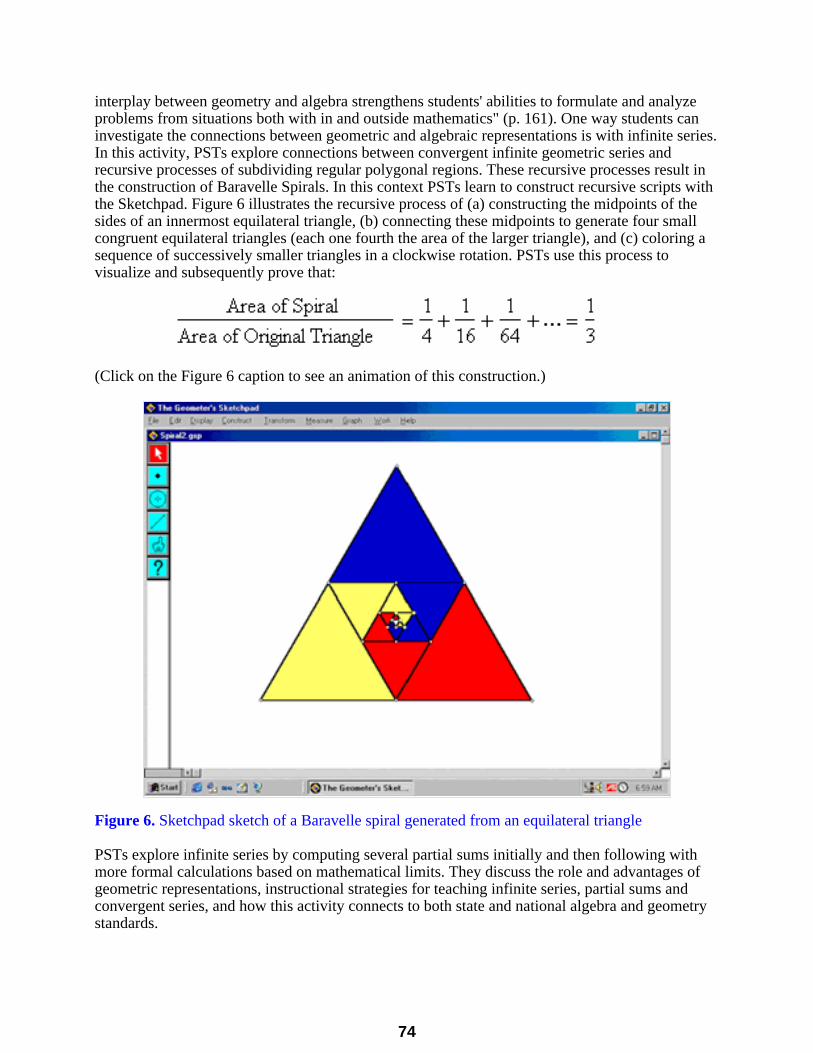
interplay between geometry and algebra strengthens students' abilities to formulate and analyzeproblems from situations both with in and outside mathematics" (p. 161). One way students caninvestigate the connections between geometric and algebraic representations is with infinite series.In this activity, PSTs explore connections between convergent infinite geometric series andrecursive processes of subdividing regular polygonal regions. These recursive processes result inthe construction of Baravelle Spirals. In this context PSTs learn to construct recursive scripts withthe Sketchpad. Figure 6 illustrates the recursive process of (a) constructing the midpoints of thesides of an innermost equilateral triangle, (b) connecting these midpoints to generate four smallcongruent equilateral triangles (each one fourth the area of the larger triangle), and (c) coloring asequence of successively smaller triangles in a clockwise rotation. PSTs use this process tovisualize and subsequently prove that:
(Click on the Figure 6 caption to see an animation of this construction.)
Figure 6. Sketchpad sketch of a Baravelle spiral generated from an equilateral triangle
PSTs explore infinite series by computing several partial sums initially and then following withmore formal calculations based on mathematical limits. They discuss the role and advantages ofgeometric representations, instructional strategies for teaching infinite series, partial sums andconvergent series, and how this activity connects to both state and national algebra and geometrystandards.
74
Example: Connect Mathematics With Social Studies
To illustrate how technology can facilitate connections between mathematics and other disciplineswe present our PSTs with the following information from a story in our local newspaper:
On Sunday, March 12, 2000 the Charlottesville Daily Progress contained an articlereporting the results of a Washington Post-ABC News Poll. The article reported "Goreleads Bush by 48 percent to 45 percent, a statistical tie." It also reported, "A total of 1,218adults, including 999 self-described registered voters, were interviewed" and the "margin oferror for the overall results is plus or minus 3 percentage points, and slightly larger forresults based on only the registered voters."
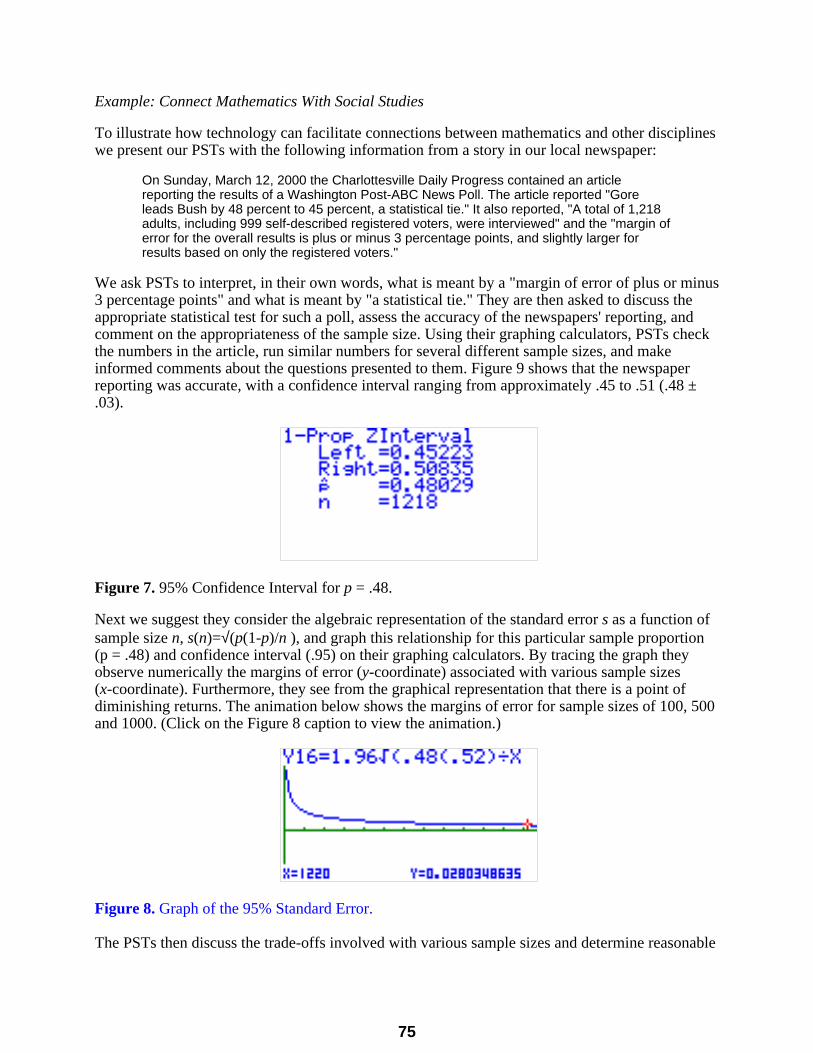
We ask PSTs to interpret, in their own words, what is meant by a "margin of error of plus or minus3 percentage points" and what is meant by "a statistical tie." They are then asked to discuss theappropriate statistical test for such a poll, assess the accuracy of the newspapers' reporting, andcomment on the appropriateness of the sample size. Using their graphing calculators, PSTs checkthe numbers in the article, run similar numbers for several different sample sizes, and makeinformed comments about the questions presented to them. Figure 9 shows that the newspaperreporting was accurate, with a confidence interval ranging from approximately .45 to .51 (.48 ±.03).
Figure 7. 95% Confidence Interval for p = .48.
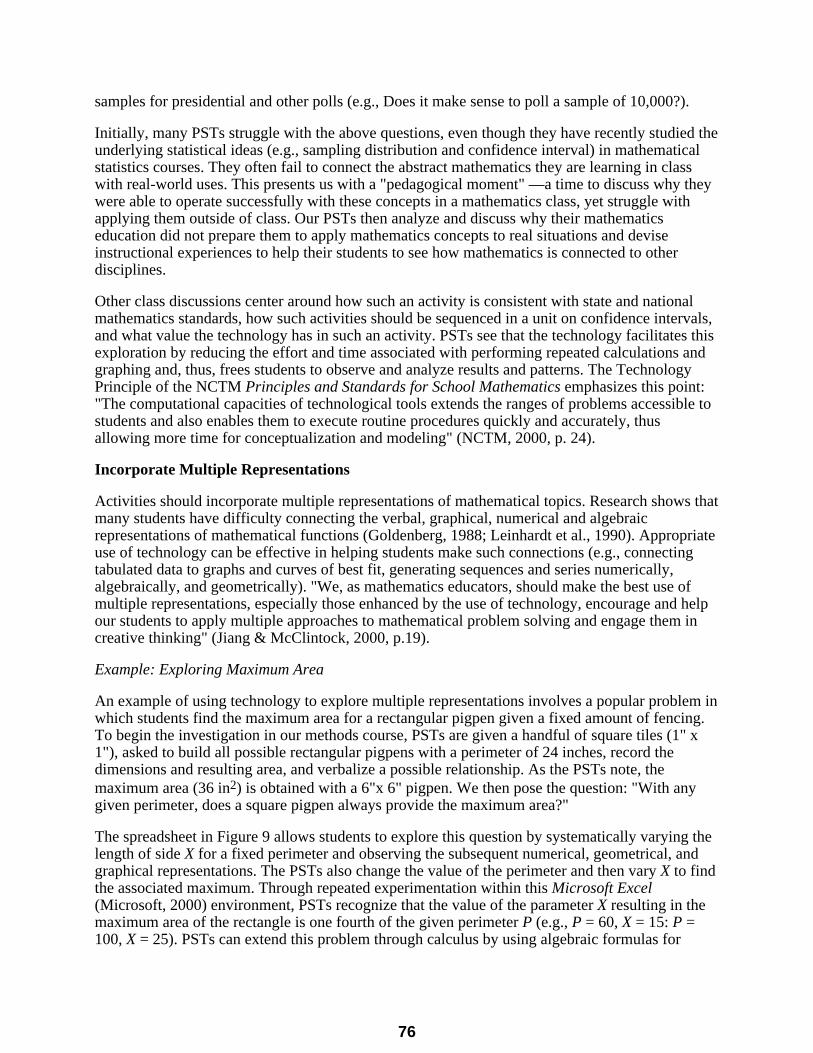
Next we suggest they consider the algebraic representation of the standard error s as a function ofsample size n, s(n)=√(p(1-p)/n ), and graph this relationship for this particular sample proportion(p = .48) and confidence interval (.95) on their graphing calculators. By tracing the graph theyobserve numerically the margins of error (y-coordinate) associated with various sample sizes(x-coordinate). Furthermore, they see from the graphical representation that there is a point ofdiminishing returns. The animation below shows the margins of error for sample sizes of 100, 500and 1000. (Click on the Figure 8 caption to view the animation.)
Figure 8. Graph of the 95% Standard Error.
The PSTs then discuss the trade-offs involved with various sample sizes and determine reasonable
75
samples for presidential and other polls (e.g., Does it make sense to poll a sample of 10,000?).
Initially, many PSTs struggle with the above questions, even though they have recently studied theunderlying statistical ideas (e.g., sampling distribution and confidence interval) in mathematicalstatistics courses. They often fail to connect the abstract mathematics they are learning in classwith real-world uses. This presents us with a "pedagogical moment" —a time to discuss why theywere able to operate successfully with these concepts in a mathematics class, yet struggle withapplying them outside of class. Our PSTs then analyze and discuss why their mathematicseducation did not prepare them to apply mathematics concepts to real situations and deviseinstructional experiences to help their students to see how mathematics is connected to otherdisciplines.
Other class discussions center around how such an activity is consistent with state and nationalmathematics standards, how such activities should be sequenced in a unit on confidence intervals,and what value the technology has in such an activity. PSTs see that the technology facilitates thisexploration by reducing the effort and time associated with performing repeated calculations andgraphing and, thus, frees students to observe and analyze results and patterns. The TechnologyPrinciple of the NCTM Principles and Standards for School Mathematics emphasizes this point:"The computational capacities of technological tools extends the ranges of problems accessible tostudents and also enables them to execute routine procedures quickly and accurately, thusallowing more time for conceptualization and modeling" (NCTM, 2000, p. 24).
Incorporate Multiple Representations
Activities should incorporate multiple representations of mathematical topics. Research shows thatmany students have difficulty connecting the verbal, graphical, numerical and algebraicrepresentations of mathematical functions (Goldenberg, 1988; Leinhardt et al., 1990). Appropriateuse of technology can be effective in helping students make such connections (e.g., connectingtabulated data to graphs and curves of best fit, generating sequences and series numerically,algebraically, and geometrically). "We, as mathematics educators, should make the best use ofmultiple representations, especially those enhanced by the use of technology, encourage and helpour students to apply multiple approaches to mathematical problem solving and engage them increative thinking" (Jiang & McClintock, 2000, p.19).
Example: Exploring Maximum Area
An example of using technology to explore multiple representations involves a popular problem inwhich students find the maximum area for a rectangular pigpen given a fixed amount of fencing.To begin the investigation in our methods course, PSTs are given a handful of square tiles (1" x1"), asked to build all possible rectangular pigpens with a perimeter of 24 inches, record thedimensions and resulting area, and verbalize a possible relationship. As the PSTs note, themaximum area (36 in2) is obtained with a 6"x 6" pigpen. We then pose the question: "With anygiven perimeter, does a square pigpen always provide the maximum area?"
The spreadsheet in Figure 9 allows students to explore this question by systematically varying thelength of side X for a fixed perimeter and observing the subsequent numerical, geometrical, andgraphical representations. The PSTs also change the value of the perimeter and then vary X to findthe associated maximum. Through repeated experimentation within this Microsoft Excel(Microsoft, 2000) environment, PSTs recognize that the value of the parameter X resulting in themaximum area of the rectangle is one fourth of the given perimeter P (e.g., P = 60, X = 15: P =100, X = 25). PSTs can extend this problem through calculus by using algebraic formulas for
76
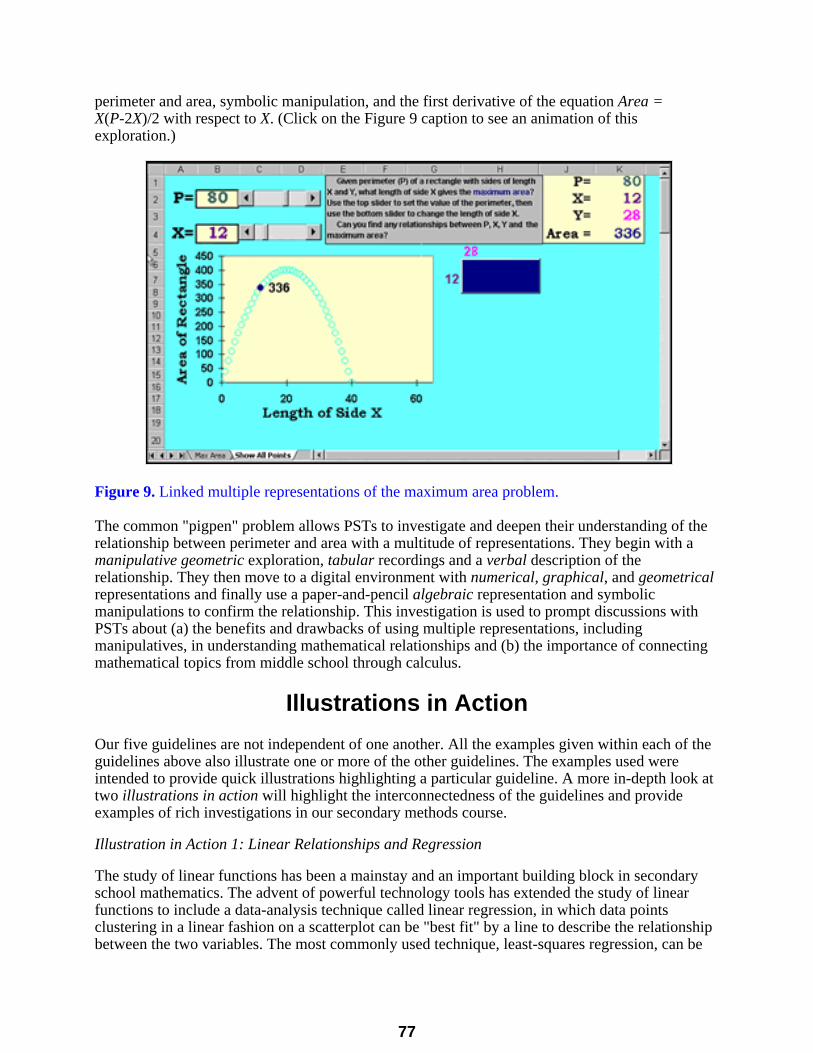
perimeter and area, symbolic manipulation, and the first derivative of the equation Area =X(P-2X)/2 with respect to X. (Click on the Figure 9 caption to see an animation of thisexploration.)
Figure 9. Linked multiple representations of the maximum area problem.
The common "pigpen" problem allows PSTs to investigate and deepen their understanding of therelationship between perimeter and area with a multitude of representations. They begin with amanipulative geometric exploration, tabular recordings and a verbal description of therelationship. They then move to a digital environment with numerical, graphical, and geometricalrepresentations and finally use a paper-and-pencil algebraic representation and symbolicmanipulations to confirm the relationship. This investigation is used to prompt discussions withPSTs about (a) the benefits and drawbacks of using multiple representations, includingmanipulatives, in understanding mathematical relationships and (b) the importance of connectingmathematical topics from middle school through calculus.
Illustrations in Action
Our five guidelines are not independent of one another. All the examples given within each of theguidelines above also illustrate one or more of the other guidelines. The examples used wereintended to provide quick illustrations highlighting a particular guideline. A more in-depth look attwo illustrations in action will highlight the interconnectedness of the guidelines and provideexamples of rich investigations in our secondary methods course.
Illustration in Action 1: Linear Relationships and Regression
The study of linear functions has been a mainstay and an important building block in secondaryschool mathematics. The advent of powerful technology tools has extended the study of linearfunctions to include a data-analysis technique called linear regression, in which data pointsclustering in a linear fashion on a scatterplot can be "best fit" by a line to describe the relationshipbetween the two variables. The most commonly used technique, least-squares regression, can be
77
quickly performed on graphing calculators, computer graphing software, and standardspreadsheets. Although technology places this computationally intense topic within the reach of allstudents (Vonder Embse, 1997), it is important that PSTs and their future students have aconceptual understanding of what it means to perform a least-square regression on data points andhow to interpret the results.
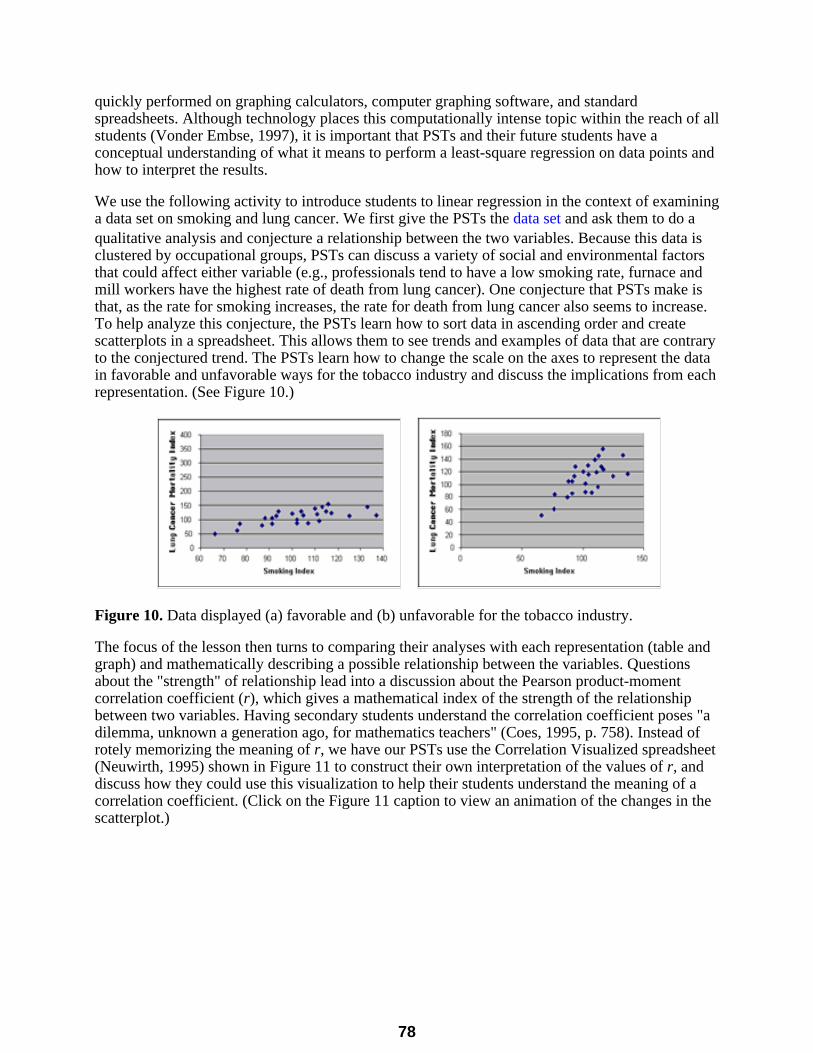
We use the following activity to introduce students to linear regression in the context of examininga data set on smoking and lung cancer. We first give the PSTs the data set and ask them to do aqualitative analysis and conjecture a relationship between the two variables. Because this data isclustered by occupational groups, PSTs can discuss a variety of social and environmental factorsthat could affect either variable (e.g., professionals tend to have a low smoking rate, furnace andmill workers have the highest rate of death from lung cancer). One conjecture that PSTs make isthat, as the rate for smoking increases, the rate for death from lung cancer also seems to increase.To help analyze this conjecture, the PSTs learn how to sort data in ascending order and createscatterplots in a spreadsheet. This allows them to see trends and examples of data that are contraryto the conjectured trend. The PSTs learn how to change the scale on the axes to represent the datain favorable and unfavorable ways for the tobacco industry and discuss the implications from eachrepresentation. (See Figure 10.)
Figure 10. Data displayed (a) favorable and (b) unfavorable for the tobacco industry.
The focus of the lesson then turns to comparing their analyses with each representation (table andgraph) and mathematically describing a possible relationship between the variables. Questionsabout the "strength" of relationship lead into a discussion about the Pearson product-momentcorrelation coefficient (r), which gives a mathematical index of the strength of the relationshipbetween two variables. Having secondary students understand the correlation coefficient poses "adilemma, unknown a generation ago, for mathematics teachers" (Coes, 1995, p. 758). Instead ofrotely memorizing the meaning of r, we have our PSTs use the Correlation Visualized spreadsheet(Neuwirth, 1995) shown in Figure 11 to construct their own interpretation of the values of r, anddiscuss how they could use this visualization to help their students understand the meaning of acorrelation coefficient. (Click on the Figure 11 caption to view an animation of the changes in thescatterplot.)
78
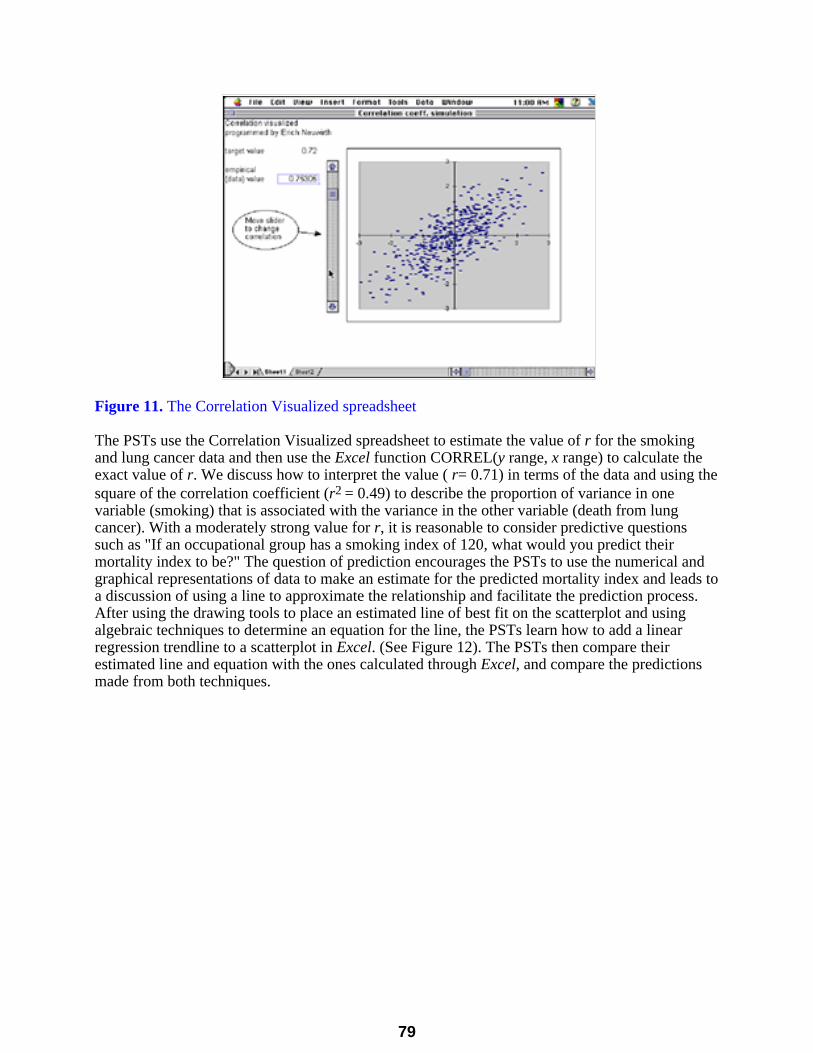
Figure 11. The Correlation Visualized spreadsheet
The PSTs use the Correlation Visualized spreadsheet to estimate the value of r for the smokingand lung cancer data and then use the Excel function CORREL(y range, x range) to calculate theexact value of r. We discuss how to interpret the value ( r= 0.71) in terms of the data and using thesquare of the correlation coefficient (r2 = 0.49) to describe the proportion of variance in onevariable (smoking) that is associated with the variance in the other variable (death from lungcancer). With a moderately strong value for r, it is reasonable to consider predictive questionssuch as "If an occupational group has a smoking index of 120, what would you predict theirmortality index to be?" The question of prediction encourages the PSTs to use the numerical andgraphical representations of data to make an estimate for the predicted mortality index and leads toa discussion of using a line to approximate the relationship and facilitate the prediction process.After using the drawing tools to place an estimated line of best fit on the scatterplot and usingalgebraic techniques to determine an equation for the line, the PSTs learn how to add a linearregression trendline to a scatterplot in Excel. (See Figure 12). The PSTs then compare theirestimated line and equation with the ones calculated through Excel, and compare the predictionsmade from both techniques.
79
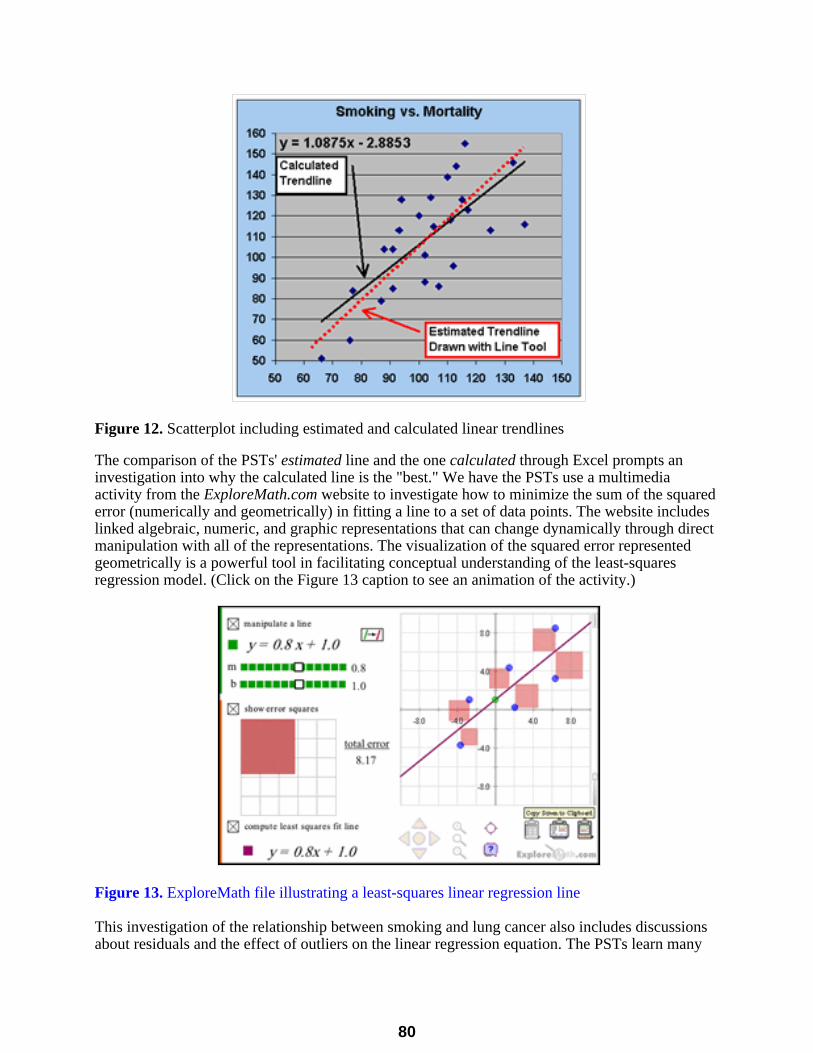
Figure 12. Scatterplot including estimated and calculated linear trendlines
The comparison of the PSTs' estimated line and the one calculated through Excel prompts aninvestigation into why the calculated line is the "best." We have the PSTs use a multimediaactivity from the ExploreMath.com website to investigate how to minimize the sum of the squarederror (numerically and geometrically) in fitting a line to a set of data points. The website includeslinked algebraic, numeric, and graphic representations that can change dynamically through directmanipulation with all of the representations. The visualization of the squared error representedgeometrically is a powerful tool in facilitating conceptual understanding of the least-squaresregression model. (Click on the Figure 13 caption to see an animation of the activity.)
Figure 13. ExploreMath file illustrating a least-squares linear regression line
This investigation of the relationship between smoking and lung cancer also includes discussionsabout residuals and the effect of outliers on the linear regression equation. The PSTs learn many
80
mathematics concepts and technology skills and engage in meaningful discourse about their ownlearning in this activity and the pedagogical issues surrounding teaching these topics and using thetechnology to effectively promote conceptual understanding, rather than mindless "speedy"calculations.
This "illustration-in-action" is rich in mathematics and pedagogy discussions and uses a variety oftechnology tools to facilitate the teaching and learning process. The PSTs learn how to use thetechnology tools in the context of the investigation, when the needed technology skill isappropriate (e.g., adding a trendline to a scatterplot). By focusing on conceptual understanding ofboth correlation coefficient and least-squares regression, we are modeling appropriate pedagogyand sound mathematical practices. We take advantage of technology as a vehicle for bothprocedural and conceptual understanding through using multiple representations, as well asfacilitating classroom discussions. In addition, the mathematics is connected to a real-worldcontroversial issue and also connects the study of linear functions in algebra to statisticaltechniques of linear regression.
Illustration in Action 2: Trigonometric Graphs
The study of trigonometry, which translates verbatim as "triangle measurement," began more than2,000 years ago, partially as a means to solving land surveying problems. Traditionally,trigonometry is introduced as the ratios of the lengths of sides of a right triangle. This iscommonly the first time the students hear the "SOH-CAH-TOA" acronym to remember the threecommon trigonometric ratios:
Because most students are not introduced to these ratios as functions of angle measurement untilprecalculus courses, the connections between the "right triangle" trigonometry and the graphs offunctions of sine, cosine and tangent are not apparent. The following description is an illustrationof an activity we use in our secondary methods class to connect right triangle and functionalrepresentations of trigonometry.
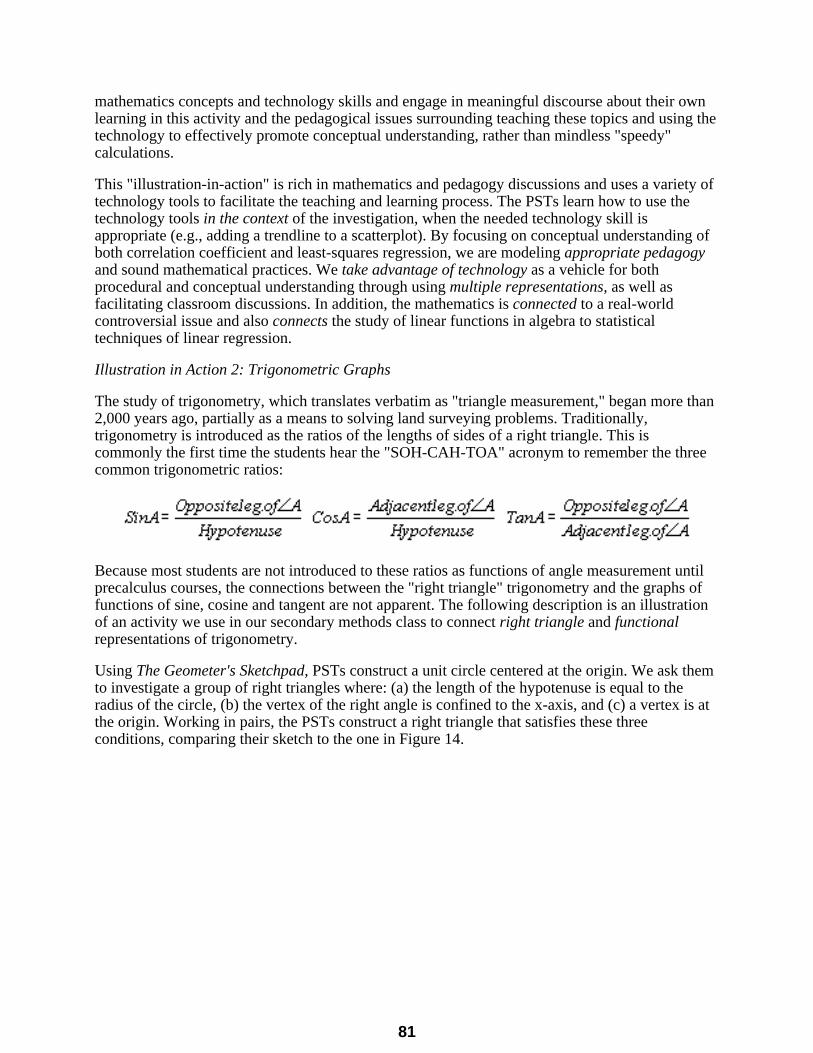
Using The Geometer's Sketchpad, PSTs construct a unit circle centered at the origin. We ask themto investigate a group of right triangles where: (a) the length of the hypotenuse is equal to theradius of the circle, (b) the vertex of the right angle is confined to the x-axis, and (c) a vertex is atthe origin. Working in pairs, the PSTs construct a right triangle that satisfies these threeconditions, comparing their sketch to the one in Figure 14.
81
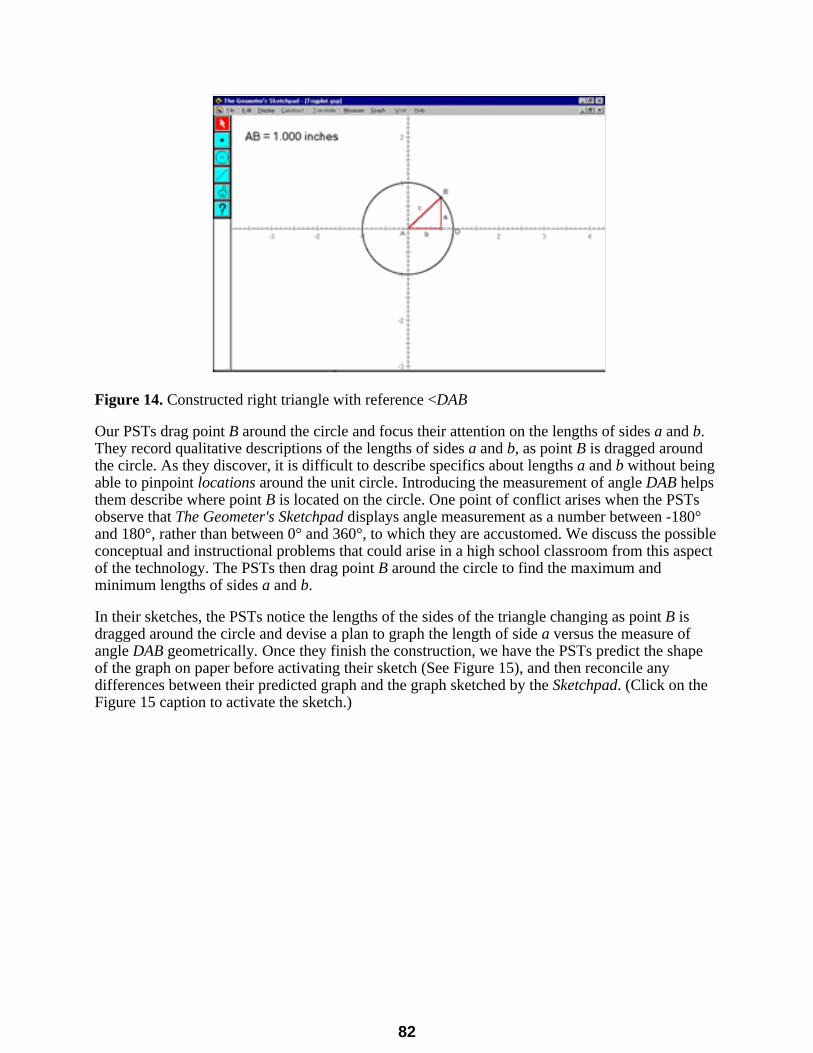
Figure 14. Constructed right triangle with reference <DAB
Our PSTs drag point B around the circle and focus their attention on the lengths of sides a and b.They record qualitative descriptions of the lengths of sides a and b, as point B is dragged aroundthe circle. As they discover, it is difficult to describe specifics about lengths a and b without beingable to pinpoint locations around the unit circle. Introducing the measurement of angle DAB helpsthem describe where point B is located on the circle. One point of conflict arises when the PSTsobserve that The Geometer's Sketchpad displays angle measurement as a number between -180°and 180°, rather than between 0° and 360°, to which they are accustomed. We discuss the possibleconceptual and instructional problems that could arise in a high school classroom from this aspectof the technology. The PSTs then drag point B around the circle to find the maximum andminimum lengths of sides a and b.
In their sketches, the PSTs notice the lengths of the sides of the triangle changing as point B isdragged around the circle and devise a plan to graph the length of side a versus the measure ofangle DAB geometrically. Once they finish the construction, we have the PSTs predict the shapeof the graph on paper before activating their sketch (See Figure 15), and then reconcile anydifferences between their predicted graph and the graph sketched by the Sketchpad. (Click on theFigure 15 caption to activate the sketch.)
82
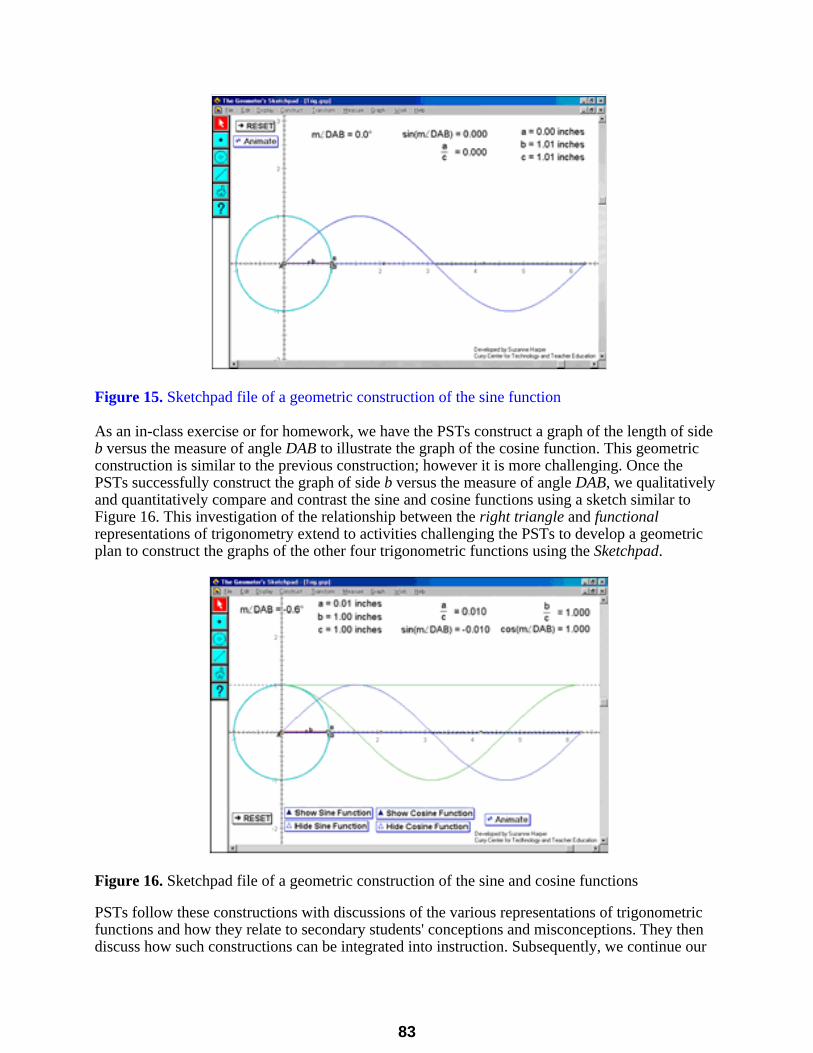
Figure 15. Sketchpad file of a geometric construction of the sine function
As an in-class exercise or for homework, we have the PSTs construct a graph of the length of sideb versus the measure of angle DAB to illustrate the graph of the cosine function. This geometricconstruction is similar to the previous construction; however it is more challenging. Once thePSTs successfully construct the graph of side b versus the measure of angle DAB, we qualitativelyand quantitatively compare and contrast the sine and cosine functions using a sketch similar toFigure 16. This investigation of the relationship between the right triangle and functionalrepresentations of trigonometry extend to activities challenging the PSTs to develop a geometricplan to construct the graphs of the other four trigonometric functions using the Sketchpad.
Figure 16. Sketchpad file of a geometric construction of the sine and cosine functions
PSTs follow these constructions with discussions of the various representations of trigonometricfunctions and how they relate to secondary students' conceptions and misconceptions. They thendiscuss how such constructions can be integrated into instruction. Subsequently, we continue our
83
investigation of trigonometric functions with a graphing calculator activity that illustrates howtechnology facilitates use of mathematics to model real-world phenomena, in this case connectingtrigonometry to physical geography. Together, these activities provide opportunities for the PSTsto view "mathematical ideas from multiple perspectives" (NCTM, 2000, p.24).
The PSTs examine the average monthly temperature data given in Table 1 and describe andinterpret patterns in the data over one year.
Table 1Average Monthly Temperatures
Apr May Jun Jul Aug Sep Oct Nov Dec Jan Feb Mar Apr
Wash. DC 54 64 73 77 75 68 57 46 37 34 36 45 54
Verhoyansk 5 32 54 57 48 36 5 -35 -53 -57 -48 -25 5
Buenos Aries 63 55 48 50 52 55 59 66 72 73 73 70 63
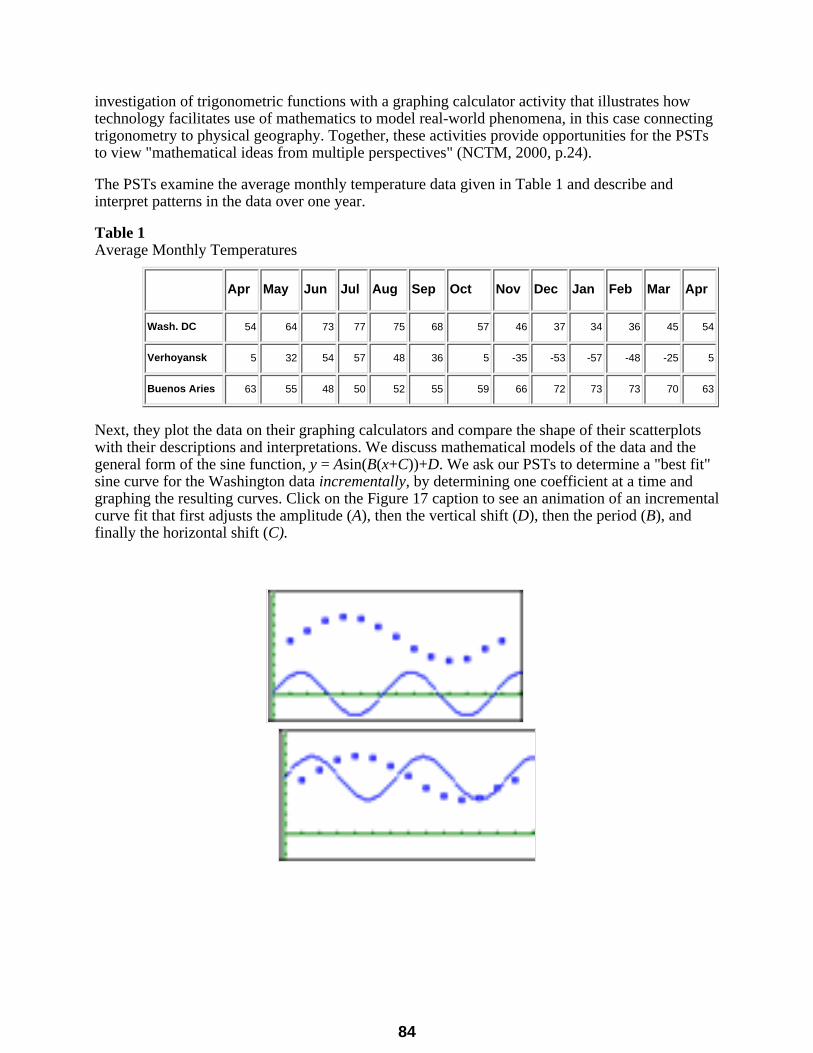
Next, they plot the data on their graphing calculators and compare the shape of their scatterplotswith their descriptions and interpretations. We discuss mathematical models of the data and thegeneral form of the sine function, y = Asin(B(x+C))+D. We ask our PSTs to determine a "best fit"sine curve for the Washington data incrementally, by determining one coefficient at a time andgraphing the resulting curves. Click on the Figure 17 caption to see an animation of an incrementalcurve fit that first adjusts the amplitude (A), then the vertical shift (D), then the period (B), andfinally the horizontal shift (C).
84
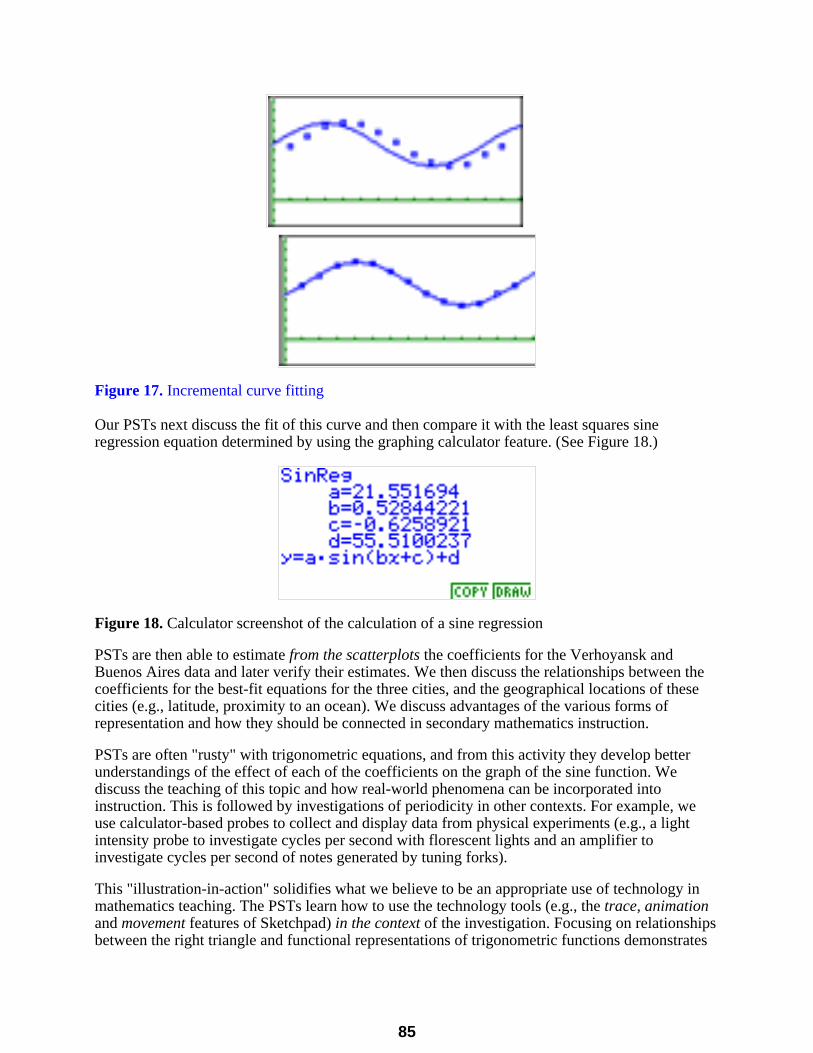
Figure 17. Incremental curve fitting
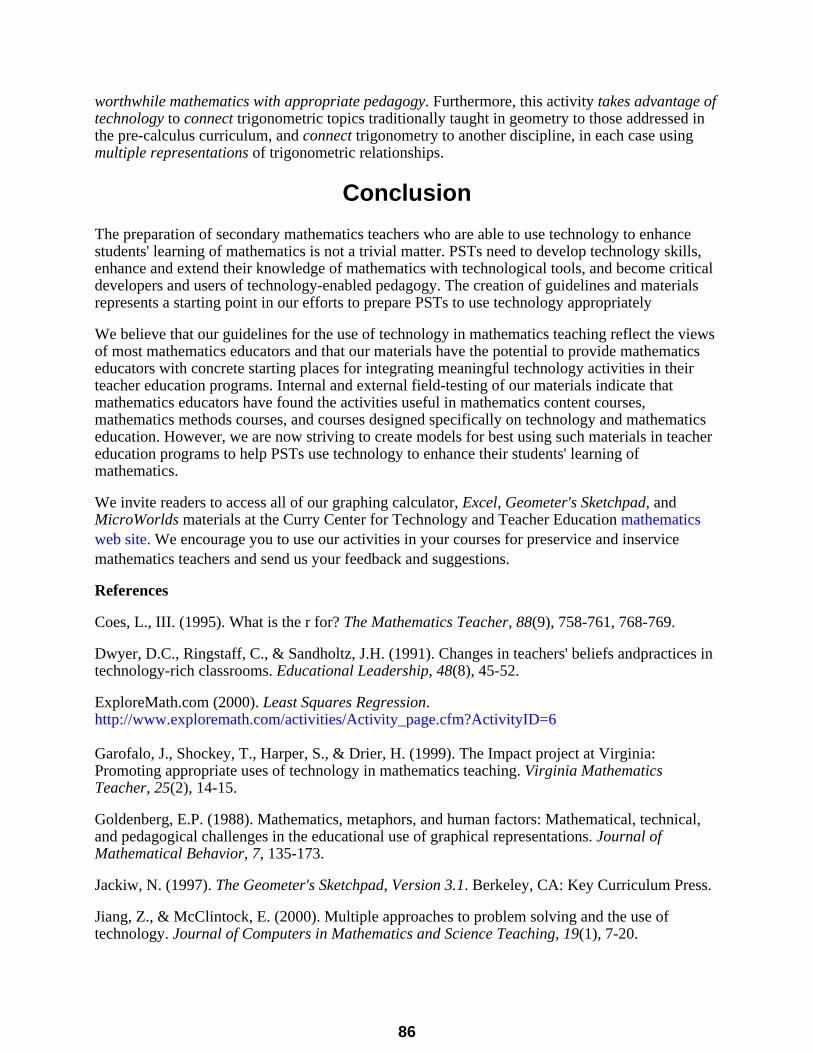
Our PSTs next discuss the fit of this curve and then compare it with the least squares sineregression equation determined by using the graphing calculator feature. (See Figure 18.)
Figure 18. Calculator screenshot of the calculation of a sine regression
PSTs are then able to estimate from the scatterplots the coefficients for the Verhoyansk andBuenos Aires data and later verify their estimates. We then discuss the relationships between thecoefficients for the best-fit equations for the three cities, and the geographical locations of thesecities (e.g., latitude, proximity to an ocean). We discuss advantages of the various forms ofrepresentation and how they should be connected in secondary mathematics instruction.
PSTs are often "rusty" with trigonometric equations, and from this activity they develop betterunderstandings of the effect of each of the coefficients on the graph of the sine function. Wediscuss the teaching of this topic and how real-world phenomena can be incorporated intoinstruction. This is followed by investigations of periodicity in other contexts. For example, weuse calculator-based probes to collect and display data from physical experiments (e.g., a lightintensity probe to investigate cycles per second with florescent lights and an amplifier toinvestigate cycles per second of notes generated by tuning forks).
This "illustration-in-action" solidifies what we believe to be an appropriate use of technology inmathematics teaching. The PSTs learn how to use the technology tools (e.g., the trace, animationand movement features of Sketchpad) in the context of the investigation. Focusing on relationshipsbetween the right triangle and functional representations of trigonometric functions demonstrates
85
worthwhile mathematics with appropriate pedagogy. Furthermore, this activity takes advantage oftechnology to connect trigonometric topics traditionally taught in geometry to those addressed inthe pre-calculus curriculum, and connect trigonometry to another discipline, in each case usingmultiple representations of trigonometric relationships.
Conclusion
The preparation of secondary mathematics teachers who are able to use technology to enhancestudents' learning of mathematics is not a trivial matter. PSTs need to develop technology skills,enhance and extend their knowledge of mathematics with technological tools, and become criticaldevelopers and users of technology-enabled pedagogy. The creation of guidelines and materialsrepresents a starting point in our efforts to prepare PSTs to use technology appropriately
We believe that our guidelines for the use of technology in mathematics teaching reflect the viewsof most mathematics educators and that our materials have the potential to provide mathematicseducators with concrete starting places for integrating meaningful technology activities in theirteacher education programs. Internal and external field-testing of our materials indicate thatmathematics educators have found the activities useful in mathematics content courses,mathematics methods courses, and courses designed specifically on technology and mathematicseducation. However, we are now striving to create models for best using such materials in teachereducation programs to help PSTs use technology to enhance their students' learning ofmathematics.
We invite readers to access all of our graphing calculator, Excel, Geometer's Sketchpad, andMicroWorlds materials at the Curry Center for Technology and Teacher Education mathematicsweb site. We encourage you to use our activities in your courses for preservice and inservicemathematics teachers and send us your feedback and suggestions.
References
Coes, L., III. (1995). What is the r for? The Mathematics Teacher, 88(9), 758-761, 768-769.
Dwyer, D.C., Ringstaff, C., & Sandholtz, J.H. (1991). Changes in teachers' beliefs andpractices intechnology-rich classrooms. Educational Leadership, 48(8), 45-52.
ExploreMath.com (2000). Least Squares Regression.http://www.exploremath.com/activities/Activity_page.cfm?ActivityID=6
Garofalo, J., Shockey, T., Harper, S., & Drier, H. (1999). The Impact project at Virginia:Promoting appropriate uses of technology in mathematics teaching. Virginia MathematicsTeacher, 25(2), 14-15.
Goldenberg, E.P. (1988). Mathematics, metaphors, and human factors: Mathematical, technical,and pedagogical challenges in the educational use of graphical representations. Journal ofMathematical Behavior, 7, 135-173.
Jackiw, N. (1997). The Geometer's Sketchpad, Version 3.1. Berkeley, CA: Key Curriculum Press.
Jiang, Z., & McClintock, E. (2000). Multiple approaches to problem solving and the use oftechnology. Journal of Computers in Mathematics and Science Teaching, 19(1), 7-20.
86
Kaput, J.J. (1992). Technology and mathematics education. In D.A. Grouws (Ed.), Handbook ofresearch on mathematics teaching and learning (pp. 515-556). New York:Macmillan.
Kerslake, D. (1977). The understanding of graphs. Mathematics in School, 6(2), 56-63.
Leinhardt, G., Zaslavsky, O., & Stein, M.K. (1990). Functions, graphs, and graphing: Tasks,learning and teaching. Review of Educational Research, 60(1), 1-64.
Logo Computer Systems Inc. (1997). MicroWorlds, Version 2.0. Montreal, CA: Author.
Means, B., & Olson., K. (1994). Tomorrow's schools: Technology and reform in partnership. In B.Means (Ed.), Technology and the education reform (pp. 191-222). San Francisco: Jossey-Bass.
Mergendoller, J.R. (1994). The Curry School of Education, University of Virginia. In Exemplaryapproaches to training teachers to use technology, vol. 1: Case studies (pp. 4.1-4.24). Novato,CA: Beryl Buck Institute for Education.
Microsoft Corporation (2000). Microsoft Excel 2000. Redmond, WA: Author.
National Council of Teachers of Mathematics. (1989). Curriculum and evaluation standards forschool mathematics. Reston, VA: Author.
National Council of Teachers of Mathematics. (1991). Professional standards for teachingmathematics. Reston, VA: Author.
National Council of Teachers of Mathematics. (2000). Principles and standards for schoolmathematics. Reston, VA: Author.
Neuwirth, E. (1995). Correlation visualized. http://sunsite.univie.ac.at/Spreadsite/statexamp.
President's Committee of Advisors on Science and Technology, Panel on Educational Technology.(1997). Report to the President on the use of technology to strengthen K-12 education in theUnited States.
Schoenfeld, A. (1985). Mathematical problem solving. New York: Academic Press.
Waits, B.K., & Demana, F. (2000). Calculators in mathematics teaching and learning: Past,present, and future. In M. J. Burke and F. R. Curcio (Eds.), Learning mathematics for a newcentury (pp. 51-66). Reston, VA: National Council of Teachers of Mathematics.
Vonder Embse, C. (1997). Visualizing least-square lines of best fit. The Mathematics Teacher,90(5), 404-408.
Contact Information:
Joe GarofaloCurry School of EducationUniversity of VirginiaLambeth House1912 Thompson RoadCharlottesville, VA [email protected]
87
Contemporary Issues in Technology and Teacher Education is an online journal. All text, tables, and figures in theprint version of this article are exact representations of the original. However, the original article may also includevideo and audio files, which can be accessed on the World Wide Web at http://www.citejournal.org
88
Recommended

![Computational Thinking in Mathematics Teacher Education · An example of the mind-maps TCs created through Popplet. [/caption] Contemporary Issues in Technology and Teacher Education,](https://img.pdfslide.net/doc/110x75/5e7195911174f76b250f0980/computational-thinking-in-mathematics-teacher-education-an-example-of-the-mind-maps.jpg)