1 | October 6, 2016 | Proprietary | © 2016 Curtiss-Wright
Investor Day 2016
Nuclear Power Overview
NYSE: CW
2 | October 6, 2016 | Proprietary | © 2016 Curtiss-Wright
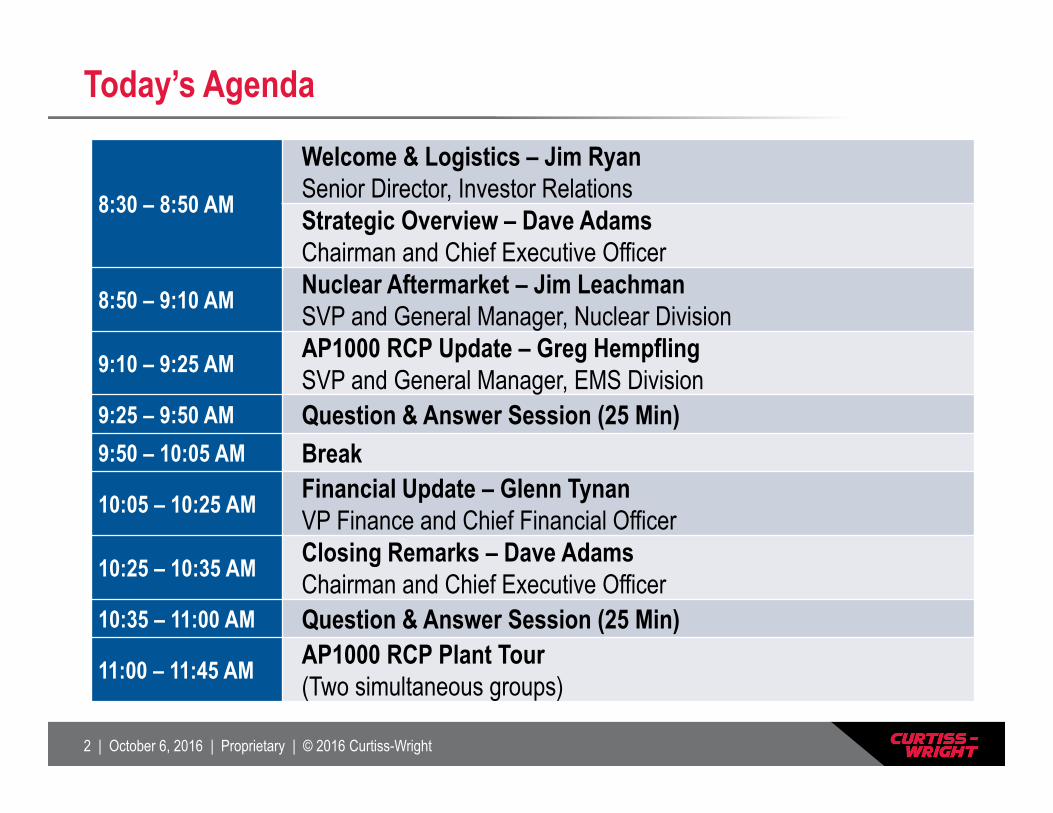
Today’s Agenda
8:30 – 8:50 AM
Welcome & Logistics – Jim RyanSenior Director, Investor RelationsStrategic Overview – Dave AdamsChairman and Chief Executive Officer
8:50 – 9:10 AM Nuclear Aftermarket – Jim LeachmanSVP and General Manager, Nuclear Division
9:10 – 9:25 AM AP1000 RCP Update – Greg HempflingSVP and General Manager, EMS Division
9:25 – 9:50 AM Question & Answer Session (25 Min)9:50 – 10:05 AM Break
10:05 – 10:25 AM Financial Update – Glenn TynanVP Finance and Chief Financial Officer
10:25 – 10:35 AM Closing Remarks – Dave AdamsChairman and Chief Executive Officer
10:35 – 11:00 AM Question & Answer Session (25 Min)
11:00 – 11:45 AM AP1000 RCP Plant Tour (Two simultaneous groups)
3 | October 6, 2016 | Proprietary | © 2016 Curtiss-Wright
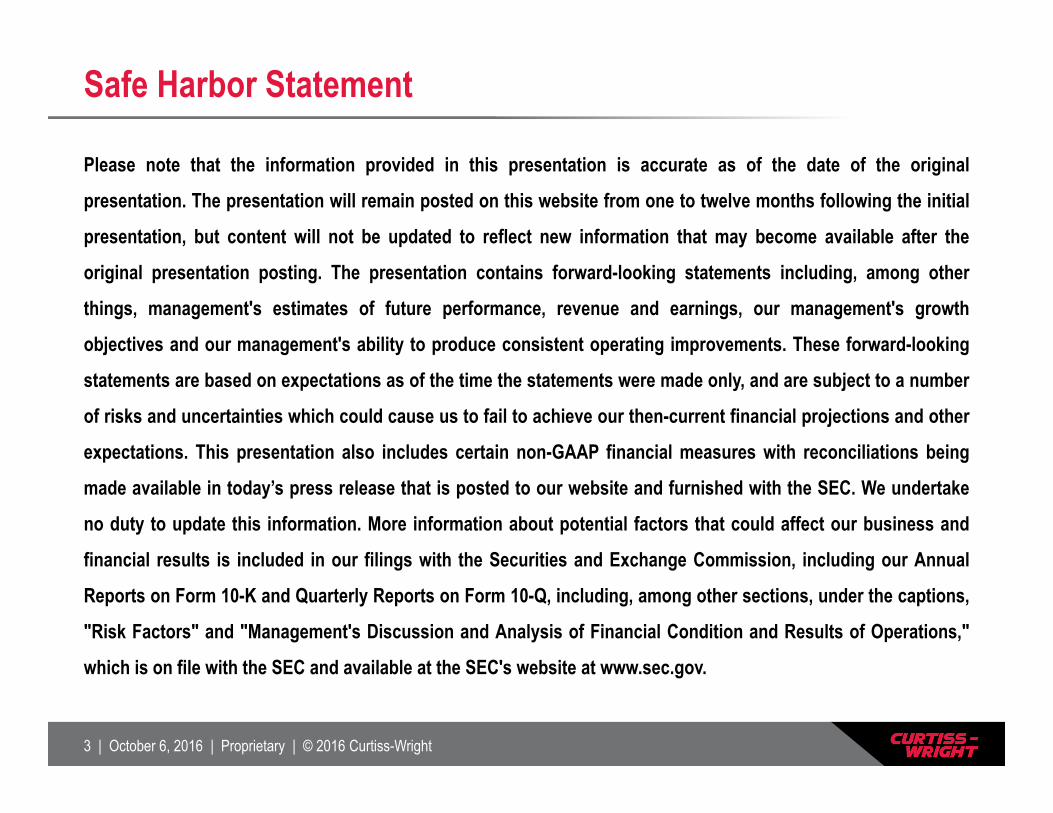
Safe Harbor Statement
Please note that the information provided in this presentation is accurate as of the date of the original
presentation. The presentation will remain posted on this website from one to twelve months following the initial
presentation, but content will not be updated to reflect new information that may become available after the
original presentation posting. The presentation contains forward-looking statements including, among other
things, management's estimates of future performance, revenue and earnings, our management's growth
objectives and our management's ability to produce consistent operating improvements. These forward-looking
statements are based on expectations as of the time the statements were made only, and are subject to a number
of risks and uncertainties which could cause us to fail to achieve our then-current financial projections and other
expectations. This presentation also includes certain non-GAAP financial measures with reconciliations being
made available in today’s press release that is posted to our website and furnished with the SEC. We undertake
no duty to update this information. More information about potential factors that could affect our business and
financial results is included in our filings with the Securities and Exchange Commission, including our Annual
Reports on Form 10-K and Quarterly Reports on Form 10-Q, including, among other sections, under the captions,
"Risk Factors" and "Management's Discussion and Analysis of Financial Condition and Results of Operations,"
which is on file with the SEC and available at the SEC's website at www.sec.gov.

4 | October 6, 2016 | Proprietary | © 2016 Curtiss-Wright
Strategic Overview
David C. Adams, Chairman and CEO
5 | October 6, 2016 | Proprietary | © 2016 Curtiss-Wright
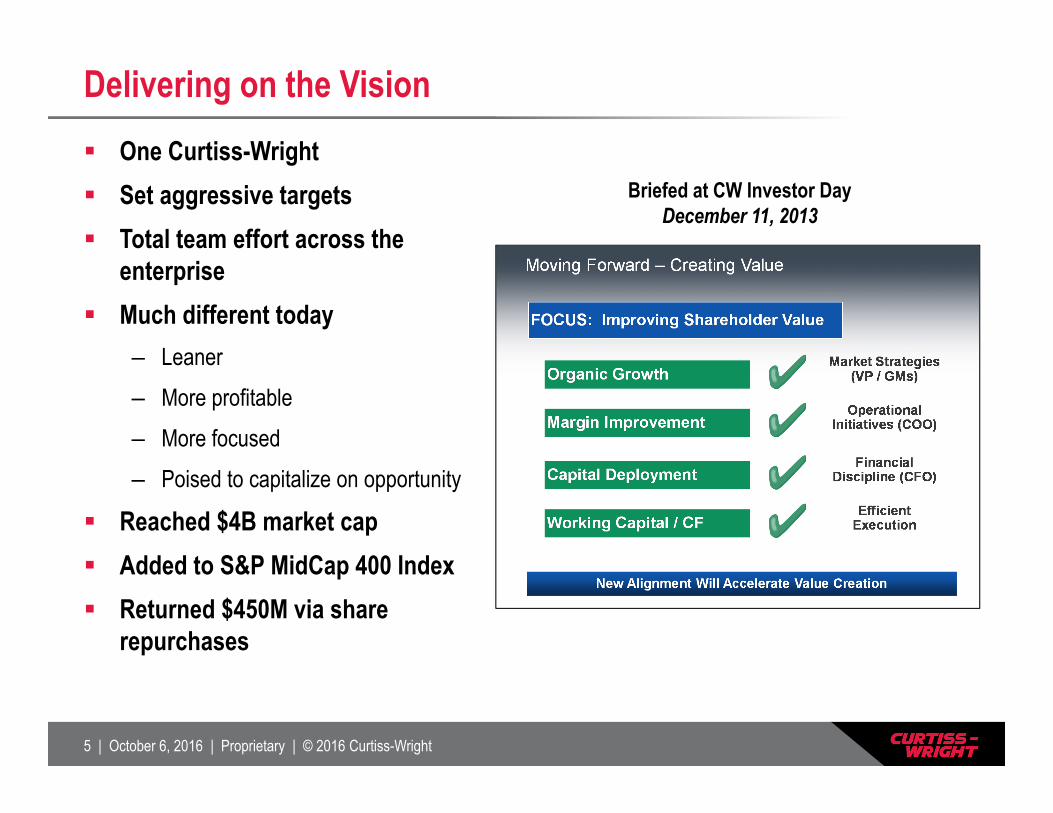
Delivering on the Vision
Briefed at CW Investor DayDecember 11, 2013
One Curtiss-Wright Set aggressive targets Total team effort across the
enterprise Much different today
– Leaner– More profitable– More focused– Poised to capitalize on opportunity
Reached $4B market cap Added to S&P MidCap 400 Index Returned $450M via share
repurchases
6 | October 6, 2016 | Proprietary | © 2016 Curtiss-Wright
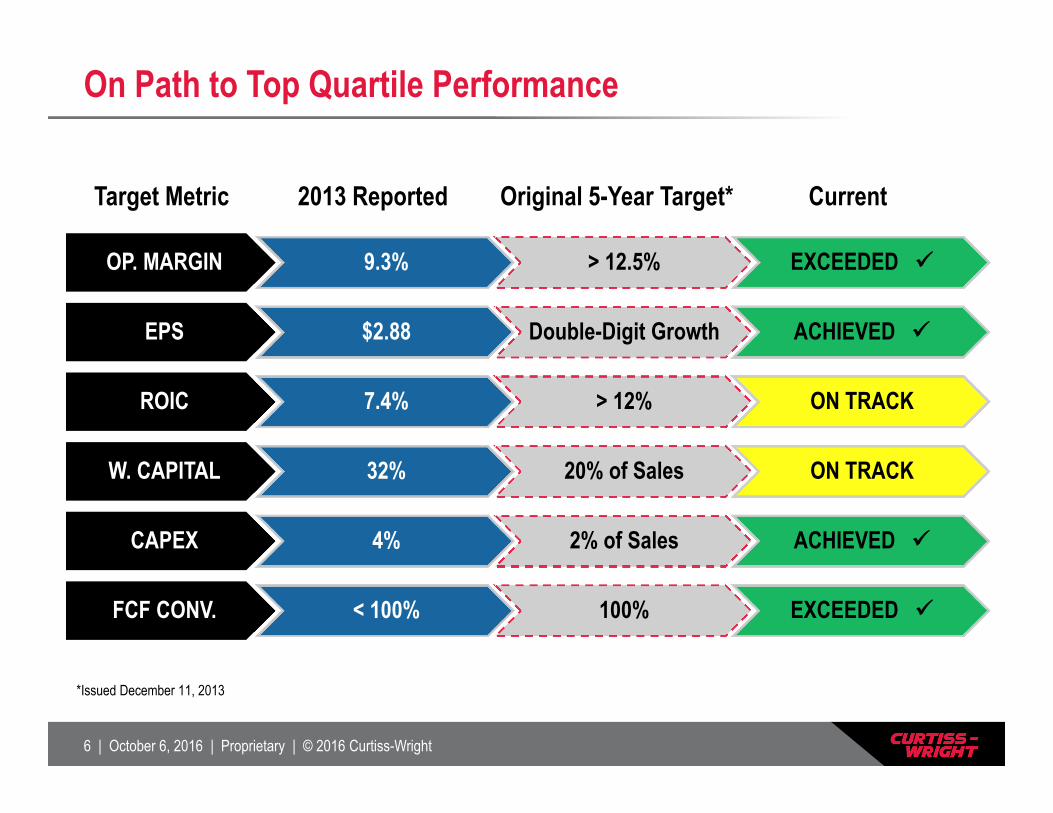
On Path to Top Quartile Performance
Target Metric Original 5-Year Target* Current
OP. MARGIN 9.3% > 12.5% EXCEEDED
EPS $2.88 Double-Digit Growth ACHIEVED
ROIC 7.4% > 12% ON TRACK
W. CAPITAL 32% 20% of Sales ON TRACK
CAPEX 4% 2% of Sales ACHIEVED
FCF CONV. < 100% 100% EXCEEDED
2013 Reported
*Issued December 11, 2013
7 | October 6, 2016 | Proprietary | © 2016 Curtiss-Wright
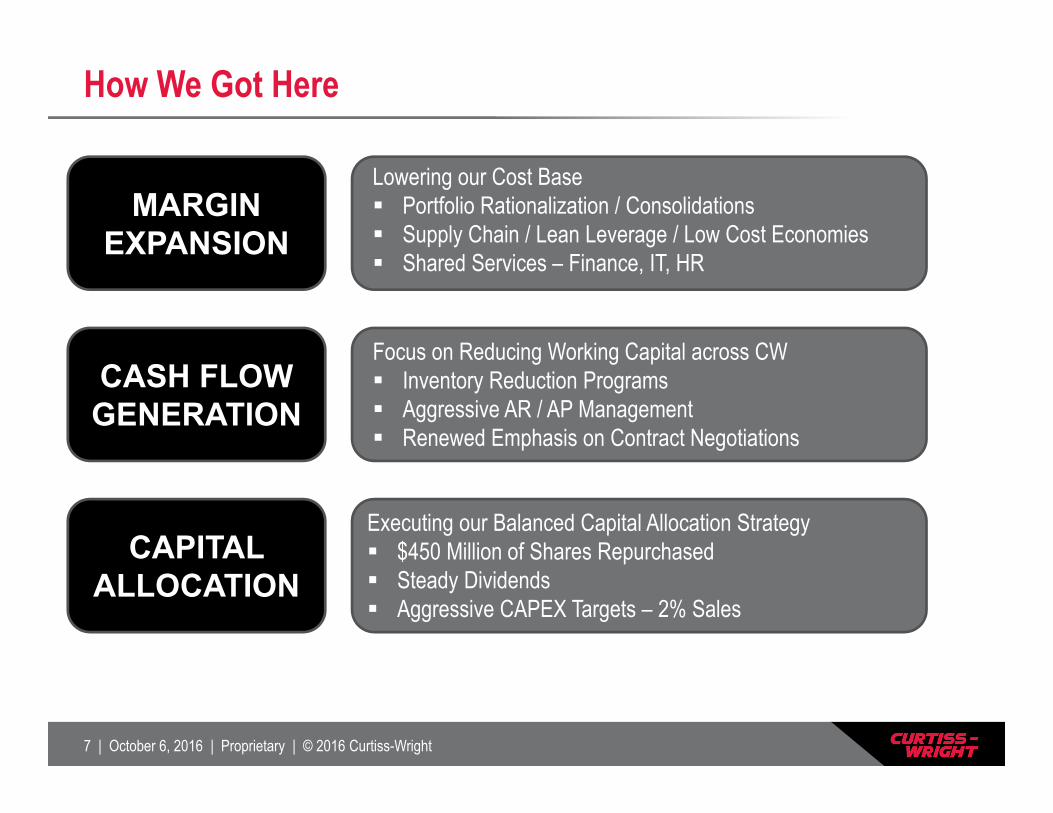
How We Got Here
MARGIN EXPANSION
CASH FLOW GENERATION
CAPITAL ALLOCATION
Lowering our Cost Base Portfolio Rationalization / Consolidations Supply Chain / Lean Leverage / Low Cost Economies Shared Services – Finance, IT, HR
Executing our Balanced Capital Allocation Strategy $450 Million of Shares Repurchased Steady Dividends Aggressive CAPEX Targets – 2% Sales
Focus on Reducing Working Capital across CW Inventory Reduction Programs Aggressive AR / AP Management Renewed Emphasis on Contract Negotiations
8 | October 6, 2016 | Proprietary | © 2016 Curtiss-Wright
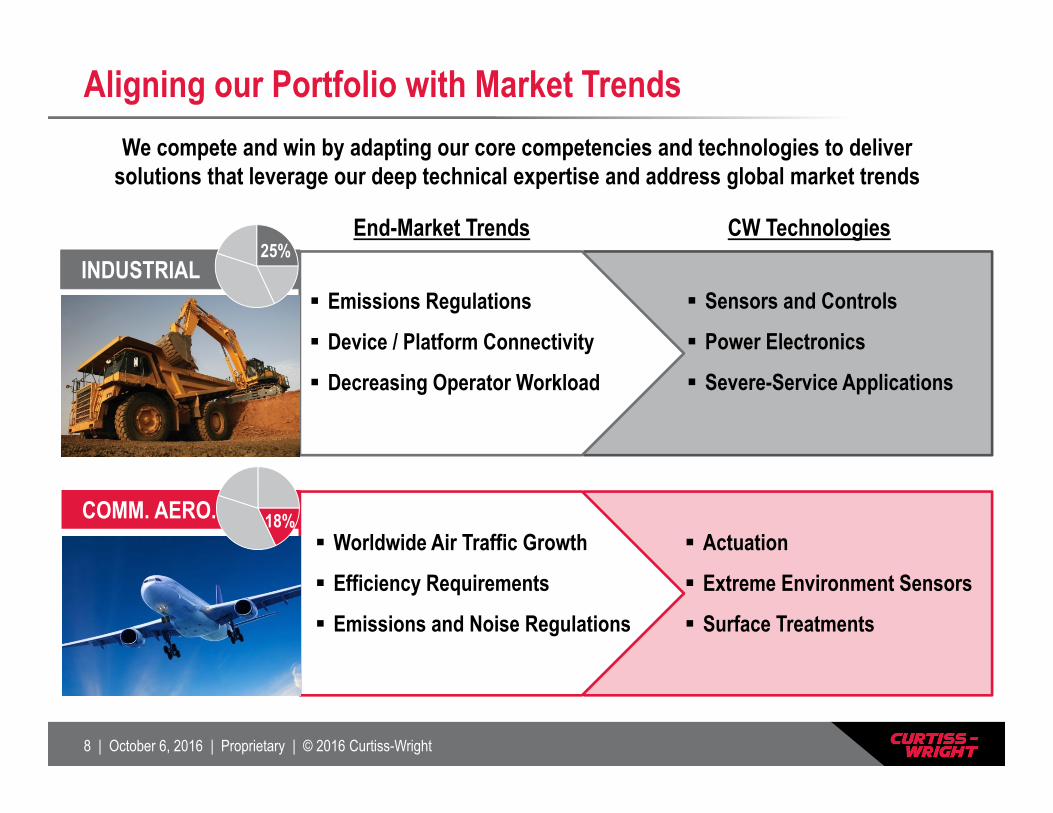
We compete and win by adapting our core competencies and technologies to deliver solutions that leverage our deep technical expertise and address global market trends
Aligning our Portfolio with Market Trends
CW TechnologiesEnd-Market Trends
COMM. AERO.
INDUSTRIAL Emissions Regulations
Device / Platform Connectivity
Decreasing Operator Workload
Worldwide Air Traffic Growth
Efficiency Requirements
Emissions and Noise Regulations
Actuation
Extreme Environment Sensors
Surface Treatments
Sensors and Controls
Power Electronics
Severe-Service Applications
25%
18%
9 | October 6, 2016 | Proprietary | © 2016 Curtiss-Wright
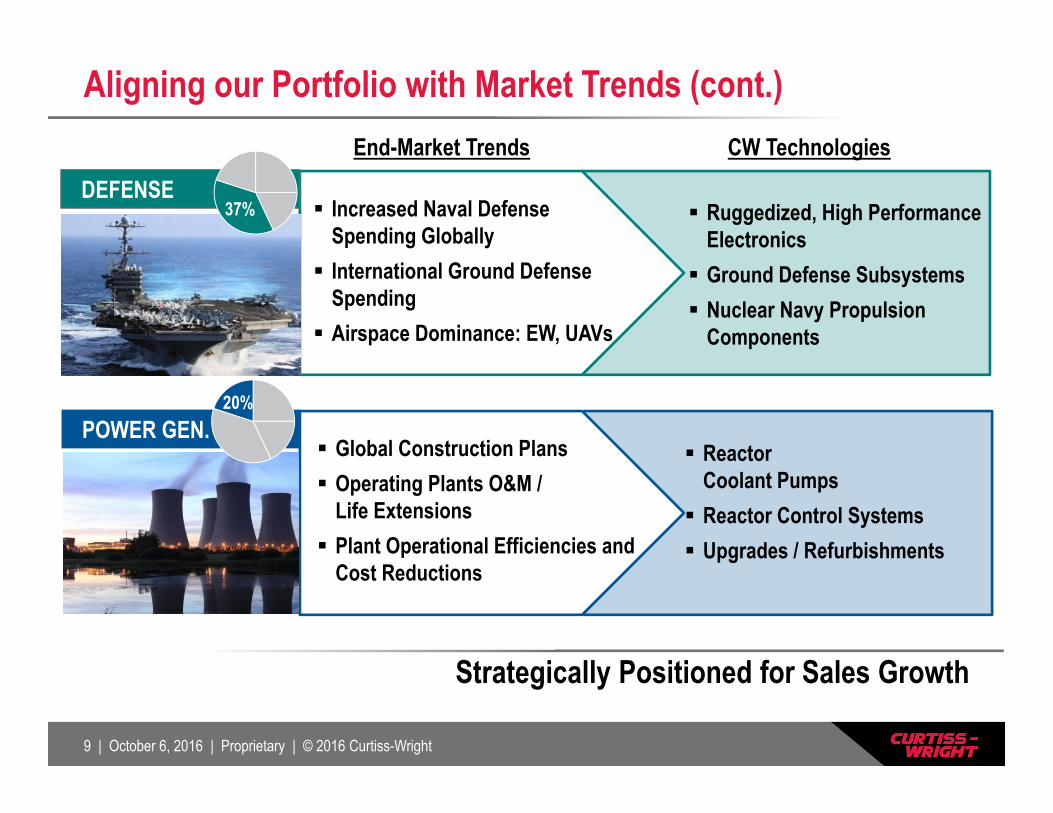
Aligning our Portfolio with Market Trends (cont.)
Strategically Positioned for Sales Growth
Ruggedized, High Performance Electronics Ground Defense Subsystems Nuclear Navy Propulsion
Components
Increased Naval Defense Spending Globally International Ground Defense
Spending Airspace Dominance: EW, UAVs
CW Technologies
Global Construction Plans Operating Plants O&M /
Life Extensions Plant Operational Efficiencies and
Cost Reductions
Reactor Coolant Pumps Reactor Control Systems Upgrades / Refurbishments
End-Market Trends
DEFENSE
POWER GEN.20%
37%
10 | October 6, 2016 | Proprietary | © 2016 Curtiss-Wright
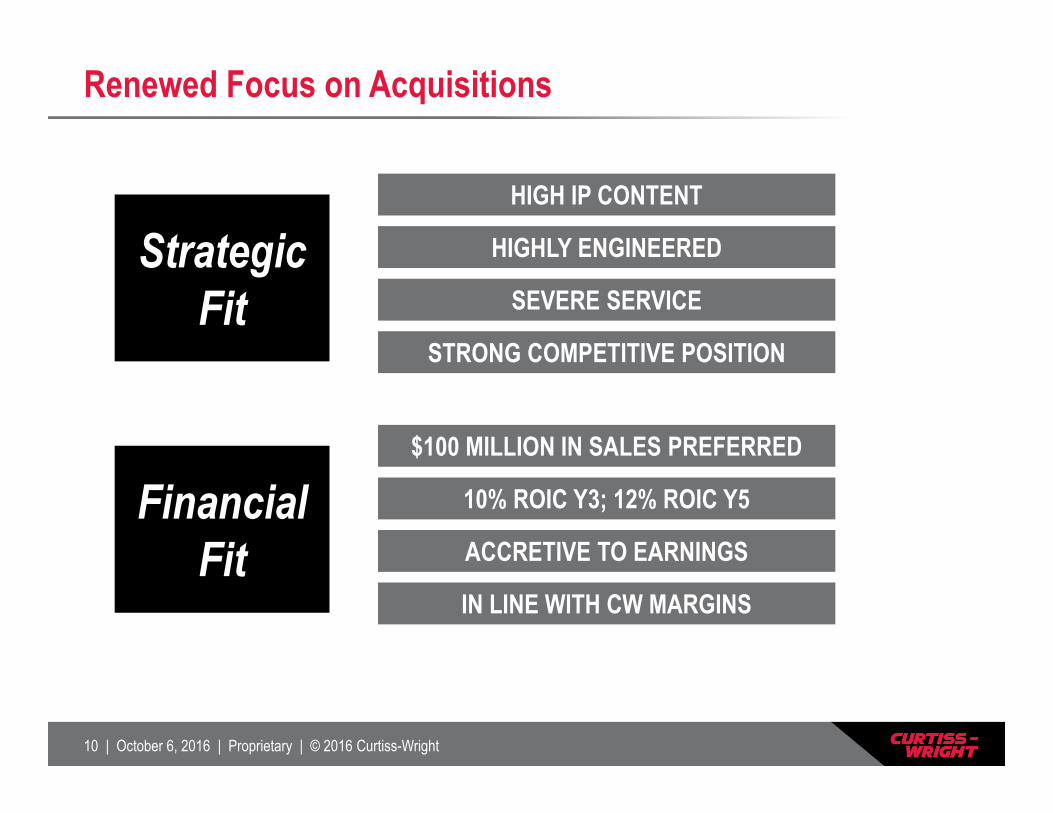
Renewed Focus on Acquisitions
HIGH IP CONTENT
HIGHLY ENGINEERED
SEVERE SERVICE
STRONG COMPETITIVE POSITION
Strategic Fit
$100 MILLION IN SALES PREFERRED
10% ROIC Y3; 12% ROIC Y5
ACCRETIVE TO EARNINGS
IN LINE WITH CW MARGINS
Financial Fit
11 | October 6, 2016 | Proprietary | © 2016 Curtiss-Wright
Well Positioned for Growth
Consistently Increasing Shareholder Value
SALES VOLUME
O.I.
EPS
FCF
Rebounds in Core Markets….
….will Drive Strong Profitability and Free Cash Flow
12 | October 6, 2016 | Proprietary | © 2016 Curtiss-Wright
Nuclear AftermarketJim Leachman, SVP and General Manager, Nuclear Division
13 | October 6, 2016 | Proprietary | © 2016 Curtiss-Wright
Overview
Nuclear Aftermarket Business
Worldwide Trends
Market Dynamics
Challenges and Opportunities
14 | October 6, 2016 | Proprietary | © 2016 Curtiss-Wright
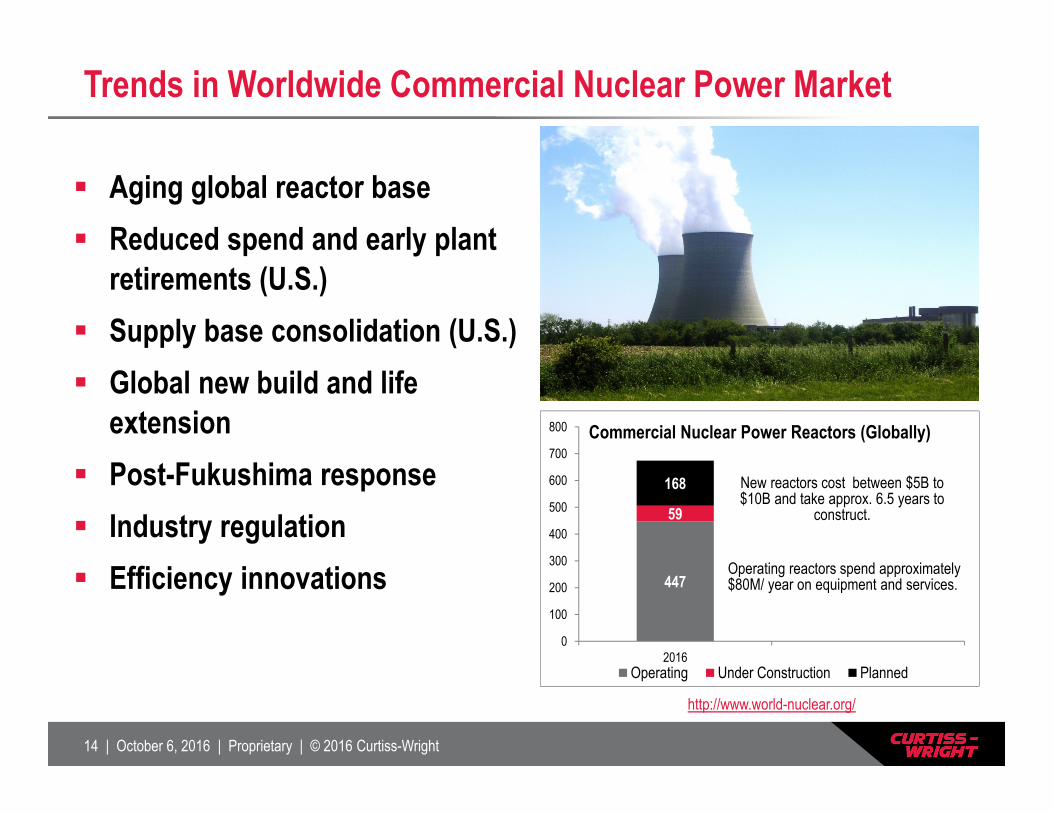
Trends in Worldwide Commercial Nuclear Power Market
Aging global reactor base Reduced spend and early plant
retirements (U.S.) Supply base consolidation (U.S.) Global new build and life
extension Post-Fukushima response Industry regulation Efficiency innovations
Insert Picture(s)
447
59
168
0
100
200
300
400
500
600
700
800
2016
Commercial Nuclear Power Reactors (Globally)
Operating Under Construction Planned
Operating reactors spend approximately $80M/ year on equipment and services.
New reactors cost between $5B to $10B and take approx. 6.5 years to
construct.
http://www.world-nuclear.org/
15 | October 6, 2016 | Proprietary | © 2016 Curtiss-Wright
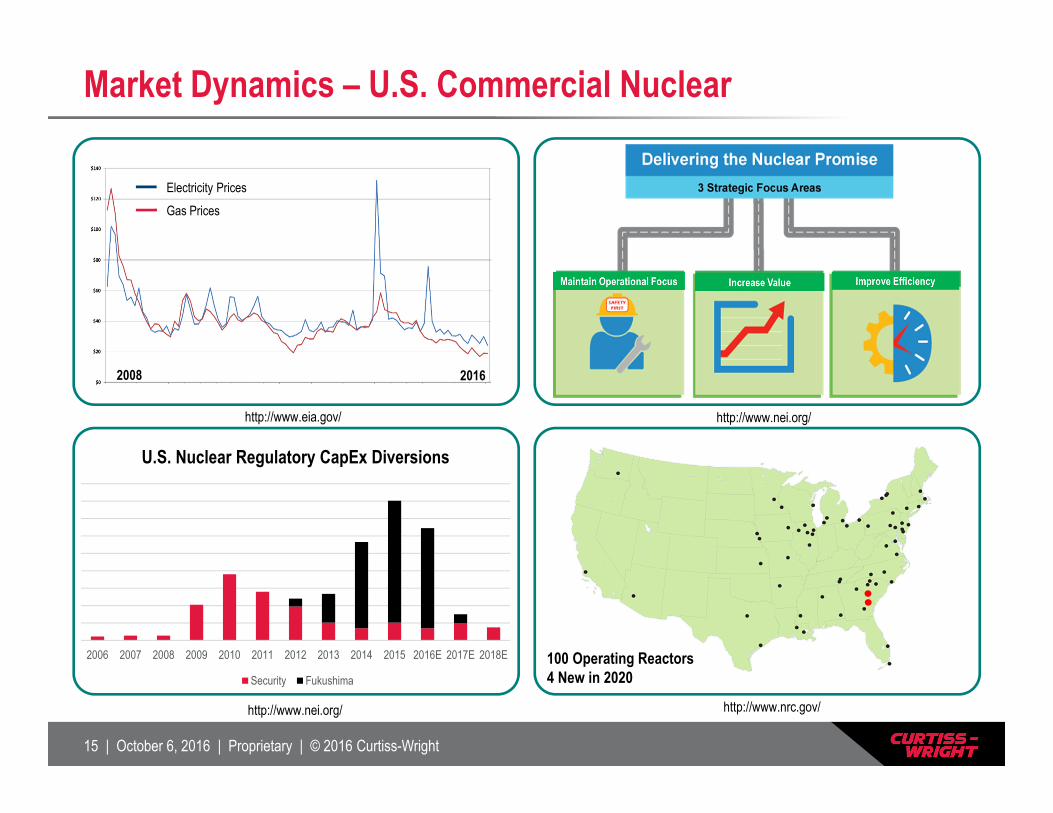
Market Dynamics – U.S. Commercial Nuclear
Gas PricesElectricity Prices
2008 2016
100 Operating Reactors4 New in 2020
2006 2007 2008 2009 2010 2011 2012 2013 2014 2015 2016E 2017E 2018E
U.S. Nuclear Regulatory CapEx Diversions
Security Fukushima
http://www.nrc.gov/
http://www.eia.gov/
http://www.nei.org/
http://www.nei.org/
16 | October 6, 2016 | Proprietary | © 2016 Curtiss-Wright
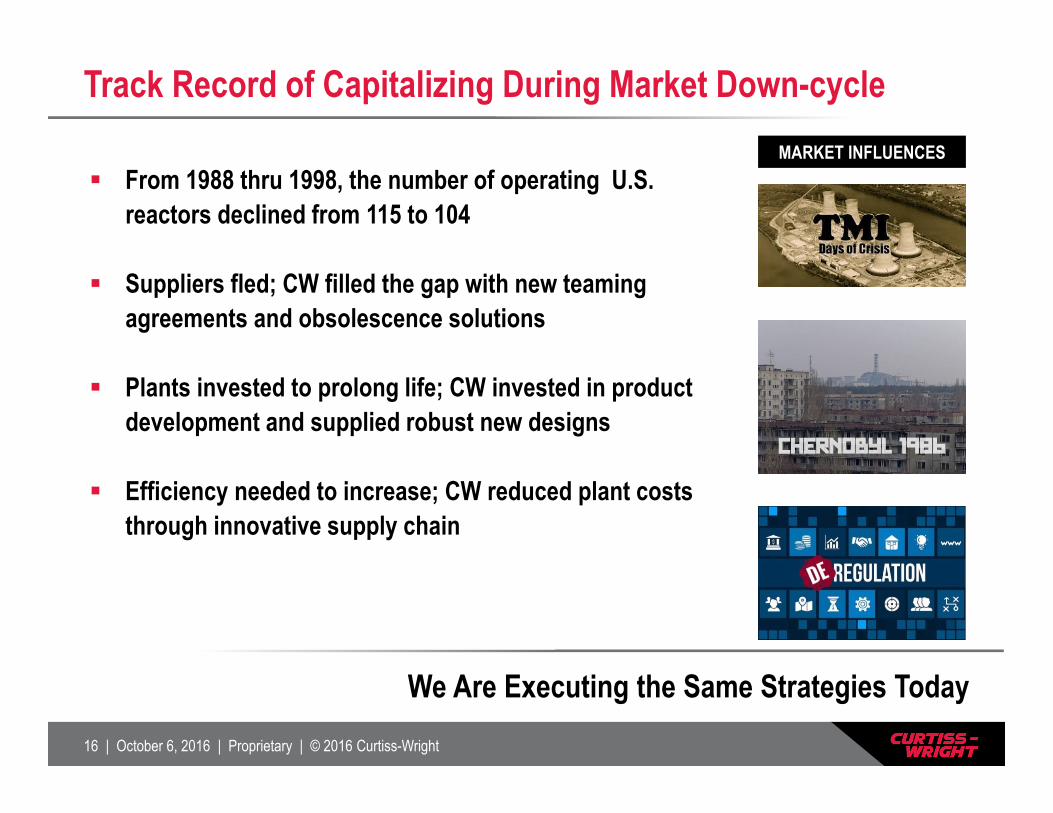
Track Record of Capitalizing During Market Down-cycle
We Are Executing the Same Strategies Today
From 1988 thru 1998, the number of operating U.S. reactors declined from 115 to 104
Suppliers fled; CW filled the gap with new teaming agreements and obsolescence solutions
Plants invested to prolong life; CW invested in product development and supplied robust new designs
Efficiency needed to increase; CW reduced plant coststhrough innovative supply chain
MARKET INFLUENCES
17 | October 6, 2016 | Proprietary | © 2016 Curtiss-Wright
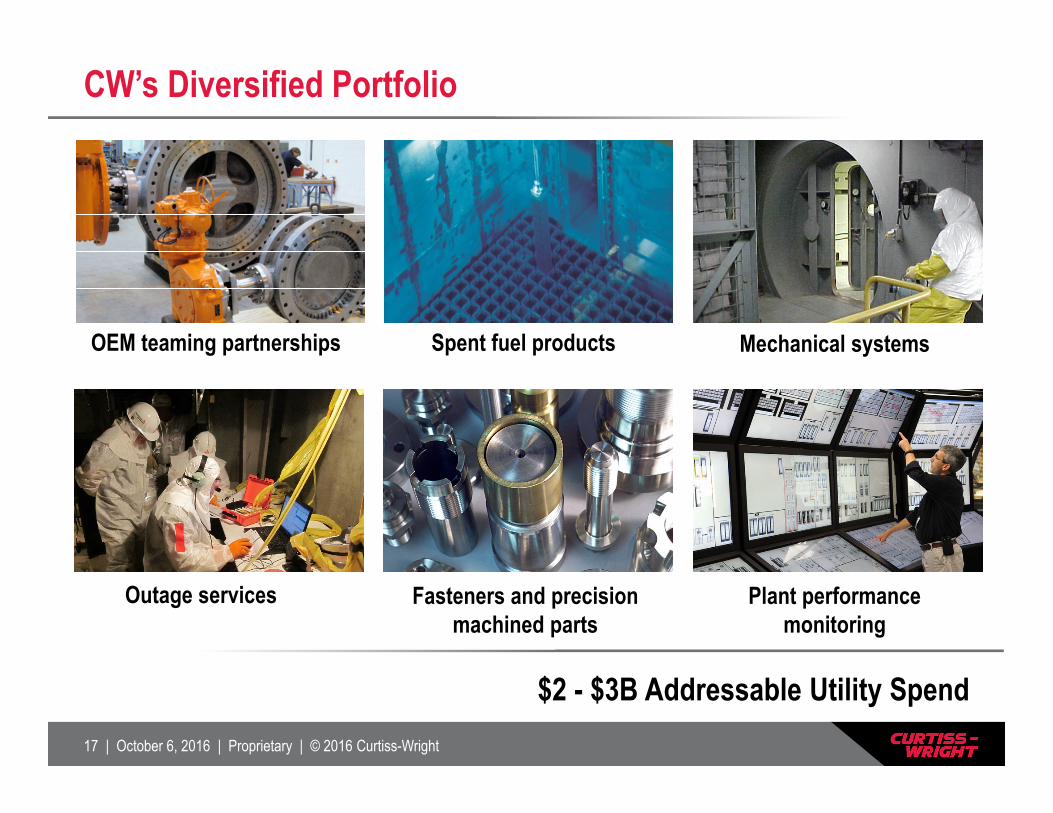
CW’s Diversified Portfolio
Mechanical systems OEM teaming partnerships Spent fuel products
Outage services Fasteners and precision machined parts
Plant performance monitoring
$2 - $3B Addressable Utility Spend
18 | October 6, 2016 | Proprietary | © 2016 Curtiss-Wright
What Will Drive Our Growth?
Addressing Plant Efficiency and Reliability Requirements
Capitalizing on Supplier Consolidation
Leveraging Global Plant Aging Trends
Increasing Content on New Build Reactors
19 | October 6, 2016 | Proprietary | © 2016 Curtiss-Wright
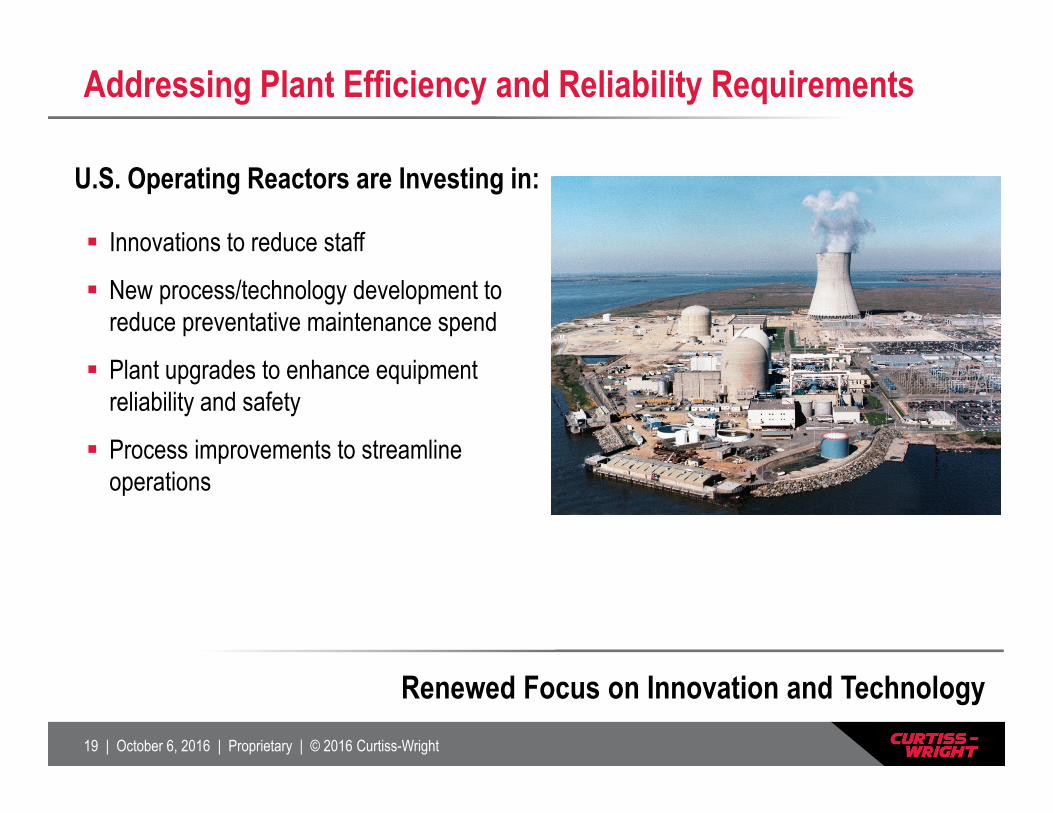
Addressing Plant Efficiency and Reliability Requirements
U.S. Operating Reactors are Investing in:
Innovations to reduce staff
New process/technology development to reduce preventative maintenance spend
Plant upgrades to enhance equipment reliability and safety
Process improvements to streamline operations
Renewed Focus on Innovation and Technology
20 | October 6, 2016 | Proprietary | © 2016 Curtiss-Wright
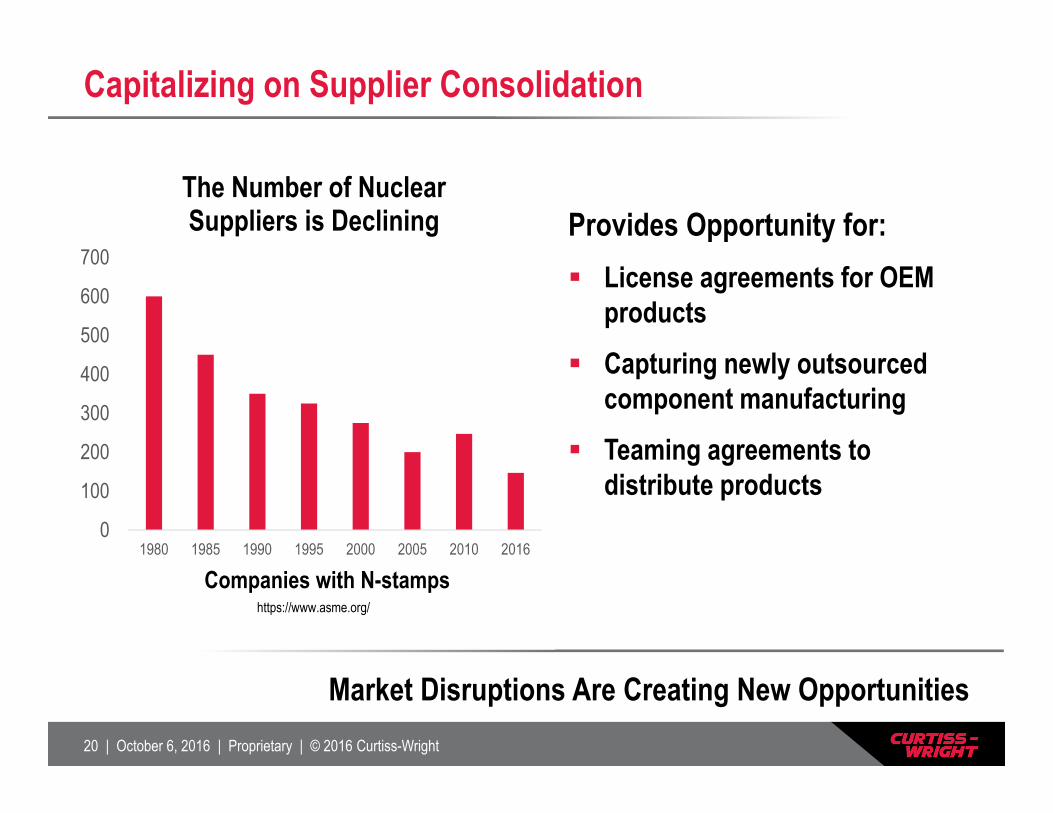
Capitalizing on Supplier Consolidation
Provides Opportunity for: License agreements for OEM
products Capturing newly outsourced
component manufacturing Teaming agreements to
distribute products0
100
200
300
400
500
600
700
1980 1985 1990 1995 2000 2005 2010 2016
The Number of Nuclear Suppliers is Declining
Market Disruptions Are Creating New Opportunities
Companies with N-stampshttps://www.asme.org/
21 | October 6, 2016 | Proprietary | © 2016 Curtiss-Wright
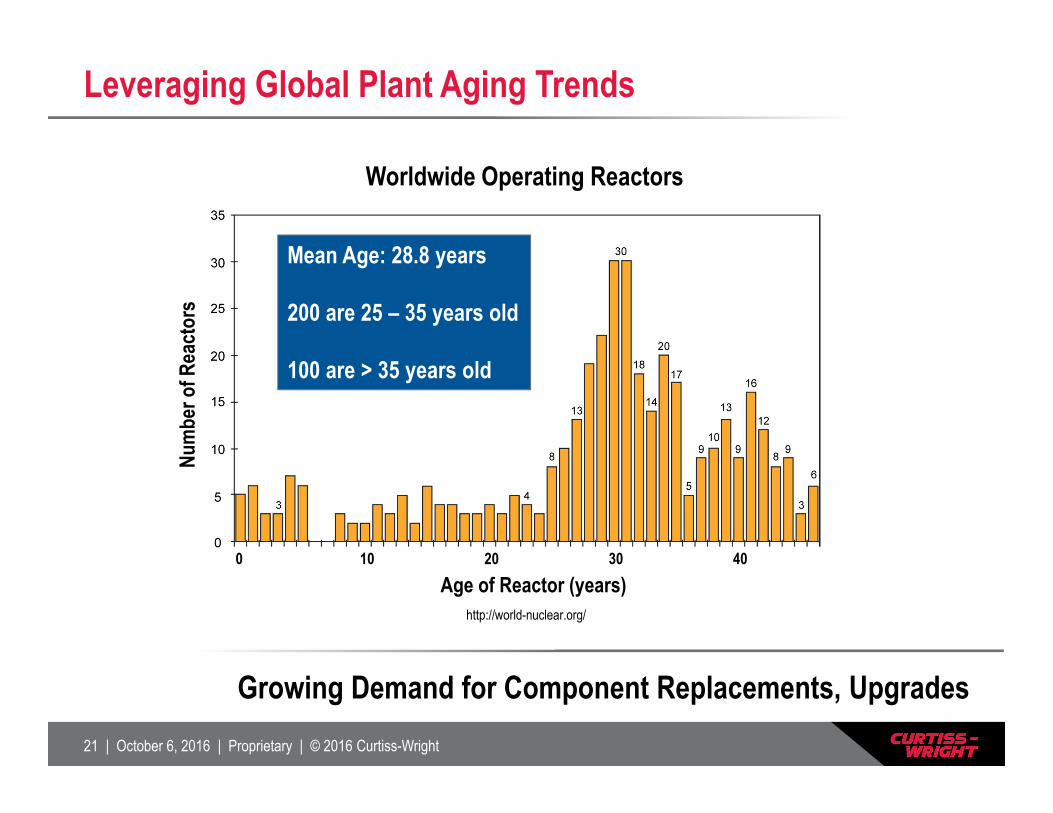
Leveraging Global Plant Aging Trends
Growing Demand for Component Replacements, Upgrades
Age of 447 Reactors in Operation in the WorldWorldwide Operating Reactors
0 10 20 30 40
Num
ber o
f Rea
ctor
s
Mean Age: 28.8 years
200 are 25 – 35 years old
100 are > 35 years old
Age of Reactor (years)http://world-nuclear.org/
22 | October 6, 2016 | Proprietary | © 2016 Curtiss-Wright
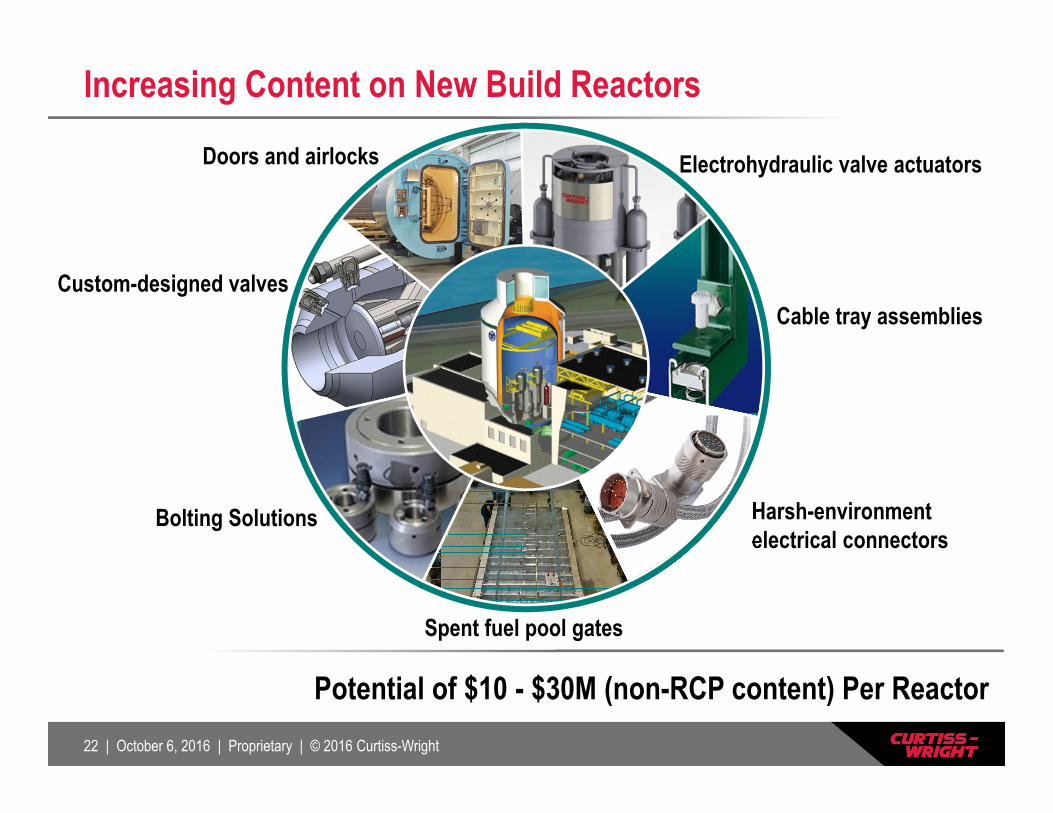
Increasing Content on New Build Reactors
Potential of $10 - $30M (non-RCP content) Per Reactor
Doors and airlocks
Custom-designed valves
Bolting Solutions
Spent fuel pool gates
Electrohydraulic valve actuators
Cable tray assemblies
Harsh-environment electrical connectors
23 | October 6, 2016 | Proprietary | © 2016 Curtiss-Wright
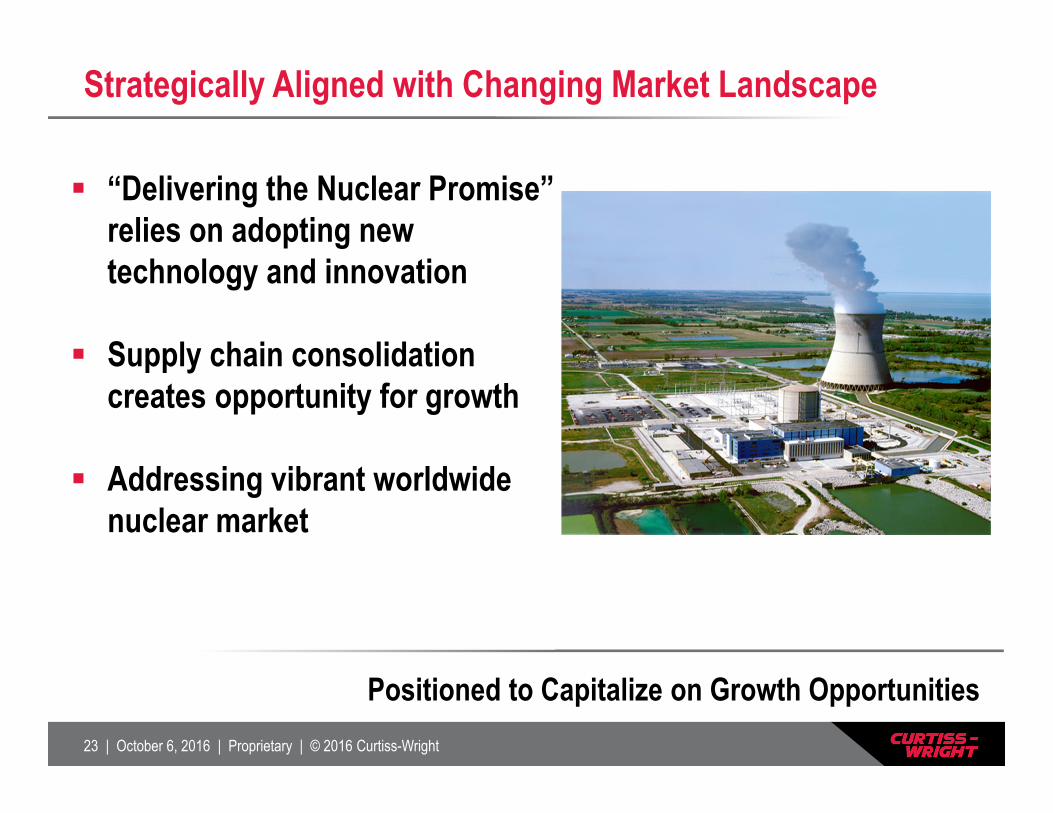
Strategically Aligned with Changing Market Landscape
“Delivering the Nuclear Promise” relies on adopting new technology and innovation
Supply chain consolidation creates opportunity for growth
Addressing vibrant worldwide nuclear market
Positioned to Capitalize on Growth Opportunities
24 | October 6, 2016 | Proprietary | © 2016 Curtiss-Wright
AP1000 RCP Update
Greg Hempfling, SVP and General Manager, EMS Division
25 | October 6, 2016 | Proprietary | © 2016 Curtiss-Wright
Overview
Benefits of the AP1000 Reactor Coolant Pump (RCP)
Status and key milestones on existing RCP contracts
Future outlook for the nuclear new build market
How Curtiss-Wright is strategically positioned for growth
26 | October 6, 2016 | Proprietary | © 2016 Curtiss-Wright
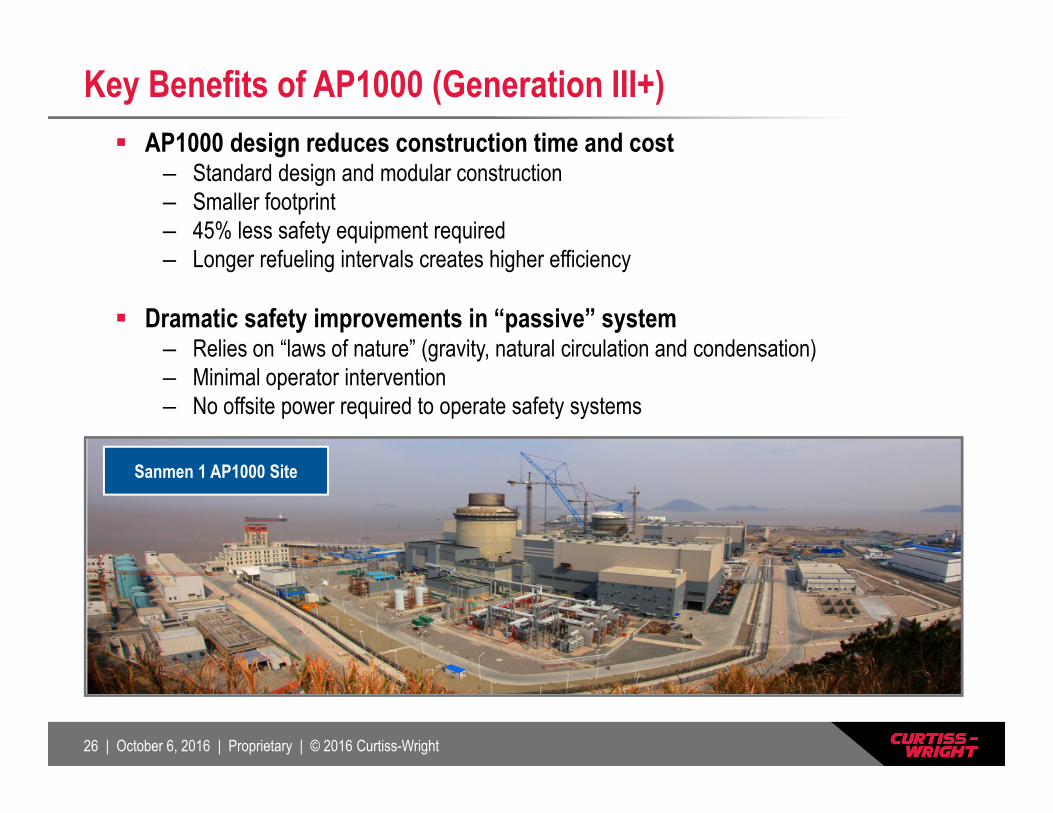
Key Benefits of AP1000 (Generation III+) AP1000 design reduces construction time and cost
– Standard design and modular construction– Smaller footprint – 45% less safety equipment required– Longer refueling intervals creates higher efficiency
Dramatic safety improvements in “passive” system– Relies on “laws of nature” (gravity, natural circulation and condensation)– Minimal operator intervention– No offsite power required to operate safety systems
Sanmen 1 AP1000 Site
27 | October 6, 2016 | Proprietary | © 2016 Curtiss-Wright
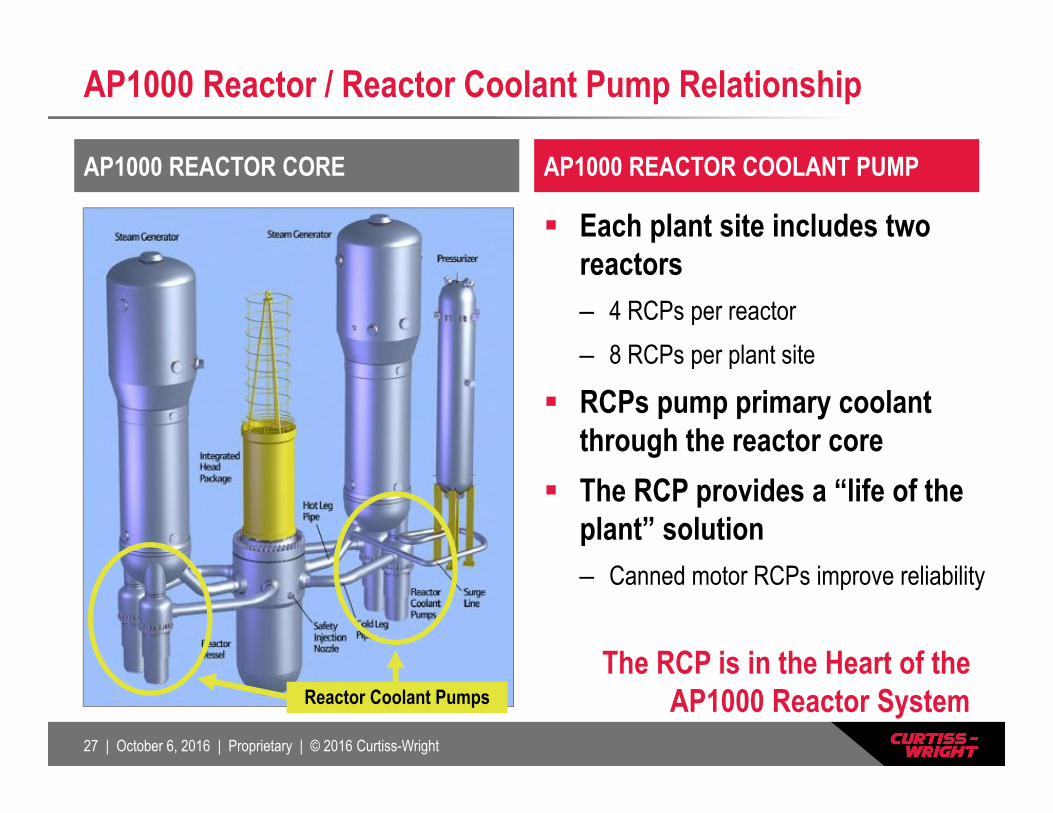
AP1000 Reactor / Reactor Coolant Pump Relationship
Heart of Reactor System Each plant site includes two reactors– 4 RCPs per reactor– 8 RCPs per plant site
RCPs pump primary coolant through the reactor core
The RCP provides a “life of the plant” solution– Canned motor RCPs improve reliability
AP1000 REACTOR CORE AP1000 REACTOR COOLANT PUMP
The RCP is in the Heart of the AP1000 Reactor SystemReactor Coolant Pumps
28 | October 6, 2016 | Proprietary | © 2016 Curtiss-Wright
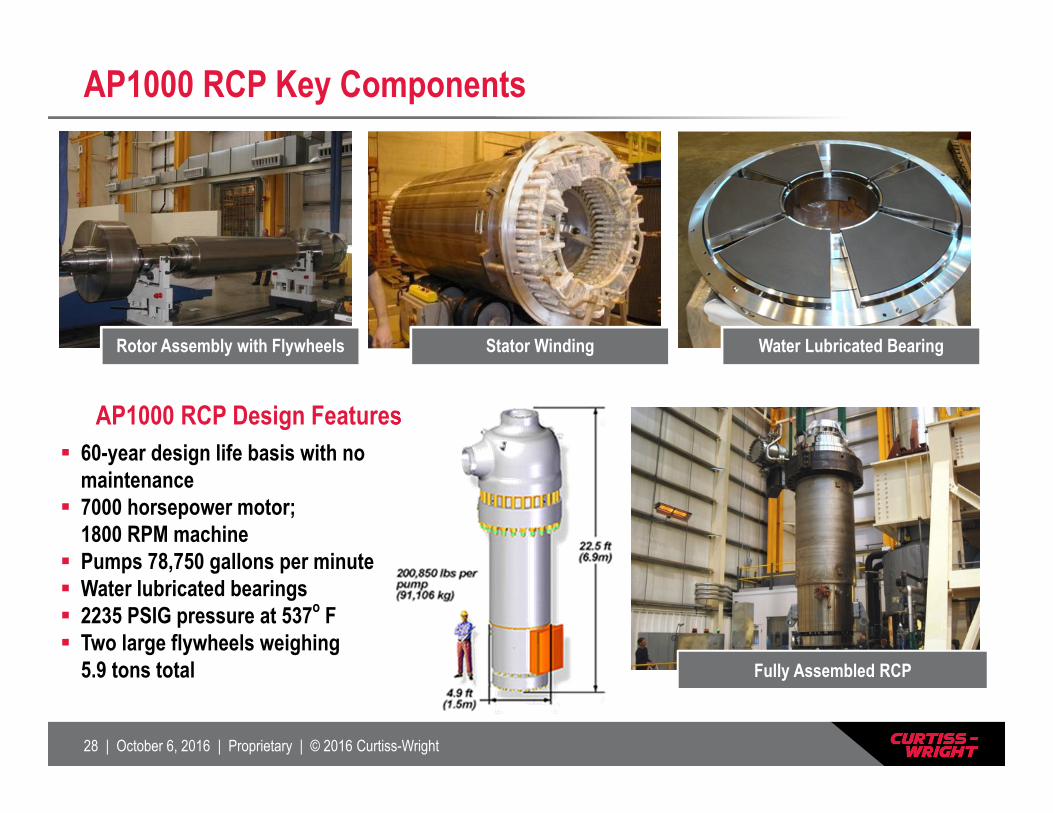
AP1000 RCP Key Components
AP1000 RCP Design Features 60-year design life basis with no
maintenance 7000 horsepower motor;
1800 RPM machine Pumps 78,750 gallons per minute Water lubricated bearings 2235 PSIG pressure at 537o F Two large flywheels weighing
5.9 tons total
Rotor Assembly with Flywheels Stator Winding Water Lubricated Bearing
Fully Assembled RCP
29 | October 6, 2016 | Proprietary | © 2016 Curtiss-Wright
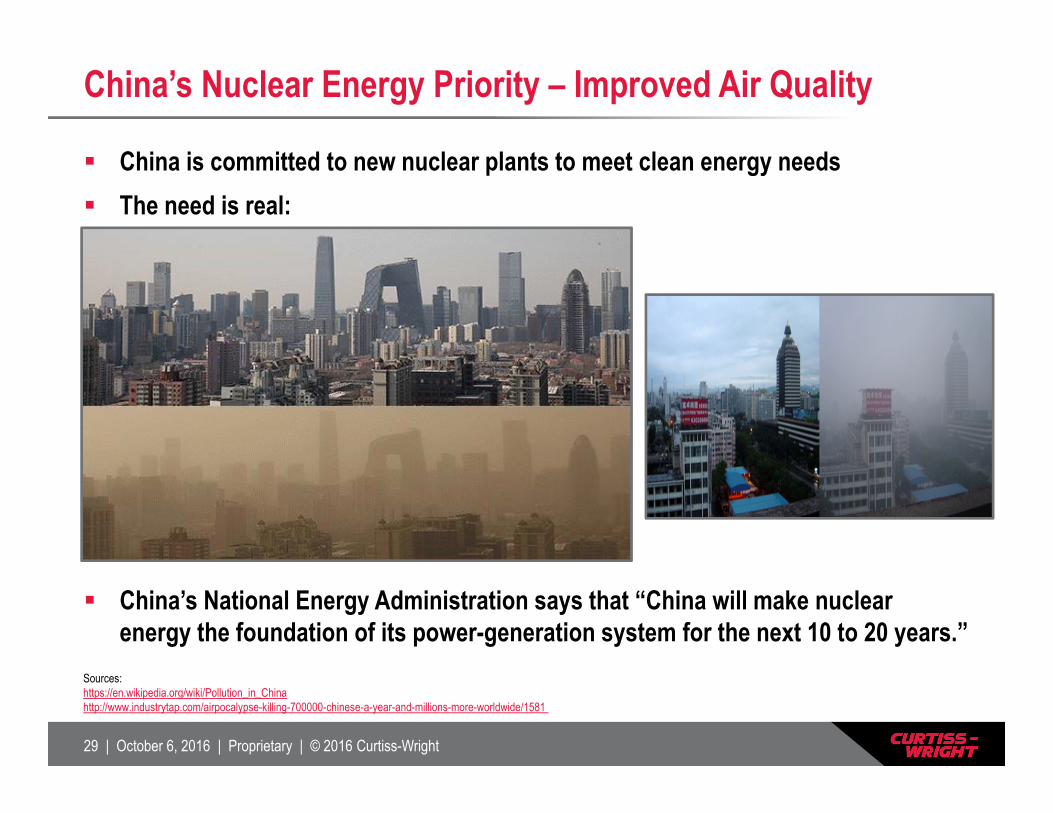
China’s Nuclear Energy Priority – Improved Air Quality
China is committed to new nuclear plants to meet clean energy needs The need is real:
China’s National Energy Administration says that “China will make nuclear energy the foundation of its power-generation system for the next 10 to 20 years.”
Sources:https://en.wikipedia.org/wiki/Pollution_in_Chinahttp://www.industrytap.com/airpocalypse-killing-700000-chinese-a-year-and-millions-more-worldwide/1581
30 | October 6, 2016 | Proprietary | © 2016 Curtiss-Wright
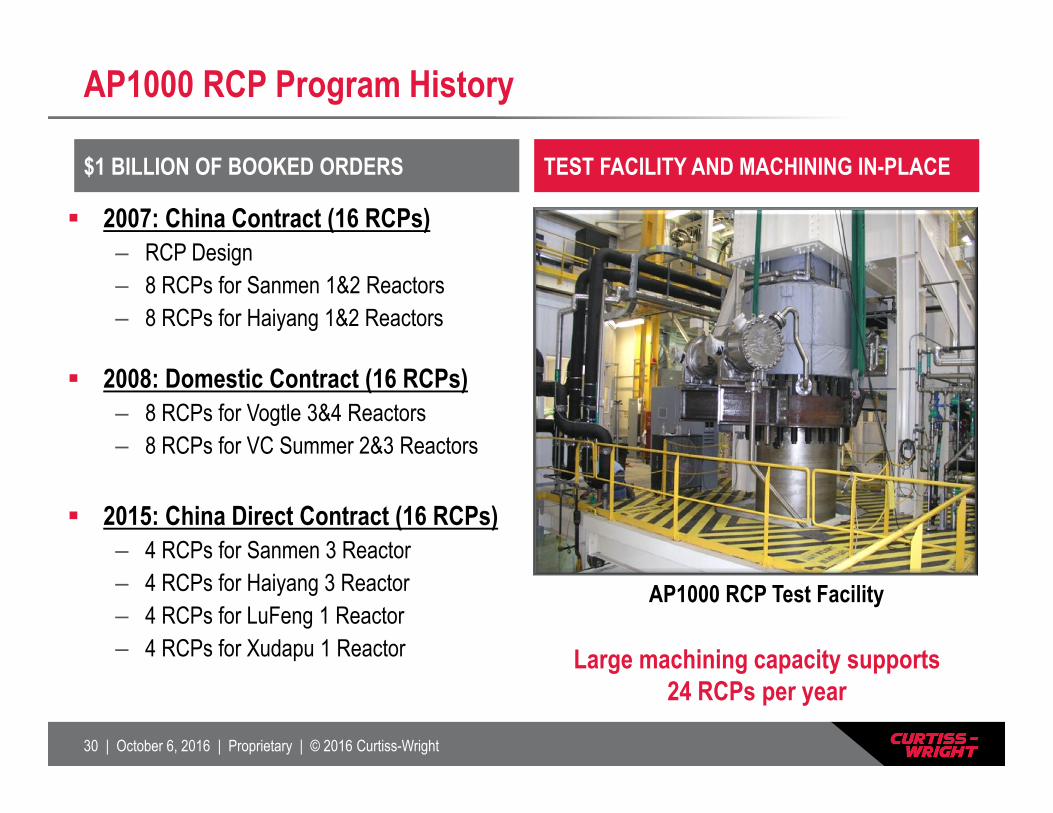
AP1000 RCP Program History
2007: China Contract (16 RCPs) – RCP Design – 8 RCPs for Sanmen 1&2 Reactors– 8 RCPs for Haiyang 1&2 Reactors
2008: Domestic Contract (16 RCPs)– 8 RCPs for Vogtle 3&4 Reactors– 8 RCPs for VC Summer 2&3 Reactors
2015: China Direct Contract (16 RCPs)– 4 RCPs for Sanmen 3 Reactor– 4 RCPs for Haiyang 3 Reactor– 4 RCPs for LuFeng 1 Reactor – 4 RCPs for Xudapu 1 Reactor
$1 BILLION OF BOOKED ORDERS TEST FACILITY AND MACHINING IN-PLACE
AP1000 RCP Test Facility
Large machining capacity supports 24 RCPs per year
31 | October 6, 2016 | Proprietary | © 2016 Curtiss-Wright
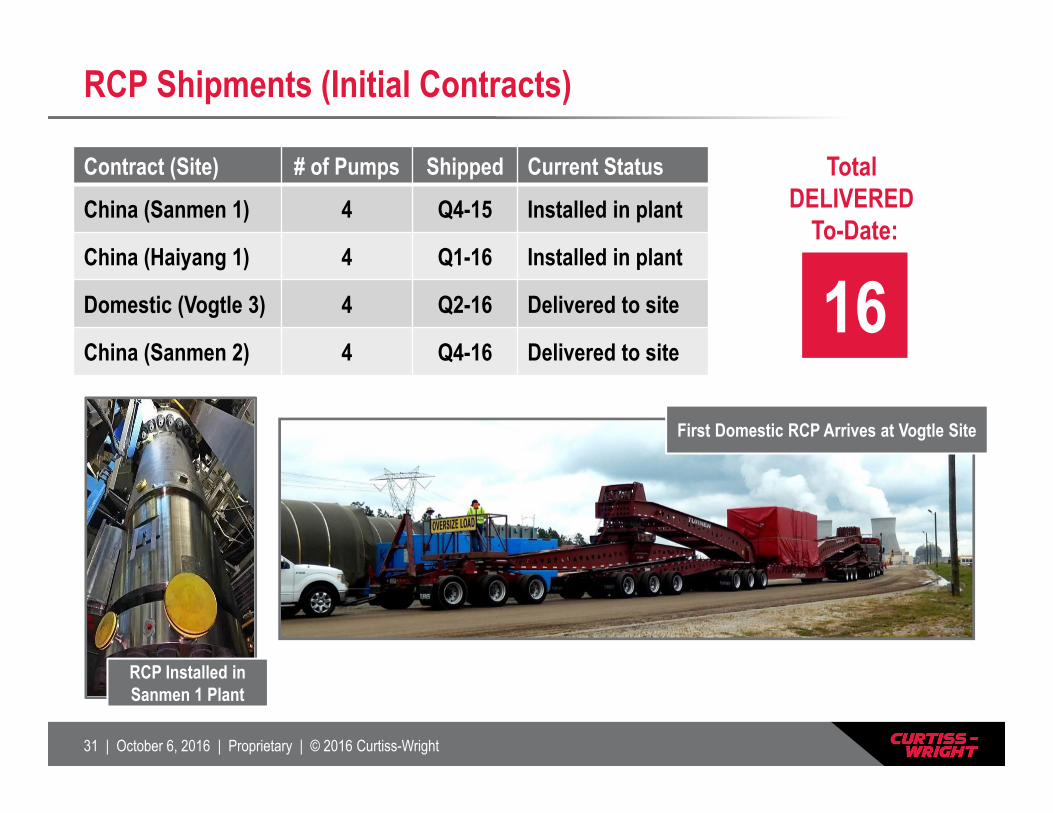
RCP Shipments (Initial Contracts)
Contract (Site) # of Pumps Shipped Current Status
China (Sanmen 1) 4 Q4-15 Installed in plant
China (Haiyang 1) 4 Q1-16 Installed in plant
Domestic (Vogtle 3) 4 Q2-16 Delivered to site
China (Sanmen 2) 4 Q4-16 Delivered to site
First Domestic RCP Arrives at Vogtle Site
RCP Installed in Sanmen 1 Plant
Total DELIVERED
To-Date:
16
32 | October 6, 2016 | Proprietary | © 2016 Curtiss-Wright
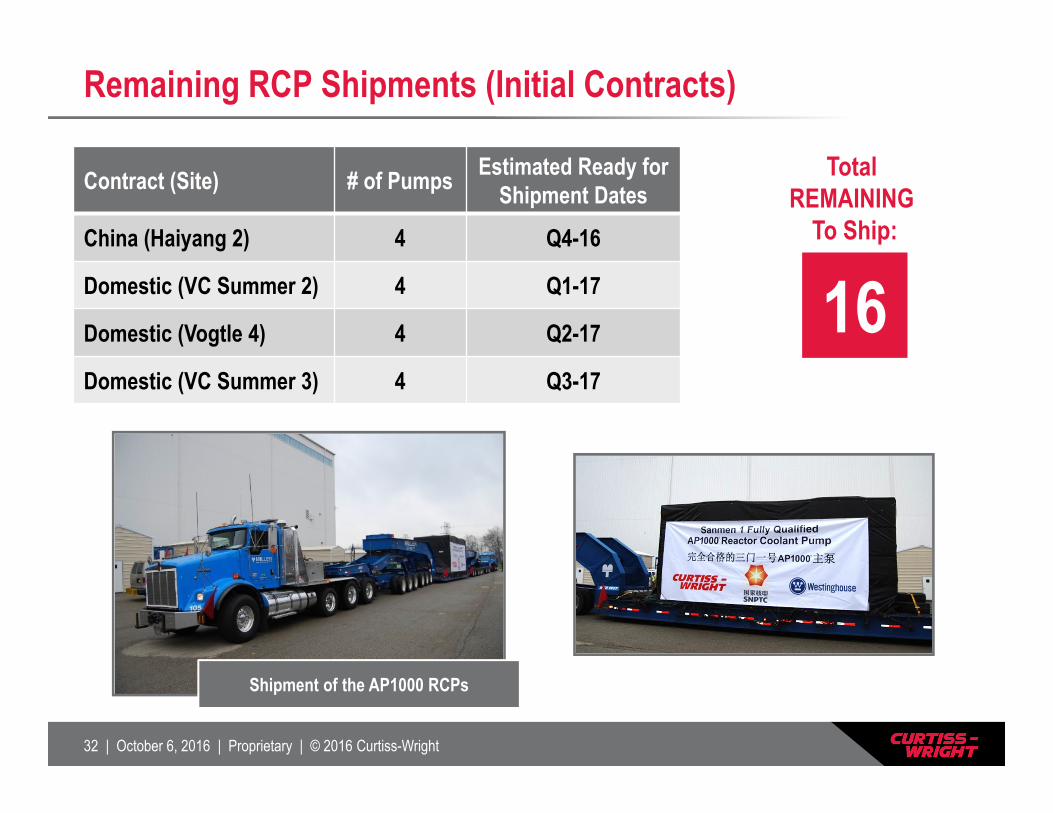
Remaining RCP Shipments (Initial Contracts)
Contract (Site) # of Pumps Estimated Ready for Shipment Dates
China (Haiyang 2) 4 Q4-16
Domestic (VC Summer 2) 4 Q1-17
Domestic (Vogtle 4) 4 Q2-17
Domestic (VC Summer 3) 4 Q3-17
Shipment of the AP1000 RCPs
Total REMAINING
To Ship:
16
33 | October 6, 2016 | Proprietary | © 2016 Curtiss-Wright
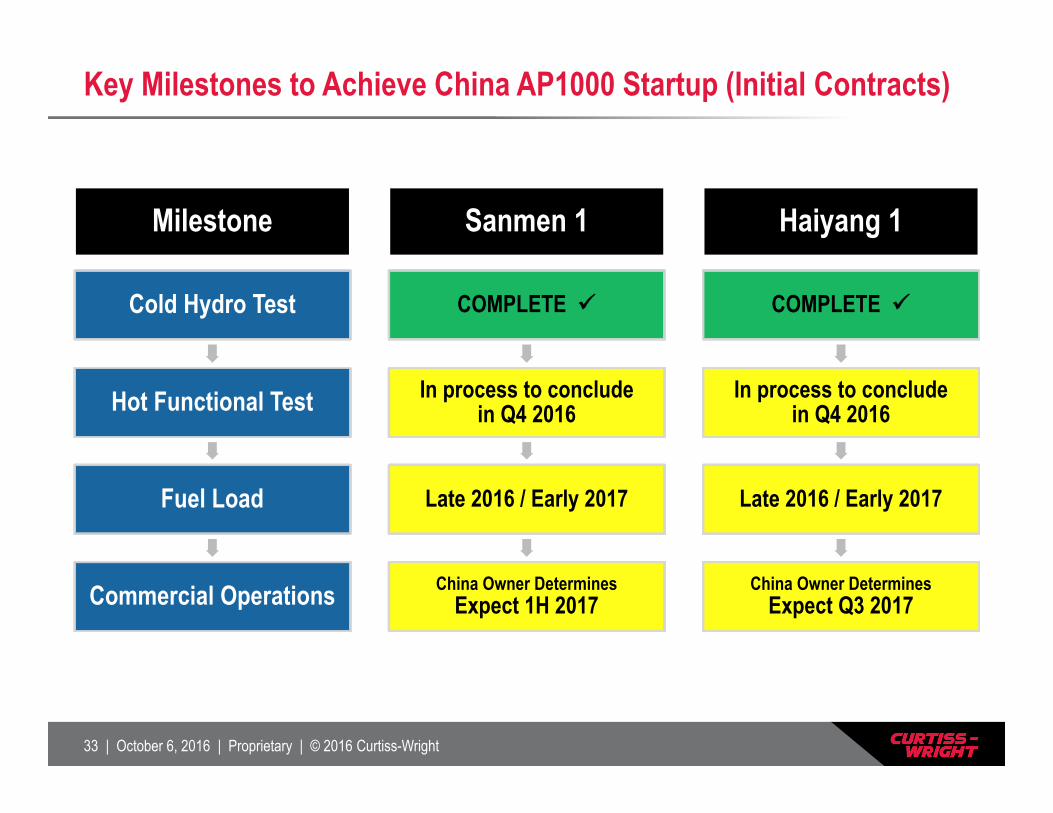
Key Milestones to Achieve China AP1000 Startup (Initial Contracts)
Milestone
Cold Hydro Test
Hot Functional Test
Fuel Load
Commercial Operations
Sanmen 1
COMPLETE
In process to conclude in Q4 2016
Late 2016 / Early 2017
China Owner Determines Expect 1H 2017
Haiyang 1
COMPLETE
In process to conclude in Q4 2016
Late 2016 / Early 2017
China Owner DeterminesExpect Q3 2017
34 | October 6, 2016 | Proprietary | © 2016 Curtiss-Wright
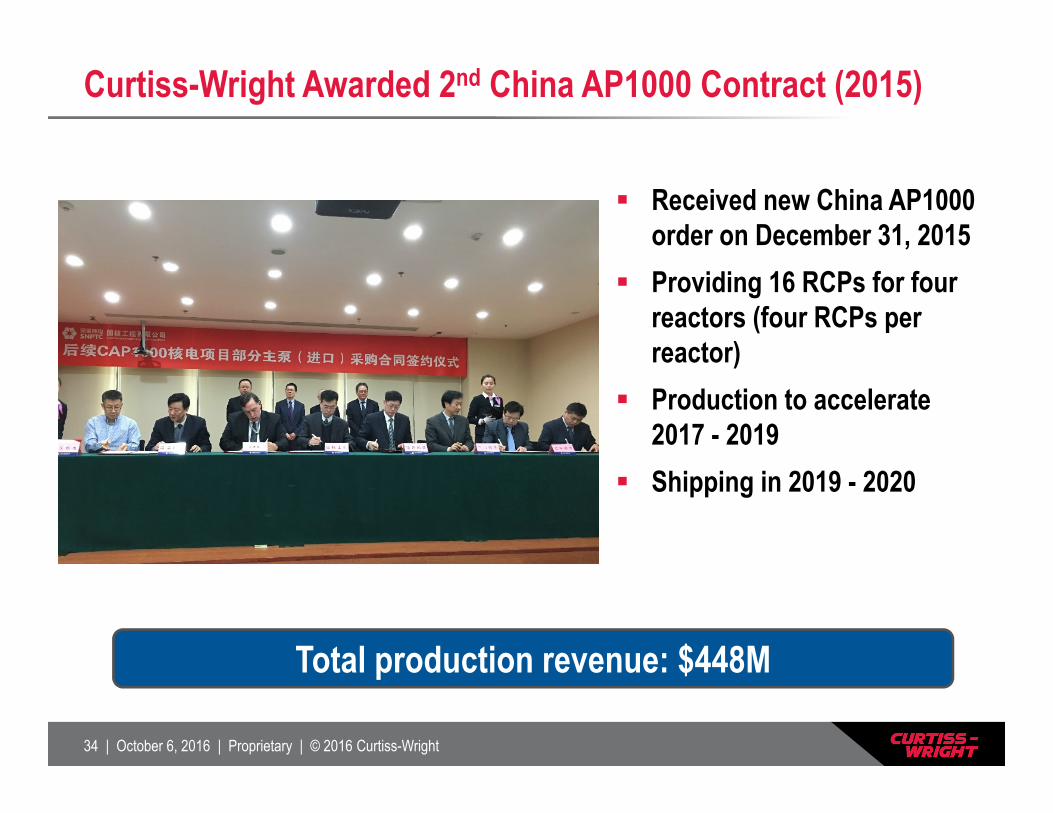
Curtiss-Wright Awarded 2nd China AP1000 Contract (2015)
Received new China AP1000 order on December 31, 2015
Providing 16 RCPs for four reactors (four RCPs per reactor)
Production to accelerate 2017 - 2019
Shipping in 2019 - 2020
Total production revenue: $448M
35 | October 6, 2016 | Proprietary | © 2016 Curtiss-Wright
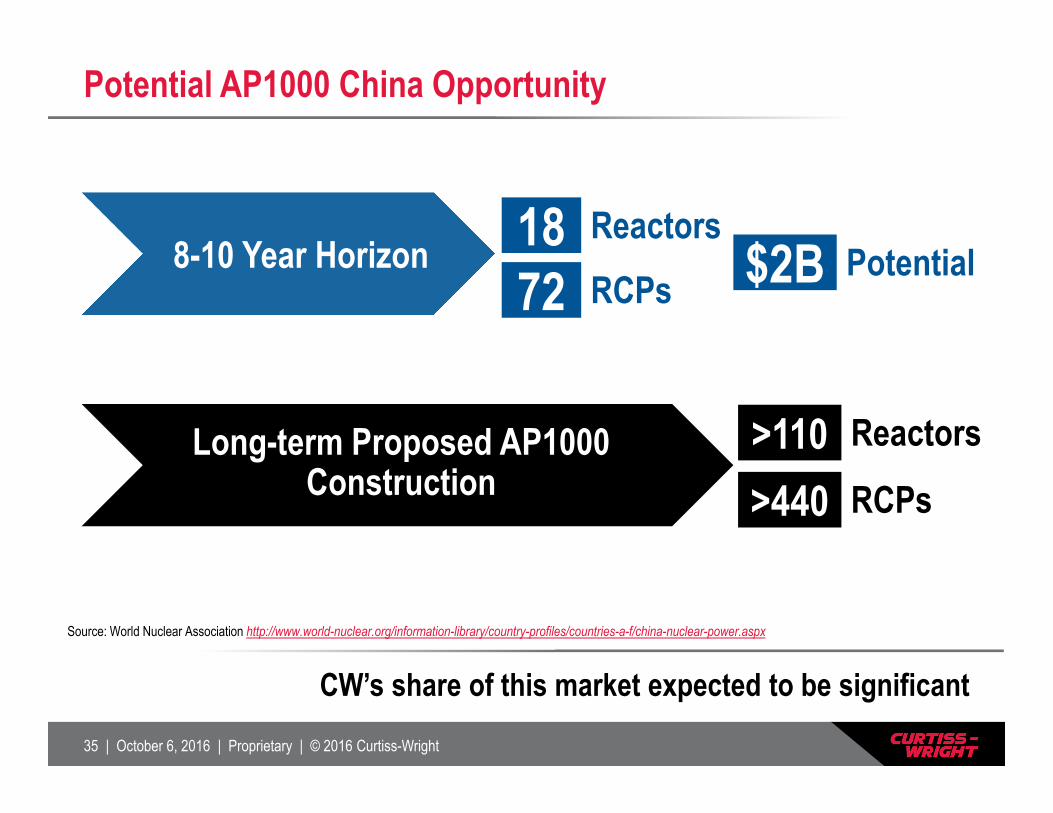
Potential AP1000 China Opportunity
CW’s share of this market expected to be significant
Source: World Nuclear Association http://www.world-nuclear.org/information-library/country-profiles/countries-a-f/china-nuclear-power.aspx
8-10 Year Horizon
Long-term Proposed AP1000 Construction
18 Reactors
72 RCPs $2B Potential
>110 Reactors
>440 RCPs
36 | October 6, 2016 | Proprietary | © 2016 Curtiss-Wright
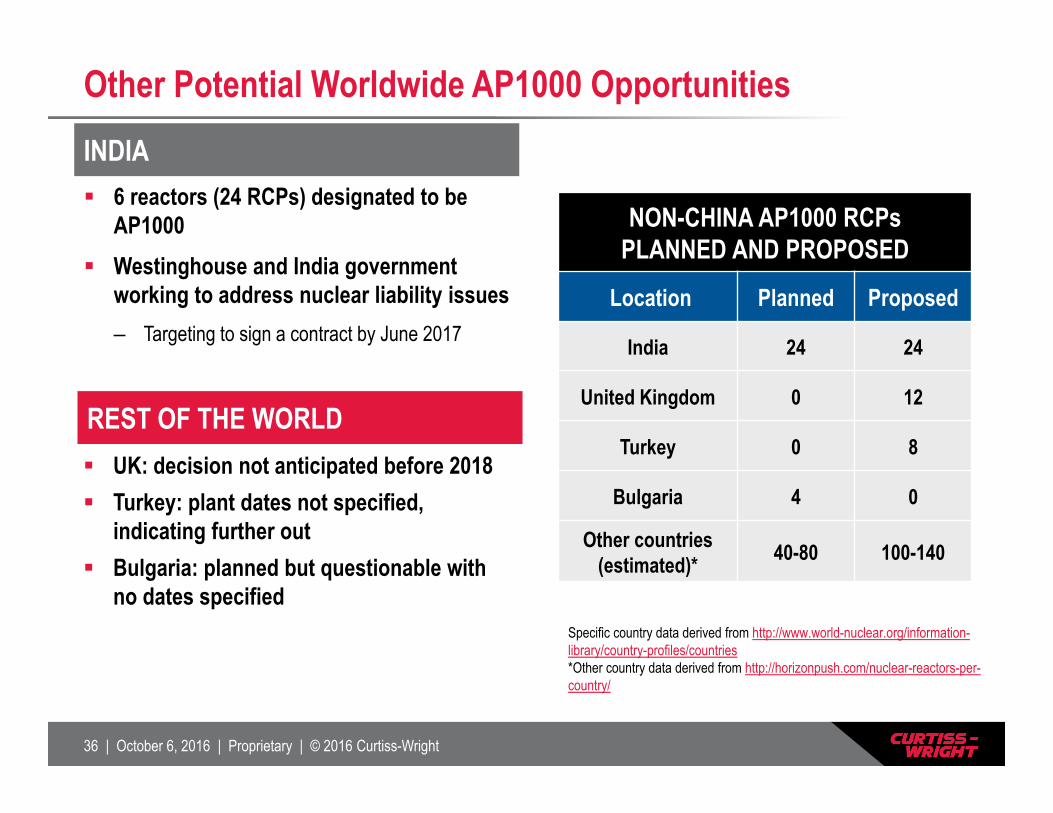
Other Potential Worldwide AP1000 OpportunitiesINDIA
NON-CHINA AP1000 RCPsPLANNED AND PROPOSED
Location Planned Proposed
India 24 24
United Kingdom 0 12
Turkey 0 8
Bulgaria 4 0
Other countries (estimated)* 40-80 100-140
REST OF THE WORLD
6 reactors (24 RCPs) designated to be AP1000
Westinghouse and India government working to address nuclear liability issues – Targeting to sign a contract by June 2017
UK: decision not anticipated before 2018 Turkey: plant dates not specified,
indicating further out Bulgaria: planned but questionable with
no dates specifiedSpecific country data derived from http://www.world-nuclear.org/information-library/country-profiles/countries*Other country data derived from http://horizonpush.com/nuclear-reactors-per-country/
37 | October 6, 2016 | Proprietary | © 2016 Curtiss-Wright
Unique AP1000 Technology Positions CW for Success
AP1000 is the FIRST NRC licensed Generation III+ design being constructed throughout the world
CW has the ONLY designed, tested, qualified, produced and installed AP1000 RCP
CW AP1000 RCP SUCCESSFULLY going through initial plant start-up
Curtiss-Wright Competitive Advantage is Real and the Market Opportunities are Significant

38 | October 6, 2016 | Proprietary | © 2016 Curtiss-Wright
Q&A
39 | October 6, 2016 | Proprietary | © 2016 Curtiss-Wright
BREAK
Tentatively Resume ~10:00am ET

40 | October 6, 2016 | Proprietary | © 2016 Curtiss-Wright
Financial Update
Glenn E. Tynan, VP Finance and CFO
41 | October 6, 2016 | Proprietary | © 2016 Curtiss-Wright
Agenda
AP1000 financial projections– Initial orders (2007 China / 2008 U.S.)– China Direct order (2015)
Progress on long-term financial objectives
Review of 2016 financial guidance
Preview of 2017 financial outlook
42 | October 6, 2016 | Proprietary | © 2016 Curtiss-Wright
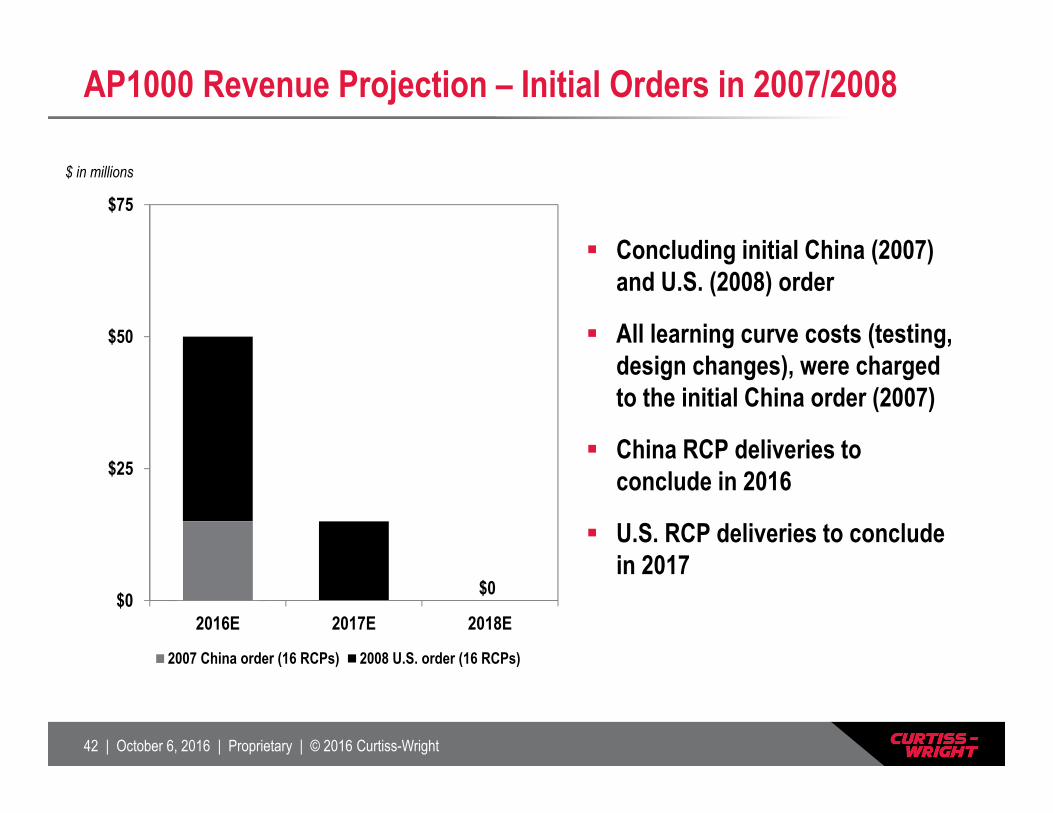
AP1000 Revenue Projection – Initial Orders in 2007/2008
$ in millions
$0
$25
$50
$75
2016E 2017E 2018E
2007 China order (16 RCPs) 2008 U.S. order (16 RCPs)
$0
Concluding initial China (2007) and U.S. (2008) order
All learning curve costs (testing, design changes), were charged to the initial China order (2007)
China RCP deliveries to conclude in 2016
U.S. RCP deliveries to conclude in 2017
43 | October 6, 2016 | Proprietary | © 2016 Curtiss-Wright
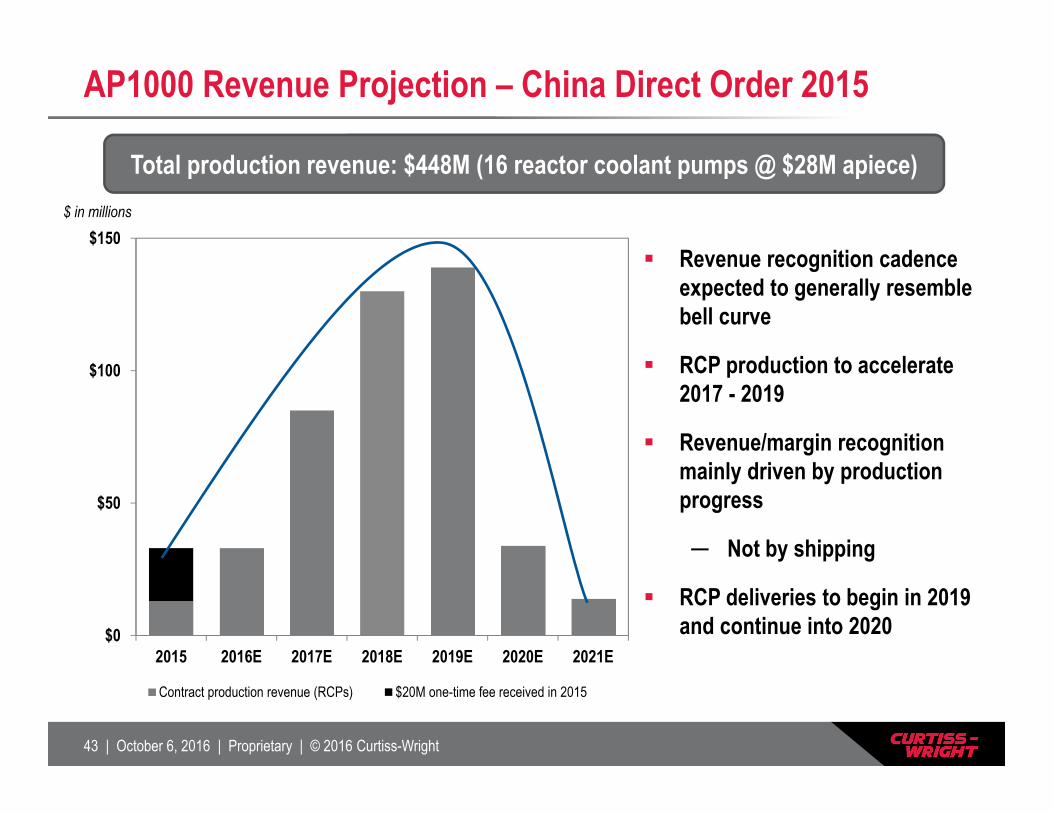
AP1000 Revenue Projection – China Direct Order 2015
$0
$50
$100
$150
2015 2016E 2017E 2018E 2019E 2020E 2021E
Contract production revenue (RCPs) $20M one-time fee received in 2015
$ in millions
Total production revenue: $448M (16 reactor coolant pumps @ $28M apiece)
Revenue recognition cadence expected to generally resemble bell curve
RCP production to accelerate 2017 - 2019
Revenue/margin recognition mainly driven by production progress
─ Not by shipping
RCP deliveries to begin in 2019 and continue into 2020
44 | October 6, 2016 | Proprietary | © 2016 Curtiss-Wright
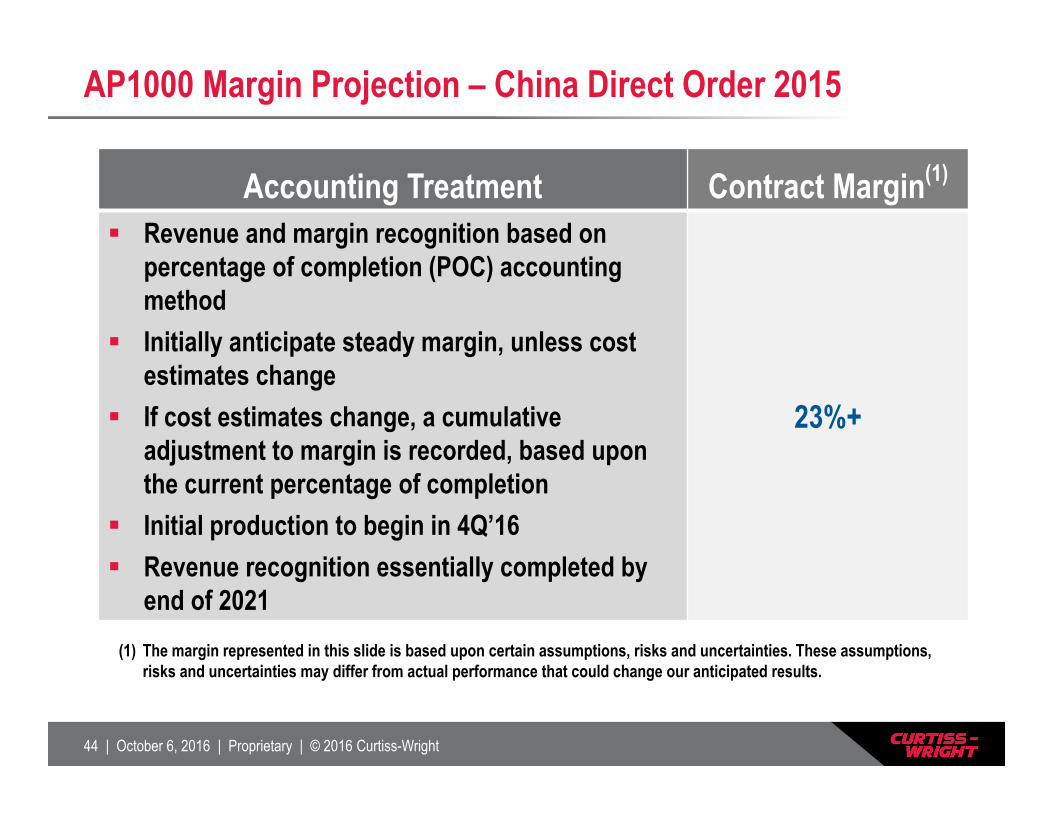
AP1000 Margin Projection – China Direct Order 2015
Accounting Treatment Contract Margin(1)
Revenue and margin recognition based on percentage of completion (POC) accounting method
Initially anticipate steady margin, unless cost estimates change
If cost estimates change, a cumulative adjustment to margin is recorded, based upon the current percentage of completion
Initial production to begin in 4Q’16 Revenue recognition essentially completed by
end of 2021
23%+
(1) The margin represented in this slide is based upon certain assumptions, risks and uncertainties. These assumptions, risks and uncertainties may differ from actual performance that could change our anticipated results.
45 | October 6, 2016 | Proprietary | © 2016 Curtiss-Wright
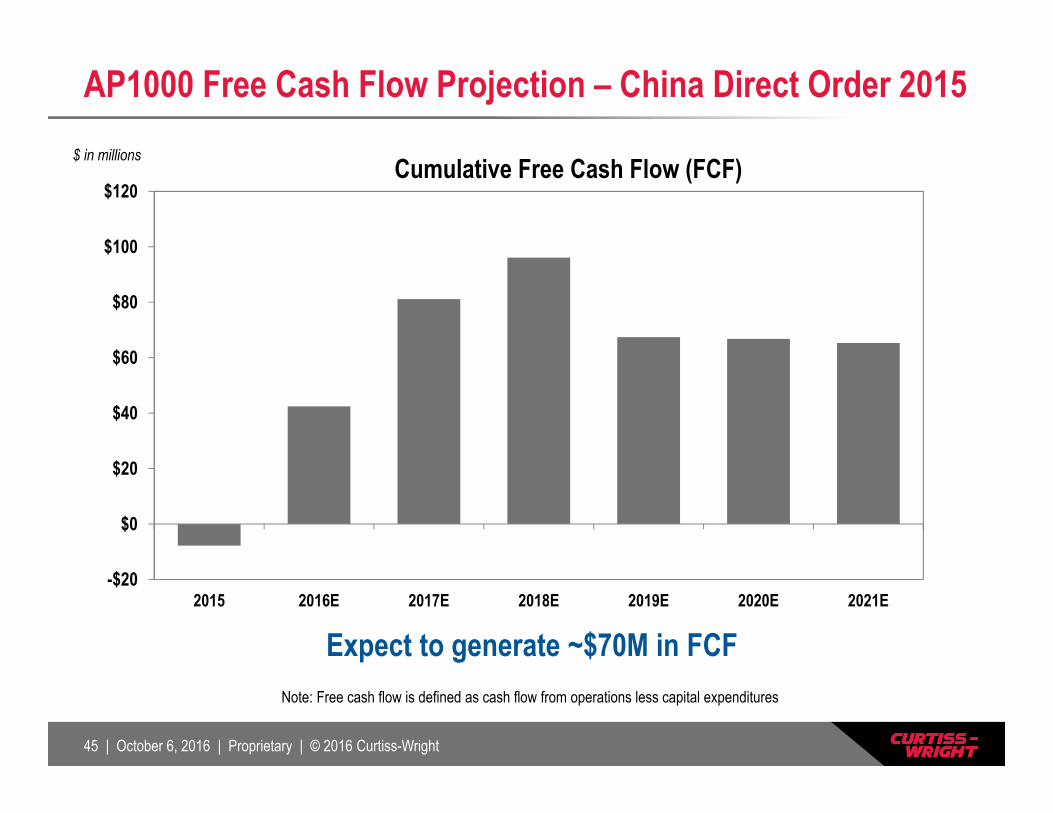
-$20
$0
$20
$40
$60
$80
$100
$120
2015 2016E 2017E 2018E 2019E 2020E 2021E
Cumulative Free Cash Flow (FCF)$ in millions
AP1000 Free Cash Flow Projection – China Direct Order 2015
Note: Free cash flow is defined as cash flow from operations less capital expenditures
Expect to generate ~$70M in FCF

46 | October 6, 2016 | Proprietary | © 2016 Curtiss-Wright
On Path to Top Quartile Performance
Target Metric Original 5-Year Target* Current
OP. MARGIN 9.3% > 12.5% EXCEEDED
EPS $2.88 Double-Digit Growth ACHIEVED
ROIC 7.4% > 12% ON TRACK
W. CAPITAL 32% 20% of Sales ON TRACK
CAPEX 4% 2% of Sales ACHIEVED
FCF CONV. < 100% 100% EXCEEDED
2013 Reported
*Issued December 11, 2013
47 | October 6, 2016 | Proprietary | © 2016 Curtiss-Wright
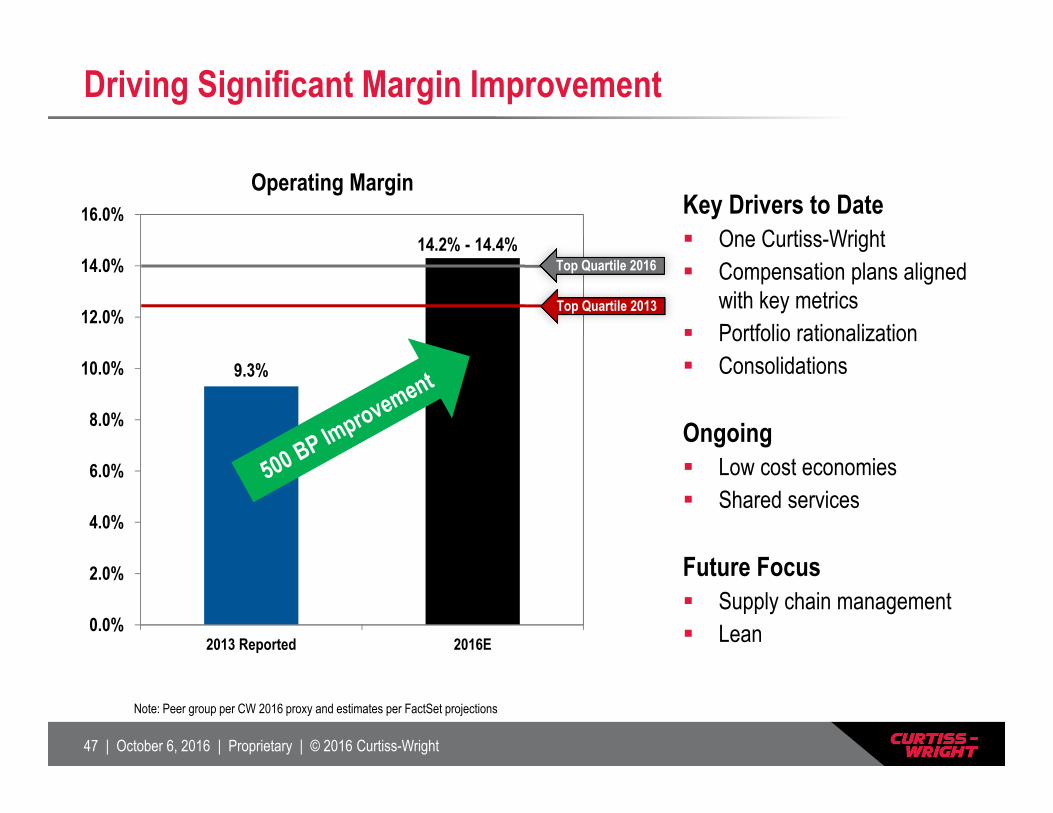
Driving Significant Margin Improvement
9.3%
0.0%
2.0%
4.0%
6.0%
8.0%
10.0%
12.0%
14.0%
16.0%
2013 Reported 2016E
Operating Margin
14.2% - 14.4%
Note: Peer group per CW 2016 proxy and estimates per FactSet projections
Key Drivers to Date One Curtiss-Wright Compensation plans aligned
with key metrics Portfolio rationalization Consolidations
Ongoing Low cost economies Shared services
Future Focus Supply chain management Lean
Top Quartile 2016
Top Quartile 2013
48 | October 6, 2016 | Proprietary | © 2016 Curtiss-Wright
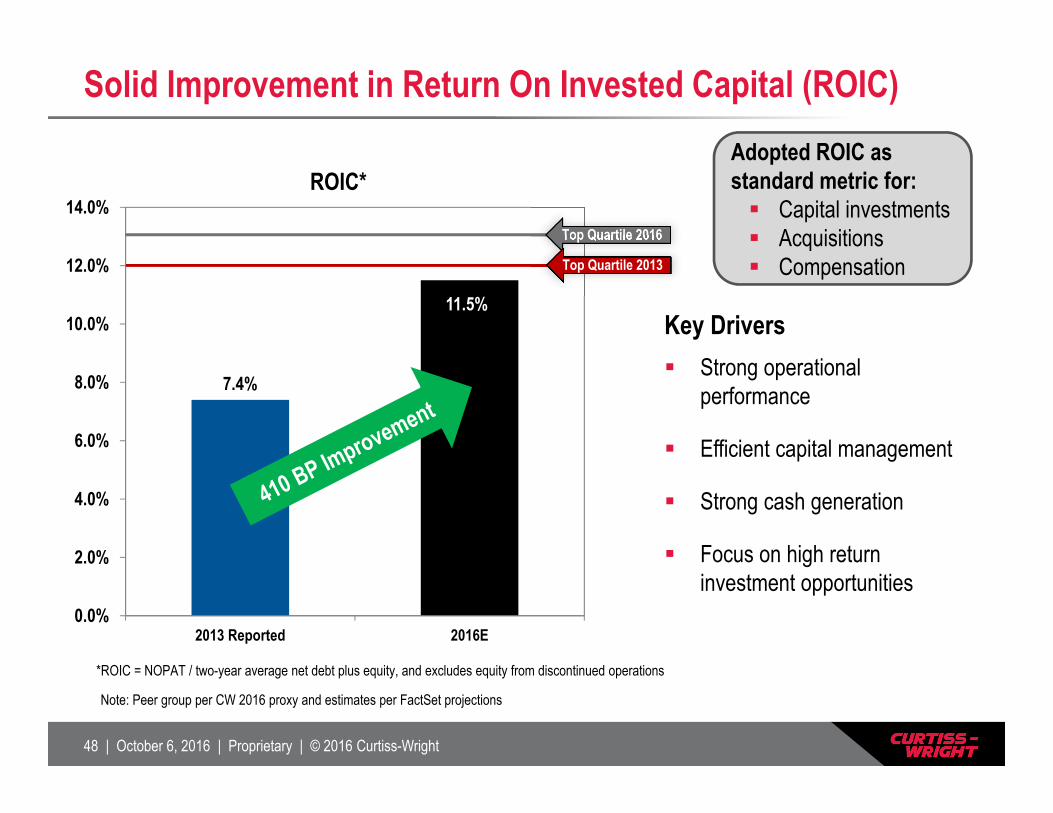
Solid Improvement in Return On Invested Capital (ROIC)
7.4%
11.5%
0.0%
2.0%
4.0%
6.0%
8.0%
10.0%
12.0%
14.0%
2013 Reported 2016E
ROIC*
Note: Peer group per CW 2016 proxy and estimates per FactSet projections
*ROIC = NOPAT / two-year average net debt plus equity, and excludes equity from discontinued operations
Key Drivers Strong operational
performance
Efficient capital management
Strong cash generation
Focus on high return investment opportunities
Adopted ROIC as standard metric for: Capital investments Acquisitions Compensation
Top Quartile 2016
Top Quartile 2013
49 | October 6, 2016 | Proprietary | © 2016 Curtiss-Wright
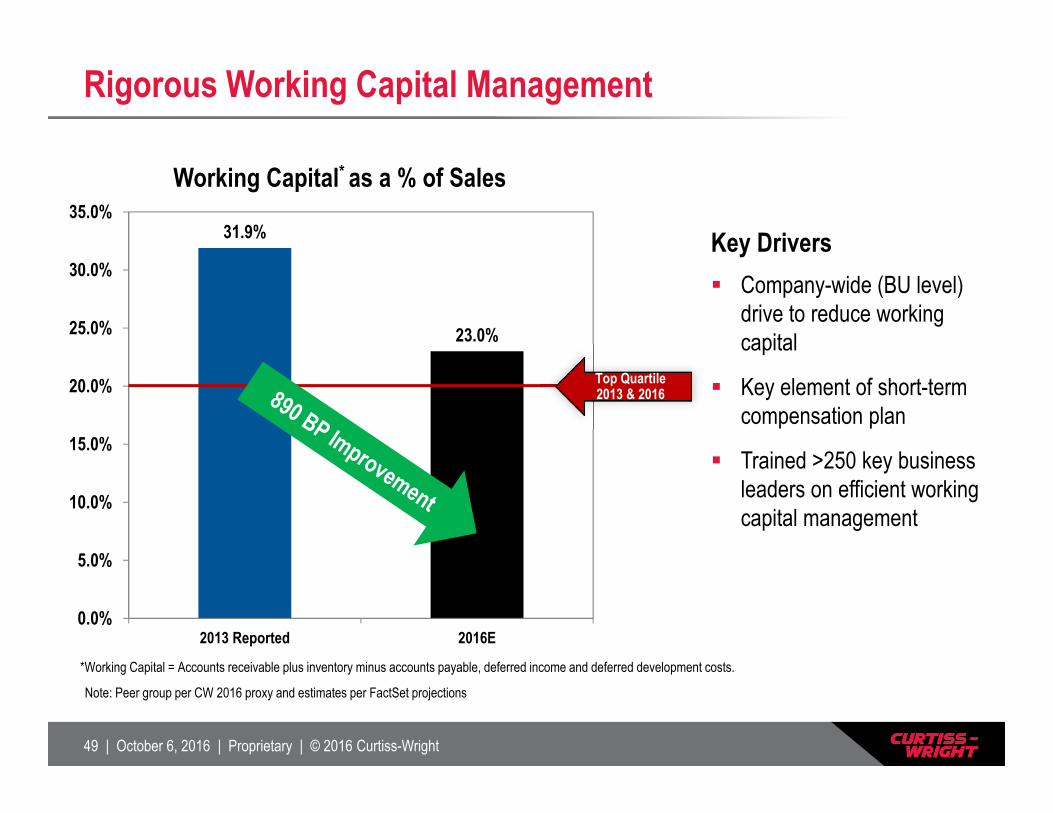
Rigorous Working Capital Management
31.9%
23.0%
0.0%
5.0%
10.0%
15.0%
20.0%
25.0%
30.0%
35.0%
2013 Reported 2016E
Working Capital* as a % of Sales
*Working Capital = Accounts receivable plus inventory minus accounts payable, deferred income and deferred development costs.
Note: Peer group per CW 2016 proxy and estimates per FactSet projections
Key Drivers Company-wide (BU level)
drive to reduce working capital
Key element of short-term compensation plan
Trained >250 key business leaders on efficient working capital management
Top Quartile 2013 & 2016
50 | October 6, 2016 | Proprietary | © 2016 Curtiss-Wright
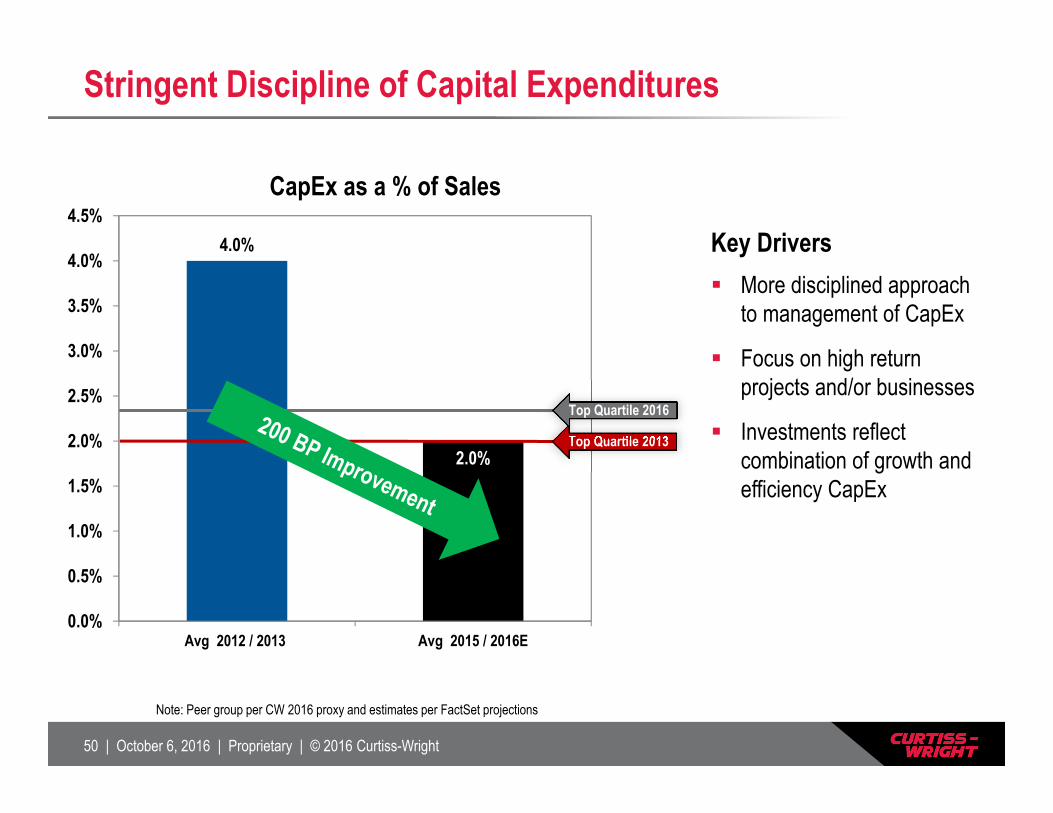
Stringent Discipline of Capital Expenditures
4.0%
2.0%
0.0%
0.5%
1.0%
1.5%
2.0%
2.5%
3.0%
3.5%
4.0%
4.5%
Avg 2012 / 2013 Avg 2015 / 2016E
CapEx as a % of Sales
Note: Peer group per CW 2016 proxy and estimates per FactSet projections
Top Quartile 2013
Top Quartile 2016
Key Drivers More disciplined approach
to management of CapEx
Focus on high return projects and/or businesses
Investments reflect combination of growth and efficiency CapEx
51 | October 6, 2016 | Proprietary | © 2016 Curtiss-Wright
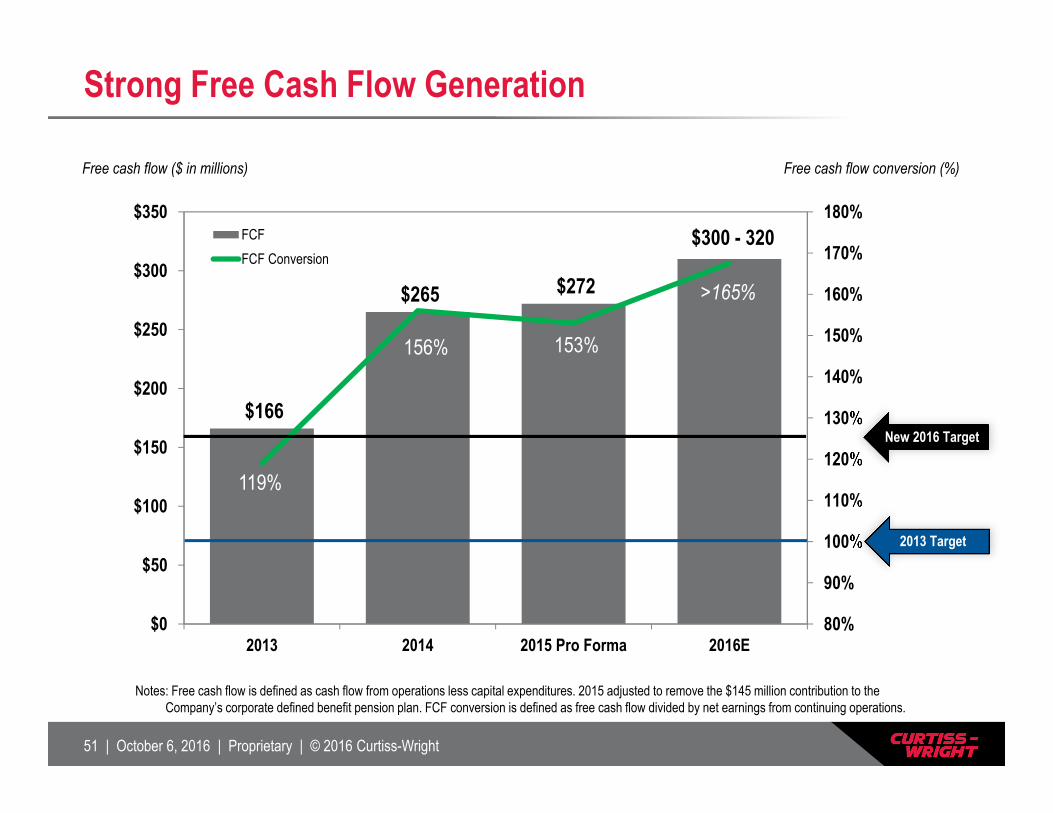
Strong Free Cash Flow Generation
$166
$265 $272
119%
156% 153%
80%
90%
100%
110%
120%
130%
140%
150%
160%
170%
180%
$0
$50
$100
$150
$200
$250
$300
$350
2013 2014 2015 Pro Forma 2016E
FCFFCF Conversion
$300 - 320
Notes: Free cash flow is defined as cash flow from operations less capital expenditures. 2015 adjusted to remove the $145 million contribution to the Company’s corporate defined benefit pension plan. FCF conversion is defined as free cash flow divided by net earnings from continuing operations.
>165%
Free cash flow ($ in millions)
2013 Target
Free cash flow conversion (%)
New 2016 Target
52 | October 6, 2016 | Proprietary | © 2016 Curtiss-Wright
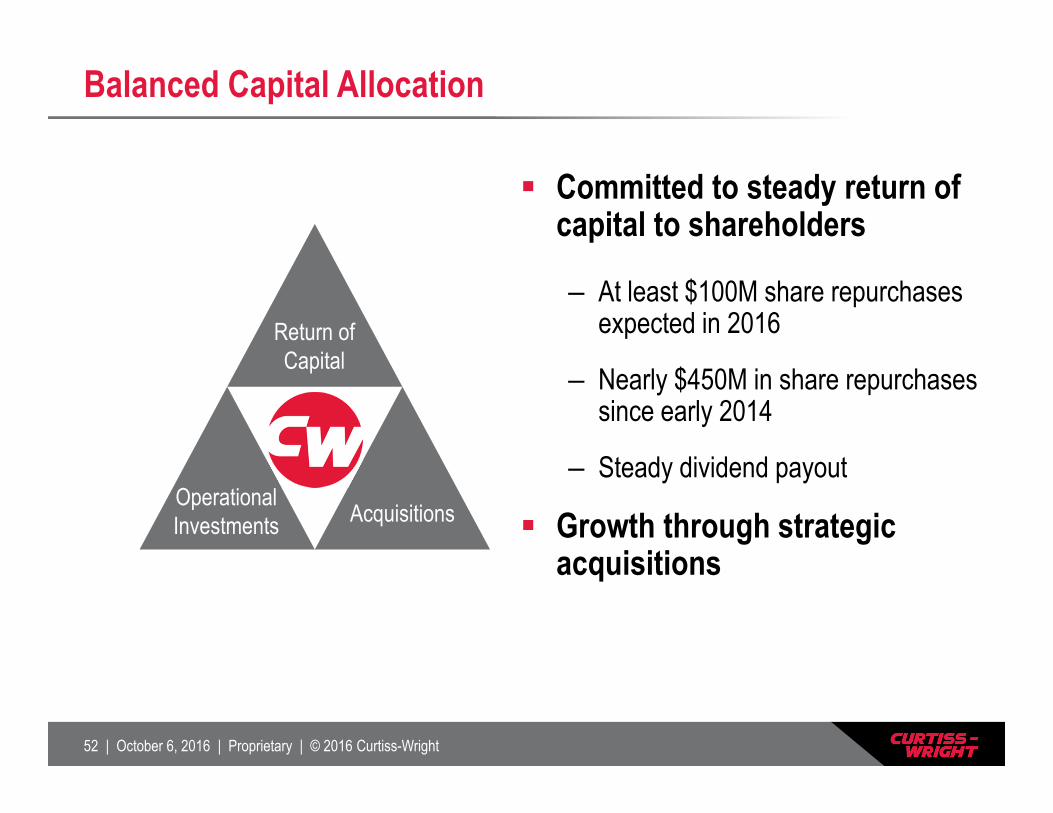
Balanced Capital Allocation
Return of Capital
Operational Investments Acquisitions
Committed to steady return of capital to shareholders
– At least $100M share repurchases expected in 2016
– Nearly $450M in share repurchases since early 2014
– Steady dividend payout
Growth through strategic acquisitions
53 | October 6, 2016 | Proprietary | © 2016 Curtiss-Wright
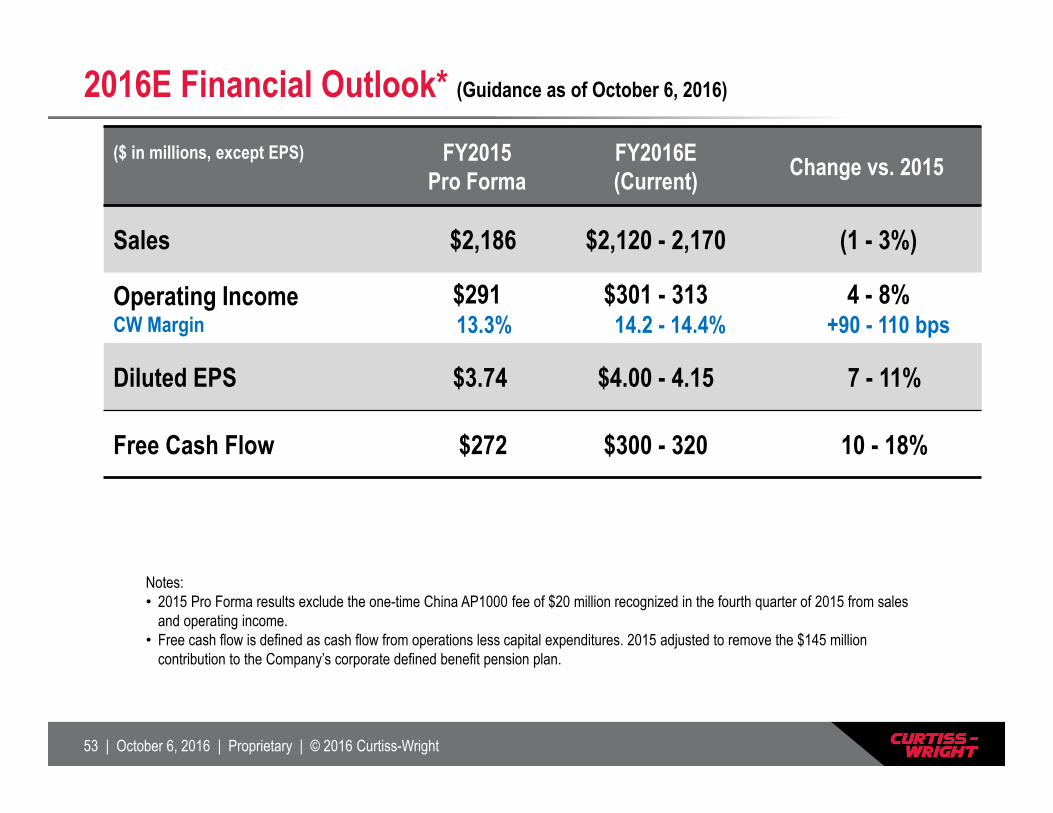
2016E Financial Outlook* (Guidance as of October 6, 2016)
($ in millions, except EPS) FY2015 Pro Forma
FY2016E(Current) Change vs. 2015
Sales $2,186 $2,120 - 2,170 (1 - 3%)
Operating IncomeCW Margin
$29113.3%
$301 - 31314.2 - 14.4%
4 - 8%+90 - 110 bps
Diluted EPS $3.74 $4.00 - 4.15 7 - 11%
Free Cash Flow $272 $300 - 320 10 - 18%
Notes: • 2015 Pro Forma results exclude the one-time China AP1000 fee of $20 million recognized in the fourth quarter of 2015 from sales
and operating income. • Free cash flow is defined as cash flow from operations less capital expenditures. 2015 adjusted to remove the $145 million
contribution to the Company’s corporate defined benefit pension plan.
54 | October 6, 2016 | Proprietary | © 2016 Curtiss-Wright
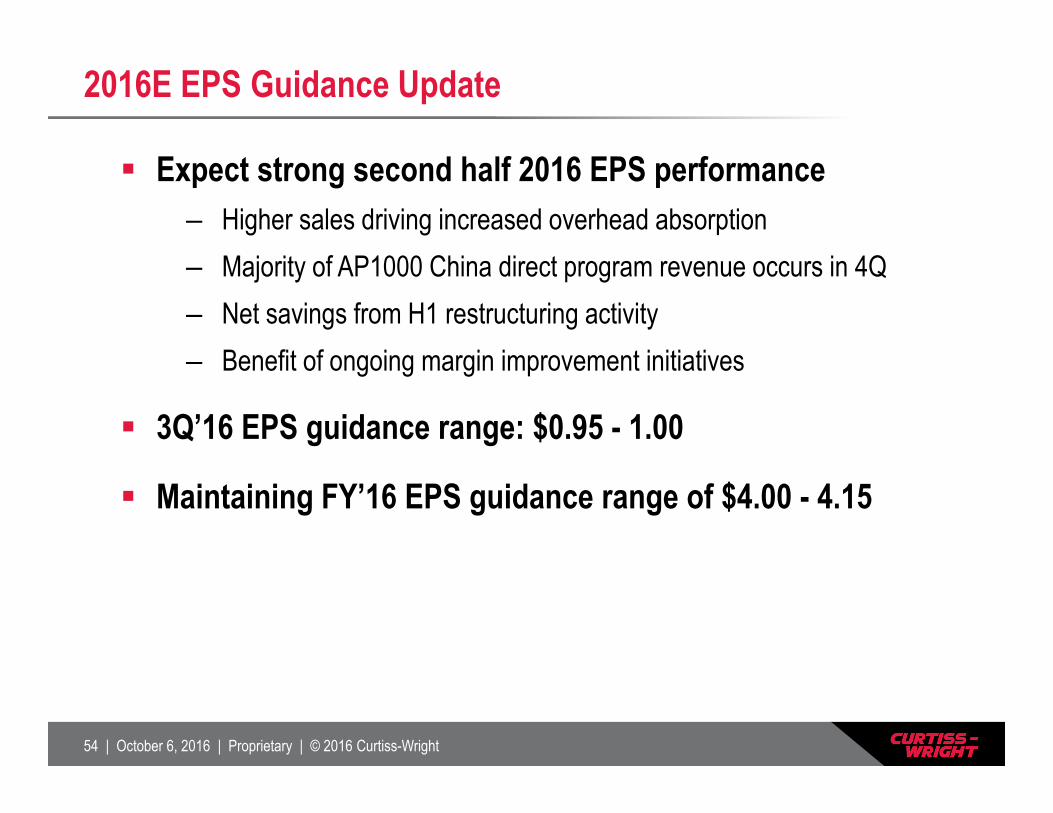
2016E EPS Guidance Update
Expect strong second half 2016 EPS performance– Higher sales driving increased overhead absorption– Majority of AP1000 China direct program revenue occurs in 4Q– Net savings from H1 restructuring activity– Benefit of ongoing margin improvement initiatives
3Q’16 EPS guidance range: $0.95 - 1.00
Maintaining FY’16 EPS guidance range of $4.00 - 4.15
55 | October 6, 2016 | Proprietary | © 2016 Curtiss-Wright
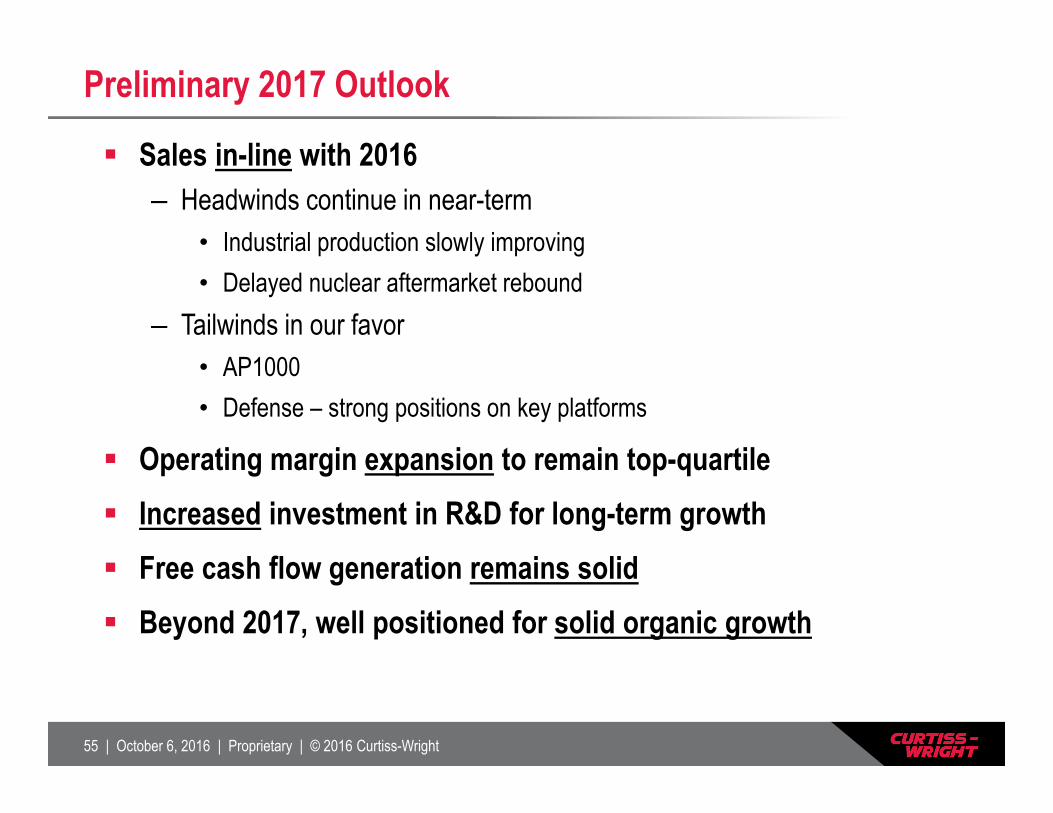
Preliminary 2017 Outlook
Sales in-line with 2016– Headwinds continue in near-term
• Industrial production slowly improving• Delayed nuclear aftermarket rebound
– Tailwinds in our favor• AP1000 • Defense – strong positions on key platforms
Operating margin expansion to remain top-quartile Increased investment in R&D for long-term growth Free cash flow generation remains solid Beyond 2017, well positioned for solid organic growth
56 | October 6, 2016 | Proprietary | © 2016 Curtiss-Wright
Curtiss-Wright Remains a Solid Investment
Delivering Long-Term Shareholder Value
Financial transparency
Delivering top-quartile performance vs. peer group
Rigorous working capital management
Driving free cash flow generation
Committed to balanced capital allocation strategy

57 | October 6, 2016 | Proprietary | © 2016 Curtiss-Wright
Closing Remarks
David C. Adams, Chairman and CEO
58 | October 6, 2016 | Proprietary | © 2016 Curtiss-Wright
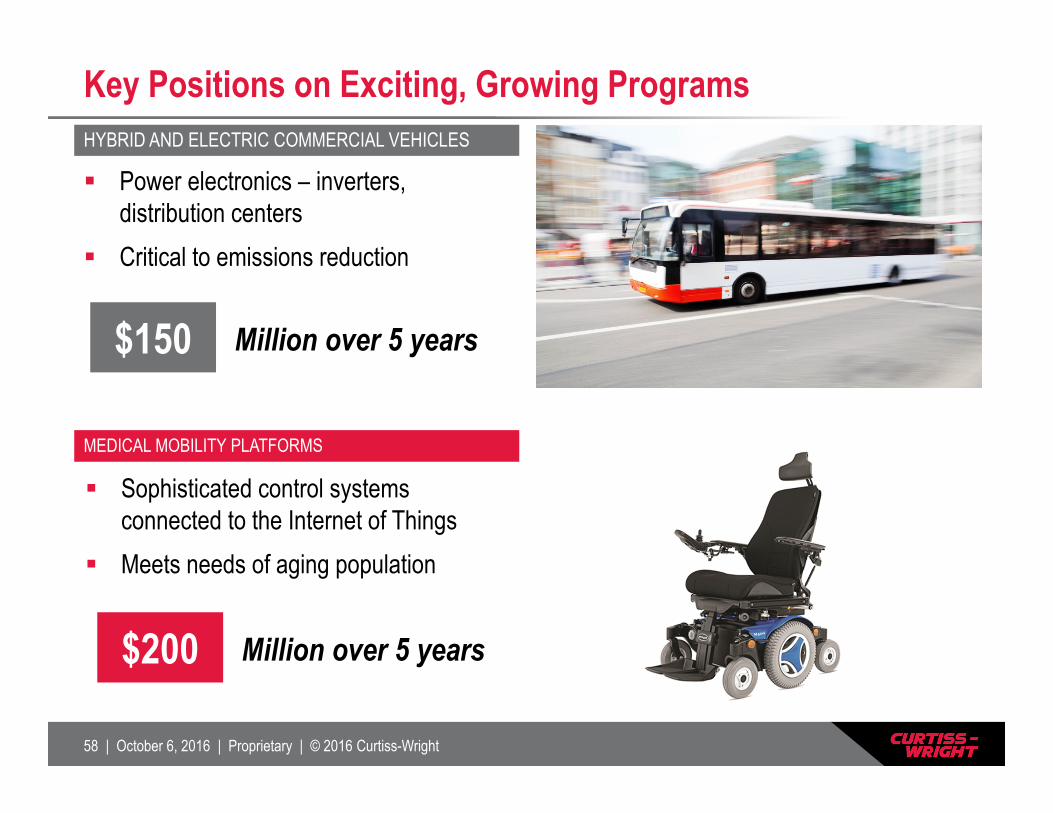
Key Positions on Exciting, Growing Programs
MEDICAL MOBILITY PLATFORMS
Sophisticated control systems connected to the Internet of Things
Meets needs of aging population
$200 Million over 5 years
HYBRID AND ELECTRIC COMMERCIAL VEHICLES
Power electronics – inverters, distribution centers
Critical to emissions reduction
$150 Million over 5 years
59 | October 6, 2016 | Proprietary | © 2016 Curtiss-Wright
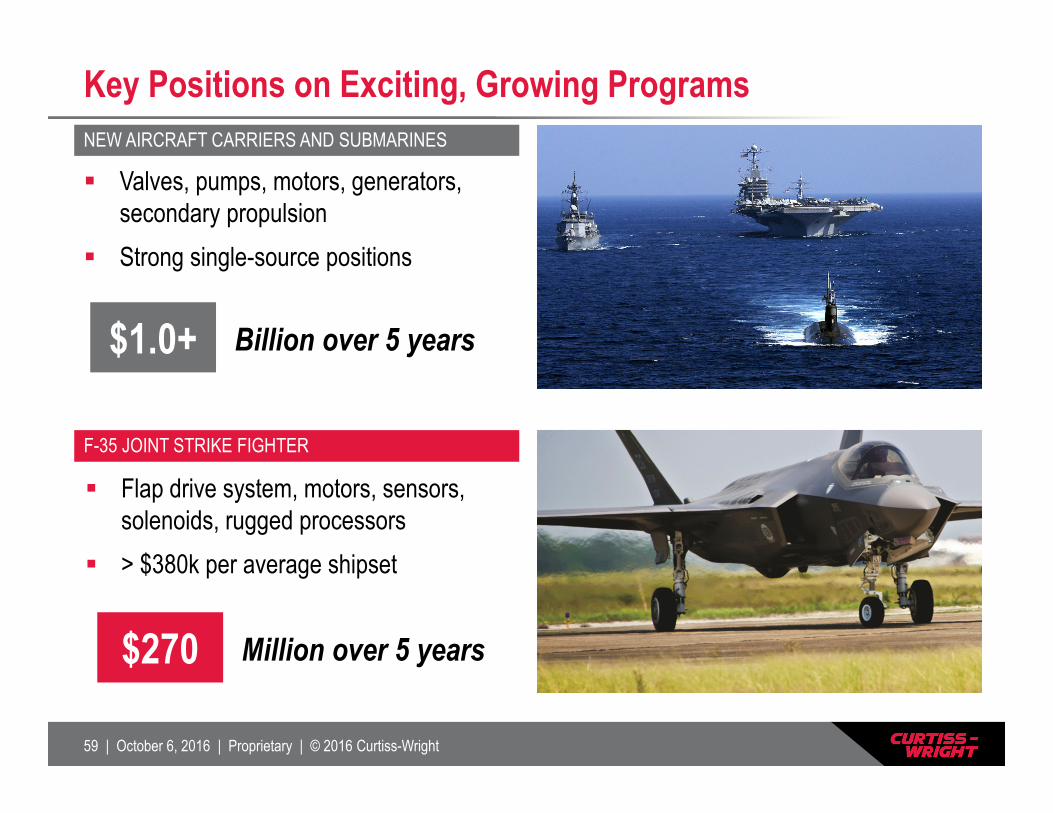
Key Positions on Exciting, Growing ProgramsNEW AIRCRAFT CARRIERS AND SUBMARINES
F-35 JOINT STRIKE FIGHTER
Valves, pumps, motors, generators, secondary propulsion
Strong single-source positions
$1.0+ Billion over 5 years
Flap drive system, motors, sensors, solenoids, rugged processors
> $380k per average shipset
$270 Million over 5 years
60 | October 6, 2016 | Proprietary | © 2016 Curtiss-Wright
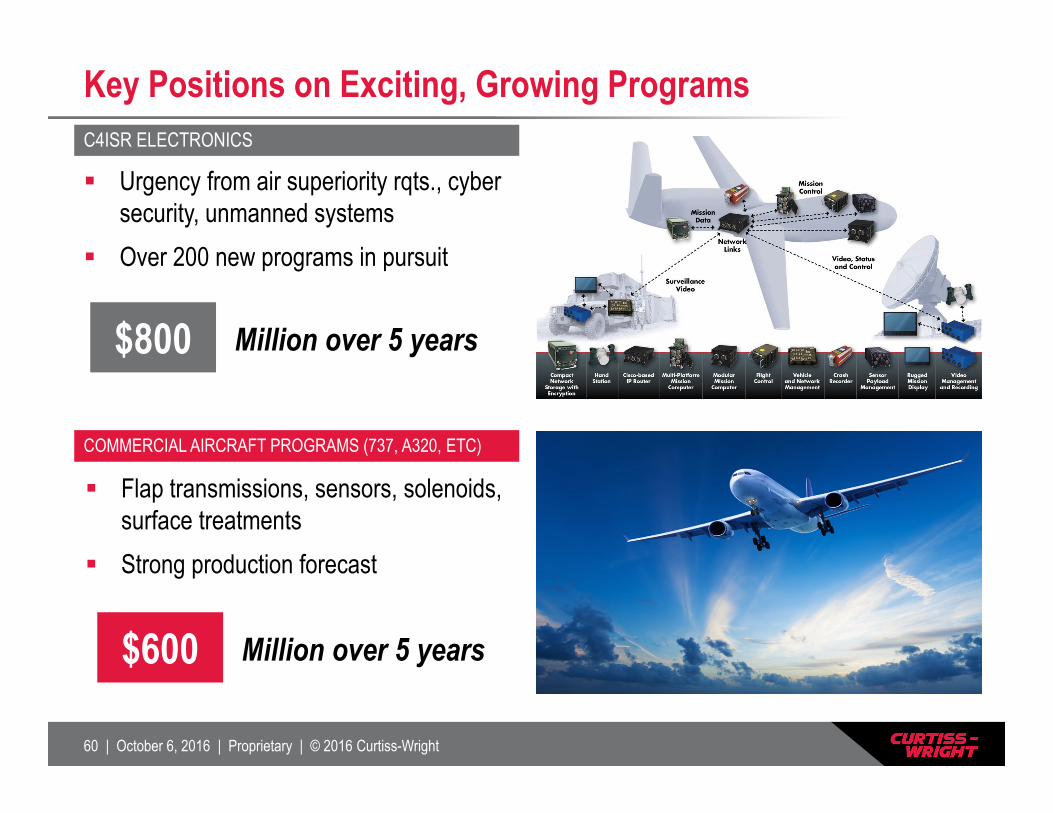
Key Positions on Exciting, Growing Programs
COMMERCIAL AIRCRAFT PROGRAMS (737, A320, ETC)
Flap transmissions, sensors, solenoids, surface treatments
Strong production forecast
$600 Million over 5 years
C4ISR ELECTRONICS
Urgency from air superiority rqts., cyber security, unmanned systems
Over 200 new programs in pursuit
$800 Million over 5 years
61 | October 6, 2016 | Proprietary | © 2016 Curtiss-Wright
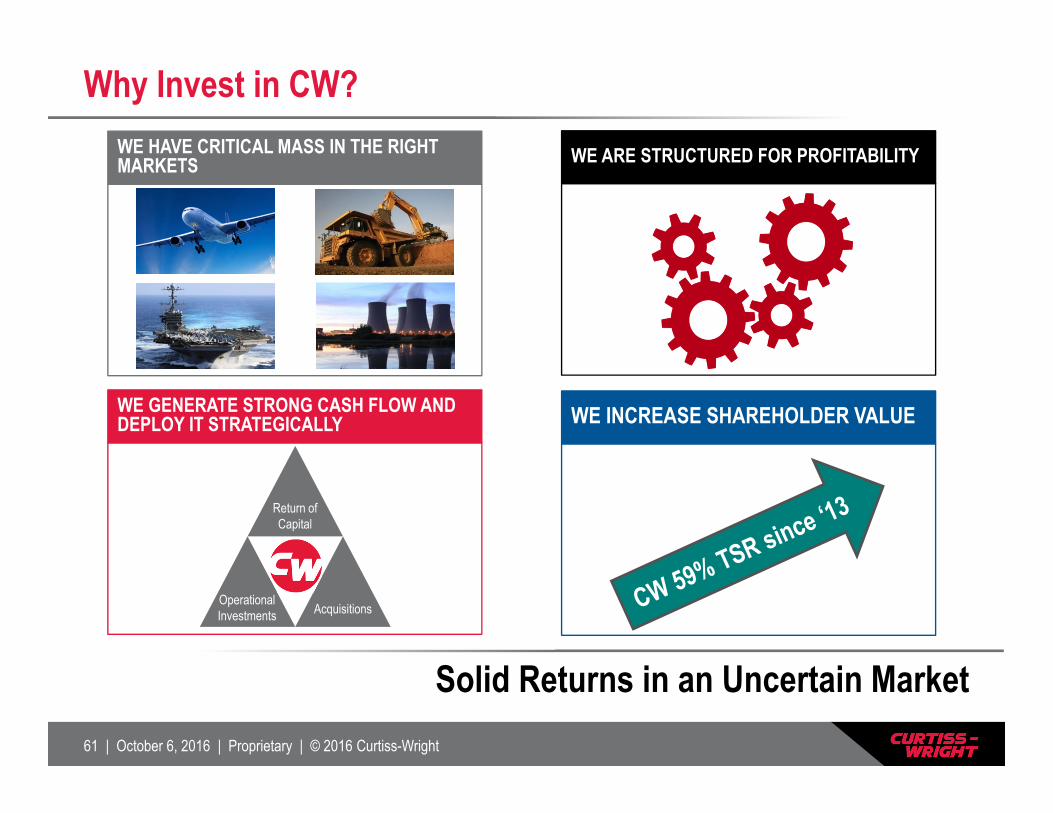
Why Invest in CW?
Solid Returns in an Uncertain Market
WE HAVE CRITICAL MASS IN THE RIGHT MARKETS
WE GENERATE STRONG CASH FLOW AND DEPLOY IT STRATEGICALLY
WE ARE STRUCTURED FOR PROFITABILITY
WE INCREASE SHAREHOLDER VALUE
Return of Capital
Operational Investments Acquisitions
62 | October 6, 2016 | Proprietary | © 2016 Curtiss-Wright
Q&A

63 | October 6, 2016 | Proprietary | © 2016 Curtiss-Wright
Appendix
64 | October 6, 2016 | Proprietary | © 2016 Curtiss-Wright
Appendix - Use of Non-GAAP Financial InformationThe Corporation supplements its financial information determined under U.S. generally accepted accounting principles (GAAP) with certain non-GAAP financial information. Curtiss-Wright believes that these non-GAAP measures provide investors with additional insight into the Company’s ongoing business performance. These non-GAAP measures should not be considered in isolation or as a substitute for the related GAAP measures, and other companies may define such measures differently. Curtiss-Wright encourages investors to review its financial statements and publicly-filed reports in their entirety and not to rely on any single financial measure. The following definitions are provided:
Organic Revenue and Organic Operating Income
The Corporation discloses organic revenue and organic operating income because the Corporation believes it provides investors with insight as to the Company’s ongoing business performance. Organic revenue and organic operating income are defined as revenue and operating income excluding the impact of foreign currency fluctuations and contributions from acquisitions made during the last twelve months.
Free Cash Flow and Free Cash Flow Conversion
The Corporation discloses free cash flow because it measures cash flow available for investing and financing activities. Free cash flow represents cash available to repay outstanding debt, invest in the business, acquire businesses, return capital to shareholders and make other strategic investments. Free cash flow is defined as cash flow provided by operating activities less capital expenditures. The Corporation discloses free cash flow conversion because it measures the proportion of net earnings converted into free cash flow and is defined as free cash flow divided by net earnings from continuing operations.
Recommended