Interim Report Q3 2016
INTERIM REPORT Q3 2016 | CONTENTS 3
Contents
A | Key Figures 4
B | Daimler and the Capital Market 6
C | Interim Management Report 7 - 18
Business development 7Profitability 9Cash flows 11Financial position 13Capital expenditure and research activities 15Workforce 15Important events 15Risk and opportunity report 16Outlook 17
D | The Divisions 19 - 23
Mercedes-Benz Cars 19Daimler Trucks 20Mercedes-Benz Vans 21Daimler Buses 22Daimler Financial Services 23
E | Interim Consolidated Financial Statements 24 - 49
Consolidated Statement of Income 24Consolidated Statement of Comprehensive Income 26Consolidated Statement of Financial Position 28Consolidated Statement of Cash Flows 29Consolidated Statement of Changes in Equity 30Notes to the Interim Consolidated Financial Statements 32
Auditor’s Review Report 50
F | Addresses – Information –
Financial Calendar 51
Cover photo: the new Cascadia. The new Freightliner Cascadia with its aerodynamic design and inte-grated Detroit powertrain achieves an improvement in fuel efficiency of up to 8% compared with a 2016 Cascadia Evolution. It reaches a new level also in terms of safety, connectivity and operating time. With its new full-LED system, the new Cascadia offers a significantly larger field of vision in situations of poor visibility. The optional Detroit Assurance 4.0 safety package includes Active Brake Assist. A new, exclusive connectivity platform can supply automatic fuel-efficiency and safety analyses. This platform helps to reduce repair costs and increase operating times.
4 A | KEY FIGURES
Q3
Key Figures Daimler Group
€ amounts in millions Q3 2016 Q3 2015 % change
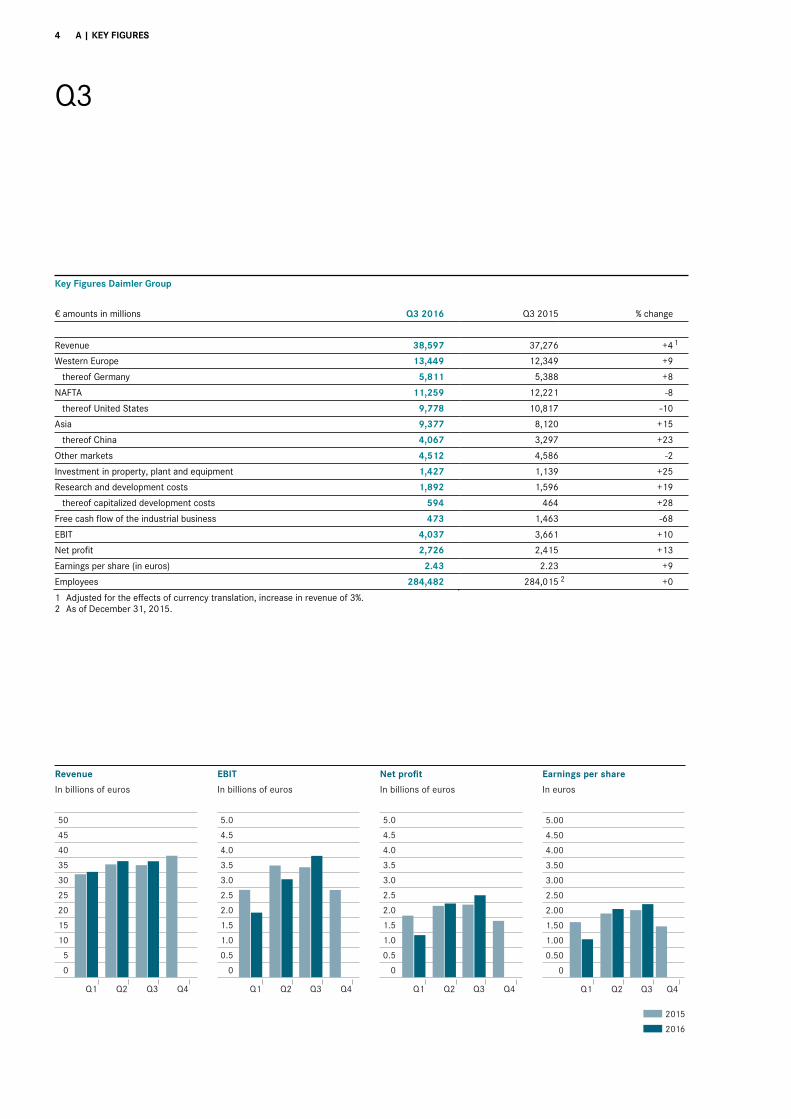
Revenue 38,597 37,276 +41
Western Europe 13,449 12,349 +9
thereof Germany 5,811 5,388 +8
NAFTA 11,259 12,221 -8
thereof United States 9,778 10,817 -10
Asia 9,377 8,120 +15
thereof China 4,067 3,297 +23
Other markets 4,512 4,586 -2
Investment in property, plant and equipment 1,427 1,139 +25
Research and development costs 1,892 1,596 +19
thereof capitalized development costs 594 464 +28
Free cash flow of the industrial business 473 1,463 -68
EBIT 4,037 3,661 +10
Net profit 2,726 2,415 +13
Earnings per share (in euros) 2.43 2.23 +9
Employees 284,482 284,015 2 +0
1 Adjusted for the effects of currency translation, increase in revenue of 3%. 2 As of December 31, 2015.
Q1 Q2 Q3 Q4
2015
2016
Q1 Q2 Q3 Q4 Q1 Q2 Q3 Q4 Q1 Q2 Q3 Q4
50
45
40
35
30
25
20
15
10
5
0
Revenue
In billions of euros In billions of euros In billions of euros
EBIT Net profit Earnings per share
In euros
5.0
4.5
4.0
3.5
3.0
2.5
2.0
1.5
1.0
0.5
0
5.0
4.5
4.0
3.5
3.0
2.5
2.0
1.5
1.0
0.5
0
5.00
4.50
4.00
3.50
3.00
2.50
2.00
1.50
1.00
0.50
0
A | KEY FIGURES 5
Q1-3
Key Figures Daimler Group
€ amounts in millions Q1-3 2016 Q1-3 2015 % change
Revenue 112,260 109,039 +3 1
Western Europe 39,851 35,405 +13
thereof Germany 17,223 15,957 +8
NAFTA 33,307 35,081 -5
thereof United States 29,123 30,920 -6
Asia 26,036 24,816 +5
thereof China 11,667 10,655 +9
Other markets 13,066 13,737 -5
Investment in property, plant and equipment 3,882 3,211 +21
Research and development costs 5,447 4,743 +15
thereof capitalized development costs 1,648 1,296 +27
Free cash flow of the industrial business 2,593 4,828 -46
EBIT 9,443 10,285 -8
Net profit 6,578 6,837 -4
Earnings per share (in euros) 5.96 6.19 -4
Employees 284,482 284,015 2 +0
1 Adjusted for the effects of currency translation, increase in revenue of 4%. 2 As of December 31, 2015.
6 B | DAIMLER AND THE CAPITAL MARKET
Daimler and the Capital Market
Key figures
Sept. 30, Sept. 30, 2016 2015 % change
Earnings per share in Q3 (in €) 2.43 2.23 +9
Outstanding shares (in millions) 1,069.8 1,069.8 0
Market capitalization (€ billion) 67.09 69.38 -3
Xetra closing price (in €) 62.71 64.85 -3
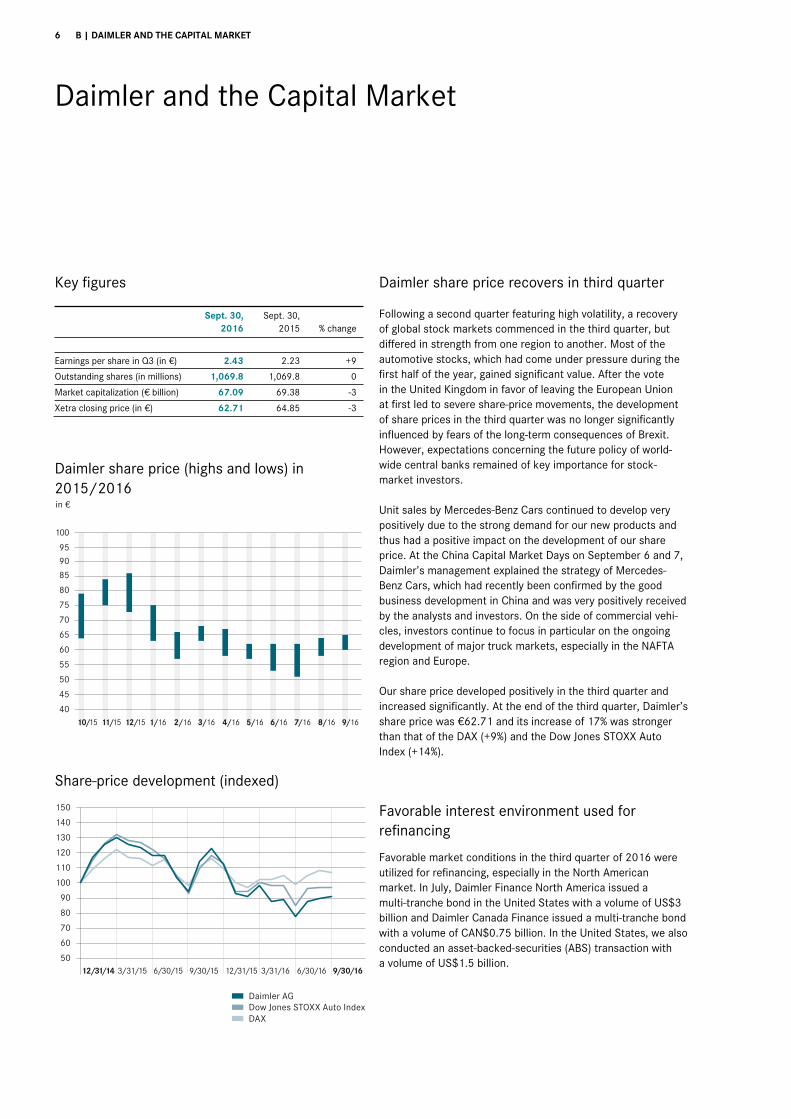
Daimler share price (highs and lows) in 2015/2016
Share-price development (indexed)
Daimler share price recovers in third quarter
Following a second quarter featuring high volatility, a recovery of global stock markets commenced in the third quarter, but differed in strength from one region to another. Most of the automotive stocks, which had come under pressure during the first half of the year, gained significant value. After the vote in the United Kingdom in favor of leaving the European Union at first led to severe share-price movements, the development of share prices in the third quarter was no longer significantly influenced by fears of the long-term consequences of Brexit. However, expectations concerning the future policy of world-wide central banks remained of key importance for stock-market investors.
Unit sales by Mercedes-Benz Cars continued to develop very positively due to the strong demand for our new products and thus had a positive impact on the development of our share price. At the China Capital Market Days on September 6 and 7, Daimler’s management explained the strategy of Mercedes-Benz Cars, which had recently been confirmed by the good business development in China and was very positively received by the analysts and investors. On the side of commercial vehi-cles, investors continue to focus in particular on the ongoing development of major truck markets, especially in the NAFTA region and Europe.
Our share price developed positively in the third quarter and increased significantly. At the end of the third quarter, Daimler’s share price was €62.71 and its increase of 17% was stronger than that of the DAX (+9%) and the Dow Jones STOXX Auto Index (+14%).
Favorable interest environment used for refinancing
Favorable market conditions in the third quarter of 2016 were utilized for refinancing, especially in the North American market. In July, Daimler Finance North America issued a multi-tranche bond in the United States with a volume of US$3 billion and Daimler Canada Finance issued a multi-tranche bond with a volume of CAN$0.75 billion. In the United States, we also conducted an asset-backed-securities (ABS) transaction with a volume of US$1.5 billion.
in €
50
45
40
55
60
65
70
75
80
85
9095
100
9/168/167/166/165/164/163/162/161/1612/1511/1510/15
Dow Jones STOXX Auto IndexDAX
Daimler AG
150
140
130
120
110
100
90
80
70
60
5012/31/14 3/31/16 6/30/16 9/30/163/31/15 6/30/15 9/30/15 12/31/15
C | INTERIM MANAGEMENT REPORT 7
Interim Management Report Unit sales slightly above prior-year level at 754,100 vehicles (+5%) Revenue up by 4% to €38.6 billion Group EBIT of €4,037 million (Q3 2015: €3,661 million) Net profit of €2,726 million (Q3 2015: €2,415 million) Free cash flow of industrial business of €2,593 million in the first nine months (Q1-3 2015: €4,828 million) Slight growth in unit sales and revenue on prior-year level anticipated for full-year 2016 Group EBIT adjusted for special items expected to be slightly higher than in 2015
Business development
World economy still lacks dynamism The world economy continued its moderate, below-average growth with a year-on-year rate of probably just under 2.5% in the third quarter. Most economic indicators followed a sideways development in the past three months, especially the still rather moderate global business sentiment. The major impact on markets feared following the referendum in the United Kingdom did not really occur, with the exception of the pound’s deprecia-tion by just over 10%. The European economy was fairly resistant and continued to expand in line with its long-term growth trend of about 1.5%. The European Central Bank main-tained its very expansive monetary policy. As the US Federal Reserve has not yet raised interest rates and the Bank of Eng-land actually reduced interest rates in order to counteract the effects of the referendum, the global level of interest rates remained very low in the third quarter. After relatively weak growth in the second quarter, the US economy seems recently to have accelerated again somewhat. Although the economic situation in emerging markets with high exports of raw materi-als continued to stabilize, economic output in some South American countries and in Russia remained lower than in the prior-year period, in some cases by a significant margin.
Worldwide demand for cars continued along its path of expansion in the third quarter. The main drivers of the global growth were ongoing favorable market developments in China and Western Europe. Demand in China profited not only from tax incentives for the purchase of small cars, but also from rather more favorable economic conditions. Compared with the development in the first half of the year, the market became more dynamic and was a good double-digit percentage larger than in the third quarter of 2015. Demand for cars in Western Europe continued to recover, but the growth rate of about 4% was rather moderate due to the rising basis of comparison. The markets of Italy and Spain once again expanded very substan-tially (+13% and +10% respectively). But the German market also remained solid with growth of approximately 4%. In the United States, demand for cars and light trucks remained at a high level, but was slightly lower than in the third quarter of last year at about minus 1%. The Japanese car market continued to stabilize and was roughly at the prior-year level. Car markets in the emerging economies continued to show a varying picture. In India, demand was higher than in the prior-year period by a double-digit percentage, and the Russian market contracted by a similar rate.
The development of demand for medium- and heavy-duty trucks continued to differ considerably from one region to another. In the North American market, the expected cyclical downswing is meanwhile taking place, so the number of trucks sold in Classes 6-8 decreased by a double-digit rate. The situa-tion was positive in the European market, which remained significantly above the prior-year level, although with rather less dynamism. The Turkish market, which is anyway experiencing considerably lower demand this year due to the introduction of the Euro VI emission standard, has recently been additionally weakened by the country’s current situation and was once again below its prior-year level by a double-digit percentage. The development in Brazil was similarly negative; due to the country’s ongoing deep recession, the market contracted again by almost 30% from its already low level of the prior-year peri-od. The Japanese market for light-, medium- and heavy-duty trucks continued to display a favorable tendency in the past quarter, expanding slightly compared with the prior-year period. The development of the overall truck market was disappointing in Indonesia. Although the downward trend became less pro-nounced, the drop in demand was still significant. The develop-ment of the Indian market for medium- and heavy-duty trucks has recently also weakened significantly. After strong growth in the first half of the year, sales declined by a double-digit rate in the third quarter. Demand in Russia continued to stabilize and according to recent estimates was significantly stronger than in the weak prior-year period. The recovery of the Chinese market has recently been increasingly dynamic, with strong double-digit growth in the third quarter.
Demand for vans in Western Europe continued to grow, with a 19% increase in market volume for mid-size and large vans. Demand for small vans increased by 17%. The US market for large vans also continued its strong growth at a rate of 13%. Due to unfavorable economic conditions, the market for large vans in Latin America once again contracted, however.
The bus market in Western Europe developed significantly better in the third quarter of 2016 than in the prior-year period, with growth of 12%. Due to the ongoing difficult economic situation, demand in Brazil was significantly lower than in the third quarter of last year, with a decrease of approximately 15%. As a result of the current difficult situation, domestic demand in Turkey was well below the prior-year level (-56%).
8 C | INTERIM MANAGEMENT REPORT
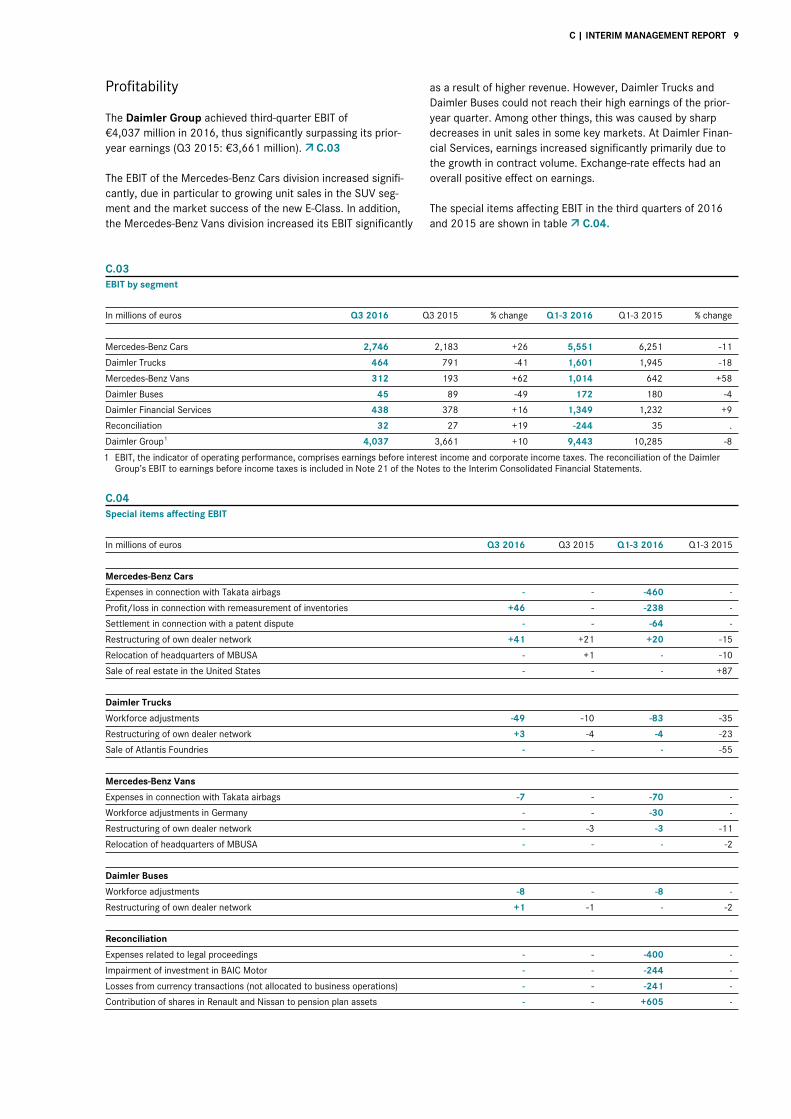
Slight growth in third-quarter unit sales In the third quarter of 2016, Daimler sold 754,100 cars and commercial vehicles worldwide, surpassing the total for the prior-year period by 5%. C.01
Mercedes-Benz Cars increased its unit sales in the third quar-ter of 2016 by 11% to a total of 565,600 vehicles. The past three months were therefore the best-selling quarter in the company’s history. In Europe, Mercedes-Benz Cars set a new record for a third quarter with sales of 244,600 units, or 12% more than in the prior-year period. Double-digit growth was achieved in the United Kingdom, France, Italy, Spain and Bel-gium. In Germany, 79,100 vehicles of the Mercedes-Benz and smart brands were sold between July and September (+8%). Sales in China rose by 20% to a new high of 126,600 units, and new records were set also in Japan (+8%), South Korea (+40%), Australia (+8%) and Taiwan (+13%). Unit sales were higher than ever before in a third quarter also in the NAFTA region. In the United States, sales by Mercedes-Benz Cars in the period of July through September increased to 89,900 units (Q3 2015: 88,100).
Third-quarter sales of 97,100 units by Daimler Trucks were 24% lower than the prior-year figure. In the NAFTA region, our truck sales decreased to 31,400 units in a declining market environment (Q3 2015: 52,200). We were able to further extend our market leadership in Classes 6-8, however, with a market share of 39,3% (Q3 2015: 38.1%). In the EU30 region (European Union, Switzerland and Norway), we achieved a positive sales development with growth of 7% to 21,300 units. In Latin America, our sales decreased to 7,700 units due to the continuation of difficult economic conditions (Q3 2015: 7,800). Our deliveries in Turkey decreased to 1,700 units in a very weak market environment (Q3 2015: 4,500). Sales of 11,700 vehicles in Japan were on the prior-year level. Unit sales were significant-ly lower than in the prior-year period in the Middle East, where we delivered 3,300 trucks (Q3 2015: 9,700). Our unit sales in Indonesia amounted to 6.700 vehicles (Q3 2015: 5,400).
Mercedes-Benz Vans increased its unit sales by 13% to the new record of 85,200 vehicles in the third quarter of 2016. In its core region of Western Europe, the van division achieved further substantial growth of 13% to 54,200 units, with strong growth in Germany (+19%), France (+16%), Spain (+14%) and Italy (+40%). In Eastern Europe, however, unit sales decreased by 19% to 6,900 vehicles. The development was positive once again in the NAFTA region, where Mercedes-Benz Vans increased its third-quarter sales by 14% to 10,600 units. The market environment in Latin America remained difficult; nonetheless, our unit sales there stabilized at 3,400 vehicles (-3%). In China, unit sales more than doubled to 4,100 units, following the market launch of the new Mercedes-Benz Vito in that market.
Third-quarter sales by Daimler Buses decreased by 17% to 6,200 units. In Western Europe, we sold 1,700 buses of the Mercedes-Benz and Setra brands despite supply bottlenecks in the logistics chain (Q3 2015: 1,800). In Turkey our sales were significantly lower than in the third quarter of last year due to the current difficult situation in that country (-81%). In Latin America (excluding Mexico), demand for bus chassis continued to be negatively affected by the ongoing difficult economic situation in Brazil, so sales of 2,200 units were significantly lower than in the prior-year period (Q3 2015: 3,500).
At Daimler Financial Services, new business increased by 7% compared with the prior-year period to €15.7 billion. Contract volume reached €122.1 billion at the end of September, which is 5% higher than at the end of 2015. Adjusted for exchange-rate effects, contract volume increased by 6%. The business of brokering insurance contracts continued to develop very posi-tively. Worldwide, approximately 445,000 insurance contracts were concluded through Daimler Financial Services (Q3 2015: 428,000).
The Daimler Group’s third-quarter revenue amounted to €38.6 billion, which is 4% higher than in the third quarter of 2015. Adjusted for exchange-rate effects, revenue grew by 3%. C.02
Mercedes-Benz Cars’ revenue increased by 12% to €23.3 billion. At Daimler Trucks, revenue decreased by 19% to €7.9 billion due to lower unit sales caused by weak markets in major regions. Mercedes-Benz Vans achieved revenue growth of 13% to €3.1 billion. Despite an overall significant decrease in unit sales at Daimler Buses, changes in the division’s sales structure led to a disproportionately small decrease in revenue of 8% to €0.9 billion.
C.01 Unit sales by division
Q3 2016 Q3 2015 % change
Daimler Group 754,130 720,016 +5
Mercedes-Benz Cars 565,564 508,350 +11
Daimler Trucks 97,143 128,496 -24
Mercedes-Benz Vans 85,238 75,732 +13
Daimler Buses 6,185 7,438 -17
C.02 Revenue by division
In millions of euros Q3 2016 Q3 2015 % change
Daimler Group 38,597 37,276 +4
Mercedes-Benz Cars 23,251 20,707 +12
Daimler Trucks 7,851 9,650 -19
Mercedes-Benz Vans 3,120 2,752 +13
Daimler Buses 937 1,018 -8
Daimler Financial Services 5,133 4,702 +9
C | INTERIM MANAGEMENT REPORT 9
Profitability
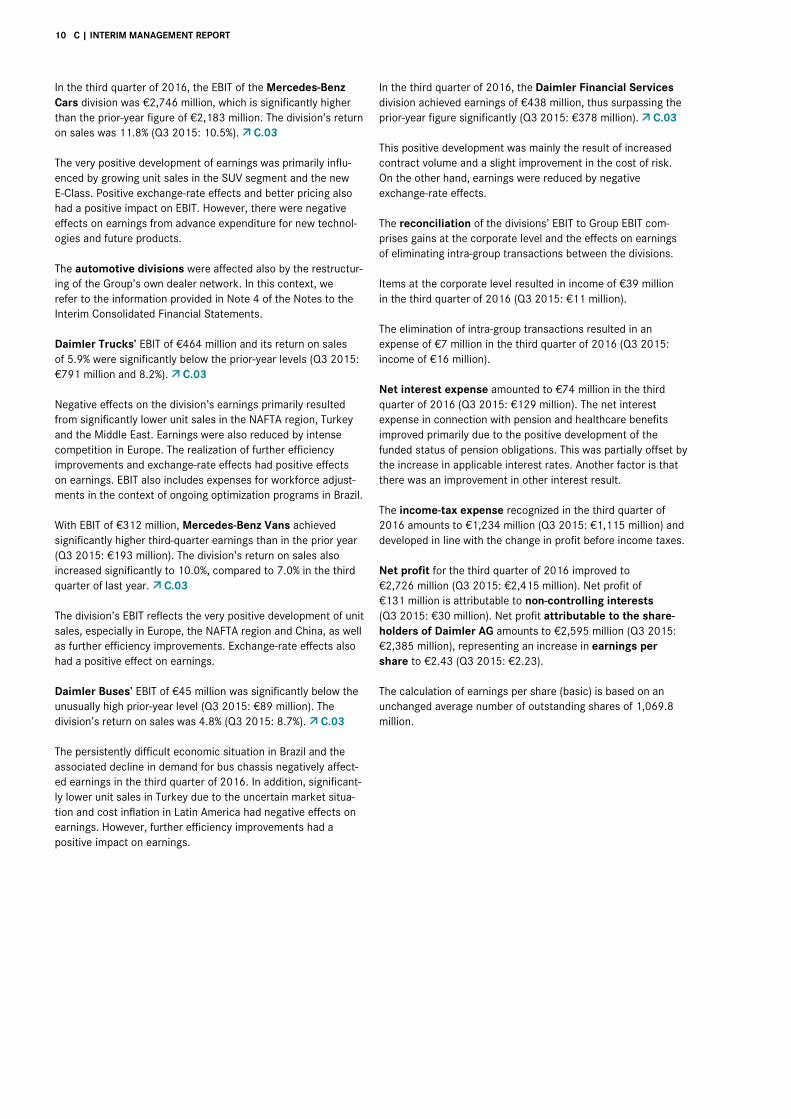
The Daimler Group achieved third-quarter EBIT of €4,037 million in 2016, thus significantly surpassing its prior-year earnings (Q3 2015: €3,661 million). C.03
The EBIT of the Mercedes-Benz Cars division increased signifi-cantly, due in particular to growing unit sales in the SUV seg-ment and the market success of the new E-Class. In addition, the Mercedes-Benz Vans division increased its EBIT significantly
as a result of higher revenue. However, Daimler Trucks and Daimler Buses could not reach their high earnings of the prior-year quarter. Among other things, this was caused by sharp decreases in unit sales in some key markets. At Daimler Finan-cial Services, earnings increased significantly primarily due to the growth in contract volume. Exchange-rate effects had an overall positive effect on earnings.
The special items affecting EBIT in the third quarters of 2016 and 2015 are shown in table C.04.
C.03 EBIT by segment
In millions of euros Q3 2016 Q3 2015 % change Q1-3 2016 Q1-3 2015 % change
Mercedes-Benz Cars 2,746 2,183 +26 5,551 6,251 -11
Daimler Trucks 464 791 -41 1,601 1,945 -18
Mercedes-Benz Vans 312 193 +62 1,014 642 +58
Daimler Buses 45 89 -49 172 180 -4
Daimler Financial Services 438 378 +16 1,349 1,232 +9
Reconciliation 32 27 +19 -244 35 .
Daimler Group
1 4,037 3,661 +10 9,443 10,285 -8
1 EBIT, the indicator of operating performance, comprises earnings before interest income and corporate income taxes. The reconciliation of the Daimler Group’s EBIT to earnings before income taxes is included in Note 21 of the Notes to the Interim Consolidated Financial Statements.
C.04 Special items affecting EBIT
In millions of euros Q3 2016 Q3 2015 Q1-3 2016 Q1-3 2015
Mercedes-Benz Cars
Expenses in connection with Takata airbags - - -460 -
Profit/loss in connection with remeasurement of inventories +46 - -238 -
Settlement in connection with a patent dispute - - -64 -
Restructuring of own dealer network +41 +21 +20 -15
Relocation of headquarters of MBUSA - +1 - -10
Sale of real estate in the United States - - - +87
Daimler Trucks
Workforce adjustments -49 -10 -83 -35
Restructuring of own dealer network +3 -4 -4 -23
Sale of Atlantis Foundries - - - -55
Mercedes-Benz Vans
Expenses in connection with Takata airbags -7 - -70 -
Workforce adjustments in Germany - - -30 -
Restructuring of own dealer network - -3 -3 -11
Relocation of headquarters of MBUSA - - - -2
Daimler Buses
Workforce adjustments -8 - -8 -
Restructuring of own dealer network +1 -1 - -2
Reconciliation
Expenses related to legal proceedings - - -400 -
Impairment of investment in BAIC Motor - - -244 -
Losses from currency transactions (not allocated to business operations) - - -241 -
Contribution of shares in Renault and Nissan to pension plan assets - - +605 -
10 C | INTERIM MANAGEMENT REPORT
In the third quarter of 2016, the EBIT of the Mercedes-Benz Cars division was €2,746 million, which is significantly higher than the prior-year figure of €2,183 million. The division’s return on sales was 11.8% (Q3 2015: 10.5%). C.03
The very positive development of earnings was primarily influ-enced by growing unit sales in the SUV segment and the new E-Class. Positive exchange-rate effects and better pricing also had a positive impact on EBIT. However, there were negative effects on earnings from advance expenditure for new technol-ogies and future products.
The automotive divisions were affected also by the restructur-ing of the Group’s own dealer network. In this context, we refer to the information provided in Note 4 of the Notes to the Interim Consolidated Financial Statements.
Daimler Trucks’ EBIT of €464 million and its return on sales of 5.9% were significantly below the prior-year levels (Q3 2015: €791 million and 8.2%). C.03
Negative effects on the division’s earnings primarily resulted from significantly lower unit sales in the NAFTA region, Turkey and the Middle East. Earnings were also reduced by intense competition in Europe. The realization of further efficiency improvements and exchange-rate effects had positive effects on earnings. EBIT also includes expenses for workforce adjust-ments in the context of ongoing optimization programs in Brazil.
With EBIT of €312 million, Mercedes-Benz Vans achieved significantly higher third-quarter earnings than in the prior year (Q3 2015: €193 million). The division’s return on sales also increased significantly to 10.0%, compared to 7.0% in the third quarter of last year. C.03
The division’s EBIT reflects the very positive development of unit sales, especially in Europe, the NAFTA region and China, as well as further efficiency improvements. Exchange-rate effects also had a positive effect on earnings.
Daimler Buses’ EBIT of €45 million was significantly below the unusually high prior-year level (Q3 2015: €89 million). The division’s return on sales was 4.8% (Q3 2015: 8.7%). C.03
The persistently difficult economic situation in Brazil and the associated decline in demand for bus chassis negatively affect-ed earnings in the third quarter of 2016. In addition, significant-ly lower unit sales in Turkey due to the uncertain market situa-tion and cost inflation in Latin America had negative effects on earnings. However, further efficiency improvements had a positive impact on earnings.
In the third quarter of 2016, the Daimler Financial Services division achieved earnings of €438 million, thus surpassing the prior-year figure significantly (Q3 2015: €378 million). C.03
This positive development was mainly the result of increased contract volume and a slight improvement in the cost of risk. On the other hand, earnings were reduced by negative exchange-rate effects.
The reconciliation of the divisions’ EBIT to Group EBIT com-prises gains at the corporate level and the effects on earnings of eliminating intra-group transactions between the divisions.
Items at the corporate level resulted in income of €39 million in the third quarter of 2016 (Q3 2015: €11 million).
The elimination of intra-group transactions resulted in an expense of €7 million in the third quarter of 2016 (Q3 2015: income of €16 million).
Net interest expense amounted to €74 million in the third quarter of 2016 (Q3 2015: €129 million). The net interest expense in connection with pension and healthcare benefits improved primarily due to the positive development of the funded status of pension obligations. This was partially offset by the increase in applicable interest rates. Another factor is that there was an improvement in other interest result.
The income-tax expense recognized in the third quarter of 2016 amounts to €1,234 million (Q3 2015: €1,115 million) and developed in line with the change in profit before income taxes.
Net profit for the third quarter of 2016 improved to €2,726 million (Q3 2015: €2,415 million). Net profit of €131 million is attributable to non-controlling interests (Q3 2015: €30 million). Net profit attributable to the share-holders of Daimler AG amounts to €2,595 million (Q3 2015: €2,385 million), representing an increase in earnings per share to €2.43 (Q3 2015: €2.23).
The calculation of earnings per share (basic) is based on an unchanged average number of outstanding shares of 1,069.8 million.
C | INTERIM MANAGEMENT REPORT 11
Cash flows
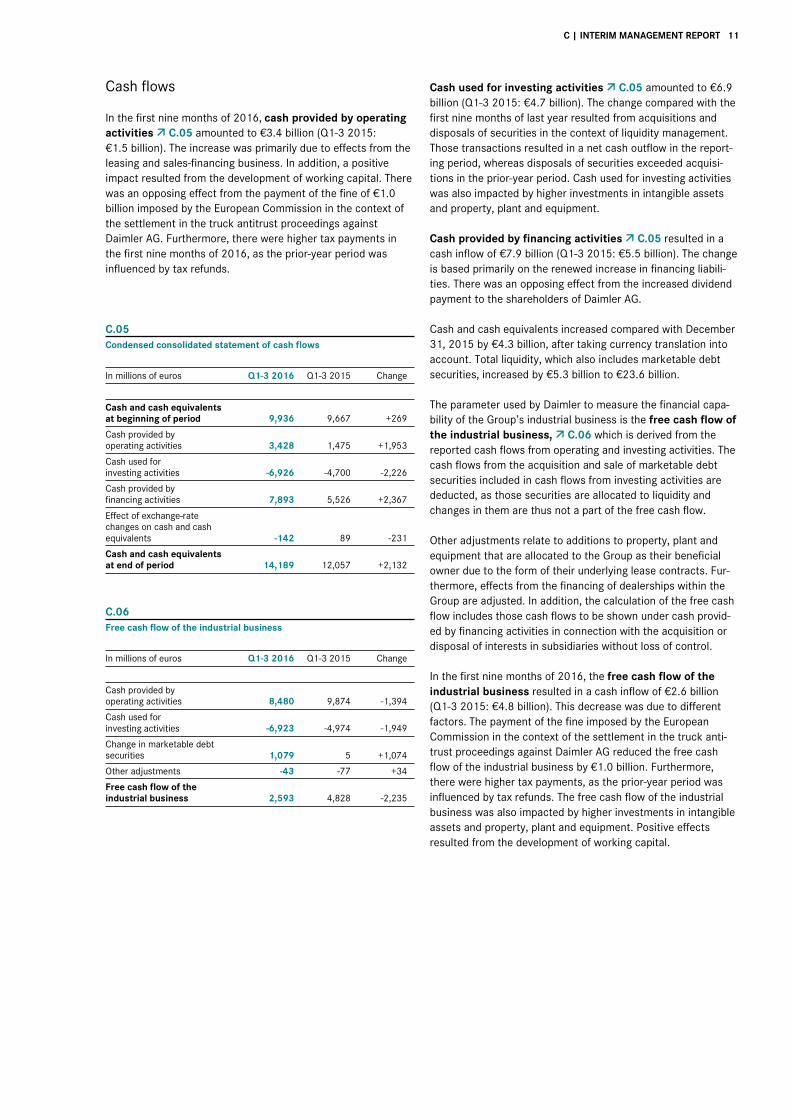
In the first nine months of 2016, cash provided by operating activities C.05 amounted to €3.4 billion (Q1-3 2015: €1.5 billion). The increase was primarily due to effects from the leasing and sales-financing business. In addition, a positive impact resulted from the development of working capital. There was an opposing effect from the payment of the fine of €1.0 billion imposed by the European Commission in the context of the settlement in the truck antitrust proceedings against Daimler AG. Furthermore, there were higher tax payments in the first nine months of 2016, as the prior-year period was influenced by tax refunds.
C.05 Condensed consolidated statement of cash flows
In millions of euros Q1-3 2016 Q1-3 2015 Change
Cash and cash equivalents at beginning of period 9,936 9,667 +269
Cash provided by operating activities 3,428 1,475 +1,953
Cash used for investing activities -6,926 -4,700 -2,226
Cash provided by financing activities 7,893 5,526 +2,367
Effect of exchange-rate changes on cash and cash equivalents -142 89 -231
Cash and cash equivalents at end of period 14,189 12,057 +2,132
C.06 Free cash flow of the industrial business
In millions of euros Q1-3 2016 Q1-3 2015 Change
Cash provided by operating activities 8,480 9,874 -1,394
Cash used for investing activities -6,923 -4,974 -1,949
Change in marketable debt securities 1,079 5 +1,074
Other adjustments -43 -77 +34
Free cash flow of the industrial business 2,593 4,828 -2,235
Cash used for investing activities C.05 amounted to €6.9 billion (Q1-3 2015: €4.7 billion). The change compared with the first nine months of last year resulted from acquisitions and disposals of securities in the context of liquidity management. Those transactions resulted in a net cash outflow in the report-ing period, whereas disposals of securities exceeded acquisi-tions in the prior-year period. Cash used for investing activities was also impacted by higher investments in intangible assets and property, plant and equipment.
Cash provided by financing activities C.05 resulted in a cash inflow of €7.9 billion (Q1-3 2015: €5.5 billion). The change is based primarily on the renewed increase in financing liabili-ties. There was an opposing effect from the increased dividend payment to the shareholders of Daimler AG.
Cash and cash equivalents increased compared with December 31, 2015 by €4.3 billion, after taking currency translation into account. Total liquidity, which also includes marketable debt securities, increased by €5.3 billion to €23.6 billion.
The parameter used by Daimler to measure the financial capa-bility of the Group’s industrial business is the free cash flow of the industrial business, C.06 which is derived from the reported cash flows from operating and investing activities. The cash flows from the acquisition and sale of marketable debt securities included in cash flows from investing activities are deducted, as those securities are allocated to liquidity and changes in them are thus not a part of the free cash flow.
Other adjustments relate to additions to property, plant and equipment that are allocated to the Group as their beneficial owner due to the form of their underlying lease contracts. Fur-thermore, effects from the financing of dealerships within the Group are adjusted. In addition, the calculation of the free cash flow includes those cash flows to be shown under cash provid-ed by financing activities in connection with the acquisition or disposal of interests in subsidiaries without loss of control.
In the first nine months of 2016, the free cash flow of the industrial business resulted in a cash inflow of €2.6 billion (Q1-3 2015: €4.8 billion). This decrease was due to different factors. The payment of the fine imposed by the European Commission in the context of the settlement in the truck anti-trust proceedings against Daimler AG reduced the free cash flow of the industrial business by €1.0 billion. Furthermore, there were higher tax payments, as the prior-year period was influenced by tax refunds. The free cash flow of the industrial business was also impacted by higher investments in intangible assets and property, plant and equipment. Positive effects resulted from the development of working capital.
12 C | INTERIM MANAGEMENT REPORT
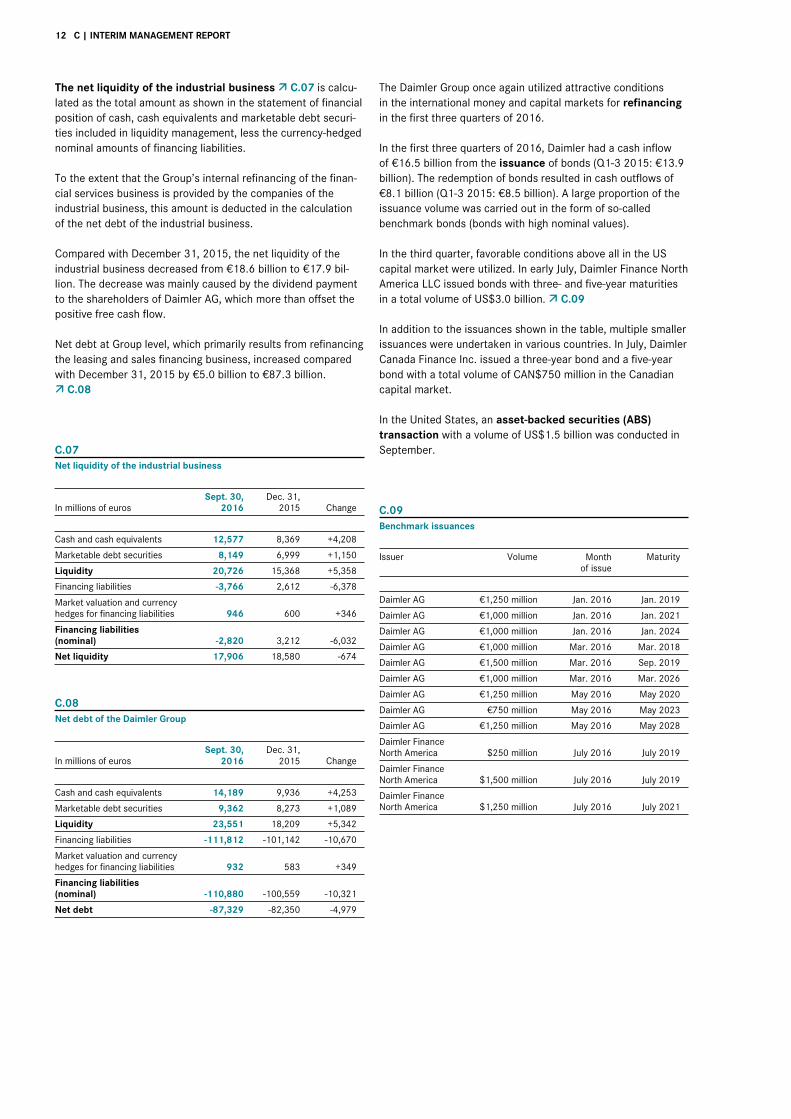
The net liquidity of the industrial business C.07 is calcu-lated as the total amount as shown in the statement of financial position of cash, cash equivalents and marketable debt securi-ties included in liquidity management, less the currency-hedged nominal amounts of financing liabilities.
To the extent that the Group’s internal refinancing of the finan-cial services business is provided by the companies of the industrial business, this amount is deducted in the calculation of the net debt of the industrial business.
Compared with December 31, 2015, the net liquidity of the industrial business decreased from €18.6 billion to €17.9 bil-lion. The decrease was mainly caused by the dividend payment to the shareholders of Daimler AG, which more than offset the positive free cash flow.
Net debt at Group level, which primarily results from refinancing the leasing and sales financing business, increased compared with December 31, 2015 by €5.0 billion to €87.3 billion.
C.08
C.07 Net liquidity of the industrial business
In millions of euros Sept. 30,
2016 Dec. 31,
2015 Change
Cash and cash equivalents 12,577 8,369 +4,208
Marketable debt securities 8,149 6,999 +1,150
Liquidity 20,726 15,368 +5,358
Financing liabilities -3,766 2,612 -6,378
Market valuation and currency hedges for financing liabilities 946 600 +346
Financing liabilities (nominal) -2,820 3,212 -6,032
Net liquidity 17,906 18,580 -674
C.08 Net debt of the Daimler Group
In millions of euros Sept. 30,
2016 Dec. 31,
2015 Change
Cash and cash equivalents 14,189 9,936 +4,253
Marketable debt securities 9,362 8,273 +1,089
Liquidity 23,551 18,209 +5,342
Financing liabilities -111,812 -101,142 -10,670
Market valuation and currency hedges for financing liabilities 932 583 +349
Financing liabilities (nominal) -110,880 -100,559 -10,321
Net debt -87,329 -82,350 -4,979
The Daimler Group once again utilized attractive conditions in the international money and capital markets for refinancing in the first three quarters of 2016.
In the first three quarters of 2016, Daimler had a cash inflow of €16.5 billion from the issuance of bonds (Q1-3 2015: €13.9 billion). The redemption of bonds resulted in cash outflows of €8.1 billion (Q1-3 2015: €8.5 billion). A large proportion of the issuance volume was carried out in the form of so-called benchmark bonds (bonds with high nominal values).
In the third quarter, favorable conditions above all in the US capital market were utilized. In early July, Daimler Finance North America LLC issued bonds with three- and five-year maturities in a total volume of US$3.0 billion. C.09
In addition to the issuances shown in the table, multiple smaller issuances were undertaken in various countries. In July, Daimler Canada Finance Inc. issued a three-year bond and a five-year bond with a total volume of CAN$750 million in the Canadian capital market.
In the United States, an asset-backed securities (ABS) transaction with a volume of US$1.5 billion was conducted in September.
C.09 Benchmark issuances
Issuer
Volume Month of issue
Maturity
Daimler AG €1,250 million Jan. 2016 Jan. 2019
Daimler AG €1,000 million Jan. 2016 Jan. 2021
Daimler AG €1,000 million Jan. 2016 Jan. 2024
Daimler AG €1,000 million Mar. 2016 Mar. 2018
Daimler AG €1,500 million Mar. 2016 Sep. 2019
Daimler AG €1,000 million Mar. 2016 Mar. 2026
Daimler AG €1,250 million May 2016 May 2020
Daimler AG €750 million May 2016 May 2023
Daimler AG €1,250 million May 2016 May 2028
Daimler Finance North America $250 million July 2016 July 2019
Daimler Finance North America $1,500 million July 2016 July 2019
Daimler Finance North America $1,250 million July 2016 July 2021
C | INTERIM MANAGEMENT REPORT 13
Financial position
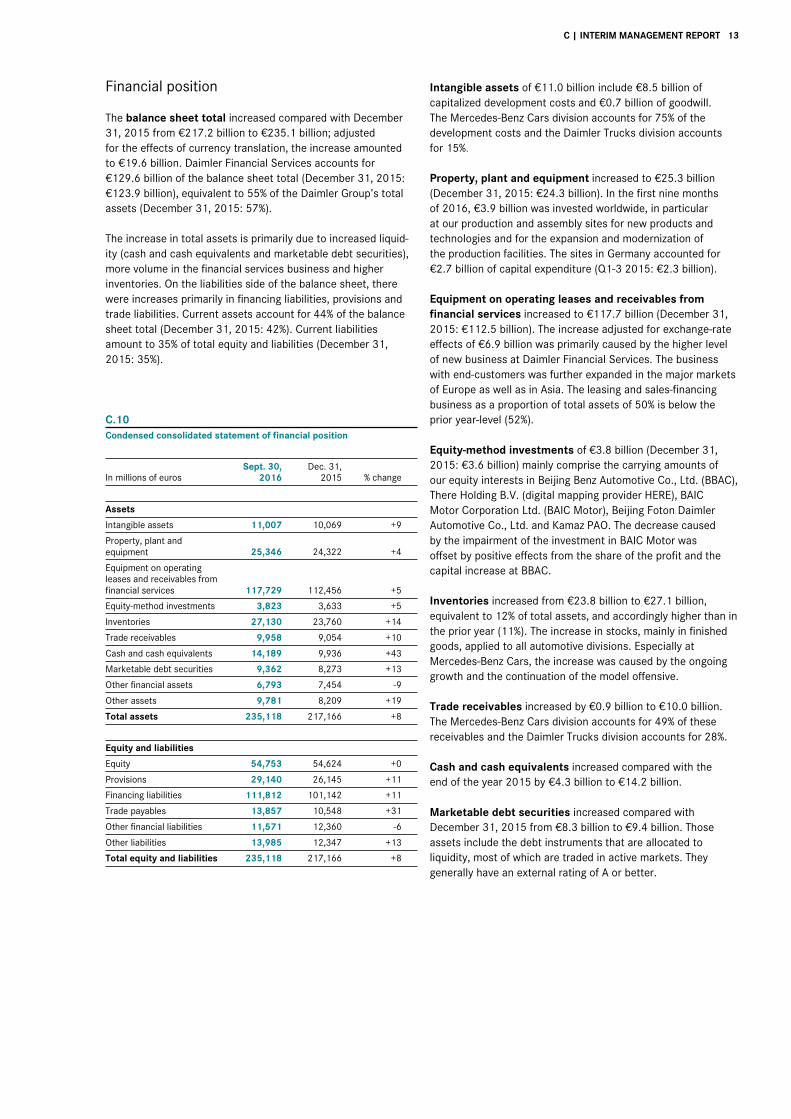
The balance sheet total increased compared with December 31, 2015 from €217.2 billion to €235.1 billion; adjusted for the effects of currency translation, the increase amounted to €19.6 billion. Daimler Financial Services accounts for €129.6 billion of the balance sheet total (December 31, 2015: €123.9 billion), equivalent to 55% of the Daimler Group’s total assets (December 31, 2015: 57%).
The increase in total assets is primarily due to increased liquid-ity (cash and cash equivalents and marketable debt securities), more volume in the financial services business and higher inventories. On the liabilities side of the balance sheet, there were increases primarily in financing liabilities, provisions and trade liabilities. Current assets account for 44% of the balance sheet total (December 31, 2015: 42%). Current liabilities amount to 35% of total equity and liabilities (December 31, 2015: 35%).
C.10 Condensed consolidated statement of financial position
In millions of euros Sept. 30,
2016 Dec. 31,
2015 % change
Assets
Intangible assets 11,007 10,069 +9
Property, plant and equipment 25,346 24,322 +4
Equipment on operating leases and receivables from financial services 117,729 112,456 +5
Equity-method investments 3,823 3,633 +5
Inventories 27,130 23,760 +14
Trade receivables 9,958 9,054 +10
Cash and cash equivalents 14,189 9,936 +43
Marketable debt securities 9,362 8,273 +13
Other financial assets 6,793 7,454 -9
Other assets 9,781 8,209 +19
Total assets 235,118 217,166 +8
Equity and liabilities
Equity 54,753 54,624 +0
Provisions 29,140 26,145 +11
Financing liabilities 111,812 101,142 +11
Trade payables 13,857 10,548 +31
Other financial liabilities 11,571 12,360 -6
Other liabilities 13,985 12,347 +13
Total equity and liabilities 235,118 217,166 +8
Intangible assets of €11.0 billion include €8.5 billion of capitalized development costs and €0.7 billion of goodwill. The Mercedes-Benz Cars division accounts for 75% of the development costs and the Daimler Trucks division accounts for 15%.
Property, plant and equipment increased to €25.3 billion (December 31, 2015: €24.3 billion). In the first nine months of 2016, €3.9 billion was invested worldwide, in particular at our production and assembly sites for new products and technologies and for the expansion and modernization of the production facilities. The sites in Germany accounted for €2.7 billion of capital expenditure (Q1-3 2015: €2.3 billion).
Equipment on operating leases and receivables from financial services increased to €117.7 billion (December 31, 2015: €112.5 billion). The increase adjusted for exchange-rate effects of €6.9 billion was primarily caused by the higher level of new business at Daimler Financial Services. The business with end-customers was further expanded in the major markets of Europe as well as in Asia. The leasing and sales-financing business as a proportion of total assets of 50% is below the prior year-level (52%).
Equity-method investments of €3.8 billion (December 31, 2015: €3.6 billion) mainly comprise the carrying amounts of our equity interests in Beijing Benz Automotive Co., Ltd. (BBAC), There Holding B.V. (digital mapping provider HERE), BAIC Motor Corporation Ltd. (BAIC Motor), Beijing Foton Daimler Automotive Co., Ltd. and Kamaz PAO. The decrease caused by the impairment of the investment in BAIC Motor was offset by positive effects from the share of the profit and the capital increase at BBAC.
Inventories increased from €23.8 billion to €27.1 billion, equivalent to 12% of total assets, and accordingly higher than in the prior year (11%). The increase in stocks, mainly in finished goods, applied to all automotive divisions. Especially at Mercedes-Benz Cars, the increase was caused by the ongoing growth and the continuation of the model offensive.
Trade receivables increased by €0.9 billion to €10.0 billion. The Mercedes-Benz Cars division accounts for 49% of these receivables and the Daimler Trucks division accounts for 28%.
Cash and cash equivalents increased compared with the end of the year 2015 by €4.3 billion to €14.2 billion.
Marketable debt securities increased compared with December 31, 2015 from €8.3 billion to €9.4 billion. Those assets include the debt instruments that are allocated to liquidity, most of which are traded in active markets. They generally have an external rating of A or better.
14 C | INTERIM MANAGEMENT REPORT
Other financial assets decreased by €0.7 billion to €6.8 billion. They primarily consist of derivative financial instruments, equity instruments in unconsolidated subsidiaries and other invest-ments, as well as loans and other receivables due from third parties. The change is related to effects from the contribution of the shares in Renault S.A. (Renault) and Nissan Motor Company Ltd. (Nissan) to the pension-plan assets. There was an opposing effect from higher carrying values of derivative financial instruments.
Other assets of €9.8 billion (December 31, 2015: €8.2 billion) primarily comprise deferred tax assets and tax refund claims. The increase in deferred tax assets primarily relates to effects from pensions and similar obligations not recognized in profit and loss.
The Group’s equity increased compared with December 31, 2015 from €54.6 billion to €54.8 billion. The increase was mainly due to net profit of €6.6 billion and the remeasurement of derivative financial instruments not recognized in profit and loss (€1.7 billion). Equity was reduced, however, by the payment of the dividend to the shareholders of Daimler AG of €3.5 billion and by actuarial losses of €3.4 billion from the defined-benefit pension plans that are recognized in retained earnings. In addition, the remeasurement (€0.5 billion) and contribution to the pension-plan assets (€0.6 billion) of the shares in Renault and Nissan led to a decrease in the reserve of financial assets available for sale. Equity attributable to the shareholders of Daimler AG increased slightly to €53.7 billion (December 31, 2015: €53.6 billion).
In relation to the slight increase in equity, the balance-sheet total increased at the disproportionately high rate of 8%. The Group’s equity ratio of 23.3% was therefore below the level at the end of 2015 (23.6%); the equity ratio for the industrial business was 42.4% (December 31, 2015: 44.2%).
Provisions increased from €26.1 billion at December 31, 2015 to €29.1 billion; as a proportion of the balance-sheet total, they amount to 12%, as at the end of 2015. They primarily comprise provisions for pensions and similar obligations of €12.2 billion (December 31, 2015: €8.7 bilion), which mainly consist of the difference between the present value of defined-benefit pension obligations of €33.6 billion (December 31, 2015: €27.6 billion) and the fair value of the pension-plan assets applied to finance those obligations of €22.7 billion (December 31, 2015: €20.2 billion). The decrease in discount rates, especially for the German plans from 2.6% at December 31, 2015 to 1.25% at September 30, 2016, led to an increase in the present value of the defined-benefit pension obligations. The contribution to the pension-plan assets of the shares in Renault and Nissan (€1.8 billion) led to an increase in the fair value of the pension-plan assets. Provisions also relate to liabilities from income taxes of €1.4 billion (December 31, 2015: €1.7 billion), from product warranties of €6.1 billion (December 31, 2015: €5.7 billion) and from personnel and social costs of €4.1 billion (December 31, 2015: €4.4 billion), as well as other provisions of €5.3 billion (December 31, 2015: €5.8 billion).
Financing liabilities of €111.8 billion were above the level of December 31, 2015 (€101.1 billion). The increase of €11.5 billion after adjusting for exchange-rate effects primarily reflects the refinancing of the growing leasing and sales-financing business. 53% of the financing liabilities are accounted for by notes and bonds, 26% by liabilities to financial institutions, 10% by deposits in the direct banking business and 8% by liabilities from ABS transactions.
Trade payables increased to €13.9 billion (December 31, 2015: €10.5 billion), primarily due to the higher volume of business. The Mercedes-Benz Cars division accounts for 65% of those payables and the Daimler Trucks division accounts for 20%.
Other financial liabilities of €11.6 billion (December 31, 2015: €12.4 billion) mainly consist of liabilities from derivative financial instruments, residual value guarantees, accrued interest on financing liabilities, deposits received and liabilities from salaries and wages. The decrease mainly results from the derivative financial instruments.
Other liabilities of €14.0 billion (December 31, 2015: €12.3 billion) primarily comprise deferred income, tax liabilities, and deferred taxes. The increase was mainly the result of higher deferred taxes and deferred revenue from multi-year service and maintenance contracts.
Further information on the assets presented in the statement of financial position and on the Group’s equity and liabilities is provided in the Consolidated Statement of Financial Position, the Consolidated Statement of Changes in Equity and the related notes in the Notes to the Interim Consolidated Financial Statements.
C | INTERIM MANAGEMENT REPORT 15
Capital expenditure and research activities
The Daimler Group invested €1.4 billion in property, plant and equipment in the third quarter of this year (Q3 2015: €1.1 billion). Most of that investment, €1.1 billion, was at the Mercedes-Benz Cars division (Q3 2015: €0.8 billion). The main focus of capital expenditure was on production preparations for new models, in particular the derivatives of the C-Class and the E-Class, as well as investments for new transmissions and engine versions. Another area of capital expenditure was for the ongoing expan-sion of our international production and component plants. At Daimler Trucks, the main investments were for engines, transmissions and new vehicles, as well as the optimization of our worldwide production network.
The Daimler Group’s research and development spending in the third quarter of the year amounted to €1.9 billion (Q3 2015: €1.6 billion), of which €0.6 billion was capitalized (Q3 2015: €0.5 billion). More than two thirds of the research and devel-opment spending (€1.4 billion) was at the Mercedes-Benz Cars segment (Q3 2015: €1.2 billion). A substantial proportion of that amount represents our advance expenditure for the mobili-ty of the future. The other main areas there, as at Daimler Trucks, were new vehicle models, particularly fuel-efficient and environmentally friendly drive systems, and the intensification of the modular strategy.
Workforce
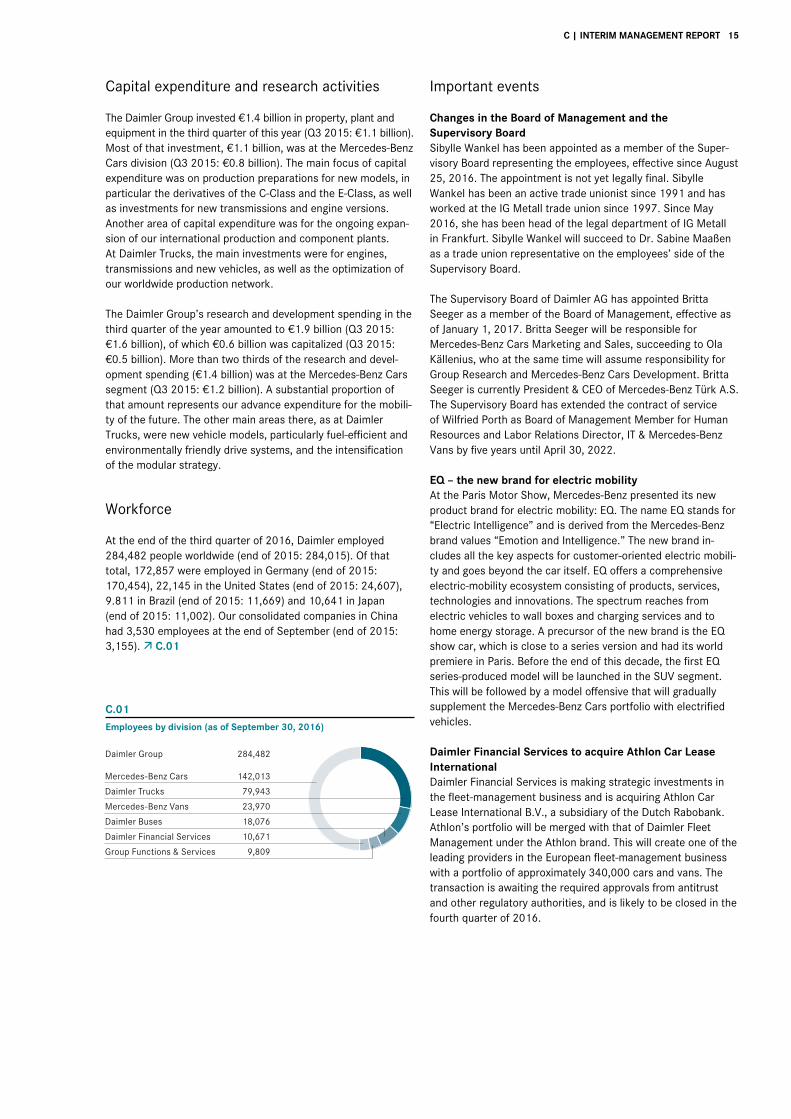
At the end of the third quarter of 2016, Daimler employed 284,482 people worldwide (end of 2015: 284,015). Of that total, 172,857 were employed in Germany (end of 2015: 170,454), 22,145 in the United States (end of 2015: 24,607), 9.811 in Brazil (end of 2015: 11,669) and 10,641 in Japan (end of 2015: 11,002). Our consolidated companies in China had 3,530 employees at the end of September (end of 2015: 3,155). C.01
C.01 Employees by division (as of September 30, 2016)
Important events
Changes in the Board of Management and the Supervisory Board Sibylle Wankel has been appointed as a member of the Super-visory Board representing the employees, effective since August 25, 2016. The appointment is not yet legally final. Sibylle Wankel has been an active trade unionist since 1991 and has worked at the IG Metall trade union since 1997. Since May 2016, she has been head of the legal department of IG Metall in Frankfurt. Sibylle Wankel will succeed to Dr. Sabine Maaßen as a trade union representative on the employees’ side of the Supervisory Board.
The Supervisory Board of Daimler AG has appointed Britta Seeger as a member of the Board of Management, effective as of January 1, 2017. Britta Seeger will be responsible for Mercedes-Benz Cars Marketing and Sales, succeeding to Ola Källenius, who at the same time will assume responsibility for Group Research and Mercedes-Benz Cars Development. Britta Seeger is currently President & CEO of Mercedes-Benz Türk A.S. The Supervisory Board has extended the contract of service of Wilfried Porth as Board of Management Member for Human Resources and Labor Relations Director, IT & Mercedes-Benz Vans by five years until April 30, 2022.
EQ – the new brand for electric mobility At the Paris Motor Show, Mercedes-Benz presented its new product brand for electric mobility: EQ. The name EQ stands for “Electric Intelligence” and is derived from the Mercedes-Benz brand values “Emotion and Intelligence.” The new brand in-cludes all the key aspects for customer-oriented electric mobili-ty and goes beyond the car itself. EQ offers a comprehensive electric-mobility ecosystem consisting of products, services, technologies and innovations. The spectrum reaches from electric vehicles to wall boxes and charging services and to home energy storage. A precursor of the new brand is the EQ show car, which is close to a series version and had its world premiere in Paris. Before the end of this decade, the first EQ series-produced model will be launched in the SUV segment. This will be followed by a model offensive that will gradually supplement the Mercedes-Benz Cars portfolio with electrified vehicles. Daimler Financial Services to acquire Athlon Car Lease International Daimler Financial Services is making strategic investments in the fleet-management business and is acquiring Athlon Car Lease International B.V., a subsidiary of the Dutch Rabobank. Athlon’s portfolio will be merged with that of Daimler Fleet Management under the Athlon brand. This will create one of the leading providers in the European fleet-management business with a portfolio of approximately 340,000 cars and vans. The transaction is awaiting the required approvals from antitrust and other regulatory authorities, and is likely to be closed in the fourth quarter of 2016.
Mercedes-Benz Cars 142,013
Daimler Trucks 79,943
Mercedes-Benz Vans 23,970
Daimler Buses 18,076
Daimler Financial Services 10,671
Group Functions & Services 9,809
Daimler Group 284,482
16 C | INTERIM MANAGEMENT REPORT
EU antitrust proceedings In a settlement decision adopted on July 19, 2016, the Europe-an Commission concluded the antitrust proceedings against Daimler and other truck manufacturers that commenced in 2011. The European Commission imposed a fine on Daimler in the amount of €1,009 million. Daimler cooperated closely with the authorities throughout the proceedings and the European Commission took this into account in reducing the fine im-posed. Daimler had recognized a provision for the proceedings and paid the fine in September.
Risk and opportunity report
The risks and opportunities that can have a significant influence on the profitability, cash flows and financial position of the Daimler Group, as well as detailed information on our risk and opportunity management system, are presented on pages 138 to 151 of our Annual Report 2015. In addition, we refer to the notes on forward-looking statements provided at the end of this Interim Report.
Our assessment of risks and opportunities has changed since publication of Annual Report 2015 with regard to the following points.
At the beginning of the fourth quarter of 2016, economic risks for the world economy are still considerable. The British vote to leave the European Union first of all involves considerable risks for the economic prospects of the United Kingdom, but could also have an impact on continental Europe. If other countries follow the example of the UK and plan to carry out referendums, the ensuing investor and consumer uncertainty could addition-ally affect the economic outlook for the EU. Although energy prices have recovered again recently, the danger of deflation has not yet been overcome, especially in the euro zone. Within the European Monetary Union, developments in Greece, Italy and Spain remain problematic, both politically and economical-ly. In Italy in particular, business uncertainty could increase significantly depending on the result of the referendum on constitutional reform planned for early December. From a global perspective, political events continue to be the cause of risks in many cases. With a view to the terror attacks both within and outside Europe, it is very hard to assess whether and to what extent they could lead to a crisis of confidence among the key economies. After the attempted coup d’état, this also applies to further developments in Turkey. The possibility of political esca-lation between Russia and the Western countries continues to be a source of risks. The ongoing tension in the Middle East also represents a considerable threat potential. It is still the case that those economies that depend on the inflow of capital due to external trade deficits are especially susceptible to major currency volatilities and growth slowdowns. In the United States, possible uncertainty in connection with the presidential election could lead to unforeseen impacts, particularly on in-vestment. In connection with the increasingly expansive mone-tary policy of the European Central Bank, there is also continu-ing concern about the extent to which this will increase the danger of speculative bubbles in the stock and bond markets.
Greater turbulence in the financial markets would then have a direct impact on the economic outlook. Opportunities exist on the one hand in a rapid economic recovery of the emerging markets, and on the other hand in a stronger revival of the economies of the United States and the euro zone. A sustained reduction in tension in the Middle East would also have a posi-tive impact on the world economy.
The automotive industry is subject to extensive governmental regulations worldwide. Laws in various jurisdictions regulate occupant safety and the environmental impact of vehicles, including emission levels, fuel economy and noise, as well as the pollutants generated by the plants where vehicles are pro-duced. Noncompliance with regulations applicable in the differ-ent regions could result in significant penalties and reputational harm or the inability to sell vehicles in the relevant markets. The cost of compliance with these regulations is significant, and in this context Daimler expects a significant increase in such costs.
Currently, Daimler is subject to regulatory information requests, inquiries and litigation relating to environmental and other laws and regulations in connection with diesel exhaust emissions. Several authorities, including in Europe and the United States, have inquired about test results and the emission control systems used in Mercedes-Benz diesel vehicles and related legal implications, including but not limited to under applicable securities laws. These authorities include, among others, the U.S. Department of Justice (“DOJ”), which has requested that Daimler conduct an internal investigation, the U.S. Environmental Protection Agency (“EPA”) and the California Air Resources Board (“CARB”). These information requests, inquiries and our internal investigation are still ongoing and open; hence, Daimler cannot predict the outcome at this time. If these or other inquiries result in unfavorable findings, Daimler could be subject to significant monetary penalties, remediation requirements, vehicle recalls, process improvements and mitigation measures, and/or other sanctions, measures and actions, including sub-sequent civil and criminal enforcement actions against Daimler and/or its employees, and delays in obtaining regulatory ap-provals necessary to introduce new diesel models, which could cause significant collateral damage including reputational harm. In addition, Daimler’s ability to defend itself in litigations could be impaired by unfavourable results in any of the regulatory inquiries discussed above. Insofar, it cannot be ruled out that the risks discussed above may materially adversely impact our profitability, cash flows and financial situation.
With regard to the legal proceedings, we refer to Note 18 of the Notes to the Interim Consolidated Financial Statements.
Information on production and technology risks is provided in Interim Report Q2 2016.
C | INTERIM MANAGEMENT REPORT 17
Outlook
At the beginning of the fourth quarter, the fundamental situa-tion of the world economy has not changed; there are no perceptible indications of either acceleration or deceleration of growth. Although moderate expansion can therefore be ex-pected for the fourth quarter, full-year 2016 will probably have the lowest growth rate since the financial crisis, with expansion of global gross domestic product (GDP) of just under 2.5%. The US economy will also remain significantly below its growth potential. Meanwhile, most analysts assume that despite a rather better second half of the year, GDP growth will amount to only about 1.5% in 2016. With relatively stable consumption, it is above all weak investment demand and increasing destocking that are preventing stronger growth. A positive factor, however, is the ongoing resilience of the economy of the European Mone-tary Union (EMU). For the year 2016, GDP growth in the EMU in the region of 1.5% can still be anticipated. But the development of the British economy might well be weaker. It is quite possible that the referendum’s outcome has unsettled investors and consumers so much that the overall economy will merely stag-nate until the end of the year. But the ongoing stabilization of economic prospects in China is significantly more important for the global economy. Most analysts now assume that China will achieve GDP growth of just over 6.5% this year. On the other hand, economic developments in South America remain very difficult, even though the recession in Brazil meanwhile seems to have bottomed out. And although the distinct recovery in oil prices compared with the beginning of the year has improved the growth prospects of the Russian economy, slight contrac-tion is still expected for the full year.
According to recent assessments, worldwide demand for cars is likely to increase from its already high level by about 2% in 2016. Once again, the biggest contribution to this global growth should come from the Chinese market, which is likely to contin-ue expanding at a significant rate. But the expected increase in demand will to a great extent be due to state stimulus. Since last fall, tax on cars with engines of up to 1.6 liters displace-ment has been halved. As this measure is expected to remain in effect until the end of 2016, we continue to anticipate a positive impact on the overall Chinese car market in the fourth quarter. We do not expect any more growth for the US market for cars and light trucks, and sales volumes there will be slightly below the high level of the previous year. We anticipate significant growth for the Western European car market. With a view to the individual markets, this growth is continuing on a relatively broad base. Despite the vote in favor of Brexit, current assess-ments are that the British market will remain at its unusually high level. In Japan, a slight decrease in demand is to be expected following the significant market correction of 2015. Prospects for the major emerging markets remain mixed. In India, market growth is likely to remain solid. In Russia, however, the ongoing difficult economic situation is likely to result in another double-digit drop in car sales.
Demand for medium- and heavy-duty trucks in the regions important for Daimler should be perceptibly below the prior-year volume. A major negative factor is the expected significant market contraction in North America. In a comparatively weak overall investment environment, from today’s perspective, demand in the market for Class 6-8 trucks can be expected to decrease by approximately 15%. But the European market has so far proven to be relatively resilient and should continue its recovery with growth of 5-10% in the full year. There is still no turnaround in sight for the Brazilian market; due to the ongoing economic recession, we have to anticipate further market contraction there in the magnitude of 25%. The situation of the Russian market has meanwhile stabilized somewhat, so the market should not contract any further than its very low prior-year level. Demand in China will recover significantly after last year’s sharp market contraction. The Japanese market for light-, medium- and heavy-duty trucks continues its solid development and should be close to its level of 2015. The Indonesian truck market is likely to contract once again, however; from today’s perspective, we anticipate contraction of approximately 15%. In India, only slight growth is meanwhile expected in the segment of medium- and heavy-duty trucks.
We expect significant growth in the market for mid-size, large and small vans in Western Europe in 2016. In the United States, we also anticipate significant growth in demand for large vans. In Latin America, however, we expect further significant contraction in the market for large vans. In China, we now anticipate significantly lower demand in the market we address there.
We now expect a significantly larger market volume for buses in Western Europe in 2016 than in 2015. In Brazil, we anticipate further significant market contraction in full-year 2016.
On the basis of the assumptions presented above on the devel-opment of the markets important for us and of the division’s current assessments, Daimler expects to slightly increase its total unit sales in the year 2016.
Following the strongest first three quarters of a year for Mercedes-Benz Cars, we intend to continue our growth in the fourth quarter and thus to significantly increase our unit sales in full-year 2016. This will be primarily driven by the new E-Class sedan, which has made a successful start, as well as by the new wagon version of the E-Class, deliveries of which will start in Europe in October. Sales will be boosted also by the market launch of the GLC Coupe in the United States – a model without a direct predecessor in the product portfolio. The Mercedes-AMG GT R and its convertible version, the Mercedes-AMG GT Roadster, will be available to customers as of the end of the year. This year’s model offensive will be concluded in December with the market launch of the new smart fortwo coupe electric drive in the USA.
18 C | INTERIM MANAGEMENT REPORT
Due to negative developments in many truck markets, Daimler Trucks assumes that unit sales in full-year 2016 will be signifi-cantly lower than in the previous year. Weaker development of demand for heavy-duty trucks in the NAFTA region will have a significant impact on our sales. We anticipate a significantly weaker sales development also in Brazil, in a sharply declining market environment. We should achieve increased sales of trucks in the EU30 region (European Union, Switzerland and Norway). In Turkey, we anticipate a significant decrease in unit sales in the full year. This is due to purchases being brought forward to 2015 because of the new emission standard taking effect in 2016, as well as the current economic environment. The low level of oil prices is negatively impacting demand in the Middle East, so we expect a substantial reduction in unit sales in that region. We assume that unit sales in the full year will be significantly lower also in Indonesia for market-related reasons. Our truck sales in Japan should be at the level of the previous year. In India, we expect unit sales to be slightly higher than in 2015. And we will generate additional unit sales with the expanded range of FUSO trucks produced in India, especially in Asia and Africa.
Mercedes-Benz Vans plans to achieve significant growth in unit sales in 2016. We anticipate further significant increases in sales of vans especially in Western Europe, our core market. We expect significant growth in unit sales also in the NAFTA region. In the context of our strategy for the division, “Mercedes-Benz Vans goes global,” following the successful market launch of the V-Class in China in spring 2016, we also launched the new Vito there in September. This will allow us to further expand our presence in the market we address in that country.
Daimler Buses assumes that it will be able to defend its mar-ket leadership in its core markets for buses above 8 tons with innovative, high-quality and modern products. However, we anticipate total unit sales in 2016 at slightly below the prior-year level. We assume that unit sales in Western Europe will continue to grow at a significant rate. Following the substantial decrease in Brazil in 2015, we expect another significant fall in unit sales in 2016. In Mexico, unit sales are now expected to be slightly below the prior-year level.
Daimler Financial Services anticipates slight growth in new business and further growth in contract volume in the year 2016, driven by the growth offensives of the automotive divi-sions. In addition, we are utilizing new market potential espe-cially in Asia, and are applying new and digital possibilities for customer contacts – in particular by systematically further developing our online sales channels. We continue to see good growth opportunities also in the field of innovative mobility services.
We anticipate Daimler Group’s revenue in 2016 in the magnitude of the previous year. Revenue growth is expected in Western Europe and Asia, while revenue in the NAFTA region is likely to be below the prior-year level.
On the basis of the market development we anticipate and the assessments of our divisions, we assume that EBIT adjusted for special items will increase slightly in 2016.
The individual divisions have the following expectations for EBIT adjusted for special items in the year 2016: – Mercedes-Benz Cars: slightly above the prior-year level, – Daimler Trucks: significantly below the prior-year level, – Mercedes-Benz Vans: significantly above the prior-year level, – Daimler Buses: slightly above the prior-year level, and – Daimler Financial Services: slightly above the prior-year level.
The anticipated development of earnings in the automotive divisions will have a positive impact on the free cash flow of the industrial business also in 2016. The free cash flow in the year 2015 was significantly affected by extraordinary contribu-tions to the German and American pension-plan assets of €1.2 billion, as well as by the acquisition of a stake in the digital mapping business, HERE, for an amount of €0.7 billion. As we will continue and intensify our investment offensive in products and technologies, the free cash flow of the industrial business adjusted for special items should be significantly lower in 2016 than the comparable amount of €5.9 billion in 2015. We assume, however, that it will be significantly higher than the dividend distribution in the year 2016.
In order to achieve our ambitious growth targets, we will once again significantly increase our already very high investment in property, plant and equipment in the year 2016 (2015: €5.1 billion). In addition to capital expenditure, we are developing our position in the emerging markets by means of targeted financial investments in joint ventures and equity interests.
With our research and development activities, we anticipate a total volume significantly above the previous year’s spending of €6.6 billion. Key projects at Mercedes-Benz Cars include successor models for the current compact class, the GLS and GLE SUVs, and the S-Class. In addition, we are investing in the automotive divisions in new, low-emission and fuel-efficient engines, alternative drive systems, autonomous driving and the connected and digital user interface. Further key projects at Daimler Trucks include the development of tailored products and technologies for the Brazilian market and for the FUSO product portfolio.
From today’s perspective, we assume that the size of the worldwide workforce will be at the level of year-end 2015.
D | THE DIVISIONS 19
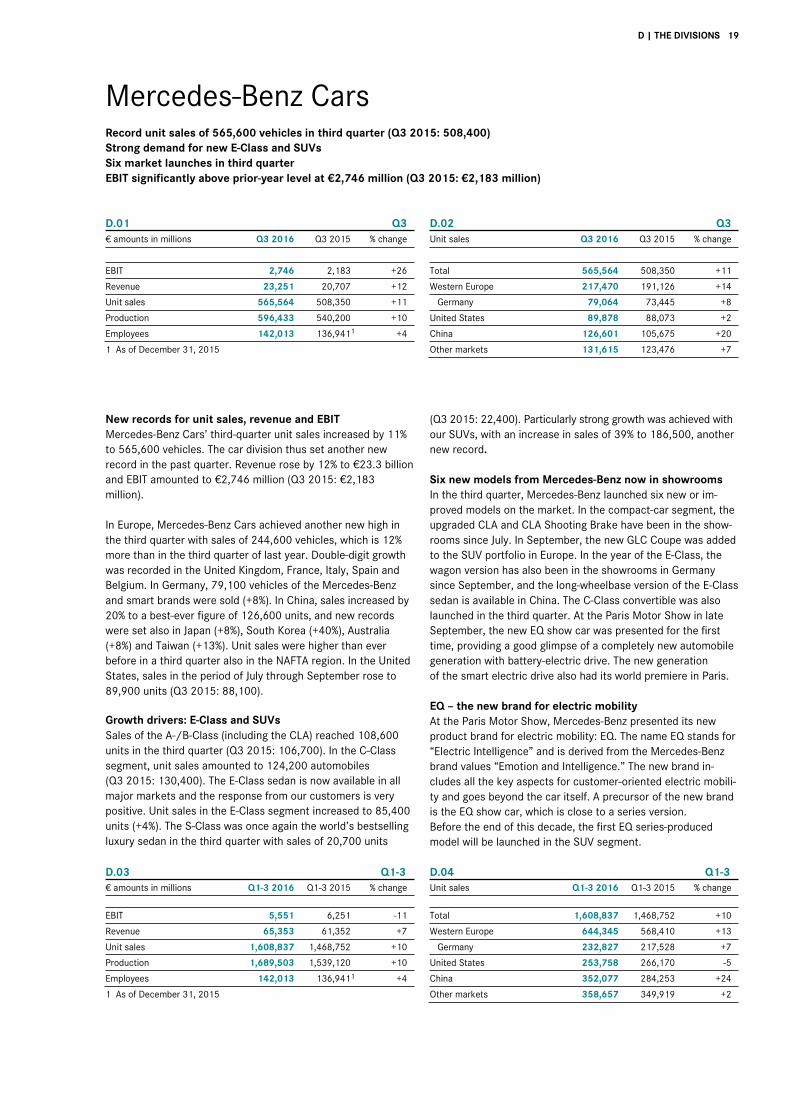
Mercedes-Benz Cars Record unit sales of 565,600 vehicles in third quarter (Q3 2015: 508,400) Strong demand for new E-Class and SUVs Six market launches in third quarter EBIT significantly above prior-year level at €2,746 million (Q3 2015: €2,183 million)
D.01 Q3 € amounts in millions Q3 2016 Q3 2015 % change
EBIT 2,746 2,183 +26
Revenue 23,251 20,707 +12
Unit sales 565,564 508,350 +11
Production 596,433 540,200 +10
Employees 142,013 136,9411 +4
1 As of December 31, 2015
D.02 Q3 Unit sales Q3 2016 Q3 2015 % change
Total 565,564 508,350 +11
Western Europe 217,470 191,126 +14
Germany 79,064 73,445 +8
United States 89,878 88,073 +2
China 126,601 105,675 +20
Other markets 131,615 123,476 +7
New records for unit sales, revenue and EBIT Mercedes-Benz Cars’ third-quarter unit sales increased by 11% to 565,600 vehicles. The car division thus set another new record in the past quarter. Revenue rose by 12% to €23.3 billion and EBIT amounted to €2,746 million (Q3 2015: €2,183 million).
In Europe, Mercedes-Benz Cars achieved another new high in the third quarter with sales of 244,600 vehicles, which is 12% more than in the third quarter of last year. Double-digit growth was recorded in the United Kingdom, France, Italy, Spain and Belgium. In Germany, 79,100 vehicles of the Mercedes-Benz and smart brands were sold (+8%). In China, sales increased by 20% to a best-ever figure of 126,600 units, and new records were set also in Japan (+8%), South Korea (+40%), Australia (+8%) and Taiwan (+13%). Unit sales were higher than ever before in a third quarter also in the NAFTA region. In the United States, sales in the period of July through September rose to 89,900 units (Q3 2015: 88,100).
Growth drivers: E-Class and SUVs Sales of the A-/B-Class (including the CLA) reached 108,600 units in the third quarter (Q3 2015: 106,700). In the C-Class segment, unit sales amounted to 124,200 automobiles (Q3 2015: 130,400). The E-Class sedan is now available in all major markets and the response from our customers is very positive. Unit sales in the E-Class segment increased to 85,400 units (+4%). The S-Class was once again the world’s bestselling luxury sedan in the third quarter with sales of 20,700 units
(Q3 2015: 22,400). Particularly strong growth was achieved with our SUVs, with an increase in sales of 39% to 186,500, another new record. Six new models from Mercedes-Benz now in showrooms In the third quarter, Mercedes-Benz launched six new or im-proved models on the market. In the compact-car segment, the upgraded CLA and CLA Shooting Brake have been in the show-rooms since July. In September, the new GLC Coupe was added to the SUV portfolio in Europe. In the year of the E-Class, the wagon version has also been in the showrooms in Germany since September, and the long-wheelbase version of the E-Class sedan is available in China. The C-Class convertible was also launched in the third quarter. At the Paris Motor Show in late September, the new EQ show car was presented for the first time, providing a good glimpse of a completely new automobile generation with battery-electric drive. The new generation of the smart electric drive also had its world premiere in Paris.
EQ – the new brand for electric mobility At the Paris Motor Show, Mercedes-Benz presented its new product brand for electric mobility: EQ. The name EQ stands for “Electric Intelligence” and is derived from the Mercedes-Benz brand values “Emotion and Intelligence.” The new brand in-cludes all the key aspects for customer-oriented electric mobili-ty and goes beyond the car itself. A precursor of the new brand is the EQ show car, which is close to a series version. Before the end of this decade, the first EQ series-produced model will be launched in the SUV segment.
D.03 Q1-3 € amounts in millions Q1-3 2016 Q1-3 2015 % change EBIT 5,551 6,251 -11
Revenue 65,353 61,352 +7
Unit sales 1,608,837 1,468,752 +10
Production 1,689,503 1,539,120 +10
Employees 142,013 136,9411 +4
1 As of December 31, 2015
D.04 Q1-3 Unit sales Q1-3 2016 Q1-3 2015 % change
Total 1,608,837 1,468,752 +10
Western Europe 644,345 568,410 +13
Germany 232,827 217,528 +7
United States 253,758 266,170 -5
China 352,077 284,253 +24
Other markets 358,657 349,919 +2
20 D | THE DIVISIONS
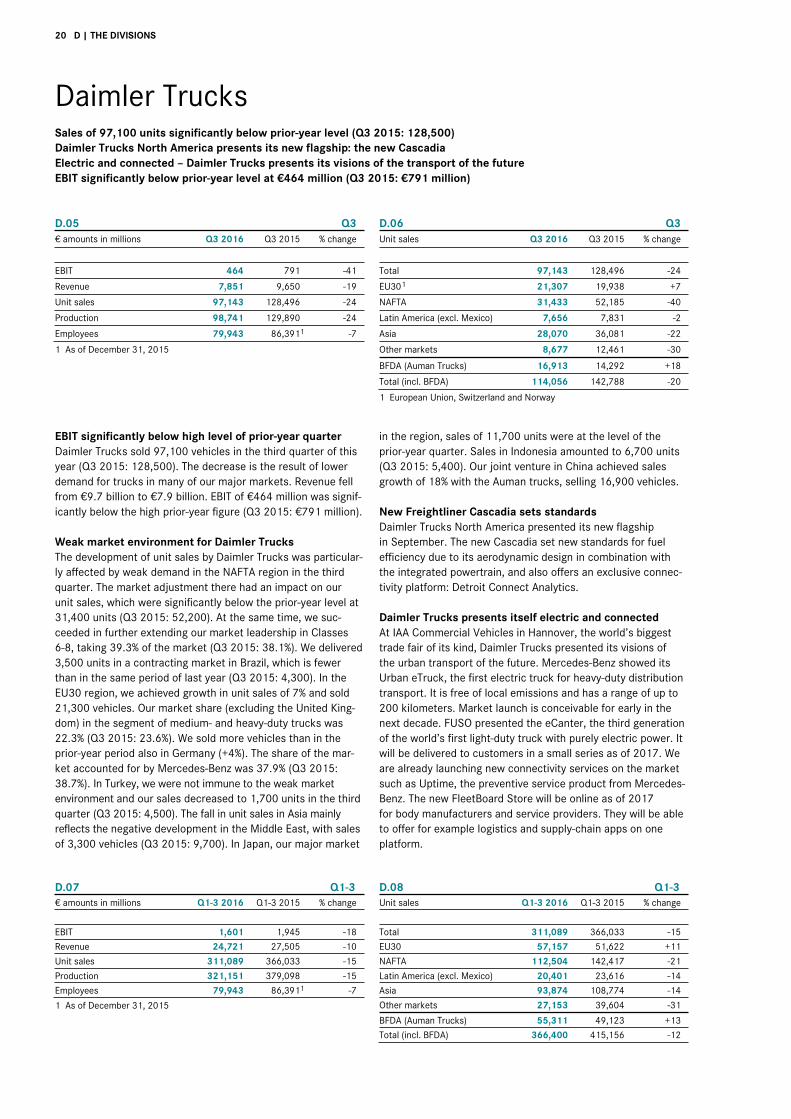
Daimler Trucks Sales of 97,100 units significantly below prior-year level (Q3 2015: 128,500) Daimler Trucks North America presents its new flagship: the new Cascadia Electric and connected – Daimler Trucks presents its visions of the transport of the future EBIT significantly below prior-year level at €464 million (Q3 2015: €791 million)
D.05 Q3 € amounts in millions Q3 2016 Q3 2015 % change
EBIT 464 791 -41
Revenue 7,851 9,650 -19
Unit sales 97,143 128,496 -24
Production 98,741 129,890 -24
Employees 79,943 86,3911 -7
1 As of December 31, 2015
D.06 Q3 Unit sales Q3 2016 Q3 2015 % change
Total 97,143 128,496 -24
EU30
1 21,307 19,938 +7
NAFTA 31,433 52,185 -40
Latin America (excl. Mexico) 7,656 7,831 -2
Asia 28,070 36,081 -22
Other markets 8,677 12,461 -30
BFDA (Auman Trucks) 16,913 14,292 +18
Total (incl. BFDA) 114,056 142,788 -20
1 European Union, Switzerland and Norway
EBIT significantly below high level of prior-year quarter Daimler Trucks sold 97,100 vehicles in the third quarter of this year (Q3 2015: 128,500). The decrease is the result of lower demand for trucks in many of our major markets. Revenue fell from €9.7 billion to €7.9 billion. EBIT of €464 million was signif-icantly below the high prior-year figure (Q3 2015: €791 million).
Weak market environment for Daimler Trucks The development of unit sales by Daimler Trucks was particular-ly affected by weak demand in the NAFTA region in the third quarter. The market adjustment there had an impact on our unit sales, which were significantly below the prior-year level at 31,400 units (Q3 2015: 52,200). At the same time, we suc-ceeded in further extending our market leadership in Classes 6-8, taking 39.3% of the market (Q3 2015: 38.1%). We delivered 3,500 units in a contracting market in Brazil, which is fewer than in the same period of last year (Q3 2015: 4,300). In the EU30 region, we achieved growth in unit sales of 7% and sold 21,300 vehicles. Our market share (excluding the United King-dom) in the segment of medium- and heavy-duty trucks was 22.3% (Q3 2015: 23.6%). We sold more vehicles than in the prior-year period also in Germany (+4%). The share of the mar-ket accounted for by Mercedes-Benz was 37.9% (Q3 2015: 38.7%). In Turkey, we were not immune to the weak market environment and our sales decreased to 1,700 units in the third quarter (Q3 2015: 4,500). The fall in unit sales in Asia mainly reflects the negative development in the Middle East, with sales of 3,300 vehicles (Q3 2015: 9,700). In Japan, our major market
in the region, sales of 11,700 units were at the level of the prior-year quarter. Sales in Indonesia amounted to 6,700 units (Q3 2015: 5,400). Our joint venture in China achieved sales growth of 18% with the Auman trucks, selling 16,900 vehicles.
New Freightliner Cascadia sets standards Daimler Trucks North America presented its new flagship in September. The new Cascadia set new standards for fuel efficiency due to its aerodynamic design in combination with the integrated powertrain, and also offers an exclusive connec-tivity platform: Detroit Connect Analytics.
Daimler Trucks presents itself electric and connected At IAA Commercial Vehicles in Hannover, the world’s biggest trade fair of its kind, Daimler Trucks presented its visions of the urban transport of the future. Mercedes-Benz showed its Urban eTruck, the first electric truck for heavy-duty distribution transport. It is free of local emissions and has a range of up to 200 kilometers. Market launch is conceivable for early in the next decade. FUSO presented the eCanter, the third generation of the world’s first light-duty truck with purely electric power. It will be delivered to customers in a small series as of 2017. We are already launching new connectivity services on the market such as Uptime, the preventive service product from Mercedes-Benz. The new FleetBoard Store will be online as of 2017 for body manufacturers and service providers. They will be able to offer for example logistics and supply-chain apps on one platform.
D.07 Q1-3 € amounts in millions Q1-3 2016 Q1-3 2015 % change
EBIT 1,601 1,945 -18
Revenue 24,721 27,505 -10
Unit sales 311,089 366,033 -15
Production 321,151 379,098 -15
Employees 79,943 86,3911 -7
1 As of December 31, 2015
D.08 Q1-3 Unit sales Q1-3 2016 Q1-3 2015 % change
Total 311,089 366,033 -15
EU30 57,157 51,622 +11
NAFTA 112,504 142,417 -21
Latin America (excl. Mexico) 20,401 23,616 -14
Asia 93,874 108,774 -14
Other markets 27,153 39,604 -31
BFDA (Auman Trucks) 55,311 49,123 +13
Total (incl. BFDA) 366,400 415,156 -12
D | THE DIVISIONS 21
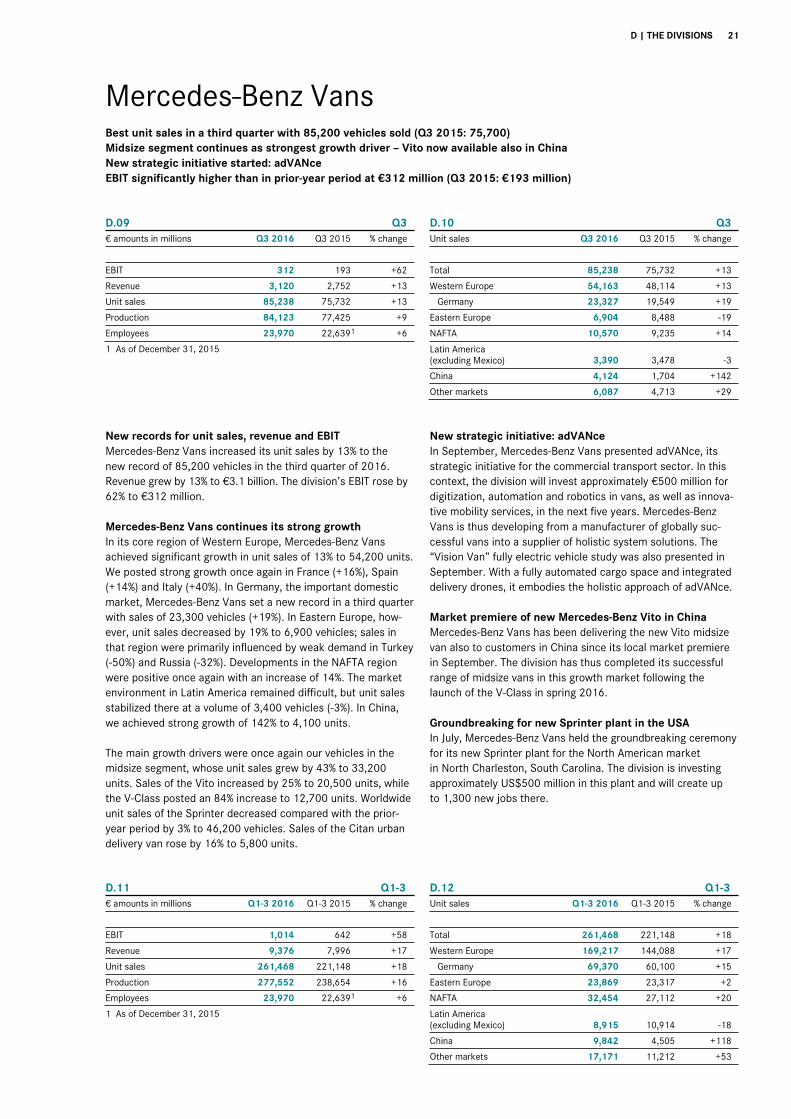
Mercedes-Benz Vans Best unit sales in a third quarter with 85,200 vehicles sold (Q3 2015: 75,700) Midsize segment continues as strongest growth driver – Vito now available also in China New strategic initiative started: adVANce EBIT significantly higher than in prior-year period at €312 million (Q3 2015: €193 million)
D.09 Q3 € amounts in millions Q3 2016 Q3 2015 % change
EBIT 312 193 +62
Revenue 3,120 2,752 +13
Unit sales 85,238 75,732 +13
Production 84,123 77,425 +9
Employees 23,970 22,6391 +6
1 As of December 31, 2015
D.10 Q3 Unit sales Q3 2016 Q3 2015 % change
Total 85,238 75,732 +13
Western Europe 54,163 48,114 +13
Germany 23,327 19,549 +19
Eastern Europe 6,904 8,488 -19
NAFTA 10,570 9,235 +14
Latin America (excluding Mexico) 3,390 3,478 -3
China 4,124 1,704 +142
Other markets 6,087 4,713 +29
New records for unit sales, revenue and EBIT Mercedes-Benz Vans increased its unit sales by 13% to the new record of 85,200 vehicles in the third quarter of 2016. Revenue grew by 13% to €3.1 billion. The division’s EBIT rose by 62% to €312 million.
Mercedes-Benz Vans continues its strong growth In its core region of Western Europe, Mercedes-Benz Vans achieved significant growth in unit sales of 13% to 54,200 units. We posted strong growth once again in France (+16%), Spain (+14%) and Italy (+40%). In Germany, the important domestic market, Mercedes-Benz Vans set a new record in a third quarter with sales of 23,300 vehicles (+19%). In Eastern Europe, how-ever, unit sales decreased by 19% to 6,900 vehicles; sales in that region were primarily influenced by weak demand in Turkey (-50%) and Russia (-32%). Developments in the NAFTA region were positive once again with an increase of 14%. The market environment in Latin America remained difficult, but unit sales stabilized there at a volume of 3,400 vehicles (-3%). In China, we achieved strong growth of 142% to 4,100 units.
The main growth drivers were once again our vehicles in the midsize segment, whose unit sales grew by 43% to 33,200 units. Sales of the Vito increased by 25% to 20,500 units, while the V-Class posted an 84% increase to 12,700 units. Worldwide unit sales of the Sprinter decreased compared with the prior-year period by 3% to 46,200 vehicles. Sales of the Citan urban delivery van rose by 16% to 5,800 units.
New strategic initiative: adVANce In September, Mercedes-Benz Vans presented adVANce, its strategic initiative for the commercial transport sector. In this context, the division will invest approximately €500 million for digitization, automation and robotics in vans, as well as innova-tive mobility services, in the next five years. Mercedes-Benz Vans is thus developing from a manufacturer of globally suc-cessful vans into a supplier of holistic system solutions. The “Vision Van” fully electric vehicle study was also presented in September. With a fully automated cargo space and integrated delivery drones, it embodies the holistic approach of adVANce.
Market premiere of new Mercedes-Benz Vito in China Mercedes-Benz Vans has been delivering the new Vito midsize van also to customers in China since its local market premiere in September. The division has thus completed its successful range of midsize vans in this growth market following the launch of the V-Class in spring 2016.
Groundbreaking for new Sprinter plant in the USA In July, Mercedes-Benz Vans held the groundbreaking ceremony for its new Sprinter plant for the North American market in North Charleston, South Carolina. The division is investing approximately US$500 million in this plant and will create up to 1,300 new jobs there.
D.11 Q1-3 € amounts in millions Q1-3 2016 Q1-3 2015 % change
EBIT 1,014 642 +58
Revenue 9,376 7,996 +17
Unit sales 261,468 221,148 +18
Production 277,552 238,654 +16
Employees 23,970 22,6391 +6
1 As of December 31, 2015
D.12 Q1-3 Unit sales Q1-3 2016 Q1-3 2015 % change
Total 261,468 221,148 +18
Western Europe 169,217 144,088 +17
Germany 69,370 60,100 +15
Eastern Europe 23,869 23,317 +2
NAFTA 32,454 27,112 +20
Latin America (excluding Mexico) 8,915 10,914 -18
China 9,842 4,505 +118
Other markets 17,171 11,212 +53
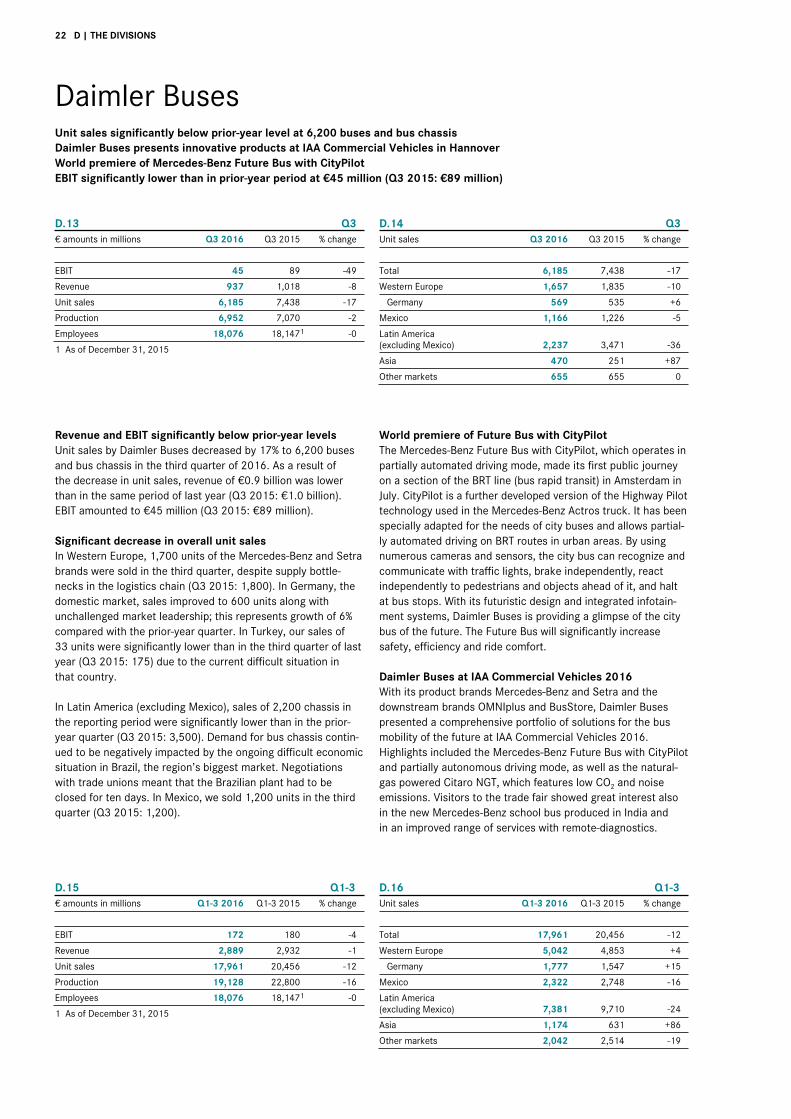
22 D | THE DIVISIONS
Daimler Buses Unit sales significantly below prior-year level at 6,200 buses and bus chassis Daimler Buses presents innovative products at IAA Commercial Vehicles in Hannover World premiere of Mercedes-Benz Future Bus with CityPilot EBIT significantly lower than in prior-year period at €45 million (Q3 2015: €89 million)
D.13 Q3 € amounts in millions Q3 2016 Q3 2015 % change
EBIT 45 89 -49
Revenue 937 1,018 -8
Unit sales 6,185 7,438 -17
Production 6,952 7,070 -2
Employees 18,076 18,1471 -0
1 As of December 31, 2015
D.14 Q3 Unit sales Q3 2016 Q3 2015 % change
Total 6,185 7,438 -17
Western Europe 1,657 1,835 -10
Germany 569 535 +6
Mexico 1,166 1,226 -5
Latin America (excluding Mexico) 2,237 3,471 -36
Asia 470 251 +87
Other markets 655 655 0
Revenue and EBIT significantly below prior-year levels Unit sales by Daimler Buses decreased by 17% to 6,200 buses and bus chassis in the third quarter of 2016. As a result of the decrease in unit sales, revenue of €0.9 billion was lower than in the same period of last year (Q3 2015: €1.0 billion). EBIT amounted to €45 million (Q3 2015: €89 million).
Significant decrease in overall unit sales In Western Europe, 1,700 units of the Mercedes-Benz and Setra brands were sold in the third quarter, despite supply bottle-necks in the logistics chain (Q3 2015: 1,800). In Germany, the domestic market, sales improved to 600 units along with unchallenged market leadership; this represents growth of 6% compared with the prior-year quarter. In Turkey, our sales of 33 units were significantly lower than in the third quarter of last year (Q3 2015: 175) due to the current difficult situation in that country.
In Latin America (excluding Mexico), sales of 2,200 chassis in the reporting period were significantly lower than in the prior-year quarter (Q3 2015: 3,500). Demand for bus chassis contin-ued to be negatively impacted by the ongoing difficult economic situation in Brazil, the region’s biggest market. Negotiations with trade unions meant that the Brazilian plant had to be closed for ten days. In Mexico, we sold 1,200 units in the third quarter (Q3 2015: 1,200).
World premiere of Future Bus with CityPilot The Mercedes-Benz Future Bus with CityPilot, which operates in partially automated driving mode, made its first public journey on a section of the BRT line (bus rapid transit) in Amsterdam in July. CityPilot is a further developed version of the Highway Pilot technology used in the Mercedes-Benz Actros truck. It has been specially adapted for the needs of city buses and allows partial-ly automated driving on BRT routes in urban areas. By using numerous cameras and sensors, the city bus can recognize and communicate with traffic lights, brake independently, react independently to pedestrians and objects ahead of it, and halt at bus stops. With its futuristic design and integrated infotain-ment systems, Daimler Buses is providing a glimpse of the city bus of the future. The Future Bus will significantly increase safety, efficiency and ride comfort.
Daimler Buses at IAA Commercial Vehicles 2016 With its product brands Mercedes-Benz and Setra and the downstream brands OMNIplus and BusStore, Daimler Buses presented a comprehensive portfolio of solutions for the bus mobility of the future at IAA Commercial Vehicles 2016. Highlights included the Mercedes-Benz Future Bus with CityPilot and partially autonomous driving mode, as well as the natural-gas powered Citaro NGT, which features low CO2 and noise emissions. Visitors to the trade fair showed great interest also in the new Mercedes-Benz school bus produced in India and in an improved range of services with remote-diagnostics.
D.15 Q1-3 € amounts in millions Q1-3 2016 Q1-3 2015 % change
EBIT 172 180 -4
Revenue 2,889 2,932 -1
Unit sales 17,961 20,456 -12
Production 19,128 22,800 -16
Employees 18,076 18,1471 -0
1 As of December 31, 2015
D.16 Q1-3 Unit sales Q1-3 2016 Q1-3 2015 % change
Total 17,961 20,456 -12
Western Europe 5,042 4,853 +4
Germany 1,777 1,547 +15
Mexico 2,322 2,748 -16
Latin America (excluding Mexico) 7,381 9,710 -24
Asia 1,174 631 +86
Other markets 2,042 2,514 -19
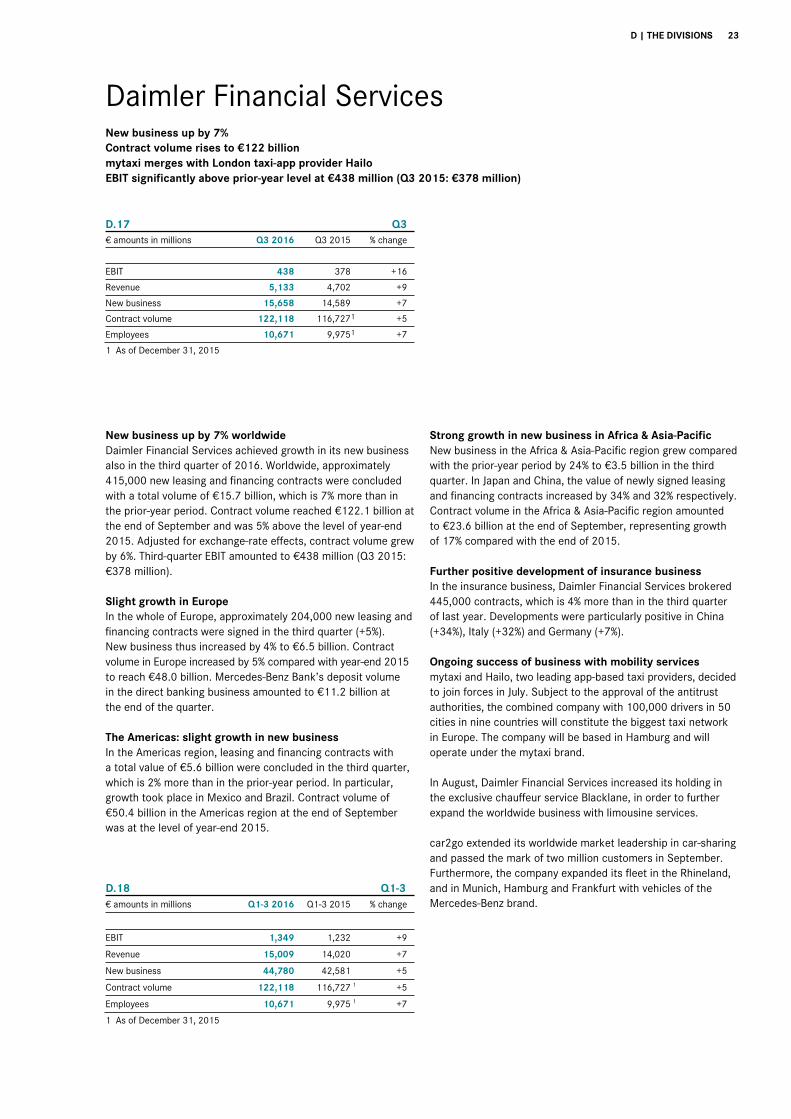
D | THE DIVISIONS 23
Daimler Financial Services New business up by 7% Contract volume rises to €122 billion mytaxi merges with London taxi-app provider Hailo EBIT significantly above prior-year level at €438 million (Q3 2015: €378 million)
D.17 Q3 € amounts in millions Q3 2016 Q3 2015 % change
EBIT 438 378 +16
Revenue 5,133 4,702 +9
New business 15,658 14,589 +7
Contract volume 122,118 116,7271 +5
Employees 10,671 9,9751 +7
1 As of December 31, 2015
New business up by 7% worldwide Daimler Financial Services achieved growth in its new business also in the third quarter of 2016. Worldwide, approximately 415,000 new leasing and financing contracts were concluded with a total volume of €15.7 billion, which is 7% more than in the prior-year period. Contract volume reached €122.1 billion at the end of September and was 5% above the level of year-end 2015. Adjusted for exchange-rate effects, contract volume grew by 6%. Third-quarter EBIT amounted to €438 million (Q3 2015: €378 million).
Slight growth in Europe In the whole of Europe, approximately 204,000 new leasing and financing contracts were signed in the third quarter (+5%). New business thus increased by 4% to €6.5 billion. Contract volume in Europe increased by 5% compared with year-end 2015 to reach €48.0 billion. Mercedes-Benz Bank’s deposit volume in the direct banking business amounted to €11.2 billion at the end of the quarter.
The Americas: slight growth in new business In the Americas region, leasing and financing contracts with a total value of €5.6 billion were concluded in the third quarter, which is 2% more than in the prior-year period. In particular, growth took place in Mexico and Brazil. Contract volume of €50.4 billion in the Americas region at the end of September was at the level of year-end 2015.
D.18 Q1-3 € amounts in millions Q1-3 2016 Q1-3 2015 % change
EBIT 1,349 1,232 +9
Revenue 15,009 14,020 +7
New business 44,780 42,581 +5
Contract volume 122,118 116,727 1 +5
Employees 10,671 9,975 1 +7
1 As of December 31, 2015
Strong growth in new business in Africa & Asia-Pacific New business in the Africa & Asia-Pacific region grew compared with the prior-year period by 24% to €3.5 billion in the third quarter. In Japan and China, the value of newly signed leasing and financing contracts increased by 34% and 32% respectively. Contract volume in the Africa & Asia-Pacific region amounted to €23.6 billion at the end of September, representing growth of 17% compared with the end of 2015.
Further positive development of insurance business In the insurance business, Daimler Financial Services brokered 445,000 contracts, which is 4% more than in the third quarter of last year. Developments were particularly positive in China (+34%), Italy (+32%) and Germany (+7%).
Ongoing success of business with mobility services mytaxi and Hailo, two leading app-based taxi providers, decided to join forces in July. Subject to the approval of the antitrust authorities, the combined company with 100,000 drivers in 50 cities in nine countries will constitute the biggest taxi network in Europe. The company will be based in Hamburg and will operate under the mytaxi brand.
In August, Daimler Financial Services increased its holding in the exclusive chauffeur service Blacklane, in order to further expand the worldwide business with limousine services.
car2go extended its worldwide market leadership in car-sharing and passed the mark of two million customers in September. Furthermore, the company expanded its fleet in the Rhineland, and in Munich, Hamburg and Frankfurt with vehicles of the Mercedes-Benz brand.
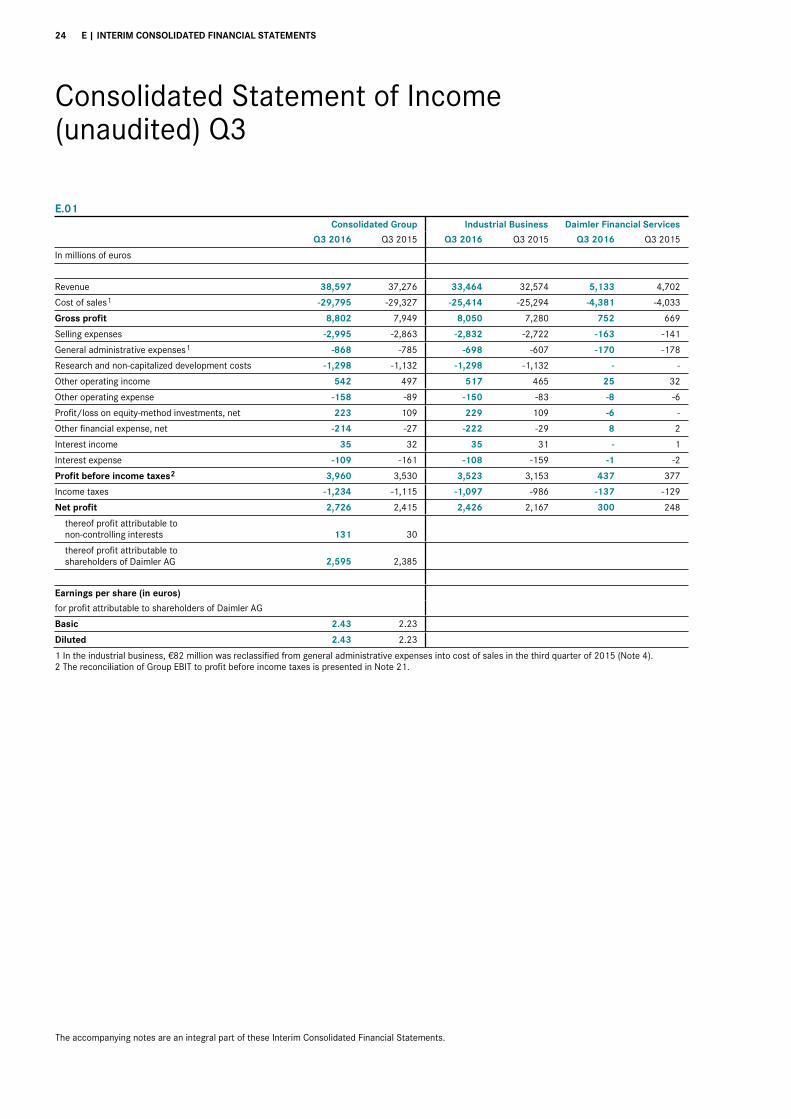
24 E | INTERIM CONSOLIDATED FINANCIAL STATEMENTS
Consolidated Statement of Income (unaudited) Q3
E.01 Consolidated Group Industrial Business Daimler Financial Services
Q3 2016 Q3 2015 Q3 2016 Q3 2015 Q3 2016 Q3 2015
In millions of euros
Revenue 38,597 37,276 33,464 32,574 5,133 4,702
Cost of sales
1 -29,795 -29,327 -25,414 -25,294 -4,381 -4,033
Gross profit 8,802 7,949 8,050 7,280 752 669
Selling expenses -2,995 -2,863 -2,832 -2,722 -163 -141
General administrative expenses
1 -868 -785 -698 -607 -170 -178
Research and non-capitalized development costs -1,298 -1,132 -1,298 -1,132 - -
Other operating income 542 497 517 465 25 32
Other operating expense -158 -89 -150 -83 -8 -6
Profit/loss on equity-method investments, net 223 109 229 109 -6 -
Other financial expense, net -214 -27 -222 -29 8 2
Interest income 35 32 35 31 - 1
Interest expense -109 -161 -108 -159 -1 -2
Profit before income taxes
2 3,960 3,530 3,523 3,153 437 377
Income taxes -1,234 -1,115 -1,097 -986 -137 -129
Net profit 2,726 2,415 2,426 2,167 300 248
thereof profit attributable to non-controlling interests 131 30
thereof profit attributable to shareholders of Daimler AG 2,595 2,385
Earnings per share (in euros)
for profit attributable to shareholders of Daimler AG
Basic 2.43 2.23
Diluted 2.43 2.23
1 In the industrial business, €82 million was reclassified from general administrative expenses into cost of sales in the third quarter of 2015 (Note 4). 2 The reconciliation of Group EBIT to profit before income taxes is presented in Note 21.
The accompanying notes are an integral part of these Interim Consolidated Financial Statements.
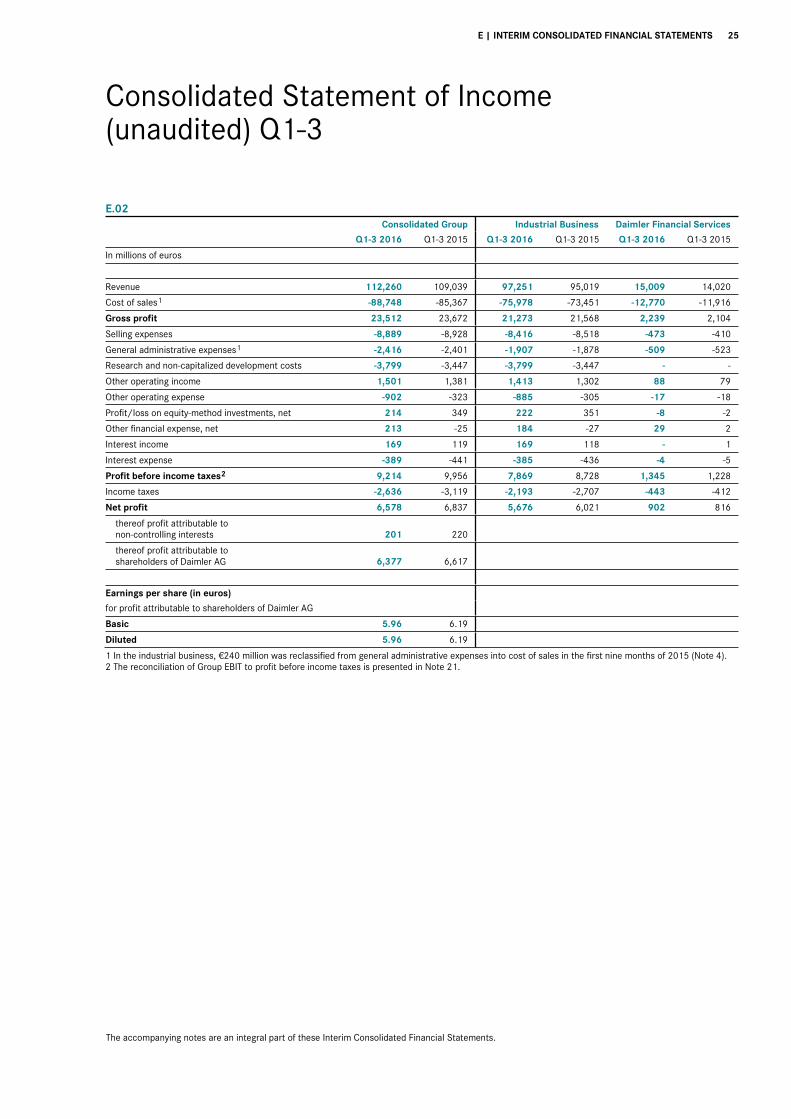
E | INTERIM CONSOLIDATED FINANCIAL STATEMENTS 25
Consolidated Statement of Income (unaudited) Q1-3
E.02 Consolidated Group Industrial Business Daimler Financial Services
Q1-3 2016 Q1-3 2015 Q1-3 2016 Q1-3 2015 Q1-3 2016 Q1-3 2015
In millions of euros
Revenue 112,260 109,039 97,251 95,019 15,009 14,020
Cost of sales
1 -88,748 -85,367 -75,978 -73,451 -12,770 -11,916
Gross profit 23,512 23,672 21,273 21,568 2,239 2,104
Selling expenses -8,889 -8,928 -8,416 -8,518 -473 -410
General administrative expenses
1 -2,416 -2,401 -1,907 -1,878 -509 -523
Research and non-capitalized development costs -3,799 -3,447 -3,799 -3,447 - -
Other operating income 1,501 1,381 1,413 1,302 88 79
Other operating expense -902 -323 -885 -305 -17 -18
Profit/loss on equity-method investments, net 214 349 222 351 -8 -2
Other financial expense, net 213 -25 184 -27 29 2
Interest income 169 119 169 118 - 1
Interest expense -389 -441 -385 -436 -4 -5
Profit before income taxes
2 9,214 9,956 7,869 8,728 1,345 1,228
Income taxes -2,636 -3,119 -2,193 -2,707 -443 -412
Net profit 6,578 6,837 5,676 6,021 902 816
thereof profit attributable to non-controlling interests 201 220
thereof profit attributable to shareholders of Daimler AG 6,377 6,617
Earnings per share (in euros)
for profit attributable to shareholders of Daimler AG
Basic 5.96 6.19
Diluted 5.96 6.19
1 In the industrial business, €240 million was reclassified from general administrative expenses into cost of sales in the first nine months of 2015 (Note 4). 2 The reconciliation of Group EBIT to profit before income taxes is presented in Note 21.
The accompanying notes are an integral part of these Interim Consolidated Financial Statements.
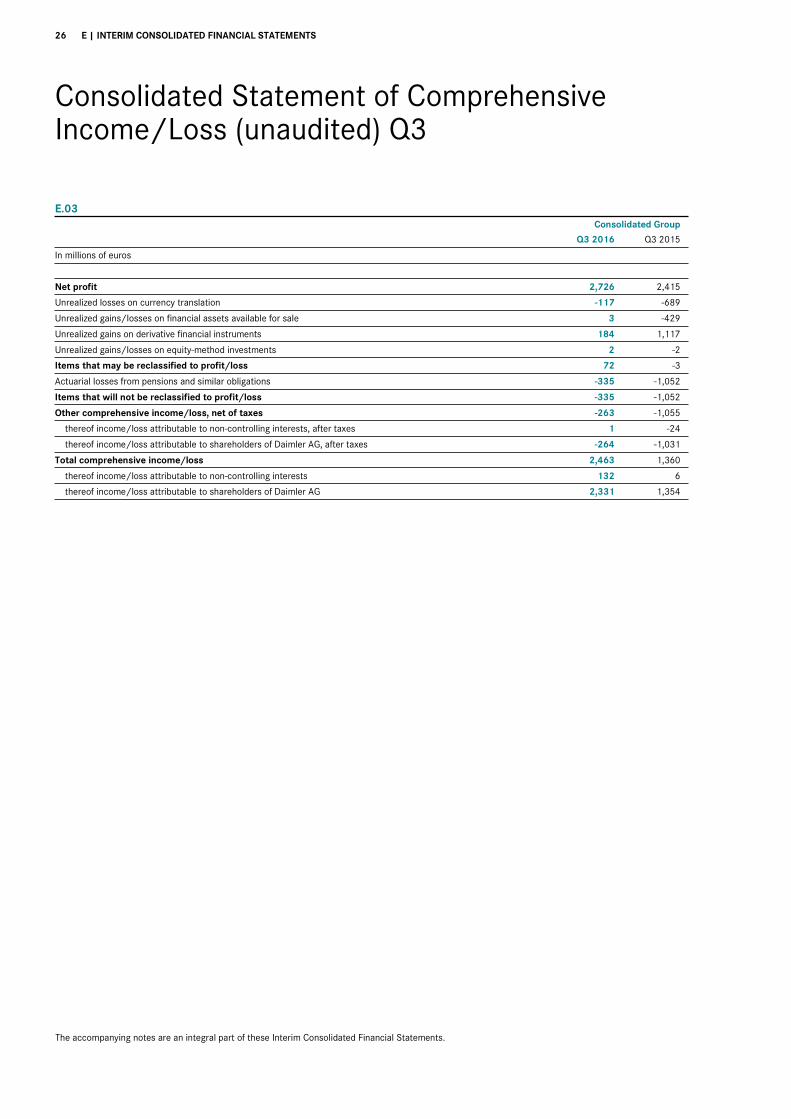
26 E | INTERIM CONSOLIDATED FINANCIAL STATEMENTS
Consolidated Statement of Comprehensive Income/Loss (unaudited) Q3
E.03 Consolidated Group
Q3 2016 Q3 2015
In millions of euros
Net profit 2,726 2,415
Unrealized losses on currency translation -117 -689
Unrealized gains/losses on financial assets available for sale 3 -429
Unrealized gains on derivative financial instruments 184 1,117
Unrealized gains/losses on equity-method investments 2 -2
Items that may be reclassified to profit/loss 72 -3
Actuarial losses from pensions and similar obligations -335 -1,052
Items that will not be reclassified to profit/loss -335 -1,052
Other comprehensive income/loss, net of taxes -263 -1,055
thereof income/loss attributable to non-controlling interests, after taxes 1 -24
thereof income/loss attributable to shareholders of Daimler AG, after taxes -264 -1,031
Total comprehensive income/loss 2,463 1,360
thereof income/loss attributable to non-controlling interests 132 6
thereof income/loss attributable to shareholders of Daimler AG 2,331 1,354
The accompanying notes are an integral part of these Interim Consolidated Financial Statements.
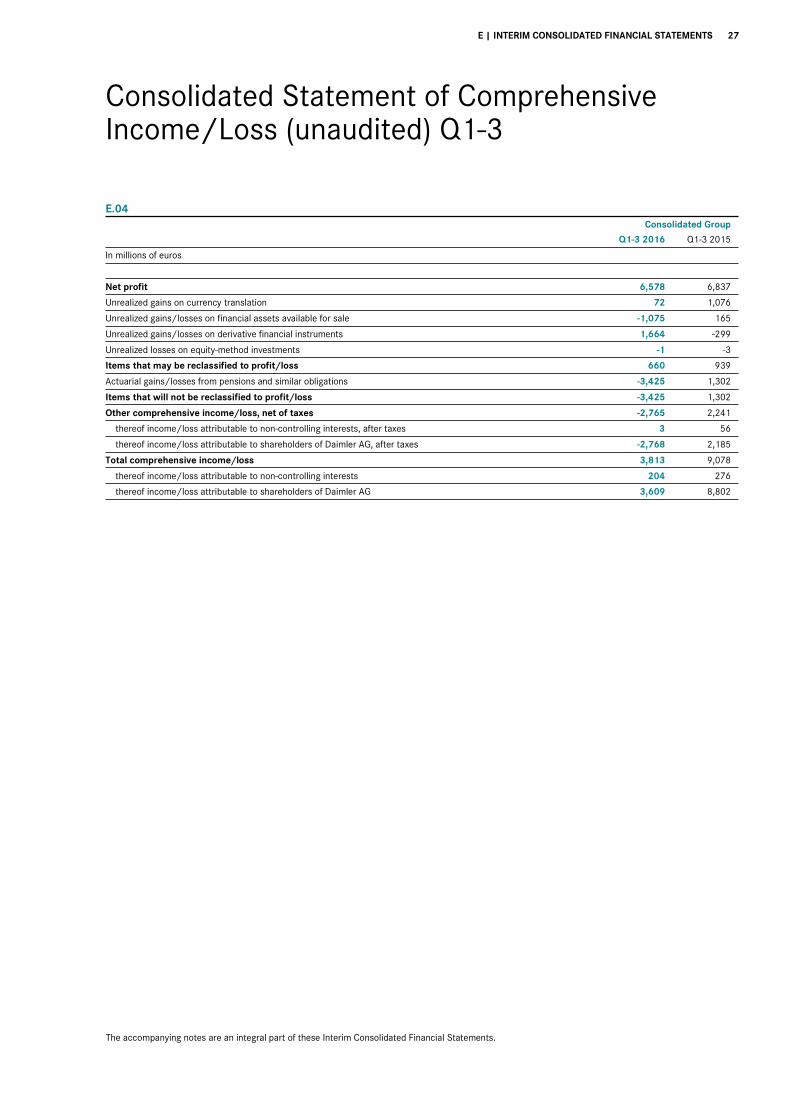
E | INTERIM CONSOLIDATED FINANCIAL STATEMENTS 27
Consolidated Statement of Comprehensive Income/Loss (unaudited) Q1-3
E.04 Consolidated Group
Q1-3 2016 Q1-3 2015
In millions of euros
Net profit 6,578 6,837
Unrealized gains on currency translation 72 1,076
Unrealized gains/losses on financial assets available for sale -1,075 165
Unrealized gains/losses on derivative financial instruments 1,664 -299
Unrealized losses on equity-method investments -1 -3
Items that may be reclassified to profit/loss 660 939
Actuarial gains/losses from pensions and similar obligations -3,425 1,302
Items that will not be reclassified to profit/loss -3,425 1,302
Other comprehensive income/loss, net of taxes -2,765 2,241
thereof income/loss attributable to non-controlling interests, after taxes 3 56
thereof income/loss attributable to shareholders of Daimler AG, after taxes -2,768 2,185
Total comprehensive income/loss 3,813 9,078
thereof income/loss attributable to non-controlling interests 204 276
thereof income/loss attributable to shareholders of Daimler AG 3,609 8,802
The accompanying notes are an integral part of these Interim Consolidated Financial Statements.
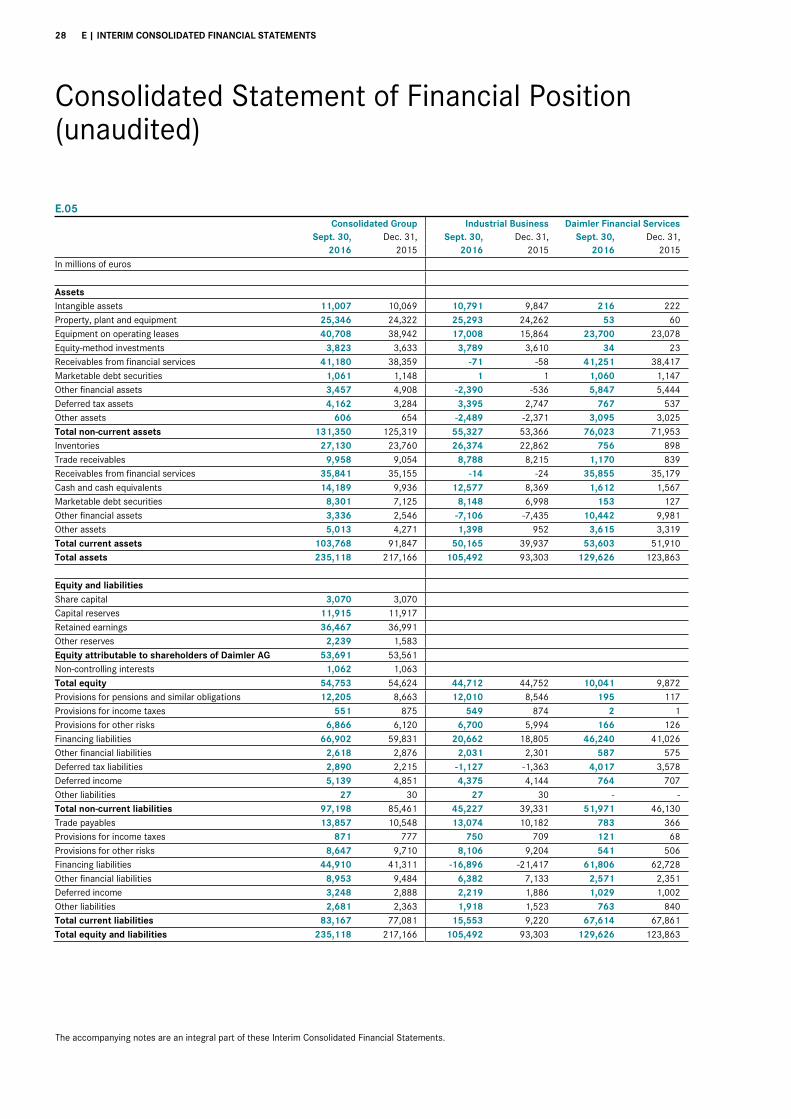
28 E | INTERIM CONSOLIDATED FINANCIAL STATEMENTS
Consolidated Statement of Financial Position (unaudited)
E.05 Consolidated Group Industrial Business Daimler Financial Services Sept. 30, Dec. 31, Sept. 30, Dec. 31, Sept. 30, Dec. 31, 2016 2015 2016 2015 2016 2015 In millions of euros Assets Intangible assets 11,007 10,069 10,791 9,847 216 222 Property, plant and equipment 25,346 24,322 25,293 24,262 53 60 Equipment on operating leases 40,708 38,942 17,008 15,864 23,700 23,078 Equity-method investments 3,823 3,633 3,789 3,610 34 23 Receivables from financial services 41,180 38,359 -71 -58 41,251 38,417 Marketable debt securities 1,061 1,148 1 1 1,060 1,147 Other financial assets 3,457 4,908 -2,390 -536 5,847 5,444 Deferred tax assets 4,162 3,284 3,395 2,747 767 537 Other assets 606 654 -2,489 -2,371 3,095 3,025 Total non-current assets 131,350 125,319 55,327 53,366 76,023 71,953 Inventories 27,130 23,760 26,374 22,862 756 898 Trade receivables 9,958 9,054 8,788 8,215 1,170 839 Receivables from financial services 35,841 35,155 -14 -24 35,855 35,179 Cash and cash equivalents 14,189 9,936 12,577 8,369 1,612 1,567 Marketable debt securities 8,301 7,125 8,148 6,998 153 127 Other financial assets 3,336 2,546 -7,106 -7,435 10,442 9,981 Other assets 5,013 4,271 1,398 952 3,615 3,319 Total current assets 103,768 91,847 50,165 39,937 53,603 51,910 Total assets 235,118 217,166 105,492 93,303 129,626 123,863 Equity and liabilities Share capital 3,070 3,070 Capital reserves 11,915 11,917 Retained earnings 36,467 36,991 Other reserves 2,239 1,583 Equity attributable to shareholders of Daimler AG 53,691 53,561 Non-controlling interests 1,062 1,063 Total equity 54,753 54,624 44,712 44,752 10,041 9,872 Provisions for pensions and similar obligations 12,205 8,663 12,010 8,546 195 117 Provisions for income taxes 551 875 549 874 2 1 Provisions for other risks 6,866 6,120 6,700 5,994 166 126 Financing liabilities 66,902 59,831 20,662 18,805 46,240 41,026 Other financial liabilities 2,618 2,876 2,031 2,301 587 575 Deferred tax liabilities 2,890 2,215 -1,127 -1,363 4,017 3,578 Deferred income 5,139 4,851 4,375 4,144 764 707 Other liabilities 27 30 27 30 - - Total non-current liabilities 97,198 85,461 45,227 39,331 51,971 46,130 Trade payables 13,857 10,548 13,074 10,182 783 366 Provisions for income taxes 871 777 750 709 121 68 Provisions for other risks 8,647 9,710 8,106 9,204 541 506 Financing liabilities 44,910 41,311 -16,896 -21,417 61,806 62,728 Other financial liabilities 8,953 9,484 6,382 7,133 2,571 2,351 Deferred income 3,248 2,888 2,219 1,886 1,029 1,002 Other liabilities 2,681 2,363 1,918 1,523 763 840 Total current liabilities 83,167 77,081 15,553 9,220 67,614 67,861 Total equity and liabilities 235,118 217,166 105,492 93,303 129,626 123,863
The accompanying notes are an integral part of these Interim Consolidated Financial Statements.
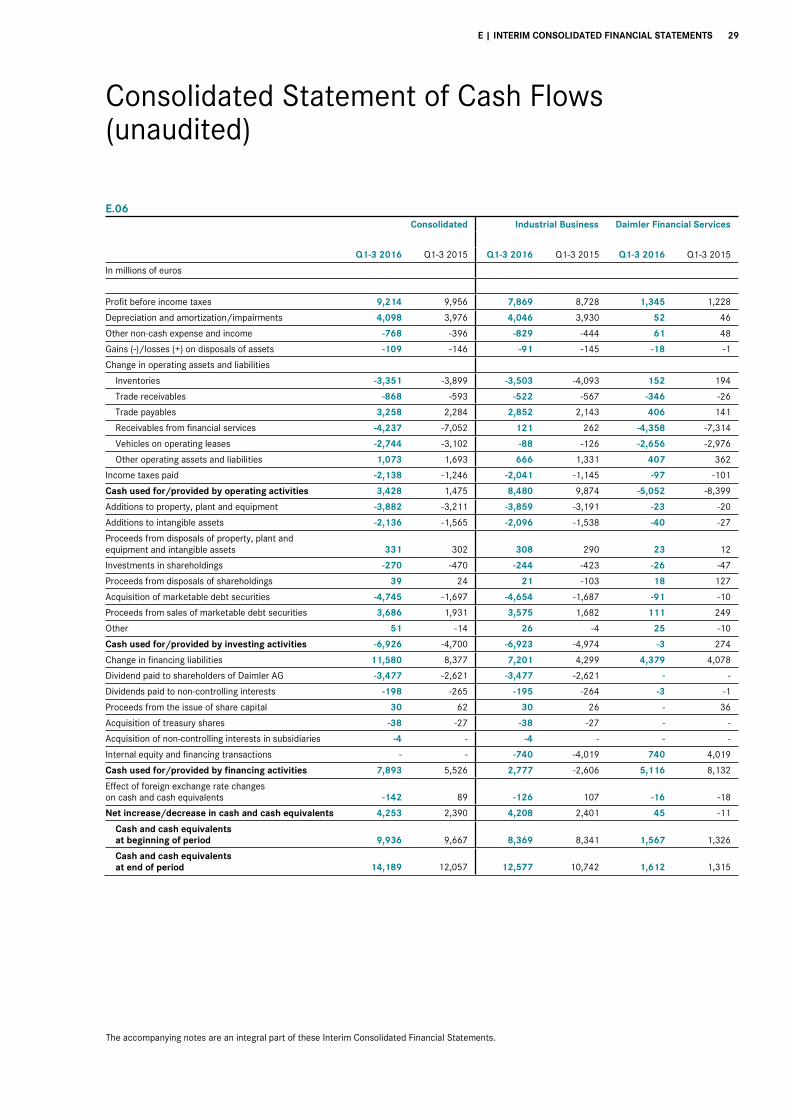
E | INTERIM CONSOLIDATED FINANCIAL STATEMENTS 29
Consolidated Statement of Cash Flows (unaudited)
E.06 Consolidated Industrial Business Daimler Financial Services
Q1-3 2016 Q1-3 2015 Q1-3 2016 Q1-3 2015 Q1-3 2016 Q1-3 2015
In millions of euros
Profit before income taxes 9,214 9,956 7,869 8,728 1,345 1,228
Depreciation and amortization/impairments 4,098 3,976 4,046 3,930 52 46
Other non-cash expense and income -768 -396 -829 -444 61 48
Gains (-)/losses (+) on disposals of assets -109 -146 -91 -145 -18 -1
Change in operating assets and liabilities
Inventories -3,351 -3,899 -3,503 -4,093 152 194
Trade receivables -868 -593 -522 -567 -346 -26
Trade payables 3,258 2,284 2,852 2,143 406 141
Receivables from financial services -4,237 -7,052 121 262 -4,358 -7,314
Vehicles on operating leases -2,744 -3,102 -88 -126 -2,656 -2,976
Other operating assets and liabilities 1,073 1,693 666 1,331 407 362
Income taxes paid -2,138 -1,246 -2,041 -1,145 -97 -101
Cash used for/provided by operating activities 3,428 1,475 8,480 9,874 -5,052 -8,399
Additions to property, plant and equipment -3,882 -3,211 -3,859 -3,191 -23 -20
Additions to intangible assets -2,136 -1,565 -2,096 -1,538 -40 -27
Proceeds from disposals of property, plant and equipment and intangible assets 331 302 308 290 23 12
Investments in shareholdings -270 -470 -244 -423 -26 -47
Proceeds from disposals of shareholdings 39 24 21 -103 18 127
Acquisition of marketable debt securities -4,745 -1,697 -4,654 -1,687 -91 -10
Proceeds from sales of marketable debt securities 3,686 1,931 3,575 1,682 111 249
Other 51 -14 26 -4 25 -10
Cash used for/provided by investing activities -6,926 -4,700 -6,923 -4,974 -3 274
Change in financing liabilities 11,580 8,377 7,201 4,299 4,379 4,078
Dividend paid to shareholders of Daimler AG -3,477 -2,621 -3,477 -2,621 - -
Dividends paid to non-controlling interests -198 -265 -195 -264 -3 -1
Proceeds from the issue of share capital 30 62 30 26 - 36
Acquisition of treasury shares -38 -27 -38 -27 - -
Acquisition of non-controlling interests in subsidiaries -4 - -4 - - -
Internal equity and financing transactions - - -740 -4,019 740 4,019
Cash used for/provided by financing activities 7,893 5,526 2,777 -2,606 5,116 8,132
Effect of foreign exchange rate changes on cash and cash equivalents -142 89 -126 107 -16 -18
Net increase/decrease in cash and cash equivalents 4,253 2,390 4,208 2,401 45 -11
Cash and cash equivalents at beginning of period 9,936 9,667 8,369 8,341 1,567 1,326
Cash and cash equivalents at end of period 14,189 12,057 12,577 10,742 1,612 1,315
The accompanying notes are an integral part of these Interim Consolidated Financial Statements.
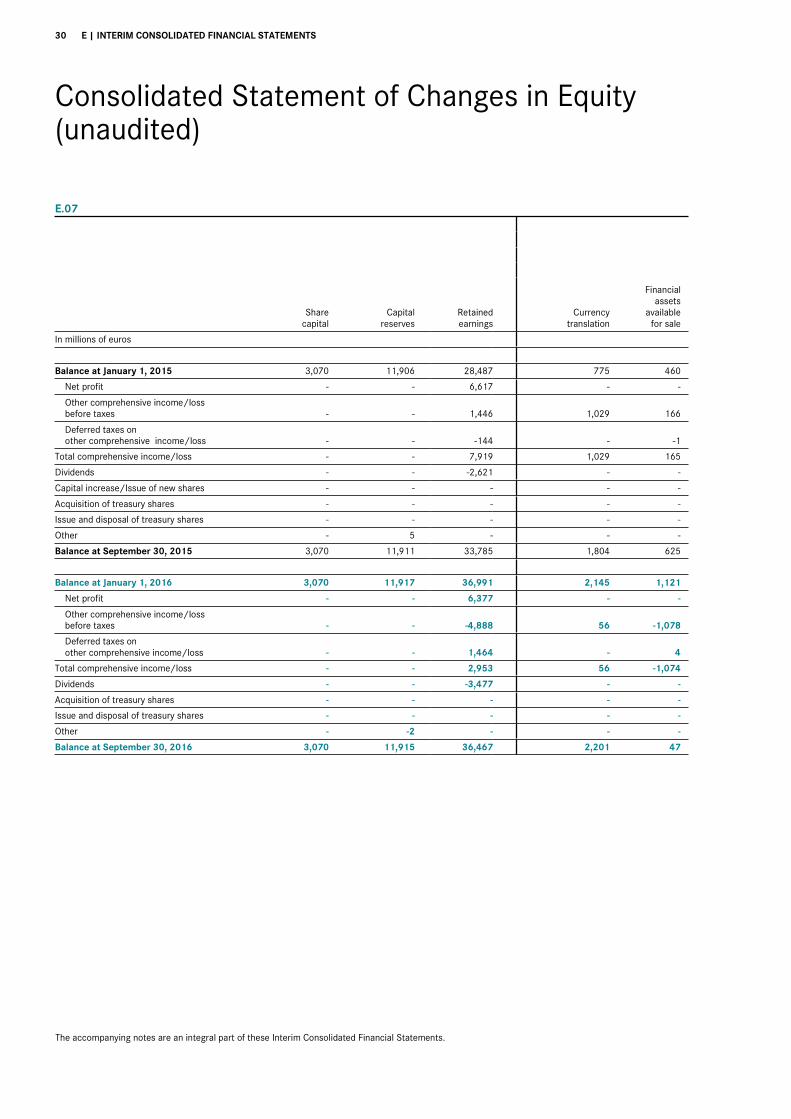
30 E | INTERIM CONSOLIDATED FINANCIAL STATEMENTS
Consolidated Statement of Changes in Equity (unaudited)
E.07
Share
capital Capital
reserves Retainedearnings
Currencytranslation
Financialassets
availablefor sale
In millions of euros
Balance at January 1, 2015 3,070 11,906 28,487 775 460
Net profit - - 6,617 - -
Other comprehensive income/loss before taxes - - 1,446 1,029 166
Deferred taxes on other comprehensive income/loss - - -144 - -1
Total comprehensive income/loss - - 7,919 1,029 165
Dividends - - -2,621 - -
Capital increase/Issue of new shares - - - - -
Acquisition of treasury shares - - - - -
Issue and disposal of treasury shares - - - - -
Other - 5 - - -
Balance at September 30, 2015 3,070 11,911 33,785 1,804 625
Balance at January 1, 2016 3,070 11,917 36,991 2,145 1,121
Net profit - - 6,377 - -
Other comprehensive income/loss before taxes - - -4,888 56 -1,078
Deferred taxes on other comprehensive income/loss - - 1,464 - 4
Total comprehensive income/loss - - 2,953 56 -1,074
Dividends - - -3,477 - -
Acquisition of treasury shares - - - - -
Issue and disposal of treasury shares - - - - -
Other - -2 - - -
Balance at September 30, 2016 3,070 11,915 36,467 2,201 47
The accompanying notes are an integral part of these Interim Consolidated Financial Statements.
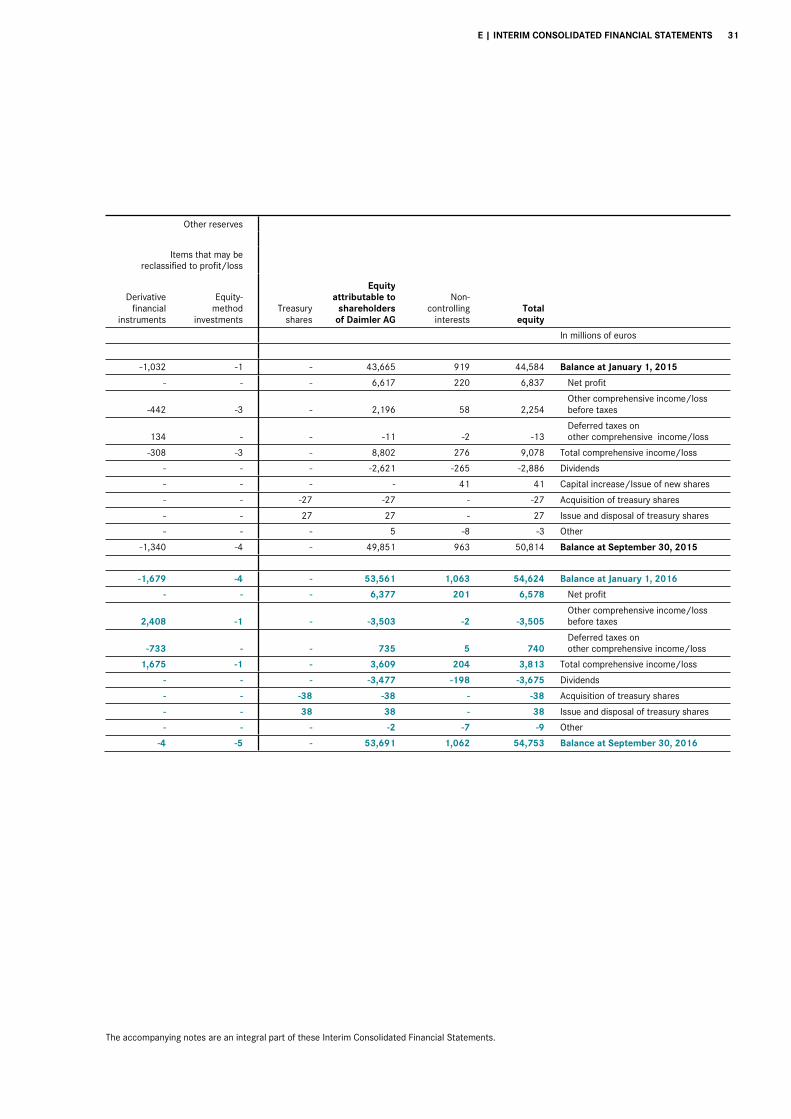
E | INTERIM CONSOLIDATED FINANCIAL STATEMENTS 31
Other reserves
Items that may be reclassified to profit/loss
Derivative financial
instruments
Equity- method
investments Treasury
shares
Equityattributable to
shareholdersof Daimler AG
Non-controlling
interests Total
equity
In millions of euros
-1,032 -1 - 43,665 919 44,584 Balance at January 1, 2015
- - - 6,617 220 6,837 Net profit
-442 -3 - 2,196 58 2,254 Other comprehensive income/lossbefore taxes
134 - - -11 -2 -13 Deferred taxes on other comprehensive income/loss
-308 -3 - 8,802 276 9,078 Total comprehensive income/loss
- - - -2,621 -265 -2,886 Dividends
- - - - 41 41 Capital increase/Issue of new shares
- - -27 -27 - -27 Acquisition of treasury shares
- - 27 27 - 27 Issue and disposal of treasury shares
- - - 5 -8 -3 Other
-1,340 -4 - 49,851 963 50,814 Balance at September 30, 2015
-1,679 -4 - 53,561 1,063 54,624 Balance at January 1, 2016
- - - 6,377 201 6,578 Net profit
2,408 -1 - -3,503 -2 -3,505 Other comprehensive income/loss before taxes
-733 - - 735 5 740 Deferred taxes on other comprehensive income/loss
1,675 -1 - 3,609 204 3,813 Total comprehensive income/loss
- - - -3,477 -198 -3,675 Dividends
- - -38 -38 - -38 Acquisition of treasury shares
- - 38 38 - 38 Issue and disposal of treasury shares
- - - -2 -7 -9 Other
-4 -5 - 53,691 1,062 54,753 Balance at September 30, 2016
The accompanying notes are an integral part of these Interim Consolidated Financial Statements.
32 E | INTERIM CONSOLIDATED FINANCIAL STATEMENTS
Notes to the Interim Consolidated Financial Statements (unaudited)
1. Presentation of the Interim Consolidated Financial Statements
General These unaudited interim consolidated financial statements (interim financial statements) of Daimler AG and its subsidiaries (“Daimler” or “the Group”) have been prepared in accordance with Section 37w of the German Securities Trading Act (WpHG) and International Accounting Standard (IAS) 34 Interim Finan-cial Reporting.
The interim financial statements comply with the International Financial Reporting Standards (IFRS) as adopted by the Euro-pean Union.
Daimler AG is a stock corporation organized under the laws of the Federal Republic of Germany. Daimler AG is entered in the Commercial Register of the Stuttgart District Court under No. HRB 19360 and its registered office is located at Mercedes-straße 137, 70327 Stuttgart, Germany.
The interim financial statements of the Daimler Group are presented in euros (€). Unless otherwise stated, all amounts are stated in millions of euros. All figures shown are rounded in accordance with standard business rounding principles.
The Board of Management authorized the interim consolidated financial statements for publication on October 20, 2016.
All significant intercompany accounts and transactions have been eliminated. In the opinion of the management, the interim financial statements reflect all adjustments (i.e. normal recur-ring adjustments) necessary for a fair presentation of the profit-ability, liquidity and capital resources, and financial position of the Group. Results for the interim periods presented are not necessarily indicative of the results that may be expected for any future period or for the full fiscal year. The interim financial statements should be read in conjunction with the December 31, 2015 audited and published IFRS consolidated financial statements and notes thereto. The accounting policies applied by the Group in these interim financial statements basically correspond with those applied for the consolidated financial statements for the year ended December 31, 2015.
The Group’s consolidated financial statements are significantly influenced by the activities of its financial services business. To enhance readers’ understanding of the Group’s profitability, liquidity and capital resources and its financial position, the accompanying interim consolidated financial statements also present information with respect to the Group’s industrial business and Daimler Financial Services’ business activities. Such information, however, is not required by IFRS and is not intended to, and does not, represent the separate IFRS profita-bility, liquidity and capital resources and financial position of the Group’s industrial business or Daimler Financial Services business activities. Eliminations of the effects of transactions between the industrial business and Daimler Financial Services and items at the corporate level have generally been allocated to the industrial business.
Preparation of interim financial statements in conformity with IFRS requires management to make estimates, assessments and assumptions which can affect the amounts and reporting of assets and liabilities, the reporting of contingent assets and liabilities as at the end of the reporting period and the amounts of income and expense reported for the period. Actual amounts can differ from those estimates. Changes in the estimates, assessments and assumptions can have a material impact on the interim consolidated financial statements. 2. Significant acquisitions and disposals Significant acquisitions
Athlon On June 30, 2016 Daimler signed the agreements for the acqui-sition of 100% of the shares of Athlon Car Lease International B.V. (Athlon), Haarlemmermeer, a subsidiary of the Dutch Ra-bobank Group. Athlon is one of the leading providers of mobility solutions in Europe, especially leasing and fleet management for commercial customers. The purchase price amounts to €1.1 billion, subject to possible purchase price adjustments. Fur-thermore, when the transaction is finalized, Daimler will settle the financial liabilities of Athlon, which will probably amount to approximately €2.3 billion. The finalization of the transaction is subject to the approval of antitrust and other supervisory authorities and is expected in the fourth quarter of 2016. After completion of the transaction, Athlon will be allocated to the segment Daimler Financial Services.
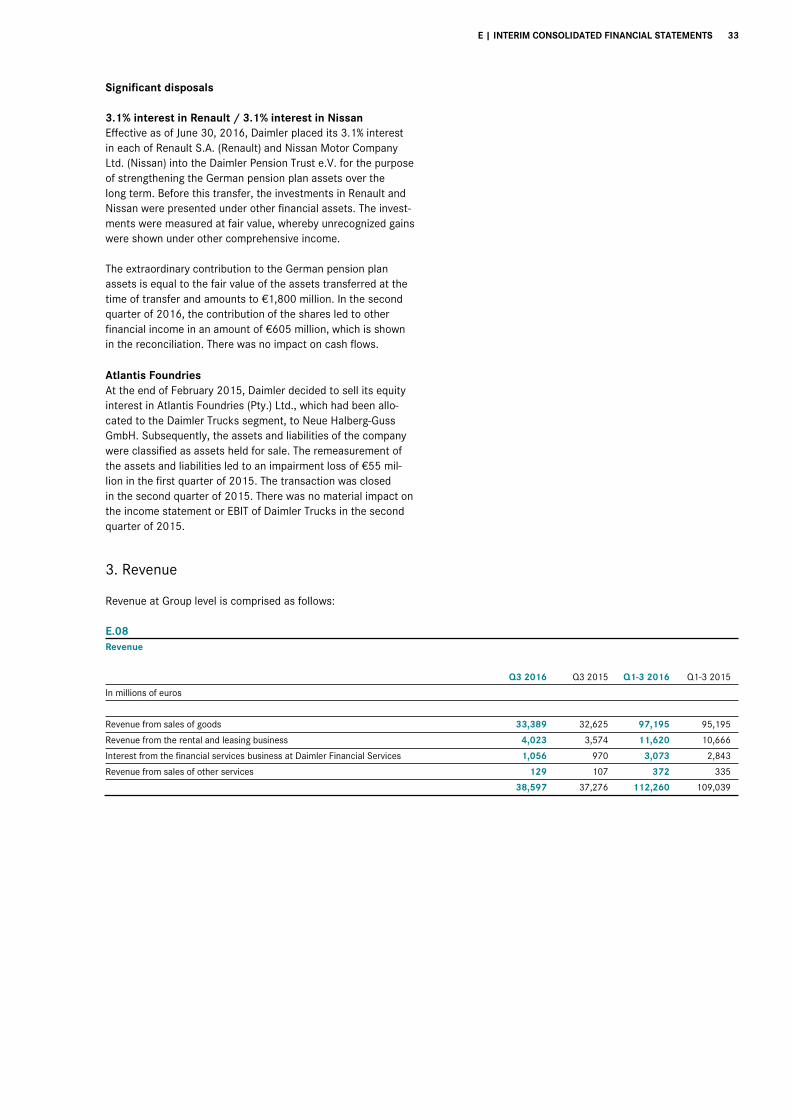
E | INTERIM CONSOLIDATED FINANCIAL STATEMENTS 33
Significant disposals
3.1% interest in Renault / 3.1% interest in Nissan Effective as of June 30, 2016, Daimler placed its 3.1% interest in each of Renault S.A. (Renault) and Nissan Motor Company Ltd. (Nissan) into the Daimler Pension Trust e.V. for the purpose of strengthening the German pension plan assets over the long term. Before this transfer, the investments in Renault and Nissan were presented under other financial assets. The invest-ments were measured at fair value, whereby unrecognized gains were shown under other comprehensive income. The extraordinary contribution to the German pension plan assets is equal to the fair value of the assets transferred at the time of transfer and amounts to €1,800 million. In the second quarter of 2016, the contribution of the shares led to other financial income in an amount of €605 million, which is shown in the reconciliation. There was no impact on cash flows.
Atlantis Foundries At the end of February 2015, Daimler decided to sell its equity interest in Atlantis Foundries (Pty.) Ltd., which had been allo-cated to the Daimler Trucks segment, to Neue Halberg-Guss GmbH. Subsequently, the assets and liabilities of the company were classified as assets held for sale. The remeasurement of the assets and liabilities led to an impairment loss of €55 mil-lion in the first quarter of 2015. The transaction was closed in the second quarter of 2015. There was no material impact on the income statement or EBIT of Daimler Trucks in the second quarter of 2015.
3. Revenue Revenue at Group level is comprised as follows:
E.08
Revenue
Q3 2016 Q3 2015 Q1-3 2016 Q1-3 2015
In millions of euros
Revenue from sales of goods 33,389 32,625 97,195 95,195
Revenue from the rental and leasing business 4,023 3,574 11,620 10,666
Interest from the financial services business at Daimler Financial Services 1,056 970 3,073 2,843
Revenue from sales of other services 129 107 372 335
38,597 37,276 112,260 109,039
34 E | INTERIM CONSOLIDATED FINANCIAL STATEMENTS
4. Functional costs Cost of sales Cost of sales increased from €29,327 million to €29,795 million in the third quarter of 2016 and from €85,367 million to €88,748 million in the nine-month period ended September 30, 2016. Cost of sales primarily comprises expenses of goods sold.
Selling expenses In the third quarter of 2016, selling expenses amounted to €2,995 million (Q3 2015: €2,863 million) and in the nine-month period ended September 30, 2016 they amounted to €8,889 million (Q1-3 2015: €8,928 million). Selling expenses include direct selling costs as well as selling overhead expenses and consist of personnel expenses, material costs and other selling costs.
General administrative expenses General administrative expenses amounted to €868 million in the third quarter of 2016 (Q3 2015: €785 million) and amount-ed to €2,416 million in the nine- month period ended Septem-ber 30, 2016 (Q1-3 2015: €2,401 million). They comprise expenses which are not attributable to production, sales or research and development functions, and include personnel expenses, depreciation and amortization of fixed and intangible assets, and other administrative costs. In the third quarter and the nine-month period ended September 30, 2015, a redefini-tion of cost allocations led to the reclassification of €82 million and €240 million from administrative expenses to cost of sales.
Research and non-capitalized development costs Research and non-capitalized development costs were €1,298 million in the third quarter of 2016 (Q3 2015: €1,132 million) and €3,799 million in the nine-month period ended September 30, 2016 (Q1-3 2015: €3,447 million). They primarily comprise personnel expenses and material costs.
Optimization programs Measures and programs with implementation costs that materi-ally impacted the EBIT of the segments are briefly described below.
In the course of the organizational focus on the divisions, Daimler started a restructuring program for its sales organiza-tion in Germany in 2014. Selected sales-and-service centers and outlets are being combined into passenger car and com-mercial vehicle outlets in order to steadily increase the profita-bility of Daimler’s own dealer activities in the highly competitive German market. In addition, programs for restructuring the Group’s dealer network abroad were initiated in 2015.
The restructuring programs also include the sale of selected operations of the Group’s current sales network in Germany and abroad. Those programs affect all automotive segments, but especially the Mercedes-Benz Cars segment. In the third quar-ter and the nine-month period ended September 30, 2016, they resulted in net income of €45 million and €13 million (Q3 2015: net income of €13 million and Q1-3 2015: net expense of €51 million.) The restructuring program for the sales organization in Germany was concluded in the third quarter of 2016.
At September 30, 2016, the disposal group’s assets for the locations abroad amounted to €321 million (December 31, 2015: €248 million) and its liabilities amounted to €115 million (December 31, 2015: €12 million). Due to their minor impact on the Group’s profitability, liquidity and capital resources, and financial position, the assets and liabilities held for sale are not presented separately in the consolidated statement of financial position.
In the Daimler Trucks segment, a redundancy program was launched in Brazil in 2013. That program led to a reduction of approximately 3,200 jobs in the administrative and productive areas as of December 31, 2015, mostly through voluntary severance agreements.
Furthermore, another severance program was initiated in Brazil in the second quarter of 2016. So far, that program has led to a reduction of approximately 2,000 jobs, mostly through volun-tary severance agreements. In the Daimler Trucks segment, that program resulted in expenses of €49 million in the third quarter and €83 million in the nine-month period ended September 30, 2016. Daimler Trucks anticipates a total expense of up to €0.1 billion in this respect in full-year 2016.
The aforementioned workforce adjustments in Brazil also affect the Daimler Buses segment to a small extent. In the third quarter of 2016, an expense of €8 million was recognized in this respect at Daimler Buses.
In addition, in non-productive areas of Daimler Trucks in Germany, a program based on socially acceptable voluntary measures ran between May 2013 and December 2014, which was continued in the third quarter of 2015 and led to a total reduction of approximately 700 jobs as of December 31, 2015.
In January 2016, Mercedes-Benz Vans initiated a socially acceptable voluntary severance program for the Düsseldorf plant. Approximately 150 severance agreements were signed in the first quarter of this year, leading to an expense of €30 million in that quarter. Total expenses of up to €0.1 billion are expected in the years 2016 through 2018.
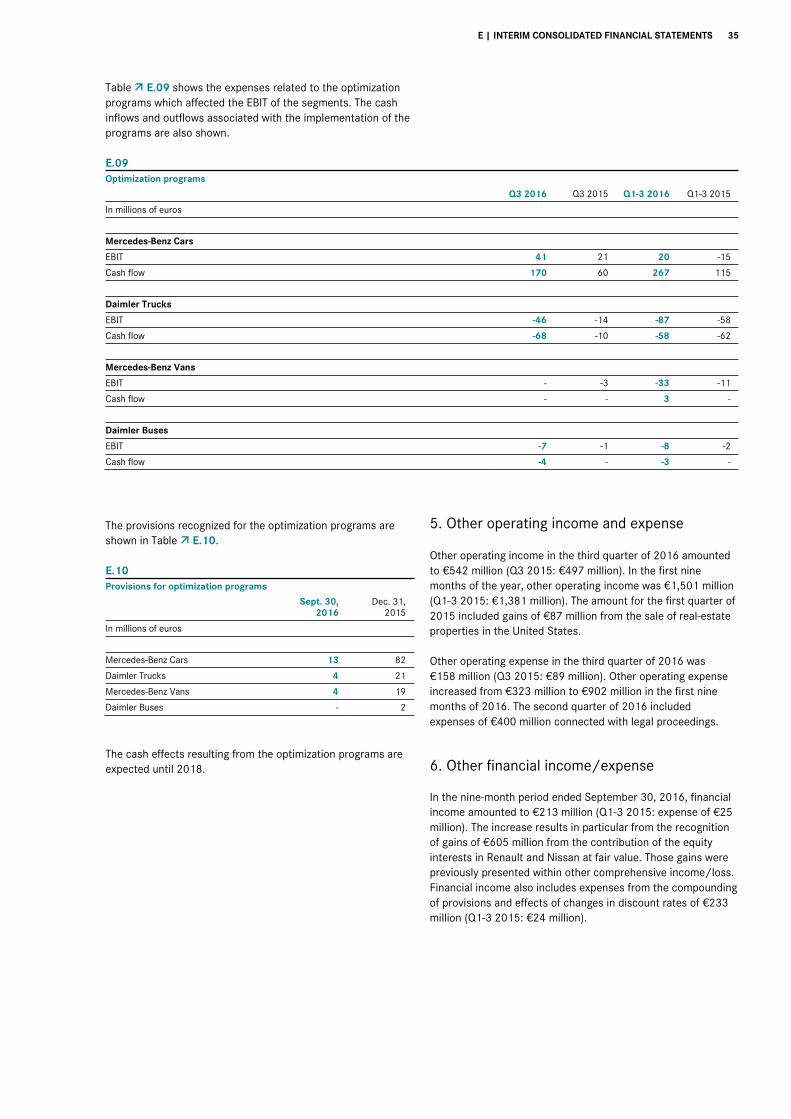
E | INTERIM CONSOLIDATED FINANCIAL STATEMENTS 35
Table E.09 shows the expenses related to the optimization programs which affected the EBIT of the segments. The cash inflows and outflows associated with the implementation of the programs are also shown.
E.09Optimization programs
Q3 2016 Q3 2015 Q1-3 2016 Q1-3 2015
In millions of euros
Mercedes-Benz Cars
EBIT 41 21 20 -15
Cash flow 170 60 267 115
Daimler Trucks
EBIT -46 -14 -87 -58
Cash flow -68 -10 -58 -62
Mercedes-Benz Vans
EBIT - -3 -33 -11
Cash flow - - 3 -
Daimler Buses
EBIT -7 -1 -8 -2
Cash flow -4 - -3 -
The provisions recognized for the optimization programs are shown in Table E.10.
E.10Provisions for optimization programs
Sept. 30,
2016 Dec. 31,
2015
In millions of euros
Mercedes-Benz Cars 13 82
Daimler Trucks 4 21
Mercedes-Benz Vans 4 19
Daimler Buses - 2
The cash effects resulting from the optimization programs are expected until 2018.
5. Other operating income and expense
Other operating income in the third quarter of 2016 amounted to €542 million (Q3 2015: €497 million). In the first nine months of the year, other operating income was €1,501 million (Q1-3 2015: €1,381 million). The amount for the first quarter of 2015 included gains of €87 million from the sale of real-estate properties in the United States.
Other operating expense in the third quarter of 2016 was €158 million (Q3 2015: €89 million). Other operating expense increased from €323 million to €902 million in the first nine months of 2016. The second quarter of 2016 included expenses of €400 million connected with legal proceedings.
6. Other financial income/expense In the nine-month period ended September 30, 2016, financial income amounted to €213 million (Q1-3 2015: expense of €25 million). The increase results in particular from the recognition of gains of €605 million from the contribution of the equity interests in Renault and Nissan at fair value. Those gains were previously presented within other comprehensive income/loss. Financial income also includes expenses from the compounding of provisions and effects of changes in discount rates of €233 million (Q1-3 2015: €24 million).
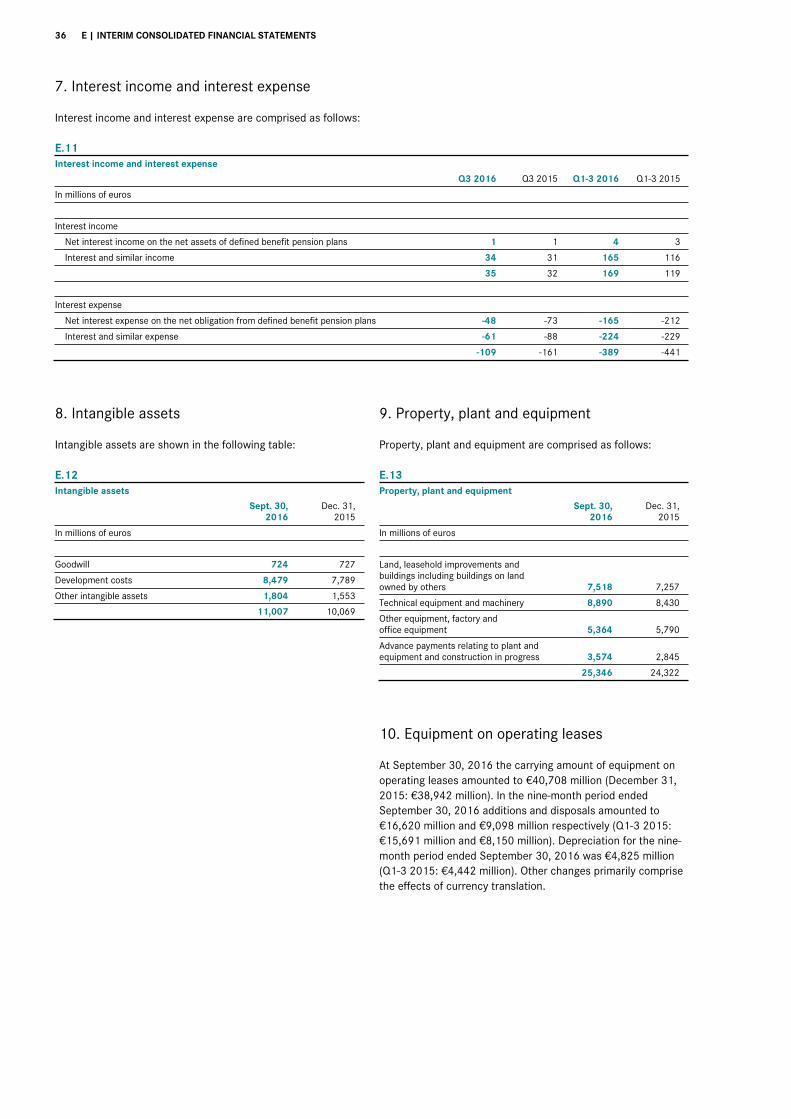
36 E | INTERIM CONSOLIDATED FINANCIAL STATEMENTS
7. Interest income and interest expense Interest income and interest expense are comprised as follows:
E.11Interest income and interest expense
Q3 2016 Q3 2015 Q1-3 2016 Q1-3 2015
In millions of euros
Interest income
Net interest income on the net assets of defined benefit pension plans 1 1 4 3
Interest and similar income 34 31 165 116
35 32 169 119
Interest expense
Net interest expense on the net obligation from defined benefit pension plans -48 -73 -165 -212
Interest and similar expense -61 -88 -224 -229
-109 -161 -389 -441
8. Intangible assets Intangible assets are shown in the following table:
E.12Intangible assets
Sept. 30,
2016 Dec. 31,
2015
In millions of euros
Goodwill 724 727
Development costs 8,479 7,789
Other intangible assets 1,804 1,553
Buchwert IVG 11,007 10,069
9. Property, plant and equipment Property, plant and equipment are comprised as follows:
E.13Property, plant and equipment
Sept. 30,
2016 Dec. 31,
2015
In millions of euros
Land, leasehold improvements and buildings including buildings on land owned by others 7,518 7,257
Technical equipment and machinery 8,890 8,430
Other equipment, factory and office equipment 5,364 5,790
Advance payments relating to plant andequipment and construction in progress 3,574 2,845
Buchwert Sachanlagen 25,346 24,322
10. Equipment on operating leases At September 30, 2016 the carrying amount of equipment on operating leases amounted to €40,708 million (December 31, 2015: €38,942 million). In the nine-month period ended September 30, 2016 additions and disposals amounted to €16,620 million and €9,098 million respectively (Q1-3 2015: €15,691 million and €8,150 million). Depreciation for the nine-month period ended September 30, 2016 was €4,825 million (Q1-3 2015: €4,442 million). Other changes primarily comprise the effects of currency translation.
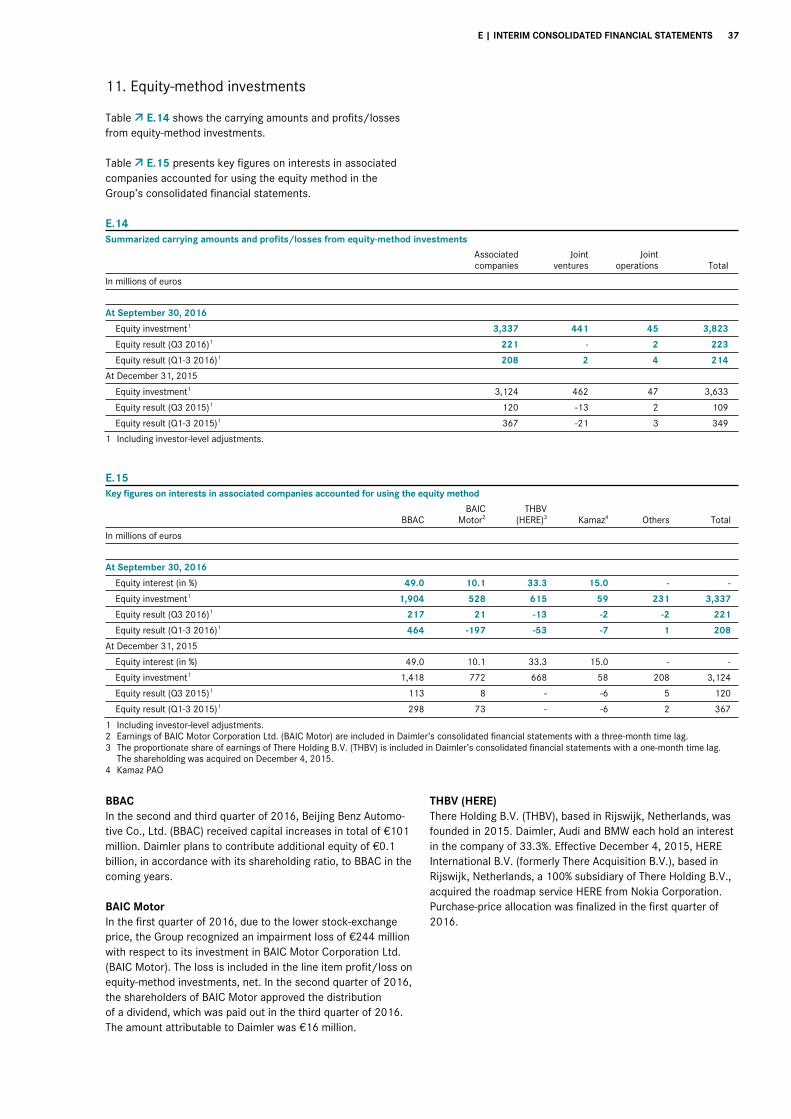
E | INTERIM CONSOLIDATED FINANCIAL STATEMENTS 37
11. Equity-method investments Table E.14 shows the carrying amounts and profits/losses from equity-method investments.
Table E.15 presents key figures on interests in associated companies accounted for using the equity method in the Group’s consolidated financial statements.
E.14Summarized carrying amounts and profits/losses from equity-method investments
Associatedcompanies
Jointventures
Jointoperations Total
In millions of euros
At September 30, 2016
Equity investment
1 3,337 441 45 3,823
Equity result (Q3 2016)
1 221 - 2 223
Equity result (Q1-3 2016)
1 208 2 4 214
At December 31, 2015
Equity investment
1 3,124 462 47 3,633
Equity result (Q3 2015)
1 120 -13 2 109
Equity result (Q1-3 2015)
1 367 -21 3 349
1 Including investor-level adjustments.
E.15Key figures on interests in associated companies accounted for using the equity method
BBAC BAIC
Motor2 THBV
(HERE)3 Kamaz4 Others Total
In millions of euros
At September 30, 2016
Equity interest (in %) 49.0 10.1 33.3 15.0 - -
Equity investment
1 1,904 528 615 59 231 3,337
Equity result (Q3 2016)
1 217 21 -13 -2 -2 221
Equity result (Q1-3 2016)
1 464 -197 -53 -7 1 208
At December 31, 2015
Equity interest (in %) 49.0 10.1 33.3 15.0 - -
Equity investment
1 1,418 772 668 58 208 3,124
Equity result (Q3 2015)
1 113 8 - -6 5 120
Equity result (Q1-3 2015)
1 298 73 - -6 2 367
1 Including investor-level adjustments. 2 Earnings of BAIC Motor Corporation Ltd. (BAIC Motor) are included in Daimler’s consolidated financial statements with a three-month time lag. 3 The proportionate share of earnings of There Holding B.V. (THBV) is included in Daimler’s consolidated financial statements with a one-month time lag.
The shareholding was acquired on December 4, 2015. 4 Kamaz PAO
BBAC In the second and third quarter of 2016, Beijing Benz Automo-tive Co., Ltd. (BBAC) received capital increases in total of €101 million. Daimler plans to contribute additional equity of €0.1 billion, in accordance with its shareholding ratio, to BBAC in the coming years.
BAIC Motor In the first quarter of 2016, due to the lower stock-exchange price, the Group recognized an impairment loss of €244 million with respect to its investment in BAIC Motor Corporation Ltd. (BAIC Motor). The loss is included in the line item profit/loss on equity-method investments, net. In the second quarter of 2016, the shareholders of BAIC Motor approved the distribution of a dividend, which was paid out in the third quarter of 2016. The amount attributable to Daimler was €16 million.
THBV (HERE) There Holding B.V. (THBV), based in Rijswijk, Netherlands, was founded in 2015. Daimler, Audi and BMW each hold an interest in the company of 33.3%. Effective December 4, 2015, HERE International B.V. (formerly There Acquisition B.V.), based in Rijswijk, Netherlands, a 100% subsidiary of There Holding B.V., acquired the roadmap service HERE from Nokia Corporation. Purchase-price allocation was finalized in the first quarter of 2016.
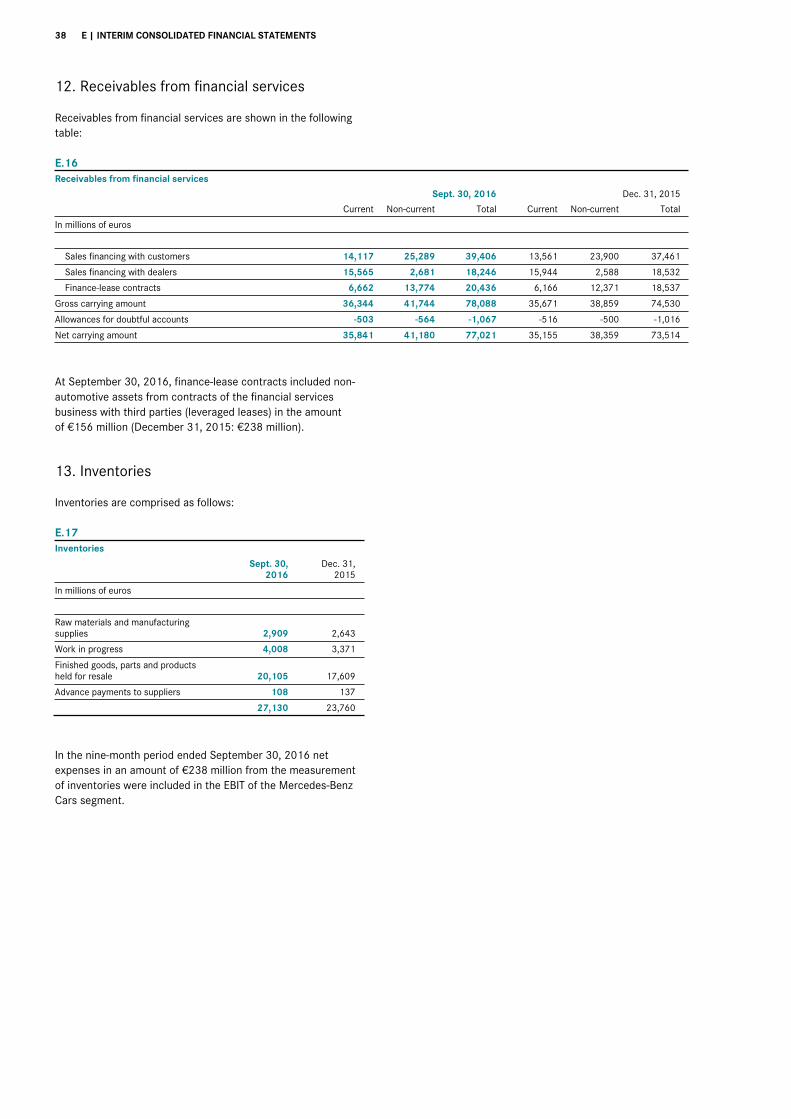
38 E | INTERIM CONSOLIDATED FINANCIAL STATEMENTS
12. Receivables from financial services Receivables from financial services are shown in the following table:
E.16Receivables from financial services
Sept. 30, 2016 Dec. 31, 2015
Current Non-current Total Current Non-current Total
In millions of euros
Sales financing with customers 14,117 25,289 39,406 13,561 23,900 37,461
Sales financing with dealers 15,565 2,681 18,246 15,944 2,588 18,532
Finance-lease contracts 6,662 13,774 20,436 6,166 12,371 18,537
Gross carrying amount 36,344 41,744 78,088 35,671 38,859 74,530
Allowances for doubtful accounts -503 -564 -1,067 -516 -500 -1,016
Net carrying amount 35,841 41,180 77,021 35,155 38,359 73,514
At September 30, 2016, finance-lease contracts included non-automotive assets from contracts of the financial services business with third parties (leveraged leases) in the amount of €156 million (December 31, 2015: €238 million). 13. Inventories Inventories are comprised as follows:
E.17Inventories
Sept. 30,
2016 Dec. 31,
2015
In millions of euros
Raw materials and manufacturing supplies 2,909 2,643
Work in progress 4,008 3,371
Finished goods, parts and products held for resale 20,105 17,609
Advance payments to suppliers 108 137
Buchwert Vorräte 27,130 23,760
In the nine-month period ended September 30, 2016 net expenses in an amount of €238 million from the measurement of inventories were included in the EBIT of the Mercedes-Benz Cars segment.
E | INTERIM CONSOLIDATED FINANCIAL STATEMENTS 39
14. Equity Conditional capital The resolution of the Annual Shareholders’ Meeting on April 14, 2010 authorizing the Company until April 13, 2015 to issue convertible and/or warrant bonds, which had not been utilized, was replaced by a new authorization of the Annual Sharehold-ers’ Meeting on April 1, 2015. This authorizes the Board of Management, with the consent of the Supervisory Board, until March 31, 2020 to issue convertible and/or warrant bonds or a combination of these instruments (“bonds”) with a total face value of up to €10.0 billion and a maturity of no more than ten years. The Board of Management is allowed to grant the holders of these bonds conversion or warrant rights for new registered no-par-value shares in Daimler AG with an allocable portion of the share capital of up to €500 million in accordance with the details defined in the terms and conditions of the bonds. The bonds can be offered in exchange for cash and/or non-cash contributions, in particular for shares in other companies. The terms and conditions of the bonds can include warranty obligations or conversion obligations. The bonds can be issued once or several times, wholly or in installments, or simultane-ously in various tranches, as well by affiliates of the Company within the meaning of Sections 15 et seq. of the German Stock Corporation Act (AktG). Among other things, the Board of Man-agement was authorized to exclude shareholders’ subscription rights for the bonds under certain conditions and within defined constraints with the consent of the Supervisory Board.
In order to fulfill the conditions of the above-mentioned authori-zation, the Annual Shareholders’ Meeting on April 1, 2015 also resolved to increase the share capital conditionally by an amount of up to €500 million (Conditional Capital 2015). Conditional Capital 2010 has been canceled.
Treasury shares The authorization resolved by the Annual Meeting on April 14, 2010 to acquire treasury shares including the authorization to use derivative financial instruments in this context until April 13, 2015 was canceled by resolution of the Annual Sharehold-ers’ Meeting held on April 1, 2015 and replaced by a new au-thorization. This authorizes the Company until March 31, 2020 to acquire treasury shares in a volume up to 10% of the share capital issued as of the day of the resolution to be used for all legal purposes. The shares can be used, amongst other things, excluding shareholders’ subscription rights for business combi-nations or to acquire companies or to be sold to third parties for cash at a price that is not significantly lower than the stock-exchange price of the Company’s shares. The acquired shares can also be used to fulfill obligations from issued convertible bonds and/or bonds with warrants and to be issued to employ-ees of the Company and employees and board members of the Company’s affiliates pursuant to Sections 15 et seq. of the German Stock Corporation Act (AktG). The treasury shares can also be canceled.
The Board of Management is further authorized, with the con-sent of the Supervisory Board, to exclude shareholders’ sub-scription rights in other defined cases. In a volume up to 5% of the share capital issued as of the day of the resolution of the Annual Shareholders’ Meeting, the Company was also author-ized to acquire treasury shares also by using derivatives (put options, call options, forward purchases or a combination of these instruments), whereas the term of a derivative must not exceed 18 months and must not end later than March 31, 2020.
Employee share purchase plan In the first quarter of 2016, 0.6 million (2015: 0.3 million) Daimler shares were purchased and reissued to employees in connection with employee share purchase plans.
Dividend The Annual Shareholders’ Meeting held on April 6, 2016 authorized Daimler to pay a dividend of €3,477 million (€3.25 per share) from the distributable profit of Daimler AG (separate financial statements) for the year 2015 (2015: €2,621 million and €2.45 per share). The dividend was paid out on April 7, 2016.
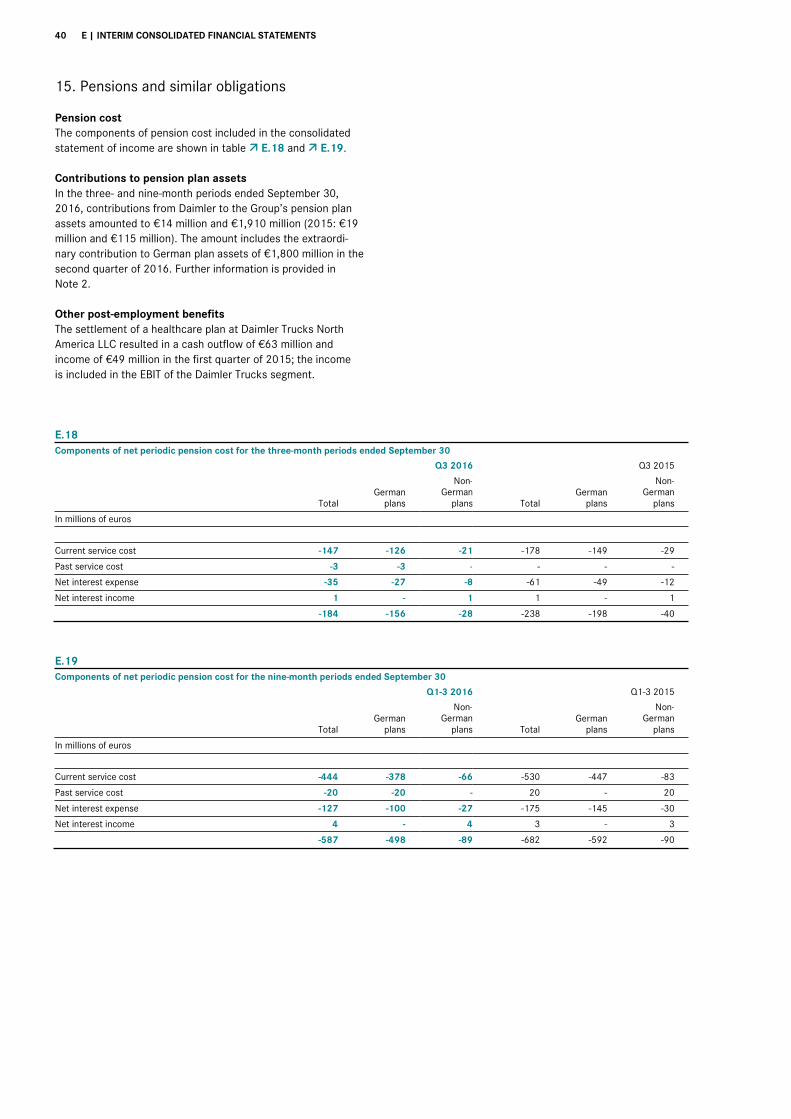
40 E | INTERIM CONSOLIDATED FINANCIAL STATEMENTS
15. Pensions and similar obligations Pension cost The components of pension cost included in the consolidated statement of income are shown in table E.18 and E.19.
Contributions to pension plan assets In the three- and nine-month periods ended September 30, 2016, contributions from Daimler to the Group’s pension plan assets amounted to €14 million and €1,910 million (2015: €19 million and €115 million). The amount includes the extraordi-nary contribution to German plan assets of €1,800 million in the second quarter of 2016. Further information is provided in Note 2.
Other post-employment benefits The settlement of a healthcare plan at Daimler Trucks North America LLC resulted in a cash outflow of €63 million and income of €49 million in the first quarter of 2015; the income is included in the EBIT of the Daimler Trucks segment.
E.18Components of net periodic pension cost for the three-month periods ended September 30
Q3 2016 Q3 2015
TotalGerman
plans
Non-German
plans Total German
plans
Non-German
plans
In millions of euros
Current service cost -147 -126 -21 -178 -149 -29
Past service cost -3 -3 - - - -
Net interest expense -35 -27 -8 -61 -49 -12
Net interest income 1 - 1 1 - 1
-184 -156 -28 -238 -198 -40
E.19Components of net periodic pension cost for the nine-month periods ended September 30
Q1-3 2016 Q1-3 2015
TotalGerman
plans
Non-German
plans Total German
plans
Non-German
plans
In millions of euros
Current service cost -444 -378 -66 -530 -447 -83
Past service cost -20 -20 - 20 - 20
Net interest expense -127 -100 -27 -175 -145 -30
Net interest income 4 - 4 3 - 3
-587 -498 -89 -682 -592 -90
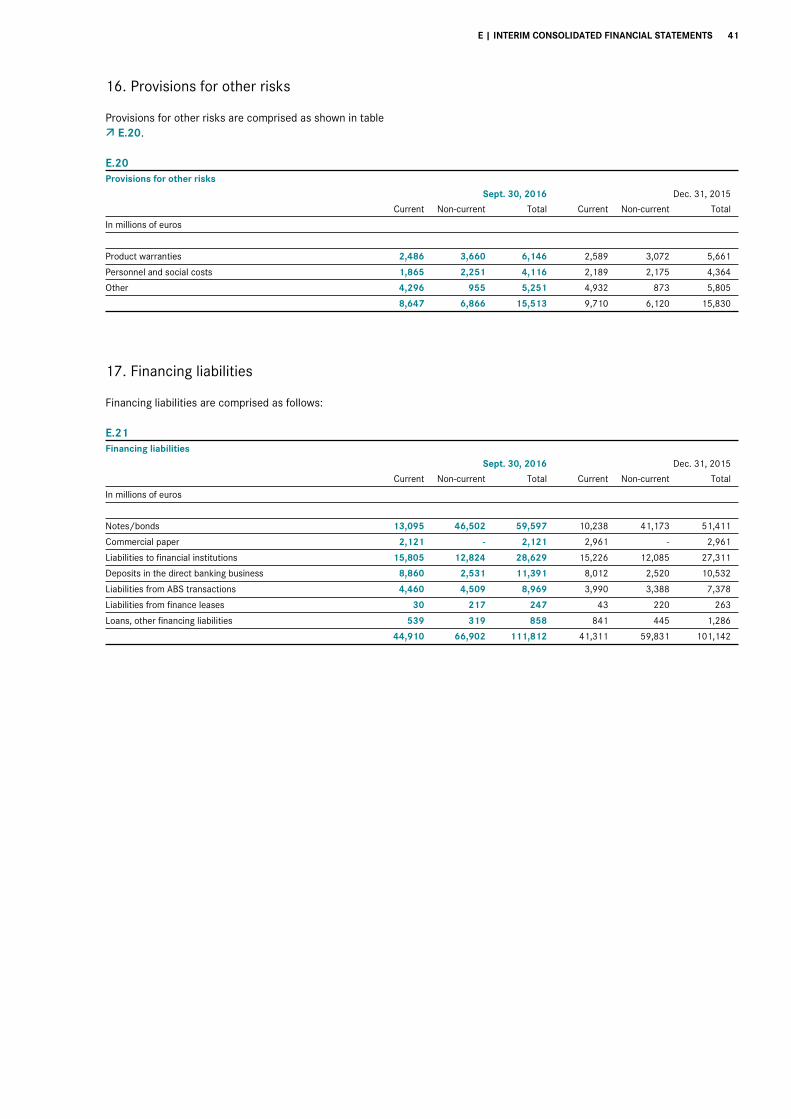
E | INTERIM CONSOLIDATED FINANCIAL STATEMENTS 41
16. Provisions for other risks Provisions for other risks are comprised as shown in table
E.20.
E.20Provisions for other risks
Sept. 30, 2016 Dec. 31, 2015
Current Non-current Total Current Non-current Total
In millions of euros
Product warranties 2,486 3,660 6,146 2,589 3,072 5,661
Personnel and social costs 1,865 2,251 4,116 2,189 2,175 4,364
Other 4,296 955 5,251 4,932 873 5,805
8,647 6,866 15,513 9,710 6,120 15,830
17. Financing liabilities Financing liabilities are comprised as follows:
E.21
Financing liabilities
Sept. 30, 2016 Dec. 31, 2015
Current Non-current Total Current Non-current Total
In millions of euros
Notes/bonds 13,095 46,502 59,597 10,238 41,173 51,411
Commercial paper 2,121 - 2,121 2,961 - 2,961
Liabilities to financial institutions 15,805 12,824 28,629 15,226 12,085 27,311
Deposits in the direct banking business 8,860 2,531 11,391 8,012 2,520 10,532
Liabilities from ABS transactions 4,460 4,509 8,969 3,990 3,388 7,378
Liabilities from finance leases 30 217 247 43 220 263
Loans, other financing liabilities 539 319 858 841 445 1,286
44,910 66,902 111,812 41,311 59,831 101,142
42 E | INTERIM CONSOLIDATED FINANCIAL STATEMENTS
18. Legal proceedings In the second quarter of 2016, expenses of €400 million were recognized in connection with legal proceedings. In accordance with IAS 37.92, no further information is disclosed on these expenses.
Since the beginning of 2016, several consumer class-action lawsuits against MBUSA have been filed in federal courts of various US states. The main allegation is the use of devices that impermissibly impair the effectiveness of emission control systems in reducing nitrogen-oxide (NOx) emissions and which cause excessive emissions from vehicles with diesel engines. In addition, plaintiffs allege that consumers were deliberately deceived in connection with the advertising of Mercedes-Benz diesel vehicles. The US consumer class actions have all been consolidated into one class action pending against Daimler AG and MBUSA in the US District Court for the District of New Jersey, in which the plaintiffs are seeking monetary relief on behalf of a nationwide class of all persons or entities who owned or leased certain models of Mercedes-Benz diesel vehi-cles as of February 18, 2016. Another consumer class-action lawsuit against Daimler AG and other companies of the Group containing similar allegations was filed in Canada in April 2016. Daimler regards the lawsuits as without merit, and will defend vigorously against the claims.
In addition, several authorities, including in Europe and the United States have inquired about test results and the emission control systems used in Mercedes-Benz diesel vehicles and related legal implications, e.g. under applicable securities laws. These authorities include, among others, the U.S. Department of Justice (DOJ), the U.S. Environmental Protection Agency (EPA) and the California Air Resources Board (CARB), whereas in April 2016, the DOJ requested that Daimler AG review its certification and admissions processes related to exhaust emis-sions in the United States by way of an internal investigation in cooperation with the DOJ. Daimler has agreed to cooperate fully with the DOJ and the other authorities. These inquiries and Daimler’s internal investigation are ongoing.
In late August 2016, Mercedes-Benz Canada (“MBC”) was added as a defendant to a putative nationwide class action pending in Ontario Superior Court. The main allegation is that MB Canada, along with Takata entities as well as many other companies who sold vehicles with Takata airbag inflators installed in them, was allegedly negligent in selling such vehicles, purportedly not recalling them quickly enough, and continuing to not be able to provide an allegedly adequate new airbag inflator. Daimler AG regards these cases as without merit, and MB Canada will defend vigorously against the claims.
On June 23, 2016 the German Federal Cartel Office carried out dawn raids at several car manufacturers and suppliers, including Daimler AG, with regard to steel purchasing. Daimler is cooperating in full with the authority. It is not possible to provide further details at the moment.
In a settlement decision adopted on July 19, 2016, the Europe-an Commission concluded the trucks antitrust proceedings against Daimler AG and other truck manufacturers that com-menced in 2011. The European Commission imposed a fine on Daimler AG in the amount of €1,009 million which has, in the meantime, been paid. During the entire proceedings, Daimler AG cooperated closely with the authorities and the European Commission took into account the company’s cooperation by reducing the fine imposed. Daimler had recognized a provision for the fine.
19. Contingent liabilities In connection with the industry-wide problems with Takata airbags and as of a result of regulatory recalls of Mercedes-Benz vehicles provisions for warranty expenses in that context were recognized. Additional charges on earnings cannot be ruled out. Further disclosure pursuant to IAS 37.86 cannot be made at present due to the ongoing technical investigations and consul-tations with the relevant authorities.
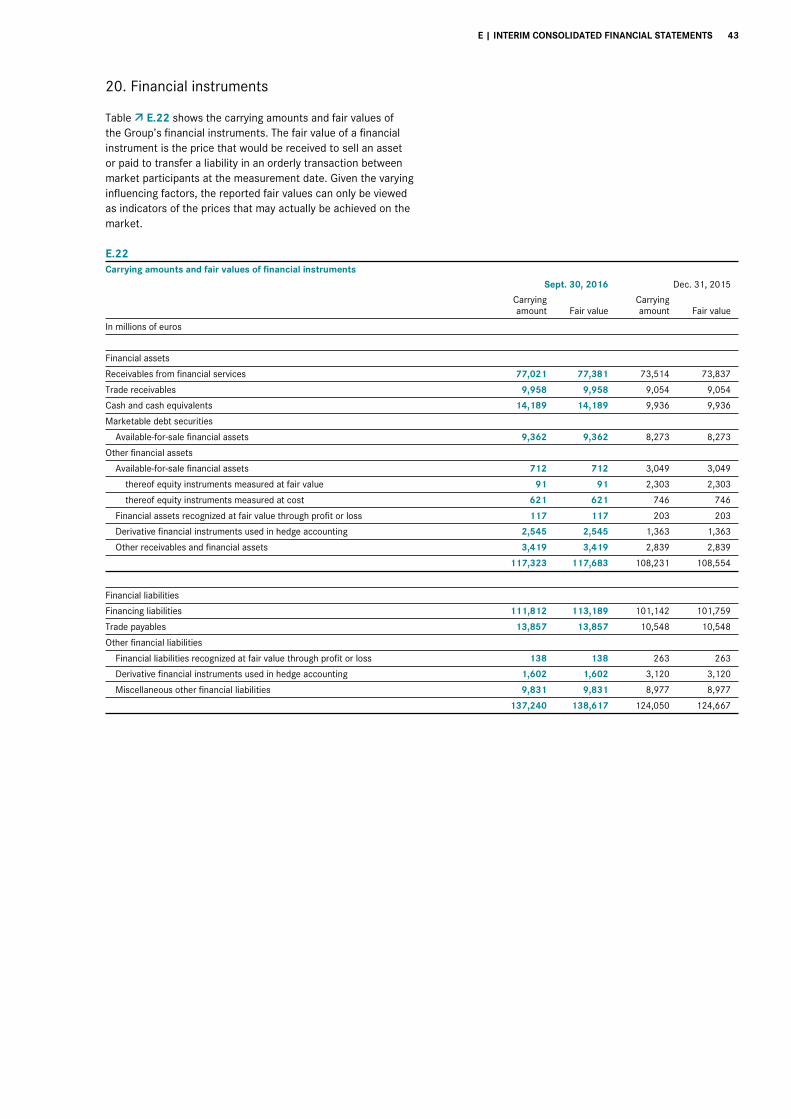
E | INTERIM CONSOLIDATED FINANCIAL STATEMENTS 43
20. Financial instruments Table E.22 shows the carrying amounts and fair values of the Group’s financial instruments. The fair value of a financial instrument is the price that would be received to sell an asset or paid to transfer a liability in an orderly transaction between market participants at the measurement date. Given the varying influencing factors, the reported fair values can only be viewed as indicators of the prices that may actually be achieved on the market.
E.22Carrying amounts and fair values of financial instruments
Sept. 30, 2016 Dec. 31, 2015
Carryingamount Fair value
Carryingamount Fair value
In millions of euros
Financial assets
Receivables from financial services 77,021 77,381 73,514 73,837
Trade receivables 9,958 9,958 9,054 9,054
Cash and cash equivalents 14,189 14,189 9,936 9,936
Marketable debt securities
Available-for-sale financial assets 9,362 9,362 8,273 8,273
Other financial assets
Available-for-sale financial assets 712 712 3,049 3,049
thereof equity instruments measured at fair value 91 91 2,303 2,303
thereof equity instruments measured at cost 621 621 746 746
Financial assets recognized at fair value through profit or loss 117 117 203 203
Derivative financial instruments used in hedge accounting 2,545 2,545 1,363 1,363
Other receivables and financial assets 3,419 3,419 2,839 2,839
117,323 117,683 108,231 108,554
Financial liabilities
Financing liabilities 111,812 113,189 101,142 101,759
Trade payables 13,857 13,857 10,548 10,548
Other financial liabilities
Financial liabilities recognized at fair value through profit or loss 138 138 263 263
Derivative financial instruments used in hedge accounting 1,602 1,602 3,120 3,120
Miscellaneous other financial liabilities 9,831 9,831 8,977 8,977
137,240 138,617 124,050 124,667
44 E | INTERIM CONSOLIDATED FINANCIAL STATEMENTS
The fair values of financial instruments were calculated on the basis of market information available on the balance sheet date. The following methods and premises were used:
Marketable debt securities, other financial assets and liabilities Financial assets available for sale include: − debt and equity instruments measured at fair value; these
instruments were measured using quoted market prices at September 30, 2016. Otherwise, the fair value measurement of these debt and equity instruments is based on inputs that are either directly or indirectly observable in active markets. Until June 30, 2016, equity instruments measured at fair value predominantly comprised the investments in Renault and Nissan (see Note 2).
− equity interests measured at cost; fair values could not be determined for these financial instruments because no stock exchange or market prices are available. These equity inter-ests comprise investments in non-listed companies for which no objective evidence existed at the balance sheet date that these assets were impaired and whose fair values cannot be determined with sufficient reliability. It is assumed that the fair values approximate the carrying amounts. Daimler does not intend to sell the equity interests which are presented at September 30, 2016.
Financial assets and liabilities recognized at fair value through profit or loss include derivative financial instruments not used in hedge accounting. These financial instruments as well as derivative financial instruments used in hedge accounting comprise: − derivative currency hedging contracts; the fair values of
cross-currency interest rate swaps are determined on the basis of the discounted estimated future cash flows using market interest rates appropriate to the remaining terms of the financial instruments. The valuation of currency forwards is based on market quotes of forward curves; currency options were measured using price quotations or option pricing models using market data.
− derivative interest rate hedging contracts; the fair values of interest rate hedging instruments (e.g. interest rate swaps) are calculated on the basis of the discounted estimated future cash flows using the market interest rates appropriate to the remaining terms of the financial instruments.
− derivative commodity hedging contracts; the fair values of commodity hedging contracts (e.g. commodity forwards) are determined on the basis of current reference prices with consideration of forward premiums and discounts.
Table E.23 provides an overview of the classification into measurement hierarchies of financial assets and liabilities measured at fair value (according to IFRS 13).
At the end of each reporting period, Daimler reviews the neces-sity for reclassification between the fair value hierarchies.
For the determination of the credit risk from derivative financial instruments which are allocated to the Level 2 fair value hierar-chy, we apply the exception described in IFRS 13.48 (portfolios managed on the basis of net exposure).

E | INTERIM CONSOLIDATED FINANCIAL STATEMENTS 45
E.23Measurement hierarchy of financial assets and liabilities measured at fair value
Sept. 30, 2016 Dec. 31, 2015
Total Level 11 Level 22 Level 33 Total Level 11 Level 22 Level 33
In millions of euros
Financial assets measured at fair value
Financial assets available for sale 9,453 5,045 4,408 - 10,576 6,976 3,600 -
thereof equity instruments measured at fair value 91 82 9 - 2,303 2,297 6 -
thereof marketable debt securities 9,362 4,963 4,399 - 8,273 4,679 3,594 -
Financial assets recognized at fair value through profit or loss 117 - 117 - 203 - 203 -
Derivative financial instruments used in hedge accounting 2,545 - 2,545 - 1,363 - 1,363 -
12,115 5,045 7,070 - 12,142 6,976 5,166 -
Financial liabilities measured at fair value
Financial liabilities recognized at fair value through profit and loss 138 - 138 - 263 - 263 -
Derivative financial instruments used in hedge accounting 1,602 - 1,602 - 3,120 - 3,120 -
1,740 - 1,740 - 3,383 - 3,383 -
1 Fair value measurement based on quoted prices (unadjusted) in active markets for these or identical assets or liabilities. 2 Fair value measurement based on inputs that are observable in active markets either directly (i.e. as prices) or indirectly (i.e. derived from prices). 3 Fair value measurement based on inputs for which no observable market data is available.
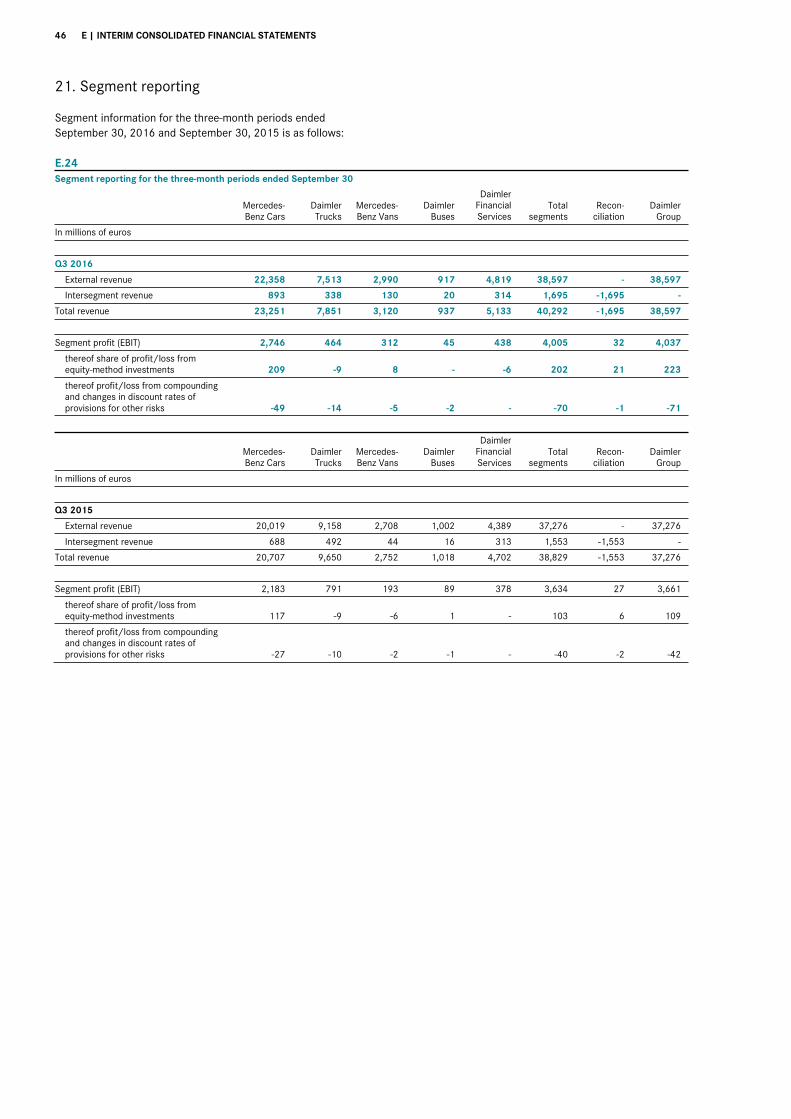
46 E | INTERIM CONSOLIDATED FINANCIAL STATEMENTS
21. Segment reporting Segment information for the three-month periods ended September 30, 2016 and September 30, 2015 is as follows:
E.24
Segment reporting for the three-month periods ended September 30
Mercedes- Benz Cars
DaimlerTrucks
Mercedes-Benz Vans
Daimler Buses
Daimler Financial Services
Totalsegments
Recon-ciliation
DaimlerGroup
In millions of euros
Q3 2016
External revenue 22,358 7,513 2,990 917 4,819 38,597 - 38,597
Intersegment revenue 893 338 130 20 314 1,695 -1,695 -
Total revenue 23,251 7,851 3,120 937 5,133 40,292 -1,695 38,597
Segment profit (EBIT) 2,746 464 312 45 438 4,005 32 4,037
thereof share of profit/loss from equity-method investments 209 -9 8 - -6 202 21 223
thereof profit/loss from compounding and changes in discount rates of provisions for other risks -49 -14 -5 -2 - -70 -1 -71
Mercedes- Benz Cars
DaimlerTrucks
Mercedes-Benz Vans
Daimler Buses
Daimler Financial Services
Totalsegments
Recon-ciliation
DaimlerGroup
In millions of euros
Q3 2015
External revenue 20,019 9,158 2,708 1,002 4,389 37,276 - 37,276
Intersegment revenue 688 492 44 16 313 1,553 -1,553 -
Total revenue 20,707 9,650 2,752 1,018 4,702 38,829 -1,553 37,276
Segment profit (EBIT) 2,183 791 193 89 378 3,634 27 3,661
thereof share of profit/loss from equity-method investments 117 -9 -6 1 - 103 6 109
thereof profit/loss from compounding and changes in discount rates of provisions for other risks -27 -10 -2 -1 - -40 -2 -42
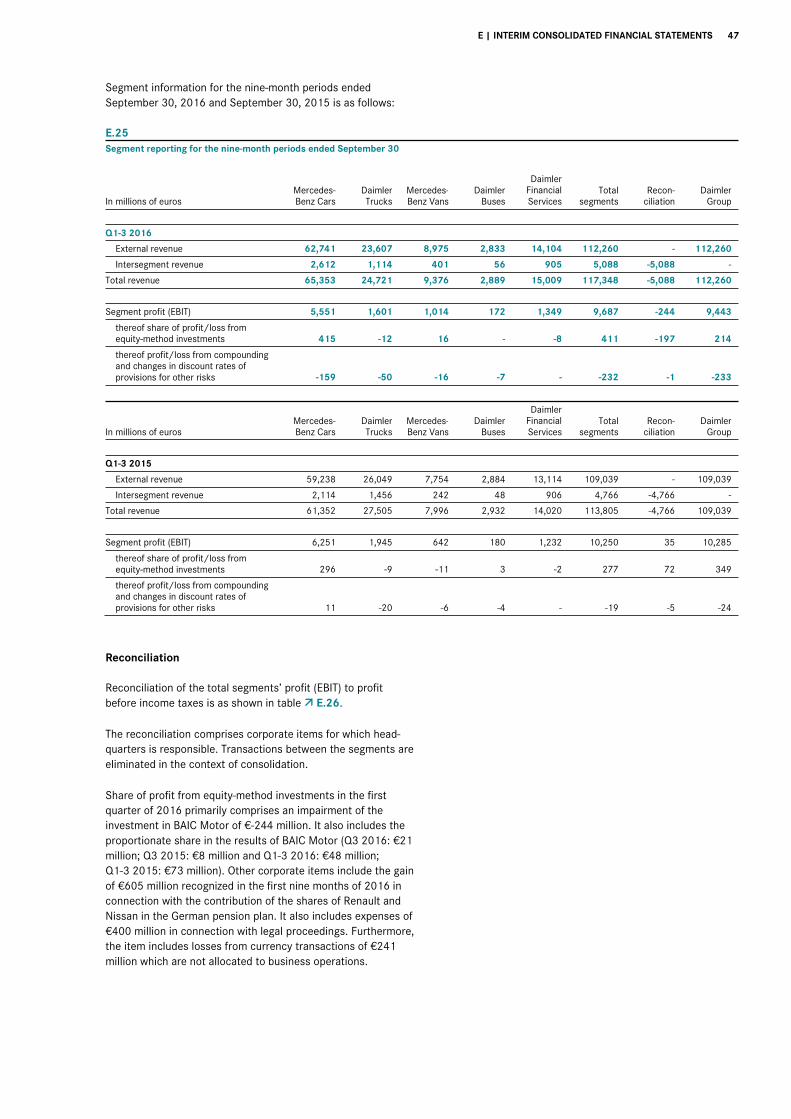
E | INTERIM CONSOLIDATED FINANCIAL STATEMENTS 47
Segment information for the nine-month periods ended September 30, 2016 and September 30, 2015 is as follows:
E.25
Segment reporting for the nine-month periods ended September 30
In millions of euros Mercedes- Benz Cars
DaimlerTrucks
Mercedes-Benz Vans
Daimler Buses
Daimler Financial Services
Totalsegments
Recon-ciliation
DaimlerGroup
Q1-3 2016
External revenue 62,741 23,607 8,975 2,833 14,104 112,260 - 112,260
Intersegment revenue 2,612 1,114 401 56 905 5,088 -5,088 -
Total revenue 65,353 24,721 9,376 2,889 15,009 117,348 -5,088 112,260
Segment profit (EBIT) 5,551 1,601 1,014 172 1,349 9,687 -244 9,443
thereof share of profit/loss from equity-method investments 415 -12 16 - -8 411 -197 214
thereof profit/loss from compounding and changes in discount rates of provisions for other risks -159 -50 -16 -7 - -232 -1 -233
In millions of euros Mercedes- Benz Cars
DaimlerTrucks
Mercedes-Benz Vans
Daimler Buses
Daimler Financial Services
Totalsegments
Recon-ciliation
DaimlerGroup
Q1-3 2015
External revenue 59,238 26,049 7,754 2,884 13,114 109,039 - 109,039
Intersegment revenue 2,114 1,456 242 48 906 4,766 -4,766 -
Total revenue 61,352 27,505 7,996 2,932 14,020 113,805 -4,766 109,039
Segment profit (EBIT) 6,251 1,945 642 180 1,232 10,250 35 10,285
thereof share of profit/loss from equity-method investments 296 -9 -11 3 -2 277 72 349
thereof profit/loss from compounding and changes in discount rates of provisions for other risks 11 -20 -6 -4 - -19 -5 -24
Reconciliation
Reconciliation of the total segments’ profit (EBIT) to profit before income taxes is as shown in table E.26.
The reconciliation comprises corporate items for which head-quarters is responsible. Transactions between the segments are eliminated in the context of consolidation.
Share of profit from equity-method investments in the first quarter of 2016 primarily comprises an impairment of the investment in BAIC Motor of €-244 million. It also includes the proportionate share in the results of BAIC Motor (Q3 2016: €21 million; Q3 2015: €8 million and Q1-3 2016: €48 million; Q1-3 2015: €73 million). Other corporate items include the gain of €605 million recognized in the first nine months of 2016 in connection with the contribution of the shares of Renault and Nissan in the German pension plan. It also includes expenses of €400 million in connection with legal proceedings. Furthermore, the item includes losses from currency transactions of €241 million which are not allocated to business operations.
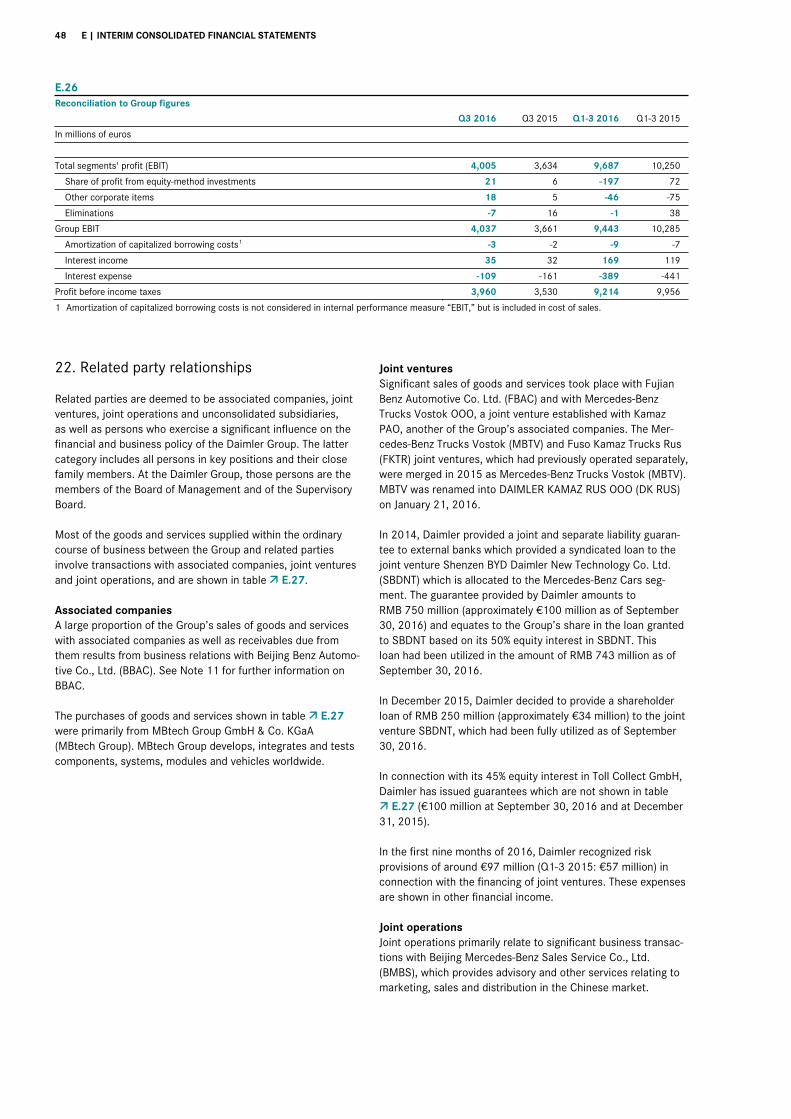
48 E | INTERIM CONSOLIDATED FINANCIAL STATEMENTS
E.26Reconciliation to Group figures
Q3 2016 Q3 2015 Q1-3 2016 Q1-3 2015
In millions of euros
Total segments' profit (EBIT) 4,005 3,634 9,687 10,250
Share of profit from equity-method investments 21 6 -197 72
Other corporate items 18 5 -46 -75
Eliminations -7 16 -1 38
Group EBIT 4,037 3,661 9,443 10,285
Amortization of capitalized borrowing costs
1 -3 -2 -9 -7
Interest income 35 32 169 119
Interest expense -109 -161 -389 -441
Profit before income taxes 3,960 3,530 9,214 9,956
1 Amortization of capitalized borrowing costs is not considered in internal performance measure “EBIT,” but is included in cost of sales.
22. Related party relationships Related parties are deemed to be associated companies, joint ventures, joint operations and unconsolidated subsidiaries, as well as persons who exercise a significant influence on the financial and business policy of the Daimler Group. The latter category includes all persons in key positions and their close family members. At the Daimler Group, those persons are the members of the Board of Management and of the Supervisory Board.
Most of the goods and services supplied within the ordinary course of business between the Group and related parties involve transactions with associated companies, joint ventures and joint operations, and are shown in table E.27.
Associated companies A large proportion of the Group’s sales of goods and services with associated companies as well as receivables due from them results from business relations with Beijing Benz Automo-tive Co., Ltd. (BBAC). See Note 11 for further information on BBAC.
The purchases of goods and services shown in table E.27 were primarily from MBtech Group GmbH & Co. KGaA (MBtech Group). MBtech Group develops, integrates and tests components, systems, modules and vehicles worldwide.
Joint ventures Significant sales of goods and services took place with Fujian Benz Automotive Co. Ltd. (FBAC) and with Mercedes-Benz Trucks Vostok OOO, a joint venture established with Kamaz PAO, another of the Group’s associated companies. The Mer-cedes-Benz Trucks Vostok (MBTV) and Fuso Kamaz Trucks Rus (FKTR) joint ventures, which had previously operated separately, were merged in 2015 as Mercedes-Benz Trucks Vostok (MBTV). MBTV was renamed into DAIMLER KAMAZ RUS OOO (DK RUS) on January 21, 2016.
In 2014, Daimler provided a joint and separate liability guaran-tee to external banks which provided a syndicated loan to the joint venture Shenzen BYD Daimler New Technology Co. Ltd. (SBDNT) which is allocated to the Mercedes-Benz Cars seg-ment. The guarantee provided by Daimler amounts to RMB 750 million (approximately €100 million as of September 30, 2016) and equates to the Group’s share in the loan granted to SBDNT based on its 50% equity interest in SBDNT. This loan had been utilized in the amount of RMB 743 million as of September 30, 2016.
In December 2015, Daimler decided to provide a shareholder loan of RMB 250 million (approximately €34 million) to the joint venture SBDNT, which had been fully utilized as of September 30, 2016.
In connection with its 45% equity interest in Toll Collect GmbH, Daimler has issued guarantees which are not shown in table
E.27 (€100 million at September 30, 2016 and at December 31, 2015).
In the first nine months of 2016, Daimler recognized risk provisions of around €97 million (Q1-3 2015: €57 million) in connection with the financing of joint ventures. These expenses are shown in other financial income.
Joint operations Joint operations primarily relate to significant business transac-tions with Beijing Mercedes-Benz Sales Service Co., Ltd. (BMBS), which provides advisory and other services relating to marketing, sales and distribution in the Chinese market.
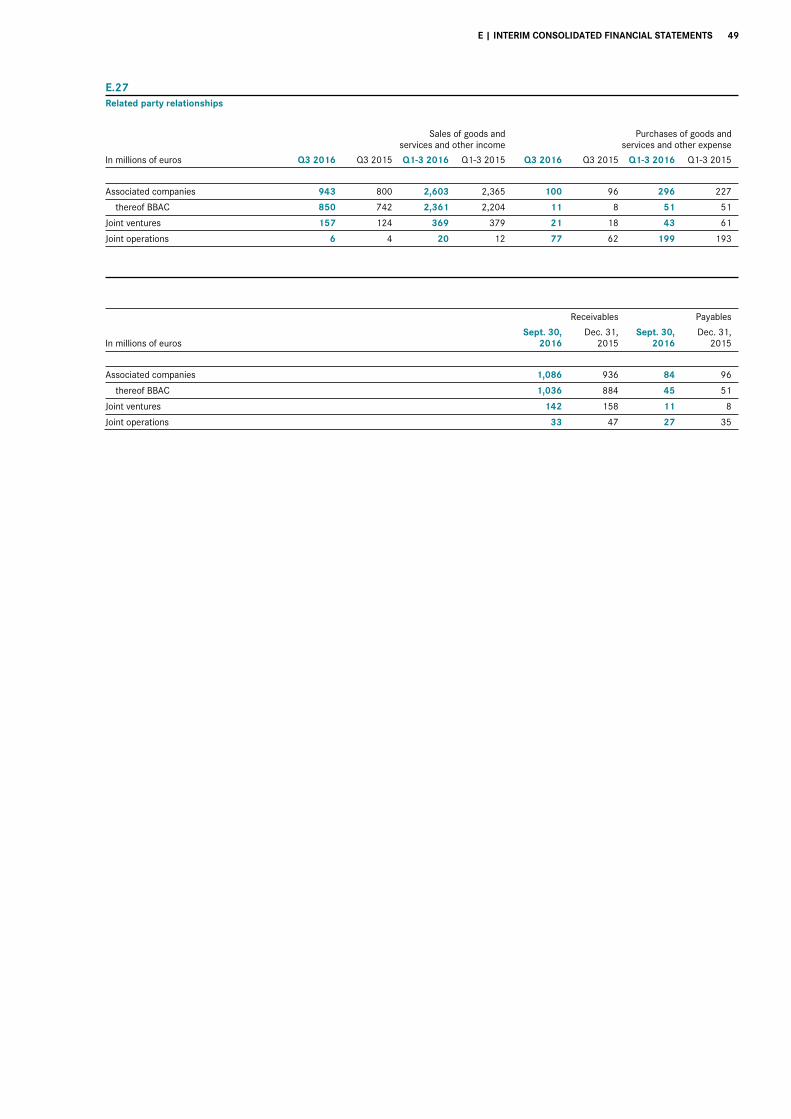
E | INTERIM CONSOLIDATED FINANCIAL STATEMENTS 49
E.27Related party relationships
Sales of goods and
services and other income Purchases of goods and
services and other expense
In millions of euros Q3 2016 Q3 2015 Q1-3 2016 Q1-3 2015 Q3 2016 Q3 2015 Q1-3 2016 Q1-3 2015
Associated companies 943 800 2,603 2,365 100 96 296 227
thereof BBAC 850 742 2,361 2,204 11 8 51 51
Joint ventures 157 124 369 379 21 18 43 61
Joint operations 6 4 20 12 77 62 199 193
Receivables Payables
In millions of euros Sept. 30,
2016 Dec. 31,
2015 Sept. 30,
2016 Dec. 31,
2015
Associated companies 1,086 936 84 96
thereof BBAC 1,036 884 45 51
Joint ventures 142 158 11 8
Joint operations 33 47 27 35
50 E | INTERIM CONSOLIDATED FINANCIAL STATEMENTS
Auditor’s Review Report
To the Supervisory Board of Daimler AG, Stuttgart
We have reviewed the condensed interim consolidated financial statements of Daimler AG, Stuttgart, comprising – the consoli-dated statement of income/loss, consolidated statement of comprehensive income/loss, consolidated statement of finan-cial position, consolidated statement of changes in equity, consolidated statement of cash flows and selected, explanatory notes – together with the interim group management report of Daimler AG, for the period from January 1 to September 30, 2016, that are part of the quarterly financial report according to § 37 w WpHG (“Wertpapierhandelsgesetz”: “German Securities Trading Act”). The preparation of the condensed interim consol-idated financial statements in accordance with those IFRS applicable to interim financial reporting as adopted by the EU, and of the interim group management report in accordance with the requirements of the WpHG applicable to interim group management reports, is the responsibility of the Company’s management. Our responsibility is to issue a report on the condensed interim consolidated financial statements and on the interim group management report based on our review.
We performed our review of the condensed interim consolidat-ed financial statements and the interim group management report in accordance with the German generally accepted standards for the review of financial statements promulgated by the Institut der Wirtschaftsprüfer (IDW). Those standards require that we plan and perform the review so that we can preclude through critical evaluation, with a certain level of assur-ance, that the condensed interim consolidated financial state-ments have not been prepared, in material respects, in accord-ance with the IFRS applicable to interim financial reporting as adopted by the EU, and that the interim group management report has not been prepared, in material respects, in accord-ance with the requirements of the WpHG applicable to interim group management reports. A review is limited primarily to inquiries of company employees and analytical assessments and therefore does not provide the assurance attainable in a financial statement audit. Since, in accordance with our engagement, we have not performed a financial statement audit, we cannot issue an auditor’s report.
Based on our review, no matters have come to our attention that cause us to presume that the condensed interim consoli-dated financial statements have not been prepared, in material respects, in accordance with the IFRS applicable to interim financial reporting as adopted by the EU, or that the interim group management report has not been prepared, in material respects, in accordance with the requirements of the WpHG applicable to interim group management reports.
Stuttgart, October 20, 2016
KPMG AG Wirtschaftsprüfungsgesellschaft
Becker Dr. Thümler Wirtschaftsprüfer Wirtschaftsprüfer
Addresses | Information
Investor Relations Telephone +49 711 17 92261 17 97778 17 95256 17 95277 Fax +49 711 17 94075
This report and additional information can be found on the Internet at www.daimler.com
Concept and contents Daimler AG Investor Relations
Publications for our shareholders Annual Report (German and English) Interim Reports on the first, second and third quarters (German and English) Sustainability Report (German and English) www.daimler.com/ir/reports
Financial Calendar
Interim Report Q3 2016 October 21, 2016
Annual Press Conference February 2, 2017
Investor and Analyst Conference February 3, 2017
Annual Shareholders’ Meeting 2017 Berlin March 29, 2017
Interim Report Q1 2017 April 26, 2017
Interim Report Q2 2017 July 26, 2017
Interim Report Q3 2017 October 20, 2017
As changes to the above dates cannot be ruled out, we recommend checking on the Internet shortly before each scheduled date at www.daimler.com/ir/calendar.
Forward-looking statements: This document contains forward-looking statements that reflect our current views about future events. The words “anticipate,” “assume,” “believe,” “estimate,” “expect,” “intend,” “may,” ”can,” “could,” “plan,” “project,” “should” and similar expressions are used to identify forward-looking state-ments. These statements are subject to many risks and uncertainties, including an adverse development of global economic conditions, in particu-lar a decline of demand in our most important markets; a deterioration of our refinancing possibilities on the credit and financial markets; events of force majeure including natural disasters, acts of terrorism, political unrest, armed conflicts, industrial accidents and their effects on our sales, purchasing, production or financial services activities; changes in currency exchange rates; a shift in consumer preferences towards smaller, lower-margin vehi-cles; a possible lack of acceptance of our products or services which limits our ability to achieve prices and adequately utilize our production capacities; price increases for fuel or raw materials; disruption of production due to shortages of materials, labor strikes or supplier insolvencies; a decline in
resale prices of used vehicles; the effective implementation of cost-reduction and efficiency-optimization measures; the business outlook for companies in which we hold a significant equity interest; the successful implementation of strategic cooperations and joint ventures; changes in laws, regulations and government policies, particularly those relating to vehicle emissions, fuel economy and safety; the resolution of pending government investigations or of investigations requested by governments and the conclusion of pending or threatened future legal proceedings; and other risks and uncertainties, some of which we describe under the heading “Risk and Opportunity Report” in the current Annual Report. If any of these risks and uncertainties material-izes or if the assumptions underlying any of our forward-looking statements prove to be incorrect, the actual results may be materially different from those we express or imply by such statements. We do not intend or assume any obligation to update these forward-looking statements since they are based solely on the circumstances at the date of publication.

Daimler AGMercedesstr. 13770327 StuttgartGermanywww.daimler.com
Recommended