1406 IEEE TRANSACTIONS ON NUCLEAR SCIENCE, VOL. 42, NO. 4, AUGUST 1995
Development of an On-Line Fuzzy Expert System for Integrated Alarm Processing in Nuclear Power Plants
Seong So0 Choi, Ki Sig Kang, Han Gon Kim, and Soon Heung Chang, Member, ZEEE
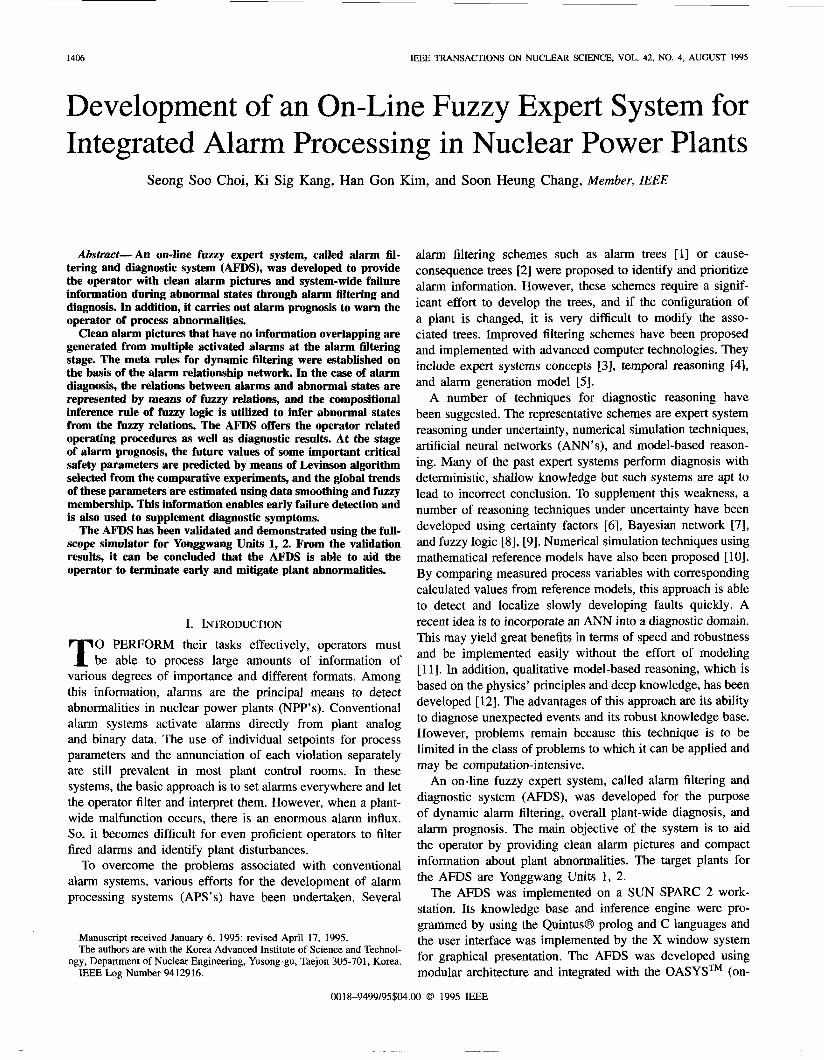
Abstract-An on-line fuzzy expert system, called alarm fil- tering and diagnostic system (AFDS), was developed to provide the operator with clean alarm pictures and system-wide failure information during abnormal states through alarm filtering and diagnosis. In addition, it carries out alarm prognosis to warn the operator of process abnormalities.
Clean alarm pictures that have no information overlapping are generated from multiple activated alarms at the alarm filtering stage. The meta rules for dynamic filtering were established on the basis of the alarm relationship network. In the case of alarm diagnosis, the relations between alarms and abnormal states are represented by means of fuzzy relations, and the compositional inference rule of fuzzy logic is utilized to infer abnormal states from the fuzzy relations. The AFDS offers the operator related operating procedures as well as diagnostic results. At the stage of alarm prognosis, the future values of some important critical safety parameters are predicted by means of Levinson algorithm selected from the comparative experiments, and the global trends of these parameters are estimated using data smoothing and fuzzy membership. This information enables early failure detection and is also used to supplement diagnostic symptoms.
The AFDS has been validated and demonstrated using the full- scope simulator for Yonggwang Units 1, 2. From the validation results, it can be concluded that the AFDS is able to aid the operator to terminate early and mitigate plant abnormalities.
I. INTRODUCTION
0 PERFORM their tasks effectively, operators must T be able to process large amounts of information of various degrees of importance and different formats. Among this information, alarms are the principal means to detect abnormalities in nuclear power plants (NPP’s). Conventional alarm systems activate alarms directly from plant analog and binary data. The use of individual setpoints for process parameters and the annunciation of each violation separately are still prevalent in most plant control rooms. In these systems, the basic approach is to set alarms everywhere and let the operator filter and interpret them. However, when a plant- wide malfunction occurs, there is an enormous alarm influx. So, it becomes difficult for even proficient operators to filter fired alarms and identify plant disturbances.
To overcome the problems associated with conventional alarm systems, various efforts for the development of alarm processing systems (APS’ s) have been undertaken. Several
Manuscript received January 6, 1995; revised April 17, 1995. The authors are with the Korea Advanced Institute of Science and Technol-
ogy, Department of Nuclear Engineering, Yusong-gu, Taejon 305-701, Korea. IEEE Log Number 9412916.
alarm filtering schemes such as alarm trees [l] or cause- consequence trees [2] were proposed to identify and prioritize alarm information. However, these schemes require a signif- icant effort to develop the trees, and if the configuration of a plant is changed, it is very difficult to modify the asso- ciated trees. Improved filtering schemes have been proposed and implemented with advanced computer technologies. They include expert systems concepts [3], temporal reasoning [4], and alarm generation model [5].
A number of techniques for diagnostic reasoning have been suggested. The representative schemes are expert system reasoning under uncertainty, numerical simulation techniques, artificial neural networks (ANN’S), and model-based reason- ing. Many of the past expert systems perform diagnosis with deterministic, shallow knowledge but such systems are apt to lead to incorrect conclusion. To supplement this weakness, a number of reasoning techniques under uncertainty have been developed using certainty factors [6] , Bayesian network [7], and fuzzy logic [8], [9]. Numerical simulation techniques using mathematical reference models have also been proposed [ 101. By comparing measured process variables with corresponding calculated values from reference models, this approach is able to detect and localize slowly developing faults quickly. A recent idea is to incorporate an ANN into a diagnostic domain. This may yield great benefits in terms of speed and robustness and be implemented easily without the effort of modeling [ 1 11. In addition, qualitative model-based reasoning, which is based on the physics’ principles and deep knowledge, has been developed [12]. The advantages of this approach are its ability to diagnose unexpected events and its robust knowledge base. However, problems remain because this technique is to be limited in the class of problems to which it can be applied and may be computation-intensive.
An on-line fuzzy expert system, called alarm filtering and diagnostic system (AFDS), was developed for the purpose of dynamic alarm filtering, overall plant-wide diagnosis, and alarm prognosis. The main objective of the system is to aid the operator by providing clean alarm pictures and compact information about plant abnormalities. The target plants for the AFDS are Yonggwang Units 1, 2.
The AF’DS was implemented on a SUN SPARC 2 work- station. Its knowledge base and inference engine were pro- grammed by using the Quintus@ prolog and C languages and the user interface was implemented by the X window system for graphical presentation. The AFDS was developed using modular architecture and integrated with the OASYSTM (on-
0018-9499/95$04.00 @ 1995 IEEE
CHOI et al.: DEVELOPMENT OF AN ON-LINE FUZZY EXPERT SYSTEM FOR INTEGRATED ALARM PROCESSING IN NUCLEAR POWER PLANTS 1407
line Operator Aid SYStem) [13] which was installed in the simulator for the target plants.
In Section 11, the overall structure of the AFDS is described. In Section 111, the development strategies of the system are described, including its alarm filtering, diagnostic, and prog- nostic scheme. The validation and demonstration of the AFDS are presented in Section IV.
11. OVERALL STRUCTURE OF THE AFDS
The AFDS is designed to perform both dynamic filtering of multiple fired alarms and overall system-wide diagnosis when an abnormal state occurs. In addition, it executes alarm prognosis to warn the operator of process disturbances in advance and it generates high-level alarms which can be used as auxiliary diagnostic information. The alarm filtering and diagnostic knowledge bases are organized as object- oriented concepts. Object-oriented programming is a powerful technique used in artificial intelligence (AI). It provides the advantages of modularity, expressiveness, and data abstraction. This approach reduces the development and maintenance costs because the knowledge base can be easily built and modified. The diagnostic process uses the compositional inference rule of fuzzy logic which is appropriate for manipulating insufficient or uncertain symptoms.
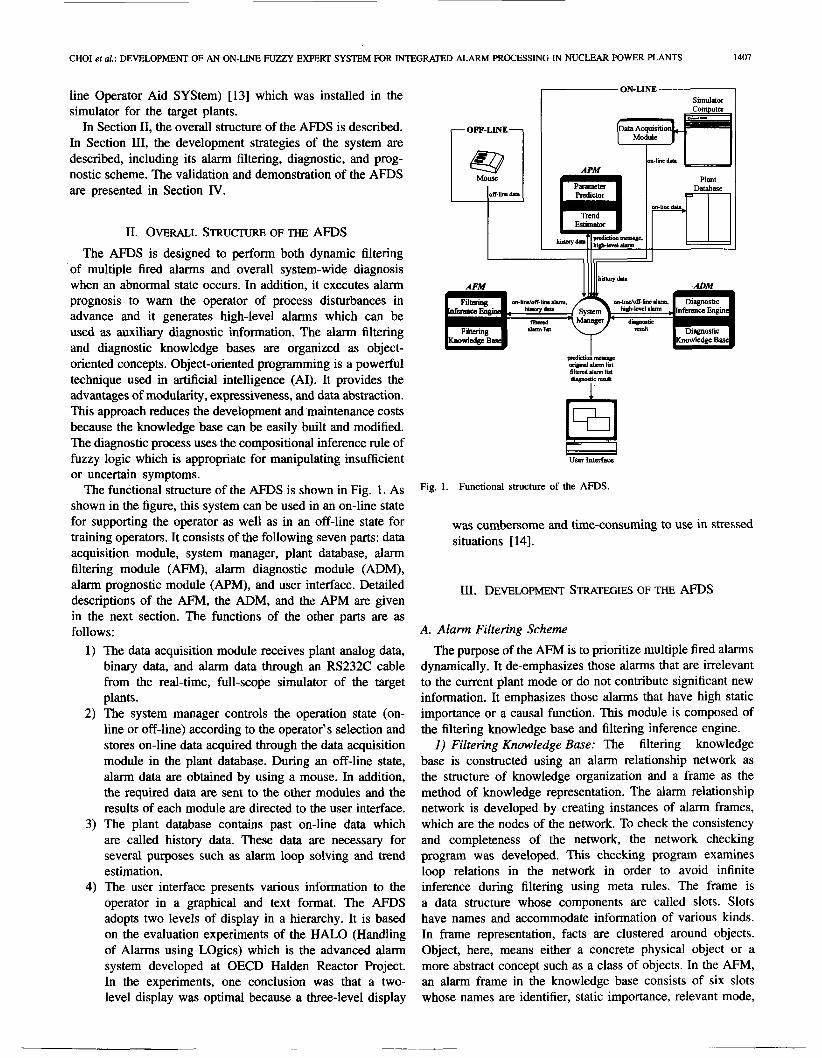
The functional structure of the AFDS is shown in Fig. 1. As shown in the figure, this system can be used in an on-line state for supporting the operator as well as in an off-line state for training operators. It consists of the following seven parts: data acquisition module, system manager, plant database, alarm filtering module (AFM), alarm diagnostic module (ADM), alarm prognostic module (APM), and user interface. Detailed descriptions of the AFM, the ADM, and the APM are given in the next section. The functions of the other parts are as follows:
1) The data acquisition module receives plant analog data, binary data, and alarm data through an RS232C cable from the real-time, full-scope simulator of the target plants.
2) The system manager controls the operation state (on- line or off-line) according to the operator’s selection and stores on-line data acquired through the data acquisition module in the plant database. During an off-line state, alarm data are obtained by using a mouse. In addition, the required data are sent to the other modules and the results of each module are directed to the user interface.
3) The plant database contains past on-line data which are called history data. These data are necessary for several purposes such as alarm loop solving and trend estimation.
4) The user interface presents various information to the operator in a graphical and text format. The AFDS adopts two levels of display in a hierarchy. It is based on the evaluation experiments of the HALO (Handling of Alarms using Logics) which is the advanced alarm system developed at OECD Halden Reactor Project. In the experiments, one conclusion was that a two- level display was optimal because a three-level display
ON-LINE Simulator
A PM on-line data
M o w I Plant I
B Usu Interface
Fig. 1. Functional structure. of the AFDS.
was cumbersome and time-consuming to use in stressed situations [ 141.
111. DEVELOPMENT STRATEGIES OF THE AFDs
A. Alarm Filtering Scheme
The purpose of the AFM is to prioritize multiple fired alarms dynamically. It de-emphasizes those alarms that are irrelevant to the current plant mode or do not contribute significant new information. It emphasizes those alarms that have high static importance or a causal function. This module is composed of the filtering knowledge base and filtering inference engine.
I) Filtering Knowledge Base: The filtering knowledge base is constructed using an alarm relationship network as the structure of knowledge organization and a frame as the method of knowledge representation. The alarm relationship network is developed by creating instances of alarm frames, which are the nodes of the network. To check the consistency and completeness of the network, the network checking program was developed. This checking program examines loop relations in the network in order to avoid infinite inference during filtering using meta rules. The frame is a data structure whose components are called slots. Slots have names and accommodate information of various kinds. In frame representation, facts are clustered around objects. Object, here, means either a concrete physical object or a more abstract concept such as a class of objects. In the AFM, an alarm frame in the knowledge base consists of six slots whose names are identifier, static importance, relevant mode,
1408 IEEE TRANSACTIONS ON NUCLEAR SCIENCE, VOL. 42, NO. 4, AUGUST 1995
Rule4
TABLE I CATEGORY OF CONVENTIONAL ALARMS
[IF] thereareloopalarms
characteristic Example alarm
ROD CONlROL URGENT FAILURE
facilities AFW SIGNAL MOTOR DRlVE AClUAlFD
DSL GEN AM “ROU DURING ESFAS
level precursor, direct precursor, and loop alarm respectively. The information contained in each slot is as follows:
1) The identifier is an alarm tag. 2) The static importance is a property for giving high
priority to those alarms which are important in itself in a plant safety and availability aspect. These kinds of alarms are classified into three categories on the basis of the review of the main control room design of Yonggwang Units 1, 2 [15]. Some examples of these kinds of alarms are shown in Table I.
3) The relevant mode validates the alarms related to current plant operating mode and inhibits others which are called standing alarms. The most common way of identifying operating modes is to check the status of some important process parameters, e.g., power, reactor coolant average temperature, and reactivity. In the AFDS, six plant oper- ating modes are recognized. There are: power operation, startup, hot standby, hot shutdown, cold shutdown, and refueling.
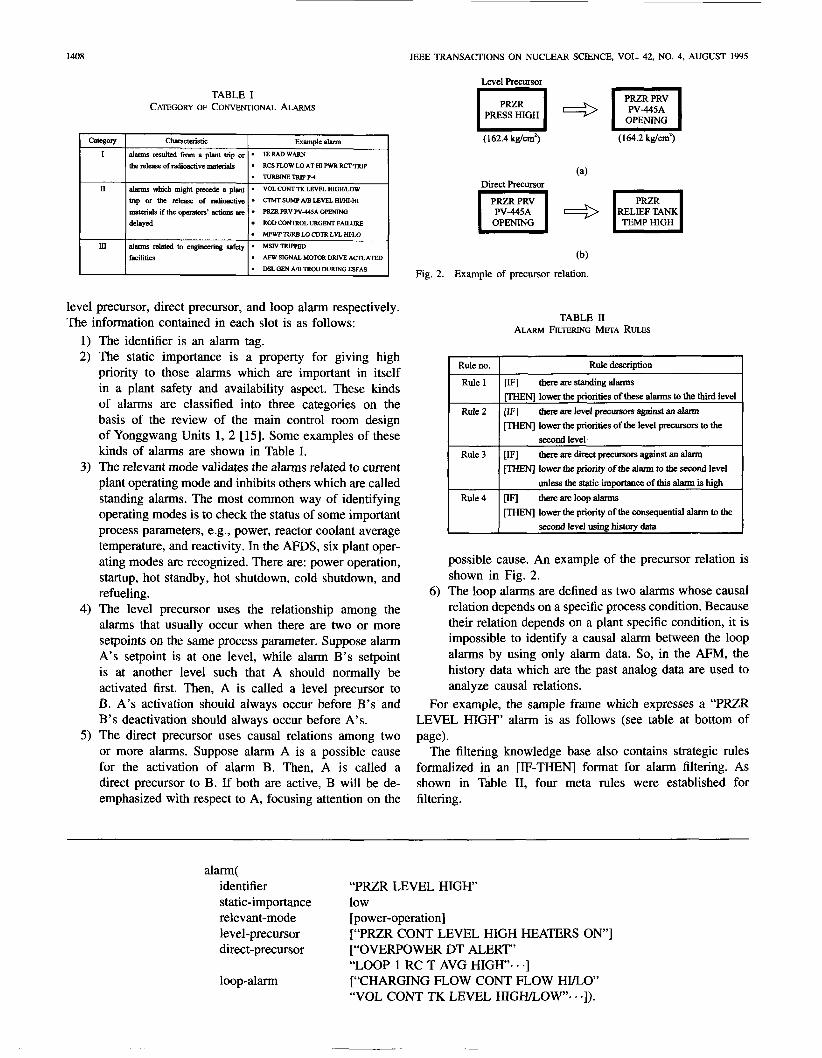
4) The level precursor uses the relationship among the alarms that usually occur when there are two or more setpoints on the same process parameter. Suppose alarm A’s setpoint is at one level, while alarm B’s setpoint is at another level such that A should normally be activated first. Then, A is called a level precursor to B. A’s activation should always occur before B’s and B’s deactivation should always occur before A’s.
5) The direct precursor uses causal relations among two or more alarms. Suppose alarm A is a possible cause for the activation of alarm B. Then, A is called a direct precursor to B. If both are active, B will be de- emphasized with respect to A, focusing attention on the
Level Precursor - I I P E R PRV
PV-445A OPENING -
(162.4 kg/cmz)
~ ~~~ ~
(164.2 kg/cmz)
(a) Direct Precursor
OPENING TEMP HIGH
(b)
Fig. 2. Example of precursor relation.
TABLE 11 ALARM FILERING META RULES
I Ruleno. 1 Rule description I I Rule1 I [IF] therearestandingalarms I I [THEN] lower the priorities of these alarms to the third level
Rule 2 PF] there are level precursors against an alarm
I I [THEN] lower the priorities of the level precursors to the I second level there are d m t precursors against an alarm Rule 3 I [IF]
I I [THEN] lower the priority of the alarm to the second level I
lower the priority of the consequential alarm to the second level using history data
possible cause. An example of the precursor relation is shown in Fig. 2.
6) The loop alarms are defined as two alarms whose causal relation depends on a specific process condition. Because their relation depends on a plant specific condition, it is impossible to identify a causal alarm between the loop alarms by using only alarm data. So, in the AFM, the history data which are the past analog data are used to analyze causal relations.
For example, the sample frame which expresses a “PRZR LEVEL HIGH’ alarm is as follows (see table at bottom of
The filtering knowledge base also contains strategic rules formalized in an [IF-THEN] format for alarm filtering. As shown in Table 11, four meta rules were established for filtering.
page).
alarm( identifier “PRZR LEVEL HIGH’
relevant-mode [power-operation] level-precursor direct-precursor [“OVERPOWER DT ALERT”
loop-alarm
static-importance low
[‘‘PUR CONT LEVEL HIGH HEATERS ON’]
“LOOP 1 RC T AVG HIGH” . .] [“CHARGING FLOW CONT FLOW HILO’ “VOL CONT TK LEVEL HIGHLOW”. . -3).
CHOI et al.: DEVELOPMENT OF AN ON-LINE FUZZY EXPERT SYSTEM FOR INTEGRATED ALARM PROCESSING IN NUCLEAR POWER PLANTS 1409
2) Filtering Inference Engine: The filtering inference en- gine processes fired alarms with their alarm frames and the filtering meta rules. For this reasoning, forward chaining, which searches from data to goals, is used. Through the execution of the meta rules on the frames of multiple fired alarms, both consequential alarms which have low static importance and standing alarms are lowered in priority. The priority of the AFM is divided into three levels. The first level alarms are those which are causal alarms or important alarms statically. Consequential alarms that may result from causal alarms belong to the second level if they are not important in a plant safety and availability aspect. Standing alarms form the third level. To distinguish the priority levels, coloring presentation of multiple fired alarms is used.
B. Alarm Diagnostic Scheme
To approach the diagnostic problem from the operator’s point of view, the ADM performs a system-wide diagnosis using current alarm information because the alarm system is the main information source to detect disturbances in a process. It also uses generated high-level alarms to make up for diagnostic information. After a diagnosis, the ADM provides the operator with diagnostic results and related abnormal operating procedures. This module also contains the diagnostic knowledge base and diagnostic inference engine.
1 ) Diagnostic Knowledge Base: The diagnostic knowledge was elicited from the following two steps: a simple pattern matching and an assignment of the frequency and certi- tude values. Here the frequency describes the degree with which an alarm (Ai) occurs when an abnormal state (Dj) is present. Similarly, the certitude reflects the degree to which the presence of Ai implies the presence of Dj. At first, the knowledge for pattern matching between alarm symptoms and abnormal states was extracted through the process analysis, the analysis of the abnormal operating procedures (AOP’s) [16], and the interview with the domain experts, senior reactor operators (SRO’s) in this study. The relative importance between symptoms was not considered at this step. A group of the SRO’s reviewed the pattern matching knowledge in
order to assign the frequency and certitude values to each symptom. Each expert gave the values, ranged from 0-1, for each symptom. Final values for the frequency and certitude were obtained by the averaging of individual values.
However, because fired alarm patterns are not always iden- tical during the same abnormal state, it is very difficult to diagnose plant abnormalities using typical symptom matching methodologies. To solve this problem, a fuzzy relation is used to formalize the elicited knowledge. The diagnostic knowledge base is constructed using a frame as the knowledge representation method.
The objects used in a diagnostic process are as follows: alarm, alarm group, and abnormal state. Here, the alarm means either a conventional alarm fired in the main control room or a high-level alarm generated by the APM. That is, in addition to conventional alarms, high-level alarms generated from trend estimation are also used as supplementary symptoms in the ADM. In some cases, a single alarm indicates weak confidence for a specific abnormal state. However, if it appears together with other alarms, this combination can be a strong indication of the abnormal state. For these cases, the alarm group is incorporated as a diagnostic object. The abnormal state is the goal object of alarm diagnosis.
With these objects, the following relations are established: relation between alarm and alarm group relation between alarm and abnormal state relation between alarm group and abnormal state.
For the first relation, a crisp relation is used, and in the case of the second and third one, a fuzzy relation is introduced. A sample knowledge unit expressing the relation between an alarm and an alarm group is as follows (see table at bottom of page).
Here, fired-alarm means a conventional alarm in the main control room and high-alarm means a high-level alarm gener- ated by the APM. In the case of “turbine runback due to the stop of all feed water (FW) heater drain pumps,” the sample frame representing the relation between an alarm (or alarm group) and an abnormal state is as follows (see table at bottom of page).
alarm-group( identifier fired-alarm
“HEATER DRN PUMP PO21 & PO22 TRIP” [“HEATER DRN PUMP PO21 FLOW LOW’ “HEATER DRN PUMP PO22 FLOW LOW’ “DEH TURB RUNBACK OPERATING’]
high-alarm [“POWER VERY DECREASING’]). ~ _ _ _ _ _ _ _
abnormal-state( identifier symptom
“Turb Runback From All FW Heater DRN Pump Stop” [“DEH TURB RUNBACK OPERATING”: 100:25
“HEATER DRN PUMP PO21 FLOW LOW’:90:50 “HEATER DRN PUMP PO22 FLOW LOW’:90:50 “HEATER DRN PUMP DISCH PRESS L0’:90:75 “HEATER DRN PUMP PO21 PO22 TRIP:90:100]).
“HEATER DRN TK TO20 LVL LO-L0’:75:25
1410
Critical safety parameter Critical safety function
EEE TRANSACTIONS ON NUCLEAR SCIENCE, VOL. 42, NO. 4, AUGUST 1995
Normal value Rule no.
E P E R level
RCS ThO-k,
TABLE Ill ALARM DIAGNOSTIC RULES
Rule description I
RCS inventory 58.0 Yo
Core cooling 326.1 ‘C
RCS integrity
Exclusion by absent alarms(p,,,,,,,, = 1.0) I RCS Tmld-lq Subcriticality
As shown, the fuzzy relation between the objects is formal- ized by the following form:
alarm : frequency : certitude. (1)
The membership function for the frequency and certitude is a sigmoid logistic function. It is defined as follows in the reference set: = (x (0 5 x 5 loo}, where x means the frequency of an alarm (Ai ) in x of one hundred cases of an abnormal state (Dj) or the certitude to Dj in x of one hundred occurrences of Ai:
292.8 “C
where a,/3 are adjustable factors. 2) Diagnostic Inference Engine: In order to diagnose plant
disturbances using predefined fuzzy relations, the ADM uti- lizes the compositional inference rule of fuzzy logic as the diagnostic rule. This inference rule is the composition of the conjunction rule and projection rule of approximate reasoning [17]. More specifically, if two fuzzy relations, II(P,Ai) = R ~ A and II(Ai, Dj) = RAD are given, we can infer the new fuzzy relation between P and Dj, II(P, Dj) = R ~ A . RAD, which is defined by the possibility distribution function
P R ~ A . R A D ( P ~ Dj) = mm[min(~~,,(f‘ , Ai) , P R A D (Ai, D j ) ) ] (3)
where P, Ai, and Dj mean a plant, an alarm, and an abnormal state, respectively. In (3), , u ~ ~ ~ (Ai , Dj) is calculated using (2) and p~~~ (Pi Ai) is obtained using the following membership function:
Ai
RCS flow
SG pressure
SG level
steam flow
FW flow
VCT level
1 P ( x ) = 1 + (x - x,)2
core cooling 100 %
Heat sink 68.5 kg/cm2
Heat sink 50.0 %
Heat sink 514.5 kg/s
Heat sink 522.9 kg/s
RCS inventory 60.0 %
(4)
where x is the total number of fired alarms and ZO is the number of fired alarms matched with the symptoms in the frame of Dj.
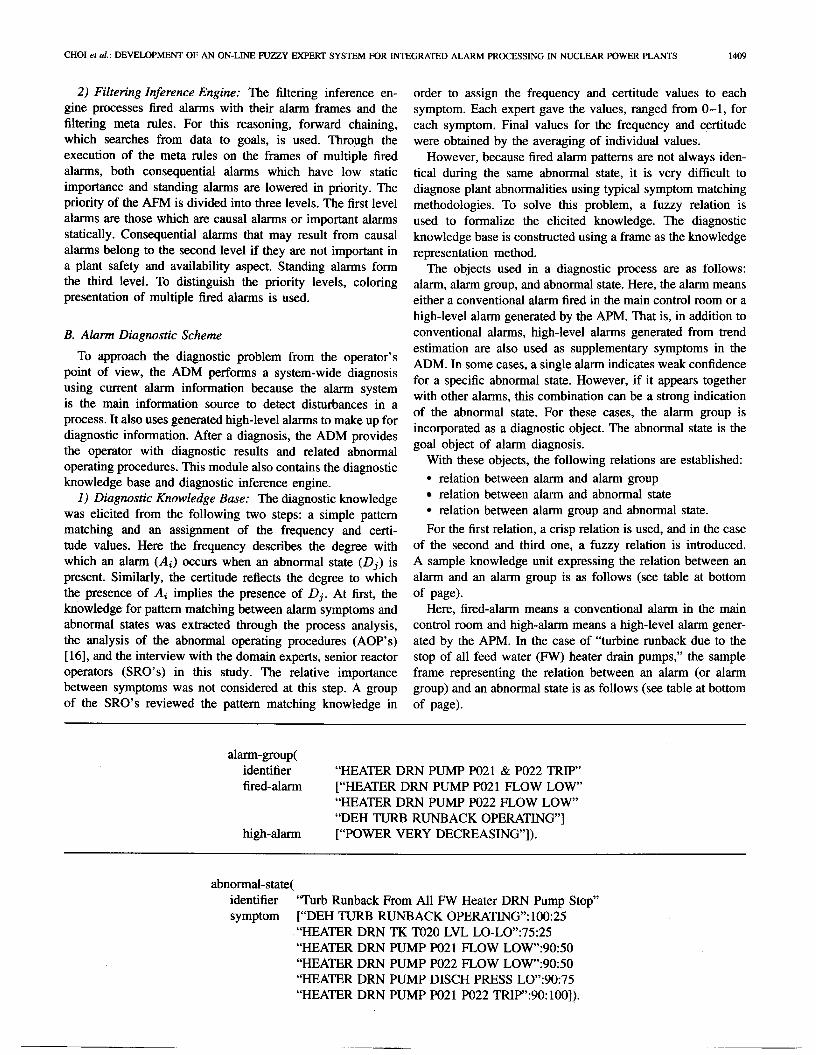
rules were established to deduce an abnormal state of a plant from multiple fired alarms. These rules are listed in Table I11 with their compositions and membership functions. In the table, the superscript f means the frequency and the superscript c means the certitude. The hypothesis and confirmation rule includes a suspicious abnormal state (Dj) in
, Based on the compositional inference rule, three inference
I I I i
TABLE N CRITICAL S m T Y PARAMETERS MONITORED BY THE APM
I P R Z R p l e s s u r e I RCSintegity I 157.9kg/cm2 I I I
core cooling
RCS T,, core cooling
the dynamic memory as a diagnostic result, if the membership value of the first composition, p R b D (P, Dj), exceeds a certain threshold equal to 0.5. The exclusion rule by fired alarms excludes an abnormal state (Dj) from the dynamic memory if a certain alarm (Ai), which cannot be fired in the abnormal state, is fired. The exclusion rule by absent alarms excludes an abnormal state (Dj) from the dynamic memory if a certain alarm (Ai), which is essential to the abnormal state, is not fired. A similar inference mechanism was successfully used in the medical expert system, CADIAG-2 [8].
C. Alarm Prognostic Scheme
As a rule, process parameters contain a lot of information. However, in conventional alarm systems, if operators want to get some information on the trends of measured variables or to verify fired alarms, they should move into corresponding indicators or meters and observe the measured variables. Therefore, in conventional alarm systems, there may be some amount of information that the operator fails to notice because operators cannot monitor all measuring instruments at the same time.
To rectify the above weakness, the APM monitors some important critical safety parameters (CSP’s) and suggests the future values of the measured parameters to the operator if there are some deviations from normal conditions. This module also performs a trend analysis to extract current global trends of the parameters. The CSP’s that are monitored by the APM are listed in Table IV together with related critical safety functions.
-
CHOI et al.: DEVELOPMENT OF AN ON-LINE FUZZY EXPERT SYSTEM FOR INTEGRATED ALARM PROCESSING IN NUCLEAR POWER PLANTS 141 1
-+- EFR algori th -x- Covariance method -A- Levinson algorithm - Real data
56 0 10 20 30 40 50 60 70 80 90 100 110
Time(transmission cycle)
(a)
-+- EFR algorithm -x- Covariance method
162 ---c Levinson algorithm - Real data
154 . . , . . . . . , . . . I d io io i o do i o do i o 80 do Id0 110
Time(transmission cycle) (b)
-+- Fixed order(=3) -x- Fixed order(=5) -w- Fixed order(=7) A M D L
2.0
g 8 1.5
8
p!
.d * 0
1.0
a
0.5
0.0 0
Time(transmission cycle) (C)
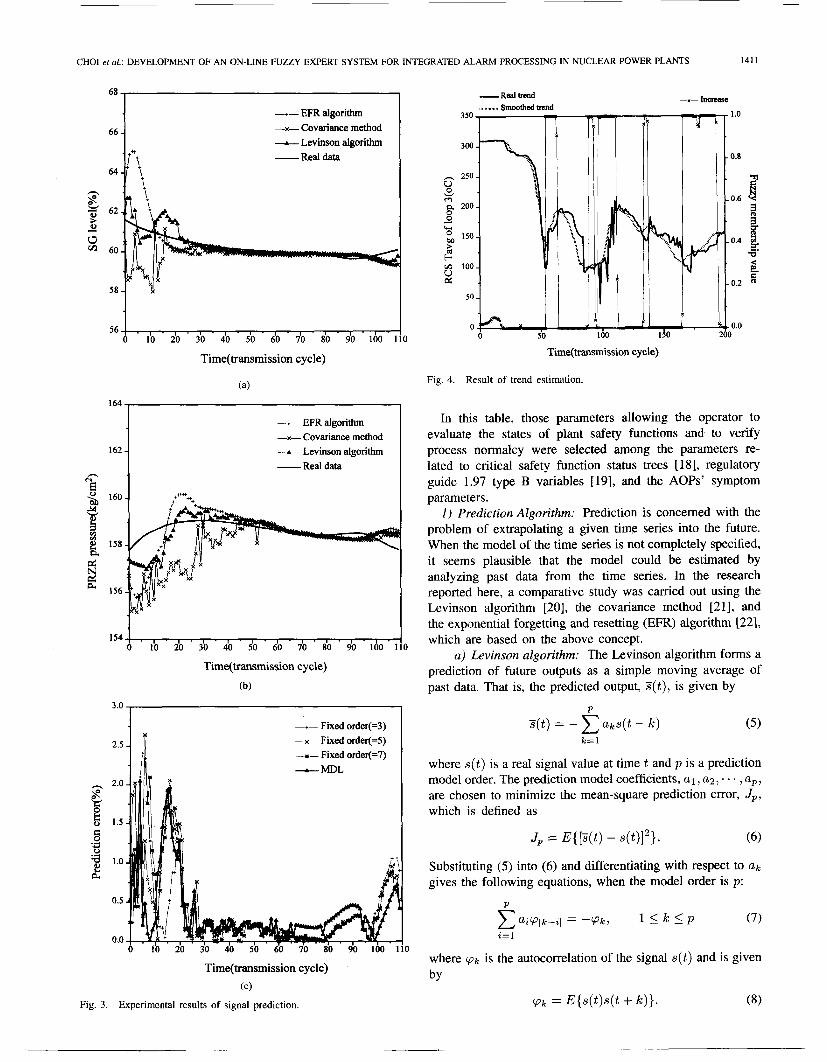
Fig. 3. Experimental results of signal prediction.
150
b v) 100 V d
50
t,
0 0 50
Time(transmission cycle)
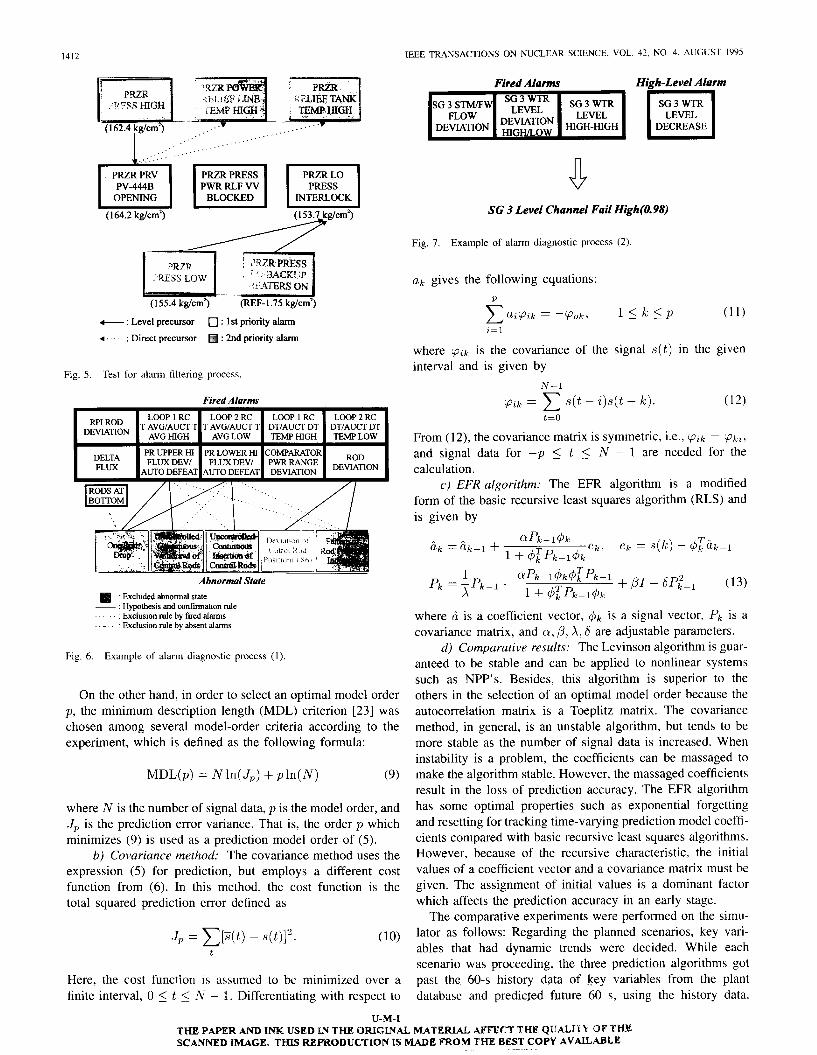
Fig. 4. Result of trend estimation.
In this table, those parameters allowing the operator to evaluate the states of plant safety functions and to verify process normalcy were selected among the parameters re- lated to critical safety function status trees 1181, regulatory guide 1.97 type B variables 1191, and the AOPs' symptom parameters.
1) Prediction Algorithm: Prediction is concerned with the problem of extrapolating a given time series into the future. When the model of the time series is not completely specified, it seems plausible that the model could be estimated by analyzing past data from the time series. In the research reported here, a comparative study was carried out using the Levinson algorithm [20], the covariance method [21], and the exponential forgetting and resetting (Em) algorithm 1221, which are based on the above concept.
a ) Levinson algorithm: The Levinson algorithm forms a prediction of future outputs as a simple moving average of past data. That is, the predicted output, S ( t ) , is given by
P
( 5 ) k = l
where s ( t ) is a real signal value at time t and p is a prediction model order. The prediction model coefficients, a1 , a2, . . . , up , are chosen to minimize the mean-square prediction error, J p , which is defined as
Jp = E{ [ S ( t ) - ~ ( t ) ] ~ } . (6)
Substituting (5) into (6) and differentiating with respect to U k
gives the following equations, when the model order is p :
where (pk is the autocorrelation of the signal s ( t ) and is given by
q k = E{s ( t ) s ( t + k ) } . (8)
1412 IEEE TRANSACTIONS ON NUCLEAR SCIENCE, VOL. 42, NO. 4. AUGUST 1995
Fired Alarms High-Level Alarm
DECREASE
PWRRLF W OPENING BLOCKED INTERLOCK
(1 64.2 kg/cm’)
‘J TlACKUP
(155.4 kg/cm*) (REF-1.75 kgcm’)
t : Level precursor
4 : Direct precursor
0 : 1 st priority alarm
Fig. 5. Test for alarm filtering process.
SG 3 Level Channel Fail High(0.98)
Fig. 7. Example of alarm diagnostic process (2).
ak gives the following equations: P
z = 1
where pik is the covariance of the signal s ( t ) in the given interval and is given by
N - 1
Fired Alarms pzk = s ( t - z)s( t - k ) . (12) t = O
From (12), the covanance matrix is symmetric, i.e., pzk = pkz. and signal data for - p 5 t 5 N - 1 are needed for the calculation.
c ) EFR algorithm: The EFR algorithm is a modified form of the basic recursive least squares algorithm (RLS) and is given by
e k . ek = s ( k ) - q5:iLk-l a p k - 1 4 k
iLk = iLk- - l + 1 + 4 T P k - 1 4 k
Abnormal Staie P k = - 4 - 1 1 - Q P k - 1 4 k 4 3 - 1 + p1- sp,2-, (13) Excluded abnormal state x 1 + 4 p k - 1 4 k
- Hypothesis and confiiation d e Exclusion rule by fued alarms where 6 is a coefficient vector, 4 k is a signal vector, P k is a
covariance matrix, and a , p. A. 6 are adjustable parameters. - Exclusion rule by absent alarms
Fig. 6. Example of alarm diagnostic process (1).
On the other hand, in order to select an optimal model order p , the minimum description length (MDL) criterion [23] was chosen among several model-order criteria according to the experiment, which is defined as the following formula:
MDL(p) = Nln(J,) +pln(N) (9)
where N is the number of signal data, p is the model order, and Jp is the prediction error variance. That is, the order p which minimizes (9) is used as a prediction model order of (5) .
b) Covariance method: The covariance method uses the expression (5) for prediction, but employs a different cost function from (6). In this method, the cost function is the total squared prediction error defined as
J p = E[”@) -
t
Here, the cost function is assumed to be minimized over a finite interval, 0 5 t 5 N - 1. Differentiating with respect to
d ) Comparative results: The Levinson algorithm is guar- anteed to be stable and can be applied to nonlinear systems such as NPP’s. Besides, this algorithm is superior to the others in the selection of an optimal model order because the autocorrelation matrix is a Toeplitz matrix. The covariance method, in general, is an unstable algorithm, but tends to be more stable as the number of signal data is increased. When instability is a problem, the coefficients can be massaged to make the algorithm stable. However, the massaged coefficients result in the loss of prediction accuracy. The EFR algorithm has some optimal properties such as exponential forgetting and resetting for tracking time-varying prediction model coeffi- cients compared with basic recursive least squares algorithms. However, because of the recursive characteristic, the initial values of a coefficient vector and a covariance matrix must be given. The assignment of initial values is a dominant factor which affects the prediction accuracy in an early stage.
The comparative experiments were performed on the simu- lator as follows: Regarding the planned scenarios, key vari- ables that had dynamic trends were decided. While each scenario was proceeding, the three prediction algorithms got past the 60-s history data of key variables from the plant database and predicted future 60 s, using the history data.
U-M-I THE PAPER AND INK USED UV THE OWGLfVAL haATERLII, M€TcIF THE QtJALILrlk 3 F THE SCANNED IMAGE. THTS REPHODUCTION IS W E PROM THE BEST COPY AVAILABLE
CHOI et al.: DEVELOPMENT OF AN ON-LINE FUZZY EXPERT SYSTEM FOR INTEGRATED ALARM PROCESSING IN NUCLEAR POWER PLANTS 1413
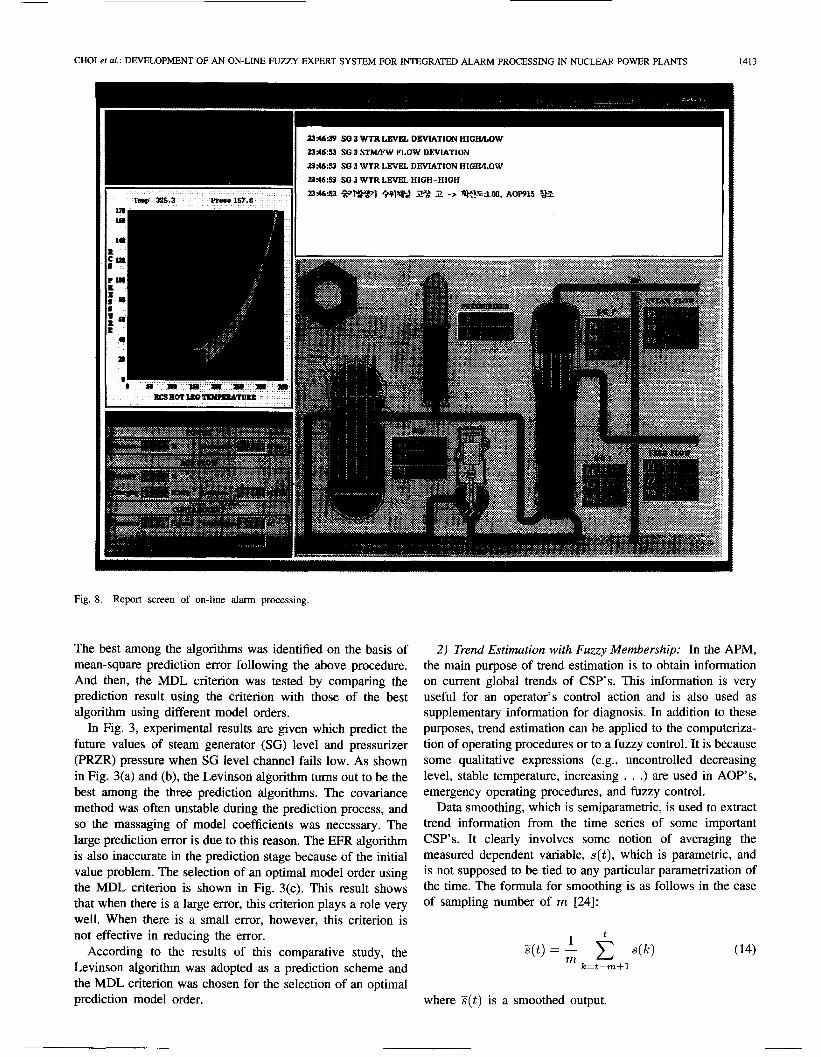
Fig. 8. Report screen of on-line alarm processing.
The best among the algorithms was identified on the basis of mean-square prediction error following the above procedure. And then, the MDL criterion was tested by comparing the prediction result using the criterion with those of the best algorithm using different model orders.
In Fig. 3, experimental results are given which predict the future values of steam generator (SG) level and pressurizer (PRZR) pressure when SG level channel fails low. As shown in Fig. 3(a) and (b), the Levinson algorithm turns out to be the best among the three prediction algorithms. The covariance method was often unstable during the prediction process, and so the massaging of model coefficients was necessary. The large prediction error is due to this reason. The EFR algorithm is also inaccurate in the prediction stage because of the initial value problem. The selection of an optimal model order using the MDL criterion is shown in Fig. 3(c). This result shows that when there is a large error, this criterion plays a role very well. When there is a small error, however, this criterion is not effective in reducing the error.
According to the results of this comparative study, the Levinson algorithm was adopted as a prediction scheme and the MDL criterion was chosen for the selection of an optimal prediction model order.
2 ) Trend Estimation with Fuzzy Membership: In the APM, the main purpose of trend estimation is to obtain information on current global trends of CSP’s. This information is very useful for an operator’s control action and is also used as supplementary information for diagnosis. In addition to these purposes, trend estimation can be applied to the computeriza- tion of operating procedures or to a fuzzy control. It is because some qualitative expressions (e.g., uncontrolled decreasing level, stable temperature, increasing . . .) are used in AOP’s, emergency operating procedures, and fuzzy control.
Data smoothing, which is semiparametric, is used to extract trend information from the time series of some important CSP’s. It clearly involves some notion of averaging the measured dependent variable, s ( t ) , which is parametric, and is not supposed to be tied to any particular parametrization of the time. The formula for smoothing is as follows in the case of sampling number of m [24]:
t - 1 s ( t ) = - s(k)
k = t - m + l
where S ( t ) is a smoothed output.
1414 IEEE TRANSACTIONS ON NUCLEAR SCIENCE, VOL. 42, NO. 4, AUGUST 1995
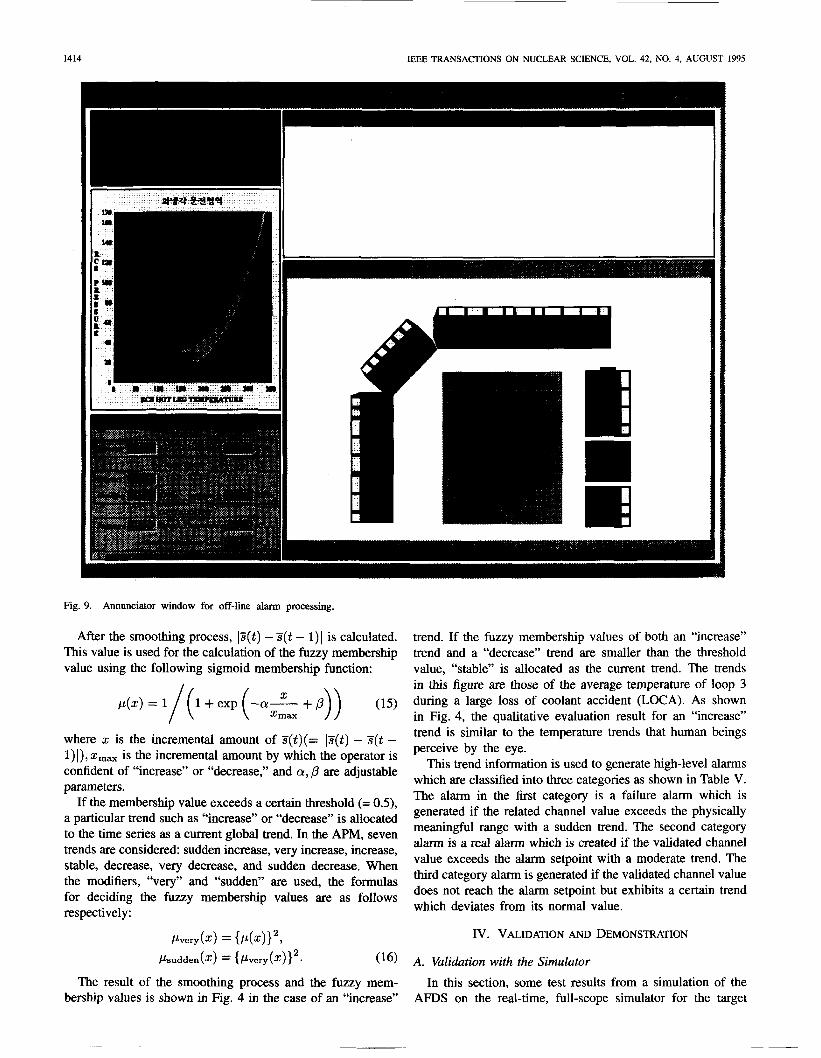
Fig. 9. Annunciator window for off-line alarm processing.
After the smoothing process, lZ(t) - S ( t - 1) I is calculated. This value is used for the calculation of the fuzzy membership value using the following sigmoid membership function:
where z is the incremental amount of S(t)(= la(t) - s(t - 1)1), z,, is the incremental amount by which the operator is confident of “increase” or “decrease,” and a, P are adjustable parameters.
If the membership value exceeds a certain threshold (= O S ) , a particular trend such as “increase” or “decrease” is allocated to the time series as a current global trend. In the APM, seven trends are considered: sudden increase, very increase, increase, stable, decrease, very decrease, and sudden decrease. When the modifiers, “very” and “sudden” are used, the formulas for deciding the fuzzy membership values are as follows respectively:
PL,ery(2) = { P ( 4 I 2 , psudden(Z) = { p ~ e r y ( z ) } ~ . (16)
The result of the smoothing process and the fuzzy mem- bership values is shown in Fig. 4 in the case of an “increase”
trend. If the fuzzy membership values of both an “increase” trend and a “decrease” trend are smaller than the threshold value, “stable” is allocated as the current trend. The trends in this figure are those of the average temperature of loop 3 during a large loss of coolant accident (LOCA). As shown in Fig. 4, the qualitative evaluation result for an “increase” trend is similar to the temperature trends that human beings perceive by the eye.
This trend information is used to generate high-level alarms which are classified into three categories as shown in Table V. The alarm in the first category is a failure alarm which is generated if the related channel value exceeds the physically meaningful range with a sudden trend. The second category alarm is a real alarm which is created if the validated channel value exceeds the alarm setpoint with a moderate trend. The third category alarm is generated if the validated channel value does not reach the alarm setpoint but exhibits a certain trend which deviates from its normal value.
Iv. VALIDATION AND DEMONSTRATION
A. Validation with the Simulator
In this section, some test results from a simulation of the AFDS on the real-time, full-scope simulator for the target
CHOI et al.: DEVELOPMENT OF AN ON-LINE FUZZY EXPERT SYSTEM FOR INTEGRATED ALARM PROCESSING IN NUCLEAR POWER PLANTS 1415
breakaway from
range with a sudden trend physically meaningful
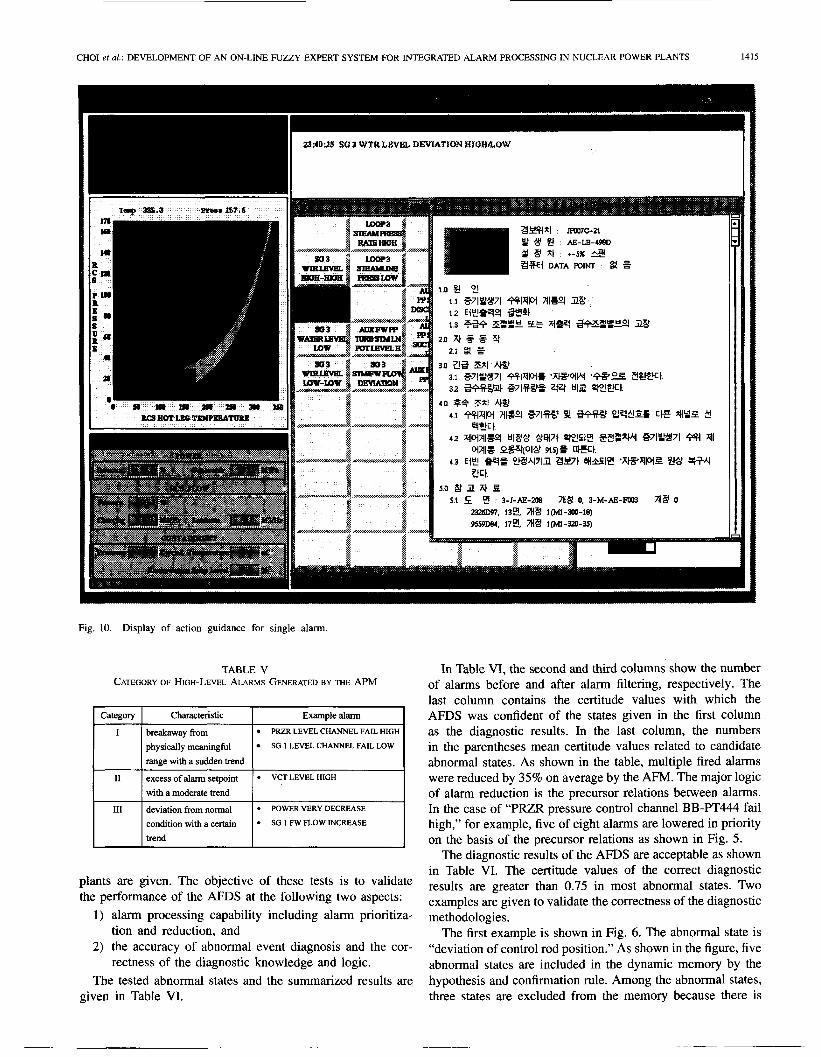
Fig. 10. Display of action guidance for single alarm.
PRZR LEVEL CHANNEL FAIL HIGH
SG 1 LEVEL CHANNEL FAIL LOW
TABLE V CATEGORY OF HIGH-LEVEL ALARMS GENERATED BY THE APM
~
Category
I
I1
I11
____
Charac&tic T Example dam
excess of alarm setpoint with a moderate trend
deviation from normal condition with a certain trend
VCT LEVEL HIGH
SG 1 FW FLOW INCREASE
plants are given. The objective of these tests is to validate the performance of the AFDS at the following two aspects:
1) alarm processing capability including alarm prioritiza-
2) the accuracy of abnormal event diagnosis and the cor-
The tested abnormal states and the summarized results are
tion and reduction, and
rectness of the diagnostic knowledge and logic.
given in Table VI.
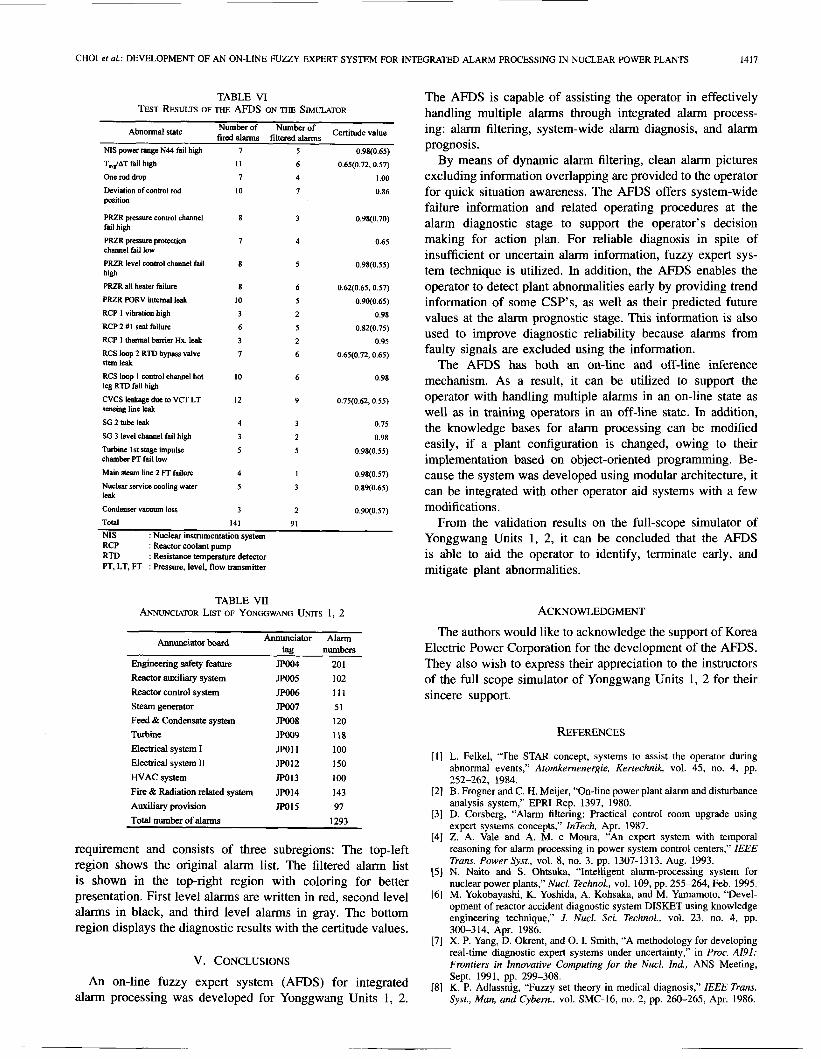
In Table VI, the second and third columns show the number of alarms before and after alarm filtering, respectively. The last column contains the certitude values with which the AFDS was confident of the states given in the first column as the diagnostic results. In the last column, the numbers in the parentheses mean certitude values related to candidate abnormal states. As shown in the table, multiple fired alarms were reduced by 35% on average by the AFM. The major logic of alarm reduction is the precursor relations between alarms. In the case of ‘ ‘PER pressure control channel BB-PT444 fail high,” for example, five of eight alarms are lowered in priority on the basis of the precursor relations as shown in Fig. 5.
The diagnostic results of the AFDS are acceptable as shown in Table VI. The certitude values of the correct diagnostic results are greater than 0.75 in most abnormal states. Two examples are given to validate the correctness of the diagnostic methodologies.
The first example is shown in Fig. 6. The abnormal state is “deviation of control rod position.” As shown in the figure, five abnormal states are included in the dynamic memory by the hypothesis and confirmation rule. Among the abnormal states, three states are excluded from the memory because there is
1416 IEEE TRANSACTIONS ON NUCLEAR SCIENCE, VOL. 42, NO. 4, AUGUST 1995
23:4639 SO 3 WTRLEVEL DEVIATION HIOI-ULOW P:46:S3 S(13 SThWW PLOW I>HVIATION
2 3 A G 53 SO 3 WTR I.EVcX DEVIATION IiIOH&LOW
23.415.53 SO3 WTRLEVVCL €IIGfi-tIlU€I
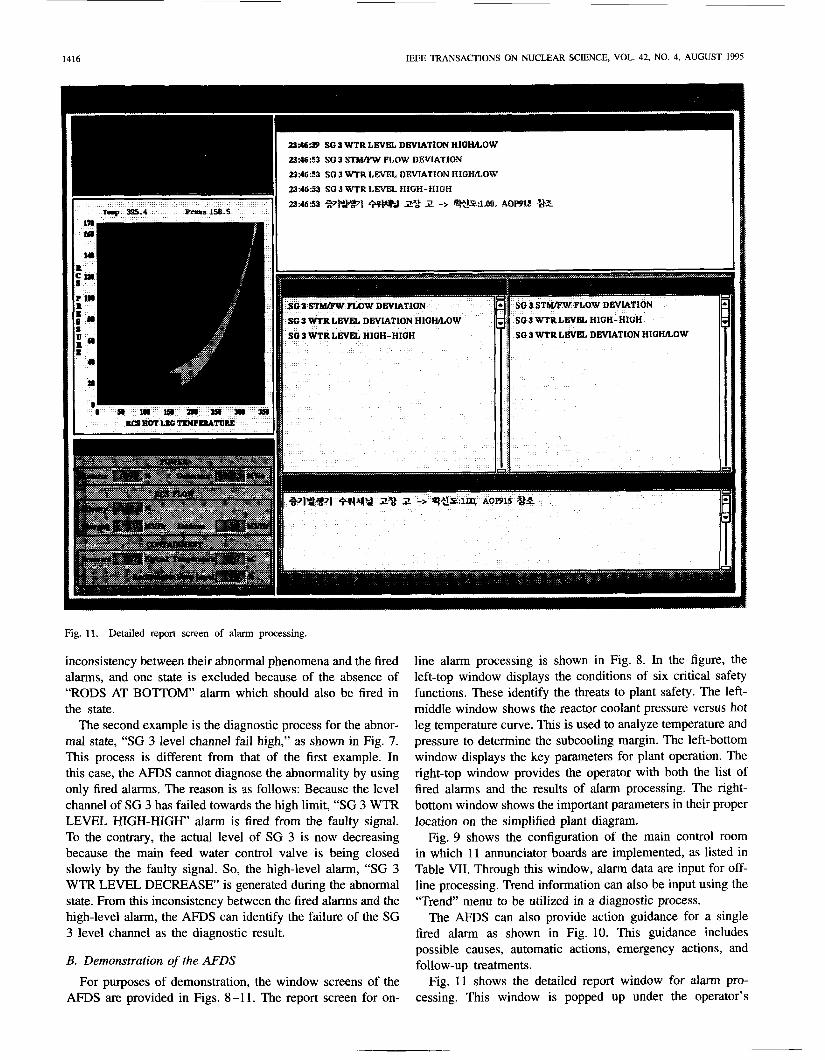
Fig. 11. Detailed report screen of alarm processing.
inconsistency between their abnormal phenomena and the fired alarms, and one state is excluded because of the absence of “RODS AT BOTTOM’ alarm which should also be fired in the state.
The second example is the diagnostic process for the abnor- mal state, “SG 3 level channel fail high,” as shown in Fig. 7. This process is different from that of the first example. In this case, the AFDS cannot diagnose the abnormality by using only fired alarms. The reason is as follows: Because the level channel of SG 3 has failed towards the high limit, “SG 3 WTR LEVEL HIGH-HIGH’ alarm is fired from the faulty signal. To the contrary, the actual level of SG 3 is now decreasing because the main feed water control valve is being closed slowly by the faulty signal. So, the high-level alarm, “SG 3 WTR LEVEL DECREASE’ is generated during the abnormal state. From this inconsistency between the fired alarms and the high-level alarm, the AFDS can identify the failure of the SG 3 level channel as the diagnostic result.
B. Demonstration of the AFDS
For purposes of demonstration, the window screens of the AFDS are provided in Figs. 8-11. The report screen for on-
line alarm processing is shown in Fig. 8. In the figure, the left-top window displays the conditions of six critical safety functions. These identify the threats to plant safety. The left- middle window shows the reactor coolant pressure versus hot leg temperature curve. This is used to analyze temperature and pressure to determine the subcooling margin. The left-bottom window displays the key parameters for plant operation. The right-top window provides the operator with both the list of fired alarms and the results of alarm processing. The right- bottom window shows the important parameters in their proper location on the simplified plant diagram.
Fig. 9 shows the configuration of the main control room in which 11 annunciator boards are implemented, as listed in Table VII. Through this window, alarm data are input for off- line processing. Trend information can also be input using the “Trend” menu to be utilized in a diagnostic process.
The AFDS can also provide action guidance for a single fired alarm as shown in Fig. 10. This guidance includes possible causes, automatic actions, emergency actions, and follow-up treatments.
Fig. 11 shows the detailed report window for alarm pro- cessing. This window is popped up under the operator’s
CHOI et al.: DEVELOPMENT OF AN ON-LINE FUZZY EXPERT SYSTEM FOR INTEGRATED ALARM PROCESSING IN NUCLEAR POWER PLANTS 1417
TABLE VI TEST RESULTS OF THE AFDS ON THE SIMULATOR
Number of Number of f i a h s filtered a l m s Certitude value Abnormal state
NIS power range N44 fail high T d A T fail high One rod drop
Deviation of control rod position
PRZR pressure control channel fail high
PRZR pressure protection channel fail low
PRZR level control channel fail high PRZR all heater failure
PRZR PORV mtemal leak RCP I vibration high RCP 2 #I seal failure RCP 1 thermal barrier Hx. leak RCS loop 2 RTD bypass valve stem leak RCS loop I control channel hot leg RTD fail high
CVCS leakage due to VCT LT sensing line leak SG 2 tube leak
SG 3 level channel fail high
Turbine 1st stage impulse chamber PT fail low
Main steam line 2 FT failure Nuclesr service cooling water leak
Condenser vacuum loss
7 5 0.98(0.65)
I I
7 IO
8
7
8
IO 8
3
6
3 7
IO
12
4
3
5
4
5
3
6
4
7
3
4
5
6
5
2
5
2
6
6
9
3
2 5
1
3
2
0.65(0.72,0.57)
1 .oo 0.86
0.98(0.70)
0.65
0.98(0.55)
0.62(0.65,0.57)
0.90(0.65)
0.98
0.82(0.75)
0.95
0.65(0.72,0.65)
0.98
0.75(0.62,0.55)
0.75
0.98
0.98(0.55)
0.98(0.57)
0.89(0.65)
0.90(0.57) Total 141 91 NIS : Nuclear instrumentation system RCP : Reactor coolant pump RTD : Resistance temperature detector PT, LT, FT : Pressure, level, flow transmitter
TABLE VII ANNUNCIATOR LIST OF YONGGWANG UNITS 1, 2
hmcimr bard Annunciator Alarm tag numbers
Engineering safety feature PO04 20 1 Reactor auxiliary system PO05 102 Reactor control system Po06 111 Steam generator PO07 51 Feed & Condensate system PO08 120
Electrical system I P O I 1 100
WAC system PO13 100 Fire & Radiation related system PO14 143 Auxiliary provision PO15 97
Turbine Po09 118
Electrical system I1 PO12 150
Total number of alarms 1293
requirement and consists of three subregions: The top-left region shows the original alarm list. The filtered alarm list is shown in the top-right region with coloring for better presentation. First level alarms are written in red, second level alarms in black, and third level alarms in gray. The bottom region displays the diagnostic results with the certitude values.
V. CONCLUSIONS An on-line fuzzy expert system (AFDS) for integrated
alarm processing was developed for Yonggwang Units 1, 2.
The AFDS is capable of assisting the operator in effectively handling multiple alarms through integrated alarm process- ing: alarm filtering, system-wide alarm diagnosis, and alarm prognosis.
By means of dynamic alarm filtering, clean alarm pictures excluding information overlapping are provided to the operator for quick situation awareness. The AFDS offers system-wide failure information and related operating procedures at the alarm diagnostic stage to support the operator’s decision making for action plan. For reliable diagnosis in spite of insufficient or uncertain alarm information, fuzzy expert sys- tem technique is utilized. In addition, the AFDS enables the operator to detect plant abnormalities early by providing trend information of some CSP’s, as well as their predicted future values at the alarm prognostic stage. This information is also used to improve diagnostic reliability because alarms from faulty signals are excluded using the information.
The AFDS has both an on-line and off-line inference mechanism. As a result, it can be utilized to support the operator with handling multiple alarms in an on-line state as well as in training operators in an off-line state. In addition, the knowledge bases for alarm processing can be modified easily, if a plant configuration is changed, owing to their implementation based on object-oriented programming. Be- cause the system was developed using modular architecture, it can be integrated with other operator aid systems with a few modifications.
From the validation results on the full-scope simulator of Yonggwang Units 1, 2, it can be concluded that the AFDS is able to aid the operator to identify, terminate early, and mitigate plant abnormalities.
ACKNOWLEDGMENT The authors would like to acknowledge the support of Korea
Electric Power Corporation for the development of the AFDS. They also wish to express their appreciation to the instructors of the full scope simulator of Yonggwang Units 1, 2 for their sincere support.
REFERENCES
L. Felkel, “The STAR concept, systems to assist the operator during abnormal events,” Atomkemener,ie, Kerrechnik, vol. 45, no. 4, pp. _ - 252-262, 1984. B. Frogner and C. H. Meiier. “On-line power plant alarm and disturbance analysis system,” EPRI Rep. 1397, 1980. D. Corsberg, “Alarm filtering: Practical control room upgrade using expert systems concepts,” InTech, Apr. 1987. Z. A . Vale and A. M. e Moura, “An expert system with temporal reasoning for alarm processing in power system control centers,” IEEE Trans. PowerSysf., vol. 8, no. 3, pp. 1307-1313, Aug. 1993. N. Naito and S. Ohtsuka, “Intelligent alarmprocessing system for nuclear power plants,” Nucl. TechnoL, vol. 109, pp. 255-264, Feb. 1995. M. Yokobayashi, K. Yoshida, A. Kohsaka, and M. Yamamoto, “Devel- opment of reactor accident diagnostic system DISKET using knowledge engineering technique,” J . Nucl. Sci. TechnoL, vol. 23, no. 4, pp. 300-314, Apr. 1986. X. P. Yang, D. Okrent, and 0. I. Smith, “A methodology for developing real-time diagnostic expert systems under uncertainty,” in Pmc. AI91; Frontiers in Innovative Computing for the Nucl. Ind., A N S Meeting, Sept. 1991, pp. 299-308. K. P. Adlassnig, “Fuzzy set theory in medical diagnosis,” IEEE Trans. Sysr., Man, and Cybem., vol. SMC-16, no. 2, pp. 260-265, Apr. 1986.
1418 IEEE TRANSACTIONS ON NUCLEAR SCIENCE, VOL. 42, NO. 4, AUGUST 1995
[9] A. Ikonomopoulos, R. E. Uhrig, and L. Tsoukalas, “A hybrid neural network-Fuzzy logic approach to nuclear power plant transient identi- fication,” in Proc. AI91: Frontiers in Innovative Computing for the Nucl. I d . , ANS Meeting, Sept. 1991, pp. 217-226.
[lo] 0. Berg, A. Bye, and A. Sorenssen, “Early fault detection and signal validation at the Loviisa nuclear power plant,” in Proc. AI91: Frontiers in Innovative Computing for the Nucl. I d . , ANS Meeting, Sept. 1991, pp. 111-119.
1111 T. Sorsa and H. N. Koivo, “Neural networks in process fault diagnosis,” IEEE Trans. Syst., Man, and Cybern., vol. 21, no. 4, pp. 815-825, Aug. 1991.
[12] J. Ha, B. K. Hajek, and D. W. Miller, “Model based on-line diagnosis of plant malfunctions using constraint propagation,” in Proc. AI91: Frontiers in Innovative Computing for the Nucl. I d . , ANS Meeting, Sept. 1991, pp. 329-336.
[13] K. S. Kang, H. G. Kim, S. H. Chang, H. K. Jeong, and S. D. Park, “Development strategies on an integrated operator decision aid support system for nuclear power plants,” IEEE Trans. Nucl. Sci., vol. 40, no.
[14] A. Bye, 0. Berg, and F. Owre, “Operator support systems for sta- tus identification and alarm processing at the OECD Halden reactor project- Experience and perspectives for future development,” Institutt
4, pp. 1295-1304, Aug. 1993.
for Energiteknikk, 1992. [15] “Review of the main control room design of Yonggwang Units 1, 2,”
Korea Power Electric Corp. Rep., 1990, pp. 37CL373. [16] “Abnormal operating procedure of Yonggwang Units 1, 2,” Korea
Electric Power Corp., 1992. [17] G. H. Lee and G. R. Oh, Fuzly Theory and Its Application. Seoul,
Korea: Honglung Press, 1991, pp. 23-29. [ 181 Westinghouse Owners Group, “Emergency response guidelines: Status
trees,” Westinghouse Electric Corp., PA, 1983. [ 191 U.S. Nuclear Regulatory Commission, “Regulatory Guide 1.97,” Wash-
ington, D.C., 1983. [20] G. C. Goodwin and K. S. Sin, Adaptive Filtering Prediction And Control.
Englewood Cliffs, NJ: Prentice-Hall, 1984, pp. 28C283. 1211 J. Makhoul, “Linear urediction: A tutorial review.” Proc. IEEE. vol. 63. . .
no. 4, pp. 561-578,-Apr. 1975. 1221 M. E. Salaado, G. C. Goodwin. and R. H. Middleton, “Modified least . .
squares aliorithm incorporating exponential resetting and forgetting,” Int. J. Contr., vol. 47, no. 2, pp. 477491, 1988.
[23] S. L. Marple, Digital Spectral Analysis with Applications. Englewood Cliffs, NJ: Prentice-Hall, 1987, pp. 229-232.
[24] T. Kobayashi, “Analysis of impact properties of A533 steel for nuclear reactor pressure vessel by instrumented Charpy test,” Eng. Fracture Mech., vol. 19, no. 1, pp. 4945, 1984.
Recommended