GHANA STATISTICAL SERVICE (GSS)Statistics for Development
Ghana Statistical Service (GSS)P.O. Box GP 1098 Accra, Ghana.Telephone: 0302664382www.statsghana.gov.ghE-Mail: [email protected] December, 2014
Digest of International Merchandise Trade Statistics
2009-2013
PREFACE AND ACKNOWLEDGEMENT
The Digest of International Merchandise Trade Statistics (IMTS) for 2013 presents statistics on Ghana's Merchandise Trade from 2009 to 2013.
Archival records show that International Merchandise Trade Statistics of Ghana were available as far back as 1960 in different publications. However, since the year 2000, the Quarterly Digest of Statistics has not been published. The IMTS digest aims at consolidating the data gap and enhancing the investment drive of the country.
This publication contains a wide range on current trade statistics of Ghana that will provide its users with information to facilitate planning and decision making. Yearly and quarterly data for most series are presented for the last five-years. The Digest also contains some data on nontraditional export commodities which are compiled by the Ghana Export Promotion Authority (GEPA). The content of the Digest includes Balance of Trade, Imports and Exports by Section and Major Trading Partners. The digest will continually be reviewed and additional data series of interest will be included as and when appropriate.
Internet users can access the Digest via the Ghana Statistical Service (GSS) website at www.statsghana.gov.gh. For users who have specific data needs, the Trade Statistics Section of the Service will offer the necessary assistance.
The Ghana Statistical Service wishes to express its profound gratitude to the Customs Division of the Ghana Revenue Authority (GRA) and the Ghana Community Network Service Limited (GCNet) for making available the necessary data for the compilation of the International Merchandise Trade Statistics.
We hope that users will find this digest useful.
~fAA/\UV Dr. P~oJena Nyarko Government Statistician December, 2014
TABLE OF CONTENTS
1 Introduction2 Merchanidise Trade of Ghana: Balance of Trade, 2009 - 20133 Quarterly value of Exports & Imports, 2009 - 20134 Imports by section, 2009 -20135 Imports of selected items, 2009 - 20136 Imports by mojor trading partners, 2009 - 20137 Exports by section, 2009 - 20138 Exports of selected items, 2009 - 20139 Exports by major trading partner, 2009 - 201310 Non Traditional exports, 2010 - 201311 Exports to ECOWAS, 2009 - 201311 Imports from ECOWAS, 2009 - 201312 Exports to World Economic Bloc, 2009 - 201312 Import from World Economic Bloc, 2009 - 2013LIST OF FIGURE1 Balance of Trade, 2009 - 2013ACRONYMSGCMS Ghana Customs Management SystemGEPA Ghana Export Promotion AuthorityGRA Ghana Revenue Authorityq Quarterlynes not elsewhere specifiedFOB Free-on-BoardCIF Cost, Insurance and FreightASEAN Association of South East Asian NationsCOMESA Common Market for Eastern and Southern AfricaCUSFTA Canada -United State Free Trade AgreementECOWAS Economic Community of West African StatesEU European UnionUNASUR Union of South American Nations
For enquiries contact:Ghana Statistical Service (GSS)P O Box 1098Accra, Ghana.Telephone: 0302664382
or: [email protected]@statsghana.gov.ghweb site: www.statsghana.gov.gh
ii
1
Introduction The Digest of International Merchandise Trade Statistics for 2013 presents data on Ghana’s Merchandise Trade during the period 2009 to 2013. This digest covers the General Trade Type System, as captured by the Customs Division of the Ghana Revenue Authority. The commodity classification is based on the Harmonized Commodity Description & Coding System (HS Codes). Balance of Trade The Balance of Trade deals with the components of total trade, which is: total exports and total imports. Total exports in this digest refer to all registered goods leaving the country based on ‘Free-on-Board’ (FOB). Total imports refer to all goods entering the country, including the free zone goods based on Cost, Freight and Insurance (CIF). Trade balance is the difference between total exports and imports for a given period of time.
Imports and Export by Section “Section” as presented in the Digest is at the 2-digit HS codes (Chapter level). The 2-digit HS codes consist of principal commodity groupings of related commodities. Exports and Imports of Selected Items Exports and Imports of selected items in the Digest are classified using the 10-digit HS codes (commodity level). Exports and Imports by Major Trading Partners The direction of trade gives imports by country of origin while exports are presented by country of destination (consignment). Major trading partners are considered individually while smaller trading partners are grouped together under “others.”
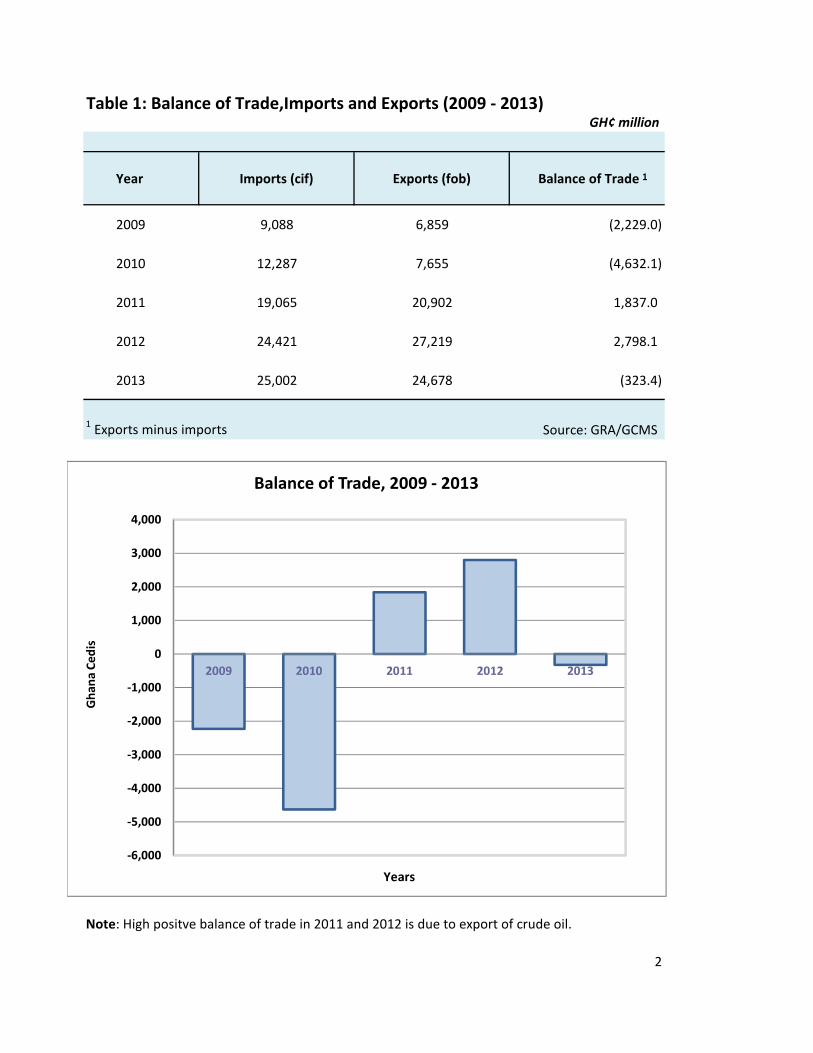
Table 1: Balance of Trade,Imports and Exports (2009 - 2013)GH¢ million
Year Imports (cif) Exports (fob) Balance of Trade
2009 9,088 6,859 (2,229.0)
2010 12,287 7,655 (4,632.1)
2011 19,065 20,902 1,837.0
2012 24,421 27,219 2,798.1
2013 25,002 24,678 (323.4)
1 Exports minus imports Source: GRA/GCMS
Note: High positve balance of trade in 2011 and 2012 is due to export of crude oil.
2
1
-6,000
-5,000
-4,000
-3,000
-2,000
-1,000
0
1,000
2,000
3,000
4,000
2009 2010 2011 2012 2013
Ghan
a Ced
is
Years
Balance of Trade, 2009 - 2013
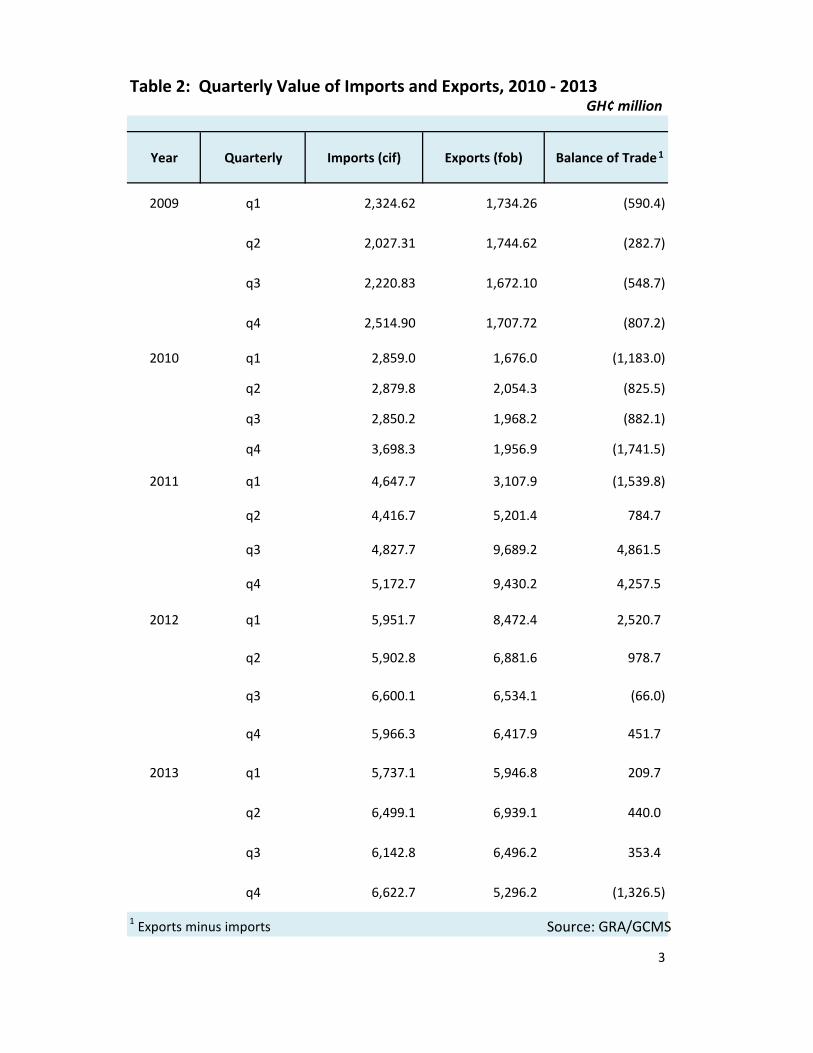
Table 2: Quarterly Value of Imports and Exports, 2010 - 2013GH¢ million
Year Quarterly Imports (cif) Exports (fob) Balance of Trade
2009 q1 2,324.62 1,734.26 (590.4)
q2 2,027.31 1,744.62 (282.7)
q3 2,220.83 1,672.10 (548.7)
q4 2,514.90 1,707.72 (807.2)
2010 q1 2,859.0 1,676.0 (1,183.0) q2 2,879.8 2,054.3 (825.5) q3 2,850.2 1,968.2 (882.1) q4 3,698.3 1,956.9 (1,741.5)
2011 q1 4,647.7 3,107.9 (1,539.8)
q2 4,416.7 5,201.4 784.7
q3 4,827.7 9,689.2 4,861.5
q4 5,172.7 9,430.2 4,257.5
2012 q1 5,951.7 8,472.4 2,520.7
q2 5,902.8 6,881.6 978.7
q3 6,600.1 6,534.1 (66.0)
q4 5,966.3 6,417.9 451.7
2013 q1 5,737.1 5,946.8 209.7
q2 6,499.1 6,939.1 440.0
q3 6,142.8 6,496.2 353.4
q4 6,622.7 5,296.2 (1,326.5) 1 Exports minus imports Source: GRA/GCMS
3
1
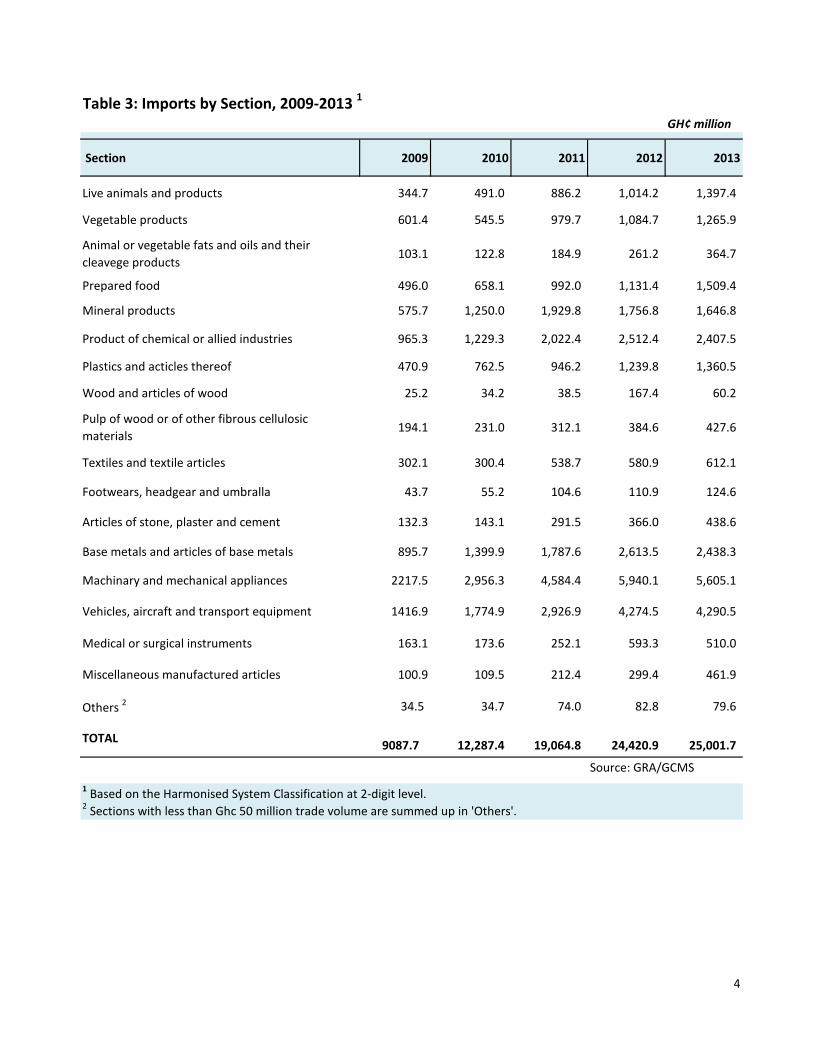
Table 3: Imports by Section, 2009-2013 1GH¢ million
Section 2009 2010 2011 2012 2013
Live animals and products 344.7 491.0 886.2 1,014.2 1,397.4 Vegetable products 601.4 545.5 979.7 1,084.7 1,265.9 Animal or vegetable fats and oils and their cleavege products 103.1 122.8 184.9 261.2 364.7
Prepared food 496.0 658.1 992.0 1,131.4 1,509.4 Mineral products 575.7 1,250.0 1,929.8 1,756.8 1,646.8 Product of chemical or allied industries 965.3 1,229.3 2,022.4 2,512.4 2,407.5 Plastics and acticles thereof 470.9 762.5 946.2 1,239.8 1,360.5 Wood and articles of wood 25.2 34.2 38.5 167.4 60.2 Pulp of wood or of other fibrous cellulosic materials 194.1 231.0 312.1 384.6 427.6
Textiles and textile articles 302.1 300.4 538.7 580.9 612.1 Footwears, headgear and umbralla 43.7 55.2 104.6 110.9 124.6 Articles of stone, plaster and cement 132.3 143.1 291.5 366.0 438.6 Base metals and articles of base metals 895.7 1,399.9 1,787.6 2,613.5 2,438.3 Machinary and mechanical appliances 2217.5 2,956.3 4,584.4 5,940.1 5,605.1
Vehicles, aircraft and transport equipment 1416.9 1,774.9 2,926.9 4,274.5 4,290.5
Medical or surgical instruments 163.1 173.6 252.1 593.3 510.0
Miscellaneous manufactured articles 100.9 109.5 212.4 299.4 461.9
Others 2 34.5 34.7 74.0 82.8 79.6
TOTAL 9087.7 12,287.4 19,064.8 24,420.9 25,001.7 Source: GRA/GCMS
1 Based on the Harmonised System Classification at 2-digit level.2 Sections with less than Ghc 50 million trade volume are summed up in 'Others'.
4
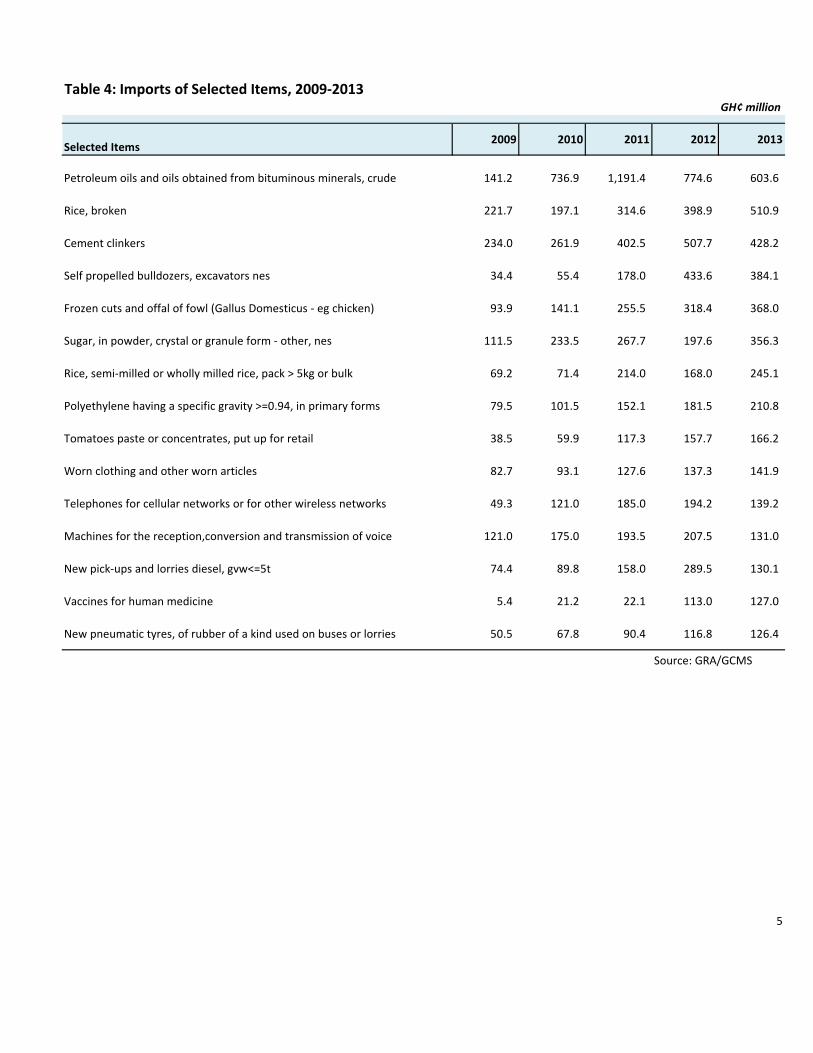
Table 4: Imports of Selected Items, 2009-2013GH¢ million
Selected Items 2009 2010 2011 2012 2013
Petroleum oils and oils obtained from bituminous minerals, crude 141.2 736.9 1,191.4 774.6 603.6
Rice, broken 221.7 197.1 314.6 398.9 510.9
Cement clinkers 234.0 261.9 402.5 507.7 428.2
Self propelled bulldozers, excavators nes 34.4 55.4 178.0 433.6 384.1
Frozen cuts and offal of fowl (Gallus Domesticus - eg chicken) 93.9 141.1 255.5 318.4 368.0
Sugar, in powder, crystal or granule form - other, nes 111.5 233.5 267.7 197.6 356.3
Rice, semi-milled or wholly milled rice, pack > 5kg or bulk 69.2 71.4 214.0 168.0 245.1
Polyethylene having a specific gravity >=0.94, in primary forms 79.5 101.5 152.1 181.5 210.8
Tomatoes paste or concentrates, put up for retail 38.5 59.9 117.3 157.7 166.2
Worn clothing and other worn articles 82.7 93.1 127.6 137.3 141.9
Telephones for cellular networks or for other wireless networks 49.3 121.0 185.0 194.2 139.2
Machines for the reception,conversion and transmission of voice 121.0 175.0 193.5 207.5 131.0
New pick-ups and lorries diesel, gvw<=5t 74.4 89.8 158.0 289.5 130.1
Vaccines for human medicine 5.4 21.2 22.1 113.0 127.0
New pneumatic tyres, of rubber of a kind used on buses or lorries 50.5 67.8 90.4 116.8 126.4 Source: GRA/GCMS
5
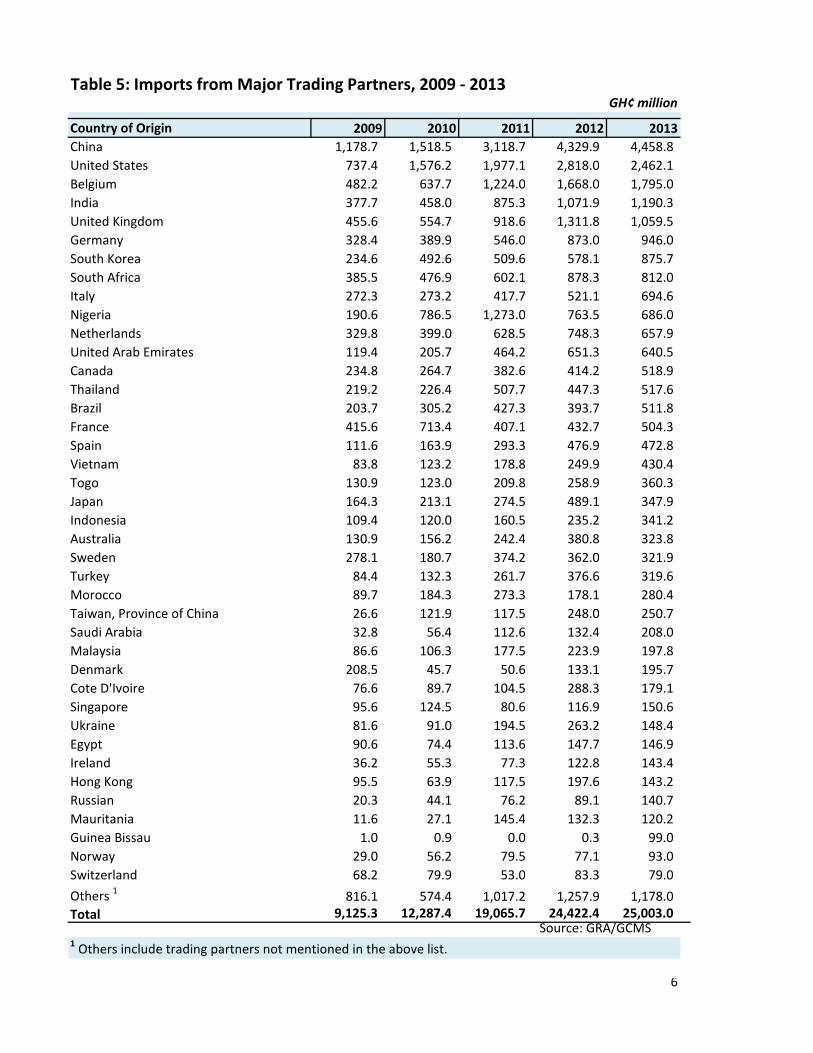
Table 5: Imports from Major Trading Partners, 2009 - 2013GH¢ million
Country of Origin 2009 2010 2011 2012 2013China 1,178.7 1,518.5 3,118.7 4,329.9 4,458.8 United States 737.4 1,576.2 1,977.1 2,818.0 2,462.1 Belgium 482.2 637.7 1,224.0 1,668.0 1,795.0 India 377.7 458.0 875.3 1,071.9 1,190.3 United Kingdom 455.6 554.7 918.6 1,311.8 1,059.5 Germany 328.4 389.9 546.0 873.0 946.0 South Korea 234.6 492.6 509.6 578.1 875.7 South Africa 385.5 476.9 602.1 878.3 812.0 Italy 272.3 273.2 417.7 521.1 694.6 Nigeria 190.6 786.5 1,273.0 763.5 686.0 Netherlands 329.8 399.0 628.5 748.3 657.9 United Arab Emirates 119.4 205.7 464.2 651.3 640.5 Canada 234.8 264.7 382.6 414.2 518.9 Thailand 219.2 226.4 507.7 447.3 517.6 Brazil 203.7 305.2 427.3 393.7 511.8 France 415.6 713.4 407.1 432.7 504.3 Spain 111.6 163.9 293.3 476.9 472.8 Vietnam 83.8 123.2 178.8 249.9 430.4 Togo 130.9 123.0 209.8 258.9 360.3 Japan 164.3 213.1 274.5 489.1 347.9 Indonesia 109.4 120.0 160.5 235.2 341.2 Australia 130.9 156.2 242.4 380.8 323.8 Sweden 278.1 180.7 374.2 362.0 321.9 Turkey 84.4 132.3 261.7 376.6 319.6 Morocco 89.7 184.3 273.3 178.1 280.4 Taiwan, Province of China 26.6 121.9 117.5 248.0 250.7 Saudi Arabia 32.8 56.4 112.6 132.4 208.0 Malaysia 86.6 106.3 177.5 223.9 197.8 Denmark 208.5 45.7 50.6 133.1 195.7 Cote D'Ivoire 76.6 89.7 104.5 288.3 179.1 Singapore 95.6 124.5 80.6 116.9 150.6 Ukraine 81.6 91.0 194.5 263.2 148.4 Egypt 90.6 74.4 113.6 147.7 146.9 Ireland 36.2 55.3 77.3 122.8 143.4 Hong Kong 95.5 63.9 117.5 197.6 143.2 Russian 20.3 44.1 76.2 89.1 140.7 Mauritania 11.6 27.1 145.4 132.3 120.2 Guinea Bissau 1.0 0.9 0.0 0.3 99.0 Norway 29.0 56.2 79.5 77.1 93.0 Switzerland 68.2 79.9 53.0 83.3 79.0 Others 1 816.1 574.4 1,017.2 1,257.9 1,178.0 Total 9,125.3 12,287.4 19,065.7 24,422.4 25,003.0
Source: GRA/GCMS1 Others include trading partners not mentioned in the above list.
6
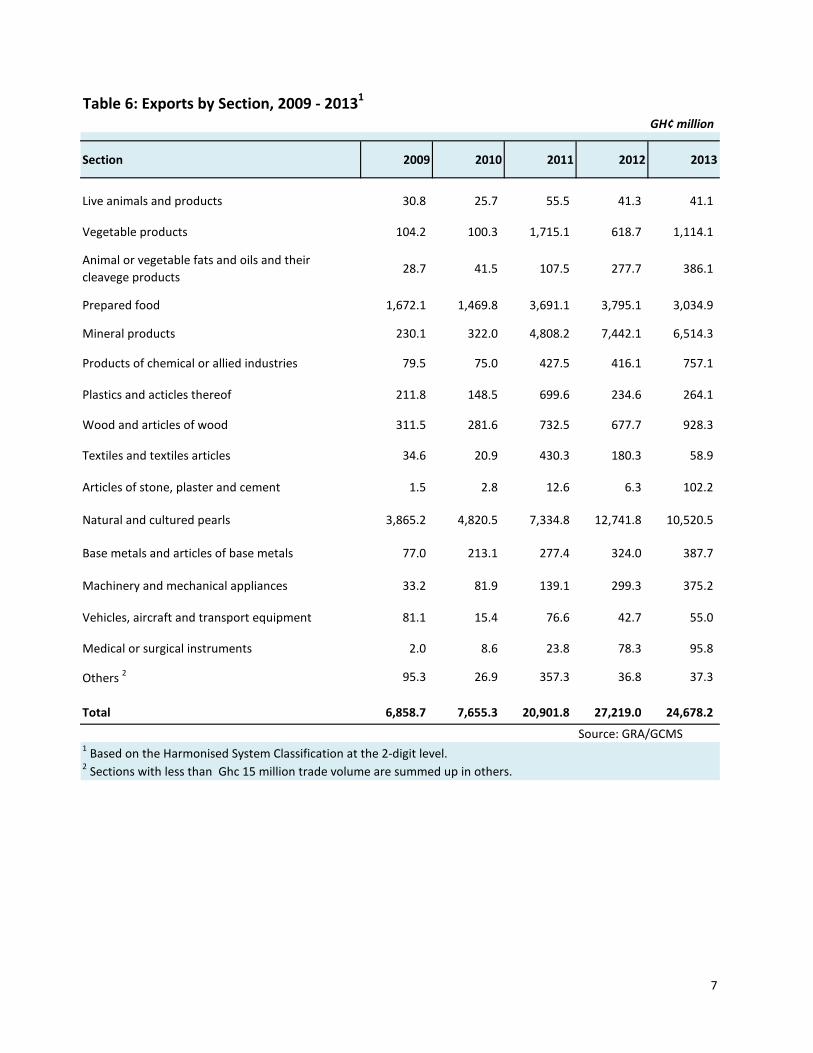
Table 6: Exports by Section, 2009 - 20131
GH¢ million
Section 2009 2010 2011 2012 2013
Live animals and products 30.8 25.7 55.5 41.3 41.1
Vegetable products 104.2 100.3 1,715.1 618.7 1,114.1 Animal or vegetable fats and oils and their cleavege products 28.7 41.5 107.5 277.7 386.1
Prepared food 1,672.1 1,469.8 3,691.1 3,795.1 3,034.9 Mineral products 230.1 322.0 4,808.2 7,442.1 6,514.3 Products of chemical or allied industries 79.5 75.0 427.5 416.1 757.1
Plastics and acticles thereof 211.8 148.5 699.6 234.6 264.1 Wood and articles of wood 311.5 281.6 732.5 677.7 928.3
Textiles and textiles articles 34.6 20.9 430.3 180.3 58.9
Articles of stone, plaster and cement 1.5 2.8 12.6 6.3 102.2
Natural and cultured pearls 3,865.2 4,820.5 7,334.8 12,741.8 10,520.5
Base metals and articles of base metals 77.0 213.1 277.4 324.0 387.7
Machinery and mechanical appliances 33.2 81.9 139.1 299.3 375.2
Vehicles, aircraft and transport equipment 81.1 15.4 76.6 42.7 55.0
Medical or surgical instruments 2.0 8.6 23.8 78.3 95.8 Others 2 95.3 26.9 357.3 36.8 37.3
Total 6,858.7 7,655.3 20,901.8 27,219.0 24,678.2 Source: GRA/GCMS
1 Based on the Harmonised System Classification at the 2-digit level.2 Sections with less than Ghc 15 million trade volume are summed up in others.
7
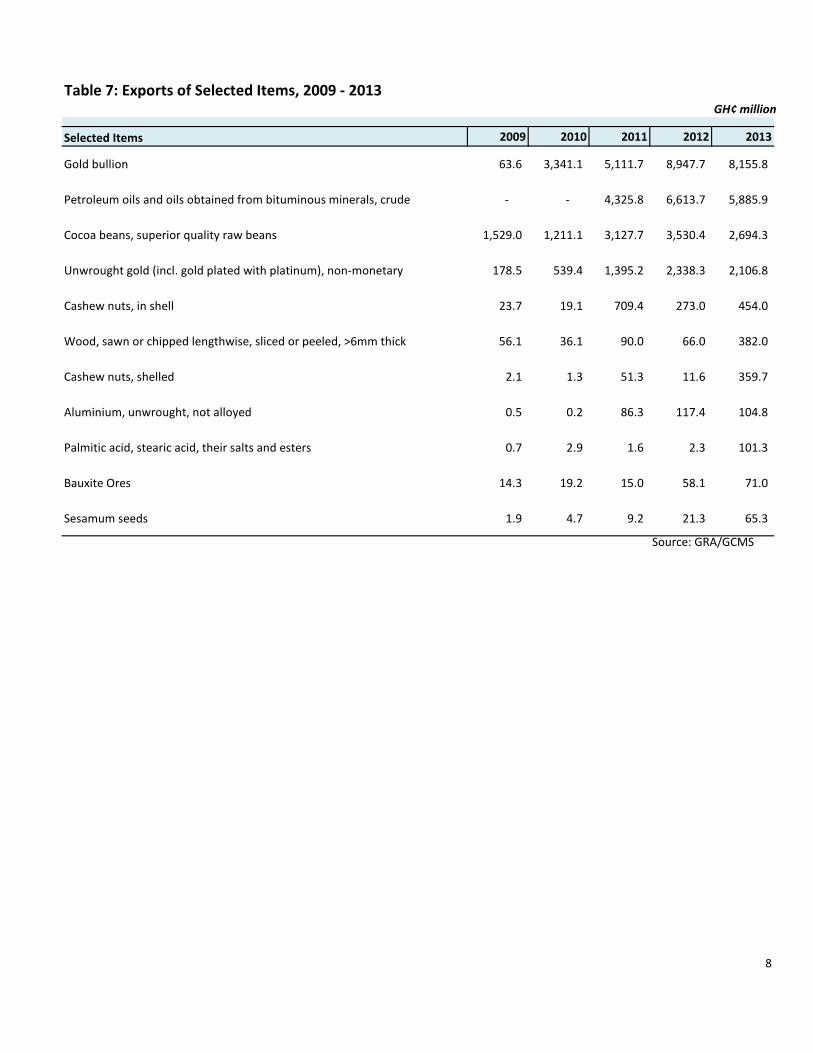
Table 7: Exports of Selected Items, 2009 - 2013GH¢ million
Selected Items 2009 2010 2011 2012 2013
Gold bullion 63.6 3,341.1 5,111.7 8,947.7 8,155.8
Petroleum oils and oils obtained from bituminous minerals, crude - - 4,325.8 6,613.7 5,885.9
Cocoa beans, superior quality raw beans 1,529.0 1,211.1 3,127.7 3,530.4 2,694.3
Unwrought gold (incl. gold plated with platinum), non-monetary 178.5 539.4 1,395.2 2,338.3 2,106.8
Cashew nuts, in shell 23.7 19.1 709.4 273.0 454.0
Wood, sawn or chipped lengthwise, sliced or peeled, >6mm thick 56.1 36.1 90.0 66.0 382.0
Cashew nuts, shelled 2.1 1.3 51.3 11.6 359.7
Aluminium, unwrought, not alloyed 0.5 0.2 86.3 117.4 104.8
Palmitic acid, stearic acid, their salts and esters 0.7 2.9 1.6 2.3 101.3
Bauxite Ores 14.3 19.2 15.0 58.1 71.0
Sesamum seeds 1.9 4.7 9.2 21.3 65.3 Source: GRA/GCMS
8
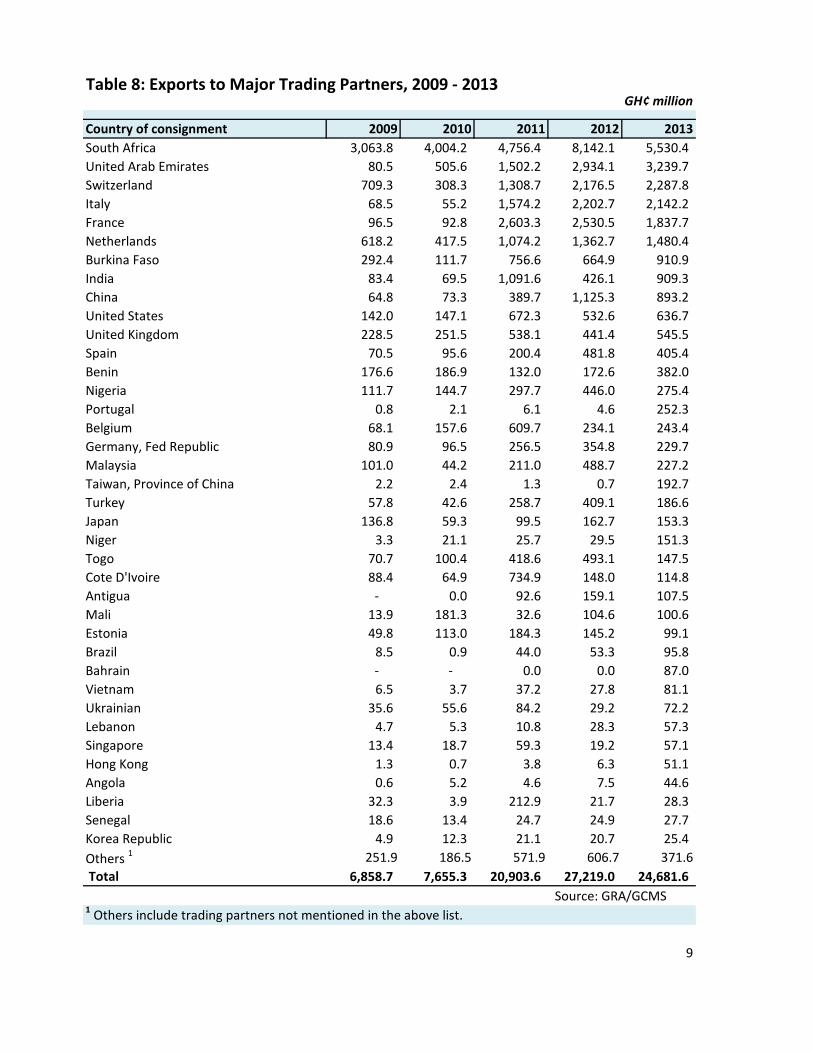
Table 8: Exports to Major Trading Partners, 2009 - 2013GH¢ million
Country of consignment 2009 2010 2011 2012 2013South Africa 3,063.8 4,004.2 4,756.4 8,142.1 5,530.4 United Arab Emirates 80.5 505.6 1,502.2 2,934.1 3,239.7 Switzerland 709.3 308.3 1,308.7 2,176.5 2,287.8 Italy 68.5 55.2 1,574.2 2,202.7 2,142.2 France 96.5 92.8 2,603.3 2,530.5 1,837.7 Netherlands 618.2 417.5 1,074.2 1,362.7 1,480.4 Burkina Faso 292.4 111.7 756.6 664.9 910.9 India 83.4 69.5 1,091.6 426.1 909.3 China 64.8 73.3 389.7 1,125.3 893.2 United States 142.0 147.1 672.3 532.6 636.7 United Kingdom 228.5 251.5 538.1 441.4 545.5 Spain 70.5 95.6 200.4 481.8 405.4 Benin 176.6 186.9 132.0 172.6 382.0 Nigeria 111.7 144.7 297.7 446.0 275.4 Portugal 0.8 2.1 6.1 4.6 252.3 Belgium 68.1 157.6 609.7 234.1 243.4 Germany, Fed Republic 80.9 96.5 256.5 354.8 229.7 Malaysia 101.0 44.2 211.0 488.7 227.2 Taiwan, Province of China 2.2 2.4 1.3 0.7 192.7 Turkey 57.8 42.6 258.7 409.1 186.6 Japan 136.8 59.3 99.5 162.7 153.3 Niger 3.3 21.1 25.7 29.5 151.3 Togo 70.7 100.4 418.6 493.1 147.5 Cote D'Ivoire 88.4 64.9 734.9 148.0 114.8 Antigua - 0.0 92.6 159.1 107.5 Mali 13.9 181.3 32.6 104.6 100.6 Estonia 49.8 113.0 184.3 145.2 99.1 Brazil 8.5 0.9 44.0 53.3 95.8 Bahrain - - 0.0 0.0 87.0 Vietnam 6.5 3.7 37.2 27.8 81.1 Ukrainian 35.6 55.6 84.2 29.2 72.2 Lebanon 4.7 5.3 10.8 28.3 57.3 Singapore 13.4 18.7 59.3 19.2 57.1 Hong Kong 1.3 0.7 3.8 6.3 51.1 Angola 0.6 5.2 4.6 7.5 44.6 Liberia 32.3 3.9 212.9 21.7 28.3 Senegal 18.6 13.4 24.7 24.9 27.7 Korea Republic 4.9 12.3 21.1 20.7 25.4 Others 1 251.9 186.5 571.9 606.7 371.6 Total 6,858.7 7,655.3 20,903.6 27,219.0 24,681.6
Source: GRA/GCMS1 Others include trading partners not mentioned in the above list.
9
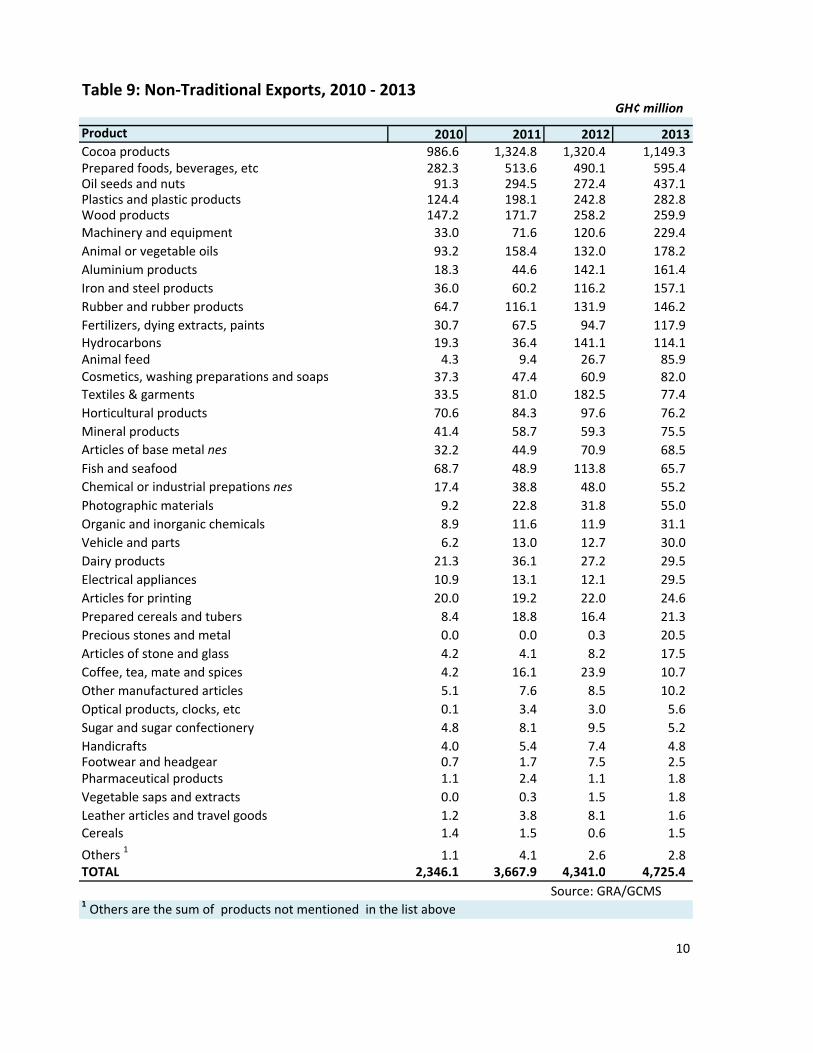
Table 9: Non-Traditional Exports, 2010 - 2013GH¢ million
Product 2010 2011 2012 2013Cocoa products 986.6 1,324.8 1,320.4 1,149.3 Prepared foods, beverages, etc 282.3 513.6 490.1 595.4 Oil seeds and nuts 91.3 294.5 272.4 437.1 Plastics and plastic products 124.4 198.1 242.8 282.8 Wood products 147.2 171.7 258.2 259.9 Machinery and equipment 33.0 71.6 120.6 229.4 Animal or vegetable oils 93.2 158.4 132.0 178.2 Aluminium products 18.3 44.6 142.1 161.4 Iron and steel products 36.0 60.2 116.2 157.1 Rubber and rubber products 64.7 116.1 131.9 146.2 Fertilizers, dying extracts, paints 30.7 67.5 94.7 117.9 Hydrocarbons 19.3 36.4 141.1 114.1 Animal feed 4.3 9.4 26.7 85.9 Cosmetics, washing preparations and soaps 37.3 47.4 60.9 82.0 Textiles & garments 33.5 81.0 182.5 77.4 Horticultural products 70.6 84.3 97.6 76.2 Mineral products 41.4 58.7 59.3 75.5 Articles of base metal nes 32.2 44.9 70.9 68.5 Fish and seafood 68.7 48.9 113.8 65.7 Chemical or industrial prepations nes 17.4 38.8 48.0 55.2 Photographic materials 9.2 22.8 31.8 55.0 Organic and inorganic chemicals 8.9 11.6 11.9 31.1 Vehicle and parts 6.2 13.0 12.7 30.0 Dairy products 21.3 36.1 27.2 29.5 Electrical appliances 10.9 13.1 12.1 29.5 Articles for printing 20.0 19.2 22.0 24.6 Prepared cereals and tubers 8.4 18.8 16.4 21.3 Precious stones and metal 0.0 0.0 0.3 20.5 Articles of stone and glass 4.2 4.1 8.2 17.5 Coffee, tea, mate and spices 4.2 16.1 23.9 10.7 Other manufactured articles 5.1 7.6 8.5 10.2 Optical products, clocks, etc 0.1 3.4 3.0 5.6 Sugar and sugar confectionery 4.8 8.1 9.5 5.2 Handicrafts 4.0 5.4 7.4 4.8 Footwear and headgear 0.7 1.7 7.5 2.5 Pharmaceutical products 1.1 2.4 1.1 1.8 Vegetable saps and extracts 0.0 0.3 1.5 1.8 Leather articles and travel goods 1.2 3.8 8.1 1.6 Cereals 1.4 1.5 0.6 1.5 Others 1 1.1 4.1 2.6 2.8 TOTAL 2,346.1 3,667.9 4,341.0 4,725.4
Source: GRA/GCMS1 Others are the sum of products not mentioned in the list above
10
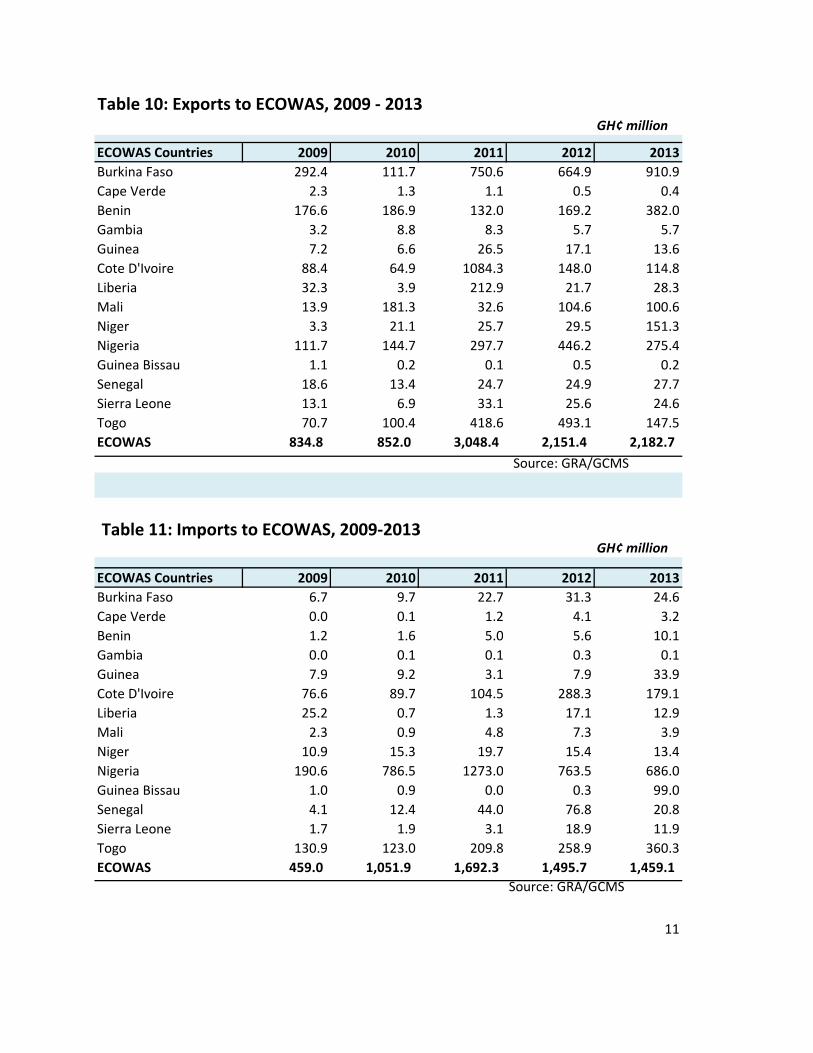
Table 10: Exports to ECOWAS, 2009 - 2013GH¢ million
ECOWAS Countries 2009 2010 2011 2012 2013Burkina Faso 292.4 111.7 750.6 664.9 910.9Cape Verde 2.3 1.3 1.1 0.5 0.4Benin 176.6 186.9 132.0 169.2 382.0Gambia 3.2 8.8 8.3 5.7 5.7Guinea 7.2 6.6 26.5 17.1 13.6Cote D'Ivoire 88.4 64.9 1084.3 148.0 114.8Liberia 32.3 3.9 212.9 21.7 28.3Mali 13.9 181.3 32.6 104.6 100.6Niger 3.3 21.1 25.7 29.5 151.3Nigeria 111.7 144.7 297.7 446.2 275.4Guinea Bissau 1.1 0.2 0.1 0.5 0.2Senegal 18.6 13.4 24.7 24.9 27.7Sierra Leone 13.1 6.9 33.1 25.6 24.6Togo 70.7 100.4 418.6 493.1 147.5ECOWAS 834.8 852.0 3,048.4 2,151.4 2,182.7
Source: GRA/GCMS
Table 11: Imports to ECOWAS, 2009-2013 GH¢ million
ECOWAS Countries 2009 2010 2011 2012 2013Burkina Faso 6.7 9.7 22.7 31.3 24.6Cape Verde 0.0 0.1 1.2 4.1 3.2Benin 1.2 1.6 5.0 5.6 10.1Gambia 0.0 0.1 0.1 0.3 0.1Guinea 7.9 9.2 3.1 7.9 33.9Cote D'Ivoire 76.6 89.7 104.5 288.3 179.1Liberia 25.2 0.7 1.3 17.1 12.9Mali 2.3 0.9 4.8 7.3 3.9Niger 10.9 15.3 19.7 15.4 13.4Nigeria 190.6 786.5 1273.0 763.5 686.0Guinea Bissau 1.0 0.9 0.0 0.3 99.0Senegal 4.1 12.4 44.0 76.8 20.8Sierra Leone 1.7 1.9 3.1 18.9 11.9Togo 130.9 123.0 209.8 258.9 360.3ECOWAS 459.0 1,051.9 1,692.3 1,495.7 1,459.1
Source: GRA/GCMS
11
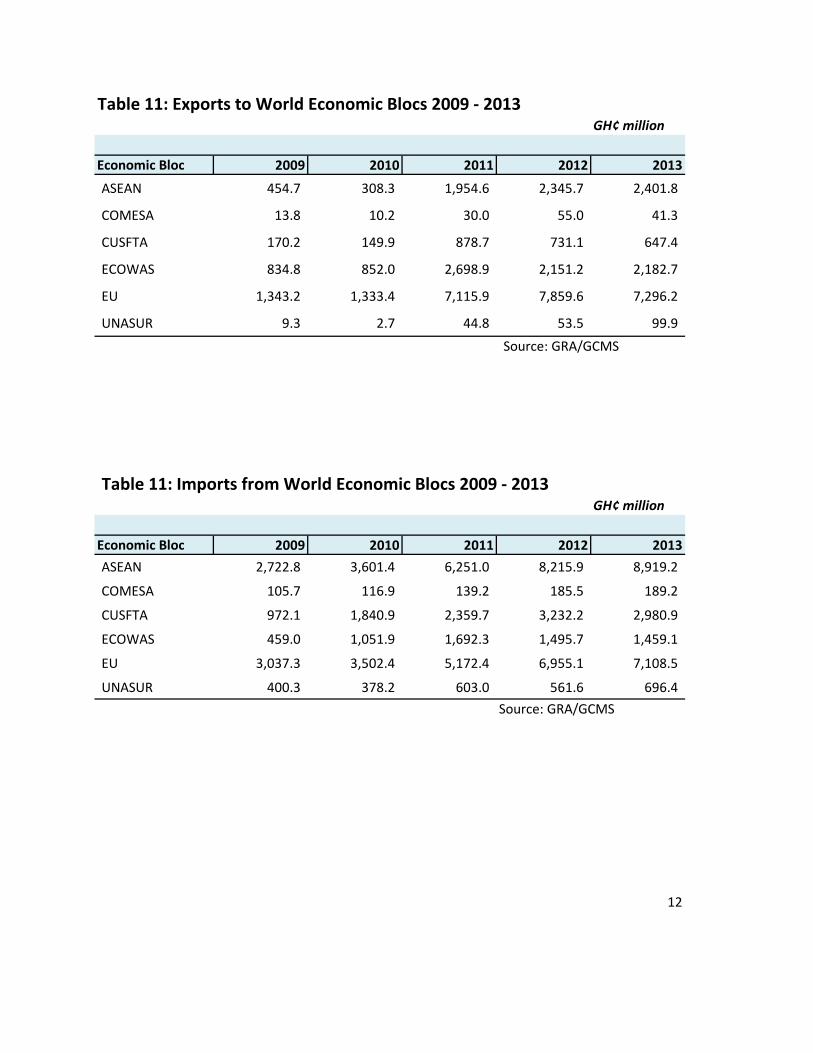
Table 11: Exports to World Economic Blocs 2009 - 2013GH¢ million
Economic Bloc 2009 2010 2011 2012 2013ASEAN 454.7 308.3 1,954.6 2,345.7 2,401.8 COMESA 13.8 10.2 30.0 55.0 41.3 CUSFTA 170.2 149.9 878.7 731.1 647.4 ECOWAS 834.8 852.0 2,698.9 2,151.2 2,182.7 EU 1,343.2 1,333.4 7,115.9 7,859.6 7,296.2 UNASUR 9.3 2.7 44.8 53.5 99.9
Source: GRA/GCMS
Table 11: Imports from World Economic Blocs 2009 - 2013GH¢ million
Economic Bloc 2009 2010 2011 2012 2013ASEAN 2,722.8 3,601.4 6,251.0 8,215.9 8,919.2 COMESA 105.7 116.9 139.2 185.5 189.2 CUSFTA 972.1 1,840.9 2,359.7 3,232.2 2,980.9 ECOWAS 459.0 1,051.9 1,692.3 1,495.7 1,459.1 EU 3,037.3 3,502.4 5,172.4 6,955.1 7,108.5 UNASUR 400.3 378.2 603.0 561.6 696.4
Source: GRA/GCMS
12
Recommended